business plan kaibab joint venturepublic.dirxploration.fastmail.us/dir 2010 business plan.pdf ·...
TRANSCRIPT

BUSINESS PLAN
KAIBAB JOINT VENTURE
DIR Exploration, Inc.
3614 G 4/10 Road
Palisade, CO 81526
970-464-7236
Contact: Larry D. Turner
November 2010

ii 11/2/2011 ii
BUSINESS PLAN, KAIBAB JOINT VENTURE
Executive Summary DIR Exploration, Inc., was formed in 1987 for the initial purpose of conducting breccia pipe exploration in a joint venture with the Japanese government company, PNC Exploration (USA), Inc. The DIR-PNC JV ended in 1992 due to low uranium price. Properties explored during this first DIR breccia pipe exploration program were re-staked by DIR in 2005 and in late 2006 were brought into a second JV, this time with the Canadian junior, Takara Resources, Inc. Unfortunately, the DIR-Takara JV ended in 2009 as Takara’s investors became terminally leery of further Arizona work involvement. This ‘leeriness’ occurred when it became evident that uranium-prospective federal lands in the Grand Canyon region of Arizona might be withdrawn from further mineral entry by the US Department of Interior for a 20-year period beginning in 2011. Having again lost a JV partner for external reasons, DIR began seeking answers to the two following questions:
1. What, if anything, can be done to protect mineral rights to breccia pipe prospects held on the lands that are subject to possible withdrawal?
2. Which lands in northern Arizona that are not subject to a possible 2011 federal mineral
rights withdrawal are likely to contain economically-mineralized breccia pipes? Under the threat of loss of its breccia pipe mining claims to possible post-withdrawal federal mineral examinations, DIR successfully developed a new surface exploration technique that permits estimation of the uranium resource present at any given breccia pipe.1 It is believed that the application of this technique, a technique which utilizes the weak breccia pipe mineralization present at the surface above each mineralized pipe, now makes it possible to “perfect” Arizona breccia pipe mining claims – i.e., reasonably and legally prove “discovery”2 of valuable uranium mineralization -- before exploration drilling work has been carried out on a pipe. In turn, elucidation of the regional structural controls of the distribution of mineralized collapse breccia pipes has permitted DIR to identify three different sub-regions of northern Arizona still legally open to uranium exploration and mining and likely prospective for economic breccia pipe uranium mineralization. Two of these areas have received very little, if any, historical or recent uranium exploration attention. What the discovery of this proprietary technique means is that, among other things, the industry-harming political opposition to northern Arizona breccia pipe uranium mining has unwittingly generated a means for ultimately stabilizing, consolidating, and expanding the operations of the
1 This trade secret technique, based on the surface geochemistry and published mined reserves data of seven mined breccia pipes, is explained and described in an April 8, 2010, DIR report entitled, “Surface Sampling Breccia Pipe Uranium Mineralization Resource Assessment Method”. The DIR report is available for examination upon execution of a strict confidentiality agreement with DIR. For the test and calibration sample of uranium mines, the technique predicts greater than 97% of the variation in reserves among each of the mined pipes. See the cover page watermark for an illustration of the goodness-of-fit between predicted and observed breccia pipe uranium resource quantities achieved by the method. 2 To modern US mining law prudent man standards; i.e., a claim is legally valid if the mineral found within the limits of a claim is of such quantity and quality that a prudent person would be justified in the further expenditure of his labor and his means with a reasonable prospect of success of developing a paying mine (United State v. Coleman, 390 US 599, 602 [1968]; Christman v. Miller, 197 US 313 [1905]; Castle v. Womble, 19 L.D. 455, 457 [1984]. The question is not whether a profitable mining operation can be demonstrated, but whether, under the circumstances and the mineralization exposed, a person of ordinary prudence would expend substantial sums with the reasonable expectation that a profitable mine might be developed (Barton v. Morton, 498 F.2d 288; 9th Cir. 1974).

iii 11/2/2011 iii
northern Arizona breccia pipe uranium mining industry; i.e., DIR’s pre-drilling breccia pipe uranium resource assessment method. Therefore, in addition to eventually carrying out further exploration and development of DIR’s current breccia pipe target inventory, DIR proposes the early (2010-2011) leveraging of DIR’s claims validation method as a means of preserving and leasing the mineral rights of other exploration companies working in the area that would otherwise be subject to the possible 2011 mining rights withdrawal. This work will also permit later increase in scale of operations of the program, and maximization of near term returns on investment. Initial exploration goals of annually adding one new economically-mineralized breccia pipe to development operations are expected to bring annual program yellowcake production rates up to 4,000,000 pounds or more of U3O8/year within 5 to 10 years, and total program after-tax present value up to more than $1,700,000,000 in 5 years. The 48 breccia pipe prospects (130 claims) DIR will carry through on into the 2010-2011 assessment year all evidence, judging from the weak mineralization sampled on surface and evaluated using DIR’s proprietary breccia pipe uranium resource assessment method, “…mineral of such quantity and quality that a prudent person would be justified in the further expenditure of his labor and his means with a reasonable prospect of success of developing a paying mine.” 3 The total statistically/geochemically-expected4 resource for DIR’s 48 thoroughly screened (and therefore retained) claim-staked prospects is about 180,000,000 pounds U3O8. Thirteen of the 48 breccia pipe targets are located on lands not potentially subject to withdrawal, and are estimated to contain a total of about 50,000,000 pounds (28%) of the current, statistically/geochemically-expected DIR retained claims resource of about 180,000,000 pounds U3O8.
DIR is currently staffed with the two company principals, I.L. Turner and L.D. Turner, and a consultant, Terry W. Fox.5 DIR’s plans after finding a new JV partner are to rehire two of the former DIR junior geologists, and hire a second senior geologist to, among other things, help train and supervise the two rehired junior geologists in breccia pipe exploration drilling work. A first year budget of US $1,200,000 is believed to be sufficient to assess the land positions of DIR’s remaining competitors, begin and possibly complete the ground reconnaissance of the two breccia pipe exploration sub-regions still open to mineral entry, and carry at least 4000 unfiltered/unassessed breccia pipe mining claims staked by DIR’s competitors (as well as DIR’s current claims) for a year. During this initial year, sampling and laboratory work would be carried out in order to determine -- to the prudent man standard -- which of the mining claims of DIR’s competitors contain economic quantities of uranium mineralization. In the subsequent year, the competitors’ breccia pipe claims determined to not stand a reasonable probability of containing economic quantities of ore would be relinquished back to their owners. The following years of work will be given to the task of preparing the northern Arizona mining prospects for uranium mine development and ore production. After the first year of property acquisition work, it has been calculated that exploration budgets will have to be in the $3,000,000 to $8,500,000 range to meet the basic goal of adding one new breccia pipe uranium ore body each year to the development work roster.
3 DIR is dropping approximately 45% of its 2009-2010 claims this year as its pipe uranium resource prediction method has indicated that these claims do not contain economic quantities of breccia pipe uranium mineralization. 4 The adjective “expected” is used here in the statistical sense of the word corresponding to the “mean” or “average” predicted value of uranium resource. 5 A former mill, mine, and exploration department employee of Energy Fuels. Mr. Fox carried out the exploration and surface development drilling of the Kanab North pipe.

4 11/2/2011 4
Table of Contents
Executive Summary ........................................................................................................ii The Opportunity..............................................................................................................6 Mining Background.........................................................................................................7 Political Environment ....................................................................................................12 Discovery and Valid Existing Federal Mineral Rights ...................................................15 Pre-Drilling Validation of Economically-Mineralized Breccia Pipe Claims ..................16 Discounted Cash Flow Projections and Program Scalability ..........................................23
Economic Ore Body Discovery Frequency and Associated Exploration Costs ..................23 Development and Operating Costs ..............................................................................25 Mine Production Rates ..............................................................................................26 Size of Breccia Pipe Ore Bodies .................................................................................27 Yellowcake Price......................................................................................................27 Scenario Analysis and Discounted Cash Flow Projections .............................................30 Program Scalability...................................................................................................31
First-Year Plan ..............................................................................................................33 Introduction .............................................................................................................33 Maintaining and Increasing the Breccia Pipe Property Position of the Planned JV on Non-
Segregated Lands......................................................................................................35 Appendix.......................................................................................................................41
Hard-Copy Bibliography ...........................................................................................42 3-D Seismic Geophysical Surveys and Breccia Pipes ....................................................43 Cash Flow and Production Projections.........................................................................46 First-Year Budget .....................................................................................................53 DIR Personnel ..........................................................................................................54
Lawrence (Larry) D. Turner .................................................................................................. 54 Irving L. (Larry) Turner......................................................................................................... 54 Terry W. Fox .......................................................................................................................... 55
List of Figures
Figure 1. Index map of program area. .............................................................................8 Figure 2. Diagram of a surface-penetrating collapse breccia pipe....................................9 Figure 3. NPVs of Arizona collapse breccia pipe ore bodies. ........................................10 Figure 4. IRRs of Arizona collapse breccia pipe ore bodies. .........................................11 Figure 5. Map of US Department of Interior segregation area. ......................................13 Figure 6. Grand Canyon region uranium mining EIS timeline.......................................14 Figure 7. Weakening of pipe surface mineralization with increasing ore body depth. ....18 Figure 8. DIR method pipe resource estimates vs. mine production. .............................20 Figure 9. Drill hole deviation and collapse breccia pipes...............................................22 Figure 10. An explanation for reserves overestimations in Arizona breccia pipes..........23 Figure 11. Increasing returns to scale from breccia pipe ore deposit size. ......................26 Figure 12. Frequency of different sizes of breccia pipe ore bodies in northern Arizona. 27 Figure 13. Current data cumulative frequency diagram of breccia pipe ore deposit sizes.
..............................................................................................................................28 Figure 14. Long-run US yellowcake supply curve. .......................................................29

5 11/2/2011 5
Figure 15. Projected annual program yellowcake production rates. ...............................31 Figure 16. Apparent uranium resource frequency distribution, DIR current prospects. ..32 Figure 17. DIR prospects and the US Department of Interior segregation area. .............34 Figure 18. Basement high and northern Arizona uranium mineralization. .....................36 Figure 19. Open breccia pipe exploration and mining areas. .........................................37 Figure 20. Land ownership south of the Grand Canyon.................................................39 Figure 21. A collapse breccia pipe south of Flagstaff, AZ. ............................................40
Tables
Table I. Mineralized Breccia Pipes, Comparison of Mined U3O8 Values to DIR-Predicted U3O8
Resource Values ......................................................................................................19 Table II. Comparison of DIR-Predicted Resource Values and Semi-Quantitative and Qualitative
Exploration Drilling Results ......................................................................................21 Table III. Historic Cash-Cost Estimates, Northern Arizona Bx Pipe Mines in 2009 Dollars......25 Table IV. Scenario Assumptions and Results......................................................................30

6 11/2/2011 6
BUSINESS PLAN, KAIBAB JOINT VENTURE The Opportunity According to the USGS,6 the plentiful collapse breccia pipes of northern Arizona contain the bulk of the US uranium resource. Historical underground mine production from these mines shows average ore grades of about 0.6% U3O8 and total average reserves of about 3,500,000 pounds U3O8/mine. Using current costs and current yellowcake price, the historical average7 breccia pipe uranium ore body has an after-tax NPV (at 10% discount rate) of greater than $25,000,000, and an after-tax IRR greater than 30%. According to the results of DIR’s recent application of its pre-drilling breccia pipe uranium resource assessment technique, the uranium resource of its current breccia pipe property position could contain as much as 180,000,000 pounds of U3O8. As explained later, DIR has concrete plans for strongly increasing the size of this resource base during the first year of operations in order to prepare for future increase in scale of operations, and in order to maximize returns on investment in the near term.8 DIR Exploration, Inc., was initially formed in 1987 for the purpose of conducting breccia pipe uranium exploration in a joint venture in northern Arizona with the Japanese government company, PNC Exploration (USA), Inc. The DIR-PNC JV ended in 1992 due to low uranium price. Historically exhibiting definite drill hole evidence or other signs of containing uranium mineralization, the mineral properties explored during this first DIR breccia pipe exploration program were re-staked by DIR in 2005. In late 2006 these prospects were brought into a second JV, this time with the Canadian junior, Takara Resources, Inc. Unfortunately, the DIR-Takara JV ended in 2009 as Takara’s investors became terminally leery of further Arizona work involvement. This terminal ‘leeriness’ occurred when it became evident that uranium-prospective federal lands in the Grand Canyon region of Arizona might be withdrawn from further mineral entry by the US Department of Interior for a 20-year period beginning in 2011. Having once again lost a JV partner for external reasons, DIR, like its remaining competitors, began seeking answers to the two following questions:
1. What, if anything, can be done to protect current mineral rights to breccia pipe prospects held on the lands that are subject to a possible future federal withdrawal?
2. Which lands in northern Arizona that are not subject to a possible 2011 federal
mineral rights withdrawal are likely to contain economically-mineralized breccia pipes?
Under the threat of loss of its breccia pipe mining claims to possible post-withdrawal federal mineral examinations, DIR successfully developed a new surface exploration technique that permits pre-drilling estimation of the uranium resource present at any given breccia pipe. It is believed that the application of this technique, a technique which utilizes the weak breccia pipe mineralization present at the surface above each mineralized structure, now makes it possible to “perfect” Arizona breccia pipe mining claims – i.e., reasonably and legally prove “discovery” of
6 http://pubs.usgs.gov/bul/b2004/html/bull2004breccia_pipe_uranium_deposits.htm, line 10. 7 The largest single development breccia pipe uranium mine (Hacks 2 & 3) produced 8,100,000 pounds U3O8, for an apparent after-tax NPV of more than 110 million 2009 US$ and apparent after-tax IRR of greater than 55%. 8 Frontloading reserves delineation drilling and mine development work on structures with higher indicated uranium resources would strongly increase program NPV. In order to maximize this effect it is necessary to have more breccia pipe prospects to choose from. This is because larger-sized ore bodies are more rare than moderate and smaller-sized ore deposits.

7 11/2/2011 7
valuable uranium mineralization -- before exploration drilling work has been carried out on a breccia pipe target. What the discovery of this proprietary technique means, among other things, is that the industry-harming political opposition to northern Arizona breccia pipe uranium mining has ironically generated a ready means for ultimately stabilizing, consolidating, and improving9 the operations of the northern Arizona breccia pipe uranium mining industry. Therefore, in addition to eventually carrying out further exploration and development of DIR’s current breccia pipe target inventory, DIR proposes the early (2010-2011) leveraging of DIR’s claims validation method as a means of preserving and preferentially leasing the mineral rights of other exploration companies working in the area.10 Successfully following this particular plan would have the effect of protecting a substantial US uranium resource from the negative effects of ideologically- and emotionally-biased decision-making. In turn, elucidation of the regional structural controls of the distribution of mineralized collapse breccia pipes has permitted DIR to identify three different sub-regions of northern Arizona still legally open to uranium exploration and mining. Two of these areas have received relatively little, if any, historical or recent uranium exploration attention. DIR laid off three junior geologists several months before the departure of Takara Resources from the DIR-Takara JV, and is currently staffed with the two company principals, I.L. Turner and L.D. Turner, and a consultant, Terry W. Fox. DIR’s plans after finding a new JV partner are to rehire two of the former DIR junior geologists, and engage a senior geologist to, among other things, help train and supervise the two rehired junior geologists in breccia pipe exploration drilling work. See the appendix of this plan for vita of DIR’s principals and senior consultant.
Mining Background Again, largely because of their relatively high ore grade and compactness, the United States Geological Survey anticipates that Arizona collapse breccia pipes will be “…the major source of future uranium production within the United States.11 During the late 1970s and through the 1980s, Mohave and Coconino Counties, Arizona, immediately north and south of the Grand Canyon and west of the Navajo Indian Reservation, were explored for Arizona breccia pipe uranium mineralization located in collapse breccia pipes. The search area included the region between the Colorado River and the Utah border known as the “Arizona Strip”.12 See Figure 1.
9 Considerable resources have been expended over the last thirty years in drilling insufficiently mineralized collapse breccia pipes. See Table II in this report for examples of this inefficiency. The new method promises to help rationally maximize annual returns on investment of the breccia pipe uranium mining industry by minimizing this old problem. 10 Most of the mining claims held by DIR’s competitors have not yet been proven to be valid claims by the discovery of a valuable mineral deposit at the staked prospects. In the event that the Department of Interior or US Congress give signs of withdrawing all or part of the currently segregated lands from mineral entry for 20 or more years, these companies will recognize that the BLM and US National Forest Service will begin examining their mining claims after the withdrawal in order to invalidate these claims. All other things being equal, this will influence DIR’s competitors to abandon their mineral properties in northern Arizona and leave the area. In such a case, such companies will have nothing to lose by leasing the grandfathered claims to DIR on the chance that DIR can prove their claims to be valid to federal mineral examiners by using DIR’s uranium resource evaluation technique. For an example of the favorable lease terms companies departing northern Arizona due to political resistance to uranium mining have recently negotiated, see http://www.tradingmarkets.com/.site/news/Stock%20News/2390741/ 11 http://pubs.usgs.gov/bul/b2004/html/bull2004breccia_pipe_uranium_deposits.htm 12 Much of this general introductory material is duplicated in Wikipedia under “Arizona breccia pipe mineralization” and therefore may seem very familiar to some readers. The contact person, Larry D. Turner, authored the Wikipedia entry in 2007.

8 11/2/2011 8
Figure 1. Index map of program area.
Collapse breccia pipes are vertical cylindrical bodies of broken sedimentary rock (breccia), down-dropped into caverns in underlying massive limestone. See Figure 2. Uraninite, a reduced uranium ore mineral, accumulated within the permeable column of broken rock, forming a cylindrical and vertical (and largely stationary) rather than tabular and sub-horizontal (and largely migrating) uranium roll front deposit. Mineralizing fluid flow direction was upward. As in roll front uranium deposits, disseminated and massive sulfides are found on the downstream side of breccia pipe uranium accumulations (above the breccia pipe uranium ore). The breccia pipe mineral deposits range from 1000 to 1800 feet deep and have a vertical extent of up to 600 feet. The pipes structures containing the uranium ore and directly associated metal sulfides typically have a 200 to 400 foot horizontal diameter. A 1000- to 1600-foot deep shaft is generally required to access the deposits. In rare cases where a mineralized pipe occurs near a deep canyon, a decline can be used instead of a shaft to access the ore during mining. The surface disturbance of collapse breccia pipe uranium mining has historically been remarkably small because of the high-grade, compact nature of the mineralization and use of underground waste rock back-fill procedures during breccia pipe mine development work.13 Wenrich states,14 “Although these uranium grades are dwarfed by those of the Athabasca Basin unconformity deposits in Canada, it is significant that (1) the breccia pipe mining costs are significantly less for the Arizona deposits, and (2) these ore grades of 0.4-1% [U3O8] are as high or higher than any
13 For photographs of reclaimed breccia pipe uranium mine sites, see Figures 6 through 9 of http://republicans.resourcescommittee.house.gov/UploadedFiles/WenrichTestimony07.21.09.pdf. 14 http://www.libertystaruranium.com/www/links-articles/uranium-mining-in-arizona-high-grade-and-safe

9 11/2/2011 9
other global uranium-deposit type.” Figures 3 and 4 show, as a local example, the consequent corporate after-tax internal rate of return and net present value of collapse breccia pipes as a function of amount of high grade uranium ore available per mine. These charts were generated at current operating costs for open Bureau of Land Management lands north of the Grand Canyon, and at a typical $60/pound 2009-2010 long-term contract yellowcake selling price.
Figure 2. Diagram of a surface-penetrating collapse breccia pipe.
Taken from Figure 2 of Krewdl and Carisey, 1986.
The earliest breccia pipe mined for uranium was the Orphan, a mineralized pipe exposed on the southern wall of the Grand Canyon within the Grand Canyon National Park and mined for uranium during the 1950s and 1960s. During the late 70s, Energy Fuels Nuclear, Inc. (founder Bob Adams and successor Oren Benton) began a concerted effort to locate and then mine further examples of this previously neglected class of uranium deposit. With the exploration success of Energy Fuels and its ensuing development of the early Hacks 1 and 2, Pigeon, and Kanab North mines, competing exploration and mining companies soon entered northern Arizona. During the 1970s and 1980s, relatively large companies such as Gulf Resources, Pathfinder Mines Corporation, Rocky Mountain Energy Company, and Uranerz all competed with Energy Fuels Nuclear, Inc.(“EFN”), for mineral rights in the predominantly public lands of the Arizona Strip. By 1989, at least 13 uranium-ore-bearing breccia pipes had been identified by various companies.
10 11/2/2011 10
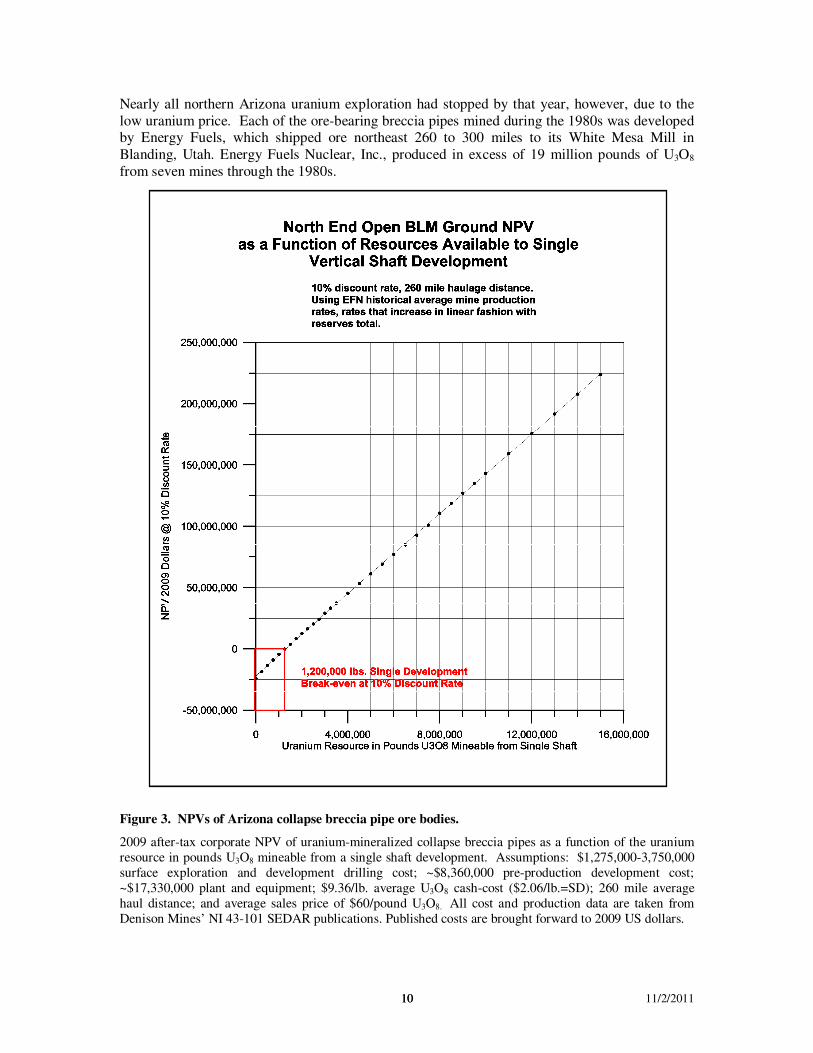
Nearly all northern Arizona uranium exploration had stopped by that year, however, due to the low uranium price. Each of the ore-bearing breccia pipes mined during the 1980s was developed by Energy Fuels, which shipped ore northeast 260 to 300 miles to its White Mesa Mill in Blanding, Utah. Energy Fuels Nuclear, Inc., produced in excess of 19 million pounds of U3O8
from seven mines through the 1980s.
Figure 3. NPVs of Arizona collapse breccia pipe ore bodies.
2009 after-tax corporate NPV of uranium-mineralized collapse breccia pipes as a function of the uranium resource in pounds U3O8 mineable from a single shaft development. Assumptions: $1,275,000-3,750,000 surface exploration and development drilling cost; ~$8,360,000 pre-production development cost; ~$17,330,000 plant and equipment; $9.36/lb. average U3O8 cash-cost ($2.06/lb.=SD); 260 mile average haul distance; and average sales price of $60/pound U3O8. All cost and production data are taken from Denison Mines’ NI 43-101 SEDAR publications. Published costs are brought forward to 2009 US dollars.

11 11/2/2011 11
Figure 4. IRRs of Arizona collapse breccia pipe ore bodies.
2009 after-tax corporate IRR of uranium-mineralized collapse breccia pipes as a function of the uranium resource in pounds U3O8 mineable from a single shaft development. Assumptions: $1,275,000-3,750,000 surface exploration and development drilling cost; ~$8,360,000 pre-production development cost; ~$17,330,000 plant and equipment; $9.36/lb. average U3O8 cash-cost ($2.06/lb.=SD); 260 mile average haul distance; and average sales price of $60/pound U3O8. All cost and production data are from Denison Mines SEDAR publications. Published costs are brought forward to 2009 US dollars.
With the recent increase in price and demand for nuclear reactor fuel, the Arizona Strip is again the site of uranium exploration and mining. The former Energy Fuels Nuclear White Mesa Mill in Blanding, Utah, is now owned and operated by the vertically-integrated Denison Mines Corporation (http://www.denisonmines.com). Besides operating the mill built by Energy Fuels Nuclear, Inc., Denison is in the process of re-opening four of the breccia pipe underground mines previously discovered and developed by Energy Fuels. More than 500 breccia pipe targets in northern Arizona were actively being explored by at least 11 mineral exploration companies at the time that the US Department of Interior, as explained below, effectively closed down all uranium exploration drilling work in the region for a minimum period of two years.
12 11/2/2011 12
Political Environment Beginning with a March 2008 field hearing of the Subcommittee on National Parks, Forests and Public Lands of the US House Natural Resources Committee, members of the Democrat majority of the US House of Representatives, several environmentalist non-governmental organizations (“NGOs”), and certain Indian tribes from the region, joined together in mounting a well-coordinated political campaign against the return of uranium exploration and mining activity to northern Arizona. The primary stated objection to return of uranium mining activity was a concern that uranium drilling and mining might contaminate the Colorado River that bisects the large northern Arizona uranium mining district. See Figure 5. The answering industry defenses15 to these attacks eventually resulted in the US Department of Interior temporarily segregating the 1,000,000 acres of the federally-managed lands covering the primary area of historical breccia pipe uranium mining from further mining claim activity. During this two-year segregation period that began in July 2009, various federal agencies16 are jointly composing a regional NEPA Environmental Impact Statement in order to gauge the potential effects of continued uranium mining in northern Arizona. Timeline for the ongoing Environmental Impact Statement considerations is reproduced below as Figure 6.17 In March 2011 the US Department of Interior will record its decision to withdraw or not withdraw all or part of the 1,000,000 acres of the currently segregated area for a twenty year period. Subject to valid existing mining claims (“grandfathered claims”), any land areas potentially withdrawn from further mineral entry in March 2011 will be closed to further uranium exploration and mining for the next two decades. According to Aseff (2010, pp. 25-29),18 however, the organized opposition to northern Arizona uranium mining considers the NEPA process described above as only one of several opportunities to attempt to curtail the further development of the uranium mining industry in northern Arizona. Others include: 1. Litigation. Grand Canyon Trust, Center for Biological Diversity, the Sierra Club, and several
Indian tribes have filed suits against the Kaibab National Forest and the Arizona State Office of the BLM in efforts to impede exploration and mining operations approved by both the BLM and US National Forest Service. In addition, the NGOs active in the area, again according to Aseff (ibid.), in the future intend to challenge validity of ‘grandfathered’19 mining claims in the event that the Grand Canyon region lands are otherwise temporarily or permanently withdrawn from further mineral entry.
2. Passage of the Grand Canyon Watershed Protection Act, introduced to the 111th Congress by Representative Raul Grijalva (D, AZ),20 that would permanently withdraw the 1,000,000 acres currently segregated from mineral entry by the US Department of Interior. Valid
15 See, for example, the Draft Environmental Analysis completed by DIR Exploration, Inc., that shows quite clearly – using US Geological Survey data -- that there is no threat to the Colorado River water from uranium exploration drilling or mining. See http://public.dirxploration.fastmail.us/Draft%20Environmental%20Assessment%202-22-09.pdf. 16 US National Forest Service, US Geological Survey, Bureau of Land Management, National Park Service, and US Fish and Wildlife Service. The Arizona State Office of the Bureau of Land Management is the lead agency in the EIS study. 17 http://www.blm.gov/pgdata/etc/medialib/blm/az/pdfs/withdraw.Par.82215.File.dat/Newsletter-1.pdf The expected publication date for the draft version of the EIS is now October or November 2010 (Chris Horyza, BLM, 8/11/10). 18 http://lawlib.wlu.edu/works/713-1.pdf 19 “Grandfathered” mining claims are those claims present within a federally-managed lands area before a withdrawal decision. As long as the claims owner can show that these claims contain a valuable mineral deposit, a federal lands withdrawal will have no retroactive effect on the owner’s rights to own and mine those claims. 20 http://grijalva.house.gov/index.cfm?sectionid=13&itemid=672

13 11/2/2011 13
current claims within the segregated area would still be ‘grandfathered’ and remain available for exploration and development in the extremely unlikely event that this very lightly-sponsored law is passed in the US House and Senate.
Figure 5. Map of US Department of Interior segregation area.
Map showing location of the 1,000,000 acres segregated from further claim-staking activity for two years on July 20, 2009, by the US Department of Interior. The segregated areas are outlined in red. The two parcels north of the Grand Canyon are chiefly administered by the Bureau of Land Management, while the single parcel south of the Canyon is managed by the US National Forest Service. Eachllllon the map represents the location of a DIR prospect as of 10/09. (About 45% of the 10/09 prospects are being dropped by DIR as of 8/31/10 because of the low uranium resource evaluation results obtained from them during 2010.)

14 11/2/2011 14
Figure 6. Grand Canyon region uranium mining EIS timeline.
Timeline for Grand Canyon Region Environmental Impact Statement. Decision to withdraw all or part or none of the 1,000,000 acre segregated mining area from additional mining work for a period of 20 years will occur in March 2011. The Draft Environmental Impact Statement was originally supposed to be published in August 2010, but is now not expected to be issued until October or November 2010. For more information, see the Arizona State Office of the Bureau of Land Management webpage at http://www.blm.gov/az/st/en/prog/mining/timeout.html.
3. Modification of the US Mining Law of 1872. US Mining Law permits mining operators to
freely and independently enter upon most US public lands (excepting lands specifically withdrawn from such entry, including wilderness areas, national parks, and acquired lands) for the purpose of staking mining claims, conducting exploration, and developing and operating mines. As it is extremely unlikely that proposed House and Senate bills that would change the US Mining Law of 1872 will be passed in the current or next Congress, those interested in increasing federal control of uranium development in the Grand Canyon region (and elsewhere) are currently pushing for near term conversion of uranium from a locatable mineral to a leasable mineral.21 In contrast to the case of locatable minerals, under the US mineral leasing regulations whether or not leasable minerals are developed is subject to the discretion of the federal agency managing the lands containing the minerals. With leasing arrangements on federal lands, the initiative is with the federal agency rather than with the miner. Since Fall 2009, the US House Natural Resources Committee has been composing HR 3534, the Consolidated Land, Energy, and Aquatic Resources Act (“the CLEAR Act”). July 14, 2010, the bill underwent committee markup that left undisturbed Section 242 which converts uranium into a leasable mineral. In the event that the CLEAR Act is approved by the House and the Senate, valid grandfathered claims within the Grand Canyon region would be converted into uranium leases, leases that would require 6.25-12.5% gross production royalty payments to the federal government during mine production.22
21 See Representative Girjalva’s letter to President Obama at http://grijalva.house.gov/uploads/Grijalva%20Letter%20to%20Obama%20on%20Grand%20Canyon%20Mining.pdf 22 Survival of this Section of the CLEAR Act as written seems unlikely for the following reasons: (1) conversion of royalty-free federal mineral rights to royalty-laden leasing rights on valid existing claims would constitute a federal takings, a matter that is unconstitutional, and (2) conversion of a hardrock mineral to a leasable mineral would threaten the US metals mining industry at large, a fact that is expected by Republican House Natural Resource Committee members to easily arouse substantial legislative resistance in the US Senate preventing passage of the uranium leasing provisions of the Act. For the uranium leasing language present in the July 14, 2010, amended version of the bill, see

15 11/2/2011 15
As can be gleaned from the above discussion, it is clear that in the current political environment, uranium exploration and mining on US public lands in northern Arizona can only be safely carried out on mining claims that contain evidence of discovery of a valuable uranium deposit like those held by DIR. The legal requirements for successful validation of an economic minerals discovery on federal locatable lands are discussed further in the following section.
Discovery and Valid Existing Federal Mineral Rights
Maley (1993, p. 324) summarizes the mineral ownership rights of claim-stakers and highlights the fact that the strongest of these rights is ultimately based upon the “discovery of a valuable mineral deposit” on the claim or claims concerned:
“The discovery of a valuable mineral deposit within the limits of a mining claim located on the public lands in conformance with state and Federal statutes validates the claim; and the locator acquires an exclusive possessory interest in the claim. The classic statement on a mining claim as property is found in the United States Supreme Court case of Wilbur v. U.S. ex rel. Krushnic, 280 US 306 (1930). The Supreme Court said:
When the location of a mining claim is perfected under the law, it has the effect of a grant by the United States of the right of present and exclusive possession. The claim is property in the fullest sense of that term; and may be sold, transferred, mortgaged, and inherited without infringing any right or title of the United States. The right of the owner is taxable by the state; and is “real property,” subject to the lien of a judgment recovered against the owner in a state or territorial court. The owner is not required to purchase the claim or secure patent from the United States; but so long as he complies with the provisions of the mining laws, his possessory right, for all practical purposes of ownership, is as good as though secured by patent.
This possessory interest may be asserted against the United States as well as against third parties, Best v. Humboldt Placer Mining Co., 371 US 334, 336 (1963), and may not be taken from the claimant by the United States without due compensation, United States v.
North American Transportation & Trading Co., 253 US 330 (1920), or be declared invalid except in accordance with due process. Cameron v. United States, 252 US 450 (1920). Fee title remains with the Federal Government until patent issues.23 The owner of an unpatented claim is entitled to mine, remove and sell all valuable mineral deposits within his claim boundaries that are not subject to extralateral rights of adjacent claim owners. The claimant is also entitled to such surface rights necessary for mining operations.”
Although the original US Mining Law requires that a discovery of a valuable mineral deposit needs to precede location of a mining claim for this claim to be valid and thereby confer complete mineral ownership rights to the claim locator, this has generally become an impractical requirement because nearly all remaining US ore deposits are buried below the surface and therefore require sustained exploration work before they can be detected. As a result, current US Mining Law permits mining claim locators to defend their claims from adverse claimants by
Section 511 of the original version of the Act available at http://www.govtrack.us/congress/billtext.xpd?bill=h111-3534. 23 The federal government imposed a moratorium on the issuance of mining claim patents in 1994.

16 11/2/2011 16
diligently occupying the claims24 and carrying out geochemical, geophysical, and geological surveys (including drilling) focused on establishing ore deposit discovery that retroactively validates the claim. This partial possessory right to mineral rights afforded by the simultaneous combination of defense and exploration of claims is termed the “law of possession” or “pedis
possessio” and has achieved statutory recognition under federal law. These temporary and incomplete pedis possessio rights to a mining claim only protect against rival claimants, however, and have no force against the federal government in the case of federal land withdrawals like those now being considered for northern Arizona. As an additional complication, in the event that rival claimants overstake claims that are not being continuously occupied by the senior locator and these rival claimants then peaceably effect first discovery of a valuable mineral deposit on the same ground, the courts will award ownership of the validated claim to the junior locator. Geomet Exploration v. Lucky Mc Uranium, Ariz., 601 P2d 1339 (1979). What, then, constitutes legal proof of discovery of a valuable mineral deposit, discovery that permits assertion of possessory interest even against the US federal government? In United
States v. Jerry E. Franklin, 99 IBLA 120, 124 (1987), the US Department of Interior Board of Land Appeals gave an up-to-date version of the deciding “prudent man test” as it is applied to establishing the fact of discovery and the consequent validity of a mining claim:
There is not question that the validity of any mining claim is dependent upon the disclosure of a valuable mineral deposit within the limits of a claim. 30 U.S.C. (1982). A valuable mineral deposit exists if the mineral found within the limits of claim is of such quantity and quality that a prudent person would be justified in the further expenditure of his labor and means with a reasonable prospect of success in developing a paying mine. United States v. Coleman, 390 U.S. 599, 602 (1968); Chrisman v. Miller, 197 U.S. 313 (1905); Castle v. Womble, 19 L.D. 455, 457 (1984). This “prudent man test” has been refined to require a showing that “as a present fact, considering historic price and cost factors and assuming that they will continue, there is a reasonable likelihood of success that a paying mine can be developed.” In re Pacific Coast Molybdenum, 75 IBLA 16, 29 90 I.D. 352, 360 (1983). However, actual successful exploitation need not be shown – only the reasonable potential for it. Barrows v. Hickel, 447 F.2d 80, 82 (9th Cir. 1971). The question is not whether a profitable mining operation can be demonstrated, but whether, under the circumstances and based upon the
mineralization exposed, a person of ordinary prudence would expend substantial sums with the reasonable expectation that a profitable mine might be developed [emphases added]. Barton v. Morton, 498 F.2d 288 (9th Cir. 1974).
Pre-Drilling Validation of Economically-Mineralized Breccia Pipe Claims Within three years of the re-entry of uranium exploration and mining companies to the now segregated area, the political opposition to northern Arizona uranium exploration and mining had the effect of halting all BLM and USFS approvals of breccia pipe drilling exploration plans there. The rapid onset of political resistance to re-entry of the uranium mining industry prevented uranium companies working in the region from proving the validity of nearly all of their mining claims by exploration drilling before the start of the current two-year segregation period.
24Staking claims and then neglecting to explore or otherwise occupy them provides wholly legal opportunities for later explorationists to locate new claims over older claims and subsequently prove discovery before the senior, absentee locator has taken the trouble and expense to do so.

17 11/2/2011 17
Because federal regulations prohibit, for all practical purposes any further drill exploration on mining claims within areas that are withdrawn from mineral entry, at this time most of the mining claims staked in the segregated areas shown on Figure 5 remain at substantial risk of invalidation. Unless discoveries can be made on these claims before possible 20-year withdrawal of the lands through an EIS-based Department of Interior decision in March 2011 (Figure 6), or before the more permanent effect of legislative conversion of locatable uranium to a leasable mineral at some other date, northern Arizona uranium claim-owners stand a high probability of losing their claims to post-withdrawal federal mineral examinations. This substantial risk to its breccia pipe uranium claims prompted DIR to research, develop, and test a geochemical technology that permits pre-drilling estimation of the magnitude of uranium resources present in Arizona collapse breccia pipes by sampling and measuring the weak, pipe-related mineralization in the rocks above and surrounding the cores of mineralized breccia pipes.25 As it turns out, the DIR breccia pipe uranium resource assessment procedure works well on both surface-penetrating and buried (or hidden) pipes. DIR believes the accuracy and reliability of the method is sufficient to serve as an early, rapid, and low-impact method of validating breccia pipe lode mining claims located on northern Arizona federal lands administered by the BLM and USFS. Note that Figure 7 proves that weak surface mineralization sampled at the surface used by DIR to make its uranium resource assessments is causally related to the stronger mineralization present at depth in economically-mineralized breccia pipes. The key to understanding why the DIR breccia pipe evaluation technique works lies in the vertical metal zoning present in breccia pipe ore bodies. As shown elsewhere,26 this vertical zoning clearly proves that mineralizing fluids in Arizona breccia pipes moved in an upward direction, a basic fact which explains the presence and character of the weak mineralization found at the surface above and around economically-mineralized pipes. Three other main factors have been defined in DIR’s field and literature research as determining the extent of uranium and metal sulfide mineralization in collapse breccia pipes during the breccia pipe mineralization process. These factors are: (1) timed existence of bacterial feedstock (oil); (2) upwelling, metal-rich brines; and (3) consequent generation of two proximal geochemical reduction barriers capable of precipitating metal sulfides and uraninite from upwelling mineralizing fluids. DIR has defined four independent geochemical parameters that serve as causally-related proxies for the breccia pipe mineralization-controlling factors just described. Multi-variable regression of these four independent geochemical parameters measured in surface samples against published uranium reserves-plus-production figures from each test case resulted in a uranium production function that predicts 97.95% of the variance in uranium resource present in the sampled cases. The orientation data set spans a reserves range of 550,000 to 8,100,000 pounds U3O8. The average relative deviation for predicted uranium resource versus observed uranium reserves-plus-production is ± 140,000 pounds U3O8, for a ± 4.13% average prediction error.27 The statistical nature of the defined breccia pipe uranium production function is such that its application to
25 As described in paragraph 3 of the previous page, the fact that the method measures mineralization sourced by the
ore deposit per se both fulfills the legal requirement of claims validation that a prudent man’s mine development investment decisions be “…based upon the mineralization exposed” and provides scientifically-based “…reasonable”
expectations such investments will be paying propositions. 26 In DIR’s 31-page report entitled, “Surface Sampling Breccia Pipe Uranium Mineralization Resource Assessment Method, April 8, 2010”. This report is available for due diligence review upon execution of a strict confidentiality agreement. 27 The ± percent prediction error for the seven known economically-mineralized pipes used in the development of the
pipe resource assessment method ranged from 0.32% to 12.06%.

18 11/2/2011 18
hitherto undrilled breccia pipe targets in northern Arizona -- surface-penetrating or not -- is very strongly justified. See Table I and Figure 8.
Figure 7. Weakening of pipe surface mineralization with increasing ore body depth.
Field data showing that the strength of the mineralization at the surface above an economically-mineralized breccia pipe is inversely and exactly related to the depth of the ore beneath the sampling surface. In cases like Hacks 2 and 3 where the breccia pipe does not extend all the way to the surface, the mineralization detectable in surface rocks is further weakened and belongs to a separate population of anomalous surface geochemical values.
Test sampling of an additional 22 unmined breccia pipes, and subsequent mineral resource prediction for each of these using the Arizona breccia pipe uranium production function, showed that uranium resource predictions resulting from the application DIR’s technique matched published historical exploration drill findings for 77% of these cases. However, DIR surface sampling results indicate that 23% (5) of the 22 test samples were mis-classified by very early historical drilling exploration work and that these breccia pipe ore body discoveries yet merit continued development work. See Table II. Figure 9 provides at least a partial explanation for the drill underestimations of breccia pipe uranium resources that apparently occurred in the very early northern Arizona exploration drilling work. All early exploring companies in the northern Arizona breccia pipe province found that rotary drilling produced extreme hole deviation away from the center of the pipes unless much care was taken during the completion of the entire exploration drill hole. A second explanatory

19 11/2/2011 19
variable for the occasional misfit between historical drilling results and DIR surface assessments of pipe uranium resource is the presence of residual uranium daughter products at the base (upstream) of breccia pipe mineralized zones caused by incremental upward migration of pipe uranium ore zones.28 Where this has occurred in quite similar tabular roll-front uranium ore deposits, host rocks immediately upstream of the main ore body often show large volumes of reduced and hematite-stained rock where eU>>U. See Figure 10. In the roll-front ore body case, these residual accumulations of uranium daughter product radium can cause up to 150 to 200% drilling overestimations of uranium reserves.
Table I. Mineralized Breccia Pipes, Comparison of Mined U3O8 Values to DIR-Predicted
U3O8 Resource Values29
Under current price and cost conditions, development and mining of Hermit Mine ore would have been carried out at a loss, while modern zero-base development and production from the Arizona-1 and Pinenut Mines would essentially be break-even propositions (assuming a 10% cost of capital).
28 Pipe mineral paragenesis commonly shows early metal sulfide replacement by later uraninite. Given the gross vertical mineralization zoning of breccia pipes, this replacement sequence itself supports the hypothesis that upward migration of pipe-contained uranium mineralization has occurred in at least some breccia pipe cases. So far, this appears to be a problem only for pipes that contain relatively young ore. 29 The predicted resource values of this and Table II should be viewed as having only two significant figures.
Actual Predicted Absolute Relative Absolute
Mined Ore Bodies Production + Defined. Resource lbs. Deviation in Percent
Reserves, lbs. U3O8 U3O8 lbs. U3O8 Deviation
Hermit-1 552,449 547,864 4,585 0.83%Hermit-2 552,449 555,214 2,765 0.50%
AZ1JCRC 1,300,000 1,433,689 133,689 10.28%AZ1-LT 1,300,000 1,295,900 4,100 0.32%
RE AZ1JCRC 1,300,000 1,143,261 156,739 12.06%AZONE-ZH 1,300,000 1,295,852 4,148 0.32%
Pinenut1-JC-RC 1,450,000 1,526,565 76,565 5.28%
Pinenut2-JC-RC 1,450,000 1,379,141 70,859 4.89%RE Pinenut2-JC-RC 1,450,000 1,621,384 171,384 11.82%
KN-2 2,767,570 2,633,411 134,159 4.85%KN-1 2,767,570 2,713,867 53,703 1.94%
Orphan-JC-RC 4,260,000 4,320,703 60,703 1.42%Orphan-ZH-RC 4,260,000 4,306,552 46,552 1.09%
Pigeon East Outer 5,702,570
Pigeon West Outer 5,702,570 Pigeon 1 avg. 5,702,570 5,635,802 66,768 1.17%
JC Pigeon Mine North 5,702,570
JC Pigeon Mine South RC 5,702,570 Pigeon 2 avg. 5,702,570 5,775,209 72,639 1.27%
Pigeon Inner RC (Pigeon 3) 5,702,570 5,629,108 73,462 1.29%
H2-2 8,122,021 8,687,227 565,206 6.96%H2-1 8,122,021 7,336,911 785,110 9.67%HACK 2 LT 8,122,021 8,324,434 202,413 2.49%
Averages for All Pipes 141,345 4.13%

20 11/2/2011 20
Figure 8. DIR method pipe resource estimates vs. mine production.
Illustration of goodness-of-fit between measured (mined) uranium reserves for mineralized breccia pipes and resource estimates obtained using DIR’s pre-drilling breccia pipe uranium resource assessment method.

21 11/2/2011 21
Table II. Comparison of DIR-Predicted Resource Values30
and Semi-Quantitative and
Qualitative Exploration Drilling Results
Pink cells correspond to pipes that would provide less than a 25% after-tax IRR; yellow cells correspond to pipes that would come close to generating a 25% or greater after-tax IRR. Current approximate break-even is reached with pipes containing about 1,200,000 lbs. U3O8 at a 10% cost-of-capital. As shown on Figure 10, DIR suspects the EZ-1 and DB-1 resource overestimates from surface drilling are both the result of deep hole disequilibrium problems with eU>U being caused by the presence of below ore residual radium haloes (Polkanov 1992). Russian examples show such disequilibrium problems can cause gamma log overestimations of ore body reserves by factors of up to 1.5-2 times actual value.
30 Predicted resource values should be viewed as having only two significant figures.
Historical Predicted Apparent Drill Data Resource Apparent Drill
Surface Drilled Ore Bodies Drill Resource Resource lbs. Estimation Error in lbs. U3O8 % Estimation Error
What (18 DHs) 449,000 1,449,835 (1,000,835) -69.0%
EZ-2B (47 DHs) 978,000 854,698 123,302 14.4%
EZ-2A 978,000 1,042,742 (64,742) -6.2%Average 4.1%
EZ-1A (34 DHs) 1,127,000 328,070 798,930 243.5%EZ-1B 1,127,000 421,701 705,299 167.3%
EZ-1B 1,127,000 469,269 657,731 140.2%Average 183.6%
DB-1B (19 DHs) 911,240 486,396 424,844 87.3%
DB-1A 911,240 631,161 280,079 44.4%Average 65.9%
Canyon Mine (ZH) 1,800,000 2,289,201 (489,201) -21.4%
Reported Predicted
Targets Barren or MineralizedResource lbs.
Pipe Barren 1,552,049
Peace Mineralized 29,941
South Antelope Mineralized 1,650,659
Clearwater Mineralized 5,138,608
Smugg Barren 1,737,660
Sunshine Barren 49,888
Little Robinson Mineralized 110,180
Grama Mineralized 3,261,841
Findlay Tank South Mineralized 618,017
Findlay Tank North Mineralized 567,006
June Barren 140,505
RA-08 Barren 3,142,204
Rim Barren 654,407
Kanab South B Mineralized 2,881,803 Kanab South A Mineralized 4,045,248
RB-7RC (Black Box) Mineralized 2,529,579
RB-8RC (New Year) Mineralized 2,920,427
Lost Calf Mineralized 437,061

22 11/2/2011 22
Figure 9. Drill hole deviation and collapse breccia pipes.
An illustration of the historical problem of drill hole deviation away from target centers in northern Arizona breccia pipe exploration drilling. This problem, when unaddressed, is believed to result in exploration drilling underestimation of the uranium resource in any given breccia pipe. Balls at one end of the drill hole projections to the surface represent the surface position of the top of the drill hole. Perpendicular cross-lines at the other end of the hole paths represent the projection to the surface of the bottom of the hole. From Krewdl and Carisey, 1986. Note that the EZ-2 pipe plunges steeply to the SW.

23 11/2/2011 23
Figure 10. An explanation for reserves overestimations in Arizona breccia pipes.
Illustration of the probable source of breccia pipe uranium resource overestimations using gamma-logging of vertical surface drill holes. After Figure 1 of Polkanov 1992. Collapse breccia pipes are the vertical (and cylindrical) equivalent of horizontal (and tabular) roll-front uranium deposits. This diagram explains previous mine operators’ observations that underground horizontal to subhorizontal long-hole drill holes in breccia pipes evidence less of an eU>U problem than vertical exploration drill holes drilled from the surface. Rotate this Figure 90 degrees clockwise to transform this vertical cross-section of a roll-front uranium deposit to an approximate vertical cross-section of a breccia pipe uranium deposit.
Discounted Cash Flow Projections and Program Scalability
Economic Ore Body Discovery Frequency and Associated Exploration Costs
The records of the historical exploration and mining work conducted in northern Arizona by companies including Energy Fuels Nuclear, Inc., and Pathfinder Mines Corporation permit relatively accurate modeling of cash flows possible from breccia pipe uranium mining. For the data used to perform the estimates provided here, see the historical exploration-development-mining cost information contained in the SEDAR NI-43-101 breccia pipe program reports published by Denison Mines Corporation,31 and the economic ore body discovery probability data represented in Tables I and II of this report. Qualitative sensitivity analysis made possible by the cash flow estimations reported here, an analysis aimed at maximizing uranium output and program net present value, forms the basis of the strategic planning of exploration and mining operations presented in this plan. Parsimoniously judging by historical mining results only, Tables I and II of this report indicate that in northern Arizona the natural frequency of mineralized breccia pipes containing 2,000,000
31 http://www.sedar.com/DisplayCompanyDocuments.do?lang=EN&issuerNo=00008288

24 11/2/2011 24
or more mineable pounds of U3O8 is about 14%. This probability estimate is obtained by dividing the 29 total pipe sample of Tables I and II into the 4 breccia pipe mines (Kanab North, Orphan, Pigeon, and Hacks 2 and 3) determined by past mining work to contain more than 2,000,000 pounds U3O8.
32 Accordingly, in the cash flow projections of this plan, a 14% ore body discovery rate is considered a ‘worst-case’ attribute. At this historically representative rate of economic breccia pipe ore body discovery, an average of seven breccia pipe targets would have to be drilled each year in order to achieve delineation of a single deposit containing at least 2,000,000 mineable pounds of U3O8 each year. From historical drilling rates/target and at current drilling costs and reasonable fixed exploration costs, it is estimated that annual exploration budgets under this worst case scenario would need to be about $29,000,000 per year. This scenario assumes that all available structural breccia pipe prospects merit and receive equal drilling priority -- and that no exploration geophysical and/or geochemical screening methods are used to discriminate among prospects before they are drilled.33 DIR Table I and II retrospective pipe assessment data, on the other hand, indicate that historical exploration drilling work has, in a critical minority of cases, materially erred by understating the uranium mineralization resources present in northern Arizona collapse breccia pipes. Using DIR’s predicted uranium resource values provided in Tables I and II to correct these apparent errors, average > 2,000,000 lbs. U3O8 breccia pipe incidence in northern Arizona is actually about 38% and not 14%, and has been underrepresented in the historical record due to exploration drilling error. In the cash flow projections of this report, a 38% ore body discovery rate is therefore considered the ‘expected-case’.34 At this expected rate of economic breccia pipe ore body discovery, an average of three breccia pipe targets would have to be drilled each year in order to achieve delineation of a single deposit containing at least 2,000,000 mineable pounds of U3O8 each year. From historical drilling rates/target and at current drilling and other reasonable fixed and variable exploration costs, it is estimated that annual exploration budgets under this expected case scenario attribute would need to be about $8,400,000 per year.35 As in the worst case scenario, the expected case assumes that all available structural breccia pipe prospects merit and receive equal drilling priority – and that no exploration geophysical and/or geochemical screening methods are used to discriminate among prospects before they are drilled. For the purpose of cash flow calculations provided here, ‘best-case’ conditions of a 100% exploration discovery frequency are those (less randomly) obtained using DIR’s pre-drilling uranium resource evaluation technique, ground VTEM, and/or 3D seismic surveys on each target as prospect screening tools prior to start of surface drilling. DIR believes that utilization of these techniques to guide and prioritize surface exploration drilling will permit much greater than expected discovery frequencies, the early development of greater than average-sized breccia pipe uranium ore bodies, minimum possible exploration costs, and maximum possible returns on breccia pipe uranium mining investment. At this best case rate of economic breccia pipe ore body discovery, an average of one breccia pipe target would have to be drilled each year in order to achieve delineation of a single deposit containing at least 2,000,000 mineable pounds of U3O8 per
32 At current prices and costs, the mining of a 2,000,000 pound U3O8 deposit would yield an after-tax IRR of about 20%. 33 Indiscriminately giving equal drilling priority to all breccia pipe structural prospects was, in fact, the dominant mode of breccia pipe exploration in the late 70s and much of the 80s. 34 That is, ‘wildcat’ drilling of randomly chosen, bona fide breccia pipe targets should yield this discovery rate if no technical errors are made in conducting the surface exploration drilling work. 35All other things being equal, this $20,600,000 difference between the worst case and expected case exploration costs therefore represents an early estimate of the minimum apparent annual value of DIR’s pre-drilling surface breccia pipe evaluation technique to a uranium mining company having the goal of delineating a single economically-mineralized breccia pipe each year.

25 11/2/2011 25
year. From historical drilling rates/target and at current drilling and other reasonable fixed and variable exploration costs, it is estimated that annual exploration budgets under this best case scenario attribute would need to be about $3,000,000 per year.36
Development and Operating Costs
Historical development and plant and equipment cost estimates for the Canyon Mine dating back to 1984 were published by Denison Mines Corporation in its 2/26/07 Arizona Strip NI-43-101 report. Brought forward to 2009 dollars these amounts are: Plant and equipment $8,500,000 Pre-production development $17,600,000 Operating cost estimates performed for the Arizona-1, Pinenut, and Canyon Mines were also published in the report referenced above. Table III lists these cost data in 2009 dollars. These amounts in toto are comparable to the current $200/ton total operating cost estimate37 published in 2009 by Denison Mines Corporation in its EZ-1 and EZ-2 NI 43-101 report. Worst case, expected case, and best case operating costs employed here for cash flow projections correspond to the limits of the 80% confidence interval of Table III and the mean (expected) operating cost of the same data. Table III. Historic Cash-Cost Estimates, Northern Arizona Bx Pipe Mines in 2009 Dollars
It is anticipated that, under the expected and best case scenario capture of the bulk of regionally-
available uranium mill feed for Denison’s White Mesa Mill, that custom milling cost terms will be
obtainable from that company that are comparable to those shown in Table III.
36All other things being equal, this $26,000,000 difference between the worst case and best case exploration costs therefore represents an early estimate of the apparent maximum annual value of DIR’s pre-drilling surface breccia pipe evaluation technique to a uranium mining company having the goal of delineating a single economically-mineralized breccia pipe each year. Having a good idea of the probable uranium resource in a pipe before drilling it is useful, cost-cutting knowledge. 37 Mining $84/ton; haulage $64/ton; and milling $52/ton.
Pounds Ore Mining Cost Haulage Haulage Haulage Haulage
Mine Average of U3O8 Mining Per lb. Cost Per Cost/lb. Distance Cost/lb U3O8Grade Per Ton Cost/Ton U3O8 Ton Ore U3O8 in Miles Per Mile
Canyon 1.08% 21.6 79.19$ 3.67$ 44.80$ 2.07$ 325 0.0064$ Arizona 1 0.70% 14.0 50.26$ 3.59$ 36.90$ 2.64$ 307 0.0086$ Pinenut 1.02% 20.4 53.76$ 2.64$ 47.20$ 2.31$ 317 0.0073$
Averages 0.93% 18.7 61.07$ 3.30$ 42.97$ 2.34$ 316.3 0.0074$
Milling Milling Total Cash Total
Mine Cost/Ton Cost Cost Per Cash
Ore Per Pound Ton Ore Cost/lb. U3O8
Canyon 87.65$ 4.06$ 211.64$ 9.80$ Arizona 1 78.06$ 5.58$ 165.22$ 11.81$ Pinenut 55.98$ 2.74$ 156.94$ 7.69$
Averages 73.90$ 4.13$ 177.93$ 9.77$
SD 29.48$ 2.06$ 80% Interval Est. 32.17$ 2.25$ 80% C.I. $145.73 to $210.10 $7.52 to $12.02

26 11/2/2011 26
Mine Production Rates
The records of the mining work of Energy Fuels Nuclear, Inc., show clear evidence of increasing returns to scale provided by the mine-to-mine variance in size of total ore reserves available to mine operations. During Energy Fuels’ historical mining operations, as total reserves per development increased, average annual mine U3O8 production from each the mines concerned also increased. As illustrated in Figure 11, the relationship between the two variables is closely linear and is therefore strongly predictive of annual production rates achievable in future breccia pipe mining operations. This relationship has been employed to estimate annual production rates and life-of-mine used in the discounted cash flow estimates of this business plan.
Figure 11. Increasing returns to scale from breccia pipe ore deposit size.
Illustration of the physical basis of increasing returns to scale in northern Arizona breccia pipe mining operations at the mine site. As can be gathered here, larger reserves per mine development allow materially faster rates of investment recovery at less total cost per production unit.
27 11/2/2011 27
Size of Breccia Pipe Ore Bodies
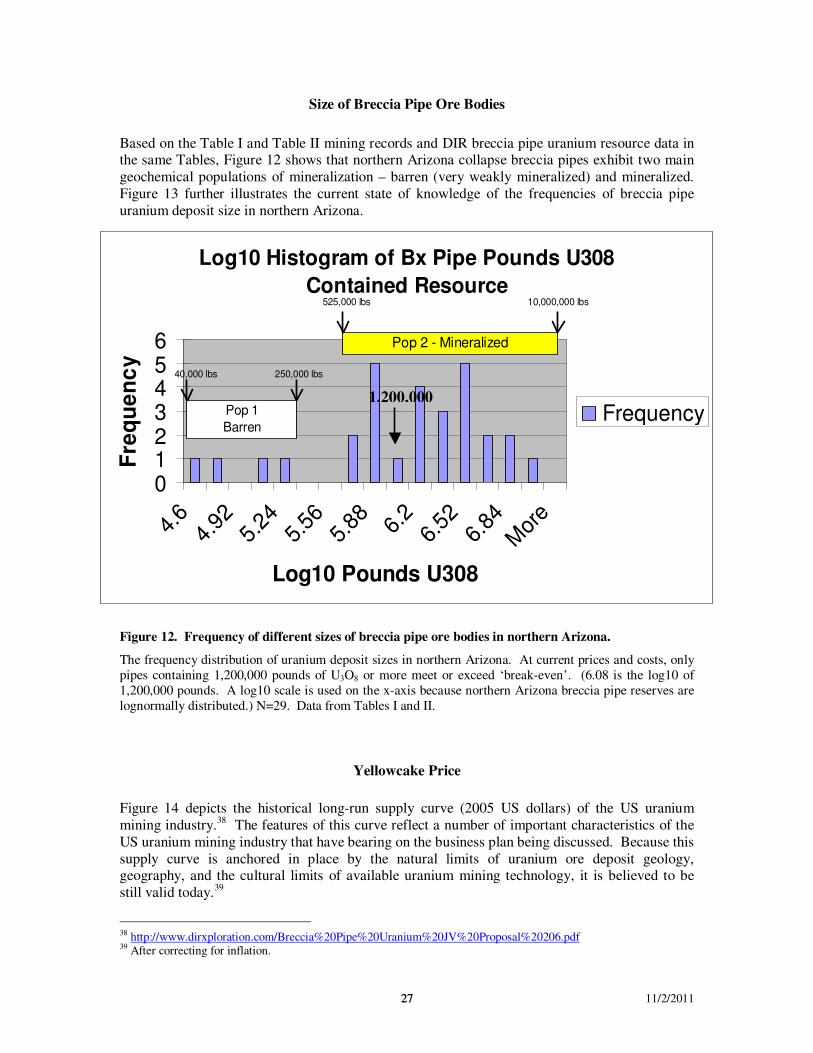
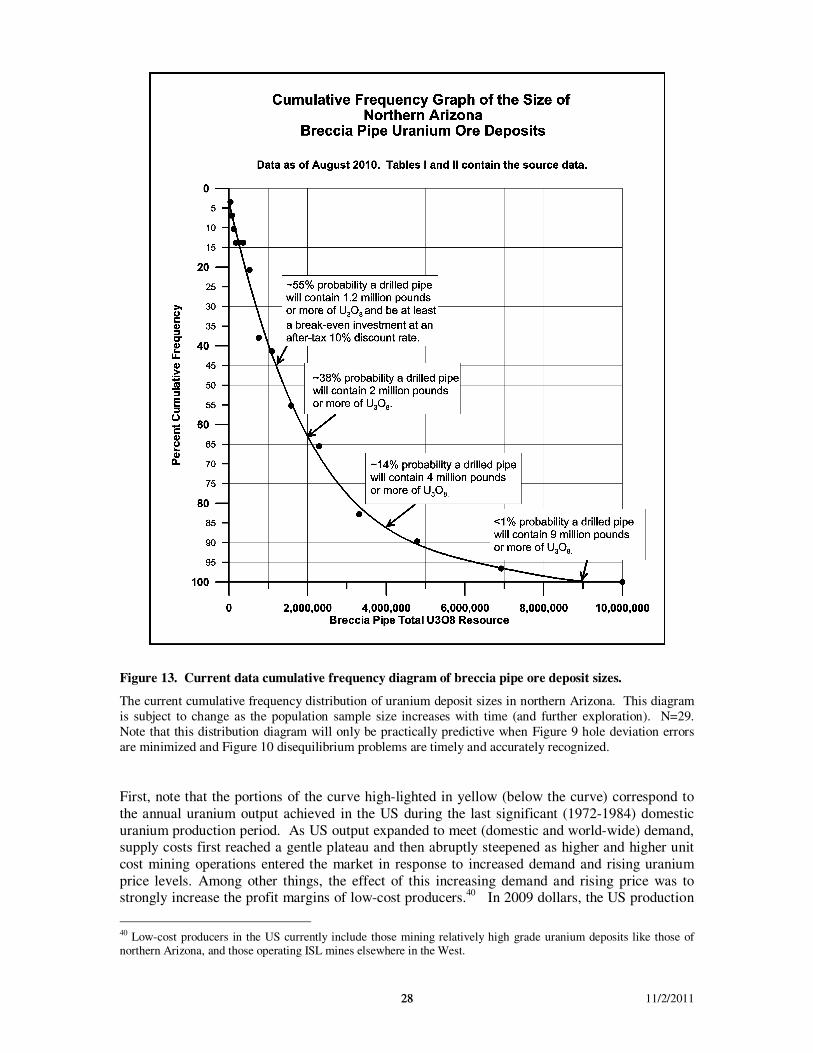
Based on the Table I and Table II mining records and DIR breccia pipe uranium resource data in the same Tables, Figure 12 shows that northern Arizona collapse breccia pipes exhibit two main geochemical populations of mineralization – barren (very weakly mineralized) and mineralized. Figure 13 further illustrates the current state of knowledge of the frequencies of breccia pipe uranium deposit size in northern Arizona.
Figure 12. Frequency of different sizes of breccia pipe ore bodies in northern Arizona.
The frequency distribution of uranium deposit sizes in northern Arizona. At current prices and costs, only pipes containing 1,200,000 pounds of U3O8 or more meet or exceed ‘break-even’. (6.08 is the log10 of 1,200,000 pounds. A log10 scale is used on the x-axis because northern Arizona breccia pipe reserves are lognormally distributed.) N=29. Data from Tables I and II.
Yellowcake Price
Figure 14 depicts the historical long-run supply curve (2005 US dollars) of the US uranium mining industry.38 The features of this curve reflect a number of important characteristics of the US uranium mining industry that have bearing on the business plan being discussed. Because this supply curve is anchored in place by the natural limits of uranium ore deposit geology, geography, and the cultural limits of available uranium mining technology, it is believed to be still valid today.39
38 http://www.dirxploration.com/Breccia%20Pipe%20Uranium%20JV%20Proposal%20206.pdf 39 After correcting for inflation.
Log10 Histogram of Bx Pipe Pounds U308
Contained Resource
0123456
4.6
4.92
5.24
5.56
5.88 6.
26.
526.
84M
ore
Log10 Pounds U308
Fre
qu
en
cy
FrequencyPop 1
Barren
Pop 2 - Mineralized
250,000 lbs
525,000 lbs 10,000,000 lbs
40,000 lbs
1,200,000
28 11/2/2011 28
Figure 13. Current data cumulative frequency diagram of breccia pipe ore deposit sizes.
The current cumulative frequency distribution of uranium deposit sizes in northern Arizona. This diagram is subject to change as the population sample size increases with time (and further exploration). N=29. Note that this distribution diagram will only be practically predictive when Figure 9 hole deviation errors are minimized and Figure 10 disequilibrium problems are timely and accurately recognized.
First, note that the portions of the curve high-lighted in yellow (below the curve) correspond to the annual uranium output achieved in the US during the last significant (1972-1984) domestic uranium production period. As US output expanded to meet (domestic and world-wide) demand, supply costs first reached a gentle plateau and then abruptly steepened as higher and higher unit cost mining operations entered the market in response to increased demand and rising uranium price levels. Among other things, the effect of this increasing demand and rising price was to strongly increase the profit margins of low-cost producers.40 In 2009 dollars, the US production
40 Low-cost producers in the US currently include those mining relatively high grade uranium deposits like those of northern Arizona, and those operating ISL mines elsewhere in the West.

29 11/2/2011 29
cost41 plateau ranges from $68/pound U3O8 to $165/pound. In contrast, current total production cost levels for northern Arizona breccia pipe uranium are in the neighborhood of $25 to $30/pound.42 Besides being currently profitable, this cost curve indicates that with expected continuing growth in domestic and worldwide demand, northern Arizona breccia pipe uranium production will result in increasing returns to capital. See the red ‘Producer Surplus’ arrows shown on Figure 14. Over the 2008-2010 period, the spot price level floor has been in the neighborhood of about $40/pound. Therefore, for the purposes of cash flow projections presented here, this yellowcake selling price level is taken as a worst-case attribute.
Figure 14. Long-run US yellowcake supply curve.
Mid-point on the gentle plateau portion of the US uranium supply curve is about $75/pound U3O8
in 2009 dollars For the purposes of this report, this is defined as the ‘expected case’ price. Similarly, the 2009 dollar equivalent previous maximum price level of the previous uranium production cycle of $165/pound U3O8 is taken as this plan’s ‘best case’ for uranium price. See the red double-headed arrows on Figure 14 again and note their significance as far as the profitability of mining uranium in northern Arizona is concerned.
41 This supply cost includes ordinary profit margins of the producers. 42 http://www.mining-technology.com/projects/arizona-1-uranium/
Bx Pipe ~ Full Production
Cost
W orst Case Producer’s
Surplus
Expected Case
Producer’s
Surplus
Best Case Producer’s
Surplus

30 11/2/2011 30
Scenario Analysis and Discounted Cash Flow Projections
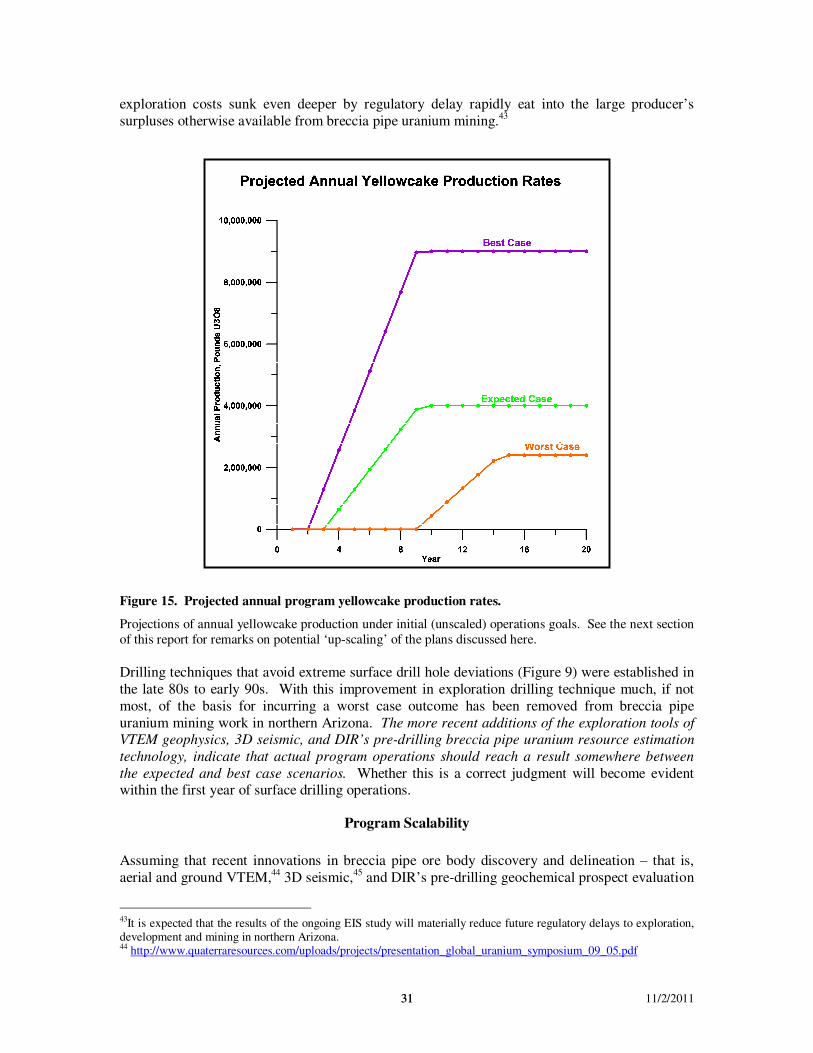
Table IV lists the scenario attributes and results of the cash flow projections of this business plan. As explained in the previous narrative material, each scenario attribute corresponds to a major controlling variable impacting the rate of progress and the degree of profitability of breccia pipe uranium mining in northern Arizona. Details of the cash flow and other modeling used to generate Table IV are provided in the appendix of this report. The initial overall program goal of this business plan is to define a minimum of one economically-mineralized breccia pipe per year, place that discovery into development in the following year, and then begin its mining within three years of surface drilling definition of the ore deposit. Annual iterations of this process would continue until all available economically-mineralized breccia pipe properties have been depleted, or until the market for uranium no longer supports such work. Ideally, then, once this basic program is in progress there will be – in any given year – one economically-mineralized breccia pipe in the surface drilling reserves delineation phase, one or more pipes in development, and one new mine coming into production. Because mine life is generally longer than the combined exploration and development phases, it is expected that annual yellowcake production rates would eventually increase to the 4,000,000 pounds/year (expected case) to 9,000,000 pounds/year (best case) range. See Figure 15.
Table IV. Scenario Assumptions and Results
The federal gross royalty of 6.25% in the ‘worst case’ corresponds to the minimum federal royalty payable in the event that uranium is converted from a locatable mineral to a leasable mineral by possible Congressional passage of the CLEAR Act.
The last row of Table IV above provides estimated 5-year program values for the purposes of considering a possible ‘going public’ harvest strategy. It is important to note in Table IV that the low returns of the worst case scenario reflect the effects of long regulatory delays on breccia pipe uranium operations like those currently being experienced by companies working in the area. Excessively sustained lag times between discovery and mine production represent a huge opportunity cost to mining companies. Sunk
31 11/2/2011 31
exploration costs sunk even deeper by regulatory delay rapidly eat into the large producer’s surpluses otherwise available from breccia pipe uranium mining.43
Figure 15. Projected annual program yellowcake production rates.
Projections of annual yellowcake production under initial (unscaled) operations goals. See the next section of this report for remarks on potential ‘up-scaling’ of the plans discussed here.
Drilling techniques that avoid extreme surface drill hole deviations (Figure 9) were established in the late 80s to early 90s. With this improvement in exploration drilling technique much, if not most, of the basis for incurring a worst case outcome has been removed from breccia pipe uranium mining work in northern Arizona. The more recent additions of the exploration tools of
VTEM geophysics, 3D seismic, and DIR’s pre-drilling breccia pipe uranium resource estimation
technology, indicate that actual program operations should reach a result somewhere between
the expected and best case scenarios. Whether this is a correct judgment will become evident within the first year of surface drilling operations.
Program Scalability
Assuming that recent innovations in breccia pipe ore body discovery and delineation – that is, aerial and ground VTEM,44 3D seismic,45 and DIR’s pre-drilling geochemical prospect evaluation
43It is expected that the results of the ongoing EIS study will materially reduce future regulatory delays to exploration, development and mining in northern Arizona. 44 http://www.quaterraresources.com/uploads/projects/presentation_global_uranium_symposium_09_05.pdf

32 11/2/2011 32
method – all will meet their current promise of increasing breccia pipe exploration effectiveness in the coming years, a secondary program goal would be to employ these cost-cutting means to increase the scale of operations so that more than one economically-mineralized breccia pipe is cost-effectively delineated each year and more than one new breccia pipe uranium mine begins production each year. Inasmuch as the planned program could become self-financing in less than five years, the chief limiting factors to eventually reaching the secondary goal of increasing the scale of operations are the number and quality of mineralized breccia pipe prospects available for ore deposit delineation, development, and mining. Figure 16, which shows the frequency distribution of the U3O8 resource semi-quantitatively estimated by DIR to exist on its current, geochemically pre-filtered collection of 48 breccia pipe prospects points to the importance of maximizing property position if increasing returns to scale are to be obtained.
Figure 16. Apparent uranium resource frequency distribution, DIR current prospects.
Frequency distribution graphs of apparent U3O8 resource amounts contained in the 48 breccia pipe properties held by DIR Exploration, Inc., as of September 2010. Note that this linear array breccia pipe distribution data is again plainly lognormal. This means that the incidence of smaller ore bodies is much higher than the incidence of larger ore bodies. It appears from this graph that about 35% of DIR’s current prospects contain 4,000,000 pounds or more of U3O8 equivalent.
Scale of operations can be increased by two means: (1) by the early front-loading development and mining work of the planned program with prospects determined to contain largest quantities of ore (‘prospect quality’), and (2) by increasing the number of simultaneously operating mines (‘prospect number’).46 Statistically speaking, increasing the number of prospects to explore by acquiring additional properties simultaneously prepares for the execution of both of these means
45 See 3D-seismic report provided in the appendix of this report. Historically, the greatest cost-increasing problem in conducting surface drilling of breccia pipes is locating the surface projection of these relatively small diameter targets. Both VTEM and 3D seismic appear capable of surmounting this problem. 46 Note, however, that increasing output by accelerating the rate of development of new mines is not as cost-effective as increasing output by gaining development and mining access to breccia pipes containing greater than average amounts of uranium ore.
Frequency Distibution of Estimated U3O8 Resource
Contained by the DIR Property Position as of September
2010 (N=48)
0
5
10
15
20
10
0000
0
20
0000
0
30
0000
0
40
0000
0
50
0000
0
60
0000
0
70
0000
0
80
0000
0
90
0000
0
100
0000
0
110
0000
0
120
0000
0
130
0000
0
Mo
re
Predicted Pounds U3O8
Fre
qu
en
cy
.00%
10.00%
20.00%
30.00%
40.00%
50.00%
60.00%
70.00%
80.00%
90.00%
100.00%
Frequency
Cumulative %

33 11/2/2011 33
of achieving economies of scale. Accordingly, the following section presents a first-year plan for acquiring (and protecting) a larger sample of northern Arizona breccia pipe prospects. Success of this work will increase the probability that operations can be advantageously scaled up in the future, and should – through early ‘cherry-picking’ development and mining of the largest available ore deposits – maximize near term production rates and returns on investment.
First-Year Plan
Introduction
As already explained, the July 19, 2009, US Department of Interior’s two year segregation of approximately 1,000,000 acres managed by the BLM and USFS from further mineral entry (lode claim location) has had the effects of at least temporarily closing down exploration drilling on these lands, and putting mineral rights prospectively held by the Kaibab JV under unusual business risk. See Figure 17 for an expanded map showing the federal lands temporarily closed to exploration drilling and new claim-staking, and the distribution of the DIR-contributed breccia pipe prospects within and outside of these segregated lands as of 10/09. All prospects previously prepared for exploration drilling work by DIR are located inside the two year segregation area and cannot be cleared for drilling operations at present without first being exposed to the jeopardy and delaying complication of federal mining claim mineral examinations. In response to the increased business uncertainty introduced by the July 2009 US DOI decision, the current legislative efforts to change uranium from a locatable mineral to a leasable mineral, and the need to maximize property position in order to maximize program value, the goals of the first year plan are restricted to:
1. Augmentation of the property position of the planned Kaibab JV on lands prospective for breccia pipe uranium ore outside of the exploration and mining areas currently directly threatened by Department of Interior actions;
2. Preparation of defenses against possible USFS and BLM efforts to invalidate DIR-
contributed mining claim inholdings at the end of the two-year temporary withdrawal period, or against similar efforts at the event of possible passage of new laws mandating the conversion of uranium claims to uranium leases; and,
3. Protective resource assessments of the uranium mineralization potential of the federal
mineral interests of competitors. This work would be completed in support of a planned Kaibab JV effort to acquire these federal mineral interests from their original owners before the claims are either dropped by these owners, or are possibly invalidated by subsequent federal mineral examinations.47
47 “Although a mining claimant may not have any rights based on a location or amended location made subsequent to a withdrawal of the land, he is not precluded from establishing that he has possessory rights, as the successor in interest of an original locator, based on mining claims made and perfected prior to the withdrawal [emphasis added].” From page ix, What is the Mining Law?, ~1970, US Department of Interior unnumbered publication, quoting Nelson, A-29174, 1963. Time is of the essence.