business park -...
TRANSCRIPT

HIGHLINE CENTRE
BU
SINESS PA
RK
1200, 1210, 1220, 1240, 1250, 1260, 1270 PARKER ROAD | DENVER, COLORADO 80231

HIGHLINE CENTRE BUSINESS PARK
2
PROPERTY OVERVIEW
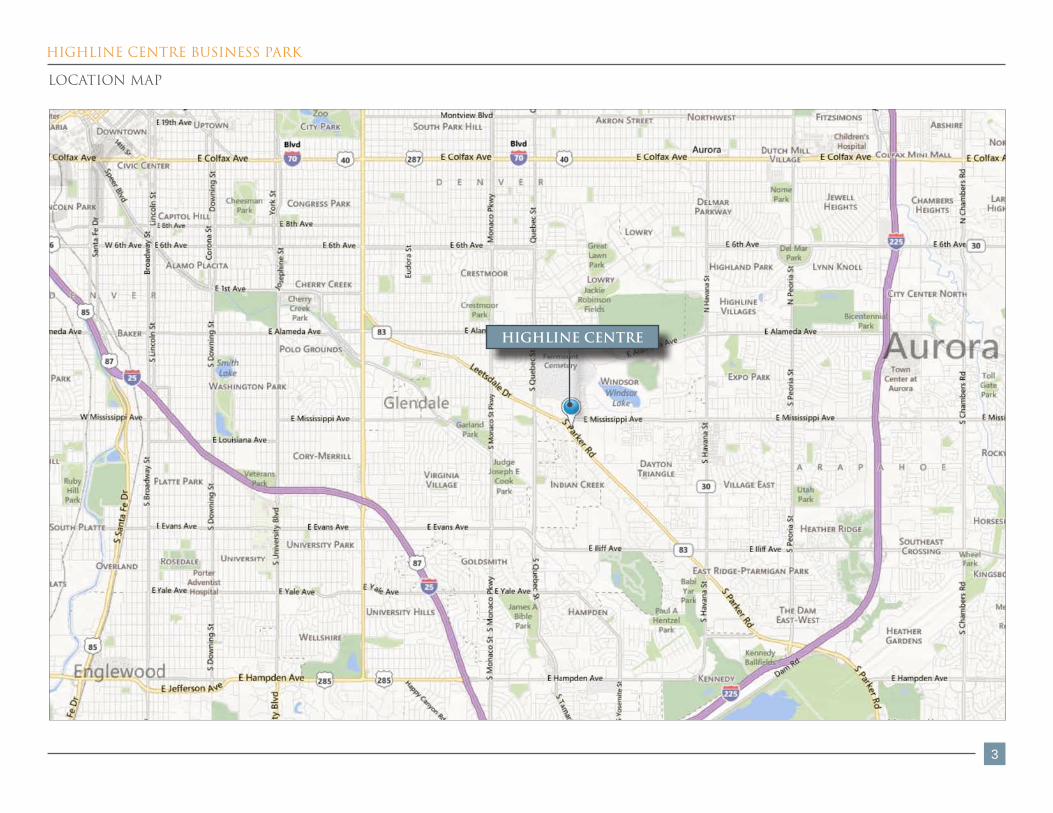
Highline Centre Business Park is centrally located in Denver, Colorado on Parker Road/Leetsdale & Mississippi between Interstates 25 and 225 with immediate access to Lowry, Cherry Creek, and the Gardens on Havana redevelopment area. Excellent medical, dental, office and meeting space is abundant, making these buildings a superb choice for smaller companies, individuals and small medical practices.
Highline Centre Business Park boasts balconies, lush landscaping and ample parking as well as fantastic visibility from both north and southbound Parker Road/Leetsdale. Reception space, conference rooms and some medical spaces containing exam rooms are available, as well as storage for most suites.
Local amenities abound near the site, with many small businesses and independent restaurateurs within the neighborhood. Colorado Boulevard is a short 2.5 miles away and offers an abundance of shopping, restaurants and services. The Cherry Creek Shopping district also offers a vast array of dining and retail as well as the Lowry area and the Gardens on Havana Redevelopment area.
The Lowry area and its surrounding neighborhoods have seen a major revitalization over the last few years and has truly become a destination for living, dining, social, employment and shopping. The area continues to see growth and economic development.
HIGHLINE CENTRE BUSINESS PARK
3
LOCATION MAP
Lat: 39.69657 Long: -104.89564 Zoom: 14.27 m
iLogos are for identification purposes only and m
ay be trademarks of their respective com
panies.
©2013, SITES USA Inc., Chandler, AZ (480) 491-1112. All Rights Reserved.
This map was produced using data from private and government sources deemed to be reliable. The information herein is provided without representation or warranty
1200 S Parker Rd
October 2013
HIGHLINE CENTRE

HIGHLINE CENTRE BUSINESS PARK
4
HIGHLINE CENTRE
AERIAL LOCATION - MACRO
INTERSTATE
70
INTERSTATE
25
INTERSTATE
225
Denver CBD
Cherry Creek
Lowry
Stapleton
Gardens on
Havana

HIGHLINE CENTRE BUSINESS PARK
5
Lowry
Colorado Boulevard
RetailCorridor
HIGHLINE CENTRE
AERIAL NEIGHBORHOODS - MACRO

HIGHLINE CENTRE BUSINESS PARK
6
Wallaby’s Liquor Warehouse
Golden Shanghai Restaurant
Continental Cleaners
Mugsy’s Bar
Sam’s Bar & Lounge
George Washington High School
JCC
Rocky Mountain Eurosport
Copper Kettle Brewery
Budget Moving
Public Library
Elsa’s Ethiopian Restaurant
Galilee Baptist Church
Denver Auto CareWestern Gas Station Jacob’s Service Center
Toy Doctor, Inc.
Cakes by KarenBlack Sea Market
Beautiful BloomsBarber Shop
Medstuff
Sun Wah Restaurant | Ouzo Liquours | Cigarettes & More | Washway Laundry
Queen Nails | International Market |WT Shorty’s Grill |Viva Burrito | Karate Dojo | MedStuff | Paris Tire |Green Around You
Les Delices de Paris | Harmony Yoga | New York Pizzeria | Fat Jacks Subs |
Quality Auto Sound | Banzai Sushi | Public Storage | 24 Hour Tans | Sterling Car Wash |Highline Automotive
AMF Monaco Bowling
HIGHLINE CENTRE
Lowry
S. PARKER ROAD
AMENITIES AERIAL

HIGHLINE CENTRE BUSINESS PARK
7
Mugsy’s BarBarber Shop
All American Pawn
Cakes by Karen
Levine Liqours
Pho 89 Restaurant
Beautiful Blooms
BUILDING 1200
BUILDING 1210 BUILDING 1220
BUILDING 1240
BUILDING 1250
BUILDING 1260
BUILDING PAD 1270
SITE AERIAL

HIGHLINE CENTRE BUSINESS PARK
8
1260
1210
NAP
1220
1200
1250
1240
1280
1270PAD/ BUILD
TO SUIT AVAILABLE
SITE PLAN
N

HIGHLINE CENTRE BUSINESS PARK
9
BUILDING 1200 SUMMARY
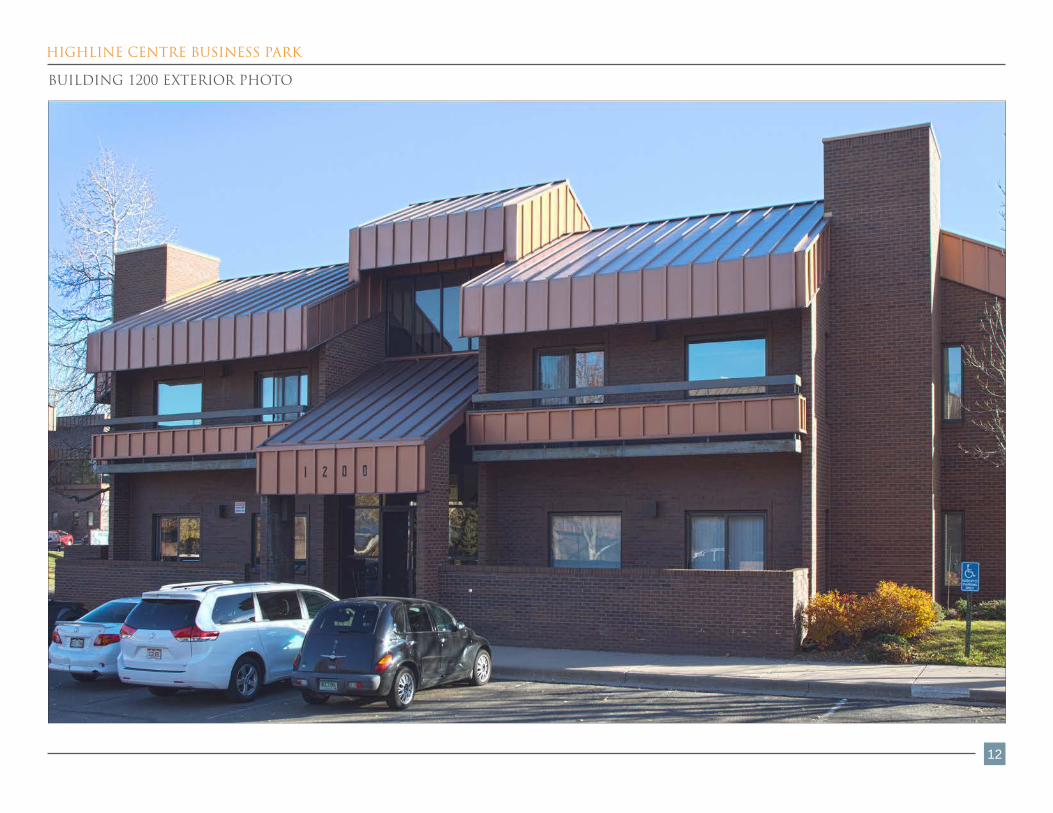
BUILDING ADDRESS 1200 Parker Road Denver, COTOTAL SQUARE FOOTAGE 7,887 RSFNUMBER OF STORIES 2PARKING AmplePROPERTY FEATURES • On bus route
• Minutes to Cherry Creek (2.5 miles)• Minutes to Lowry (1.5 miles)• Excellent location on Parker & Mississippi
BUILDING 1200
• Suites 217 SF - 1,196 SF• Storage Available
HIGHLINE CENTRE BUSINESS PARK
10
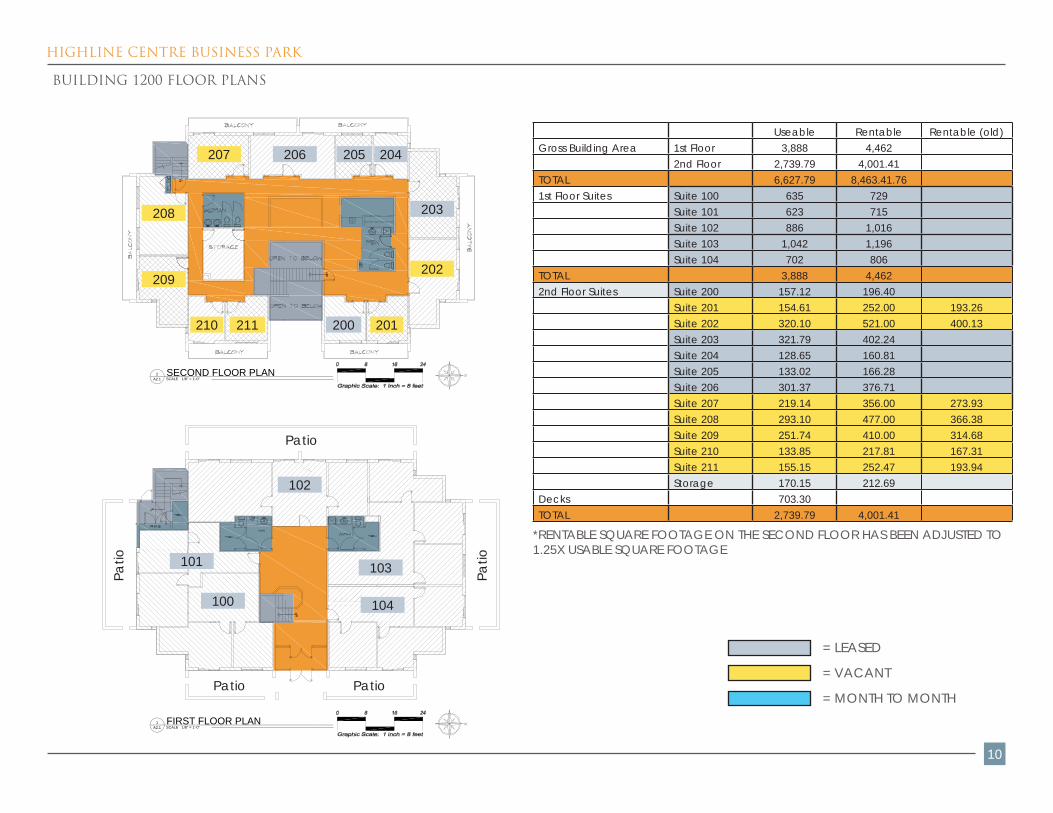
BUILDING 1200 FLOOR PLANS
SCALEFIRST FLOOR PLAN
A2.11
1/8" = 1'-0"
SCALESECOND FLOOR PLAN
A2.12
1/8" = 1'-0"
BUILDING SUMMARY SQ. FT. FLOOR SUMMARY SQ. FT.1200 Parker RoadGross Building Area 1st Floor 5,861.66 Total Rentable 1st Floor 4,386.26
2nd Floor 4,203.55 2nd Floor 4,458.47Total Rentable Total 10,065.21 Total Usable 1st Floor 3,820.51Totatl Usable 6,560.30 2nd Floor 2,739.79First floor common area percentage = 15% Combined R/U 1st Floor 1.15Second floor common area percentage = 63% 2nd Floor 1.63Total Floor Common 868.00 First Floor Common 523.06Total Building Common 1,933.78 Second Floor Common 344.94Total Vertical 703.12 First Floor Building Common 616.51
Second Floor Building Common 1,317.27First Floor Vertical 232.18Second Floor Vertical 470.94
1st Floor Suites 100 2,635.35 SF + 390.24 CA = 3,025.60101 1,185.16 SF + 175.50 CA = 1,360.66
Subtotal = 3,820.51 SF + 565.74 CA = 4,386.26Patios 1,738.04 SF
2nd Floor Suites 200 157.12 SF + 98.56 CA = 255.69201 154.61 SF + 96.99 CA = 251.60202 320.10 SF + 200.80 CA = 520.91203 321.79 SF + 201.86 CA = 523.65204 128.65 SF + 80.70 CA = 209.35205 133.02 SF + 83.44 CA = 216.46206 301.37 SF + 189.05 CA = 490.42207 219.14 SF + 137.47 CA = 356.61208 293.10 SF + 183.86 CA = 476.96209 251.74 SF + 157.92 CA = 409.66210 133.85 SF + 83.96 CA = 217.81211 155.15 SF + 97.32 CA = 252.47
Storage 170.15 SF + 106.74 CA = 276.89 Subtotal = 2,739.79 SF + 1,718.68 CA = 4,458.47Decks 703.30 SF
Areas computed in accordance with BOMA (1996) standards
Useable Rentable Rentable (old)Gross Building Area 1st Floor 3,888 4,462
2nd Floor 2,739.79 4,001.41TOTAL 6,627.79 8,463.41.761st Floor Suites Suite 100 635 729
Suite 101 623 715Suite 102 886 1,016Suite 103 1,042 1,196Suite 104 702 806
TOTAL 3,888 4,4622nd Floor Suites Suite 200 157.12 196.40
Suite 201 154.61 252.00 193.26Suite 202 320.10 521.00 400.13Suite 203 321.79 402.24Suite 204 128.65 160.81Suite 205 133.02 166.28Suite 206 301.37 376.71Suite 207 219.14 356.00 273.93Suite 208 293.10 477.00 366.38Suite 209 251.74 410.00 314.68Suite 210 133.85 217.81 167.31Suite 211 155.15 252.47 193.94Storage 170.15 212.69
Decks 703.30TOTAL 2,739.79 4,001.41
207
Patio
PatioPatio
Patio
Patio
206
203
202209
208
205
200211210
204
201
= VACANT
= LEASED
= MONTH TO MONTH
104
103
102
100
101
*RENTABLE SQUARE FOOTAGE ON THE SECOND FLOOR HAS BEEN ADJUSTED TO 1.25X USABLE SQUARE FOOTAGE

HIGHLINE CENTRE BUSINESS PARK
11
POTENTIAL OFFICE REDESIGN
HIGHLINE CENTRE BUSINESS PARK
12
BUILDING 1200 EXTERIOR PHOTO

HIGHLINE CENTRE BUSINESS PARK
13
BUILDING 1210 SUMMARY
BUILDING ADDRESS 1210 Parker Road Denver, COTOTAL SQUARE FOOTAGE 10,292 RSFNUMBER OF STORIES 2PARKING AmplePROPERTY FEATURES • On bus route
• Minutes to Cherry Creek (2.5 miles)• Minutes to Lowry (1.5 miles)• Excellent location on Parker & Mississippi
BUILDING 1210

HIGHLINE CENTRE BUSINESS PARK
14
BUILDING 1210 FLOOR PLANS
SCALEFIRST FLOOR PLAN
A2.11
1/8" = 1'-0"
SCALESECOND FLOOR PLAN
A2.12
1/8" = 1'-0"
SCALEBASEMENT FLOOR PLAN
A2.13
1/8" = 1'-0"
BUILDING SUMMARY FLOOR SUMMARY1210 S Parker Road SQ. FT. SQ. FT.Gross Building Area Bsmnt 1,855.85 Total Rentable Bsmnt 1,855.85
1st Floor 4,226.95 1st Floor 4,226.952nd Floor 4,209.06 2nd Floor 4,209.06
Total Rentable Total 10,291.87 Total Usable Bsmnt 1,688.97Totatl Usable 8,521.50 1st Floor 3,365.70
2nd Floor 3,466.83Common area Percentage = 17% Combined R/U Bsmnt 1.10Total Floor Common 724.41 1st Floor 1.26Total Building Common 392.75 2nd Floor 1.21Total Vertical 653.22 Bsmnt Floor Common 0.00
First Floor Common 289.93Second Floor Common 434.48Bsmnt Floor Building Common 75.03First Floor Building Common 172.00Second Floor Building Common 145.72Bsmnt Floor Vertical 91.85First Floor Vertical 254.83Second Floor Vertical 306.53
Basement Floor Suites Storage 1,688.97 SF + 166.88 CA = 1,855.85 Subtotal = 1,688.97 SF + 166.88 CA = 1,855.85
1st Floor Suites 100 1,289.63 SF + 221.84 CA = 1,511.47101 417.25 SF + 71.77 CA = 489.02102 442.86 SF + 76.18 CA = 519.04103 418.64 SF + 72.01 CA = 490.65104 797.32 SF + 137.15 CA = 934.48
Subtotal = 3,365.70 SF + 578.96 CA = 3,944.65
2nd Floor Suites 200 699.80 SF + 120.38 CA = 820.18205 708.80 SF + 121.93 CA = 830.73210 2,058.22 SF + 354.05 CA = 2,412.27
Subtotal = 3,466.83 SF + 596.35 CA = 4,063.18
Areas computed in accordance with BOMA (1996) standards
Useable RentableGross Building Area Basement 1,688.97 1,855.85
1st Floor 3,365.70 4,226.952nd Floor 3,466.83 4,209.06
TOTAL 8,521.50 10,291.86Basement Floor Suites Storage 1,688.97 1,855.851st Floor Suites Suite 100 1,289.63 1,511.47
Suite 101 417.25 489.02Suite 102 442.86 519.04Suite 103 418.64 490.65Suite 104 797.32 934.48
TOTAL 3,365.70 3,944.662nd Floor Suites Suite 200 699.80 820.18
Suite 205 708.80 830.73Suite 210 2,058.22 2,412.27
TOTAL 3,466.82 4,063.18
210
101
001
102
103
104100
200
205
= VACANT
= LEASED
= MONTH TO MONTH

HIGHLINE CENTRE BUSINESS PARK
15
POTENTIAL OFFICE REDESIGN

HIGHLINE CENTRE BUSINESS PARK
16
BUILDING 1210 EXTERIOR PHOTO

HIGHLINE CENTRE BUSINESS PARK
17
BUILDING 1220 SUMMARY
BUILDING ADDRESS 1220 Parker Road Denver, COTOTAL SQUARE FOOTAGE 10,445 RSFNUMBER OF STORIES 2PARKING AmplePROPERTY FEATURES • Excellent small suite spaces available
• Minutes to Cherry Creek (2.5 miles)• Minutes to Lowry (1.5 miles)• Excellent location on Parker & Mississippi • Patios & balconies available
BUILDING 1220
• Shared conference room space• Shared kitchen and reception area• Suites from 238 SF- 2,552 SF

HIGHLINE CENTRE BUSINESS PARK
18
BUILDING 1220 FLOOR PLANS
SCALEFIRST FLOOR PLAN
A2.11
1/8" = 1'-0"
SCALESECOND FLOOR PLAN
A2.12
1/8" = 1'-0"
SCALEBASEMENT FLOOR PLAN
A2.13
1/8" = 1'-0"
BUILDING SUMMARY FLOOR SUMMARY1220 S Parker Road SQ. FT. SQ. FT.Gross Building Area Bsmnt 1,896.83 Total Rentable Bsmnt 1,896.83
1st Floor 4,813.48 1st Floor 4,813.462nd Floor 4,778.89 2nd Floor 4,778.91
Total Rentable Total 11,489.20 Total Usable Bsmnt 1,479.33Totatl Usable 7,643.52 1st Floor 3,623.50
2nd Floor 2,540.69AverageCommon area Percentage = 66.53% Combined R/U Bsmnt 1.28Total Floor Common 2,161.72 1st Floor 1.33Total Building Common 786.90 2nd Floor 1.88Total Vertical 330.67 Bsmnt Floor Common 21.80
First Floor Common 687.89Second Floor Common 1,452.04Bsmnt Floor Building Common 356.58First Floor Building Common 207.26Second Floor Building Common 223.05Bsmnt Floor Vertical 39.11First Floor Vertical 62.99Second Floor Vertical 228.58
Usable RentableBasement Floor Suites 001 1,479.33 SF + 417.49 CA = 1,896.82
Subtotal = 1,479.33 SF + 417.49 CA = 1,896.82
1st Floor Suites 102 A 240.39 SF + 78.94 CA = 319.34102 B 285.96 SF + 93.91 CA = 379.87102 C 251.36 SF + 82.55 CA = 333.91102 D 430.92 SF + 141.52 CA = 572.44102 E 286.48 SF + 94.08 CA = 380.56104 2,128.39 SF + 698.96 CA = 2,827.35
Subtotal = 3,623.50 SF + 1,189.96 CA = 4,813.46
2nd Floor Suites Common Conference and ReceptionStorage 193.32 SF + NA 193.32
200 A 190.18 SF + 181.34 CA = 371.53200 B 188.02 SF + 179.28 CA = 367.30200 C 127.78 SF + 121.84 CA = 249.62200 D 128.65 SF + 122.66 CA = 251.31200 E 131.15 SF + 125.05 CA = 256.21200 F 469.07 SF + 447.26 CA = 916.32201 1,112.52 SF + 1,060.78 CA = 2,173.30
Subtotal = 2,540.69 SF + 2,238.22 CA = 4,778.91
Areas computed in accordance with BOMA (1996) standards
BUILDING SUMMARY FLOOR SUMMARY1220 S Parker Road SQ. FT. SQ. FT.Gross Building Area Bsmnt 1,896.83 Total Rentable Bsmnt 1,896.83
1st Floor 4,813.48 1st Floor 4,344.772nd Floor 4,778.89 2nd Floor 3,475.76
Total Rentable Total 11,489.20 Total Usable Bsmnt 1,479.33Totatl Usable 7,643.52 1st Floor 3,623.50
2nd Floor 2,540.69AverageCommon area Percentage = 66.53% Combined R/U Bsmnt 1.28Total Floor Common 2,161.72 1st Floor 1.20Total Building Common 786.90 2nd Floor 1.37Total Vertical 330.67 Bsmnt Floor Common 21.80
First Floor Common 687.89Second Floor Common 1,452.04Bsmnt Floor Building Common 356.58First Floor Building Common 207.26Second Floor Building Common 223.05Bsmnt Floor Vertical 39.11First Floor Vertical 62.99Second Floor Vertical 228.58
Usable RentableBasement Floor Suites 001 1,479.33 SF + 417.49 CA = 1,896.82
Subtotal = 1,479.33 SF + 417.49 CA = 1,896.82
1st Floor Suites 102 A 240.39 SF + 47.85 CA = 288.24102 B 285.96 SF + 56.92 CA = 342.88102 C 251.36 SF + 50.03 CA = 301.40102 D 430.92 SF + 85.78 CA = 516.70102 E 286.48 SF + 57.02 CA = 343.51104 2,128.39 SF + 423.66 CA = 2,552.05
Subtotal = 3,623.50 SF + 721.27 CA = 4,344.77
2nd Floor Suites Common Conference and ReceptionStorage 193.32 SF + NA 193.32
200 A 190.18 SF + 75.76 CA = 265.94200 B 188.02 SF + 74.90 CA = 262.92200 C 127.78 SF + 50.90 CA = 178.68200 D 128.65 SF + 51.25 CA = 179.89200 E 131.15 SF + 52.24 CA = 183.40200 F 469.07 SF + 186.85 CA = 655.92201 1,112.52 SF + 443.17 CA = 1,555.69
Subtotal = 2,540.69 SF + 935.07 CA = 3,475.76
Areas computed per conversation with Sharon Kamen 02/19/2014
BALCONY
PATIO
PATIOPATIO
PATIO
BALC
ON
Y
BALCONY
BALC
ON
Y
Useable RentableGross Building Area Basement 1,896.83 1,896.83
1st Floor 4,583.50 5,553.782nd Floor 2325.11 2994.37
TOTAL 8,805.44 10,444.98Basement Floor Suites 001 1,479.33 1,896.821st Floor Suites Reception* 960 1209
Suite 102A 240.39 288.24Suite 102B 285.96 342.88Suite 102C 466.82 559.75Suite 102D 215.46 258.35Suite 102E 286.48 343.51Suite 104 2,128.39 2,552.05
TOTAL 4,583.50 5,553.782nd Floor Suites Suite 200A 190.18 265.94
Suite 200B 188.02 262.92Suite 200C 127.78 178.68Suite 200D 128.65 179.89Suite 200E 131.15 183.40Suite 200F 469.07 655.69Suite 200G 272.06 316.35Suite 200H 275.20 320.00Suite 201AB* 360.00 393.50Suite 201C* 183.00 238.00
TOTAL 2325.11 2994.37
200A 200B 200C 200D 200E
201AB
200F
102D
102C
001
102B102A
104
102E= VACANT
= LEASED
= MONTH TO MONTH
*Suite 201 was subdivided, which caused slight changes in the usable and rentable square footages of 201 A, B, and C
Reception
200G
200H
201C

HIGHLINE CENTRE BUSINESS PARK
19
SHARED CONFERENCE ROOM

HIGHLINE CENTRE BUSINESS PARK
20
BUILDING 1220 EXTERIOR PHOTO

HIGHLINE CENTRE BUSINESS PARK
21
BUILDING 1240 SUMMARY
BUILDING ADDRESS 1240 Parker Road Denver, COTOTAL SQUARE FOOTAGE 15,553 RSFNUMBER OF STORIES 2PARKING AmplePROPERTY FEATURES • On bus route
• Minutes to Cherry Creek (2.5 miles)• Minutes to Lowry (1.5 miles)• Excellent location on Parker & Mississippi
BUILDING 1240
• Suites from 207 - 2,274 SF

HIGHLINE CENTRE BUSINESS PARK
22
BUILDING 1240 FLOOR PLANS
SCALEFIRST FLOOR PLAN
A2.11
1/8" = 1'-0"
SCALESECOND FLOOR PLAN
A2.12
1/8" = 1'-0"
SCALEBASEMENT FLOOR PLAN
A2.13
1/8" = 1'-0"
BUILDING SUMMARY SQ. FT. FLOOR SUMMARY SQ. FT.1240 S Parker RoadGross Building Area Bsmnt 2,018.94 Total Rentable Bsmnt 2,018.94
1st Floor 6,512.58 1st Floor 6,512.582nd Floor 7,023.41 2nd Floor 7,023.41
Total Rentable Total 15,554.93 Total Usable Bsmnt 1,850.09Totatl Usable 13,358.81 1st Floor 5,544.04
2nd Floor 5,964.68Common area Percentage = 16% Combined R/U Bsmnt 1.09Total Floor Common 990.53 1st Floor 1.17Total Building Common 588.68 2nd Floor 1.18Total Vertical 863.95 Bsmnt Floor Common 0.00
First Floor Common 423.03
Second Floor Common 567.50Bsmnt Floor Building Common 51.64First Floor Building Common 261.83Second Floor Building Common 275.22Bsmnt Floor Vertical 117.21First Floor Vertical 283.18Second Floor Vertical 463.55
Basement Floor Suites Storage 1,850.09 SF + 168.85 CA = 2,018.94 Subtotal = 1,850.09 SF + 168.85 CA = 2,018.94
1st Floor Suites 100 1,842.01 SF + 321.80 CA = 2,163.81103 2,215.43 SF + 387.04 CA = 2,602.47104 1,486.60 SF + 259.71 CA = 1,746.31
Subtotal = 5,544.04 SF + 968.04 CA = 6,512.58
2nd Floor Suites 200 1,016.45 SF + 180.42 CA = 1,196.87274 1,931.40 SF + 342.82 CA = 2,274.23204 A 234.53 SF + 41.63 CA = 276.16204 B 175.94 SF + 31.23 CA = 207.16204 C 186.45 SF + 33.09 CA = 219.55204 D 756.32 SF + 134.25 CA = 890.57205 296.20 SF + 52.58 CA = 348.78210 857.45 SF + 152.20 CA = 1,009.65222 509.94 SF + 90.51 CA = 600.45
Subtotal = 5,964.68 SF + 954.35 CA = 7,023.41
Areas computed in accordance with BOMA (1996) standards
Useable RentableGross Building Area Basement 1,850.09 2,018.94
1st Floor 5,544.61 6,511.122nd Floor 5,964.68 7,023.41
TOTAL 13,359.38 15,553.47Basement Floor Suites 1,850.09 2,018.941st Floor Suites Suite 100 1,842.01 2,163.81
Suite 103-01 1,469.00 1,724.00Suite 103-02 747.00 877.00Suite 104 1,486.60 1,746.31
TOTAL 5,544.61 6,511.122nd Floor Suites Suite 200 1,016.45 1,196.87
Suite 203 1,931.40 2,274.23Suite 204A 234.53 276.16Suite 204B 175.94 207.16Suite 204C 186.45 219.55Suite 204D 756.32 890.57Suite 205 296.20 348.78Suite 210 857.45 1,009.65Suite 222 509.94 600.45
TOTAL 5,964.68 7,023.41
LOBBY
222
210
204D
204C
204B
204A
200 203
104
100
103-01
103-02
205
= VACANT
= LEASED
= MONTH TO MONTH

HIGHLINE CENTRE BUSINESS PARK
23
potential office redesign

HIGHLINE CENTRE BUSINESS PARK
24
BUILDING 1240 EXTERIOR PHOTO

HIGHLINE CENTRE BUSINESS PARK
25
BUILDING 1250 SUMMARY
BUILDING ADDRESS 1250 Parker Road Denver, COTOTAL SQUARE FOOTAGE 19,813 RSFNUMBER OF STORIES 2PARKING AmplePROPERTY FEATURES • On bus route
• Minutes to Cherry Creek (2.5 miles)• Minutes to Lowry (1.5 miles)• Excellent location on Parker & Mississippi
BUILDING 1250

HIGHLINE CENTRE BUSINESS PARK
26
BUILDING 1250 FLOOR PLANS
SCALEFIRST FLOOR PLAN
A2.11
1/8" = 1'-0"
SCALESECOND FLOOR PLAN
A2.12
1/8" = 1'-0"
SCALEBASEMENT FLOOR PLAN
A2.13
1/8" = 1'-0"
BUILDING SUMMARY FLOOR SUMMARY1250 S Parker Road SQ. FT. SQ. FT.Gross Building Area Bsmnt 7,079.03 Total Rentable Bsmnt 7,079.03
1st Floor 6,879.97 1st Floor 6,879.972nd Floor 6,438.92 2nd Floor 6,438.92
Total Rentable Total 20,397.91 Total Usable Bsmnt 6,205.59Totatl Usable 17,881.14 1st Floor 6,031.09
2nd Floor 5,644.46Common area Percentage = 15% Combined R/U Bsmnt 1.14Total Floor Common 1,321.23 1st Floor 1.14Total Building Common 962.87 2nd Floor 1.14Total Vertical 686.96 Bsmnt Floor Common 106.96
First Floor Common 699.65
Second Floor Common 514.63Bsmnt Floor Building Common 291.59First Floor Building Common 275.83Second Floor Building Common 395.45Bsmnt Floor Vertical 169.65First Floor Vertical 236.12Second Floor Vertical 281.19
Basement Floor Suites 001 6,205.59 SF + 873.44 CA = 7,079.03 Subtotal = 6,205.59 SF + 873.44 CA = 7,079.03
1st Floor Suites 100 1,853.77 SF + 260.92 CA = 2,114.69101 1,074.31 SF + 151.21 CA = 1,225.52102 1,583.56 SF + 222.89 CA = 1,806.45103 1,053.83 SF + 148.33 CA = 1,202.15
103A 465.62 SF + 65.54 CA = 531.15 Subtotal = 6,031.09 SF + 848.88 CA = 6,879.97
2nd Floor Suites 200 1,493.75 SF + 210.25 CA = 1,703.99201 A 193.89 SF + 27.29 CA = 221.19201 B 367.48 SF + 51.72 CA = 419.20201 C 243.84 SF + 34.32 CA = 278.16202 343.28 SF + 48.32 CA = 391.60203 1,321.20 SF + 185.96 CA = 1,507.16204 932.37 SF + 131.23 CA = 1,063.60205 748.65 SF + 105.37 CA = 854.02
Subtotal = 5,644.46 SF + 794.46 CA = 6,438.92
Areas computed in accordance with BOMA (1996) standards
Useable RentableGross Building Area Basement 6,205.59 7,079.03
1st Floor 5,560.26 6,341.812nd Floor 5,602.97 6,391.77
TOTAL 17,368.82 19,812.61Basement Floor Suites 001 6,205.59 7,079.031st Floor Suites Suite 100 1,853.77 2,114.69
Suite 101 1,074.31 1,225.52Suite 102 1,583.56 1,806.45Suite 103 583.00 664.00Suite 103A 465.62 531.15
TOTAL 5,560.26 6,341.812nd Floor Suites Suite 200 1,493.75 1,703.99
Suite 201 611.00 697.00Suite 202 496.00 566.00Suite 203 1,321.20 1,507.16Suite 204 932.37 1,063.60Suite 205 748.65 854.02
TOTAL 5,602.97 6,391.77
202
200
102
001
101
002100 103A
205
204203
= VACANT
= LEASED
= MONTH TO MONTH
103
201

HIGHLINE CENTRE BUSINESS PARK
27
potential office redesign

HIGHLINE CENTRE BUSINESS PARK
28
BUILDING 1250 EXTERIOR PHOTO

HIGHLINE CENTRE BUSINESS PARK
29
BUILDING 1260 SUMMARY
BUILDING ADDRESS 1260 Parker Road Denver, COTOTAL SQUARE FOOTAGE 19,562 RSFNUMBER OF STORIES 2PARKING AmplePROPERTY FEATURES • Entire building available
• Elevator• On bus route• Minutes to Cherry Creek (2.5 miles)• Minutes to Lowry (1.5 miles)• Excellent location on Parker & Mississippi
BUILDING 1260

HIGHLINE CENTRE BUSINESS PARK
30
BUILDING 1260 FLOOR PLANS
SCALEBSMNT FLOOR PLAN
A2.11
1/8" = 1'-0" SCALEFIRST FLOOR PLAN
A2.12
1/8" = 1'-0" SCALESECOND FLOOR PLAN
A2.13
1/8" = 1'-0"
BUILDING SUMMARY SQ. FT. FLOOR SUMMARY SQ. FT.1260 S Parker RoadGross Building Area Bsmnt 6,520.56 Total Rentable Bsmnt 6,520.56
1st Floor 6,520.56 1st Floor 6,520.562nd Floor 6,520.56 2nd Floor 6,520.56
Total Rentable Total 19,561.69 Total Usable Bsmnt 5,580.28Totatl Usable 16,529.45 1st Floor 5,329.53
2nd Floor 5,619.64Common area Percentage = 21% Combined R/U Bsmnt 1.17Total Floor Common 1,071.18 1st Floor 1.22Total Building Common 2,258.59 2nd Floor 1.16Total Vertical 834.24 Bsmnt Floor Common 240.11
First Floor Common 601.59
Second Floor Common 229.47Bsmnt Floor Building Common 1,712.10First Floor Building Common 244.52Second Floor Building Common 301.98Bsmnt Floor Vertical 119.84First Floor Vertical 344.92Second Floor Vertical 369.47
Basement Floor Suites 001 4,202.53 SF + 771.16 CA = 4,973.69002 1,377.75 SF + 252.82 CA = 1,630.57
Subtotal = 5,580.28 SF + 1,023.98 CA = 6,604.26
1st Floor Suites 100 1,102.11 SF + 202.24 CA = 1,304.34101 4,227.42 SF + 775.73 CA = 5,003.15102 3,318.27 SF + 608.90 CA = 3,927.18
Subtotal = 5,329.53 SF + 977.97 CA = 6,307.49
2nd Floor Suites 201 5,619.64 SF + 1,031.20 CA = 6,650.85 Subtotal = 5,619.64 SF + 1,031.20 CA = 6,650.85
Areas computed in accordance with BOMA (1996) standards
Useable RentableGross Building Area Basement 5,580.28 6,520.56
1st Floor 5,310.45 5,561.212nd Floor 5,619.64 6,520.53
TOTAL 16,510.37 18,602.30Basement Floor Suites 001 4,202.53 4,973.69
002 1,377.75 1,630.571st Floor Suites Suite 100 - 1,368.00
Suite 101 - 1,160.00Suite 102 - 1,778.00Suite 103 - 1,176.00Suite 104 - 1,039.00
TOTAL 5,310.45 5,561.212nd Floor Suites Suite 201 5,619.64 6,520.53TOTAL 5,619.64 6,520.53
001
201002
ENTIRE 2ND FLOOR AVAILABLE FOR MEDICAL USE
= VACANT
= LEASED
= MONTH TO MONTH
103 104
102
101101
100

HIGHLINE CENTRE BUSINESS PARK
31
artist rendering of medical office redesign

HIGHLINE CENTRE BUSINESS PARK
32
BUILDING 1260 EXTERIOR

HIGHLINE CENTRE BUSINESS PARK
33
BUILDING PAD 1270 SUMMARY
BUILDING PAD ADDRESS 1270 Parker Road Denver, COTOTAL SQUARE FOOTAGE 30,098 SFZONING B1PARKING AmplePROPERTY FEATURES • On bus route
• Minutes to Cherry Creek (2.5 miles)• Minutes to Lowry (1.5 miles)• Excellent location on Parker & Mississippi
BUILDING PAD 1270
HIGHLINE CENTRE BUSINESS PARK
34
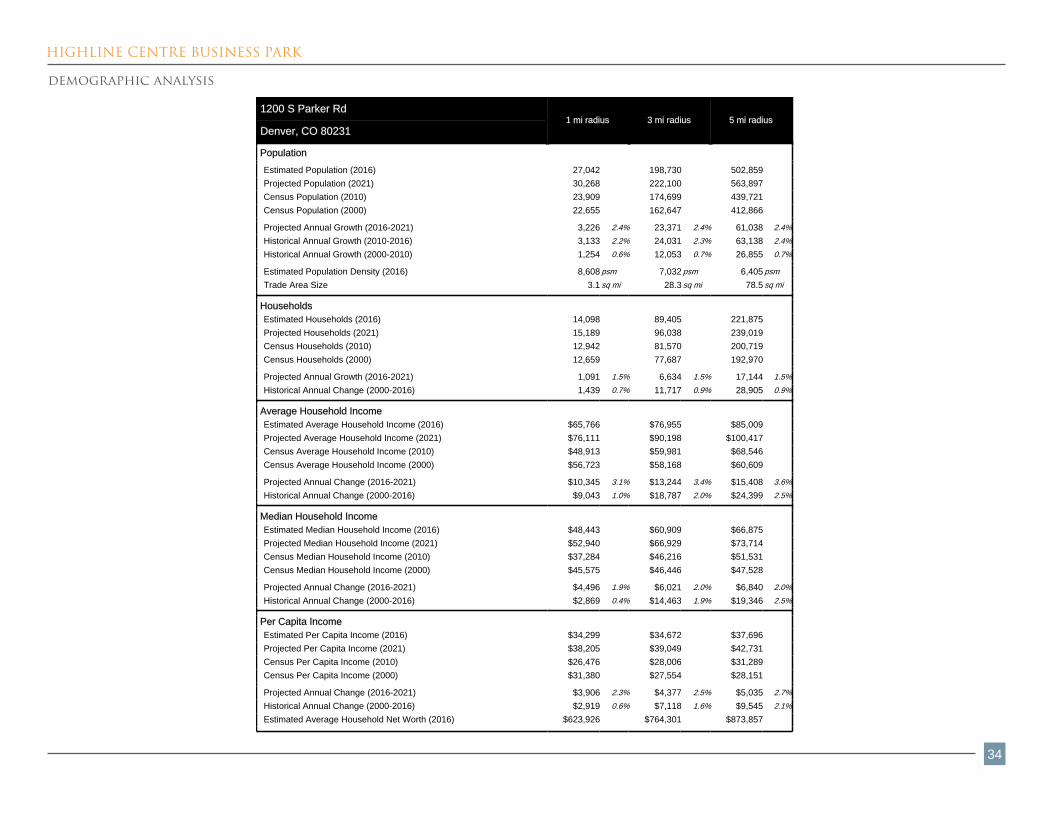
demographic analysis
Demographic Source: Applied Geographic Solutions 10/2016, TIGER Geography page 1 of 9©2017, Sites USA, Chandler, Arizona, 480-491-1112
Thi
s re
port
was
pro
duce
d us
ing
data
from
priv
ate
and
gove
rnm
ent s
ourc
es d
eem
ed to
be
relia
ble.
The
info
rmat
ion
here
in is
pro
vide
d w
ithou
t rep
rese
ntat
ion
or w
arra
nty.
COMPLETE PROFILE2000-2010 Census, 2016 Estimates with 2021 ProjectionsCalculated using Weighted Block Centroid from Block Groups
Lat/Lon: 39.6951/-104.8952RFULL9
1200 S Parker Rd1 mi radius 3 mi radius 5 mi radius
Denver, CO 80231
Population
Estimated Population (2016) 27,042 198,730 502,859Projected Population (2021) 30,268 222,100 563,897Census Population (2010) 23,909 174,699 439,721Census Population (2000) 22,655 162,647 412,866
Projected Annual Growth (2016-2021) 3,226 2.4% 23,371 2.4% 61,038 2.4%Historical Annual Growth (2010-2016) 3,133 2.2% 24,031 2.3% 63,138 2.4%Historical Annual Growth (2000-2010) 1,254 0.6% 12,053 0.7% 26,855 0.7%
Estimated Population Density (2016) 8,608 psm 7,032 psm 6,405 psmTrade Area Size 3.1 sq mi 28.3 sq mi 78.5 sq mi
HouseholdsEstimated Households (2016) 14,098 89,405 221,875Projected Households (2021) 15,189 96,038 239,019Census Households (2010) 12,942 81,570 200,719Census Households (2000) 12,659 77,687 192,970
Projected Annual Growth (2016-2021) 1,091 1.5% 6,634 1.5% 17,144 1.5%Historical Annual Change (2000-2016) 1,439 0.7% 11,717 0.9% 28,905 0.9%
Average Household IncomeEstimated Average Household Income (2016) $65,766 $76,955 $85,009Projected Average Household Income (2021) $76,111 $90,198 $100,417Census Average Household Income (2010) $48,913 $59,981 $68,546Census Average Household Income (2000) $56,723 $58,168 $60,609
Projected Annual Change (2016-2021) $10,345 3.1% $13,244 3.4% $15,408 3.6%Historical Annual Change (2000-2016) $9,043 1.0% $18,787 2.0% $24,399 2.5%
Median Household IncomeEstimated Median Household Income (2016) $48,443 $60,909 $66,875Projected Median Household Income (2021) $52,940 $66,929 $73,714Census Median Household Income (2010) $37,284 $46,216 $51,531Census Median Household Income (2000) $45,575 $46,446 $47,528
Projected Annual Change (2016-2021) $4,496 1.9% $6,021 2.0% $6,840 2.0%Historical Annual Change (2000-2016) $2,869 0.4% $14,463 1.9% $19,346 2.5%
Per Capita IncomeEstimated Per Capita Income (2016) $34,299 $34,672 $37,696Projected Per Capita Income (2021) $38,205 $39,049 $42,731Census Per Capita Income (2010) $26,476 $28,006 $31,289Census Per Capita Income (2000) $31,380 $27,554 $28,151
Projected Annual Change (2016-2021) $3,906 2.3% $4,377 2.5% $5,035 2.7%Historical Annual Change (2000-2016) $2,919 0.6% $7,118 1.6% $9,545 2.1%Estimated Average Household Net Worth (2016) $623,926 $764,301 $873,857

HIGHLINE CENTRE BUSINESS PARK
35
demographic analysis
Demographic Source: Applied Geographic Solutions 10/2016, TIGER Geography page 2 of 9©2017, Sites USA, Chandler, Arizona, 480-491-1112
Thi
s re
port
was
pro
duce
d us
ing
data
from
priv
ate
and
gove
rnm
ent s
ourc
es d
eem
ed to
be
relia
ble.
The
info
rmat
ion
here
in is
pro
vide
d w
ithou
t rep
rese
ntat
ion
or w
arra
nty.
COMPLETE PROFILE2000-2010 Census, 2016 Estimates with 2021 ProjectionsCalculated using Weighted Block Centroid from Block Groups
Lat/Lon: 39.6951/-104.8952RFULL9
1200 S Parker Rd1 mi radius 3 mi radius 5 mi radius
Denver, CO 80231
Race and Ethnicity Total Population (2016) 27,042 198,730 502,859White (2016) 17,264 63.8% 129,352 65.1% 342,261 68.1%
Black or African American (2016) 5,311 19.6% 30,956 15.6% 68,449 13.6%
American Indian or Alaska Native (2016) 161 0.6% 1,475 0.7% 3,813 0.8%
Asian (2016) 2,016 7.5% 11,053 5.6% 24,000 4.8%
Hawaiian or Pacific Islander (2016) 23 0.1% 226 0.1% 691 0.1%
Other Race (2016) 1,200 4.4% 16,876 8.5% 42,726 8.5%
Two or More Races (2016) 1,067 3.9% 8,792 4.4% 20,919 4.2%
Population < 18 (2016) 4,356 16.1% 40,334 20.3% 101,521 20.2%
White Not Hispanic 1,484 34.1% 14,807 36.7% 40,169 39.6%
Black or African American 1,268 29.1% 7,552 18.7% 16,166 15.9%
Asian 382 8.8% 2,189 5.4% 4,647 4.6%
Other Race Not Hispanic 315 7.2% 2,561 6.4% 6,106 6.0%
Hispanic 906 20.8% 13,225 32.8% 34,433 33.9%
Not Hispanic or Latino Population (2016) 23,671 87.5% 157,486 79.2% 395,117 78.6%
Not Hispanic White 15,484 65.4% 109,687 69.6% 289,387 73.2%
Not Hispanic Black or African American 5,183 21.9% 29,699 18.9% 65,078 16.5%
Not Hispanic American Indian or Alaska Native 95 0.4% 812 0.5% 1,984 0.5%
Not Hispanic Asian 1,986 8.4% 10,752 6.8% 23,277 5.9%
Not Hispanic Hawaiian or Pacific Islander 23 0.1% 198 0.1% 606 0.2%
Not Hispanic Other Race 128 0.5% 791 0.5% 1,528 0.4%
Not Hispanic Two or More Races 773 3.3% 5,549 3.5% 13,256 3.4%
Hispanic or Latino Population (2016) 3,371 12.5% 41,243 20.8% 107,742 21.4%
Hispanic White 1,781 52.8% 19,665 47.7% 52,874 49.1%
Hispanic Black or African American 128 3.8% 1,257 3.0% 3,371 3.1%
Hispanic American Indian or Alaska Native 66 2.0% 663 1.6% 1,829 1.7%
Hispanic Asian 30 0.9% 302 0.7% 723 0.7%
Hispanic Hawaiian or Pacific Islander - - 28 0.1% 85 0.1%
Hispanic Other Race 1,072 31.8% 16,086 39.0% 41,198 38.2%
Hispanic Two or More Races 294 8.7% 3,243 7.9% 7,662 7.1%
Not Hispanic or Latino Population (2010) 20,757 86.8% 138,625 79.4% 346,414 78.8%
Hispanic or Latino Population (2010) 3,152 13.2% 36,074 20.6% 93,307 21.2%
Not Hispanic or Latino Population (2000) 20,594 90.9% 138,312 85.0% 346,313 83.9%
Hispanic or Latino Population (2000) 2,061 9.1% 24,334 15.0% 66,553 16.1%
Not Hispanic or Latino Population (2021) 26,249 86.7% 173,429 78.1% 436,796 77.5%
Hispanic or Latino Population (2021) 4,019 13.3% 48,672 21.9% 127,101 22.5%
Projected Annual Growth (2016-2021) 648 3.8% 7,428 3.6% 19,359 3.6%
Historical Annual Growth (2000-2010) 1,090 5.3% 11,740 4.8% 26,754 4.0%

HIGHLINE CENTRE BUSINESS PARK
36
demographic analysis
Demographic Source: Applied Geographic Solutions 10/2016, TIGER Geography page 3 of 9©2017, Sites USA, Chandler, Arizona, 480-491-1112
Thi
s re
port
was
pro
duce
d us
ing
data
from
priv
ate
and
gove
rnm
ent s
ourc
es d
eem
ed to
be
relia
ble.
The
info
rmat
ion
here
in is
pro
vide
d w
ithou
t rep
rese
ntat
ion
or w
arra
nty.
COMPLETE PROFILE2000-2010 Census, 2016 Estimates with 2021 ProjectionsCalculated using Weighted Block Centroid from Block Groups
Lat/Lon: 39.6951/-104.8952RFULL9
1200 S Parker Rd1 mi radius 3 mi radius 5 mi radius
Denver, CO 80231
Total Age Distribution (2016)Total Population 27,042 198,730 502,859
Age Under 5 Years 1,592 5.9% 12,894 6.5% 33,193 6.6%Age 5 to 9 Years 1,239 4.6% 11,944 6.0% 29,929 6.0%Age 10 to 14 Years 1,022 3.8% 10,482 5.3% 25,800 5.1%Age 15 to 19 Years 881 3.3% 8,959 4.5% 23,802 4.7%Age 20 to 24 Years 1,840 6.8% 13,254 6.7% 32,650 6.5%Age 25 to 29 Years 3,089 11.4% 18,758 9.4% 48,665 9.7%Age 30 to 34 Years 2,809 10.4% 18,457 9.3% 49,693 9.9%Age 35 to 39 Years 2,075 7.7% 15,587 7.8% 41,756 8.3%Age 40 to 44 Years 1,728 6.4% 13,590 6.8% 35,465 7.1%Age 45 to 49 Years 1,508 5.6% 11,982 6.0% 30,426 6.1%Age 50 to 54 Years 1,506 5.6% 11,358 5.7% 28,582 5.7%Age 55 to 59 Years 1,553 5.7% 11,524 5.8% 28,522 5.7%Age 60 to 64 Years 1,582 5.8% 11,002 5.5% 27,625 5.5%Age 65 to 69 Years 1,413 5.2% 9,324 4.7% 22,750 4.5%Age 70 to 74 Years 1,118 4.1% 6,838 3.4% 15,531 3.1%Age 75 to 79 Years 742 2.7% 4,570 2.3% 10,366 2.1%Age 80 to 84 Years 604 2.2% 3,526 1.8% 7,896 1.6%Age 85 Years or Over 742 2.7% 4,682 2.4% 10,208 2.0%
Median Age 38.3 36.6 36.0Age 19 Years or Less 4,734 17.5% 44,279 22.3% 112,724 22.4%Age 20 to 64 Years 17,689 65.4% 125,512 63.2% 323,385 64.3%Age 65 Years or Over 4,619 17.1% 28,939 14.6% 66,750 13.3%
Female Age Distribution (2016)Female Population 14,617 54.1% 102,677 51.7% 255,545 50.8%
Age Under 5 Years 804 5.5% 6,334 6.2% 16,101 6.3%Age 5 to 9 Years 640 4.4% 5,894 5.7% 14,711 5.8%Age 10 to 14 Years 538 3.7% 5,247 5.1% 12,730 5.0%Age 15 to 19 Years 462 3.2% 4,493 4.4% 11,927 4.7%Age 20 to 24 Years 1,023 7.0% 6,865 6.7% 16,671 6.5%Age 25 to 29 Years 1,620 11.1% 9,567 9.3% 24,604 9.6%Age 30 to 34 Years 1,414 9.7% 9,173 8.9% 24,455 9.6%Age 35 to 39 Years 963 6.6% 7,418 7.2% 19,761 7.7%Age 40 to 44 Years 838 5.7% 6,588 6.4% 16,878 6.6%Age 45 to 49 Years 793 5.4% 5,901 5.7% 14,763 5.8%Age 50 to 54 Years 817 5.6% 5,971 5.8% 14,654 5.7%Age 55 to 59 Years 901 6.2% 5,984 5.8% 14,654 5.7%Age 60 to 64 Years 911 6.2% 6,002 5.8% 14,615 5.7%Age 65 to 69 Years 830 5.7% 5,228 5.1% 12,569 4.9%Age 70 to 74 Years 689 4.7% 3,930 3.8% 8,737 3.4%Age 75 to 79 Years 453 3.1% 2,706 2.6% 6,000 2.3%Age 80 to 84 Years 404 2.8% 2,206 2.1% 4,879 1.9%Age 85 Years or Over 516 3.5% 3,171 3.1% 6,838 2.7%
Female Median Age 39.8 37.8 37.0Age 19 Years or Less 2,444 16.7% 21,969 21.4% 55,468 21.7%Age 20 to 64 Years 9,281 63.5% 63,468 61.8% 161,054 63.0%Age 65 Years or Over 2,892 19.8% 17,240 16.8% 39,022 15.3%

HIGHLINE CENTRE BUSINESS PARK
37
demographic analysis
Demographic Source: Applied Geographic Solutions 10/2016, TIGER Geography page 4 of 9©2017, Sites USA, Chandler, Arizona, 480-491-1112
Thi
s re
port
was
pro
duce
d us
ing
data
from
priv
ate
and
gove
rnm
ent s
ourc
es d
eem
ed to
be
relia
ble.
The
info
rmat
ion
here
in is
pro
vide
d w
ithou
t rep
rese
ntat
ion
or w
arra
nty.
COMPLETE PROFILE2000-2010 Census, 2016 Estimates with 2021 ProjectionsCalculated using Weighted Block Centroid from Block Groups
Lat/Lon: 39.6951/-104.8952RFULL9
1200 S Parker Rd1 mi radius 3 mi radius 5 mi radius
Denver, CO 80231
Male Age Distribution (2016)Male Population 12,425 45.9% 96,053 48.3% 247,314 49.2%
Age Under 5 Years 788 6.3% 6,560 6.8% 17,092 6.9%Age 5 to 9 Years 599 4.8% 6,049 6.3% 15,218 6.2%Age 10 to 14 Years 484 3.9% 5,234 5.4% 13,071 5.3%Age 15 to 19 Years 419 3.4% 4,467 4.7% 11,875 4.8%Age 20 to 24 Years 817 6.6% 6,388 6.7% 15,980 6.5%Age 25 to 29 Years 1,468 11.8% 9,191 9.6% 24,062 9.7%Age 30 to 34 Years 1,396 11.2% 9,284 9.7% 25,238 10.2%Age 35 to 39 Years 1,111 8.9% 8,169 8.5% 21,995 8.9%Age 40 to 44 Years 890 7.2% 7,002 7.3% 18,587 7.5%Age 45 to 49 Years 714 5.7% 6,082 6.3% 15,663 6.3%Age 50 to 54 Years 689 5.5% 5,387 5.6% 13,928 5.6%Age 55 to 59 Years 653 5.3% 5,540 5.8% 13,868 5.6%Age 60 to 64 Years 671 5.4% 5,000 5.2% 13,010 5.3%Age 65 to 69 Years 583 4.7% 4,095 4.3% 10,181 4.1%Age 70 to 74 Years 429 3.5% 2,908 3.0% 6,794 2.7%Age 75 to 79 Years 290 2.3% 1,864 1.9% 4,366 1.8%Age 80 to 84 Years 200 1.6% 1,320 1.4% 3,017 1.2%Age 85 Years or Over 226 1.8% 1,511 1.6% 3,370 1.4%
Male Median Age 36.7 35.5 35.1Age 19 Years or Less 2,289 18.4% 22,310 23.2% 57,256 23.2%Age 20 to 64 Years 8,408 67.7% 62,044 64.6% 162,331 65.6%Age 65 Years or Over 1,727 13.9% 11,699 12.2% 27,727 11.2%
Males per 100 Females (2016)Overall Comparison 85 94 97
Age Under 5 Years 98 49.5% 104 50.9% 106 51.5%Age 5 to 9 Years 94 48.3% 103 50.6% 103 50.8%Age 10 to 14 Years 90 47.4% 100 49.9% 103 50.7%Age 15 to 19 Years 91 47.5% 99 49.9% 100 49.9%Age 20 to 24 Years 80 44.4% 93 48.2% 96 48.9%Age 25 to 29 Years 91 47.5% 96 49.0% 98 49.4%Age 30 to 34 Years 99 49.7% 101 50.3% 103 50.8%Age 35 to 39 Years 115 53.6% 110 52.4% 111 52.7%Age 40 to 44 Years 106 51.5% 106 51.5% 110 52.4%Age 45 to 49 Years 90 47.4% 103 50.8% 106 51.5%Age 50 to 54 Years 84 45.7% 90 47.4% 95 48.7%Age 55 to 59 Years 72 42.0% 93 48.1% 95 48.6%Age 60 to 64 Years 74 42.4% 83 45.4% 89 47.1%Age 65 to 69 Years 70 41.2% 78 43.9% 81 44.8%Age 70 to 74 Years 62 38.4% 74 42.5% 78 43.7%Age 75 to 79 Years 64 39.0% 69 40.8% 73 42.1%Age 80 to 84 Years 49 33.1% 60 37.4% 62 38.2%Age 85 Years or Over 44 30.4% 48 32.3% 49 33.0%
Age 19 Years or Less 94 48.4% 102 50.4% 103 50.8%Age 20 to 39 Years 95 48.8% 100 50.0% 102 50.5%Age 40 to 64 Years 85 45.9% 95 48.8% 99 49.8%Age 65 Years or Over 60 37.4% 68 40.4% 71 41.5%

HIGHLINE CENTRE BUSINESS PARK
38
demographic analysis
Demographic Source: Applied Geographic Solutions 10/2016, TIGER Geography page 5 of 9©2017, Sites USA, Chandler, Arizona, 480-491-1112
Thi
s re
port
was
pro
duce
d us
ing
data
from
priv
ate
and
gove
rnm
ent s
ourc
es d
eem
ed to
be
relia
ble.
The
info
rmat
ion
here
in is
pro
vide
d w
ithou
t rep
rese
ntat
ion
or w
arra
nty.
COMPLETE PROFILE2000-2010 Census, 2016 Estimates with 2021 ProjectionsCalculated using Weighted Block Centroid from Block Groups
Lat/Lon: 39.6951/-104.8952RFULL9
1200 S Parker Rd1 mi radius 3 mi radius 5 mi radius
Denver, CO 80231
Household Type (2016)Total Households 14,098 89,405 221,875Households with Children 2,728 19.4% 22,289 24.9% 54,919 24.8%Average Household Size 1.9 2.2 2.2Household Density per Square Mile 4,488 3,164 2,826
Population Family 17,123 63.3% 141,911 71.4% 352,220 70.0%Population Non-Family 9,868 36.5% 55,216 27.8% 141,332 28.1%Population Group Quarters 51 0.2% 1,603 0.8% 9,307 1.9%
Family Households 6,076 43.1% 45,421 50.8% 111,397 50.2%Married Couple Households 3,863 63.6% 30,653 67.5% 77,282 69.4%Other Family Households 2,213 36.4% 14,768 32.5% 34,115 30.6%
Family Households with Children 2,694 44.3% 22,074 48.6% 54,431 48.9%Married Couple with Children 1,405 52.2% 13,108 59.4% 33,667 61.9%Other Family Households with Children 1,289 47.8% 8,967 40.6% 20,764 38.1%
Family Households No Children 3,382 55.7% 23,347 51.4% 56,966 51.1%Married Couple No Children 2,458 72.7% 17,545 75.1% 43,615 76.6%Other Family Households No Children 924 27.3% 5,802 24.9% 13,351 23.4%
Non-Family Households 8,022 56.9% 43,984 49.2% 110,477 49.8%Non-Family Households with Children 34 0.4% 215 0.5% 488 0.4%Non-Family Households No Children 7,988 99.6% 43,769 99.5% 109,990 99.6%
Average Family Household Size 2.8 3.1 3.2Average Family Income $80,582 $96,881 $110,935Median Family Income $61,017 $80,403 $92,359Average Non-Family Household Size 1.2 1.3 1.3
Marital Status (2016)Population Age 15 Years or Over 23,189 163,410 413,936Never Married 9,598 41.4% 62,673 38.4% 161,999 39.1%Currently Married 8,178 35.3% 61,929 37.9% 156,518 37.8%Previously Married 5,414 23.3% 38,808 23.7% 95,419 23.1%
Separated 817 15.1% 8,436 21.7% 22,301 23.4%Widowed 1,730 32.0% 10,335 26.6% 22,304 23.4%Divorced 2,867 53.0% 20,037 51.6% 50,814 53.3%
Educational Attainment (2016)Adult Population Age 25 Years or Over 20,468 141,197 357,484Elementary (Grade Level 0 to 8) 834 4.1% 6,806 4.8% 18,296 5.1%Some High School (Grade Level 9 to 11) 705 3.4% 6,739 4.8% 17,780 5.0%High School Graduate 3,924 19.2% 27,966 19.8% 63,577 17.8%Some College 4,049 19.8% 28,488 20.2% 67,804 19.0%Associate Degree Only 1,141 5.6% 8,563 6.1% 20,547 5.7%Bachelor Degree Only 6,134 30.0% 37,766 26.7% 99,907 27.9%Graduate Degree 3,680 18.0% 24,869 17.6% 69,573 19.5%
Any College (Some College or Higher) 15,005 73.3% 99,686 70.6% 257,831 72.1%College Degree + (Bachelor Degree or Higher) 9,814 47.9% 62,635 44.4% 169,480 47.4%

HIGHLINE CENTRE BUSINESS PARK
39
demographic analysis
Demographic Source: Applied Geographic Solutions 10/2016, TIGER Geography page 6 of 9©2017, Sites USA, Chandler, Arizona, 480-491-1112
Thi
s re
port
was
pro
duce
d us
ing
data
from
priv
ate
and
gove
rnm
ent s
ourc
es d
eem
ed to
be
relia
ble.
The
info
rmat
ion
here
in is
pro
vide
d w
ithou
t rep
rese
ntat
ion
or w
arra
nty.
COMPLETE PROFILE2000-2010 Census, 2016 Estimates with 2021 ProjectionsCalculated using Weighted Block Centroid from Block Groups
Lat/Lon: 39.6951/-104.8952RFULL9
1200 S Parker Rd1 mi radius 3 mi radius 5 mi radius
Denver, CO 80231
HousingTotal Housing Units (2016) 14,456 91,654 228,376Total Housing Units (2010) 13,983 88,148 217,954Historical Annual Growth (2010-2016) 473 0.6% 3,506 0.7% 10,422 0.8%Housing Units Occupied (2016) 14,098 97.5% 89,405 97.5% 221,875 97.2%
Housing Units Owner-Occupied 5,831 41.4% 40,708 45.5% 106,885 48.2%Housing Units Renter-Occupied 8,267 58.6% 48,697 54.5% 114,990 51.8%
Housing Units Vacant (2016) 357 2.5% 2,250 2.5% 6,501 2.9%
Household Size (2016)Total Households 14,098 89,405 221,8751 Person Households 6,353 45.1% 34,501 38.6% 85,235 38.4%2 Person Households 4,735 33.6% 28,464 31.8% 70,164 31.6%3 Person Households 1,637 11.6% 11,579 13.0% 28,582 12.9%4 Person Households 898 6.4% 8,396 9.4% 21,214 9.6%5 Person Households 319 2.3% 3,806 4.3% 9,568 4.3%6 Person Households 105 0.7% 1,538 1.7% 3,911 1.8%7 or More Person Households 52 0.4% 1,120 1.3% 3,200 1.4%
Household Income Distribution (2016)HH Income $200,000 or More 787 5.6% 6,314 7.1% 19,576 8.8%HH Income $150,000 to $199,999 456 3.2% 4,355 4.9% 12,585 5.7%HH Income $125,000 to $149,999 490 3.5% 4,260 4.8% 11,120 5.0%HH Income $100,000 to $124,999 875 6.2% 5,880 6.6% 15,793 7.1%HH Income $75,000 to $99,999 1,424 10.1% 9,947 11.1% 24,722 11.1%HH Income $50,000 to $74,999 2,549 18.1% 15,668 17.5% 38,858 17.5%HH Income $35,000 to $49,999 2,068 14.7% 12,980 14.5% 30,083 13.6%HH Income $25,000 to $34,999 1,732 12.3% 10,118 11.3% 22,853 10.3%HH Income $15,000 to $24,999 1,385 9.8% 9,042 10.1% 20,181 9.1%HH Income $10,000 to $14,999 832 5.9% 4,112 4.6% 9,745 4.4%HH Income Under $10,000 1,501 10.6% 6,731 7.5% 16,358 7.4%
Household Vehicles (2016)Households 0 Vehicles Available 1,437 10.2% 8,503 9.5% 20,515 9.2%Households 1 Vehicle Available 7,507 53.2% 39,778 44.5% 94,975 42.8%Households 2 Vehicles Available 4,174 29.6% 30,868 34.5% 79,150 35.7%Households 3 or More Vehicles Available 980 7.0% 10,256 11.5% 27,236 12.3%
Total Vehicles Available 19,098 135,633 344,527Average Vehicles per Household 1.4 1.5 1.6
Owner-Occupied Household Vehicles 8,863 46.4% 73,384 54.1% 194,808 56.5%Average Vehicles per Owner-Occupied Household 1.5 1.8 1.8Renter-Occupied Household Vehicles 10,235 53.6% 62,249 45.9% 149,718 43.5%Average Vehicles per Renter-Occupied Household 1.2 1.3 1.3
Travel Time (2010)Worker Base Age 16 years or Over 11,900 86,168 218,430Travel to Work in 14 Minutes or Less 1,324 11.1% 14,909 17.3% 43,445 19.9%Travel to Work in 15 to 29 Minutes 5,419 45.5% 38,027 44.1% 92,151 42.2%Travel to Work in 30 to 59 Minutes 4,493 37.8% 25,816 30.0% 60,580 27.7%Travel to Work in 60 Minutes or More 218 1.8% 3,042 3.5% 9,263 4.2%Work at Home 446 3.7% 4,374 5.1% 12,992 5.9%
Average Minutes Travel to Work 26.9 24.0 22.9

HIGHLINE CENTRE BUSINESS PARK
40
demographic analysis
Demographic Source: Applied Geographic Solutions 10/2016, TIGER Geography page 7 of 9©2017, Sites USA, Chandler, Arizona, 480-491-1112
Thi
s re
port
was
pro
duce
d us
ing
data
from
priv
ate
and
gove
rnm
ent s
ourc
es d
eem
ed to
be
relia
ble.
The
info
rmat
ion
here
in is
pro
vide
d w
ithou
t rep
rese
ntat
ion
or w
arra
nty.
COMPLETE PROFILE2000-2010 Census, 2016 Estimates with 2021 ProjectionsCalculated using Weighted Block Centroid from Block Groups
Lat/Lon: 39.6951/-104.8952RFULL9
1200 S Parker Rd1 mi radius 3 mi radius 5 mi radius
Denver, CO 80231
Transportation To Work (2010)Worker Base Age 16 years or Over 11,900 86,168 218,430Drive to Work Alone 9,782 82.2% 67,120 77.9% 161,827 74.1%Drive to Work in Carpool 765 6.4% 6,538 7.6% 18,584 8.5%Travel to Work by Public Transportation 655 5.5% 4,863 5.6% 13,951 6.4%Drive to Work on Motorcycle 2 - 187 0.2% 425 0.2%Bicycle to Work 45 0.4% 703 0.8% 2,740 1.3%Walk to Work 72 0.6% 1,729 2.0% 6,533 3.0%Other Means 132 1.1% 653 0.8% 1,377 0.6%Work at Home 446 3.7% 4,374 5.1% 12,992 5.9%
Daytime Demographics (2016)Total Businesses 836 10,136 26,564Total Employees 5,004 90,704 250,771Company Headquarter Businesses - - 76 0.7% 183 0.7%Company Headquarter Employees 7 0.1% 7,081 7.8% 15,141 6.0%
Employee Population per Business 6.0 to 1 8.9 to 1 9.4 to 1Residential Population per Business 32.3 to 1 19.6 to 1 18.9 to 1Adj. Daytime Demographics Age 16 Years or Over 12,507 141,358 379,539
Labor ForceLabor Population Age 16 Years or Over (2016) 23,033 161,823 409,957
Labor Force Total Males (2016) 10,478 45.5% 77,406 47.8% 199,920 48.8%Male Civilian Employed 7,733 73.8% 57,731 74.6% 148,625 74.3%Male Civilian Unemployed 198 1.9% 1,632 2.1% 4,247 2.1%Males in Armed Forces - - 60 0.1% 181 0.1%Males Not in Labor Force 2,546 24.3% 17,983 23.2% 46,867 23.4%
Labor Force Total Females (2016) 12,555 54.5% 84,417 52.2% 210,037 51.2%Female Civilian Employed 7,798 62.1% 53,359 63.2% 132,316 63.0%Female Civilian Unemployed 139 1.1% 1,457 1.7% 3,541 1.7%Females in Armed Forces - - 18 - 66 - Females Not in Labor Force 4,618 36.8% 29,582 35.0% 74,114 35.3%
Unemployment Rate 10,478 1.5% 77,406 1.9% 199,920 1.9%
Labor Force Growth (2010-2016) 3,604 30.2% 23,956 27.5% 59,061 26.6%Male Labor Force Growth (2010-2016) 1,929 33.2% 12,790 28.5% 32,992 28.5%Female Labor Force Growth (2010-2016) 1,675 27.4% 11,166 26.5% 26,069 24.5%
Occupation (2010)Occupation Population Age 16 Years or Over 11,927 87,134 221,879
Occupation Total Males 5,804 48.7% 44,941 51.6% 115,633 52.1%Occupation Total Females 6,123 51.3% 42,193 48.4% 106,247 47.9%
Management, Business, Financial Operations 1,898 15.9% 13,699 15.7% 38,685 17.4%Professional, Related 3,432 28.8% 21,214 24.3% 55,437 25.0%Service 1,805 15.1% 16,590 19.0% 39,652 17.9%Sales, Office 3,356 28.1% 22,667 26.0% 54,757 24.7%Farming, Fishing, Forestry 5 - 97 0.1% 337 0.2%Construction, Extraction, Maintenance 652 5.5% 6,374 7.3% 16,109 7.3%Production, Transport, Material Moving 778 6.5% 6,494 7.5% 16,903 7.6%
White Collar Workers 8,687 72.8% 57,579 66.1% 148,879 67.1%Blue Collar Workers 3,240 27.2% 29,554 33.9% 73,000 32.9%

HIGHLINE CENTRE BUSINESS PARK
41
demographic analysis
Demographic Source: Applied Geographic Solutions 10/2016, TIGER Geography page 8 of 9©2017, Sites USA, Chandler, Arizona, 480-491-1112
Thi
s re
port
was
pro
duce
d us
ing
data
from
priv
ate
and
gove
rnm
ent s
ourc
es d
eem
ed to
be
relia
ble.
The
info
rmat
ion
here
in is
pro
vide
d w
ithou
t rep
rese
ntat
ion
or w
arra
nty.
COMPLETE PROFILE2000-2010 Census, 2016 Estimates with 2021 ProjectionsCalculated using Weighted Block Centroid from Block Groups
Lat/Lon: 39.6951/-104.8952RFULL9
1200 S Parker Rd1 mi radius 3 mi radius 5 mi radius
Denver, CO 80231
Units In Structure (2010)Total Units 12,942 81,570 200,719
1 Detached Unit 2,106 16.3% 29,805 36.5% 84,097 41.9%1 Attached Unit 1,787 13.8% 7,546 9.3% 18,683 9.3%2 Units 86 0.7% 845 1.0% 3,725 1.9%3 to 4 Units 935 7.2% 3,760 4.6% 8,735 4.4%5 to 9 Units 2,002 15.5% 6,676 8.2% 14,396 7.2%10 to 19 Units 2,608 20.2% 11,906 14.6% 24,605 12.3%20 to 49 Units 1,977 15.3% 10,482 12.8% 22,222 11.1%50 or More Units 1,293 10.0% 9,818 12.0% 22,279 11.1%Mobile Home or Trailer 75 0.6% 642 0.8% 1,870 0.9%Other Structure 73 0.6% 92 0.1% 105 0.1%
Homes Built By Year (2010)Homes Built 2005 or later 554 4.3% 3,447 4.2% 10,631 5.3%Homes Built 2000 to 2004 772 6.0% 5,749 7.0% 12,940 6.4%Homes Built 1990 to 1999 1,989 15.4% 8,520 10.4% 18,379 9.2%Homes Built 1980 to 1989 2,861 22.1% 13,011 16.0% 27,664 13.8%Homes Built 1970 to 1979 3,779 29.2% 22,376 27.4% 46,842 23.3%Homes Built 1960 to 1969 1,716 13.3% 12,690 15.6% 27,371 13.6%Homes Built 1950 to 1959 752 5.8% 9,432 11.6% 24,080 12.0%Homes Built 1940 to 1949 163 1.3% 2,900 3.6% 9,635 4.8%Homes Built Before 1939 356 2.8% 3,445 4.2% 23,175 11.5%
Median Age of Homes 35.4 yrs 39.3 yrs 42.8 yrs
Home Values (2010)Owner Specified Housing Units 5,357 37,561 98,035
Home Values $1,000,000 or More 24 0.5% 789 2.1% 3,133 3.2%Home Values $750,000 to $999,999 30 0.6% 995 2.6% 2,938 3.0%Home Values $500,000 to $749,999 166 3.1% 2,475 6.6% 8,508 8.7%Home Values $400,000 to $499,999 289 5.4% 2,321 6.2% 7,967 8.1%Home Values $300,000 to $399,999 401 7.5% 4,929 13.1% 14,174 14.5%Home Values $250,000 to $299,999 546 10.2% 4,763 12.7% 10,673 10.9%Home Values $200,000 to $249,999 471 8.8% 5,941 15.8% 13,408 13.7%Home Values $175,000 to $199,999 454 8.5% 2,755 7.3% 7,200 7.3%Home Values $150,000 to $174,999 666 12.4% 2,960 7.9% 8,068 8.2%Home Values $125,000 to $149,999 817 15.2% 3,099 8.3% 7,199 7.3%Home Values $100,000 to $124,999 668 12.5% 2,701 7.2% 6,180 6.3%Home Values $90,000 to $99,999 200 3.7% 822 2.2% 1,646 1.7%Home Values $80,000 to $89,999 143 2.7% 615 1.6% 1,328 1.4%Home Values $70,000 to $79,999 179 3.3% 638 1.7% 1,202 1.2%Home Values $60,000 to $69,999 63 1.2% 439 1.2% 847 0.9%Home Values $50,000 to $59,999 59 1.1% 252 0.7% 598 0.6%Home Values $35,000 to $49,999 63 1.2% 254 0.7% 671 0.7%Home Values $25,000 to $34,999 58 1.1% 205 0.5% 510 0.5%Home Values $10,000 to $24,999 38 0.7% 437 1.2% 1,325 1.4%Home Values Under $10,000 23 0.4% 172 0.5% 460 0.5%
Owner-Occupied Median Home Value $174,882 $255,453 $288,439Renter-Occupied Median Rent $796 $749 $764

HIGHLINE CENTRE BUSINESS PARK
42
demographic analysis
Demographic Source: Applied Geographic Solutions 10/2016, TIGER Geography page 9 of 9©2017, Sites USA, Chandler, Arizona, 480-491-1112
Thi
s re
port
was
pro
duce
d us
ing
data
from
priv
ate
and
gove
rnm
ent s
ourc
es d
eem
ed to
be
relia
ble.
The
info
rmat
ion
here
in is
pro
vide
d w
ithou
t rep
rese
ntat
ion
or w
arra
nty.
COMPLETE PROFILE2000-2010 Census, 2016 Estimates with 2021 ProjectionsCalculated using Weighted Block Centroid from Block Groups
Lat/Lon: 39.6951/-104.8952RFULL9
1200 S Parker Rd1 mi radius 3 mi radius 5 mi radius
Denver, CO 80231
Total Annual Consumer Expenditure (2016)Total Household Expenditure $740 M $5.18 B $13.8 B
Total Non-Retail Expenditure $399 M $2.81 B $7.48 BTotal Retail Expenditure $341 M $2.37 B $6.28 B
Apparel $25.7 M $181 M $483 MContributions $31.5 M $236 M $647 MEducation $27.0 M $199 M $546 MEntertainment $40.9 M $290 M $773 MFood and Beverages $110 M $756 M $1.99 BFurnishings and Equipment $24.8 M $178 M $477 MGifts $18.0 M $132 M $359 MHealth Care $60.8 M $413 M $1.08 BHousehold Operations $20.4 M $150 M $407 MMiscellaneous Expenses $11.1 M $76.2 M $201 MPersonal Care $9.63 M $67.2 M $178 MPersonal Insurance $5.30 M $39.2 M $107 MReading $1.66 M $11.6 M $30.8 MShelter $152 M $1.07 B $2.85 BTobacco $4.77 M $31.2 M $80.0 MTransportation $139 M $965 M $2.54 BUtilities $57.2 M $388 M $1.02 B
Monthly Household Consumer Expenditure (2016)Total Household Expenditure $4,371 $4,830 $5,170
Total Non-Retail Expenditure $2,358 53.9% $2,620 54.2% $2,811 54.4%Total Retail Expenditures $2,013 46.1% $2,210 45.8% $2,359 45.6%
Apparel $152 3.5% $169 3.5% $181 3.5%Contributions $186 4.3% $220 4.5% $243 4.7%Education $160 3.7% $185 3.8% $205 4.0%Entertainment $242 5.5% $270 5.6% $290 5.6%Food and Beverages $647 14.8% $704 14.6% $748 14.5%Furnishings and Equipment $147 3.4% $166 3.4% $179 3.5%Gifts $107 2.4% $123 2.5% $135 2.6%Health Care $359 8.2% $385 8.0% $406 7.8%Household Operations $121 2.8% $140 2.9% $153 3.0%Miscellaneous Expenses $66 1.5% $71 1.5% $75 1.5%Personal Care $57 1.3% $63 1.3% $67 1.3%Personal Insurance $31 0.7% $37 0.8% $40 0.8%Reading $10 0.2% $11 0.2% $12 0.2%Shelter $901 20.6% $997 20.6% $1,069 20.7%Tobacco $28 0.6% $29 0.6% $30 0.6%Transportation $820 18.8% $899 18.6% $956 18.5%Utilities $338 7.7% $362 7.5% $382 7.4%

HIGHLINE CENTRE BUSINESS PARK
43

HIGHLINE CENTRE BUSINESS PARK
44
HIGHLINE CENTRE 1200, 1210, 1220, 1240, 1250, 1260, 1270 PARKER ROAD | DENVER, COLORADO 80231
FOR LEASING INFORMATION, PLEASE CONTACT:SHARON KAMENMANAGING DIRECTORMILLER FRISHMAN [email protected]