business outlook for asean country 2017 outlook for asean country 2017 ... central bank rates, ......
TRANSCRIPT

Business Outlook forASEAN Country 2017Thailand Insurance Symposium 201619 December 2016Bangkok, Thailand
Clarence WongChief Economist Asia

2
Agenda
• What are our top economic concerns?
• What does this mean to ASEAN?
• What will be the key insurance themes forASEAN countries?

What are our topeconomic concerns?
33

4
Top economic risk map that could impact ASEAN
Chinese hardlanding: Credit risksfrom a significantslowdown in theproperty sector are thegreatest downside risk
Chinese hardlanding: Credit risksfrom a significantslowdown in theproperty sector are thegreatest downside risk
Sharp growthslowdown inadvanced marketsdue to fallout fromBrexit, downside risksin emerging marketsand political conflicts
Sharp growthslowdown inadvanced marketsdue to fallout fromBrexit, downside risksin emerging marketsand political conflicts
Recession in the Euroarea: Risks of policy errors,reform complacency,renewed conflicts in Ukraine,geopolitical risks andslowdown in China
Recession in the Euroarea: Risks of policy errors,reform complacency,renewed conflicts in Ukraine,geopolitical risks andslowdown in China
Emerging marketContagion: risks includeFed normalisation, highexternal debts, lowcommodity prices etc
Emerging marketContagion: risks includeFed normalisation, highexternal debts, lowcommodity prices etc
15%15%
20%20%
20%20%
15%15%
Source: Swiss Re Economic Research & Consulting
Medium-term inflationrisksMedium-term inflationrisks
15%15%
Oil price collapse – astabilising forceOil price collapse – astabilising force
10%10%

Interest rate risk
Note: Updated on 28/09/2016Source: CEIC
Central bank rates, monthly data
5
Ultra-low monetary policy continues in most advancedmarkets
0
2
4
6
8
10
12
14
16
19
90
19
91
19
92
19
93
19
94
19
95
19
96
19
97
19
98
19
99
20
00
20
01
20
02
20
03
20
04
20
05
20
06
20
07
20
08
20
09
20
10
20
11
20
12
20
13
20
14
20
15
20
16
EU United Kingdom United States
• Weak growth anddownside risks arenudging central bankersto keep interest rateslower for longer
• The scale of negativepolicy rates has expanded(Euro Area, Denmark,Japan, Sweden andSwitzerland) to representnearly 25% of global GDP
• Half of the world’ssovereign bonds carrynegative interest rates*
* refers to bonds in the S&P GlobalDeveloped Sovereign Bond Index

6
• The expected recovery in tradehas been slow and unsteady.
• This could reflect changes inthe global value chain, weakerdemand from emerging marketsand low supply of credit.
• Economic growth in recent years hasbeen supported by higher debt, bothfor households and corporations
• Against the backdrop of slowingtrade/economic growth, risinginterest rates, debt servicing willbecome more challenging
• Pace has remained cautious dueto heightened uncertainty overglobal economic outlook.
• Fed tightening will result incapital outflows from Asia andincreased financial volatility.
• China is in the process of goingthrough complex economicadjustments – resulting in slowergrowth.
• Key concerns include policy errors,mis-communication, systemicfinancial risks and conflictingobjectives.
High debt leverageWeak trade activities
Fed lift-off China hard-landing
Strong economic headwinds facing ASEAN
6

ASEAN has maintained ~5% growth since financial crisis…
7
6.1
%
2.7
%
5.1
% 5.6
% 6.6
%
5.6
%
6.1
% 6.6
%
4.7
%
1.8
%
7.9
%
4.9
% 5.9
%
5.0
%
4.5
%
4.5
%
4.5
%
2000 2001 2002 2003 2004 2005 2006 2007 2008 2009 2010 2011 2012 2013 2014 2015 2016
Average real GDP growth rate
5.4% 5.3%
Source: Swiss Re Economic Research & Consulting
Fina
ncia
l Cri
sis
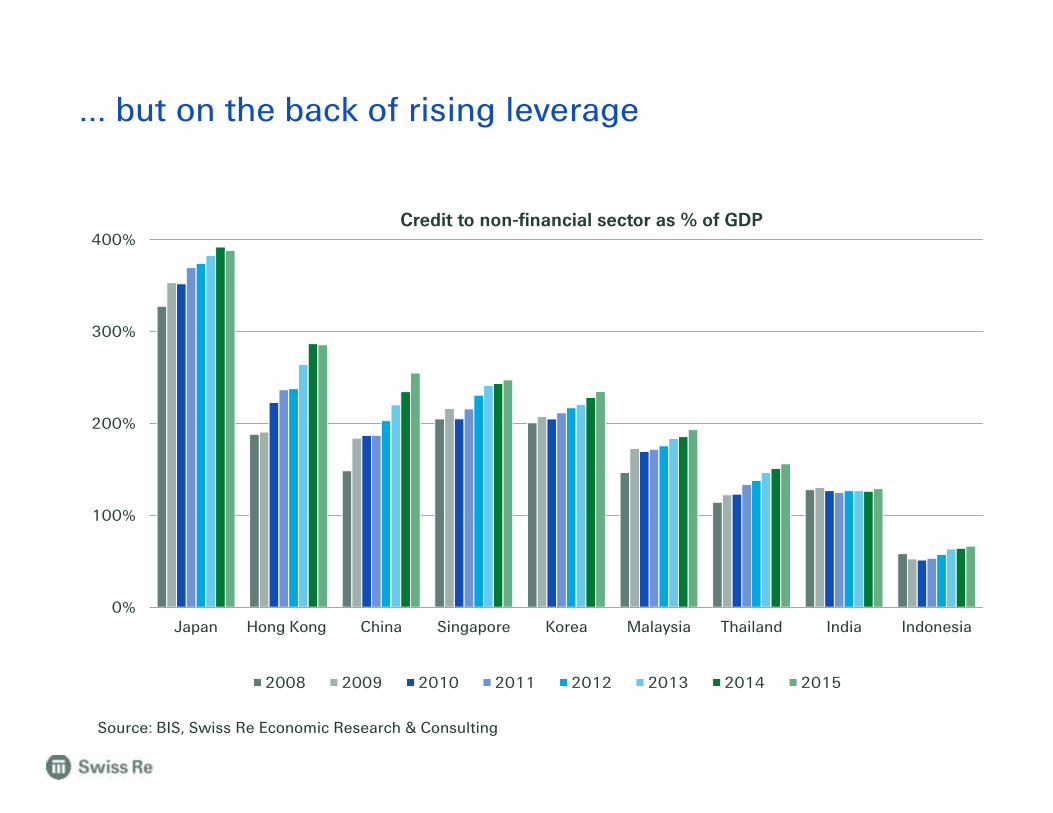
… but on the back of rising leverage
0%
100%
200%
300%
400%
Japan Hong Kong China Singapore Korea Malaysia Thailand India Indonesia
Credit to non-financial sector as % of GDP
2008 2009 2010 2011 2012 2013 2014 2015
Source: BIS, Swiss Re Economic Research & Consulting

Government deficit and leverage have also increasedsince the GFC
9
Source: Oxford Economics, BIS, Swiss Re Economic Research & Consulting
-6%
-4%
-2%
0%
Viet
nam
Mya
nmar
Mal
aysi
a
Indo
nesi
a
Thai
land
Laos
Cam
bodi
a
Phi
lippi
nes
Sing
apor
e
Government deficit as % of GDP
2007 2015
0%
30%
60%
90%
120%
Sing
apor
e
Phi
lippi
nes
Mal
aysi
a
Thai
land
Indo
nesi
a
Government leverage: credit to generalgovernment sector as % of GDP
2007 2015

What does this mean toASEAN?
1010

Interest and coupon payments are rising faster thancorporate and household income
11
Source: Bank for International Settlement
0%
5%
10%
15%
20%
25%
Hong Kong Korea China Japan Malaysia Thailand India Indonesia
Debt service ratios of private non-financial sector
1999 2009 2015

Sensitivity of ASEAN to China – trade channel
12
0
2
4
6
8
10
12
14
16
0
50,000
100,000
150,000
200,000
250,000
300,000
350,000
97 98 99 00 01 02 03 04 05 06 07 08 09 10 11 12 13 14 15
USD million (LHS) Share of total trade (%, RHS)
Note: *includes Indonesia, Malaysia, Philippines, Singapore and ThailandSource: CEIC
ASEAN-5 China trade exposure*

Sensitivity of ASEAN to China – trade and other channels
13
Channels of Spillovers from a Slowdown in China
Note: AUS = Australia; IND = India; IDN = Indonesia, JPN = Japan; KOR = Korea; MYS =Malaysia; NZL = New Zealand; PHL = the Philippines; SGP = Singapore; THA = Thailand;TWN = Taiwan Province of China; VNM = Vietnam.Source: IMF
China has more impact
on ASEAN exports than
the US and EU (except
for the Philippines) – a
1ppt rise in growth in
China will result in 1.5-
2.5 ppt increase in
ASEAN exports …
… but ASEAN is still
relatively less exposed to
China compared to other
Asian countries
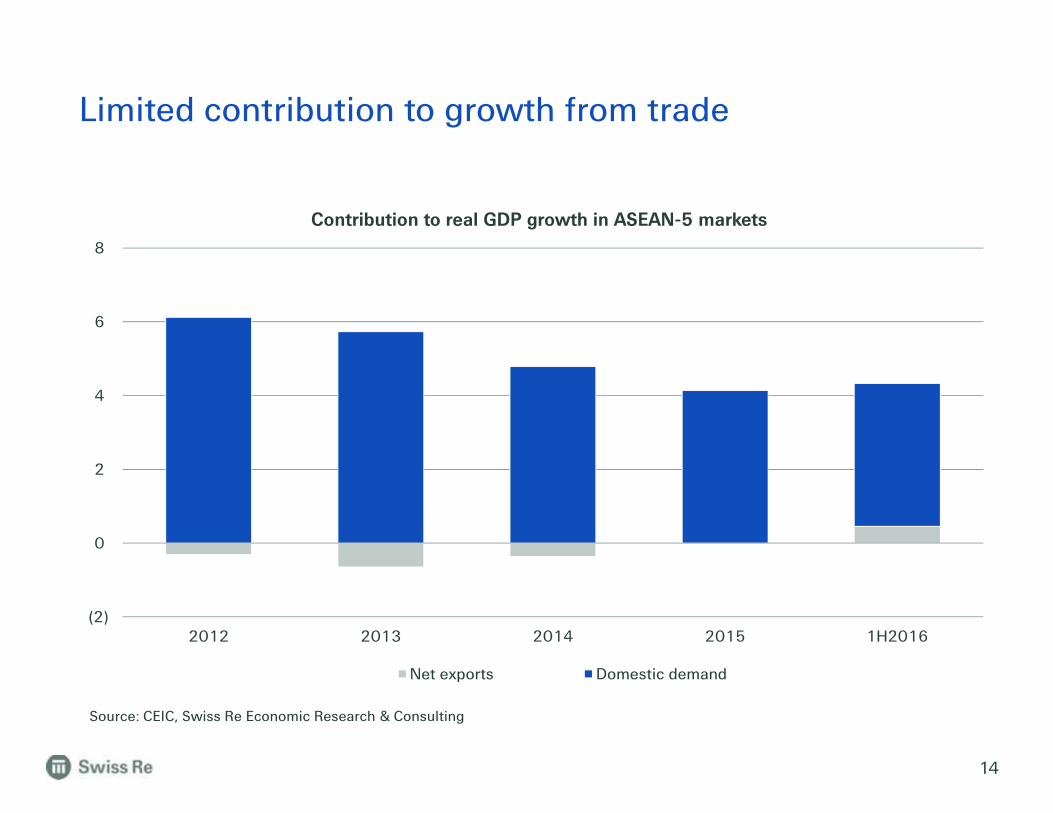
Limited contribution to growth from trade
14
(2)
0
2
4
6
8
2012 2013 2014 2015 1H2016
Contribution to real GDP growth in ASEAN-5 markets
Net exports Domestic demand
Source: CEIC, Swiss Re Economic Research & Consulting

20
40
60
80
100
120
140
Jan-
20
13
Jul-2
01
3
Jan-
20
14
Jul-2
01
4
Jan-
20
15
Jul-2
01
5
Jan-
20
16
Jul-2
01
6
Crude oil, copper and USD indices(1 Jan 2013=100)
Copper (LME) Crude oil (WTI)
USD trade weighted index
Elevated financial volatility coincides with falling crude oil,commodity prices and USD strength
15
50
100
150
200
250
300
Jan-
20
13
Jul-2
01
3
Jan-
20
14
Jul-2
01
4
Jan-
20
15
Jul-2
01
5
Jan-
20
16
Jul-2
01
6
Bond and stock volatility indices(1 Jan 2013 = 100)
US treasury volatility index (MOVE)
S&P volatility index (VIX)
Source: Bloomberg, CEIC, Swiss Re Economic Research & Consulting

16
What will be the keyinsurance themes forASEAN countries?
16

Insurance having gone through phases of development inAsia
17
0
120
240
360
480Nonlife premiums (USD b)
Life & health premiums (USD b)
Phase 1: monopolistic market structure,entry barriers, price/product regulations
Phase 2: liberalisation, deregulationand globalisation
Phase 3: economic/income growth,solvency reforms, personal lines
Source: Swiss Re Economic Research & Consulting
ASEAN FrameworkAgreement on Servicessigned in 1995
Asia financial crisis
India opened insurancesector to private and foreigncompanies
International insurersentering EM Asia markets
Global financial crisis
China entered WTO inDec 2001
-20%
0%
20%
40%
19
86
19
87
19
88
19
89
19
90
19
91
19
92
19
93
19
94
19
95
19
96
19
97
19
98
19
99
20
00
20
01
20
02
20
03
20
04
20
05
20
06
20
07
20
08
20
09
20
10
20
11
20
12
20
13
20
14
20
15
Nonlife premiums real growth
Life & health premiums real growth

China
India
South Africa
Angola
Nigeria
Morocco
Ghana
Cote d Ivoire
Kenya
Mozambique
Ethiopia
0%
1%
2%
3%
4%
0.45 4.5 45GDP per capita in 1000 USD
Asia Middle East Africa
Non-life insurance penetration(premiums as a % of GDP) South Korea
Taiwan
Japan
Hong KongMalaysia
Philippines
IndonesiaVietnamBrunei
Thailand
CambodiaBangladesh
Source: Swiss Re Economic Research & Consulting. 18
Many emerging Asian markets have low insurancepenetration but are poised to achieve fast growth
Early movers Middle market Growers Slow growth
Singapore
log scaleIncome growthIncome growth
Pene
trat
ion
grow
thPe
netr
atio
n gr
owth

Fundamentals remain strong – middle income class andurbanisation
0
5
9
14
18
China India Indonesia MiddleEast
& Africa
LatinAmerica
OtherEmergingmarkets
USD trillion
Urbanisation-led infrastructure spending isexpected to be the highest in China during
2013-2023 (USD trillion)
Commercial floor space constructionWater & waste-water managementEnergy sectorTransportation
0%
20%
40%
60%
80%
100%
2009 2020 2030
The number of middle-income households isexpected to rapidly increase in Asia Pacific,
especially in India and China
North America EuropeCentral & South America Asia PacificSub-Saharan Africa Middle East & North Africa
Source: OECD, McKinsey Institute

One-Belt-One-Road
20

0
2
4
6
8
10
12
14
16
Japa
n
Sou
th K
orea
Sin
gapo
re
Hon
g K
ong
Chi
na
Thai
land
Aus
tral
ia
Vie
tnam
Indo
nesi
a
Wor
ld
Mal
aysi
a
Indi
a
Phi
lippi
nes
Old age support ratio(population aged 15-64 over population aged
65+)
2011 2030 2050
Demographic changes and healthcare needs
Source: WHO World Health Statistics, United Nations Population Division
Government funding and out-of-pocketexpenditure are the main financing
channels for healthcare expenditure
0%
20%
40%
60%
80%
100%
Government fund Social fund Private insurance
out-of-pocket other private fund

Technologies will have an impact on the whole of societyand thus shift risk pools and create new opportunities.
World's largest transportation company owns no vehicles -
Largest accommodation provider owns no real estate -
Largest phone company owns no telco infra -
World's most valuable retailer has no inventory -
Most popular media owner creates no content -
Fastest growing banks have no actual money -
World's largest movie house owns no cinemas -
Largest software vendors don't write the apps -
What will be the insurance headline?
Source: Tech Crunch, The Battle Is For The Customer Interface, Insurance and the Connected World, Strategy Meets Action

23
Digital Technology Adaption CurveIm
pact
of d
igita
lisat
ion
Point on digitalisation journey
Energy
Health Care
Logistics
Automotive
Consumer Packaged Goods
Telecom, Insurance and Banking
Retail
Media
Several majordisruptions haveoccurred
Disruptive moves (e.g. by pure onlineplayers) have affected these industries, butthe final outcome is still to be determined
Effect of digitalisation is still unknown anddisruptive changes remain to be seen; theseindustries are very similar in their overall levelof digitalisation
Data protection and privacy
Non-traditional players areentering across the valuechain
Are consumers comfortablewith insurers access toinformation on usage/behavior
Source: BCG, How to jump start a digital transformation, 2015

In ASEAN, mortality protection gap increased by an annualaverage of 9% over the past decade to USD 3.5 trillion
24
Note: mortality protection gap is defined as the difference between the protection needed (10x of average annual salary) and theprotection in place (including net financial assets/savings and relevant life insurance) to maintain dependents in living standardsfollowing the death of the primary breadwinner.Source: Swiss Re Economic Research & Consulting
0%
6%
12%
18%
50%
150%
250%
350%Vi
etna
m
Thai
land
Mal
aysi
a
Sing
apor
e
Phi
lippi
nes
Indo
nesi
a
ASE
AN
Mortality protection gap in 2014 (USD bn), LHS Avg annual increase in mortality protection gap (2004-2014), RHS

Uninsured Nat Cat losses have been particularly large inThailand, Indonesia, Philippines and Myanmar
25
Source: Swiss Re Economic Research & Consulting
(40) (30) (20) (10) - 10 20 30 40
Singapore
Laos
Cambodia
Malaysia
Vietnam
Myanmar
Philippines
Indonesia
Thailand
Accumulative nat cat losses, USD bn (2004-2015)
Insured losses Uninsured losses
Uninsured Nat Cat losses Insured Nat Cat losses

26
ASEAN Economic Community – ASEAN in 2030
1. AEC stands for ASEAN Economic Community2. Consuming class refers to those with income exceeding the level at which they can begin to make significant discretionary purchases.Source: Southeast Asia at the crossroads: Three path to prosperity, Nov 2014, Mckinsey&Company.
USD 7 trillion ininfrastructureinvestmentopportunities
USD 7 trillion ininfrastructureinvestmentopportunities
“Consumingclass” 2
doubling to163 mnhouseholds
“Consumingclass” 2
doubling to163 mnhouseholds
Urbanisation:More than 90 mnpeople areexpected to moveto cities
Urbanisation:More than 90 mnpeople areexpected to moveto cities
AEC 1 couldcreate USD280bn to USD615bn in annualeconomic value
AEC 1 couldcreate USD280bn to USD615bn in annualeconomic value

Concluding remarks
27
• Growth in ASEAN is increasingly constrained by 1) weak trade outlook; 2)limited room for further debt accumulation; and 3) already low interest rates
• Regional markets will nonetheless continue to pursue fiscal expansion tosupport growth
• Longer–term, structural and economic reforms are key to success
• Regardless of when the Fed actually lifts off, the impact is already felt inASEAN
• The next phase of growth – deleveraging but not a financial crisis
• What these mean to the insurance industry?

28

Legal notice
29
©2016 Swiss Re. All rights reserved. You are not permitted to create any modificationsor derivative works of this presentation or to use it for commercial or other public purposeswithout the prior written permission of Swiss Re.
The information and opinions contained in the presentation are provided as at the date ofthe presentation and are subject to change without notice. Although the information usedwas taken from reliable sources, Swiss Re does not accept any responsibility for the accuracyor comprehensiveness of the details given. All liability for the accuracy and completenessthereof or for any damage or loss resulting from the use of the information contained in thispresentation is expressly excluded. Under no circumstances shall Swiss Re or its Groupcompanies be liable for any financial or consequential loss relating to this presentation.