business models for renewable energy in the built environment
TRANSCRIPT

Business models for renewable energy in the built environment
L. Würtenberger (ECN)
J.W. Bleyl (Energetic Solutions)
M. Menkveld (ECN)
P. Vethman (ECN)
X. van Tilburg (ECN)
ECN-E--12-014 Updated version - April 2012

2 IEA-RETD / ECN-E--12-014
Acknowledgements This report presents the outcomes of the project ‘Business Models for Renewable Energy in the Built Environment’ (RE-BIZZ), initiated and funded by the IEA Implementing Agreement for Renew-able Energy Technology Deployment (IEA-RETD). This project is registered at ECN under the num-ber 5.1232. The project report was first published in November 2011. It was updated in April 2012 with four additional case studies. Contact person for this publication at ECN is Laura Würtenberger ([email protected]). The authors would like to thank the project steering group represented by Michael Paunescu (Nat-ural Resources Canada), Kjell-Olav Skjølsvik (Enova Norway), Milou Beerepoot (IEA Secretariat), Walt Patterson (Chatham House), David de Jager (Ecofys, IEA-RETD Operating Agent), Kristian Petrick (IEA-RETD Operating Agent) for their review and guidance during the course of the project. A special thank you goes to Kristian Petrick, who was always available for feedback and valuable discussions. The authors would also like to thank Ron van der Steen from Financial Consult Neder-land for his helpful feedback and review, and Sytze Dijkstra at ECN for co-reading the report.
Abstract The project RE-BIZZ aims to provide insight to policy makers and market actors in the way new and innovative business models (and/or policy measures) can stimulate the deployment of renewable energy technologies (RET) and energy efficiency (EE) measures in the built environment. The pro-ject is initiated and funded by the IEA Implementing Agreement for Renewable Energy Technology Deployment (IEA-RETD). It analysed ten business models in three categories (amongst others dif-ferent types of Energy Service Companies (ESCOs), Developing properties certified with a ‘green’ building label, Building owners profiting from rent increases after EE measures, Property Assessed Clean Energy (PACE) financing, On-bill financing, and Leasing of RET equipment) including their or-ganisational and financial structure, the existing market and policy context, and an analysis of Strengths, Weaknesses, Opportunities and Threats (SWOT). The study concludes with recommen-dations for policy makers and other market actors.
About IEA-RETD
RETD stands for “Renewable Energy Technology Deployment”. IEA-RETD is a policy-focused, tech-nology cross-cutting platform that brings together the experience and best practices of some of the world’s leading countries in renewable energy with the expertise of renowned consulting firms and academia. IEA-RETD is a so-called Implementing Agreement, i.e. a platform where a number of countries cooperate under the framework of the International Energy Agency (IEA). The mission of IEA-RETD is to accelerate the large-scale deployment of renewable energies (RE). This is achieved by providing information and recommendations on RE technology cross-cutting is-sues to policy makers and other stakeholders. To this end, IEA-RETD commissions annually 5-7 studies performed by consultancies and academia. The reports and handbooks are publicly and freely available on the IEA-RETD’s website at www.iea-retd.org. In addition, IEA-RETD organizes at least two workshops per year and presents at national and international events. IEA-RETD exists since 2005 and has currently 9 member countries (Canada, Denmark, France, Germany, Ireland, Ja-pan, Netherlands, Norway and the UK).

IEA-RETD / Business Models for Renewable Energy in the Built Environment 3
Contents
1. Introduction 10 1.1 Background 10 1.2 Scope of the report 10
1.2.1 Technological focus, market segments and country focus 10 1.2.2 How to define business models for RET in the built environment 11
1.3 Reading guide and methodology 13
2. Overcoming barriers for the deployment of Renewable Energy Technologies (RET) in the built environment 15 2.1 Current barriers 15
2.1.1 Market and social barriers 15 2.1.2 Information failures 16 2.1.3 Regulatory barriers 17 2.1.4 Financial barriers 17
2.2 Barriers from a business case perspective 18
3. Business models for an increased deployment of RET in the built environment 21 3.1 Categorizing business models 21 3.2 Product-service-system business models 22 3.3 Business models based on new revenue models 23 3.1 Business models based on new financing schemes 24
4. Analysis of business models 25 4.1 Product-Service Systems: Energy-Contracting (ESCO or Energy Efficiency Services) 25
4.1.1 Introduction, Definition and Common Key Features of all three ESCO Models 25 4.1.2 Energy Supply Contracting 30 4.1.3 Energy Performance Contracting 33 4.1.4 Integrated Energy Contracting 36 4.1.5 SWOT Analysis, Discussion and Conclusions for all three ESCO Models 38
4.2 Business models based on new revenue models 43 4.2.1 Making use of a feed-in remuneration scheme 43 4.2.2 Developing properties certified with a green building label 49 4.2.1 Building owner profiting from rent increases after the implementation of
energy efficiency measures 57 4.3 Business models based on new financing schemes 62
4.3.1 Property Assessed Clean Energy (PACE) financing 62 4.3.2 On-bill financing 68 4.3.3 Leasing of renewable energy equipment 74 4.3.4 Business models based on Energy Saving Obligations 80
5. Synthesis: business models, barriers, market segments and actors 85 5.1 Which barriers are addressed by business models? 85 5.2 In which market segments can the business models be applied? 88 5.3 Who are the actors involved in the business models? 90 5.4 Conclusion and further considerations 92
5.4.1 Conclusions 92 5.4.2 Further considerations 93 5.4.3 Potential for further research 97
6. Recommendations for policy makers and market actors 99 6.1 Recommendations for policy makers 99 6.2 Recommendations for building owners 103 6.3 Recommendations for other market actors 103
Appendix A Case studies 105

4 IEA-RETD / ECN-E--12-014
A.1 LIG, Austria - Integrated Energy-Contracting Pilots 105 A.2 Berkeley FIRST - the first PACE financing programme 107 A.3 Financing commercial building retrofits with the help of an Environmental Upgrade
Charge in Melbourne 108 A.4 PROSOL: Supporting market growth of solar water heating in Tunisia 109 A.5 Greenchoice: Solar supply contracting in the Netherlands 111 A.6 Adaptation of the rental price evaluation system in the Netherlands 112 A.7 Market introduction of small and micro CHP systems 114 A.8 Leasing of a heat pump system 115 A.9 Energy supplier obligations in the UK 116 A.10 Power Smart Residential Loan programme of Manitoba Hydro, Canada 118 A.11 LEED certification 119 A.12 Berlin Energy Saving Partnership 121

IEA-RETD / Business Models for Renewable Energy in the Built Environment 5
List of tables
Table 2.1 Barriers and market segments 19 Table 3.1 List of analysed business models 22 Table 5.1 Barriers addressed by the business models 86 Table 5.2 Market segments addressed by the business models 89 Table 5.3 Actors directly involved in the various business models 91 Table A.1 Sample calculation for the installation of a solar PV plant on a residential building
under the pilot Berkeley FIRST PACE financing programme 107
List of figures
Figure 3.1 Scope of services of different ESCO models 23 Figure 4.1 Energy-Contracting: A modular energy service package with guaranteed results
for the client. (Note: The added value for the client of energy contracting compared to in-house implementation is displayed in red.) 26
Figure 4.2 Energy-Contracting: Components of service package and outsourcing of interfaces and guarantees to an ESCO 27
Figure 4.3 Energy-Contracting model where building owner finances RET equipment through a loan from a financial institute 28
Figure 4.4 Energy-Contracting model where ESCO finances RET equipment (optionally with financial institute) 28
Figure 4.5 ESC-model: Schematic standard scope of services including renewables 30 Figure 4.6 Energy Supply-Contracting business model 31 Figure 4.7 EPC-model: Schematic standard scope of services 33 Figure 4.8 Energy Performance-Contracting business model 34 Figure 4.9 IEC-model: Schematic standard scope of services 36 Figure 4.10 Integrated Energy-Contracting business model 37 Figure 4.11 Energy-Contracting models: summary of SWOT analysis 40 Figure 4.12 Value chain from primary energy to energy services 41 Figure 4.13 Schematic depiction of a business model based on a feed-in tariff and
production exceeding own use, smart meter optional 45 Figure 4.14 Schematic depiction of a business model based on a feed-in premium and
production less than own use, smart meter optional 45 Figure 4.15 Business model based on feed-in remuneration - summary of the SWOT
analysis 47 Figure 4.16 Schematic depiction of the business case of developing a property certified
according to a green label 51 Figure 4.17 Countries with ‘green’ building certification programs 52 Figure 4.18 Voluntary ‘green’ building certification - summary of the SWOT analysis 55 Figure 4.19 Schematic depiction of the business model 58 Figure 4.20 Business model based on higher rents after improving energy performance of a
building - summary of the SWOT analysis 60 Figure 4.21 Schematic depiction of PACE financing for RET 62 Figure 4.22 PACE financing - summary of the SWOT analysis 66 Figure 4.23 Schematic depiction of on-bill financing of RET 69

6 IEA-RETD / ECN-E--12-014
Figure 4.24 On-bill financing - summary of SWOT analysis 72 Figure 4.25 Lease agreement without involvement of an ESCO 75 Figure 4.26 Lease agreement with involvement of an ESCO 75 Figure 4.27 Leasing arrangement between a company distributing a specific technology
and a building owner 76 Figure 4.28 Leasing of RET - summary of the SWOT analysis 79 Figure 4.29 Schematic depiction of Energy Saving Obligations, depicting one building owner
who profits from the obligation by lower energy prices after an installation of RET / EE measure and another building owner who only pays a higher price for his electricity. 81
Figure 4.30 Energy Saving Obligation - summary of the SWOT analysis 84 Figure A.1 ‘Schloss Retzhof’: Seminar House of the Province of Styria 105 Figure A.2 Organisational structure of the PROSOL business model 110 Figure A.3 Net costs and benefits of renovation for landlords and tenants, under the adapted
rental price evaluation system 113
List of boxes
Box 4.1 Case in point: Berkeley FIRST - the first PACE financing programme 68 Box 4.2 Case in point: PROSOL 73 Box 4.3 Case in point: Market introduction of small and micro CHP systems 80 Box 5.1 Case in point: Wonen++ concept – an example of small scale energy services 95 Box 5.2 Case in point: Cost-effectiveness of RET may vary 96 Box 6.1 Supporting Energy-Contracting business models 100 Box 6.2 Considerations for supporting business models based on new financing schemes 101

IEA-RETD / Business Models for Renewable Energy in the Built Environment 7
Summary
The project “Business Models for Renewable Energy in the Built Environment (RE‐BIZZ)” aims to provide policy makers and other market actors insight into the way new and innovative business models can stimulate the deployment of renewable energy technologies (RET) and energy efficien-cy (EE) measures in the built environment. Today, various barriers prevent an increased deployment of RET in the built environment including
Market and social barriers: price distortion through externalities, low priority of energy issues, split incentives, etc.
Information failures: lack of awareness, knowledge and competence
Regulatory barriers: restrictive procurement rules, cumbersome building permitting processes
Financial barriers: low (or no) returns on investment, high up-front costs, lack of access to capi-tal etc.
For the scope of this study, a business model was defined as ‘a strategy to invest in RET (and EE measures), which creates value and leads to an increased penetration of RET in the built envi-ronment.’ Successful business models represent approaches in which the financing and implemen-tation of RET or EE in buildings is organised in such a way that certain barriers for the deployment of RET are overcome. Based on the main drivers for value creation, business models for RET in the built environment can be grouped in three categories, in which overall 10 business models were analysed:
Product-Service-Systems / Energy Service Companies (ESCOs): 1) Energy Supply Contracting (ESC): An Energy Service Company (ESCO) supplies useful energy,
such as electricity, hot water or steam to a building owner (as opposed to final energy such as pellets or natural gas in a standard utility contract). The ESC model is particularly well suited for generating electricity and heat from RET.
2) Energy Performance Contracting (EPC): An ESCO guarantees energy cost savings in compari-son to a historical (or calculated) energy cost baseline. For its services and the savings guar-antee the ESCO receives a performance based remuneration.
3) Integrated Energy Contracting (IEC): The IEC model is a hybrid of ESC and EPC aiming to combine supply of useful energy, preferably from renewable sources with energy conserva-tion measures in the entire building. The model is currently being piloted in Austria and Germany.
Business models based on new revenue models: 4) Making use of a feed-in remuneration scheme: Through a feed-in remuneration scheme the
producer of renewable energy receives a direct payment per unit of energy produced. A feed-in scheme guarantees access to a predictable and long-term revenue stream, which can serve as a stable basis for a business model.
5) Developing properties certified with a green building label: ‘Green’ building certification sys-tems assess a building’s performance according to environmental and wider sustainability criteria. In this business model a property developer or architect designs and builds buildings certified according to a voluntary ‘green’ certification scheme, expecting to realize a sales price premium compared to conventional buildings.
6) Building owner profiting from rent increases after the implementation of energy efficiency measures: Building owners who do not occupy a building themselves or housing corpora-tions can profit from additional revenue opportunities after undertaking investments in RET and EE measures if they are allowed to charge higher rent from their tenants after the reno-vation.
Business models based on new financing schemes:

8 IEA-RETD / ECN-E--12-014
7) Property Assessed Clean Energy (PACE) financing: PACE financing is a mechanism set up by a municipal government by which property owners finance RET and EE measures via an addi-tional tax assessment1 on their property. The property owners repay the ‘assessment’ over a period of 15 to 20 years through an increase in their property tax bills. When the property changes ownership, the remaining debt is transferred with the property to the new owner.
8) On-bill financing: Utilities provide financing (i.e. a loan) for RET and EE measures. The build-ing owners (or building users) repay the loans via a surcharge on their utility bills.
9) Leasing of renewable energy equipment: Leasing enables a building owner to use a renewa-ble energy installation without having to buy it. The installation is owned or invested in by another party, usually a financial institution such as a bank. Leasing can be a central compo-nent of the business model of an ESCO or of a company that introduces a new technology to the market.
10) Business models based on Energy Saving Obligations: Energy Saving Obligations are a policy instrument that obliges energy companies to realise energy savings at the level of end users. It stimulates business models based on financial incentives offered by energy suppliers to building owners, renters or energy service companies.
The analysis of the business models included an analysis of the organisational and financial struc-ture, the existing market and policy context and an analysis of Strengths, Weaknesses, Opportuni-ties and Threats (SWOT). Some of the analysed business models are specific to a certain market segment (e.g. new vs. existing, owner-occupied vs. rented, residential vs. commercial buildings), whereas others can easily be generalised. Practical experience with the models varies among coun-tries.
Strong role of policy makers required The study demonstrates that business models can play an important role in increasing the deploy-ment of RET in the built environment. They provide opportunities for building owners, e.g. facilitat-ing access to capital, financing of up-front costs, outsourcing of technical and economic risks, and offering further energy related services. In many cases business models require only a supporting role by government, e.g. through changes of legislation. However, business models alone will not lead to a significantly increased deployment of RET. The analysed business models generally only lead to a deployment of cost-effective technologies because they are unable to improve the re-turns on investment of RET and EE measures by themselves. Moreover, business models cannot address all barriers, e.g. no business model addresses the barrier of ‘low priority of energy issues’, which keeps building owners from taking action. This implies that a strong role of policy makers is still required.
In which market segments can the business models be applied? The built environment is a complex sector where barriers for an increased deployment of RET differ among market segments. The results show that in existing and new, large commercial, residential and public buildings, ESCO models can address the barriers of high upfront costs and access to cap-ital. In small residential and commercial buildings this can be achieved by PACE or on-bill financ-ing. These business models make a life cycle approach possible where building owners can spread the investment costs across the project life time. For business models to work in rented buildings, the split incentives barrier must be addressed. One way of doing this in regulated rental sectors, especially the social housing sector, involves a change in legislation, allowing building owners to pass on the cost of the investment to the tenant through a rent increase. To cushion the social ef-fects of the measure, the benefits of energy savings should be higher than the rent increase for the tenants. Business models have the advantage that they can work well for existing buildings where-
1 ‘Tax assessments’ are comparable to loans as the property owner pays off its debt in installments over a period
of various years.

IEA-RETD / Business Models for Renewable Energy in the Built Environment 9
as building codes / obligations so far tend to be limited to new buildings and substantial renova-tions.
Business models for non cost-effective technologies Today, there are already many cost-effective opportunities for a deployment of RET and EE measures (e.g. insulation of buildings, solar water heating in sunny climates), although cost-effectiveness largely depends on the background situation. For technologies that are not (yet) cost-effective, business cases may be based on supporting policy measures such as feed-in remunera-tion schemes. ‘Green’ certification of buildings can stimulate investments in RET even when they are not cost-effective. However, because such certification is voluntary, it typically only works in niche markets. Energy saving obligations are introduced by governments to stimulate EE measures and energy ser-vices through the participation of energy suppliers. In practice, this policy measure promotes for example the role of ESCOs and on-bill financing but originally it only focused on EE. The scope of energy saving obligations could be broadened to include RET in the built environment.
Recommendations for policy makers Policy makers should first analyse the cost-effectiveness of RET/EE measures in different mar-
ket segments of the built environment within their jurisdiction.
To support cost-effective RET in existing and new large commercial, residential and public buildings policy makers can stimulate ESCO models, e.g. by supporting market facilitators, facili-tating access to finance and changing procurement rules for public buildings.
To support cost-effective RET in smaller residential and commercial buildings, policy makers can stimulate business models such as on-bill financing or PACE financing, e.g. by - deciding on the most promising model based on a stakeholder analysis (which actors have an
interest in RET, the ability to offer access to capital, the technical capacity and access to the decision makers)
- mandating or strongly incentivising utilities, e.g. through energy savings obligations to take an active role
- clarifying outstanding legal issues, e.g. on linking liabilities to a property.
To address split incentives in rented buildings, depending on how their rental market is regulat-ed, policy makers may change rental legislation to make rent increases possible after RET or EE investments.
Recommendations for building owners Public building owners play a special role, as they can serve as a role model and a means to drive the implementation of government targets for RET deployment and energy efficiency in the built-environment. Governments can be proactive in applying suitable business models. Public building owners can for example:
Apply certification with voluntary ‘green’ building labels to new buildings and during substantial renovation of existing facilities, and;
Directly support ESCO business models by using these models in the public building stock. This may require a change in public procurement rules.
This provides a unique opportunity for local governments to become active in increasing the de-ployment of RET in the built environment. The analysis also shows that often business models are most successful when they are based on partnerships between actors with complementary expertise and resources, e.g. regarding access to capital, technical expertise and access to the clients / building owners.

10 IEA-RETD / ECN-E--12-014
1. Introduction
1.1 Background
The Implementing Agreement on Renewable Energy Technology Development of the International Energy Agency (IEA-RETD) has the objective to support a significantly higher utilisation of renewa-ble energy technologies (RET) by encouraging more rapid and efficient deployment of these tech-nologies. RET are increasingly recognized for their potential role within a portfolio of low-carbon and cost-competitive energy technologies capable of responding to the dual challenge of climate change and energy security. Moreover, RET have the potential to reduce environmental pollution caused by fossil fuel based energy sources. The building sector presents a large opportunity for reducing CO2 emissions in a cost-effective manner. About 40% of final energy consumption takes place in existing buildings, and buildings ac-count for about 24% of global CO2 emissions.2 At the same time, the building sector offers some of the largest potentials for reducing GHG emissions at negative costs. The IPCC (2007) estimates that globally about 30% of the business-as-usual CO2 emissions in buildings projected for 2020 could be mitigated in a cost-effective way. There is a large potential for meeting the energy demand of buildings by means of district heating and cooling schemes or through the direct use of RET in buildings (IPCC, 2011). However, as illustrated in previous studies by the IEA (IEA, 2007; IEA, 2008; IEA, 2010, IEA-RETD, 2007) and other organisations (e.g. WBCSD, 2010; Wuppertal Institute et al., 2010; European Commission, 2010/11) various barriers prevent the accelerated uptake of RET and energy efficiency measures in the built environment. New and innovative business models may help to exploit the potential of a sustainable energy in the built environment by addressing one or more of these bar-riers. The IEA-RETD therefore commissioned the project ‘Business models for Renewable Energy in the Built Environment (RE-BIZZ)’ to gain insights into the way new business models and/or policy measures can stimulate the deployment of renewable energy technology (RET) and energy efficien-cy (EE) in the built environment. The project aims at providing recommendations to both policy makers and market actors. This report presents the work undertaken within this project.
1.2 Scope of the report
1.2.1 Technological focus, market segments and country focus
The study focuses on business models for increasing the deployment of RET in the built environ-ment. Where necessary, the report also address energy efficiency measures and how energy effi-ciency measures relate to the deployment of renewable energy, as energy efficiency plays an im-portant role in reducing energy use in buildings. In addition, many existing studies, for example on barriers for reducing GHG emissions from buildings, focus on energy efficiency. Previous research commissioned by the IEA-RETD (IEA-RETD, 2010) suggests that the lessons from the promotion of residential energy efficiency may largely be transferred to programmes promoting the residential use of renewable energy.
2 This is the case in most countries of the world, i.e. both globally (UNEP, 2007) and in OECD countries (IEA, 2008;
EC, 2011).

IEA-RETD / Business Models for Renewable Energy in the Built Environment 11
The analysis covers renewable electricity, and heating and cooling. The following renewable energy technologies in buildings fall under the scope of the study:
Solar PV
Solar thermal for water and space heating (solar boilers)
Small-scale wind turbines on the roofs of buildings for electricity generation
Biomass heating (e.g. wood pellets)
Heat pumps and small-scale district heating / CHP plants based on renewable energy (e.g. when installed by a property developer on a large housing or business complex)
Heat and cold storage systems
Micro-CHP systems may be included because, although they are not a RET, a micro-CHP system is generally more efficient than traditional electricity and heat production, and may be based on renewable energy in the future.
EE measures are not an explicit focus of the report. However, where the analysis does refer to EE measures, these could include the following:
Insulation (wall, roof, floor, window, heating and water pipes, crack sealing)
Low temperature room heating
Heating boiler controls
Heat recovery systems (ventilation system, shower)
Other (water saving shower heads, weatherstrips etc.). The study distinguishes between the following market segments: new vs. existing buildings, owner-occupied versus rented, and commercial vs. residential (if needed further split into multi-family dwellings, de/attached homes and stand-alone houses). Within the segment of commercial build-ings, where required, the specific role of public building owners is addressed. Some parts of the study include country specific explanations. Case studies from a country or re-gion are used to illustrate the business models. In addition, the business models are put into the context of the country specific regulatory environment. Where this is the case, the IEA-RETD mem-ber countries, i.e. Canada, Denmark, France, Germany, Ireland, Japan, Netherlands, Norway, United Kingdom, are examined. The study may also refer to other countries and country situations which could be potentially interesting in the long term for the business models evaluated such as, but not limited to, China and the United States.
1.2.2 How to define business models for RET in the built environment
Research on business models originated during the rise of e-commerce and the development of other internet-based companies in the 1990’s and early 2000’s. Since then, business models have become an increasingly popular concept in management theory and practice. Today, the concept is being applied to an ever wider range of sectors and topics (Wuestenhagen, 2004; Osterwalder, 2005). A large number of studies on the theory of business models exist, but so far there is no generally accepted definition of what a business model is, although the definitions generally state that it de-scribes how a business creates value (Osterwalder, 2005, Osterwalder et al 2005, Porter 2001, Shafer et al 2005). The approach for value creation can then be split into different aspects, includ-ing for example the strategic objective and value proposition, sources of revenue, critical success factors, core competencies, customer segments, sales channels (Weill and Vitale, 2001) and key ac-tivities and resources. Other definitions are simpler, e.g. defining a business model as ‘the method of doing business by which a company can sustain itself, that is, generate revenue’ (Rappa, 2001).

12 IEA-RETD / ECN-E--12-014
Based on these considerations, we recognize the following distinction between a business case and a business model:
A business case captures the logic and reasoning for initiating an activity, such as an investment in RET in the built environment. The reasoning includes a financial calculation demonstrating the profitability of the planned investment.
A business model describes the structure and strategy behind a business case, and includes el-ements such as value proposition, key activities, key resources, cost structure and revenue streams. The aim of a business model is to help structure an initiative in a way that leads to a positive business case, one that leads to initiating the activity.
For the scope of this study, a business model is defined as:
‘a strategy to invest in RET and in EE measures, which creates value and leads to an increased penetration of RET and EE measures in the built environment.’
Research on business models generally focus on the strategy at a company level. However, for the concrete case of deployment of RET in the built environment, we broaden the definition of a busi-ness model to also include strategies of non-corporate actors. The built environment is an excep-tionally multifaceted system, including different market segments and market actors. The World Business Council for Sustainable Development (WBCSD) (2009) in its ‘Roadmap for a Transfor-mation of Energy Use in Buildings’ identifies for example seven different group of actors in the sec-tor: government authorities; building developers; investors; occupiers; suppliers and manufactur-ers; architects, engineers, contractors and craftsmen; and utilities. In addition, energy service com-panies may be involved. At least five of these, i.e. building developers, investors (i.e. building own-ers), occupiers, energy service companies and utilities may be directly involved in investing in RET in the built environment, and creating value from this investment. Business models vary from being relatively simple to being complex. More simple models exist when an actor takes advantage of an existing incentive scheme for RET3, while more complex mod-els include Energy Service Companies (ESCOs) offering energy services ranging from providing in-formation and advice, identifying potential RE or EE measures, implementing them, and undertak-ing operation and maintenance services and financing. Today, various barriers prevent an increased deployment of RET in the built environment (see Chapter 2). Successful business models represent situations in which the financing and implemen-tation of RET or EE in buildings is organised in such a way that certain barriers for realisation of re-newable energy are (to some degree) overcome. Financial barriers such as long payback times, (perceived) high costs and access to capital are major barriers for the implementation of RET (see Chapter 2). Therefore the financial structure of the business models is an important element in the description and analysis of business models in this study. In addition, the regulatory environment plays a crucial role for business models for the increased deployment of RET. Policy interventions address the barriers for an increased deployment, either by direct incentives (e.g. subsidies or preferential pricing), or by changing the regulatory framework (e.g. minimum technology standards, obligations). Policy interventions involving financial incentives usually directly stimulate the financial structure of the business model. Policies in the category of regulatory schemes tend to be indirectly beneficial to business models, e.g. by changing the com-petitiveness versus conventional energy. In practice, business models may depend on multiple poli-cies, including both incentives and favorable regulatory schemes. This study analyses under which regulatory environment business models are viable.
3 Wuestenhagen et al. (2005) for example consider ‘intelligent management of available subsidies’ a potentially
important element of business models for sustainable energy.

IEA-RETD / Business Models for Renewable Energy in the Built Environment 13
1.3 Reading guide and methodology
This report consists of six chapters:
Chapter 1 presents some background to the project and describes the scope of the report.
Chapter 2 identifies current barriers to introducing RET/EE measures in the built environment and describes what these barriers imply from a business case perspective.
Chapter 3 presents categories of business models for sustainable energy in the built environ-ment and introduces the new and innovative models that are analysed in the report.
Chapter 4 describes and analyses these business models in detail with respect to their potential for supporting an increased deployment of RET in the built environment.
Chapter 5 present a synthesis and conclusions of the business model analysis.
Chapter 6 gives recommendations for policy makers and market actors. The identification of current barriers for an increased deployment of RET / EE measures in the built environment in Chapter 2 is based on a literature review of recent studies. Barriers are grouped in 4 categories based on IPCC (2007), UNEP (2007) and IEA (2008). The categories of business models presented in Chapter 3 are derived based on the taxonomy of business models in existing studies in general, and specifically on categories of business models for environmental services and sustaina-ble energy. Business models can be categorized according to the main drivers for value creation. For environmental services and sustainable energy, three main categories were identified based on Wuestenhagen (2005) and COWI (2008). These categories were confirmed by a review of existing and planned business models confirming that all potential business models can indeed be summa-rized under these categories. To select concrete business models for further analysis, information on a wide range of existing and planned business models was collected. In addition, the study considered how existing and planned legislation and other potential drivers for business models such as an increased awareness of cli-mate change may lead to new business models. We also considered how current barriers for the deployment of RET could theoretically be overcome by business strategies, and how certain busi-ness cases including RET become more viable if fossil fuel prices continue to rise. Based on a longer list, in collaboration with the Project Steering Group ten business models were selected for further analysis. Methodology for business model analysis The analysis of these business models (see Chapter 4) follows the same general template for all business models to ensure comparability. Only for the Energy Contracting models (see Chapter 4.1) some parts of the analysis are presented at the general level of Energy-Contracting models, whilst other elements are explained for the specific sub-models in order to avoid lengthy repetitions of information. The template for the business model analysis contains amongst others a description of the organisational and financial structure and an analysis of Strengths, Weaknesses, Opportunities and Threats (SWOT). Strengths and weaknesses consider the business model as such, while oppor-tunities and threats look at the conditions for effective implementation and the impact of external developments. The organisational and financial structure of the business models is illustrated in a schematic repre-sentation which highlights the business model’s most important elements (see for example Figure 4.3) based on the formalism developed by Weill and Vitale (2001) for so called e-business initia-tives. Similar diagrams are used frequently in different contexts, e.g. by Bleyl (2009) for ESCO busi-ness models. The questions for the SWOT analysis are partly based on the Impact Assessment Guidelines by the European Commission (EC, 2009). The leading question is, how suitable the business model is to contribute to an increased deployment of RET (and EE measures) in the built environment). Specific

14 IEA-RETD / ECN-E--12-014
questions for the analysis of strengths and weaknesses (i.e. effectiveness, efficiency, usefulness?) are:
Is the business model effective? Does it lead to an increased penetration of RET?
Which barriers are removed, or to which extent decreased (usefulness)?
Is the business model realized cost effectively?
Does it require a lot of time or effort for the person who implements it?
Are significant transaction costs involved?
Can the business model be scaled up, or replicated in other countries?
Are other policy measures needed as supporting measures, e.g. information campaigns?
Questions for the opportunities and threats (how viable and how vulnerable is the business mod-el?) are:
In which policy context or under what market conditions does this business model work?
How do changes in the policy context and market environment affect the business model?
Is the business model sustainable after financial incentives are discontinued?
Impacts of technology developments? Impacts of developments in the building stock?
Impacts of fossil fuel prices and feedstock prices? However, these questions are only meant to give guidance, as it is not possible to give comprehen-sive answers in the frame of this study. Ideally the SWOT analysis would be based on three differ-ent types of information:
Information from concrete case studies.
Information from market and evaluation studies, e.g. on the impact of a certain policy instru-ment on a business model.
Generalized statements on the effectiveness, efficiency, usefulness and on the viability and vul-nerability of the business model.
However, in reality, this depth of information is not available. Depending on the availability of in-formation on specific business models, the SWOT analyses differ in length and level of elaboration. The business model analysis is complemented by case studies which show concrete example of the business model in a specific context. The business model analysis focuses on generalized concepts. Reality may be more complex than the stylized business models discussed in this report. The case studies give some insight as to the complexity and variations found in real implementation. Methodology for synthesis, conclusions and recommendations The synthesis chapter evaluates the business models and puts them into a larger perspective. Thereby the question is addressed, how the analysed business models can stimulate an increased deployment of RET in the built environment. The discussion also touches upon additional ques-tions, such as: Will business models that are mainly based on voluntary actions be sufficient to in-crease the energy efficiency and use of RET in buildings? Or are stricter policy measures required, e.g. like the European Building Performance Directive or local solar ordinances? Are these policies, that apply both ‘sticks and carrots’, sufficient? How can it be assured that the necessary invest-ments can be financed? And how can it be ensured that the rehabilitation of existing building stock is tackled quickly? However, based on the research undertaken for this report, it is not possible to give comprehensive answers to these questions. Overview tables which illustrate which barriers are addressed by the business models, in which market segments the business models work, and which actors are directly involved form the basis for the comparison and synthesis. The synthesis leads to some general conclusions, which form the basis for recommendations for policy makers and market actors. In addition, the SWOT analyses lead to recommendations for specific business models.

IEA-RETD / Business Models for Renewable Energy in the Built Environment 15
2. Overcoming barriers for the deployment of Renewable Energy Technologies (RET) in the built environment
2.1 Current barriers
As illustrated in previous studies by the IEA (IEA, 2007; IEA, 2008; IEA, 2010, IEA-RETD, 2007) and other organisations (e.g. WBCSD, 2010; Wuppertal Institute et al., 2010; European Commission, 2010/11) various barriers prevent the accelerated uptake of RET and EE measures in the built envi-ronment. Most of the existing studies have focused on barriers to increasing energy efficiency in the built environment, while some recent studies specifically address barriers for an increased up-take of renewable heating and cooling (e.g. IEA-RETD, 2007). In most cases, barriers for RET de-ployment in the built environment don’t differ significantly from barriers for energy efficiency measures, as most barriers are specific to the built environment. For easier conceptualization barriers are grouped into four categories (based on IPCC (2007), UNEP (2007) and IEA (2008)): market and social barriers, information failures, regulatory barriers and fi-nancial barriers. As this study explicitly takes an investment / business case perspective, technical barriers are reflected mostly in the higher risk of RET as part of the financial barriers. Political barri-ers are considered to be part of the regulatory barriers, and market and social barriers. Similarly, behavioural barriers are reflected in market and social barriers, and in financial barriers via high discount rates which hinder upfront capital investments.
2.1.1 Market and social barriers
The following barriers relate to the demand side of the market for RET and EE measures in the built environment. Low priority of energy issues In many cases, energy costs in buildings are relatively low when compared to other costs for private persons or companies (IEA, 2007). As a consequence there is little incentive to invest in improving the energy performance of the building. Consumers rather tend to invest in upgrades of their build-ings for reasons of comfort, aesthetics, reliability, convenience or status. Companies focus their in-vestments on core business assets, whereas investments into the building stock have only a low priority (IEA, 2007) Price distortion From a societal perspective energy is too cheap, as externalities such as the costs of natural re-source depletion, health impacts from pollution, and climate change are not included in the market price for energy. This implies that consumers and project developers do not receive accurate price signals reflecting the true marginal cost of energy use. The ‘hassle factor’ The benefits from implementing RET or EE measures may be outweighed by the transaction costs and efforts required for gathering information and the perceived inconvenience of installing new equipment in a building which is in use. Split incentives ‘Split incentives’ refers to situations where the investor who pays for the upfront costs for RET or EE measures is not the same person who reaps the benefits of lower energy costs. Split incentives occur for example in rental properties when there is little incentive for the building owner to invest

16 IEA-RETD / ECN-E--12-014
if the tenant pays the energy bill. Conversely, the tenant may not be interested in an investment into RET either, as he may move out before the end of the payback period. There may also be other split incentives, e.g. between project developer and building-owner/user in new buildings, where there may be no or little benefit for the developer to incorporate RET, if he does not expect to fully recover the higher initial cost from the building owner/user (IEA-RETD, 2007). Other examples are elderly people or people who may move soon, who are not willing to make any more investments in their houses. There are also less incentives to save energy in rented apartments where the heating costs are evenly split. In addition, there are barriers to the increased uptake of RET and energy efficiency measures on the supply side of the market: Fragmentation in the building chain In most countries, the building development chain is complex and fragmented, which inhibits a ho-listic approach to building design and use, especially for new buildings. Decisions on RET and ener-gy efficiency measures are taken by different actors, including architects, project developers, con-struction workers or installers, often without coordination and too late in the development pro-cess, even though a successful integration of RET and EE measures requires optimizing the system as a whole (IPCC, 2007; WBCSD, 2010). Fragmentation in the sector is also an issue for existing buildings, for example when the installer of a new heating system is not able to advice on related insulation measures. Lacking intrinsic interest by energy companies Energy providers often have no intrinsic interest in energy savings by their customers. In addition, they generally do not favor small-scale decentralized solutions, which may compete with their own business model. Small scale suppliers of RET Many small-scale renewable heating and cooling technologies are produced by local, small and medium sized enterprises, where production levels have not reached sufficiently high volume to gain economies of scale (IEA-RETD, 2007). In addition, the lack of standardisation of RET at the re-gional or global level means that companies may face challenges to penetrate markets abroad. Many suppliers therefore remain small and medium enterprises. These suppliers tend to lack the necessary skills to adequately promote RET products.
2.1.2 Information failures
Lack of awareness There is a general lack of awareness on RET and EE. If viable RET alternatives are unknown, they are not taken into account in building investments. Lack of information on financing options There is a lack of adequate information describing financing options available to individuals invest-ing in EE or RET. Even if building owners are willing to implement EE measures or RET, they often find it difficult to obtain not only qualified, but also independent and objective advice from finan-cial experts. Financiers often have no specific knowledge on EE and RET, and thus will not promote financing such projects. Lack of knowledge and competence by installers Lacking knowledge and competence of professionals involved in the installation and maintenance of RET limits the diffusion of RET, as it limits the involvement of these professionals and may lead to poor installation of equipment (IEA-RETD, 2007).

IEA-RETD / Business Models for Renewable Energy in the Built Environment 17
2.1.3 Regulatory barriers
Restrictive procurement rules Procurement rules may pose barriers to the deployment of RET, for example if governments are not permitted to outsource the management of public buildings to private parties. Cumbersome building permitting processes Permits for the installation of RET may be difficult to obtain, or this may be a lengthy process.
2.1.4 Financial barriers
Low (or no) returns on investment Many RET are not yet cost competitive with traditional energy technologies (see IEA-RETD (2007) for recent cost estimates of renewable heating and cooling technologies and EC (2008) for recent cost estimates of electricity generation from RET). People tend to not invest in renewable energy or energy saving measures if the pay-back period is too long or even longer than the economic life-time of the technology and if the investment does not meet their hurdle criteria. High upfront costs Many EE measures require a substantial upfront investment, and most RET have a higher upfront capital cost than conventional technologies. This poses a barrier to investment, as decision makers, especially private homeowners may not be willing to make large upfront investments. Fuller (2008) for example describes implicit discount rates in the order of 25% to 75% for investment decisions by private consumers, which substantially increase the hurdle for any upfront investment.4 Difficult access to capital Especially low income private home-owners and small business owners lack internal capital and face difficulties getting access to external capital for financing RET or EE measures. Higher risk of RET than of conventional technology EE and RET projects are often considered risky investments, e.g. because of high technology risk or regulatory risk. Higher risks are included in project evaluations by applying a high discount rate or requiring a higher return on investment to compensate for the risk. As a consequence, EE and RE projects frequently become unattractive to investors. Note that the higher risk of RET can also be perceived rather than real risk. Many RET are already quite advanced and, apart from biomass heating, are not exposed to any fuel price risks, e.g. for purchasing oil or gas. High transaction costs From the point of view of service companies or financial institutions, investments in EE measures or RET in individual houses are often relatively small. As technology implementation and associated services such as financing and monitoring of energy savings are complex and thus relatively expen-sive, small scale measures are unattractive for investment by commercial banks or involvement of ESCOs. Incomplete mortgage assessment For a mortgage, credit capacity and risk profile of customers should improve after implementing EE measures or RET if these lower energy costs, as consequently more income is available to serve in-terest and down payments. However, mortgage criteria generally do not reflect this and financiers are usually not allowed to acknowledge the increased credit capacity.
4 Assuming a discount rate of 8% as frequently used by policy makers and financial institutions, an intended pay-
back time of 5 years and annual cost savings of $1.000 implies an acceptable up-front investment of $4.000. However, if the consumers’ explicit discount rate was 50% rather than 8%, the acceptable up-front investment would decrease to only $1.700.

18 IEA-RETD / ECN-E--12-014
2.2 Barriers from a business case perspective
Not all barriers described above are relevant for all market segments. Table 2.1 provides an over-view which barriers are relevant for which market segments. The importance of the market seg-ments differs widely among countries, e.g. because the general level of house-ownership among the population differs. In some countries, e.g. in the Netherlands and Spain, many people own apartments in multi-family buildings whereas in other countries, e.g. in Germany, apartments in multi-family buildings are primarily rented. Some barriers are related to energy in general or to general characteristics of renewable energy technologies. These include the ‘low priority of energy issues’, ‘price distortion’, ‘lacking intrinsic interest by energy companies’, ‘lack of awareness’, ‘lack of knowledge and competency by install-ers’, ‘cumbersome building permitting process’, ‘low (or no) returns on investment’, ‘higher risk of RET than of conventional technologies’ and ‘high upfront costs’. Other barriers are specific for some market segments:
The hassle factor is mostly relevant for existing residential buildings, where the owners occupy the building. In new buildings there is no inconvenience related to installing RET, because the installation takes place before building users move in. In commercial buildings or rented multi-family houses, RET are generally installed on the roof or in a separate room with technical equipment. In rented residential buildings, the decision to invest in RET is taken by the owner based on economical considerations. Here, inconvenience for the tenants is not such an im-portant criterion as in owner-occupied buildings.
Split incentives are mostly an issue for rented buildings and for property developers of new buildings.
Lack of information about financing options, mortgage assessment and transaction costs are especially relevant for small scale projects which comprise of only one single-family house, which is either newly built or owner-occupied. Commercial building owners are expected to have more knowledge about financing options, and in larger buildings or property develop-ments transaction costs relative to the size of the investment in equipment are lower.
Successful business models represent situations in which the financing and implementation of RET in buildings are organised in a way that barriers for realisation of renewable energy are - at least to some degree - overcome. A business model is defined as a strategy where the application of RET creates value, thus from a business case perspective in the first instance financial barriers are most relevant. Financial barriers inhibit value creation if an investment is not profitable or if it’s not real-ized due to lacking access to capital or willingness to make upfront investments. Generally, financial viability is the first requirement for a successful business model, except for some cases where non-financial drivers such as increased comfort, energy security or environmental considerations are primary motives for the deployment for RET.

IEA-RETD / Business Models for Renewable Energy in the Built Environment 19
Table 2.1 Barriers and market segments
Barriers Market segments in built environment
Residential buildings Commercial and public buildings
New buildings Existing buildings New buildings Existing buildings
Built by a pro-ject
developer
Built by the building owner
Owner-occupied Rented Built by a pro-ject
developer
Built by the building owner
Owner-occupied
Rented
Multifamily houses
Single family houses
Multifamily houses
Single family houses
Market and social barriers
Low priority of energy issues Applicable to all market segments
Price distortion Applicable to all market segments
The ‘hassle factor’ X X
Split incentives X X X X X
Fragmentation in the building chain X X X X
Little interest by energy companies Applicable to all market segments
Small scale suppliers of RET Applicable to all market segments
Information failures
Lack of awareness Applicable to all market segments
Lack of information on financing X X X
Lack of knowledge by installers Applicable to all market segments
Regulatory barriers
Restrictive procurement rules X X
Building permitting process Applicable to all market segments
Financial barriers
Low returns on investment Applicable to all market segments
High upfront costs X X X X X X
Difficult access to capital X X X X X
Higher risk of RET Applicable to all market segments
High transaction costs X X
Incomplete mortgage assessment X X X X

20 IEA-RETD / ECN-E--12-014
This does not mean that non- financial barriers are not important. Calculations of negative abate-ment costs demonstrate the significance of other barriers than too low rates of return. WBCSD (2009) calculate that there is a potential for investments of US$ 150 billion in building energy effi-ciency in the US, Japan, Europe, Brazil, China and India, which would have discounted pay-back times of five years or less and which would reduce the carbon footprint from the buildings sector by 40% compared to a baseline. McKinsey (2009) in their global Marginal Abatement Cost Curve identify a significant global abatement potential of 2500 Mt CO2 a year at negative costs5 in the building sector, which includes renewable energy and energy efficiency measures. These data show that there are significant opportunities for RET and energy efficiency measures in the built envi-ronment, which are economically viable, but are not realized because of additional financial barri-ers such as high upfront investment costs, but also because of a variety of non-financial barriers such as split incentives, information barriers and fragmentation in the building chain (WBCDS, 2009, McKinsey, 2009). Often a successful business model that creates a profitable business case for investments into RET in the built environment also addresses some of the non-financial barriers which are important in its market segment. ESCOs for example offer a building owner the opportunity to outsource energy related services such as installation, investment, operation and maintenance and fuel purchases. This decreases non-financial barriers such as information and market failures. The barriers described above illustrate the current situation. However, the barriers are not static, and their importance can change in the future. For example if oil prices and related fossil fuel prices continue to rise, some financial barriers, such as ‘low returns on investment’ will become less im-portant. The WBCSD (2009) calculations for example assume an oil price of 60 USD barrel. An in-creased market share of RET may decrease other barriers such as technical risks and information failures. This study focuses on current barriers although the calculation examples in Chapter 5 illus-trate how RET become more viable if fossil fuel prices increase.
5 The calculations for McKinsey’s global MAC curve are based on a societal perspective assuming a discount rate
of 4%. The discount rate for corporate or private investments which would have to be applied for a business case perspective is higher, and is thus expected to lead to a lower abatement potential than the 2’500 Mt CO2 annually. However, the figure does illustrate that there are significant other barriers inhibiting investments.

IEA-RETD / Business Models for Renewable Energy in the Built Environment 21
3. Business models for an increased deployment of RET in the built environment
3.1 Categorizing business models
New and innovative business models for an increased deployment of RET in the built environment may be categorized according to the main drivers for value creation. Based on Wuestenhagen (2005) and COWI (2008), the following three categories of business models can be distinguished: i) Product service systems (PSS) Product service systems are business models which make use of the delivery of the function of a product combined with a relevant service (COWI, 2008). In the area of energy these are business models offering energy related services beyond the simple sale of energy. Energy Service Compa-nies (ESCOs) are the most prominent examples of PSS business models in the energy sector. ii) Business models based on new and innovative revenue models or iii) on new financing schemes: New and innovative revenue models have been a main driver for new business models in some traditional industries (Wuestenhagen, 2005). For the deployment of RET there are business oppor-tunities in the intelligent use of available government incentives which contribute to revenues. New revenue streams may also emerge from realizing the additional value of the intangible climate or environmental benefit of a product, for example of a house with a high rating by a voluntary ‘green’ building certification scheme. In addition, there are business opportunities in making use of new and innovative financing schemes. The regulatory environment plays a crucial role for business models for the deployment of RET. Many of the business models that are based on new and innovative revenue models or financing schemes are actually driven by incentive schemes initiated and financed by government. In addi-tion, regulatory schemes such as obligations to deploy RET can be an important driver for invest-ments in RET in the built environment. However, obligations tend to not lead to direct business cases for the market actor who takes the initiative to install RET. But theoretically, an obligation can trigger innovative schemes such as a financing scheme. Such financing schemes emerge for ex-ample as a consequence of energy saving obligations for utilities. Alternatively business models can be categorized according to the market segment where they are applicable and according to the main actors involved. The built environment is an exceptionally multifaceted system which including many different market actors, such as building owners, ten-ants, government authorities; building developers; financial institutions, suppliers and manufactur-ers; architects, engineers, contractors, craftsmen and service companies; and utilities. The business
model analyses in Chapter 4 describe the applicable market segments and market actors involved. Table 3.1 shows the business models which are analysed in detail in Chapter 4. These models were chosen because they are considered to have the potential to lead to an increased deployment of RET and/or have the potential to be implemented widely. Additional considerations were:
If possible, the models should cover all market segments of the built environment.
If possible, the models should address a wide range of barriers for an increased deployment of RET.
The selection should cover both very new and innovative models, for which only little experi-ence exists (e.g. Integrated Energy Contracting, PACE financing) as well as models that have been applied widely enough to allow for a comprehensive evaluation of strengths and weak-nesses (e.g. on-bill financing, feed-in remuneration schemes).

22 IEA-RETD / ECN-E--12-014
The analysis should include Energy Contracting models as these are frequently discussed as an important market-driven approach for increasing the deployment of RET and EE in the built en-vironment.
Chapters 3.2 and 3.3 provide a short description of the business models. Table 3.1 List of analysed business models
Business models
Product-Service-Systems / Energy Contracting models
1 Energy Supply Contracting (ESC)
2 Energy Performance Contracting (EPC)
3 Integrated Energy Contracting (IEC)
Business models based on new revenue models
4 Making use of a feed-in remuneration scheme
5 Developing properties certified with a green building label
6 Building owner profiting from rent increases after the implementation of energy efficiency
measures
Business models based on new financing schemes
7 Property Assessed Clean Energy (PACE) financing
8 On-bill financing
9 Leasing of renewable energy equipment
10 Business models based on Energy Saving Obligations
3.2 Product-service-system business models
Energy Service Companies (ESCOs) are one of the most prominent examples of product-service-system business models for sustainable energy. Within the ESCO sector, it is possible to distinguish between two fundamentally different business models which provide either useful energy via (1) Energy Supply Contracting (ESC) or energy savings via (2) Energy Performance Contracting (EPC) to the end user. Under an Energy Supply Contracting (ESC) model, an Energy Service Company (ESCO) supplies useful energy, such as electricity, heat, or steam under a long-term contract to a building owner or building user. The EPC model is based on delivering energy savings compared to a prede-fined baseline (for more details see Chapter 4.1). Figure 3.1 depicts typical scopes of services of dif-ferent ESCO models. In practice there are also many variations within the ESC and EPC models. Most of these variations related to the range of services delivered under the contracts and to the question how the required investments are financed. In the Anglo-Saxon EPC markets, two EPC models are differentiated mainly with regards to who finances the investment: ‘Guaranteed Savings’ refers to a service model without financing by the ESCO, whereas ‘Shared Savings’ includes financing in the ESCO’s service package. In addition to the two basic models, a third, innovative approach is being piloted in Austria and Germany, the (3) Integrated Energy Contracting (IEC) model. It is methodologically based on the ESC model and is supplemented by a deemed savings approach for the energy efficiency measures. Compared to standard ESC models, the IEC approach extends the range of services and thus the energy and emissions savings potential to the whole building (see Figure 3.1).

IEA-RETD / Business Models for Renewable Energy in the Built Environment 23
Figure 3.1 Scope of services of different ESCO models Note: NWh refers to energy savings, i.e. avoided MWh. Source: Bleyl, 2009.
3.3 Business models based on new revenue models
(4) Making use of a feed-in remuneration scheme Feed-in schemes have emerged as one of the most common and successful (in terms of leading to an increased deployment of RET) incentive schemes covering the higher cost of RET versus conven-tional technologies by compensating the owner of the RET installation with a higher price for the renewable energy. A feed-in remuneration scheme creates opportunities for business cases as it can cover the financial gap between RET and conventional technologies. Feed-in tariffs or feed-in premiums for electricity from renewable sources are the most common. A renewable heat incen-tive will soon be implemented in the UK for the first time and is planned in the Netherlands. (5) Developing properties certified with a ‘green’ building label Independent of policy incentives, a business case also exists if a property developer can achieve a higher sales price for a building which is certified according to a voluntary ‘green’ building label. This is frequently the case in the North American and some Asian markets. (6) Building owner profiting from rent increases after the implementation of energy efficiency measures For building owners who do not occupy the building themselves and for housing corporations, rev-enue opportunities from an investment in energy efficiency arise when they are allowed to charge a higher rent from the tenants after the renovation. The higher rent takes the tenant’s energy sav-ings into account. The required changes in the legal framework address the issue of split incentives.

24 IEA-RETD / ECN-E--12-014
3.1 Business models based on new financing schemes
High upfront costs are a major barrier for an increased deployment of RET. Innovative financing schemes may therefore create business cases, if the financing schemes help to overcome the barri-er of high upfront costs. As public budgets are limited, new and innovative financing schemes are emerging which do not burden government budgets. (7) Property Assessed Clean Energy (PACE) financing The Property Assessed Clean Energy (PACE) concept has for example been widely discussed and piloted in the US. Under this scheme, local governments issue bonds for RET projects. The building owner repays the loan through an additional special assessment payment on its property tax bill for a specified term (Institute for Building Efficiency, 2010b). When the property changes ownership, the remaining debt is transferred with the property to the new owner. (8) On-bill financing On-bill financing programs are another model for addressing the barrier of high up-front costs and access to capital: A utility provides capital to a home owner for the installation of RET or EE measures. The home owner repays the investment via its energy bill. (9) Leasing of RET equipment Leasing of RET offers another opportunity for building owners to use RET without having to make an upfront investment. It’s possible both for larger scale equipment in large commercial buildings and in some cases also for small-scale, innovative RET for private home owners. The opportunity to lease equipment may also be part of the energy services package offered by an ESCO. However, leasing of RET equipment is analysed separately as it is technology specific and may also target in-dividual residential customers. (10) Business models based on Energy Saving Obligations Innovative financing options can also emerge under energy saving obligations for utilities. The utili-ty (potentially via an ESCO) offers investment incentives for energy efficiency investments, which are financed by overall higher energy prices. These incentives offer opportunities for building own-ers.

IEA-RETD / Business Models for Renewable Energy in the Built Environment 25
4. Analysis of business models
The following describes and analyses the ten business models in more detail. The analyses of the business models based on new revenue models and on new financing scheme follow the same template (including an introduction and definition, applicable technologies, market segments, in-volved actors, organisational and financial structure, existing policy and market context, analysis of Strengths, Weaknesses, Opportunities and Threats (SWOT), discussion and conclusions). To avoid lengthy repetitions of information, for the Energy-Contracting (EC) / ESCO business models in the category Product-service-systems, first common features of all EC business models are described, followed by a description of the three individual ESCO models. These descriptions are wrapped up with a SWOT analysis, and discussion and conclusions for the EC models in general.
4.1 Product-Service Systems: Energy-Contracting (ESCO or Energy Efficiency Services)
4.1.1 Introduction, Definition and Common Key Features of all three ESCO Models
Introduction and definition
Energy-Contracting (EC) - also labeled as Energy Service Companies (ESCOs) - is one of the most prominent examples of product-service-system business mod-els for sustainable energy. Two basic ESCO business models can be distin-guished, which provide either useful energy (Energy Supply Contracting - ESC) or energy savings (Energy Performance Contracting - EPC) to the end user. In addition to the two basic models, a hybrid model labelled as Integrated Energy-Contracting (IEC) was introduced and is being piloted in Austria and Germany. IEC aims to combine useful energy supply, preferably from renewable sources with energy conservations measures in the entire building. Independent of the business model, energy services - in a more narrow sense - have several common features, which are outlined in this first subchapter. Most importantly an ESCO’s remuneration is performance based (it is paid for the measured outputs as opposed to the inputs consumed) and it guarantees for the outcome and all inclusive cost of the service package. All ESCO business models investigated here, lead to a reduction of final energy demand. In addi-tion, they achieve environmental benefits due to the associated energy and emission savings in addition to non-energetic benefits such as an increase in comfort or reputation gains. Various definitions of energy services can be found in respective standards and literature.6 However most commonly applied definitions fall short with regard to important properties of ‘real’ Energy-Contracting services. Such properties are outsourcing of commercial and technical risks to an ESCO, guarantees for results, and ‘all inclusive’ costs of the measures implemented or of the optimi-zation according to project-cycle costs. These features may constitute an added value in comparison to standard in-house implementation of energy services. Therefore, in a narrow sense we define Energy Contracting (EC) as:
6 See for example EC (2006), Bertholdi et.al. (2007), EN (2009), Satchwell et.al. (2010).

26 IEA-RETD / ECN-E--12-014
Energy-Contracting is a comprehensive energy service concept to execute en-ergy efficiency projects according to minimized project cycle cost.
Typically an Energy Service Company (ESCO) acts as a general contractor and implements a customized service package (consisting of e.g. design, installa-tion, (co-)financing, operation & maintenance, optimization, fuel purchase, user motivation).
As key features, the ESCO’s remuneration is performance based, it guarantees for the outcome and all-inclusive costs of the services and takes over com-mercial as well as technical and operational risks over the project term. (after Bleyl+Schinnerl (2008)) In addition to ‘real’ Energy-Contracting models, there are so-called Energy Ser-vice Providers which offer technical and engineering services for the identifica-tion and implementation of RET and EE projects, but do not offer any perfor-mance guarantees (see e.g. examples in Box 5.1).
Modular Scope of services
EC services are not about a particular technology or energy carrier. Instead EC is a flexible and modular ‘tool’ to execute energy efficiency and RET projects according to the goals of the facility owner. All the tasks shown in Figure 4.1 such as planning, construction and financing, the ongoing components of the service package (operation and maintenance, purchasing of fuel, quality assurance and measurement & verification) as well as compliance with the legislative framework have to be covered either by the building owner or the ESCO throughout the contractual period.
Figure 4.1 Energy-Contracting: A modular energy service package with guaranteed results for the client. (Note: The added value for the client of energy contracting compared to in-house implementation is displayed in red.) For implementation, the building owner assigns a customized energy service package and demands guarantees for the results of the measures taken by the ESCO. The necessary components for implementing energy projects are sum-marized in Figure 4.2.
(Co-)Financing, Subsidies
Operat. & mainten.,
Troubleshooting,
Optimization,
User mvation
Project development,
Rough planning
Detailed planning,
Construction,
Initial start up
„Energy-
Contracting“
- a modular service
package incl.
outcome
guaranteesOutsourcing of
commercial
and technical risks
Function-,
performance- and
price guarantees
Added value
through
outsourcing:
=> “Energy-Contracting“ is the guarantee, that the overall system
performs to specifications. Over the whole contract term.
Fuel + power purchase
Source: after [Bleyl+Schinnerl 2008]
Controlling,
M & V,
Quality assurance,

IEA-RETD / Business Models for Renewable Energy in the Built Environment 27
Figure 4.2 Energy-Contracting: Components of service package and outsourc-ing of interfaces and guarantees to an ESCO
Typically an ESCO serves as a general contractor and is responsible for coordi-nation and management of the individual components and interfaces of the service package towards the customer. It has to deliver the commissioned en-ergy service (Megawatt hours of useful energy or energy savings (‘Negawatt hours’)) to the customer at ‘all inclusive’ prices as displayed in Figure 4.2. Energy efficiency projects differ in their contents and general conditions. Therefore, it has proven to be necessary and sensible to adapt the scope of services specifically to the individual project. This also implies that the building owner can define, which components of the energy service are outsourced and what he carries out himself (e.g. ongoing on-site maintenance provided by a facility manager or financing from other sources). An important difference between in-house (‘do-it-yourself’) implementation and outsourcing to an ESCO root in the functional, performance and price guarantees provided by the ESCO and the assumption of technical and eco-nomic risks by the ESCO.
Actors Directly involved actors are the ESCO and the building owner. The second layer in the value chain includes equipment and final energy suppliers and financial institutions, who provide capital for the investment into (RET and EE) equip-ment. No direct policy intervention is required.
Financing of the required investment
Outsourcing of up-front financing of RE or EE equipment is often the key driver to engage with an ESCO. However ESCOs are not necessarily able to offer more attractive financing conditions in comparison to a building owner, especially when the client is a large organisation, nor is financing typically the ESCO’s core competence. Therefore, the ESCO service package does not necessarily need to include financing. Financing can be provided by the building owner (Figure 4.3), the ESCO (Figure 4.4) or a third financing partner, depending on who has better access to capital and financing conditions.
Technology
Suppliers, construction,
operation & maintenance …
Energy
Gas, fuel oil,
solar, woodchips …
Money
Equity capital, banks,
TPF, subsidies ...
Know-How
Engineers, architects,
consultants, innovation …
En
erg
y S
erv
ice
Co
mp
an
y (E
SC
o)
Supply (MWh) or
Savings (NWh)
incl. function,
performance +
price guarantees
Legislative Framework
Laws, procurement,
technical rules … © Grazer Energieagentur GmbH - For requests: [email protected]
(pot.)
ESCo
Client
Source: after [Bleyl 2009]

28 IEA-RETD / ECN-E--12-014
Figure 4.3 Energy-Contracting model where building owner finances RET equipment through a loan from a financial institute
Figure 4.4 Energy-Contracting model where ESCO finances RET equipment (optionally with financial institute)
This distinction is also reflected in the Anglo-Saxon EPC markets, where two basic EPC models are differentiated mainly with regard to who finances the in-vestment: ‘Guaranteed Savings’ refers to a service model without ESCO fi-nance, whereas the ‘Shared Savings’ model includes financing in the ESCO’s service package. Combinations of the above options are also possible to account for the specific project and the actors involved. In reality, a mixture of financing sources is of-ten the best choice in order to balance risks. If the ESCO does not provide fi-nancing itself, it can still take on the role as a facilitator supporting the building owner to get access to third party financing solutions.7
Existing markets and policy context
Reliable market data on ESCO markets are scarce or not publicly available. In the EU, Energy Supply Contracting (ESC) has by far the largest market share within the Energy Services sector (Labanca, 2011). In Germany, ESC has for example a market share of 85%-90% of the ESCO mar-ket (Bleyl, 2011). While Energy Performance Contracting is talked about a lot, its market share in the German ESCO market is only between 10% and 15% (Prognos 2009, VfW 2009). In Germany, the most recent market estimate indi-cates that there are about 250 companies active in the energy services market, mostly using the ESC model (Eikmeier et al., 2009). The total volume of the German energy services market is estimated to be about € 2 billion annually, of which about 60% takes place in the residential buildings (Bunse et al., 2010). Integrated Energy Contracting (IEC) is an innovative model which has been pi-loted in Austria. Experiences collected from up to now eight projects have con-
7 More details on financing options for energy-contracting projects can be found in Bleyl (2008), who introduces
the customer demand profile methodology. This is a tool to define and structure financing needs from the cus-tomer perspective and can be used as a checklist to compare different financing options.
ESCO Building
owner
RET equipment
Installation
Financial
institution
Loan
Principal +
Interest Up-front cost
Energy services
+ guarantees
Performance-based fees
ESCO Building
owner
RET equipment
Installation
Financial
institution
Loan, lease or
forfaiting
Repayment or
cessions
Energy services
and guarantees
Performance-based fees

IEA-RETD / Business Models for Renewable Energy in the Built Environment 29
firmed the practical feasibility of the IEC model. Beyond that, it remains to be seen what contribution IEC will make as a tool for the implementation of sus-tainable energy projects. (Bleyl 2011) In order to support energy services in general, in the EU, a large number of countries propose or have implemented policies and supporting measures, such as information campaigns (Boonekamp et al., 2010). One of the drivers for such legislation is the EU Directive on Energy End Use and Energy Services (2006/32/EC). There seem to be no specific policies directly supporting specific energy-contracting models, such as ESC or EPC (Szomolanyiova et al., 2011). In Japan, the 2007 New Procurement Law for the Environment encourages au-thorities to procure ESCO services for public buildings (WBCDS, 2008). It is ex-pected that the policy context of a country does play an important role in the development of the energy services market. In Denmark for example, energy services are implemented because energy saving obligations for energy suppli-ers may only be implemented by third-party energy service companies. For the market development of EPC, a key enabling factor has been the in-volvement of independent 3rd party organisations, acting as market and project facilitators between potential customers and ESCOs. Often they are energy agencies (e.g. Grazer Energie Agentur8 or Berliner Energieagentur9), who de-velop concrete EPC projects, mostly on behalf of the client, prepare calls for proposals and model contracts and put them out on the market to bid for (EACI, 2011). In some parts of the world, so called public ‘Super ESCOs’ have been proposed or implemented, e.g. Energy Efficiency Services Limited in India, FEDESCO in Belgium or HEP ESCO in Croatia. The scope of their (planned) activities is ex-tremely broad and ranges from market and project facilitation for (potential) clients and ESCOs to acting as a full-fledged ESCO themselves. Moreover, these organisations may be tasked amongst others to solve financing bottlenecks and undertake general information campaigns (Limaye, 2011). The success of this broad concept remains to be seen. The portfolio of Super ESCOs may require a more focussed approach, particularly regarding market development and pro-ject facilitation activities.
8 See www.grazer-ea.at
9 See www.berliner-e-agentur.de

30 IEA-RETD / ECN-E--12-014
4.1.2 Energy Supply Contracting
Description Under an Energy Supply Contracting (ESC) model, an Energy Service Company supplies useful energy, such as electricity, hot water or steam to a building owner or building user (as opposed to final energy such as pellets or natural gas in a standard utility contract). The output is measured and verified in Megawatt hours delivered. ESC models run under long-term contracts of typically 10 to 15 years, depending on the technical lifetime of the equipment deployed. Extended project terms or building cost allowances allow including measures with longer payback times like facades with integrated PV modules or entire building shells as well. This business model gives the building owner the opportunity to outsource technical and economical risks associated with energy supply related activities, including the planning, installation, operation and maintenance and financing of equipment for heating, cooling or electricity generation to a professional party and to buy services instead of individual components. ESC often includes supply of final energy through the ESCO, however on its own accounts. The standard scope of services is limited to the energy supply side, e.g. the boiler room in the basement of a building but may very well include solar supply options or other RET as displayed in Figure 4.5.
Figure 4.5 ESC-model: Schematic standard scope of services including renewables
The ESCO’s remuneration is performance based and depends on the useful en-ergy output delivered. Thus the ESC model provides an incentive to increase ef-ficiency of the final energy conversion and to reduce primary energy demand. It guarantees for the outcome and all costs of the services and takes on the com-mercial as well as technical and operational risks of the project. ESC may accel-erate the uptake of RET, if RET are cost competitive over the lifecycle of the project because ESCOs have an inherent interest to reduce life-cycle costs.
Market Segments
ESC is applied in different end-use sectors such as housing, commerce, industry or public buildings. For the housing sector specifications of minimum project sizes to be economically viable exist: Eikmeier et.al. (2009) detail a thermal load of 100 kW as lower threshold based on a transaction cost analysis and empirical results from a market query. In a simple approximation this corresponds to an-nual energy cost of about € 20,000. Upper project sizes are not limited and may go up to 10 MW or more for large industrial installations and encompass supply of heat, steam, (back-up) electricity or compressed air.
Fuel
Energy Supply-
Contracting (ESC)
=> MWh
Meter
Boiler
Solar Supply-Contracting
(Solar ESC) => MWhSolar
Meter
Sou
rce:
aft
er [
Ble
yl 2
009]
© G
razer
Energ
ieag
entu
r G
mbH
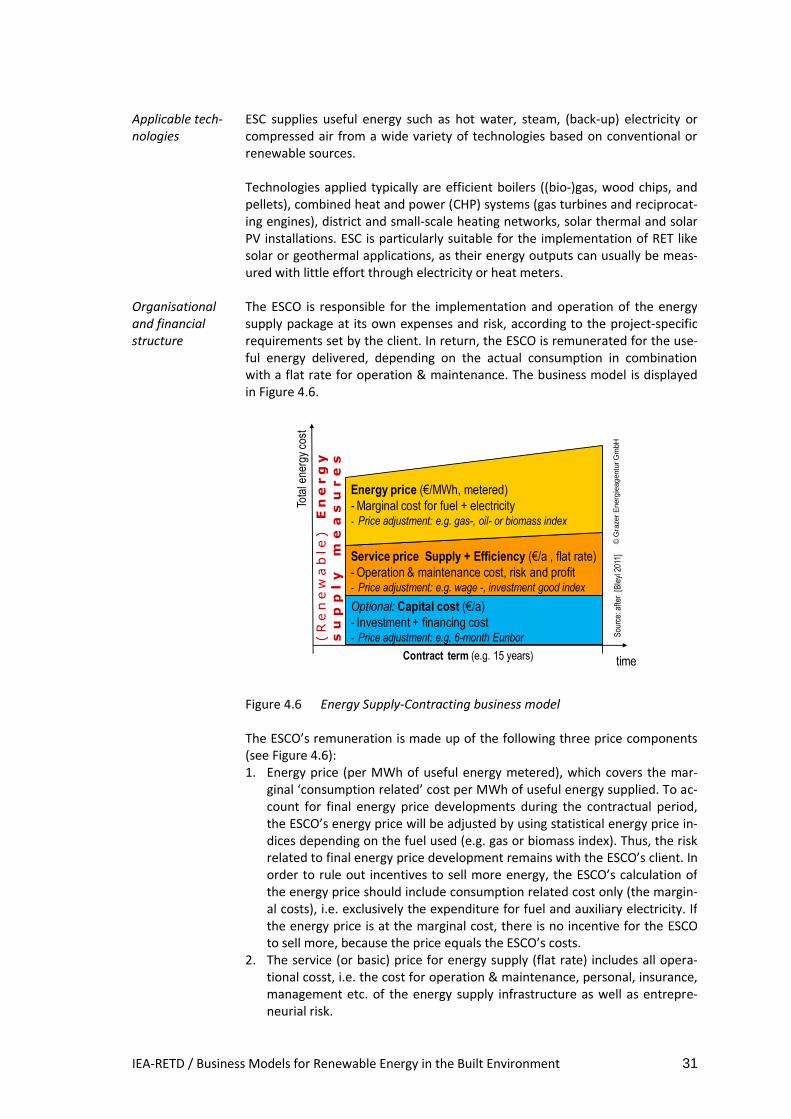
IEA-RETD / Business Models for Renewable Energy in the Built Environment 31
Applicable tech-nologies
ESC supplies useful energy such as hot water, steam, (back-up) electricity or compressed air from a wide variety of technologies based on conventional or renewable sources. Technologies applied typically are efficient boilers ((bio-)gas, wood chips, and pellets), combined heat and power (CHP) systems (gas turbines and reciprocat-ing engines), district and small-scale heating networks, solar thermal and solar PV installations. ESC is particularly suitable for the implementation of RET like solar or geothermal applications, as their energy outputs can usually be meas-ured with little effort through electricity or heat meters.
Organisational and financial structure
The ESCO is responsible for the implementation and operation of the energy supply package at its own expenses and risk, according to the project-specific requirements set by the client. In return, the ESCO is remunerated for the use-ful energy delivered, depending on the actual consumption in combination with a flat rate for operation & maintenance. The business model is displayed in Figure 4.6.
Figure 4.6 Energy Supply-Contracting business model The ESCO’s remuneration is made up of the following three price components (see Figure 4.6): 1. Energy price (per MWh of useful energy metered), which covers the mar-
ginal ‘consumption related’ cost per MWh of useful energy supplied. To ac-count for final energy price developments during the contractual period, the ESCO’s energy price will be adjusted by using statistical energy price in-dices depending on the fuel used (e.g. gas or biomass index). Thus, the risk related to final energy price development remains with the ESCO’s client. In order to rule out incentives to sell more energy, the ESCO’s calculation of the energy price should include consumption related cost only (the margin-al costs), i.e. exclusively the expenditure for fuel and auxiliary electricity. If the energy price is at the marginal cost, there is no incentive for the ESCO to sell more, because the price equals the ESCO’s costs.
2. The service (or basic) price for energy supply (flat rate) includes all opera-tional cosst, i.e. the cost for operation & maintenance, personal, insurance, management etc. of the energy supply infrastructure as well as entrepre-neurial risk.
Tota
l ene
rgy
cost
time
Energy price (€/MWh, metered)
- Marginal cost for fuel + electricity- Price adjustment: e.g. gas-, oil- or biomass index
Optional: Capital cost (€/a)
- Investment + financing cost- Price adjustment: e.g. 6-month Euribor
Contract term (e.g. 15 years)
Service price Supply + Efficiency (€/a , flat rate)
- Operation & maintenance cost, risk and profit- Price adjustment: e.g. wage -, investment good index
(Renewable)Energy
supplymeasures
Sou
rce:
aft
er [
Ble
yl 2
011]
© G
razer
Energ
ieag
entu
r G
mbH

32 IEA-RETD / ECN-E--12-014
During the contractual period, the prices are usually adjusted (typically eve-ry year retrospectively) by using statistical indices such as wage or invest-ment good indices. The service price for energy efficiency (flat rate) is de-termined in analogy to the above service price including all operational cost of the energy efficiency measures. As shown in Figure 4.6, the two basic prices can be combined.
3. If the ESCO (co)-finances the equipment its remuneration also includes a fee for its capital costs minus any subsidies for the RET equipment which it may have received.
In the above mentioned price components, all of the ESCO’s expenditure items for the defined scope of services throughout the contractual period must be included (‘all inclusive prices’).
Discussion and conclusions
The ESC model is a proven model to implement efficient supply from fossil and renewable sources in new and existing public, industrial, commercial and large residential sector buildings. It is effective in reducing final energy demand, be-cause the ESCO pays for the final energy needed and is remunerated for its useful energy output only. However, efficiency gains are usually limited to the energy supply system. The following are the main conclusions for the ESC model:
ESC is particularly suitable for the implementation of RET like solar or geo-thermal applications, because their energy outputs can usually be measured with little effort through electricity or heat meters. In comparison to the EPC model, ESC reduces the expenses for measurement and verification and the risks associated with the savings guarantee significantly,.
However, large demand-side energy efficiency potentials remain untapped, because the scope of services is limited to the provision of useful energy.
Transaction costs for ESC projects require a minimum project size, which can be expressed as a minimum energy cost baseline of about € 20,000. The ESC model is thus not suitable for individual or small multi-family houses.
In order to rule out incentives to sell more energy, the energy price compo-nent should be set at marginal cost. This implies that the ESCO’s calculation of the energy price should include variable cost only, i.e. exclusively the ex-penditure for fuel and auxiliary electricity. If the energy price is at marginal cost, there is no incentive for the ESCO to sell more energy, because the price equals its cost.
No energy cost baseline is needed for the business model to work. If desired by the building owner, savings achieved can still be calculated by comparing to a historic or calculated baseline.

IEA-RETD / Business Models for Renewable Energy in the Built Environment 33
4.1.3 Energy Performance Contracting
Description Under an Energy Performance-Contracting (EPC) business model, an Energy Service Company guarantees energy cost savings (also labelled as ‘Negawatt-hours’) in comparison to a historical (or calculated) energy cost baseline. For its services and the savings guarantee the ESCO receives performance-based re-muneration in relation to the savings it achieves. Generally, savings achieved can only be measured indirectly as difference be-tween consumption before and after implementation of the EE and RE measures (relative measurement: savings = baseline - ex post-consumption) (for more details please refer to the section ‘organisational and financial struc-ture’). The standard scope of services encompasses the entire building as displayed in Figure 4.7. RET may play a role but with most EPC projects the main focus is on the implementation of energy conservation measures.
Figure 4.7 EPC-model: Schematic standard scope of services
EPC models run under long-term contracts of typically ten years, depending on the payback time of the energy savings measures and the specification of the building owner.
Market Segments
The market for EPC projects is currently largely limited to public institutions at a federal, state and regional levels including special purpose buildings like uni-versities, hospitals and leisure facilities. In Germany, for example, projects are spread very unevenly. EPC projects are found particularly in cities or regions where independent market and project facilitators such as energy agencies en-gage on behalf of buildings owners in preparing concrete projects and putting them out on the market for ESCOs to bid for. One example such example is the Berlin Energy Saving Partnership described in Appendix A.12. US market data show a similar picture: 84% of ESCOs’ revenues from EPC projects stem from public institutions, consisting of federal buildings and so called ‘MUSH’ markets (municipal and state governments, universities and colleges, K-12 schools and hospitals) (Satchwell et al 2010). Transaction and measurement and verification costs of EPC projects are high.

34 IEA-RETD / ECN-E--12-014
As a consequence the EPC market is dominated by large projects. A minimum energy cost baselines can be set at 100,000 €/a, but realized projects are typi-cally an order of magnitude above. The 24 pools of buildings of the Berlin ‘En-ergy Saving Partnership’ - one of the most successful EPC campaigns in Europe - have for example an average energy cost baseline of € 1,88 million/year (ESP Berlin 2009; see also Appendix A.12).
Applicable technologies
An EPC contract may feature savings for all energy carriers such as electricity, gas or water. Typical measures are energy management and controls, HVAC-technologies like air conditioning systems, hydraulic adjustment of distribution networks or lighting. Sometimes an exchange of boilers or adjustment of dis-trict heating connections is also undertaken. In addition, the scope of services frequently also includes influencing the behaviour of building occupants through information campaigns and incentive programmes. Indications for the potential for energy efficiency improvements that may be unlocked through EPC contracts can be derived from realized, large scale EPC projects: The ‘Energiesparpartnerschaft’ in Berlin and the ‘Federal Contracting Campaign’ in Austria for example both report savings between 20 and 25% (ESP Berlin 2009; BundESCOntracting 2009).
Organisational and financial structure
The ESCO is responsible for the implementation and operation of the energy efficiency package at its own expenses and risk, according to the project specif-ic requirements defined by the client and the ESCO. Purchasing of final energy (electricity, fuels) mostly remains with the building owner. The standard busi-ness model scheme is displayed in Figure 4.8.
Figure 4.8 Energy Performance-Contracting business model
The ESCO’s remuneration in an EPC model is often labelled as ‘Contracting rate’. It is usually calculated as a percentage of the savings achieved through the EE and RE measures. In case of underachievement the ESCO needs to com-pensate for the losses, but it will receive an additional remuneration in case of overachieving the savings guarantee. After the end of the contract term, the facility owner benefits from the full en-ergy cost savings, but all operation and maintenance expenses are on his ac-counts.
Contracting rate to ESCo for:• Implementation of EE-measures• operation & maintenance• prefinancing of investment• taking over risks
EPC contract Contractends
Service life of investment
Cost after EE-measures Total energy cost building owner (after EE-measures)
•...
Present cost = baseline
Present state
Total energy cost
time
Present total
energy cost for:
• fuel;
•electricity;
•maintenance;
• repair (substitute
investment);
•personnel;
•other
Accounting adjustments (yearly) for:
• energy price (reference prices from baseline)
• climate (outer temperature by # of “degree days”)
• changes in utilization of facility
Cost savings
for facility owner
Sou
rce:
aft
er [
Ble
yl+
Sch
inne
rl 2
008]
© G
razer
Energ
ieag
entu
r G
mbH
EE(+RE)-Measures

IEA-RETD / Business Models for Renewable Energy in the Built Environment 35
The contracting rate needs to cover all expenses of the ESCO for the defined scope of services throughout the contractual period (‘all inclusive prices’). Typi-cally this includes the implementation of the measures, their operation & maintenance, pre-financing of the investment and taking over risks according to the project specifications defined in the contract. If the ESCO (co)-finances the equipment, the remuneration must also cover capital costs. When measuring savings through a comparison between a baseline and post-retrofit energy costs, two major difficulties may occur:
The baseline itself may be difficult to determine with enough accuracy due to a lack of availability of historic data (e.g. from bills or meters).
The determined energy cost baseline is not a constant but subject to chang-es in climate conditions (e.g. ambient temperatures, solar radiation etc.) and in energy prices. Besides, utilization of the building may change. These changes need to be taken into account when calculating energy cost savings. Especially the changes in utilization may cause considerable difficulties for the ESCO and the facility owner in adjusting the baseline.
In addition to the resources necessary (high transaction and operational costs), the baseline determination and adjustment can cause a considerable degree of insecurity and monetary risks for the (prospective) project partners. Determin-ing and adjusting the baseline is a crucial issue in the EPC business model and needs to be undertaken for all performance based billing periods over the en-tire contract term. The aforementioned difficulties and risks underline the ne-cessity for a clearly defined measurement and verification plan for each EPC project (see. e.g. IPMVP 2009).
Discussion and conclusions
The following are the main conclusions for the EPC ESCO model:
EPC provides a comprehensive approach to end-use efficiency improve-ments. RET may play a small role.
With a market share of about 10 % of the ESCO market, the market uptake of EPC is significantly lower than for ESC. The market is mainly limited to the public sector and special purpose buildings such hospitals, swimming facili-ties or universities.
Today the EPC model is applied for large projects only, with minimum ener-gy cost baselines of € 100,000 per year and markedly above, among other reasons because transaction as well as measurement and verification cost of EPC projects are high.
Determining, measuring and verifying a baseline and the appraisal of risks and costs of the savings guarantee hinder a more widespread market up-take. There is a widespread expectation that EPC projects must be com-pletely re-financed from future energy cost savings only and in addition cre-ate immediate cost savings. This achievable only for projects with very high savings potentials and short payback periods, thus severely limiting the ap-plication of EPC as an energy efficiency tool.
The initiation of policy supported implementation programs such as the Federal Energy Management Program (FEMP) in the US, the Berlin Energy Saving Partnership (see Appendix A.12) or the Federal Contracting Campaign (BundESCOntracting) in Austria are an important enabling factor for the growth of EPC projects. As a consequence, higher market penetrations are particularly observed where independent market facilitators such as energy agencies engage on behalf of building owners in preparing concrete projects and putting them on the market for ESCOs to bid for.
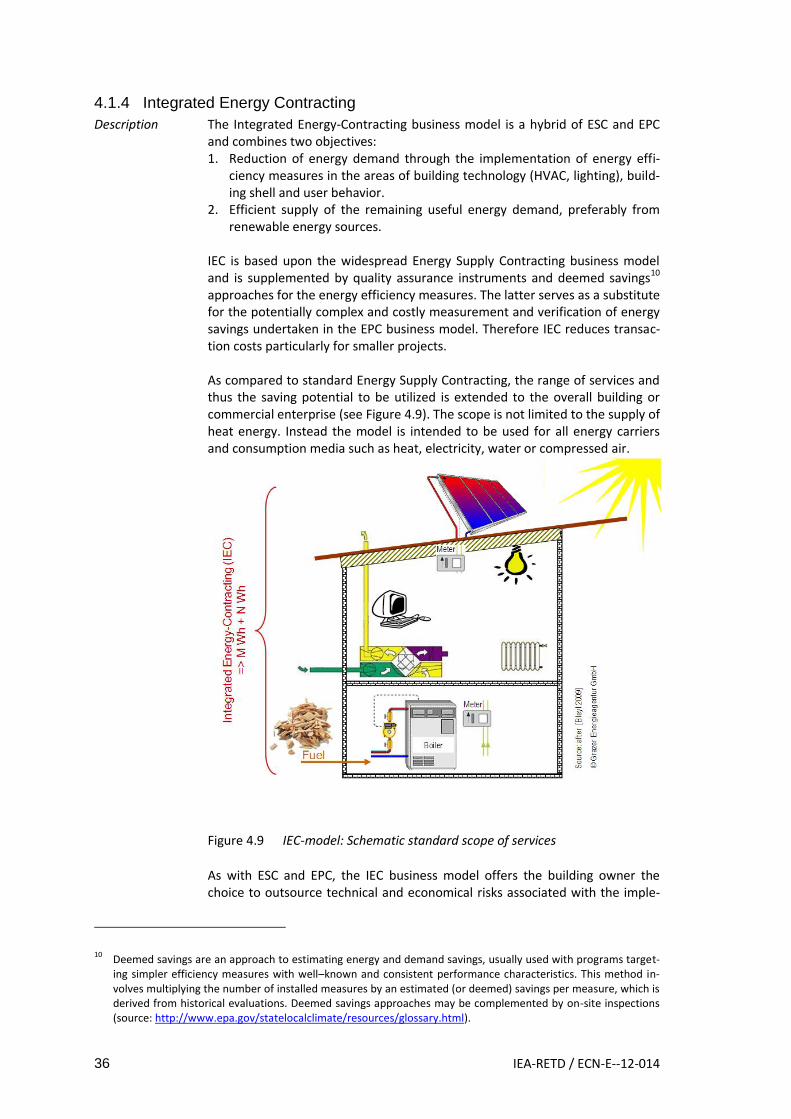
36 IEA-RETD / ECN-E--12-014
4.1.4 Integrated Energy Contracting
Description The Integrated Energy-Contracting business model is a hybrid of ESC and EPC and combines two objectives: 1. Reduction of energy demand through the implementation of energy effi-
ciency measures in the areas of building technology (HVAC, lighting), build-ing shell and user behavior.
2. Efficient supply of the remaining useful energy demand, preferably from renewable energy sources.
IEC is based upon the widespread Energy Supply Contracting business model and is supplemented by quality assurance instruments and deemed savings10 approaches for the energy efficiency measures. The latter serves as a substitute for the potentially complex and costly measurement and verification of energy savings undertaken in the EPC business model. Therefore IEC reduces transac-tion costs particularly for smaller projects. As compared to standard Energy Supply Contracting, the range of services and thus the saving potential to be utilized is extended to the overall building or commercial enterprise (see Figure 4.9). The scope is not limited to the supply of heat energy. Instead the model is intended to be used for all energy carriers and consumption media such as heat, electricity, water or compressed air.
Figure 4.9 IEC-model: Schematic standard scope of services
As with ESC and EPC, the IEC business model offers the building owner the choice to outsource technical and economical risks associated with the imple-
10
Deemed savings are an approach to estimating energy and demand savings, usually used with programs target-ing simpler efficiency measures with well–known and consistent performance characteristics. This method in-volves multiplying the number of installed measures by an estimated (or deemed) savings per measure, which is derived from historical evaluations. Deemed savings approaches may be complemented by on-site inspections (source: http://www.epa.gov/statelocalclimate/resources/glossary.html).

IEA-RETD / Business Models for Renewable Energy in the Built Environment 37
mentation of RET and EE measures to a professional third party and to buy ser-vices instead of individual components. IEC may turn out to be particularly suit-able to combine supply from renewable sources with energy conservation measures and thus accelerate the uptake of RET, provided RET are cost com-petitive over the lifecycle of the project because ESCOs have an inherent inter-est to reduce life-cycle costs.
Market Segments
Since IEC builds on the ESC model, a similarly wide range of end-use sectors such as commercial and public buildings as well as the residential sector can be targeted. For more details please refer to the ESC model description.
Applicable technologies
IEC combines energy efficiency and RET measures. All technologies listed in the ESC and EPC business model descriptions are applicable.
Organisational and financial structure
The ESCO is responsible for the implementation and operation of the energy efficiency package at its own expenses and risk, according to the project specif-ic requirements defined by the client and the ESCO. Purchasing of final energy (electricity, fuels) mostly remains with the building owner. The standard busi-ness model scheme is displayed in Figure 4.10.
Figure 4.10 Integrated Energy-Contracting business model
Basically the IEC business model builds on the ESC with similar price compo-nents and is supplemented with a flat rate price for the energy efficiency measures. To avoid or at least to reduce the (potential) EPC problems, the sup-posedly exact measurement and verification of the actual savings under an EPC approach is replaced by quality assurance and simplified measurement and ver-ification procedures (e.g. deemed savings). The individual quality assurance instruments (QAIs) for the installed EE measures secure the functionality and performance of the measures, but not their exact quantitative outcome over the entire project cycle. The objective is to simplify the business model and to reduce (transaction) cost by balancing measurement and verification cost and accuracy. Appropriate QAI’s need to be defined for each EE measure, e.g. a one-time performance measurement for a new street lighting or a one-time thermographic analysis for verifying the quali-ty of a refurbished building shell. These QAIs replace the annual measurement and verification of the EPC savings guarantee.
Contract term time
EPC, Controlling of detailed planing
Commissioning, Thermographic analyses
Energy book keeping
Performance measurement
Quality assurance for energy
efficiency measures (Examples):
Coaching + inspection of construction
Proof of user motivation
Annaul audits with
improvement propsals
En
erg
yef
fici
ency
+s
up
ply
me
as
ure
s
Contract term (e.g. 15 years) time
Optional: Capital cost (or in-house financing) (€/a)
Tota
l ene
rgy
cost
Service price Efficiency + Energy Supply (€/a)
Energy price (€/MWh)
Sou
rce:
aft
er [
Ble
yl 2
011]
© G
razer
Energ
ieag
entu
r G
mbH

38 IEA-RETD / ECN-E--12-014
Discussion and conclusions
The IEC business model builds on the Energy Supply Contracting (ESC) model, which is known and applied in public, residential, commercial and industrial buildings. The scope of services and thus energy savings potential is extended to the overall building or enterprise and to all consumption media, such as heat, electricity and water. At the same time methodological problems of Ener-gy Performance Contracting (EPC) as mentioned earlier, e.g. related to creating and adapting baselines, are avoided or at least reduced, e.g. by avoiding the need for a baseline and its adaption in the course of the project. The following are the main conclusions for the IEC ESCO model:
IEC allows for combining energy savings and supply of energy in an integrat-ed approach. Therefore, in comparison to standard ESC, higher end-use en-ergy saving potentials can be achieved. Moreover, RET may play a key role.
IEC is an innovative model. Practical experiences are still limited, but 8 pilot projects in Austria have proven the feasibility of the model (see case study LIG, Austria in Appendix A.1) Some experienced ESCOs have expressed in-terest in developing own products based on the IEC model.
For additional conclusions, please refer to the ESC model.
4.1.5 SWOT Analysis, Discussion and Conclusions for all three ESCO Models
SWOT Analysis
This analysis summarizes important findings for the deployment of RET and EE measures. If not mentioned otherwise, the analysis mainly takes the building owner’s perspective. Most implications concern ESCO business models in gen-eral, otherwise they are marked with the respective EC-model acronyms.
Strengths For the building owner
ESCOs will invest into RET and EE measures, if they are cost-competitive over the contract term, because the ESCO has an intrinsic incentive to re-duce life-cycle costs.
Building owners pay for outputs and results (services) instead of inputs and components (e.g. technology). Thus technical as well as financial and opera-tional risks can be outsourced to an ESCO and the building owner can re-quest guarantees for the total cost and overall performance of the energy service package.
Energy Contracting models can facilitate access to capital to overcome high up-front cost of RE and EE investments. Some ESCOs provide financing themselves, but frequently ESCOs are capital-constrained but may still take the role of facilitator for third party financing solutions.
EC is a modular and customized service package according to the specifica-tions of the building owner.
Outsourcing the responsibility for energy related services to an experienced actor may reduce information barriers, up-front cost and access to capital (if the ESCO (co)-finances the equipment or facilitates financing) and the ‘has-sle factor’ for the building owner.
ESC and IEC are particularly suitable for RET, because their energy outputs can be measured directly without needing a baseline. Thus, in comparison to the EPC model, the expenses for measurement and verification and the risks associated with the savings guarantee are significantly reduced.

IEA-RETD / Business Models for Renewable Energy in the Built Environment 39
General
EC projects are market-based with relatively little dependence on support-ing policy measures. RET and EE measures in one building as well as several buildings can be packaged in order to reduce transaction cost. In this pack-age or building pool, ‘low hanging fruits’ may support higher hanging ones like RET to make the whole package economically feasible.
Optimization of life-cycle costs in an Energy Contracting model may lead to deployment of RET and EE measures which may not be undertaken by the building owner alone. ESCOs may lift several barriers like separate budgets for investment and operation, lack of financial and human resources, and knowledge of available incentive schemes.
Weaknesses Energy Contracting is limited to cost-effective measures. But subsidy schemes can be integrated in the models either through the building owner or the ESCO.
If the ESCO is responsible for investing in equipment with long pay back times, long contracting periods are required which result in mutual long-term dependencies and require a long-term business perspective of the ESCO and the client. For premature contract termination, buy out clauses can be agreed in the contract.
ESCO projects require minimum project sizes, which can be expressed in minimum annual energy cost baselines. Today the EPC model is applied for large projects only with minimum energy cost baselines of € 100,000 per year and markedly above. For ESC minimum energy costs are about 20,000 €/year.
ESC: The scope of services of an ESC scheme is limited to the energy supply. ESC does not maximize the full potential for energy efficiency improvements and CO2 reductions in the building.
EC-models are complex. They cover the entire project life cycle in one con-tract and require technical, economical, financial, legal and organisational know-how. In this context the role of independent market and project facili-tators has proven to be key to overcome the challenges related to the com-plexity, particularly for EPC projects.
Opportunities ESC and IEC are suitable for smaller projects (in comparison to EPC), and
thus have a larger market potential. The ESC-model is known and applied in residential and commercial housing and industry in addition to public build-ings.
In many countries around the world, ESCO markets are growing as building owners realise the added value of outsourcing activities related to sustaina-ble energy.
Supportive policy measures, for example energy saving obligations for ener-gy suppliers, are expected to lead to a growth of the market for energy ser-vices.
With rising fossil fuel prices, RET and EE measures deployed by ESCOs be-come more attractive.
Threats ESCO business models depend on the willingness of a building owner to out-source comprehensive service packages. Outsourcing may threaten existing jobs, organisational routines and even question the performance of individ-uals previously responsible for sustainable energy agendas. Consequently ESCO models may face opposition from existing personnel of building own-ers, because changes in competences, organisational and procurement rou-tines are required.

40 IEA-RETD / ECN-E--12-014
Hiring sufficiently qualified personal with interdisciplinary skills may be a barrier for ESCO development.
Although EC-models are a market based instrument, some (legislative) policy support is required to solve existing barriers, e.g. by - Allowing public entities to conclude multi-year contracts with ESCOs,
which do not count against public deficit limits, - Addressing the barrier of ‘split incentives’ between building owners and
renters/occupants. This applies particularly to the residential but to a lesser extent also to the commercial building sector.
- Allowing life-cycle cost optimization across separate investment and op-erational budgets. This is a key barrier which for private and public or-ganisations.
Figure 4.11 Energy-Contracting models: summary of SWOT analysis
Discussion and conclusions for all ESCO models
The EC service concept shifts the focus of energy supply and management from buying or selling units of final energy (like fuel oil, gas or electricity) towards the desired benefits and services derived from the use of the energy carrier (e.g. keeping a room warm, air-conditioned or lit).11 EC is an instrument to min-imize life- or project-cycle cost, which takes the operation of the building into account. As the ESCO’s remuneration depends on the output of the services provided and not the inputs (like fuel or man-hours) consumed, the concept induces an intrinsic interest for the ESCO to increase efficiency and to reduce final energy demand. For building owners, Energy Contracting models offer the opportunity to out-source activities related to (sustainable) energy, including the planning, instal-
11
Thus Energy Contracting can be considered a tool for moving towards a thinking of ‘economics of stock’. ‘Eco-nomics of stock’ imply major long-term investments in facilities to produce and deliver fuels and electricity, with concomitant long-term finances and contracts, business relationships and risks (Patterson, 2010).
Strengths
•Proven and market based model
•Performance based payments provide incentives to maximise efficiency
• Reduces 'hassle factor' for building owner by outsourcing risks, guarantees for all-inclusive costs, and modular service package
Weaknesses
•Limited to cost-effective measures
•Long contracting periods and minimum project sizes required
•ESC is limited to energy supply, does not maximize the full EE potential in a building
Opportunities
•Expected growth of ESCo markets with increased awareness of the benefits of Energy Contracting,
•Increasing cost competitiveness of RET,
•Regulatory support and increased engagement by public building owners.
Threats
•Willingness of building owners and existing personnel to outsource service package to an ESCo
•Complex contracts covering entire project cycle
•Separate investment and operational budgets of building owners
•Split incentives

IEA-RETD / Business Models for Renewable Energy in the Built Environment 41
lation, operation and maintenance, and financing of equipment for heating, cooling or electricity generation to a professional third party. EC reduces the need for internal capacity to deal with these issues and for managing a variety of different suppliers and interfaces, thus allowing building owners to concen-trate on their core business. However, building owners still need a certain un-derstanding of energy related issues in order to negotiate contract conditions and supervise the ESCO. The next figure summarizes the two basic ESCO business models along the val-ue chain form primary energy to energy services. The figure also shows stand-ard products and services offered under the different business models.
Figure 4.12 Value chain from primary energy to energy services12 ESCO models are well replicable, but they do require specialist knowledge to operate the business model. In general, the ESCO implementing the scheme will have a much better knowledge of available RET, their characteristics, rele-vant suppliers, and available incentive and financing schemes than a building owner. Therefore one of the major advantages is that the ESCOs is more likely to take advantage of opportunities for the deployment of RET, leading to an in-crease in deployment. Such opportunities will increase with increasing compet-itiveness of RET versus conventional technologies and if additional incentive schemes are implemented. The following main conclusions are applicable to all Energy-Contracting models covered in this report:
ESCO models have an intrinsic incentive to minimize life respectively project cycle cost over the entire contract term of typically 10 to 15 years. In the ESCO’s price, all expenditure items for the defined scope of services throughout the contractual period must be included (‘all-inclusive prices’).
When comparing between outsourcing to an ESCO versus in-house imple-mentation, the functional performance and price guarantees provided by the ESCO and the assumption of technical and economic risks through the
12
Note that there are also energy suppliers that offer some energy services (see e.g. example in Box 5.1) but with-out the performance guarantee offered by an ESCO. These situations are not depicted in the graph.
ENERGY
PERFORMANCE
CONTRACTING
(EPC)
=> NWh
e.g. climatized rooms:
Energy management,
controls, HVAC,
efficient lighting,
peak load management,
thermal insulation,
user motivaton
…
Energy savings
service
ENERGY
SUPPLY
CONTRACTING
(ESC)
=> MWh
Heat, steam, cooling,
compressed air …,
CHP plants,
Renewables, e.g.
solar systems ...
+ EE-measures?
…
Useful energy
service
Standard
ENERGY
SUPPLIER
(UTILITY)
Secondary/
final energy
Primary
energy
Heating oil,
electricity,
district heating,
biomass,
…
Crude oil,
natural gas,
coal,
…
Bu
sin
es
s
mo
de
lsT
yp
ica
l pro
du
cts
& m
ea
su
res
Va
lue
ch
ain
e
Source: after [Bleyl+Schinnerl 2008]

42 IEA-RETD / ECN-E--12-014
ESCO may constitute an added value for the client and should be taken into account in addition to the comparison of total costs of different options.
For ESCO models, different options for financing the RE and EE equipment are feasible. The financing structure should be chosen depending on oppor-tunities for access to capital and risk preferences of the involved actors and the specifications of the project. Often, a mixture of financing sources is the best choice to balance risks, where ESCOs are used as a vehicle and facilita-tor for third party financing, but not necessarily as financiers themselves.
ESCO business models cannot substitute the client’s basic decision to im-plement RET and EE measures. This decision remains a prerequisite for the success of ESCOs.
The decision to outsource energy services can only be taken by building owners. For the public housing stock, however, governments have the op-portunity to directly support Energy Contracting business models. This can be done by changing public procurement rules to allow or require decision makers in public buildings, including housing corporations, to procure equipment according to lowest life- or project cycle cost (net present value), and by allowing them to enter into long-term contracts with an ESCO.
Compared to other Energy Services models, in particular Energy Perfor-mance Contracting (EPC), ESC is particularly well suited for generating elec-tricity and heat from RET, as the output of Megawatt hours delivered can be measured relatively easy, thus reducing measurement and verification cost in comparison to the EPC model.
Long-term experience with different ESCO markets shows that the develop-ment of comprehensive energy (RET and EE) projects is strongly supported by facilitators with a sufficient time horizon to raise awareness and commitment with stakeholders. Independent of the ESCO business model, the decision (vol-untary or driven by regulation) of the building owner to invest in RET / EE measures remains a basic requirement for the involvement of an ESCO. Fur-thermore, ESCOs are not able to address the barrier of the fragmented nature of the building sector which leads to a large number of small units of energy saving potentials. However, there may be significant potential for companies, e.g. individual installers or groups of them, in offering less extensive energy services to individual households.

IEA-RETD / Business Models for Renewable Energy in the Built Environment 43
4.2 Business models based on new revenue models
4.2.1 Making use of a feed-in remuneration scheme
Description A feed-in scheme is a policy by which the producer of renewable energy re-ceives a direct payment per unit of energy produced. This feed-in remuneration can be a tariff, which like a preferential price covers the full generating costs, or it can be a premium, which provides a ‘bonus’ for the producer to cover the fi-nancial gap between the generation costs of using renewable energy versus us-ing conventional (fossil) energy. A feed-in scheme guarantees access to a pre-dictable and long-term revenue stream, which can serve as a stable basis for a business model. Feed-in schemes have been used by companies and investors as a basis for business models for large scale power production (e.g. wind parks or biomass plants), as well as by households and small and medium enterprises who want to generate their own energy using renewable sources (e.g. solar-PV or bio-mass heating). Such business models by households or SMEs can focus on pro-duction for own use, or for the sale of energy to the grid (see case study ‘Greenchoice’ in Appendix A.5) (or for heat to a nearby user). Feed-in schemes typically differentiate in categories by size of the installation, technology and fuel used. The level of remuneration is based on the category specific genera-tion costs, but the actual payment is based on production (Gifford et al., 2011).
Market segments Feed-in based business models are applicable for all market segments: new and
existing buildings, public, commercial/industrial and residential buildings. No-tably, in the domestic building segment, a feed-in scheme may provide oppor-tunities for entrepreneurs who use demand aggregation (e.g. through district heating or by providing energy services to groups of customers). Which market segments are eligible for feed-in support, and therefore can be part of a busi-ness model depends on the policy specifics in the country or region.
Applicable technologies
In principle, feed-in schemes, and associated business models, can be designed for all technologies that generate heat or power (or both). In practice, the tariff or premium is based on the estimated generation costs over the lifetime of the installation, which makes it most suitable for technologies that are available off-the-shelf, e.g. solar PV for electricity generation or heat pumps for heat production, and less so for innovative (and diverse) or unique technologies. Some schemes primarily cover electricity production and an additional ‘bonus’ is made available if associated heat is put to productive use.
Actors The two main actors in a feed-in scheme are the institution that makes the payment available (government, network operator) and the recipient (home owner, building manager, or energy service company). The actual payment can be executed through a government agency, the energy supplier, or through the network operator. Payment in many instances is based on certificates, or ‘guarantees of origin’, in which case a government agency or certified third par-ty company will be involved in verifying production and issuing certificates. If tariff levels are based on category specific generation costs, an (independent) institute may be involved in advising government on costs.
Organisational and financial structure
A feed-in scheme is a policy, and the tariffs (and budgets) are therefore fixed by the government. The cost of this support is either recovered from the govern-ment budget (i.e. from tax payers), or from a network operator mark-up on en-ergy bill (i.e. from energy consumers, as is the case for the German scheme).

44 IEA-RETD / ECN-E--12-014
In addition to the tariff scheme, in which the producer gets a fixed price for the supply of energy, and the premium scheme, in which the producer gets a pre-mium in addition to income from selling the energy on the market, hybrid forms are also possible. In these, the premium is chosen to complement the in-come from the market, to jointly cover the generation costs. So, in practice, the producer gets a fixed amount, but from two different sources. This hybrid form is similar to a feed-in tariff for the investor, but it has different consequences for government expenses. A feed-in scheme typically publishes rates per energy unit for eligible produc-tion (e.g. in €/GJ or €/kWh). If a producer is eligible, a contract (or agreement) can be obtained from the government which allows the producer to claim the specific tariff (or premium) for every unit produced. This agreement fixes the conditions and levels of the tariff, typically 8-20 years depending on the tech-nology. So once an agreement is entered into, this is virtually risk free if the government is considered to be trustworthy. Some feed-in schemes only cover energy that is delivered to the grid, whereas other schemes also cover auto-production (using generated energy for own purposes). ‘Net-metering’ electricity producers that use (part of) the production for own consumption can use so-called ‘smart meters’. A smart meter keeps track of the electricity supplied to the grid and the electricity taken from the grid. The owner of the smart meter will need to settle the net demand and supply from and to the grid (consumption and production may not coincide in time) and thereby level out the energy bill. This has an advantage, since the buying price of energy (which may include taxes) is usually higher than the selling price. For example, an individual who has a solar-PV installation will weigh the costs of his installation against the kWh he no longer needs to buy (e.g. 20 ct/kWh), while a grid-supplier needs to calculate with the selling price (e.g. 5 ct/kWh). Thus, for individuals who produce their own electricity, the financial ‘break even’ point is closer than for grid-suppliers. Note that foregone taxes are effectively an addi-tional subsidy for auto-producers. Moreover, net-metering may require an ad-justment of legislation. Smart meters may or may not be used in conjunction with a feed-in scheme. To avoid operational overhead for the government, feed-in schemes do not look at specific projects and real costs, but instead use cost estimates per cate-gory. As a result, within a category some initiatives may be economically viable whereas others are not. To build a viable business model based on a feed-in scheme, the investor thus has to undertake a careful assessment of the project economics taking into consideration e.g. climate conditions for solar PV or heat pumps, technology costs, and fuel prices, e.g. prices of biomass for a biomass boiler. The main advantage of a feed-in based business model is that it has a predicta-ble and stable long-term cash flow from a credit-worthy counterpart (Glifford et al., 2011). Investors may combine the use of a feed-in scheme with other available support mechanisms such as soft loans or fiscal incentives to improve the financing conditions. Many RE technologies require high up-front investments and when this is poses a barrier for investors, a part of the feed-in tariff may be made available as in-vestment subsidy.

IEA-RETD / Business Models for Renewable Energy in the Built Environment 45
The financial structure of a feed-in based business model differs between initia-tives that 1) produce more energy than needed for own consumption, and ini-tiatives that will 2) need to buy additional energy from the market. The two sit-uations below are simplified examples to indicate where the energy and mone-tary streams flow under a tariff and a premium situation, and under production below and above own use.
Network operator Building owner
Energy market
(certificates)
Feed-in Tariff
RETequipment
Energyown use
(smart meter)Energysupply
Figure 4.13 Schematic depiction of a business model based on a feed-in tariff and production exceeding own use, smart meter optional
Figure 4.13 shows how a building owner generates renewable energy, first for own use and the excess is supplied to the grid. In a feed-in tariff situation, the building owner gets a fixed tariff for the electricity injected to the grid, i.e. sup-plied to the network operator (i.e. energy does not enter the market). Note that the use of certificates and the use of a smart meter are optional.
Government Building owner
Energy market
Ener
gyD
eman
d
Ener
gy
cost
s
(certificates)
Feed-in premium
RETequipment
Energyown use
(smart meter)
Figure 4.14 Schematic depiction of a business model based on a feed-in premium and production less than own use, smart meter optional
Figure 4.14 shows how a building owner generates renewable energy, but needs to purchase additional energy from the market to meet total demand. Note that the premium is based on certificates from the production side, and the use of a smart meter, which is still possible. The basic concept of a feed-in scheme is standard, but the implementation can vary on, inter alia, the following parameters:
Choice of categories by technology, size and use: how narrowly (or broadly)

46 IEA-RETD / ECN-E--12-014
defined are the eligible technologies? Do categories differentiate by size, and take economies of scale into account?
Volume and price limitations: is there a maximum (annual) budget beyond which feed-in contracts are no longer issued, and in case of a variable pre-mium (such as in the Dutch SDE scheme) are there limits to the remunera-tion that the producer can claim?
Duration: what is the duration of the guaranteed feed-in period, and how does it relate to the economic and technical lifetime of the installation?
Legal issues and requirements: Can a feed-in contract be passed on to a new owner of the installation, and under which conditions?
Existing markets and policy context
Feed-in schemes are currently the most commonly used incentive tools for re-newable energy production worldwide. The German EEG has been among the most well-known and effective feed-in schemes and this success can be largely attributed to its policy stability (Lensink et al., 2007). Other notable feed-in schemes that are relevant (but not necessarily limited) to the built environment include the Dutch MEP/SDE (AgentschapNL, 2011), the German MAP pro-gramme (BMU, 2011, and (part of) the UK Low-carbon buildings programme. There is a lot of experience with feed-in schemes for electricity, but little for heat. The UK Renewable Heat Incentive (RHI) is the first scheme for renewable heat (DECC, 2011).
Feed-in tariffs have been the driving force behind the uptake of solar-PV in the buildings sector in recent years.
SWOT Analysis
Strengths For the building owner / investor
A feed in tariff can cover the financial gap between the generation costs of using renewable energy versus using conventional (fossil) energy
A feed-in agreement assures the producer of a predictable long-term source of income from a usually reliable counterpart (government or network oper-ator), for the duration of typically 8-20 years. This can significantly reduce the financial risk of the project.
Feed-in schemes are generally transparent and relatively simple, although the number of categories and eligibility criteria may grow over time.
There is an incentive for entrepreneurs to find low cost projects, that ‘out-perform’ the benchmark on which the category is based, e.g. at locations with very favourable climatic conditions or if the entrepreneur has access to comparably cheap supply of biomass. The scheme thus leaves room for prof-it by ‘smart’ entrepreneurs with an above average business case.
For government
A feed-in tariff can differentiate to meet the (cost recovery) needs of specific categories and actors.
Weaknesses Tariffs are based on cost estimates at a certain moment before payment. The actual implementation of an initiative that applies for the tariff can be up to years later. If in that time the real costs have increased, the rates are too low to make a solid business case. This is a risk for the producer in the project development stage. If real costs have decreased, the feed-in scheme allows for windfall profit for investors, decreasing the scheme’s cost-effectiveness and potentially leading to political opposition.
The administrative costs of metering may be significant compared to the

IEA-RETD / Business Models for Renewable Energy in the Built Environment 47
total income from the feed-in scheme. This is especially the case for meter-ing renewable heat production, because additional heat metering is need-ed that is more expensive then electricity metering. Solutions to this in-clude using proxies and estimates, and using smart meters.
Opportunities Because of the ability to differentiate, government can use feed-in tariffs to
support specific technologies or markets with the aim of technology learning or market creation. Practical examples of a boost in market development in-clude the solar industry, which developed strongly in recent years backed by consistent (feed-in) support from countries such as Germany and Spain.
Feed-in schemes can provide a basis for developing an energy service com-pany (ESCO), where the owner of a property outsources installation and op-eration to the ESCO, as well as the claim to the feed-in support. Thus feed-in schemes can potentially drive the deployment of RET in ESCO models.
Threats The uptake of available feed-in schemes may be hindered by the fact that individual property owners may favour shorter payback times than feed-in schemes provide (typically 8-20 years). The property owners may conse-quently favour direct investment subsidies over longer term compensation and may not make use of an available feed-in scheme.
Budgets and tariffs per category are subject to policy (and political) decision making, which may lead to a certain level of unpredictability for suppliers and the installation sector. In years with low or even insufficient tariffs or budgets, the market may experience a sharp decline in demand.
A successful feed-in tariff scheme may come at a price. Depending on the way it is financed, it either puts an increased burden on the energy consum-ers or, in case of government funding, it may require significant use of public funds.
Figure 4.15 Business model based on feed-in remuneration - summary of the
SWOT analysis
Strengths
• Cover additional costs of RE
• Provides predictable long-term income for (existing) investors
•Transparent and simple
•Differentiates between technologies and actors
•Provides incentive for 'smart' entrepreneurs
Weaknesses
• Tariffs may deviate from actual costs over time
• Administrative costs for small producers may be high
• Feed-in schemes are based on long payback times
Opportunities
• Can help boost development of specific markets and technologies.
• Provides favourable conditions fordeployment of RET in ESCOs
• Can be combined with other policy support
Threaths
• Tariff setting requires insight in generation costs
• Exposure to policy decision making introduces uncertainty for suppliers and installers
• Decreasing public support in cases where feed-in tariffs are causing increases in electricity prices

48 IEA-RETD / ECN-E--12-014
Discussion and conclusions
A feed-in scheme can be a solid basis for a business model. It provides a pre-dictable, long-term income for investors, either in the form of a tariff (i.e. pref-erential price) or in the form of a premium (i.e. bonus). It can be used for every technology and market segment, but because the generation costs form the basis of the tariff levels, it works best when eligible installations do not vary widely in costs and a representative (fictional) reference cost calculation can be made. This makes it less useful for innovative and/or unique initiatives. Experi-ence across Europe has shown that feed-in schemes are effective in developing markets, and boosting the use of RE both in and outside the built environment (REN21, 2011). Considerations for building owners / investors The strength of feed-in based business models is the long-term predictability of the income provided by it once a project has started. The weakness of a feed-in based system is that tariffs set may deviate (over time) from the real costs. In-vestors that plan multiple investments over time do require trust in govern-ment to keep the stability of the feed-in system, which may be difficult if the government allows itself too much flexibility and changes from year to year. Frequent changes and (unintentionally) low tariffs can slow down or even threaten market development. Consideration for governments Because of the flexibility in choosing categories and tariffs, government can use a feed-in scheme to stimulate private sector investments into specific technol-ogies or niche markets. The flexibility for policy makers also presents some challenges. Unpredictable changes may have severe effects on the market in which suppliers and installers operate. In years where tariffs or budgets turn out to be too low, demand for new installations may plummet. On the other hand, when tariffs are too high, deployment levels and the required support budget can become very high. Policy makers are commended not to use the flexibility of the feed-in scheme too much (beyond adjusting tariffs downwards as technology costs decrease), as the main success factor of existing schemes is their stability A feed-in tariff is a policy instrument that targets a specific financial barrier: that the generation costs of renewable energy are higher than of conventional, fossil fuel based energy. In reality, there may be more barriers that prohibit implementation, such as high upfront capital costs. Policy makers should there-fore consider supporting RE in the built environment with a mix of different in-struments, including soft loans, fiscal arrangements, and investment subsidies or grants. Feed-in schemes can work effectively alongside other policies such as fiscal benefits and investment subsidies.

IEA-RETD / Business Models for Renewable Energy in the Built Environment 49
4.2.2 Developing properties certified with a green building label
Description ‘Green’ building certification systems13 assess a building’s performance accord-ing to environmental and wider sustainability criteria and provide proof that the building confirms to a certain sustainability standard.
In this business model a property developer or architect designs and builds buildings certified according to a voluntary ‘green’14 certification scheme, ex-pecting to realize a sales price premium compared to conventional buildings. This premium should compensate for the additional costs related to the ‘green’ features of the building, and for the costs of the certification. Drivers for an in-creasing demand for certified buildings include:
Corporate Social Responsibility (CSR) considerations of corporations, for whom ‘green’ buildings are part of their ‘green’ image,
Reduced operating costs of ‘green’ buildings,
Enhanced levels of comfort for building users, which in commercial buildings may lead to higher productivity and less sick leave,
Regulation which mandates ‘green’ certification, for example for public buildings, and turns voluntary schemes into mandatory ones.
Most ‘green’ building certification systems cover a range of environmental and broader sustainability criteria related to energy and water use, indoor envi-ronment, and materials used, some systems also include criteria on functionali-ty and comfort, economic questions and innovation (Nelson, 2010). Normally, a building must fulfil most of the criteria set by the certification systems. Most programmes include different levels of certification, for example Certified, Sil-ver, Gold and Platinum for the U.S. ‘Leadership in Energy and Environmental Design’ (LEED) standard.
There are a variety of voluntary certification systems globally. The most widely used are the U.S. Green Building Council’s LEED standards and the UK based ‘Building Research Establishment Environmental Assessment’ (BREEAM). There are also schemes which focus exclusively on energy related criteria, e.g. the U.S. and Canadian Energy Star label for buildings, the German ‘Passive house’ standard and the Swiss ‘Minergie’ standard. In addition to certification systems there are also building rating systems, which do not issue a formal certificate. These rating systems support project developers by setting clear standards on what constitutes a green building. As rating a building is cheaper than undergo-ing a formal certification process, rating systems are frequently used for resi-dential buildings (Nelson et al., 2010).
Market segments Certification can be done in all market segments, i.e. for new and for existing
buildings, for commercial, residential and public properties, and for rented and owner-occupied properties. This business model focuses on the sale of certified new developments (or on certification and sale after renovation). Appendix A.11 describes three examples of new LEED certified buildings. ‘Green’ building certification often targets the top-end of the real estate mar-
13
Note that this business model analysis is based on the use of voluntary building certification schemes. It does not include mandatory energy performance certification as required by the EU Directive on the Energy Performance of Buildings and translated into national law in the EU member states.
14 The terms ‘green’ and ‘sustainable’ are often used interchangeably in this context (Nelson et al., 2010). In this
report, only the term ‘green’ is used.

50 IEA-RETD / ECN-E--12-014
ket. High-end office properties located in central business districts of large cit-ies, corporate headquarters of multi-national companies but also newly built public buildings are typical examples of buildings designed and built according to the highest level of certification. A reason for the focus on the top-end of the market may be the fact that demand for certified buildings is often driven by non-financial reasons such as corporate reputation. Originally, most certification systems have focused on certification of new properties. Today, most certified ‘green’ buildings space exists in commercial buildings, and a significant proportion of the certification is in existing build-ings. For residential buildings, the focus continues to be on new properties (PIKES, 2010).
Applicable technologies
Which technologies can be included in business models based on ‘green’ build-ing labels depends on the certification scheme: All ‘green’ certification schemes include energy efficiency measures. Under both the LEED and BREEAM certifi-cation systems, the installation of on-site renewable energy technologies is evaluated positively and contributes to the performance rating. (For examples of RET and EE measures applied under LEED, see also the case studies in Ap-pendix A.11.) The 2008 BREEAM standard for new office building requires for example at a minimum a feasibility study for the integration of low or zero car-bon technologies into a new office building15. However, it does not require the actual implementation of such technologies.
Actors Directly involved actors are the property developer who designs and builds buildings certified according to the ‘green’ label and his clients who are willing to pay a premium for buying or renting certified property. Note that ‘green’ certification is also possible for existing buildings, but this business model anal-ysis focuses on new builds. Other involved actors are the institution who devel-ops and manages the certification system. Mostly these institutions are non-governmental: LEED is administered by the U.S. Green Building Council (USGBC), BREAM operated by BRE (Building Research Establishment), the Ca-nadian R-2000 standard is administered by by Natural Resources Canada (NRCan) and the SBTool was developed at the International Initiative for a Sus-tainable Built Environment (iiSBE). There may also be involvement by govern-ment institutions in the development and management of certification sys-tems: BREAM was initially developed and marketed by the British government before the scheme was privatised (Nelson et al., 2010). The German Sustaina-ble Building Certificate is run by the German Ministry of Housing.
Organisational and financial structure
This business model requires demand for buildings built according to above-average environmental (‘green’) standards. Certification is used to underpin and prove the building’s environmental qualities. The design and construction of certified ‘green’ buildings is generally more expensive than of similar devel-opments without improved environmental properties. In addition, there are costs related to the certification itself. The cost for a combined design and con-struction review of a new building of 4.650 m2 or less applying for LEED certifi-cation is for example around USD 2.50016. A property developer must thus be able to cover the additional costs via a premium to the sales price of the prop-erty (see Figure 4.16).
15
See http://www.breeam.org/page.jsp?id=301 16 See http://www.gbci.org/main-nav/building-certification/resources/fees/current.aspx

IEA-RETD / Business Models for Renewable Energy in the Built Environment 51
Figure 4.16 Schematic depiction of the business case of developing a property certified according to a green label
A number of recent studies show that certified ‘green’ buildings indeed have higher property values. A U.S. study finds 13.5% higher market values per square foot for Energy Star certified buildings than for non-certified ones (Pivo et al., 2009). Other U.S. studies find sales price premiums of between 5% and 64% for certified ‘green’ buildings compared to the non-certified samples (Fuerst et al., 2008; Fuerst et al., 2011; Miller et al. (2007); Eichholtz et al. (2008)). However, the large variation in this data also shows that there is still significant uncertainty regarding the real price premium of certified buildings, which may also depend on the level of certification achieved. Another open question is if sales price premiums are sustainable across property market cy-cles, i.e. if premiums persist during market slumps. Similarly, there is a large variability regarding the estimates of additional costs to design and build a ‘green’ building. Some studies indicate that green build-ings are not necessarily much more expensive than less efficient buildings. Kats et al. (2008) examined 146 green buildings in the U.S. and found that the medi-an of additional costs for the green aspects of the buildings was just 2%. The study also found that energy savings alone make green buildings cost effective. These savings outweigh the initial cost premium in most green buildings. The net present value of 20 years of energy savings in a typical ‘green’ office ranges from USD 75/m2 to USD 140/m2, more than the average additional cost of USD 32/m2 to USD 86/m2 for building ‘green’. In roughly 50% of ‘green’ buildings in the study’s data set the initial ‘green premium’ is paid back by energy and wa-ter savings in five years or less (see also Mathiessen et al. (2004)).
Property
developer
Commercial
client
New building
equipped with
energy efficiency
measures and RET
Certification
body
Sales price including
premium for certification
certification
feesale
investment
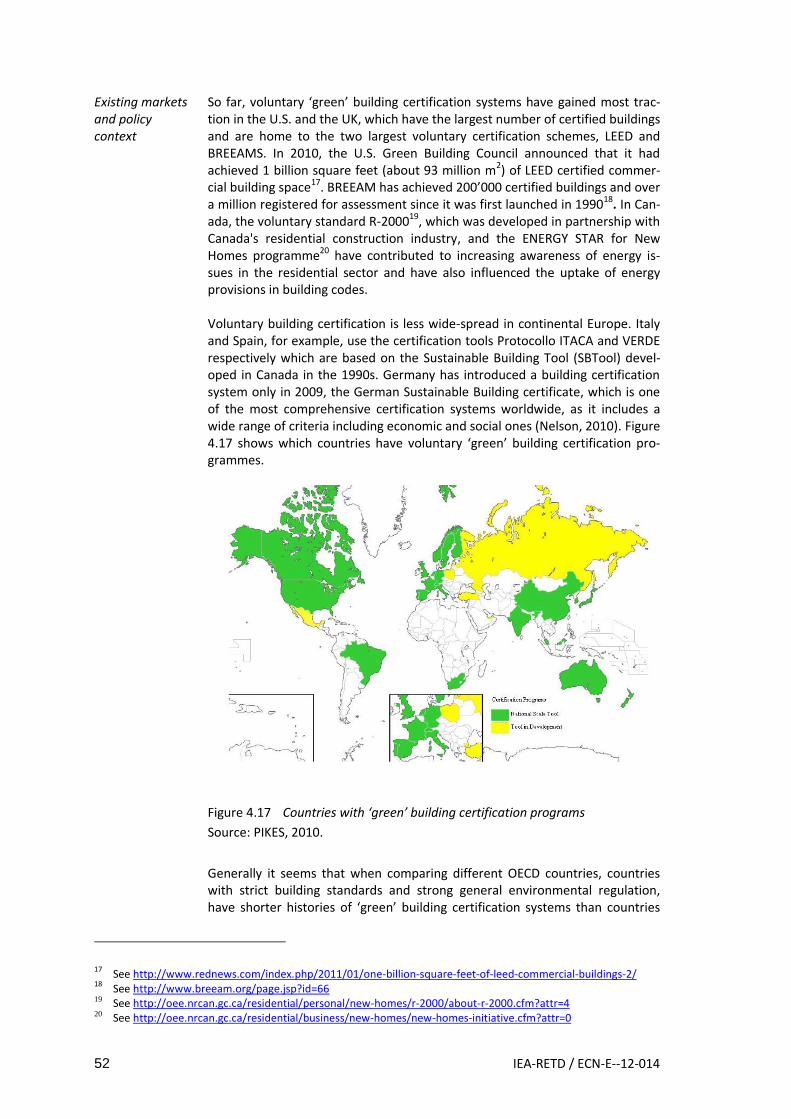
52 IEA-RETD / ECN-E--12-014
Existing markets and policy context
So far, voluntary ‘green’ building certification systems have gained most trac-tion in the U.S. and the UK, which have the largest number of certified buildings and are home to the two largest voluntary certification schemes, LEED and BREEAMS. In 2010, the U.S. Green Building Council announced that it had achieved 1 billion square feet (about 93 million m2) of LEED certified commer-cial building space17. BREEAM has achieved 200’000 certified buildings and over a million registered for assessment since it was first launched in 199018. In Can-ada, the voluntary standard R-200019, which was developed in partnership with Canada's residential construction industry, and the ENERGY STAR for New Homes programme20 have contributed to increasing awareness of energy is-sues in the residential sector and have also influenced the uptake of energy provisions in building codes. Voluntary building certification is less wide-spread in continental Europe. Italy and Spain, for example, use the certification tools Protocollo ITACA and VERDE respectively which are based on the Sustainable Building Tool (SBTool) devel-oped in Canada in the 1990s. Germany has introduced a building certification system only in 2009, the German Sustainable Building certificate, which is one of the most comprehensive certification systems worldwide, as it includes a wide range of criteria including economic and social ones (Nelson, 2010). Figure 4.17 shows which countries have voluntary ‘green’ building certification pro-grammes.
Figure 4.17 Countries with ‘green’ building certification programs
Source: PIKES, 2010.
Generally it seems that when comparing different OECD countries, countries with strict building standards and strong general environmental regulation, have shorter histories of ‘green’ building certification systems than countries
17
See http://www.rednews.com/index.php/2011/01/one-billion-square-feet-of-leed-commercial-buildings-2/ 18
See http://www.breeam.org/page.jsp?id=66 19 See http://oee.nrcan.gc.ca/residential/personal/new-homes/r-2000/about-r-2000.cfm?attr=4 20 See http://oee.nrcan.gc.ca/residential/business/new-homes/new-homes-initiative.cfm?attr=0

IEA-RETD / Business Models for Renewable Energy in the Built Environment 53
will less strict standards and that certification systems are less wide-spread in the countries with strong general environmental regulation (Nelson, 2008). An example for this hypothesis would be Germany, which has relatively strict building regulations, but which only recently introduced a certification system. Also, Scandinavian countries, which have a long history of environmental regu-lation, have so far focused mostly on ‘green’ rating systems. In the U.S., where environmental building standards tend to be lower, certification is much more common (Nelson, 2008). One reason for this may be that in countries with stricter existing regulation, there is little benefit in awarding certification to new buildings which may not be significantly ‘greener’ than the average new building. In addition, in countries with less strict existing building regulations, a certification system is likely to be less demanding than in countries with stricter regulation (Nelson, 2008).
There is a certain overlap between the voluntary ‘green’ certification programs in Europe and energy performance labelling as mandated by the EU Directive on Energy Performance of Buildings (EBPD). In the EU, it is expected that the EU Directive on Energy Performance of Buildings (EBPD) will be the main driver for moving the market as a whole, especially for new buildings. In May 2010, the European Parliament and Commission passed the recast of the directive, which will replace the 2002 version of the same directive in February 2012. The recast of the directive mandates member states to ensure that by the end of 2018 all new buildings occupied and owned by public authorities are nearly zero-energy buildings and that by the end of 2020 all new buildings achieve nearly zero-energy status. The directive further specifies that in these nearly zero energy buildings, a very significant amount of the energy still required should be pro-duced from renewable sources, including energy from renewable sources pro-duced on-site or nearby (EC, 2010). Outside of Europe, similar developments are ongoing in other OECD countries: The government of Japan is for example considering to adopt a target for zero energy buildings by 2030 (EC, 2009). Already under the 2002 version of the directive, member states are required to ensure that buildings have an energy performance certificate which is to be made available to the new owner or tenant when buildings are constructed, sold or rented out (EC, 2002). Since January 2006, certification is gradually be-ing introduced in the EU member states for different types of buildings. Coun-tries were required to implement mandatory energy performance certification of new and existing buildings, along with periodic certification of public build-ings by January 1st, 2009 at the latest. For public buildings, the energy perfor-mance certificate needs to be publicly displayed. As the EPBD is a framework directive, there is considerable room for country specific implementation. Thus the certification schemes vary across EU coun-tries, for example with regard to the moment when the prospective buy-er/tenant is given the Energy Performance certificate. Currently, many member states still allow that the prospective buyer/tenant receives the energy perfor-mance certificate only at the end of the transaction, e.g. at the notary, but not during the period when the decision making process is still ongoing. Only with the recast of the EBPD will member states be required to ensure that key ener-gy performance characteristics are already communicated while advertising the building for rent or sale. Currently, little is known on the real impact of energy performance certificates on owners' decision making for buying, renting or renovating a building. Even a

54 IEA-RETD / ECN-E--12-014
link between the energy efficiency of a building as stated in the EPC and its price on the market has not been proved yet. The energy performance certificates in the EU exist in parallel to the voluntary certification schemes which mostly cover a broad range of environmental or wider sustainability criteria.
SWOT Analysis
Strengths For the architect and property developer
Ability to get a premium price for property certified according to a ‘green’ standard
Designing and building certified ‘green’ buildings may strengthen an archi-tect’s / property developer’s competitive position in an environment of in-creasing demand for ‘green’ buildings.
Building certification can be used for marketing / image building. For the buyer
Certification gives the buyer certainty of environmental features of the build-ing. The owner can expect lower operating costs and additional benefits such as increased comfort for building users.
Building certification can be used for marketing / image building.
Weaknesses For the property developer and buyer
Undergoing the process of certifying a building carries relatively high trans-action costs.
General
Certification schemes generally focus on the high-end of the real estate market, and are unlikely to drive a transformation of the broader market. In the EU, it is for example expected, that the most important driver for a transformation of the market will be stricter government regulation. How-ever, in some other markets which do not, yet, have strict building stand-ards, building certification may be the first step towards regulation (see opportunities).
Green certification schemes do not explicitly promote the use of RET in buildings. Higher levels of certification generally have higher requirements in terms of minimum standards that a building must meet, including stronger incentives for the inclusion of RET. However, in most schemes it’s possible to achieve a high level of certification without use of RET21.
Opportunities Increased awareness of the benefits of ‘green’ buildings may increase de-mand for building certification and for green’ buildings in general.
Increased knowledge and harmonization of certification system is also ex-pected to increase demand. In many European countries, building certifica-tion systems have only recently been introduced and are growing from a low basis. In countries where building certification has already become more widespread, rapid growth is taking place.
21
See e.g. BREAAM and LEEED case studies at http://www.breeam.org/case-studies.jsp and http://www.usgbc.org/DisplayPage.aspx?CMSPageID=1721. The Rodney Phase 1 residential development (http://www.breeam.org/page.jsp?id=324) carries for example a BREAAM excellent rating without integration of low or zero carbon technologies.

IEA-RETD / Business Models for Renewable Energy in the Built Environment 55
In places where no strict building standards exist, yet, certification may be the first steps in moving towards regulation at least for certain segments of the market. Singapore for example introduced a voluntary ‘green’ building certification scheme in 2005, the BCA Green Mark standard. Three years lat-er, the basic level of the scheme became the mandatory standard for new buildings and retrofits with floor area exceeding 2000 square meter22. In the UK, since 2008 any public healthcare buildings are required to meet at least BREEAM level Excellent, all major new school buildings and refurbishments need to reach BREEAM level Very Good23.
Threats Where general building standards are high, it is expected to be more difficult to convince potential buyers of the added value of ‘green’ building certifica-tion.
There are lingering misconceptions on the additional price of ‘green’ build-ings among players in the property development value chain which hinder the increased uptake of certified ‘green’ buildings. A survey among building professional showed that industry actors on average estimated the cost premium for ‘green’ buildings to be around 17% whilst it’s less than 10% in most countries (WBCDS, 2007).
There is still a lack of comprehensive and transparent data demonstrating that certified ‘green’ buildings command higher sales prices, and a lack of studies on the overall benefits of ‘green’ buildings. Studies such as the ones quoted above focus mostly on the situation in the U.S.; for Europe no com-prehensive data is available, yet.
Figure 4.18 Voluntary ‘green’ building certification - summary of the SWOT analysis
22
See http://www.bca.gov.sg/greenmark/green_mark_buildings.html 23
See http://www.breeam.org/
Strengths
- strengthens competitive position of architect and developer
- gives certainty on the environmental performance of the building
- may enhance reputation of the owner/renter and increase well-being of users
Weaknesses
- costly certifiaction process
- focus on the high-end of the market
- no specific focus on integration of RET
Opportunities
- lncreased awareness of certification systems and increased harmonization of schemes may increase demand.
- Voluntary certification may form the basis for regulation.
Threaths
- little demand for voluntary certification where building standards are already high
- misconception on price premium for "green" buildings
- lack of data to demonstrate benefits, especially in Europe

56 IEA-RETD / ECN-E--12-014
Discussion and conclusions
Voluntary ‘green’ building certification can play a role in driving the transfor-mation of the property market towards becoming more environmentally friendly and energy efficient, especially in countries which do not (yet) have strict mandatory building codes. In Canada, it is for example assumed that ex-isting voluntary ‘green’ building certification programmes have influenced the uptake of energy provisions in building codes.
Certification enhances transparency on environmental characteristics of build-ings and provides the owners and users of the building some certainty on envi-ronmental performance, including an indication of operating costs for energy and water use. There are additional benefits to the users of green buildings such as enhancing corporate reputation and increasing well-being and produc-tivity of building users. With increased awareness of the feasibility and benefits of voluntary certification, demand for certified buildings is expected to grow. Especially the U.S. and the UK have seen significant growth in certified building space in the past years. Growing demand for certified buildings provides oppor-tunities for architects and property developers. Recent studies in the U.S. indi-cate that property values of certified buildings are indeed higher than of com-parable non-certified ones. Other studies indicate that certified buildings may not be much more expensive to design and construct. Regarding energy related aspects, the primary focus of most certification schemes is on the integration of energy efficiency measures into buildings. However, on-site production of renewable energy is also part of the most common schemes, especially for higher levels of certification. Government can encourage certification schemes by applying them to public buildings or even making them mandatory for certain types of (public) buildings as is happening currently in the UK24. Moreover, government use of certifica-tion schemes raises awareness of the scheme. However, voluntary certification generally tends to focus on the high-end of the real estate market, and by itself is unlikely to drive a transformation of the whole market towards more envi-ronmentally friendly and energy efficient practices. In the EU, it is rather ex-pected that the recast of the EU Directive on Energy Performance of Buildings (EBPD) will be the main driver for moving the market as a whole, especially for new buildings.
For owners and users of certified buildings, existing studies, mostly based on data from the US market, show operating cost savings and additional benefits such as increasing well-being and productivity of building users (see above). However, especially for the European context there are no major studies, yet, demonstrating the enhanced financial performance of green buildings over conventional ones (Nelson et al., 2010). Certification bodies and property de-velopers and owners with a large portfolio of certified green buildings could take a proactive role in collecting data and initiating such studies in order to in-crease confidence of investors into the concept. Furthermore, governments and certification bodies could work together to ensure that the requirements for voluntary and mandatory systems are harmonised. The latter is especially important in markets where voluntary certification has already reached a high market share in order to ensure that competing and incompatible systems do not cause confusion with investors and other market actors.
24
In the EU, publicly owned or occupied buildings represent about 12% of all building area (Ecorys et al., 2010).

IEA-RETD / Business Models for Renewable Energy in the Built Environment 57
4.2.1 Building owner profiting from rent increases after the implementation of energy efficiency measures
Description In this business model, building owners who do not occupy a building them-selves or housing corporations profit from additional revenue opportunities af-ter undertaking investments in RET and EE as they are allowed to charge a higher rent from their tenants after the renovation. This helps overcome the barrier of split incentives, i.e. the lack of incentives to realize building im-provements when owner and occupant are different parties. This business model is based on regulation that allows such rent increases and is being introduced in a number of countries (see below). Such regulation is possible in situations where regulation on maximum rents and/or maximum al-lowable rent increases exist. This is usually the case in the social housing sector, but such regulation may also exist in the wider residential rental sector where buildings are owned by private persons or property companies.
Market segments Applicable for renter-occupied residential buildings in jurisdictions where the rental sector is regulated through determined maximum levels of rent or max-imum allowable rent increases. It is mostly specifically applied in the social housing sector which is usually protected by tenants’ law and where there is a system for determining the level of rent based on a set of criteria. The absolute volume of buildings in the social housing sector in the EU is signif-icant. The relative share of social housing in the total building stock in EU coun-tries is estimated to be on average 13%. In most EU countries the social hous-ing sector is regulated (OTB, 2010). The rental sector is also significant in size outside of Europe, for example in the US and Japan, where the majority of apartments is rented (WBCSD, 2007).
Applicable technologies
Theoretically both EE measures and installation of RET could be undertaken under this scheme. Practically, the regulation is expected to be mostly used for energy efficiency measures because they are usually more cost effective.
Actors Directly involved actors are property owners (housing corporations, individuals, corporate or institutional investors) and tenants. The business model also in-volves governments which set the rental regulations and other actors involved in the building sector such as installers of energy efficiency measures and ener-gy auditors.
Organisational and financial structure
A building owner in a regulatory environment that allows higher rents for build-ings with higher energy performance decides to undertake improvements to the energy performance of his property. To compensate for his investment, he increases the rent of his tenants who profit from lower energy costs. In doing so, the building owner aims at recovering his investment through the higher rents over a reasonable period of time (see Figure 4.19). Regulation in many countries determines the maximum level of rent that can be charged or maximum allowable rent increases. To enable the building owner to pass through (part of) his costs, a change in regulation is required. Especially in the social housing sector, government generally aims to ensure that living expenses for tenants decrease or at least do not increase. Thus the increase in

58 IEA-RETD / ECN-E--12-014
rent should be lower than the energy cost savings, which limits the choice of available energy efficiency measures that an owner can cost-effectively under-take under the scheme.
Figure 4.19 Schematic depiction of the business model For the proposed scheme in the Netherlands, the example in Appendix A.6 il-lustrates cost implications for renters and landlords of the approach for deter-mining rents and describes the scheme in detail. Note that in the Dutch exam-ple the new regulation should guarantee that total costs for the tenants do not increase.
Existing markets and policy context
The regulation of the rental market differs widely across Europe. The same ap-plies specifically for social housing and its regulations, although most social housing is managed by social housing corporations (Fresh, 2011). Regulations that help overcome the split incentive barrier in the rented sector are not common in Europe, although awareness of the need for such schemes is growing. This was demonstrated by a survey among real estate professionals and property owners’ associations in many EU member states (UIPI & CEPI, 2010). Few countries have actually adapted their rent regulations to allow for increased rents after renovation (UIPI, 2010; IEE workshop, 2011). European countries with existing policy to address the split incentive issue in the rental market are the Netherlands, France, Germany, the UK, Italy and Sweden (IEE workshop, 2011; UIPI & CEPI,2010). In the Netherlands, the tenants’ law, more specifically the rental price evaluation system for social housing, is expected to be adapted in the course of 2011 to allow rental price increases by housing corporations for energy improvements made (see Appendix A.6) (Aedes, 2011). In France, the tenants’ law was adapted in 2009 enabling landlords that realise energy improvements to share the energy saving benefits with their tenants. A specific feature of the regulation, similar to the one in the Netherlands, is that a tenant has to give consent to the landlord to undertake the renovation. Fur-thermore benefits to the landlord cannot exceed half of the energy cost savings (UIPI & CEPI, 2010). In Germany, there is a green rent index to reward energy improvements. This index is not widely used though, as the opportunities for landlords to increase rental prices for investments into energy improvement are limited. Moreover, RET are not eligible for the index, yet (Nelson et al., 2010; UIPI & CEPI, 2010). In the UK the national energy efficiency plan of the government (‘Green deal’) aims to establish financing options (‘pay-as-you-save schemes’) for tenants

IEA-RETD / Business Models for Renewable Energy in the Built Environment 59
when landlords realise energy efficiency improvements to their house (UIPI & CEPI, 2010). In Belgium, Austria and Bulgaria discussions are ongoing to address the split in-centive problem (UIPI & CEPI (2010) and IEE workshop (2011)). And in the fu-ture, it is expected that more EU member state will introduce similar regulation driven by the proposed revision of the EU Energy Service Directive. The pro-posed revision acknowledges split incentives as a barrier for energy efficiency. Article 15 of the proposed directive states that Member states should take ac-tion to remove the split incentive between the owner and tenant, for example by means of a change of law (European Commission, 2011). There is no indication that similar regulation exists outside of Europe. In most cases, the business model requires supporting policies or services. For example the assessments of a building has to be done by an energy label or au-dit, which implies that the country already needs to have implemented the re-spective requirements set in the EU Energy Performance of Buildings Directive (EPBD), or have a similar system in place. In addition, the business model may be regulated by additional policy, such as specific rules protecting tenants. For the case of the Netherlands, the Dutch living expenses guarantee is described in Appendix A.6.
SWOT Analysis
Strengths Reduces the split incentive barrier in the rental sector because of the bene-fits for both tenants and landlords (Tigchelaar, 2011).
Stimulates energy improvements for existing dwellings on a large scale, as large property owners, e.g. social housing corporations, frequently have sufficient access to capital, technical expertise and a long term interest in maintaining their building stock. Housing corporations in the Netherlands for example have relatively good access to capital at attractive interest rates because of a guarantee fund by the government for social housing corporations, CFV25 (ECN, 2011).
Weaknesses The business model is only applicable for rented buildings in countries or
regions where rents are regulated. This is usually the case in the social housing sector, but may also be the case in the private rental sector.
The scope of the business model is limited, as in social housing the tenants are protected by tenants law which may need to be changed. Buildings are therefore only renovated when new tenants move in or existing tenants provide consent (as required in some cases). Moreover, the amount of en-ergy savings that property owners are allowed to recover may be limited, as is for example the case in France (Fresh, 2011). This reduces the incentive for renovations. In the Netherlands, it is estimated that the requirement for owner consent will limit the amount of renovations undertaken (see also the Appendix A.6).
The business model may primarily lead to energy efficiency improvements instead of renewable energy technology deployment, as the latter is fre-quently more complex and expensive. Existing policy schemes therefore
25
CFV estimated in 2010 that housing corporations can acquire capital via CFV, at 1.5% lower financing costs than on the market (ECN, 2011).

60 IEA-RETD / ECN-E--12-014
mostly focus on energy efficiency and limit or leave out RET.
Effective enforcement of the scheme requires an energy performance as-sessment (for example by labeling)26.
Some property owners and housing corporations may not have access to capital to invest in energy improvements of buildings.
Opportunities It can provide a significant driver for energy improvements of the existing building stock, for which energy saving potential is the high.
More EU countries are expected to introduce similar regulation as part of their efforts to implement the revised EU Energy Services Directive. Outside of Europe, little information is available on planned efforts.
Threats The business model requires a change in regulation that covers the rental
market. This may be a time consuming process, as there are potential con-flicts of interests between renters’ associations and property owners. In the Netherlands, the change of the rental price evaluation system was for ex-ample only realized after a political process that took three years.
Rented buildings with better energy performance but higher rent may be perceived as less affordable by a tenant.
Figure 4.20 Business model based on higher rents after improving energy performance of a building - summary of the SWOT analysis
Discussion and conclusions
The business model is based on a change in legislation regulating the rental sector. Its attractiveness for the building owner directly depends on the details of the legislation, e.g. how much of the energy savings or of his up-front in-vestment a building owner is allowed to recover. It is unlikely that being able to charge higher rents to tenants will be the sole driver for a property owner’s de-
26
In the Netherlands a more pragmatic assessment is allowed if no energy label is available. In such cases the age of the dwelling determines the amount of ‘points’ awarded (Eerste Kamer, 2011).
Strengths
- reduces split incentives barrier as it may benefit both tenant and landlord
- large property owners in the regulated rental sector frequently have access to capital, long-term time horizon and technical expertise for large-scale renovation measures
Weaknesses
- only applicable where rental sector is regulated
- scope of renovations limited by law protecing tenants
- requires an energy performance assessment
- mostly used for EE measures
Opportunities
- potentially significant driver for the renovation of the existing building stock
- more EU countries are expected to introduce legislation following the revised EU ESD
Threaths
- requires a change in regulation which may be slow due to potential conflicts of interest
- buildings with better energy performance but higher rent may be perceived as less affordable

IEA-RETD / Business Models for Renewable Energy in the Built Environment 61
cision to undertake renovation measures. However, the higher rents may still play a significant role in the decision. It is expected that in its current form the business model is mostly applied for the implementation of energy efficiency measures which are usually more cost-effective than RET. But theoretically the business model may also be applied for the implementation of RET, e.g. for the installation of a heat pump which reduces energy costs for the tenant. There are only few new business models and innovative policy instruments which specifically address the barrier of split incentives. This implies that this business model, potentially supported by additional incentives, may play an important role in catalyzing energy improvements of the existing building stock in the large rental sector. The application of the business model is limited to countries or regions that have a regulated rental sector. However in the regu-lated rental sector mostly large property owners are active, such as social hous-ing corporations which frequently have the long time horizon, access to capital and technical expertise required to plan and undertake renovation measures.
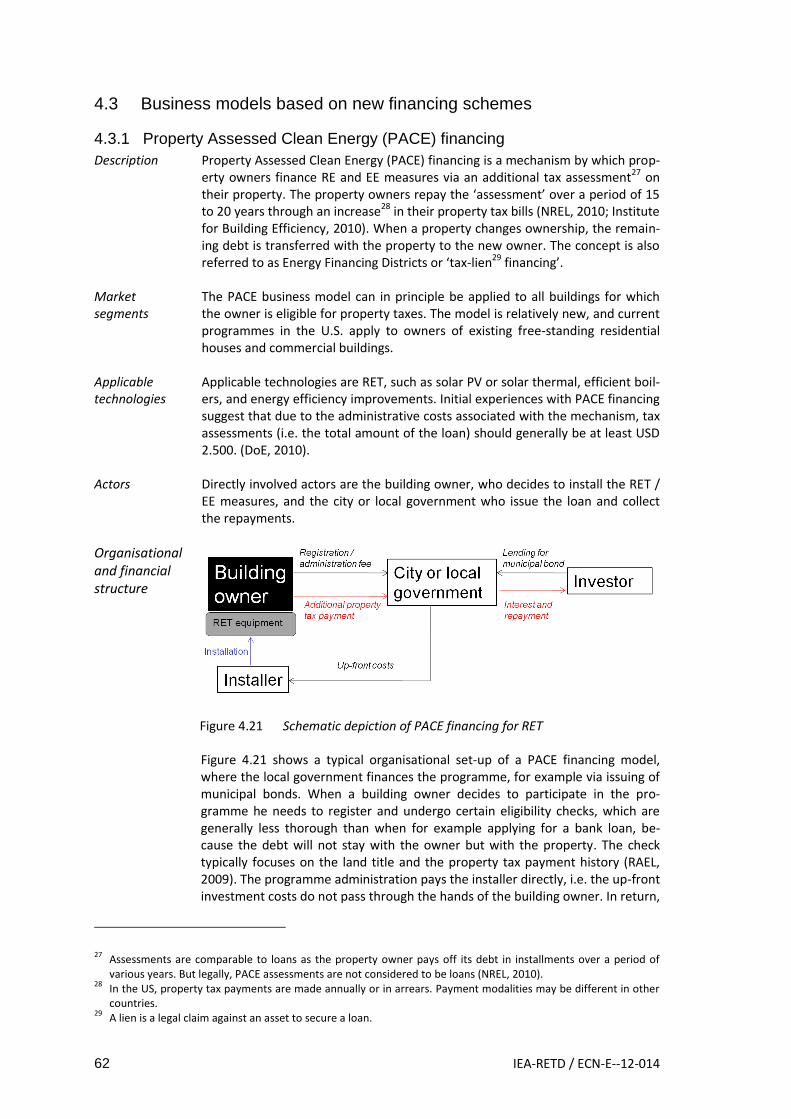
62 IEA-RETD / ECN-E--12-014
4.3 Business models based on new financing schemes
4.3.1 Property Assessed Clean Energy (PACE) financing
Description Property Assessed Clean Energy (PACE) financing is a mechanism by which prop-erty owners finance RE and EE measures via an additional tax assessment27 on their property. The property owners repay the ‘assessment’ over a period of 15 to 20 years through an increase28 in their property tax bills (NREL, 2010; Institute for Building Efficiency, 2010). When a property changes ownership, the remain-ing debt is transferred with the property to the new owner. The concept is also referred to as Energy Financing Districts or ‘tax-lien29 financing’.
Market segments
The PACE business model can in principle be applied to all buildings for which the owner is eligible for property taxes. The model is relatively new, and current programmes in the U.S. apply to owners of existing free-standing residential houses and commercial buildings.
Applicable technologies
Applicable technologies are RET, such as solar PV or solar thermal, efficient boil-ers, and energy efficiency improvements. Initial experiences with PACE financing suggest that due to the administrative costs associated with the mechanism, tax assessments (i.e. the total amount of the loan) should generally be at least USD 2.500. (DoE, 2010).
Actors Directly involved actors are the building owner, who decides to install the RET / EE measures, and the city or local government who issue the loan and collect the repayments.
Organisational and financial structure
Figure 4.21 Schematic depiction of PACE financing for RET
Figure 4.21 shows a typical organisational set-up of a PACE financing model, where the local government finances the programme, for example via issuing of municipal bonds. When a building owner decides to participate in the pro-gramme he needs to register and undergo certain eligibility checks, which are generally less thorough than when for example applying for a bank loan, be-cause the debt will not stay with the owner but with the property. The check typically focuses on the land title and the property tax payment history (RAEL, 2009). The programme administration pays the installer directly, i.e. the up-front investment costs do not pass through the hands of the building owner. In return,
27
Assessments are comparable to loans as the property owner pays off its debt in installments over a period of various years. But legally, PACE assessments are not considered to be loans (NREL, 2010).
28 In the US, property tax payments are made annually or in arrears. Payment modalities may be different in other
countries. 29
A lien is a legal claim against an asset to secure a loan.

IEA-RETD / Business Models for Renewable Energy in the Built Environment 63
an assessment is placed on the owner’s property which is secured by a senior lien. Thus in the event of foreclosure (and forced sale), the local government will be paid back the PACE loan before any other claims against the property. If the owner sells the house before the end of the repayment period, the remaining debt, repayment obligation and the equipment are transferred with the proper-ty to the new owner. The local tax agency acts as the collecting agent for the repayment. For a US$ 20,000 tax assessment at an interest rate of 6% over 15 years, the annual re-payment would for example amount to US$ 2,060. Generally, PACE financing in-struments aim at structuring RE and EE measures in a way that the additional property tax payment is lower than the cost savings achieved, thus aiming at an-nual net cost savings for the building owner.
Assessing which measures are cost-effective requires at a minimum a rough en-ergy audit of the property. Such services may be facilitated within the frame of the PACE financing programme, e.g. the administrative body can recommend service providers or may even offer energy audits themselves. These may be crucial for the programme to succeed, as building owners need to know in ad-vance if the investment is cost-effective. The ownership of the RET system or EE technologies financed through a PACE financing programme lies with the prop-erty owner. Thus the property owner could legally be eligible for additional sub-sidies or incentives, e.g. a feed-in remuneration or tax benefits.
Whilst municipal bonds are the most typical way of financing a PACE pro-gramme, other options are possible, such as bank loans, general local govern-ment funds or existing revolving funds (see NREL, 2010 and RAEL, 2009). De-pending on the type of financing used by local governments, interest rates for home owners may differ substantially. In the Berkeley First Program, for exam-ple, some applications to participate in the programme were withdrawn due to unattractive interest rates at 7.75% (see case study in Annex A.2). Two other early PACE financing programmes in Palm Desert, California and Boulder Coun-try, Colorado offered interest rates of 6.68% and 7% respectively. On the other hand, a programme in Babylon, New York, using an existing municipal solid waste revolving fund, offered interest rates of only 3% which was significantly below market rates (RAEL, 2009).
Existing markets and policy context
The PACE concept started in 2008 in California and is currently being imple-mented in various U.S. counties and municipalities, and in a similar programme in Melbourne, Australia (see Appendix A.3 for a description of this programme in Melbourne). Under U.S. law, as a prerequisite of a PACE programme, a state must establish legislation which enables local governments to create special as-sessment districts which consider RE and EE measures to be ‘public goods’. In addition, the local government needs to establish regulation which create as-sessment zones and authorizes the creation of liens on property. The local gov-ernment also has to establish the funding process and organize the administra-tion of the programme. In Australia, the introduction of the Environmental Up-grade Charge30 for the city of Melbourne (see Appendix A.3), which is similar to the concept behind PACE financing, was also done on a state level.
30
For further information, see for example http://www.institutebe.com/clean-energy-finance/melbourne-environmental-upgrade-agreement.aspx

64 IEA-RETD / ECN-E--12-014
At the end of 2010, 26 US states had passed legislation which allows local gov-ernments to create PACE programmes. There are active PACE programmes in California, Colorado, Wisconsin, Ney York and Maryland (Institute for Building Efficiency, 2010b). The U.S. Department of Energy offered support to PACE programmes in the form of technical assistance to local governments and through committing funds to communities which can be used to give low or no-interest loans for PACE pro-grammes. However, as of early 2011 most PACE programmes are stalled be-cause of a conflict about the senior liens placed on the property. Fannie Mae and Freddie Mac, which are the government entities guaranteeing more than half of U.S. residential mortgages, rightfully fear that the senior liens on the property will impair their own claim in the case of default, as the property tax assessments typically need to be paid back first. In July 2010, the Federal Hous-ing Finance Agency (FHFA) issued a statement instructing Fannie Mae and Fred-die Mac to no longer underwrite mortgages for properties with a PACE assess-ment. As a consequence, a house owner now typically has to first pay back the property tax assessment before he can sell his home. This makes one of the ma-jor advantages of PACE financing obsolete and has stalled most programmes. Currently legal and legislative efforts are underway to restore PACE financing, but its future is still uncertain (Boland, 2010; PACE Now, 2011; Woody, 2010). Commercial PACE programmes are not affected by the action by FHFA and con-tinue to move ahead (U.S. DoE, 2010b). While the PACE concept has gained relatively widespread attention, its actual use is still limited. RAEL (2009) show that as of August 2009 in four of the early PACE programmes between 39 and 393 projects had been undertaken per pro-gramme with average project sizes between USD 7.100 and USD 36.000. Looking at purely commercial PACE programmes, as of early 2011 there were 4 pro-grammes in operation and nine in design. Within the 4 operational programmes, 71 projects of total financing of USD 9.69 million were approved (LBNL, 2011). Outside of the U.S., the city of Melbourne in Australia introduced a so-called En-vironmental Upgrade Charge attached to the property. The programme aims to catalyze the retrofit of at least 1’200 non-residential buildings (LBNL, 2011). The programme is described in detail in Appendix A.3.
SWOT Analysis
Strengths For the property owner PACE financing overcomes the barrier of high-up front costs for the home
owner.
If the property tax assessment can be transferred together with the property to the new mortgage holder, the PACE model helps to overcome the hesitan-cy of homeowners who may move house every 5 to 7 years to make long-term investments into RE and EE measures (NREL, 2010).
If RE technologies are installed and contribute to a significant share of elec-tricity demand, the property owner effectively fixes his energy costs for the next 15-20 years at the level of the additional property tax payment. This is attractive if electricity prices are expected to rise.
PACE financing improves access to capital and allows for repayment terms of 15 to 20 years, much longer than typical home equity loans.
PACE financing reduces transaction costs for the homeowner as the pro-gramme is specifically set-up to finance RET and EE measures (RAEL, 2009).

IEA-RETD / Business Models for Renewable Energy in the Built Environment 65
Home owners may consider the local government to be a more trustworthy source of information on opportunities for RET and EE measures than for ex-ample industry organisations (Bailey, 2009). Similarly, investors may regard local government as a trustworthy partner.
RET and EE measures undertaken with PACE financing are chosen based on having positive net annual cash flows. If the realized energy savings are in-deed higher than the additional property tax payments, the value of the property increases and the owner may realize a higher price when selling the house. If this is not the case, and realized energy savings are less than the ad-ditional property tax payments, there is a risk of a negative impact on the value of the property.
For the municipality PACE financing generally allows a municipality to promote RET and energy ef-
ficiency with little direct costs to the government for financing such measures as the government does not need to use its own funds. The only actual costs for government are the administration costs of the programme (which may also be passed on to participating home owners).
Weaknesses For the property owner
Even though other conditions may be more beneficial, interest rates for PACE financing are not necessarily lower than for alternative financing options.
For the municipality
Requires a change in legislation to establish the ‘special assessment district’. In the U.S., the legislative change is the responsibility of states; in other coun-tries responsibility may lie with a different level of government. For further information on current legal issues around PACE financing in the U.S., see also Nostrand (2011).
Municipal governments may not have the right expertise to establish and run a PACE financing programme.
Setting up and administering a PACE financing programme requires an admin-istrative effort by the municipal government. For small municipalities this may be too costly, as they are not able to achieve economies of scale.
Opportunities As municipalities gain more experience with the set-up of PACE financing
programmes, lessons learned and best practices emerging from the first-mover programmes may be used to inform subsequent efforts and facilitate the set-up of new programmes. In the future, the PACE construction may pose opportunities to create regional programmes, thus lowering administra-tive costs for single municipalities (RAEL, 2009).
PACE financing does not directly address the barrier of split incentives and does not specifically target rented buildings. However, in the U.S., tax as-sessments qualify as a pass-through under so-called ‘triple net lease’ ar-rangements where the tenant agrees to pay all real estate taxes, building in-surance, and maintenance (Institute for Building Efficiency, 2010). Thus PACE financing can also be used to specifically target rented properties.
Threats A major threat to residential PACE financing programmes in the U.S. is the decision by the Federal Housing Finance Agency (FHFA) that instructs the mortgage reinsurers not to accept the PACE tax assessment when guarantee-ing new mortgages. This makes it virtually impossible to sell houses with a PACE tax assessment, and has stalled residential PACE programmes. There is not solution for this issue, yet.

66 IEA-RETD / ECN-E--12-014
Overall, the transferability of liabilities from PACE financing has not yet been proven on a large scale.
PACE financing requires the approval of the mortgage holder and potentially other actors such as the mortgage reinsurers, which may be a threat to PACE programmes (see above). For commercial PACE financing programmes, sev-eral recent examples demonstrate that commercial building successfully ob-tained consent from mortgage holders, with a tax assessment-to-(building) value (lien-to-value or LTV) ratio of less than 1:10 (LBNL, 2011).
With the recent economic recession, the financial situation of municipalities and local governments has been deteriorating in many countries. If munici-palities are under strong budget pressure, they may not have the resources to set up and maintain a PACE financing programme. For many municipalities and local governments economic prospects are expected to continue to be difficult in the coming years due to decreasing local tax revenues and less support by national governments.
Figure 4.22 PACE financing - summary of the SWOT analysis
Discussion and conclusions
PACE financing is a relatively new concept: the first pilot programme was under-taken in 2008 in the city of Berkeley. It is attractive as it provides access to capi-tal for property owners to invest in RET and EE measures, thus overcoming the barrier of high-up front costs. In addition, it incentivises long-term investments because the repayments of the special tax assessment may be done over 15 to 20 years and the lien on the property stays with the property when it is sold. PACE financing for residential properties suffered a serious draw-back when the US Federal Housing Finance Agency issued a statement that it would not accept mortgages with liens for PACE financing, implying that a property owner would first have to pay back the tax assessment before being able to sell his property. While this decision has put residential programmes to a halt as long as no solu-tion for this issue is found, commercial programmes continue. For residential programs legislative and legal efforts are underway to solve the outstanding is-
Strengths
- overcomes barriers of high up-front costs and improves access to credit
- opprtunity to transfer the tax assessment at the sale of the property
- long repayment terms of 15 to 20 years possible
- little use of government funds
Weaknesses
- requires a change in legislation (depending on ccountry)
- requires an administrative effort by the municipality
- interest rates may not be more attractive than for alternative forms of financing
Opportunities
- Lessons learned from initial programs may facilitate future initiatives.
- Tax assessment may be passed through to a tenant under "triple net leases" in the US, making PACE financing attractive for rented properties.
Threats
- resistance from institutional stakeholders
- deteriorating financial situation of local governments

IEA-RETD / Business Models for Renewable Energy in the Built Environment 67
sues. However, if no solution is found, it is unlikely that residential PACE pro-grams will continue. The main prerequisite to enable PACE financing or a similar programme is a change in legislation that enables the creation of special tax assessment districts or similar arrangements, and the acceptance of all stakeholders (as indicated above). In the U.S. and Australia, these legislative changes are undertaken on a state level. If other countries were interested in introducing such a concept, na-tional or regional governments would have to explore if and how the concept could fit into the existing regulatory framework. Considerations for local governments Local governments which consider the introduction of a PACE financing pro-gramme are advised to first undertake an analysis of the potential market for PACE financing. Key points to consider include:
The demographics of the area and insight in the split between owner-occupied and rented properties, the split between commercial and residential properties, income levels, and awareness and interest in RE and EE measures.
The current state of the building stock, the climatic conditions, and current energy sources and prices for electricity and heat. These will determine which technologies would be appropriate for inclusion into a PACE financing pro-gramme.
The current barriers to investing into RET and EE measures. PACE financing may overcome the barrier of high-up front costs and the hesitancy to make long-term investments, but it does not directly address the problem of split incentives, of low or negative returns on investments in RET and EE measures, or lack of awareness and information. If other barriers prevail, these need to be addressed first or in parallel with the PACE financing programme.
The availability of existing financing options for property owners (RAEL, 2009).
In addition, the ability of the local government to secure funding for PACE fi-nancing (RAEL, 2009) is an important consideration when setting up a similar programme. Regarding the administrative overhead, the local government may consider if it wants to undertake the programme itself or rather partner with third parties (private or public) to lower the burden. Even though there is not much experience, existing PACE programmes may provide valuable input for the set-up of new initiatives. Considerations for property owners Property owners who have access to PACE financing should consider if financing conditions via PACE financing are attractive compared to other alternatives such as direct bank loans or own capital. It is also important to take into considera-tion that an investment which leads to annual cost savings, i.e. where the annual energy cost savings are higher than the additional tax payments, probably leads to an increase in the value of the property. On the other hand there is a risk that the property value decreases if the special tax assessment minus the energy cost savings create additional costs to a prospective buyer.

68 IEA-RETD / ECN-E--12-014
Box 4.1 Case in point: Berkeley FIRST - the first PACE financing programme In 2008, the City of Berkeley launched the first ever PACE financing programme, called Berkeley Financing Initiative for Renewable and Solar Technology (FIRST). The small pilot programme fo-cused exclusively on solar PV installations in order to keep the process simple. Funding was based on micro-bonds issued by the City of Berkeley. The programme provided financing to 13 projects for a total of USD 336.550 of financing. The Berkeley FIRST programme provided valua-ble insights into how PACE financing can be applied in practice (see Appendix A.1 for more de-tails).
4.3.2 On-bill financing
Description In this business model, utilities provide financing (i.e. a loan) for RE and EE measures. The building owner (or building user) repays this loan via a surcharge on its utility bill. Preferably the overall utility bill should still be lowered, though, because of the associated energy cost savings. It is possible to structure the programme in a way that the loan stays with the utility meter, and thus can be transferred to the new owner if the house is sold.
Market segments
On-bill financing targets mostly owners of free-standing residential homes and small commercial buildings who want to upgrade existing buildings. It is appli-cable for owner-occupied buildings, but can also work for renter occupied build-ings, as the concept may allow tenants to pay for (via the utility bill) and profit from energy efficiency improvements. In the U.S., the two utilities Electric Com-pany (HECO) and Midwest Energy have pioneered on-bill financing programmes which specifically target renter-occupied buildings (see Johnson et al. (2011) for an evaluation of these programmes).
Applicable technologies
All RE and EE measures are theoretically possible. When applying on-bill financ-ing, the aim is generally to generate annual cost savings for the building owner within the loan term which must be shorter than the useful life of the equip-ment. Thus, only cost-effective measures are financed. On bill-financing pro-grammes are often combined with grants to enable a wider range of measures to be cost-effective. North American programmes usually finance EE measures via on-bill financing. Many programmes either offer a predetermined list of technology options or require an initial energy audit, after which generally also one or several options out of a predetermined list are suggested (Brown, 2009).
Actors On-bill financing programmes are set-up by utilities. In addition, they involve building owners, who decide to initiate RE and EE measures through on-bill fi-nancing. Utilities are frequently able to finance the programmes themselves as they have sufficient equity capital and access to debt facilities. However, the utility may also rely on additional partners for financing, such as banks or gov-ernment bodies, e.g. through revolving funds. Installers of RE equipment may be involved by partnering with the utility. Successful programmes are often characterised by strong partnerships between involved actors (Johnson, 2010; see also PROSOL case study in Appendix A.4 and the case study of Manitoba Hydro in Appendix A.10).

IEA-RETD / Business Models for Renewable Energy in the Built Environment 69
Organisational and financial structure
Figure 4.23 shows a simple model of how an on-bill financing programme may work. In this example a utility provides a loan to a building owner for the instal-lation of RE technology. The building owner in turn repays the principal and in-terest via its utility bill.
Figure 4.23 Schematic depiction of on-bill financing of RET
In the example in Figure 4.23, the utility does not only administer the pro-gramme and collect payments via electricity bills, but it also finances the in-vestments from its own capital. In the U.S., most on-bill financing programmes have been funded by a combination of sources such as the utility’s owns funds, special charges levied from all clients with the aim to support RE and EE measures and government funds. Potentially, funding could also come from is-suing bonds, or other public or private sources of capital (Fuller, 2008). There are different types of on-bill financing programmes, which in the U.S. are distinguished as on-bill loan and on-bill tariff programmes (Brown & Conover, 2009): With an on-bill loan programme, a personal loan is issued to the building owner, repaid as a line-item on the utility bill. However, it is legally not linked to the property or the utility meter. In on-bill tariff programmes on the other hand, the building owner also repays the loan via the utility bill, but in this case it is considered an ‘essential service’ and part of tariff, that the utility charges its customers (Brown & Conover, 2009). The obligation for payments stays with the property and is transferred to the next owner in the case of sale of the property as with PACE financing. Brown and Conover (2009) provide examples for both types of programmes. They also provide an overview of interest rates used in their case study pro-grammes in North America, where rates vary between 0% and 8.5%. Generally, the target for the investments in RE and EE measures is to generate positive cash flows for the property owner. As a consequence, the repayment periods vary depending on the expected energy savings and the useful life of the installed measures (Brown, 2010). In the US and Canada, on-bill financing programmes for energy efficiency retrofits frequently have mid-lengths loan terms: for on-bill loan programmes. repayment periods are often set at around 5 years. For on-bill tariffs, where the loan is legally linked to the utility meter, the payback period of the loan is stretched to about 10 years (Brown, 2010).

70 IEA-RETD / ECN-E--12-014
Existing markets and policy context
On-bill financing programmes have been undertaken by various Canadian and U.S. utilities, for example in New England and California. In North America, suc-cessful on-bill financing programmes date back over 10 years (Franklin Energy, 2011). The case study of the on-bill financing programme of the Canadian utility Manitoba Hydro in Appendix A.10 describes a particularly successful pro-gramme. Brown (2009) provides an overview of on-bill financing programmes undertaken by U.S. utilities. Outside of North America, the Tunisian PROSOL programme for solar water heaters includes an on-bill financing component (see Appendix A.4). In the UK, a scheme similar to an on-bill loan programme is being suggested as central component of the proposed ‘Green Deal’: Under the proposed scheme called ‘Pay-as-you-save’, building users would borrow money from private lend-ers and would pay the loan back through their energy bills. If they moved out and stopped being responsible for the energy bills of the property, the financial obligation would move to the next bill-payer (UK DECC, 2010). The suggested scheme closely resembles the approach taken for the Tunisian PROSOL pro-gramme (see Appendix A.4).
SWOT Analysis
Strengths For building owner / user Overcomes the barrier of high-up front costs, as it allows building owners
to apply RET and EE measures with limited or no own capital outlay.
Interest rates may be significantly lower than if the building owner would arrange for financing himself.
If set up well, the programme can be very simple for the building owner or user.
Generally, investments are structured in a way that there are net energy cost savings for the building owner.
For the customer, it is easy to see potential cost savings on his utility bill by comparing bills before and after the installation of RE and EE measures (Brown & Conover, 2009).
In an on-bill tariff programme, the liability stays with the utility meter, and may thus be not classified as personal debt. As a consequence, lower in-come borrowers or persons who are unable to take on additional debt, may also participate in the programme (Brown & Conover, 2009).
Frequently, the utility guarantees for the performance of the installed equipment thus the building owner or user is not liable if technical prob-lems occur. In on-bill tariff programmes this is more frequently the case than in on-bill financing programmes (Brown, 2009).
For the utility In on-bill tariff programmes, utilities have the ability to disconnect cus-
tomers from utility services in case of default on the loans.
Linking payments to utility bills offers a relatively secure way of recovering the loan. As a consequence, it may be possible to offer attractive interest rates due to the lower default risk. However, engaging with lower income property owners may still increase the risk of default for the utility.
An on-bill financing programme may be a way to increase customer reten-tion in liberalized markets.
An on-bill financing programme may allow a utility to meet targets sets under energy saving obligations.

IEA-RETD / Business Models for Renewable Energy in the Built Environment 71
Weaknesses For the building owner
In the case of on-bill loans, customers must repay the full loan when they sell the property (Brown & Conover, 2009). As a consequence, customers may be hesitant to take on longer term loans. In on-bill tariff programmes where the obligation stays with the meter, loan terms are generally a bit longer.
The range of RET and EE measures that can generally be financed by on-bill financing alone is limited to measures which are cost-effective with a re-payment term of maximal about 10 years. At current prices for conven-tional energy and RE and EE measures a number of potential measures are still too expensive.
For the utility
Generally, utilities are reluctant to enter into wholesale lending business as it is outside their traditional competencies. They consider it risky to use their own capital to make loans to customers. As a consequence utilities undertaking on-bill financing programmes in the U.S. may require short repayment periods of five years or less, which are too short for most po-tential RET and EE measures in the residential sector (CalCEF, 2009).
Changes to the billing system are often difficult and costly to implement.
On-bill tariff programmes require approval of the regulator for the new tariff structure.
Opportunities A potential change in mindset of utilities towards considering energy effi-ciency measures of its customers as opportunities, e.g. due to imposed obli-gations or for reasons of customer retention, may motivate more utilities to become involved in on-bill financing programmes. A utility can also perceive an on-bill financing programme not as an obligation, but as an opportunity to generate returns.
Especially on-bill tariff programmes can be structured in a way that they are also attractive to renter-occupied buildings, as the repayment of the loan is linked to the utility meter (CalCEF, 2009).
Utilities can partner with financial institutions that lend money to private persons and small businesses. This could make on-bill financing more attrac-tive to utilities and leverage the competitive advantages of banks in evaluat-ing and managing consumer credit. The Tunisian PROSOL case study is an example of such a successful collaboration between a utility and financial institutions. Increasing interest from private and institutional investors, e.g. from pension funds, may provide opportunities for utilities to form such partnerships.
Threats In cases where the utility provides the capital for financing an on-bill pro-gramme, the utility may be concerned about defaults on loans and there-fore be unwilling to engage (Brown & Conover, 2009).
If third-parties provide the capital for financing an on-bill programme, there may be a situation where the responsibility for collecting repay-ments lies with the utility and the financial liabilities with the third-party. This situation is relatively unusual and may prevent utilities and third par-ties to engage in an on-bill financing programme (Brown & Conover, 2009).
In the U.S., there are some pending legal issues, for example around the question if a utility is allowed to disconnect customers from its services if they fail to pay (see Nostrand, 2011). Legal issues around the concept can also be expected in other countries where on-bill financing is applied. This poses a risk especially for the first programmes in a new market until the legal situation is fully clarified.
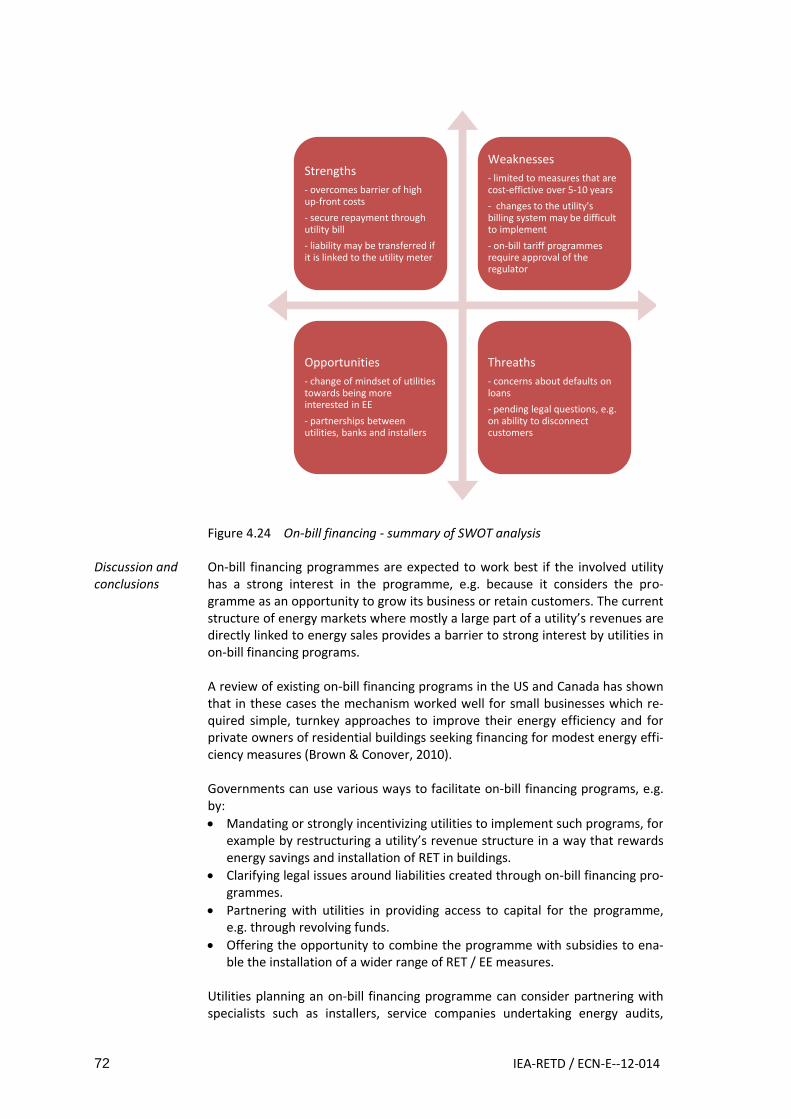
72 IEA-RETD / ECN-E--12-014
Figure 4.24 On-bill financing - summary of SWOT analysis
Discussion and conclusions
On-bill financing programmes are expected to work best if the involved utility has a strong interest in the programme, e.g. because it considers the pro-gramme as an opportunity to grow its business or retain customers. The current structure of energy markets where mostly a large part of a utility’s revenues are directly linked to energy sales provides a barrier to strong interest by utilities in on-bill financing programs. A review of existing on-bill financing programs in the US and Canada has shown that in these cases the mechanism worked well for small businesses which re-quired simple, turnkey approaches to improve their energy efficiency and for private owners of residential buildings seeking financing for modest energy effi-ciency measures (Brown & Conover, 2010). Governments can use various ways to facilitate on-bill financing programs, e.g. by:
Mandating or strongly incentivizing utilities to implement such programs, for example by restructuring a utility’s revenue structure in a way that rewards energy savings and installation of RET in buildings.
Clarifying legal issues around liabilities created through on-bill financing pro-grammes.
Partnering with utilities in providing access to capital for the programme, e.g. through revolving funds.
Offering the opportunity to combine the programme with subsidies to ena-ble the installation of a wider range of RET / EE measures.
Utilities planning an on-bill financing programme can consider partnering with specialists such as installers, service companies undertaking energy audits,
Strengths
- overcomes barrier of high up-front costs
- secure repayment through utility bill
- liability may be transferred if it is linked to the utility meter
Weaknesses
- limited to measures that are cost-effictive over 5-10 years
- changes to the utility's billing system may be difficult to implement
- on-bill tariff programmes require approval of the regulator
Opportunities
- change of mindset of utilities towards being more interested in EE
- partnerships between utilities, banks and installers
Threaths
- concerns about defaults on loans
- pending legal questions, e.g. on ability to disconnect customers

IEA-RETD / Business Models for Renewable Energy in the Built Environment 73
banks and ESCOs. Especially the role of installers and contractors may be critical for successful programs. A review of two US programme for example suggests that the success of these programs depended on the establishment of strong relationships with partners (Johnson 2011). The value of partnerships is also demonstrated in the Tunisian PROSOL example which brought together a num-ber of relevant actors active in the specific market segment. In any case, it is ad-visable for utilities to discuss a planned on-bill financing programme with the energy market regulator, even if it’s an on-bill loan rather than an on-bill tariff programme (Brown, 2009).
Box 4.2 Case in point: PROSOL The Tunisian programme PROSOL creates an innovative structure of support mechanisms to create successful business models around the financing, supply and installation of solar water heaters (SWH). The initial set up of PROSOL included
A capital cost subsidy for 20% or more of the initial cost of the SWH.
Reduction of interest rates through an agreement with participating commercial banks to charge lower interest rates.
An on-bill financing mechanism where customers who install a SWH repay the loan via their electricity bill over a period of 5 years.
PROSOL has generated significant opportunities for companies selling and installing SWH in the country and has stimulated high growth in the number of installed equipment (see Appendix A.4 for more details).

74 IEA-RETD / ECN-E--12-014
4.3.3 Leasing of renewable energy equipment
Description Leasing enables a building owner to use a renewable energy installation with-out having to buy it. The installation is owned or invested in by another party, usually a financial institution such as a bank. The building owner pays a periodic lease payment to that party (Activum finance, 2011). Leasing therefore resem-bles renting (Brealey & Meyers, 2003) or hiring of a renewable energy technol-ogy. Generally, the financial institution (or another actor who offers the lease, i.e. the lessor) remains owner of the asset during the lease period. However, sev-eral types of leasing are possible, which differ in ownership and other econom-ic, legal and fiscal conditions (Clearsupport, 2008; Bleyl, 2008). There are two main types of leases: operational lease and financial lease. Leasing can be a central component of the business model of an Energy Service Company which has limited own capital and therefore also only limited access to debt, but may lease equipment from a financial institution. The ESCO then installs the equipment at the premises of its customers as part of the services that it offers. However, building owners may also finance RET via leasing with-out the involvement of an ESCO. Leasing can also be a central component of the business model of a company that introduces a specific new technology to the market. The company that provides the technology can offer it to property owners via a leasing arrange-ment, including a service and maintenance package.
Market segments Leasing could be applicable to all types of buildings.
Applicable tech-nologies
Leasing is common for certain moveable goods such as cars, but also other equipment, like ships and airplanes (Activum finance, 2011 & Bleyl, 2008). Leas-ing may be available for energy equipment and installations like condensing boilers (AgentschapNL, 2010), small and micro-CHP systems or solar energy equipment in buildings. The case study in Appendix A.8 describes for example leasing of a large heat pump system in an office building. However, overall, leasing is not frequently used for RET. One reason for this is that not all RET can be leased. Generally, any equipment which is an integral part of a building is to be owned by the building owner. If installed technologies become part of the building, an operational lease is impossible because for this type of lease the ownership has to remain with the lessor, i.e. the actor offering the lease. An-other reason is that regulation usually requires that after the leasing period, an asset can be reused in reasonable state at a different time and place. This crite-ria is referred to as ‘fungibility’ (Bleyl, 2008). RET systems such as soil- or water-based heat pumps do not meet this criterion as the complete system cannot be removed without substantial damage. Similarly building insulation, which is of-ten a very suitable EE measure, cannot be removed after the end of the lease term.
Actors Usually an ESCO or a building owner takes a lease while a financial institution or bank provides it (Bleyl, 2008). Also, a company aiming to introduce a new tech-nology to the market may offer leasing of this technologies to a building owner or user.
Organisational and financial
Leasing involves a temporary financing contract between a party (the ‘lessor’, such as a bank) that provides an asset (such as a renewable energy technology)
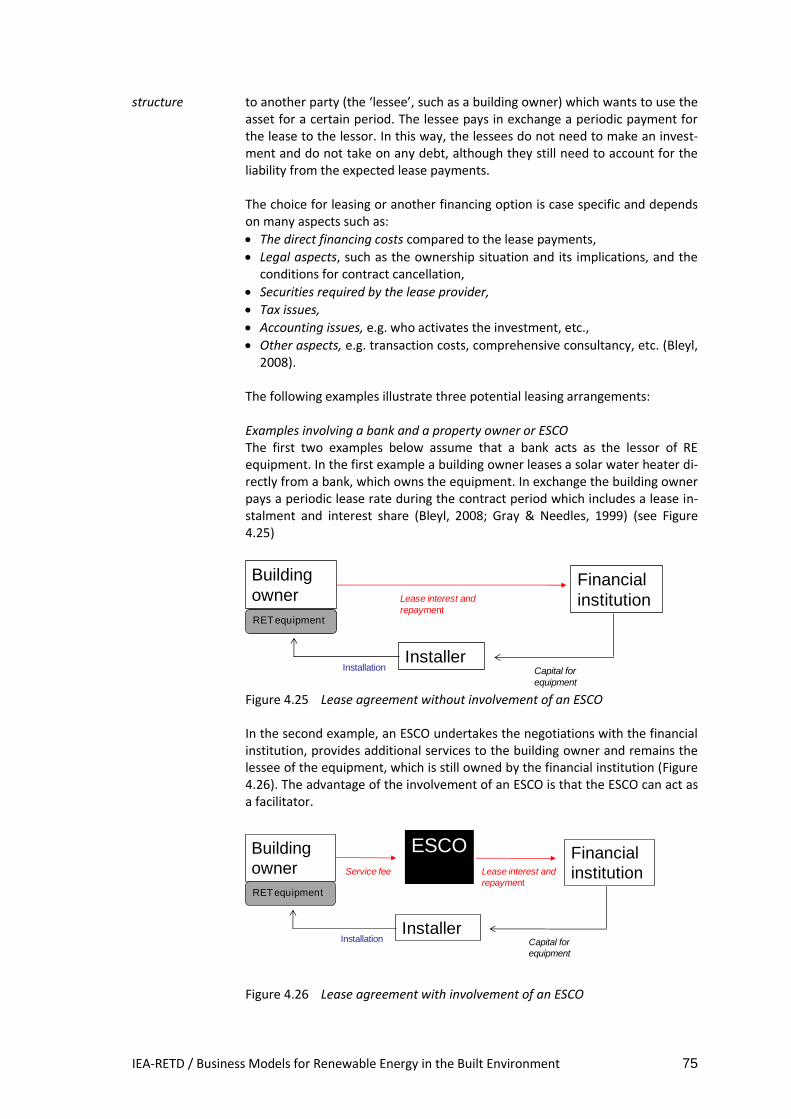
IEA-RETD / Business Models for Renewable Energy in the Built Environment 75
structure
to another party (the ‘lessee’, such as a building owner) which wants to use the asset for a certain period. The lessee pays in exchange a periodic payment for the lease to the lessor. In this way, the lessees do not need to make an invest-ment and do not take on any debt, although they still need to account for the liability from the expected lease payments.
The choice for leasing or another financing option is case specific and depends on many aspects such as:
The direct financing costs compared to the lease payments,
Legal aspects, such as the ownership situation and its implications, and the conditions for contract cancellation,
Securities required by the lease provider,
Tax issues,
Accounting issues, e.g. who activates the investment, etc.,
Other aspects, e.g. transaction costs, comprehensive consultancy, etc. (Bleyl, 2008).
The following examples illustrate three potential leasing arrangements:
Examples involving a bank and a property owner or ESCO The first two examples below assume that a bank acts as the lessor of RE equipment. In the first example a building owner leases a solar water heater di-rectly from a bank, which owns the equipment. In exchange the building owner pays a periodic lease rate during the contract period which includes a lease in-stalment and interest share (Bleyl, 2008; Gray & Needles, 1999) (see Figure 4.25)
Figure 4.25 Lease agreement without involvement of an ESCO
In the second example, an ESCO undertakes the negotiations with the financial institution, provides additional services to the building owner and remains the lessee of the equipment, which is still owned by the financial institution (Figure 4.26). The advantage of the involvement of an ESCO is that the ESCO can act as a facilitator.
Figure 4.26 Lease agreement with involvement of an ESCO
Building
owner
RETequipment
Financial
institutionLease interest and
repayment
InstallationInstaller
Capital for
equipment
Building
owner
RETequipment
Installation
Financial
institutionLease interest and
repayment
InstallerCapital for
equipment
ESCOService fee

76 IEA-RETD / ECN-E--12-014
The example of the lease of a large heat pump system described in Appendix A.8 illustrates a slightly different structure where the involved ESCO is the les-sor and economic owner of the RET. Example involving a technology provider In the third example, a provider of a specific technology, e.g. a micro-CHP sys-tem, leases the system to private or commercial customers. This approach is mostly used by companies who want to bring a new (energy) technology to the market, and have to compete against established technologies, traditional in-stitutional areas of influence and potentially long supply chains to individual customers (Foxona, 2005). The technology provider usually also provides oper-ation and maintenance services for the equipment.
Figure 4.27 Leasing arrangement between a company distributing a specific
technology and a building owner
Ownership of the assets In leasing arrangements there is a difference between legal ownership and economic ownership (AgentschapNL, 2010). In the first two examples, the bank always has legal ownership over the asset (at least during the leasing period), meaning that it has ultimate decision power over the asset. This aspect distin-guishes a lease from a loan, because with a loan the building owner (or ESCO) holds legal ownership (the money to buy the asset is ‘rented’, not the asset it-self). Economic ownership over the asset can however be either at the building own-er/ESCO or the bank. Economic ownership implies that a party receives eco-nomic benefits, such as tax benefits from deducting lease rates, but also bears economic risks from the asset, such as damage to the equipment31. The eco-nomic owner is obliged to capitalize the asset on its balance sheet (Bleyl & Suhr, 2006). The ownership situation is a main difference between an operation and finan-cial lease. With an operational lease the bank owns the economic rights, with a financial lease the ESCO/building owner does. Thus only operational leasing is regarded as off-balance sheet financing (IEA, 2010) as the value of the lease contract does not appear on the building owner’s balance sheet. With a finan-cial lease, it is possible that after the lease period the lessee also become the full legal owner of the leased asset (Activum finance, 2011). Differences be-tween operational and financial lease are explained in detail in Bleyl (2008). Provision of additional services Additional services provided are another difference between an operational and financial lease. In case of an operational lease a building owner is not re-
31
In other words, economic ownership of an asset defines who bears the risk from an increase or decrease of value of an asset.

IEA-RETD / Business Models for Renewable Energy in the Built Environment 77
sponsible for e.g. financial accounting and administrative obligations. The bank (or other lessor) performs these as lease services to the building owner (Clear-support, 2008). With a financial lease, the building owner is responsible for these arrangements. An operational lease thus offers more outsourcing of ser-vices and comfort to the building owner. Differences between a lease and a loan There are also differences between a lease and a loan:
Leasing is generally more expensive for the ESCO/building owner than a loan (Clearsupport, 2008)32, but in return provides more services to the building owner, for example, the lease service package can include technical consultan-cy. Administrative costs e.g. for negotiating terms are expected to be higher than for a loan as a lease contract for energy equipment is generally more complex than a loan (IEA, 2007). However, the Dutch energy service company Essent (2011), who facilitates leasing contracts for energy equipment between its clients and a financial institution, indicates the additional costs are limited when standard lease agreements and procedures are established and projects are sufficiently large to have relatively low transaction costs.
Leasing is considered to be more flexible than a loan, as for example shorter depreciation schemes are possible. For a loan, depreciation times are regu-lated by tax law33. Also, a financial lease contract can usually be set for a shorter term than a loan.
Tax deductions are possible for both operational leases (deduction of lease rates) and financial leases. Leasing can for example enable organisation to make use of subsidies or tax advantages for which they would normally not be eligible, e.g. because their legal status does not allow for it, but the subsi-dy or tax advantages can be claimed by the lessor and passed on to the les-see (Clearsupport, 2008; AgentschapNL, 2010).
Existing markets and policy context
Country specific regulation on leasing, e.g. regulation on tax implications and depreciation, may have a substantial impact on the decision if leasing is an at-tractive option for a building owner or ESCO (Clearsupport, 2008). Overall, leasing is not frequently used to finance RET. In Austria, leasing is for example typically applied for large scale renewable energy projects, e.g. wind farms but is not common for RE in buildings. In the Netherlands, only some en-ergy service providers are known to rent or lease solar water heater to their clients (Milieucentraal, 2011). Energy companies usually rather rent or sell RET instead of offering leasing arrangements. Financial institutions are generally found to be not very open to leasing energy technologies (Fina-ret, 2008), probably because energy is not part of their core business, because they are not familiar with the implications of leasing of RET, or because they may not want to take the risks associated with ownership of the technology. According to Essent (2011) the creditworthiness of the client and a financially sound business case are the main requirements by a bank for leasing. Public organisations would therefore be more easily accepted as clients than commercial actors.
32
Examples of reasons are higher asset risk (responsibility of operation and maintenance remains at the lessee), flexibility of a leasing contract (e.g. banks are more flexible in setting the lease period) and additional leasing ser-vices that are usually provided (e.g. subsidy acquisition).
33 In practice, depreciation periods are usually fixed for 15 years depending on the nature of the asset and ex-pected lifespan.

78 IEA-RETD / ECN-E--12-014
SWOT Analysis
Strengths For a building owner / user
Leasing of equipment provides a building owner or occupier the opportunity to use this equipment without initial investments, thus helping to overcome the barrier of high up-front costs.
By leasing via an energy service contractor, the building owners may profit from additional services such as specific financial, legal, fiscal and adminis-trative consultancy, and operation and maintenance services. This may imply lower financing costs (due to better understanding of the risk by the lessor) and lower transaction costs and effort for lessee (Bleyl, 2008).
Leasing terms are generally more flexible than for a loan. For example, banks are more flexible in setting lease periods.
Leasing can be structured in a way that makes optimal use of subsidies and tax deductions.
By leasing off the balance sheet, the building owner or ESCO can access ad-ditional financing to invest in other assets (Bley, 2008).
For an ESCO that leases equipment from a financial institution
Leasing is more flexible than debt because it can be used to finance part of a project. With a loan (such as a mortgage) this is more difficult, as ownership rights of parties involved determine the possibilities of mortgage financing (Essent, 2011).
For a technology provider that leases out equipment
The company can keep the responsibility for maintenance which may be im-portant for technologies which are just entering the market or for technolo-gies that are very maintenance intensive, e.g. CHP systems based on gas en-gines.
Leasing provides an opportunity to distribute a technology that is too costly to be sold but that does generate cost savings over its life-time.
Leasing provides an opportunity to distribute an energy technology in which customers may not yet have trust because it’s new and considered risky, e.g. fuel cells.
Weaknesses Financial institutions are hesitant to become active in leasing out RET as
energy is not their core business and they may not want to assume opera-tional risk.
Not all renewable energy projects or technologies qualify for leasing, as it must be possible to remove the technology from the building.
A bank might put requirements on the building owner, for instance a maintenance requirement, or a provision of extra collateral in addition to expected project cash flows (Bleyl, 2008).
Although, leasing periods can be set flexibly, leasing is typically undertaken for a fixed leasing period during which termination of the lease is not pos-sible (Clearsupport, 2008).
Opportunities & Threats
Changes in country specific regulations, such as accounting and tax regula-tions, may impact the attractiveness of leasing.

IEA-RETD / Business Models for Renewable Energy in the Built Environment 79
Figure 4.28 Leasing of RET - summary of the SWOT analysis
Discussion and conclusions
In general, leasing is not commonly used for renewable energy projects for rea-sons of suitability of RET for leasing and due to its lacking attractiveness to market parties.
For a building owner, the main advantage of leasing is that he can use the leased equipment without having to invest in it. Although not part of a leasing arrangement itself, a maintenance contract is frequently offered in combina-tion with leasing. This reduces the effort required by the building owner, but also the technical risk for the lessor. Leasing is generally more expensive than taking a loan or financing the equipment otherwise. It is, however, difficult to assess the exact comparative advantages or disadvantages of a lease over oth-er financing options on a general level. This requires a detailed assessment of several financial aspects, including tax and accounting regulations.
Specifically for ESCOs which often have limited own capital and therefore also limited access to debt, leasing of equipment offers opportunities to offer more comprehensive services.
At the moment there is no clear evidence that leasing contributes significantly to an increased use of RET in buildings. Leasing may offer opportunities for the introduction of new technologies to the market. Leasing is for example used for the distribution of small and micro-CHP systems (see Box 4.3 and Appendix A.7). As demonstrated in the example in Appendix A.7 by the cooperation be-tween Volkswagen and LichtBlick innovative business models are emerging that make use of leasing out of equipment or similar arrangements. Government support for such new and innovative business models has to be targeted to the specific technology and market environment. Aggregation of small CHP systems in order to manage imbalances in electricity supply and demand could for ex-ample be supported through an improved IT infrastructure such as smart grids and smart meters.
Strengths
- overcomes barrier of high up-front cost for building owner
- flexible structure, e.g. in setting lease periods and making optimal use of subsidies and tax deductions
- may be used for market introduction of new and innovative technologies
Weaknesses
- more expensive than a loan
- banks are hesitant to offer leases as energy is not their core business and they may not want to assume operational risk
- not all RET qualify for leasing
Opportunities
- Changes in country specific regulations, such as accounting and tax regulations
Threaths
- Changes in country specific regulations, such as accounting and tax regulations

80 IEA-RETD / ECN-E--12-014
Box 4.3 Case in point: Market introduction of small and micro CHP systems Leasing is being applied by companies in different countries and contexts for the market intro-duction of small and micro CHP systems. Appendix A.7 illustrates two case studies from Japan and Germany.
4.3.4 Business models based on Energy Saving Obligations
Description Energy Saving Obligation schemes, sometimes also referred to as White Certifi-cates, are not a business model in itself, but a policy instrument that obliges energy companies to realise energy savings. It stimulates business models based on financial incentives offered by energy suppliers to building owners, renters or to energy service companies. The obligations mandate energy sup-pliers to realize energy savings at the level of end users. Though primarily aimed at energy savings and energy efficiency, this regulation could potentially also be an important driver for investments in RET in the built environment. Energy Saving Obligations may stimulate energy companies to develop business models to realize the mandated energy savings, e.g. by offering new energy ef-ficiency services to customers (often in partnership with electricians and in-stallers) as is the case in France, or by ‘outsourcing’ a large part of the obliga-tions to Energy Service Companies and thus creating a significant ESCO market, as is the case in Italy (Boot, 2009; ECN, 2011b). Mostly, energy companies are allowed to pass on the costs of the EE measures (and potentially RET) to all consumers via higher energy prices. Thus, the saving obligations can also be considered a financing mechanism for the development of energy savings or RET.
Market segments Energy saving obligations mostly target existing buildings. Within this segment, the specific sub-segment targeted differs by country. In the UK, the savings must for example be realized in residential buildings. 40% of savings needs to be realized in low income households to reduce energy poverty (Ofgem, 2010). (A more detailed description of the UK energy supplier obligation is given in Appendix A.9.) The French regulation also mostly targets the residential sector (90% of realized savings in the first obligation period) and includes fuel poverty as a consideration (JRC, 2011). In Denmark the residential sector is not the pri-mary target for savings but rather other end-use sectors such as industry.
Applicable technologies
Most existing schemes focus on energy efficiency measures. However, Energy Saving Obligations could be extended to cover RET. In the UK scheme, insula-tion is for example the dominant measure, followed by energy-efficient light-ing. The share of RET is small (Ofgem, 2010; see also Appendix A.9). Until March 2011, 2,000 m2 solar water heating and 5,500 heat pumps have been in-stalled (Ofgem, 2011). In France most savings are realized by installing efficient condensing boilers. A little more than 10% of the certificates were generated through the installation of heat pumps (JRC, 2011).
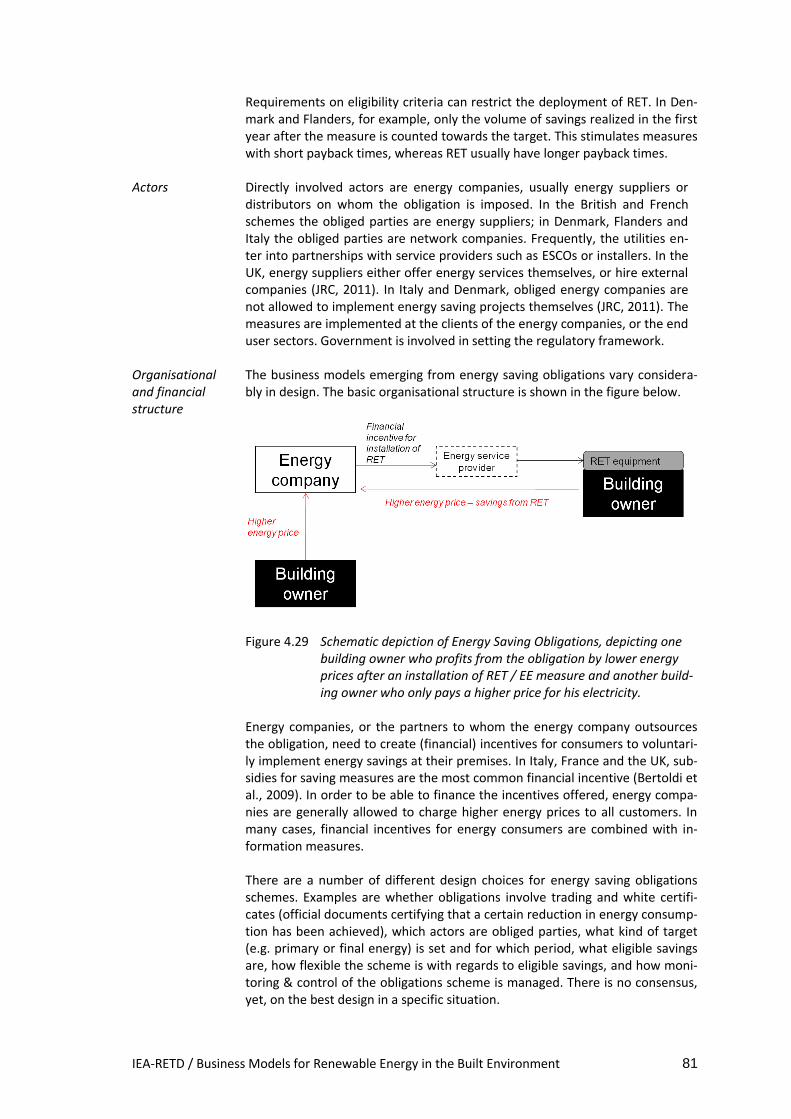
IEA-RETD / Business Models for Renewable Energy in the Built Environment 81
Requirements on eligibility criteria can restrict the deployment of RET. In Den-mark and Flanders, for example, only the volume of savings realized in the first year after the measure is counted towards the target. This stimulates measures with short payback times, whereas RET usually have longer payback times.
Actors Directly involved actors are energy companies, usually energy suppliers or distributors on whom the obligation is imposed. In the British and French schemes the obliged parties are energy suppliers; in Denmark, Flanders and Italy the obliged parties are network companies. Frequently, the utilities en-ter into partnerships with service providers such as ESCOs or installers. In the UK, energy suppliers either offer energy services themselves, or hire external companies (JRC, 2011). In Italy and Denmark, obliged energy companies are not allowed to implement energy saving projects themselves (JRC, 2011). The measures are implemented at the clients of the energy companies, or the end user sectors. Government is involved in setting the regulatory framework.
Organisational and financial structure
The business models emerging from energy saving obligations vary considera-bly in design. The basic organisational structure is shown in the figure below.
Figure 4.29 Schematic depiction of Energy Saving Obligations, depicting one building owner who profits from the obligation by lower energy prices after an installation of RET / EE measure and another build-ing owner who only pays a higher price for his electricity.
Energy companies, or the partners to whom the energy company outsources the obligation, need to create (financial) incentives for consumers to voluntari-ly implement energy savings at their premises. In Italy, France and the UK, sub-sidies for saving measures are the most common financial incentive (Bertoldi et al., 2009). In order to be able to finance the incentives offered, energy compa-nies are generally allowed to charge higher energy prices to all customers. In many cases, financial incentives for energy consumers are combined with in-formation measures.
There are a number of different design choices for energy saving obligations schemes. Examples are whether obligations involve trading and white certifi-cates (official documents certifying that a certain reduction in energy consump-tion has been achieved), which actors are obliged parties, what kind of target (e.g. primary or final energy) is set and for which period, what eligible savings are, how flexible the scheme is with regards to eligible savings, and how moni-toring & control of the obligations scheme is managed. There is no consensus, yet, on the best design in a specific situation.

82 IEA-RETD / ECN-E--12-014
In the UK, energy suppliers are estimate to have invested 3.2 billion pounds be-tween 2008 and 2011 in saving measures at households. Many saving measures are delivered by the suppliers at no cost to the homeowner (Ofgem, 2010; see also see also Appendix A.9). Suppliers in the UK use several ways to persuade homeowners to take saving measures. The most important is subsi-dizing the installation of measures by installers. Other suppliers are marketing programs to private homeowners, enter into partnerships with local public or-ganisations (social housing corporations) or with other government saving pro-grammes (Ofgem, 2010).
In France, consumers do not directly pay the costs of saving measures. Energy suppliers provide financial incentives to customers such as subsidies and soft loans (JRC, 2011). Investment can be earned back via energy bills, but since en-ergy tariffs are regulated the regulator needs to take these investments into account (Bertoldi et al., 2009). Most energy suppliers have set up their own programs.
Existing markets and policy context
As of 2011 four EU Member States and one region in the EU have an energy saving obligation scheme in place: the United Kingdom, Denmark, France, Italy and the Flemish region in Belgium. Some countries seem to be planning or con-sidering Energy Saving Obligations schemes, e.g. Poland, Ireland, Bulgaria, Ro-mania, Germany, and Portugal. Research in Sweden advised against the imple-mentation of an obligation scheme following an ex ante evaluation. (ECN, 2011).
Energy saving obligations also exist in the US, as of 2009 in 15 states. Some of these are combined with renewable portfolio standards (RPSs), which mandat-ed energy suppliers to produce renewable electricity, mostly through large-scale wind, solar, biomass and geothermal installations (US EPA, 2011). As of 2011, there are RPSs in 43 states (Dsireusa, 2011). However, it is not expected that a significant amount of RET is deployed in buildings under these schemes. Although small scale renewable energy production is possible, it is not widely eligible under the existing RSPs. Moreover, the financial incentives offered to building owners are mostly not attractive. Concrete data on the deployment of small scale RET in buildings under RPSs does not exist (US EPA, 2011b).
SWOT Analysis
Strengths For governments
Energy Saving Obligations are a means for government to catalyse energy savings without having to use government funds to finance and administer the programme. Instead, costs are paid for via higher electricity prices.
Energy Saving Obligations mandate energy suppliers to take action thus ad-dressing the barrier ‘lacking intrinsic interest by energy companies’, which implies that due to their revenue structure, energy suppliers have no inter-est in efficiency measures.
Energy companies are generally in a strong position to implement the obliga-tions as they already have direct contacts to households, which are their cus-tomers, and are often in a healthy financial position.

IEA-RETD / Business Models for Renewable Energy in the Built Environment 83
For building owners
Energy Saving Obligations reduce the barrier of high up-front costs or cost effectiveness of EE measures or RET for the building owner, as obliged en-ergy companies provide financial incentives.
The building owner is usually supported by energy companies with infor-mation and advice, and organisation of the installation.
For ESCOs
Energy Saving Obligations may create demand for energy efficiency services.
Weaknesses For building owners & the public
Energy Saving Obligations lead to higher energy prices as energy compa-nies need to recover their costs. However, the price increase may be lim-ited (Bertoldi & Rezessy, 2009). At the same time the level of ambition of the obligation is linked to the level of energy price increases.
There is a problem of equity, as not all consumers profit from the savings, but all pay higher energy prices.
For governments
Policy implementation can be costly depending on the design of the verifi-cation approach and depending if and how trading is allowed within the obligation scheme.
Energy Saving Obligations mainly catalyse EE measures which generally have lower up-front costs or are more cost effective than RET, unless the latter is supported by additional incentives.
Energy companies are likely to first target technologies or even building segments with the lowest improvement costs (realize the most cost-effective measures). The majority of the implementation costs may thus be postponed to the future, which can overstate the scheme’s cost effective-ness in the beginning and can make the realisation of saving targets in the future more difficult.
Opportunities Countries have the opportunity to design the obligation scheme in a way that also stimulates RET in buildings, e.g. by incentivizing RET, for example awarding it with more certificates, or by only allowing RET instead of EE measures in specific situations.
Energy Saving Obligations may strengthen the competitive position of ener-gy companies as the obligations may incentivise companies to increase their scope of services and focus on maintaining long term customer relation-ships. However, this requires energy companies to make an effort to adapt their business model (Bertoldi & Rezessy, 2009).
The proposed EU Energy Efficiency Directive, replacing the current EU Energy Services Directive, is expected to introduce mandatory national energy sav-ing obligation schemes in every EU member state.
Increasing energy market liberalisation in some countries can enable a fair cost recovery from consumers by energy companies as energy price increas-es need to be competitive (i.e. not too high).
Threats Utilities may have little intrinsic interest in implementing the savings obliga-
tions as it is not part of their traditional core business and may negatively af-fect their revenues as energy sales go down. This may lead to programs that do not achieve the full savings potential or that are not designed in a cost-efficient way.
Governments may be hesitant to approve increases in energy prices.

84 IEA-RETD / ECN-E--12-014
Figure 4.30 Energy Saving Obligation - summary of the SWOT analysis
Discussion and conclusions
Energy Saving Obligations are not a business model by themselves, but a policy instrument that may lead to business models based on financial incentives of-fered by energy companies to building owners, building users or to energy ser-vice companies. Energy Saving Obligations can be a powerful instrument as they force energy companies, i.e. energy suppliers or distributors to actively pursue EE measures and potentially RET. The advantage for governments is that they can ‘outsource’ the financing and implementation of energy efficien-cy measures and only need to set the regulatory framework and undertake the monitoring of the implementation of the directive. There are many approaches in designing Energy Savings Obligations, e.g. with or without associated trading of certificates, targeting different (sub-) sectors and technologies, and involving different actors for implementation. Given the limited experience with the scheme to date, it is too early to tell which ap-proaches are most effective and efficient under which background conditions. In the EU, Energy Saving Obligations are expected to become widely used if the proposed EU Energy Efficiency Directive is implemented.
Strengths
- do not require the use of government funds
- mandates energy suppliers to take action
- create demand for energy services
Weaknesses
- ambition level limited by level of energy prices increase
- targets mostly EE measures, not RET
- equity issue: all consumers pay higher prices, but only some profit from lower energy costs
Opportunities
- include RET in buidlings into the Energy Saving Obligations scheme
- mandandatory national Energy Saving Obligations schemes included in the proposed EU Energy Efficiency Directive
Threaths
- little intrinsic interest by utilities
- hesistancy to increase energy prices

IEA-RETD / Business Models for Renewable Energy in the Built Environment 85
5. Synthesis: business models, barriers, market segments and actors
This chapter summarizes and evaluates key features of the business models discussed in the previ-ous chapter and puts them into a larger perspective. The analysis looks at which barriers are ad-dressed by the business models described in this report, in which market segments the business models can work, and which actors are directly involved. In this way, it addresses the question how the analysed business models can stimulate an increased deployment of RET in the built environ-ment. The chapter ends with conclusions and an outlook.
5.1 Which barriers are addressed by business models?
This section discusses which barriers are addressed by the business models analysed in this report (see also Table 5.1). For each barrier it describes whether the barrier can be addressed via one or several of the business models and how. Table 5.1 illustrates which barriers the business models described here are able to address. Generally, some barriers such as ‘high up front costs’, ‘higher risk from RET than from conventional technologies’, and the ‘hassle factor’ are addressed by out-sourcing these issues to a third party who is better equipped to deal with them than a building owner. Other barriers cannot be addressed by business models. Regulatory barriers, for instance, can only be removed by policy makers, and ‘low priority of energy issues’ is mostly related to the mindset of decision makers. Furthermore, there are barriers, such as high transaction costs, that could be addressed by business models, but not by those described here (see Chapter 5.4 below). The individual barriers can be addressed as follows: Low or no return on investment Generally, most of the business models analysed here cannot change pay-back periods of EE measures or RET. Thus, on a large scale, these business models work only if RET are cost-competitive over the assumed life cycle of the equipment compared to traditional energy sources. There are some exceptions to this rule such as a deployment of RET / EE measures due to improved corporate reputation from ‘green’ buildings. However, this exceptions tends to be limited to niche markets and is insufficient for large-scale deployment. Other exceptions are situations where a business model directly depends on a financial incentive, and business models that create econo-mies of scale, lowering the costs for RET. Note that economies of scale are not an important ele-ment in the business models analysed in this study. Thus, for most business models to be successful, the barrier ‘low (or no) return on investment’ needs to be overcome first. Today, many cost-effective opportunities for a deployment of RET and EE measures (see e.g. examples in Box 5.2) exist already, i.e. in these cases the barrier low (or no) return on investment is overcome. However, other RET are not yet competitive and depend on fi-nancial or policy support. Without such additional support most business models34 only lead to a deployment of cost-effective technologies and the business models address other barriers than ‘low or no return on investment’ which prevent a larger deployment of RET / EE measures.
34
These business models are: the ESCO models, on-bill financing, PACE financing, leasing, and the business model based on the ability to charge higher rents to tenants.

86 IEA-RETD / ECN-E--12-014
The business models based on new revenue schemes, i.e. ‘Making use of a feed-in remuneration scheme’, ‘Developing properties certified with a ‘green’ building label’, and ‘Profiting from rent in-creases after the implementation of EE measures’ address the barrier of low return on investments by compensating for the low returns via additional revenues. Alternatively, policy makers may de-ploy a variety of other financial incentives such as subsidies or soft loans. RET can also be mandated via an obligation. Examples for such obligations are the Spanish solar thermal ordinance and the Renewable Portfolio Standards in the US and Japan. Another approach to overcoming the barrier of ‘low return on investment (ROI)’ could be to outsource the investment to a third-party who is able to improve the ROI through a lower cost structure.
Table 5.1 Barriers addressed by the business models
Product Service Systems
Revenue models
Financing schemes
Ener
gy S
up
ply
Co
ntr
acti
ng
Ener
gy P
erfo
rman
ce C
on
trac
tin
g
Inte
grat
ed E
ner
gu C
on
trac
tin
g
Feed
-in
rem
un
erat
ion
Sale
of
cert
ifie
d b
uild
ings
Pro
fits
fro
m r
ent
incr
ease
PA
CE
fin
anci
ng
On
-bill
fin
anci
ng
Leas
ing
Ener
gy s
avin
gs o
blig
atio
ns
Market and social barriers
Price distortion
No interest by energy companies
Low priority of energy issues
The ‘hassle factor’
Split incentives
(1)
Fragmentation building chain
Information barriers Lack of awareness
Limited information on financing
Limited competence of installers
Regulatory barriers Restrictive procurement rules
Cumbersome building permitting process
Economic and Financial barriers Low or no return on investment
High upfront costs
Difficult access to capital
Higher risk of RET
High transaction costs
Incomplete mortgage assessment
(1)
Limited to split incentives between landlords and tenants in the rental market

IEA-RETD / Business Models for Renewable Energy in the Built Environment 87
High up-front costs and lacking access to capital The barriers of ‘high up-front cost’ and ‘lacking access to capital’ can be addressed through out-sourcing the investment to a third party, which recuperates the investment plus capital cost over a project term oriented at the life-time of the equipment. These barriers are most frequently ad-dressed by the business models analysed here (see Table 5.1), i.e. by the product service system / Energy Contracting business models and by the business models based on new financing schemes (PACE financing, on-bill financing, and leasing). The ESCO models and new financing schemes spread the investment costs for RET over the life time of the project. This ‘life-cycle approach’ pro-vides opportunities to building owners with limited investment budgets. However, access to capital comes at a price: The calculations in Box 5.2 demonstrate the large impact of interest rates on the cost effectiveness of investments in RET.
Higher risk (technical, economical, etc.) Business models allow decision makers to outsource technical and economic risks of RET imple-mentation and operation to a third party. In the Energy Contracting models, the ESCO is paid for the output delivered, i.e. the energy supply and/or savings, and takes on the technical and econom-ic risks. As a consequence, ESCOs generally apply proven technologies with which they have suffi-cient experience. However, the technology applied could be new to the building owner, who may perceive them as high risk. Usually, an ESCO is unable to take on the high risks involved in the in-troduction of technologies which are under development or being piloted. However, there are ex-amples of companies that introduce new high-risk technologies to the market by offering leasing of the technologies in combination with a maintenance agreement (see case study on small and mi-cro-CHP in Appendix A.7).
The ‘hassle factor’ The ‘hassle facto’r may be overcome by outsourcing a (complete) service package to a third party, which allows building owners to avoid having to manage several different actors and interfaces. The Energy Contracting models are the most obvious example for this as they offer a whole set of services to building owners, e.g. planning, installation, permitting, financing, operation and maintenance. The business models ‘PACE financing’ and ‘on-bill financing’ address this barrier to a lesser extent, generally offering a combination of technical advice, access to capital and installation services to building owners.
Lack of information The involvement of specialized companies addresses this barrier, as specialists typically have a bet-ter knowledge of RET and of available financing options and subsidy schemes than building owners, as well as trained resources to implement RET projects.
Split incentives Split incentives can be overcome through binding agreements between involved actors, in which the parties who profit from RET / EE measures contribute to the required investment costs. ESCO models can address the split incentive barrier, if there is such an agreement between involved par-ties and if the prevailing legislation allows for this. Split incentives may also be overcome by allow-ing building owners to recover the costs for investments into RET / EE measures from their tenants. This business model is the only one which specifically targets the barrier of split incentives between landlords and tenants. The feasibility of the model depends on the country-specific regulation regu-lating the rental sector. Another split incentive occurs when buildings frequently change ownership, which lowers the in-centive for current owners to invest as they may not be able to recover their investment when sell-ing the house. This specific barrier is addressed by the business model ‘PACE financing’ and partly by the model ‘on-bill financing’ where the debts stay with the property respectively the utility me-ter when a property is sold.

88 IEA-RETD / ECN-E--12-014
‘Low priority of energy issues’ and’ lack of awareness’ Building owners have a central role in all of the analysed business models as they are usually the party who takes the final decision to install RET / EE measures (see Table 5,3). However, no busi-ness model addresses the barriers of ‘low priority of energy issues’ and ‘lack of awareness’, which keep building owners from taking action. In the EU ESCO market for example, the lack of sufficient projects was assumed to be the main bottleneck for market growth in the past rather than the availability of financing. In other words, not enough building owners had an interest to involve an ESCO. Government may address this barrier by voluntary measures, e.g. supporting project devel-opment by taking on the role as a market facilitator for energy services. However, the business model analysis has found no evidence that the business models alone will drive a significant transformation of the market, maybe except for energy saving obligations, which mandate energy savings from energy suppliers, but are not a business model in itself. Overall it seems that voluntary measures alone are not sufficient to drive a significantly increased deploy-ment of RET in the built environment. Similarly, the currently discussed revision of the EU Energy Services Directive (ESD) reflects that the existing regulatory framework and incentive programs are not sufficient to reach the EU’s 2020 energy savings goals.
Combining business models The discussion of the barriers that the business models address demonstrates that business models mostly address only a few barriers. This points to the potential for combining business models in order to overcome several barriers and make the models more viable. As demonstrated by the case studies described in the report, many real world examples of business models supporting an in-creased deployment of RET and EE measures in the built environment indeed combine two or sev-eral of the ‘single business models’ analysed in the previous chapter. Examples include leasing as a financing option in an energy contracting project (see Appendix A.8), or specific financial incentives to support the realisation of energy savings in energy saving obligations.
5.2 In which market segments can the business models be applied?
The following chapter discusses in which market segments the business models analysed in this re-port work best (see also Table 5.2). The market segments themselves are categorized by specific characteristics and the relevant barriers (see Chapter 2.2 and Table 2.1). Table 5.2 shows that the analysed business models are diverse in the sense that for each market segment at least two of the models are applicable.
Existing free-standing residential buildings Existing free-standing owner-occupied residential buildings are characterised by the fact that build-ing owners have the choice to take investment decisions for RET / EE measures, but may not have a high level of interest, knowledge and available capital. The business models based on a ‘feed-in re-muneration scheme’, ‘PACE financing’, ‘on-bill financing’, ‘leasing (of small-scale technologies)’ and ‘energy saving obligations’ may lead to an increased deployment of RET / EE measures in this seg-ment, as they address the barrier of ‘high upfront costs’ and present a business case to building owners through which they can profit from resulting cost savings or additional revenues.
Existing owner-occupied multi-family buildings In owner-occupied multi-family buildings, space outside of the apartments such as roof and garden space, as well as the outer shell of the building are frequently commonly owned. This limits the op-tions for apartment owners to install RET / EE measures in existing buildings unless a common agreement among the different owners is reached. However, given agreement among owners and assuming a sufficient size (> 20k EUR energy costs / yr or roughly about 10-15 apartments (Eikmeier et.al. 2009), Energy Supply Contracting might work in this market segment.

IEA-RETD / Business Models for Renewable Energy in the Built Environment 89
Table 5.2 Market segments in which the business models work
Product-Service Systems
based on new revenue models
based on new financing schemes
Ener
gy S
up
ply
Co
ntr
acti
ng
Ener
gy P
erfo
rman
ce C
on
trac
tin
g
Inte
grat
ed E
ner
gy C
on
trac
tin
g
Feed
-in
rem
un
erat
ion
Sale
of
cert
ifie
d b
uild
ings
Pro
fits
fro
m r
ent
incr
ease
PA
CE
fin
anci
ng
On
-bill
fin
anci
ng
Leas
ing
Ener
gy s
avin
gs o
blig
atio
ns
Res
iden
tial
bu
ildin
gs
New
Built by a project developer
Built by the building owner
Exis
tin
g
Owner-occupied
Multi-family
Free-standing
Rented Multi-family
Free-standing
Co
mm
erci
al
bu
ildin
gs
New
Built by a project developer
Built by the building owner
Exis
tin
g Owner-occupied
Rented
Existing rented multi-family residential buildings Addressing the market segment of rented residential buildings is challenging due to the barrier of split incentives. The business model through which building owners profit from rent increases after renovation is one of the few models that works in this market segment. In cases where the heat for a large multi-family building or a group of buildings is centrally supplied, Energy Supply Contracting may be a viable business model, if the building(s) have a sufficiently large energy demand (>20 k€ annually), as it allows the building owner to outsource energy related services. The business model based on feed-in remuneration schemes may also work as the building owner can take advantage of outside areas such as the roof.
Existing commercial and public buildings Commercial and public buildings are generally larger than residential houses, thus allowing for larger project sizes. Therefore the Energy Contracting models may work here, as the associated, high transaction costs can be compensated by the size of the contract. Moreover, commercial and public building owners tend to have a more ‘professional approach’ to energy management than private owners of residential houses. Therefore, commercial and public building owners recognize the added value of the Energy Contracting models more easily. Public buildings which may use En-ergy Contracting models include government offices, hospitals, schools, prisons and sports’ facili-ties.

90 IEA-RETD / ECN-E--12-014
As in existing owner-occupied residential buildings, the business models based on new financing schemes also work in existing owner-occupied commercial buildings. For the models ‘PACE financ-ing’, ‘on-bill financing’ and ‘business models based on energy saving obligations’, the institutions running the initiative (or the regulator who has initiated the programme) decide which market segments to target. The Environmental Upgrade Charge in Melbourne (see A.3), for example, tar-gets commercial properties, whereas the Berkely First programme (see A.2) addressed residential buildings.
New buildings New buildings offer much more flexibility for the integration of comprehensive EE measures and RET into building design than the existing building stock. Moreover, in most OECD countries, new buildings are subject to relatively strict building codes. As a consequence, new building stock tends to be more energy efficient, and currently business models appear to play a smaller role. Energy saving obligations for example mostly do not include measures in new buildings. Furthermore, building codes are increasingly tightened and it is expected that there will also be an increasing de-ployment of RET in new buildings. Business models may support property developers and building owners in fulfilling these obligations (see chapter 5.4.2). The energy contracting models are suitable for new buildings (although EPC is rather applied to the existing building stock). Also, feed-in tariffs supporting the deployment of RET are frequently ap-plied in new buildings. The high flexibility in building design of new buildings to make optimal use of available energy and other environmental improvements may be one of the reasons why certifi-cation of properties with a ‘green’ building label has originally focused on new developments.
5.3 Who are the actors involved in the business models?
The following discusses which actors are involved in the business models analysed in this report (see also Table 5.3). In doing so, only actors directly involved in the specific business models are considered. Other actors who are involved on a more general level are not covered, e.g. financial institutions who are involved for the installation of most RET in the built environment as they pro-vide the required capital. Only in the business model ‘leasing of RET’ do financial institutions direct-ly participate in the business model as lessor of the equipment.
Building owners Building owners have a central role in all of the analysed business models as they are usually the party who takes the final decision to install RET or EE measures (see Table 5.3). Thus, they are di-rectly involved in all of the analysed business models. However, no business model can substitute building owners’ strategic decisions to tap into RE and EE resources and to decide for long-term in-vestments into RET or EE measures, either on their own or through outsourcing to a third party.
Government Government may be involved in business models mainly (i) as regulator, as is the case for the mod-els based on rent increases, feed-in remuneration schemes, energy savings obligation and PACE fi-nancing, (ii) by providing financial incentives, as may be the case for feed-in remuneration schemes, or (iii) as an actor who implement a business model, as is the case with local governments who set up and administer a PACE financing programme. The following models directly depend on a policy intervention: ‘Making use of a feed-in remuneration scheme’, ‘Building owner profiting from rent increase after implementation of energy efficiency measures’, ‘PACE financing’ and ‘Business mod-els based on Energy Savings Obligations’. There are also ‘market-driven’ models in the sense that they do not directly depend on a policy or financial incentive scheme in order to create a business case for a building owner. Examples for such market driven business models are ESCOs.

IEA-RETD / Business Models for Renewable Energy in the Built Environment 91
Table 5.3 Actors directly involved in the various business models
Product Service Systems
Revenue models
Financing schemes
Ener
gy S
up
ply
Co
ntr
acti
ng
Ener
gy P
erfo
rman
ce C
on
trac
tin
g
Inte
grat
ed E
ner
gu C
on
trac
tin
g
Feed
-in
rem
un
erat
ion
Sale
of
cert
ifie
d b
uild
ings
Pro
fits
fro
m r
ent
incr
ease
PA
CE
fin
anci
ng
On
-bill
fin
anci
ng
Leas
ing
Ener
gy s
avin
gs o
blig
atio
ns
Actors
Building owner
Utility
Tenant
Government
Financial institution
Installers
Property developer
ESCO
Others
Note: Only the actors that are directly involved in the business model itself are marked with a black dot. Financial institutions are e.g. frequently involved for any installation of RET in the built environment. However, only in the business model ‘leasing of RET’ do they directly participate in the business model as lessor of the equip-ment.
Other actors In Energy Contracting business models the two directly involved actors are the building owners and the ESCO, whereas in the business models based on new financing schemes a variety of other ac-tors are active. The new financing schemes differ with regards to the involved actors, but are simi-lar from the point of view of the building owner who takes the decision for installing RET, as these models spread the upfront costs of the RET over the lifetime of the equipment: Leasing is initiated by a financial institution like a bank. On bill financing is initiated by a utility. PACE financing is initi-ated by the local government. It is not possible to make a general statement which model works best, as this highly depends on the local circumstances.

92 IEA-RETD / ECN-E--12-014
5.4 Conclusion and further considerations
5.4.1 Conclusions
This study demonstrates that business models can play an important role for increasing the de-ployment of RET in the built environment. They provide opportunities for building owners (e.g. fi-nancing of up-front costs, outsourcing of risks) and in many cases require only a supporting role by government, e.g. through changes of legislation such as allowing for rent increases after EE measures. However, business models alone will not lead to a significantly increased deployment of RET: They generally only lead to a deployment of cost-effective technologies because most busi-ness models discussed here cannot improve the returns on investment of RET and EE measures by themselves, but only work if there is a favourable business case. Moreover, business models cannot address all barriers, e.g. no business model addresses the barrier of ‘low priority of energy issues’, which keeps building owners from taking action.35 Thus a strong role of policy makers is still re-quired. The analysis also shows that the built environment is a complex sector in which some barriers for increasing the deployment of RET differ among market segments. In chapters 5.1 and 5.2 we sum-marized and discussed which barriers are addressed by the new and innovative business models analysed in this report, and in which market segments the business models work. The following gives a short overview of the main conclusions from this discussion:
The barriers of high upfront costs and access to capital can be tackled with ESCO models or leasing for existing and new, large commercial, residential and public buildings and with PACE or on-bill financing for small residential and commercial buildings. These business models make a life-cycle approach possible which from the point of view of the building owner spreads the investment costs over the project life time. The investment costs are compensated by the benefits of energy savings.
For business models to work in rental buildings, the split incentives barrier must be solved. This report describes changes in legislation allowing building owners to increase rents for energy efficiency improvements, which can be applied in jurisdictions where the rental sector is regulated, and specifically in the social housing sector where rent levels are de-termined according to a set of criteria. To soften the social effects of the measure, for the tenants the benefits of energy savings should be higher than the rent increase.
ESCO models, leasing, PACE or on-bill financing and rent increases only work for RET or EE measures that are cost effective. Today, there are already many cost-effective opportuni-ties for a deployment of RET and EE measures (see e.g. Box 5.2). For technologies where this is not (yet) the case, business cases may be based on supporting policy measures such as feed-in remuneration schemes (see Chapter 4.2.1). Moreover, ‘green’ certification of buildings can stimulate investments in RET also when they are not cost-effective. But be-cause such certification is voluntary, it is only expected to work in niche markets.
Energy saving obligations are introduced by governments to stimulate EE measures, energy services and the participation of energy suppliers. This policy measure in practice pro-motes the role of ESCOs36 and on-bill financing but originally has only focused on EE. The scope of energy saving obligations could be expanded to also include RET in the built envi-ronment.
35
In the EU ESCO market for example the lack of sufficient projects was assumed to be the main bottleneck for market growth in the past, rather than the availability of financing, i.e. not enough building owners had an in-terest to involve an ESCO.
36 In Denmark for example, energy services are implemented because energy saving obligations for energy suppli-
ers may only be implemented by third-party energy service companies.
IEA-RETD / Business Models for Renewable Energy in the Built Environment 93
5.4.2 Further considerations
Realizing EE measures vs. realizing RET Business models analysed in this report implement both RET and EE measures. In the built envi-ronment, there is often not such a clear distinction between RET and EE measures as both reduce the consumption of energy from the grid or delivered by utilities. The business models ‘Energy Supply Contracting’, ‘Making use of a feed-in remuneration scheme’ and ‘Leasing of RET’ are specif-ically suitable for the deployment of RET. The business models based on ‘PACE financing’, ‘On-bill financing’, ‘Developing properties certified with a ‘green’ building label’ and ‘Integrated Energy Contracting’ work for both RET and EE measures. Moreover, energy saving obligations could be ex-tended to cover RET. ‘Energy Performance Contracting’ is especially suited for EE measures. Generally speaking, energetically, but also from a cost-effectiveness perspective, an integrated ap-proach is preferred which first realizes energy savings and then implements RET. Such a perspective is taken by the business model Integrated Energy Contracting. Business models vs. obligations/standards The analysis has shown that business models can play an important role in supporting an increased deployment of RET, but that they cannot overcome all barriers and are certainly not the only ap-proach for supporting RET. Alternatively, RET can for example be mandated through obligations or potentially in building codes. Examples for obligations for RET are the Spanish solar thermal ordi-nance and the Renewable Portfolio Standards in the US and Japan, although the latter do not focus specifically on the built environment. There is a strong rational behind implementing obligations for RET and strengthening building codes as experience has shown that voluntary measures alone are not sufficient to drive a significantly increased deployment of RET in the built environment. The re-vision of the EU Energy Services Directive (ESD) for example reflects that the existing regulatory framework and incentive programs in place are not sufficient to reach the EU’s 2020 energy savings goals. However, whereas many of the business models analysed here focus on existing buildings, the potential reach of obligations for the energy performance of buildings tends to be limited to situations where a building permit is required, thus new buildings and substantial renovations. In these situations, obligations are the ‘stronger‘ instruments as they fully overcome the barrier of ‘low priority of energy issues’. However they tend to be less flexible than market based instruments which form the basis for many business models, and require public acceptance. There may also be a complementary role for obligations and business models based on new financ-ing schemes and Energy Contracting business models: An obligation in itself does not solve the bar-rier of ‘high up-front costs’ and ‘access to capital’ for the building owner or property developer who has to undertake the investment, nor does the obligation address the issue of how it is to be im-plemented. Thus business models could play a role in supporting building owners with providing access to capital and additional services. There may also be situations where policy makers have to decide between passing an obligation and supporting market-based solutions / business models. The current study does not allow for a general statement what would be the best approach in a specific situation. This would require further research. Business models and the EU ‘Energy Performance of Buildings Directive’ (EBPD) The analysis undertaken in this report focuses on the contribution that business models can make to an increased deployment of RET under today’s policy environment and on lessons learned from existing experience. In the future, it is expected that there will be an increased interest to support RET and EE measures in order to meet GHG reduction targets. A concrete example for tightening regulation on this subject is the 2010 recast of the EU ‘Energy Performance of Buildings Directive’ (EBPD), which will require among others that (i) at all major renovations, building owners adopt cost-effective EE measures, that (ii) the public is provided with more information on costs and ben-efits of measures that improve the energy performance of buildings and that (iii) by 2018 new

94 IEA-RETD / ECN-E--12-014
buildings occupied and owned by public authorities are nearly zero-energy buildings. By 2020 all new buildings will be required to be nearly zero- energy buildings (EC, 2010). There seems to be a two-way relationship between the EU EPBD and the role of business models: For some business models the implementation of the directive is a prerequisite. The business mod-el based on rent increases after the implementation of EE measures frequently requires a certifica-tion of a building’s energy performance such as those already mandated in the current version of the EPBD (EC, 2002). If EU Member States have not fully implemented this certification system, the business model based on rent increases faces challenges in its implementation. On the other hand, business models can also support the implementation of this kind of directive. The stricter re-quirements for new buildings and major renovations will require significant additional capital, which buildings owners or property developers may not have. Business models addressing the bar-rier of high-up front cost may support building owners in this. There is no concrete definition, yet, what exactly constitutes a nearly zero-energy building, but it is expected that the definition will also imply requirements of energy management and RET in build-ings. Moreover, the 2010 recast of the EBPC also contains requirements for existing buildings, e.g., it requires Member States to establish requirements for the installation, adjustment and control of the technical building systems in existing buildings. Both the management of new zero-energy buildings and such requirements for existing buildings will require specialist knowledge, which building owners or managers may also not have in-house. Thus there may also be additional de-mand for ESCOs or similar companies to supply this expert knowledge. Today, business models can also play a role in preparing governments and market actors for up-coming stricter regulation. The highest levels of voluntary ‘green’ building certification may for ex-ample already imply that buildings are ‘nearly zero-energy’. The experience gained with these buildings today provides lessons learned on costs and benefits of such high energy standards. Moreover, architects, property developers and other actors in the building supply chain, who are engaged in designing, developing and building such certified buildings today, can develop the re-quired skills, giving them a competitive advantage for the time when these standards become mandatory. Scope of analysed business models The list of business models analysed in this study is not comprehensive, There are for example a number of additional financing schemes that address the barriers ‘difficult access to capital’ and ‘high up-front costs’. Green mortgages for example allow building owners to finance energy-efficiency improvements to new or existing buildings as part of or through an addition to their mortgage. The interest rates of green mortgages may be lower than market rates or a green mort-gage may allow the home owner to take a larger loan than normally allowed without having to in-crease the down payment. This approach offers building owners access to capital at attractive in-terest rates and with long payback times. The additional mortgage payments are financed through lower energy bills. Thus for the homeowner the basic principles are similar to PACE and on-bill fi-nancing. In addition revolving funds set up by governments with a specific focus on RET or EE measures can provide access to capital to building owners, either directly or through e.g. a munici-pality. If carbon credits can be issued and monetized, these can generate an additional revenue stream which makes investments into RET / EE measures viable and can form one component of a business model. In countries which are eligible for undertaking CDM or Joint Implementation (JI) projects,

IEA-RETD / Business Models for Renewable Energy in the Built Environment 95
programmatic CDM / JI can cover RET / EE measures in the built environment37. However, to date CDM / JI has not been very successful in the built environment. It is highly likely, that a number of further new and innovative business models are currently being piloted in the IEA-RETD member countries. Moreover, innovation is not limited to the development of new business models, but can also play an important role when combining existing models. The case studies of the support programme for solar water heaters in Tunisia (PROSOL) (see Appendix A.4) and of Volkswagen/Lichtblick in Germany (see Appendix A.7) illustrate that new and innovative business models may arise from a combination of elements of existing models in a way that ad-dresses the specific barriers preventing an increased deployment of RET in the respective situation. Gaps in scope of existing business models: ESCOs for small residential buildings The current analysis shows that the business models described here cannot address all barriers. A specific gap identified in the analysis of the Energy Contracting business models is the fact that conventional ESCOs do not work for small buildings due to the high associated transaction costs (see Chapter 4.1). However, there may be significant potential for companies, e.g. individual in-stallers or groups of them, in offering less extensive or more standardized energy services to indi-vidual households than conventional ESCOs deliver for larger buildings. Individual home owners tend to have relatively little interest and knowledge in energy related issues, but comprehensive service packages could take away the hassle factor’ and allow building owners to outsource energy services. In the Netherlands, such approaches for improving the energy performance of existing buildings are for example stimulated by the government’s ‘More with Less’ (Meer met Minder) programme (see example Wonen++ in box 5.1). However, there is little comprehensive information on the extent to which such energy services are already offered across IEA-RETD member coun-tries. There is a need for further research in this area, and a role for policy makers to support inno-vative, new approaches (see Chapter 6.1).
Box 5.1 Case in point: Wonen++ concept – an example of small scale energy services
The ‘Wonen++’ concept of the Dutch energy company Eneco is an example of small scale en-ergy services. With this business activity Eneco supports the realisation of energy saving measures and renewable energy in households. Eneco offers several organisational and ad-ministrative services, like an energy audit, planning and installation. It does not invest for its clients nor does it engage in performance-based contracts; clients have to finance the invest-ment costs (net of subsidies) themselves. However, Eneco offers services related to financing, like searching for and requesting government financial support (soft mortgages, personal loans, or subsidies). Wonen++ is member of the Dutch government’s ‘More with Less’ pro-gramme, which allows Wonen++ to offer a small subsidy to their clients. According to Vethman (2009) this was one of the very few small energy service companies found to offer services to private homeowners at the time of that study. An important reason for a lack of supply of and demand for energy services in the residential sector are not only fi-nancial barriers, but equally important non-financial barriers like a lack of awareness, hassle and the complexity of the energy services concept.
37
See for example the proposed JI program ‘Energy Efficiency Programme in Buildings’ by BOS Bank in Poland (http://www.netinform.de/KE/files/pdf/Bos_EnEff_PoA-DD_2010_04_16_final_4.pdf)

96 IEA-RETD / ECN-E--12-014
Box 5.2 Case in point: Cost-effectiveness of RET may vary
Example of a solar water heater The cost-effectiveness of RET in the built environment depends on many factors including the conditions for financing up-front capital investments, technology specific energy yields, and the cost difference versus conventional energy generation. Consider a typical 2.4 m2 collector, thermo-siphon solar heating system with storage volume of 150 litres, assuming average investment costs of around € 650/m2 installed, VAT (20%) excluded (IEA, 2007). Thus the total investment costs including VAT are € 1872. When building owners pay the investment for the solar water heater from own funds, the opportunity costs will equal the lost interest in a savings account, e.g. 2% (not taking the risk of the project into account). In this case, the annualised investment costs are € 146 per year. The energy yields for a domestic hot wa-ter solar heating system with high solar fraction in Southern Europe, such as France are 800 kWh/m2 per year (IEA, 2007). The solar heating boiler produces 1920 kWh per year. If this heat was produced with a conventional electric boiler with a conversion efficiency of 90%, heating the same amount of water would require 2133 kWh electricity. In France, end-user electricity prices in July 2011 are 0,14 €/kWh incl. all taxes. Thus, in this case in a Southern European country with high solar fraction, the solar heating boiler would save about € 300 of electricity costs a year, im-plying a net saving of about € 150. If the same solar boiler was isntalled in Northern Europe, such e.g.s in the Netherlands or Germa-ny, the energy yield would be 250 kWh/m2 per year (IEA, 2007). In this case, the solar heating boiler produces only 600 kWh per year. If this heat was produced with a conventional gas fired boiler with a conversion efficiency of 75%, as is common in e.g. the Netherlands, producing the same heat would require 800 kWh of gas. The end-user gas price in the Netherlands or Germany in July 2011 was about 0,07 €/kWh incl. all taxes. The solar water heater saves € 56 of costs for gas a year. In this case, the annualized capital costs of the solar water heater are higher than the cost savings. If alternatively a building owner borrows the money for the investment commercially, interest rates and administration costs for concluding the loan agreement are higher. If the solar boiler was for example financed through the mortgage on the building, the interest rate could be around 5% and there are no additional costs for the loan agreement. In this case, the annualized capital costs would increase to € 180 per year. If the solar boiler is financed through a personal loan, the interest rate could be up to 10% and the administrative costs for concluding the loan agreement would probably be relatively high compared to the small amount borrowed. However, an ESCO could aggregate demand for the equipment and the financing of a large amount of solar water heaters, which would lower the administrative overhead considerably. Example of solar PV Solar PV has traditionally been a relatively expensive renewable energy technology. However, to-day, in some Southern European countries, grid parity (i.e. production costs equal end-user elec-tricity prices) is almost reached for solar PV, e.g. in Spain (Jumanjisolar, 2011). An average house-hold in Spain uses 3000 kWh electricity every year. Electricity costs are € 521, assuming an elec-tricity price of € 0.1737 incl. energy tax and VAT per kWh. To produce this electricity by solar PV, 2.54 kilowatt-peak (kWp) of solar panels would be required, as solar PV delivers 1400 kWh per kWp in Spain. The total investment costs for such a system would be € 7586 (at € 3540 per kWp). With a life time of 25 years this amounts to an annual payment of € 538, assuming a 5% interest rate on the capital investment. According to this example, in Spain the electricity generation costs of solar PV are almost the same as the electricity prices paid by consumers.

IEA-RETD / Business Models for Renewable Energy in the Built Environment 97
(continued on next page) For countries in Northern Europe more solar PV capacity is needed to produce the same 3000 kWh per year. In the Netherlands, solar PV delivers for example 800 kWh per kWp. The total invest-ment costs for a sufficiently large system would be € 17,280 (assuming € 4608 per kWp including installation). With a lifetime of 25 years this amounts to annualized costs of € 1226 per year at 5% interest rates. The same amount of electricity from the grid would cost € 540 (electricity price of € 0,19 per kWh incl. all taxes). These calculations assume constant prices for conventional energy in the future. RET will become more cost-effective, if the prices for fossil fuel rise and / or the prices for RET decrease. While for the RET discussed there, cost-effectiveness still depends largely on the background situation, some EE measures, such as improving insulation of walls, roofs and windows to a certain level, are al-most always cost-effective. [All energy prices based on www.energy.eu, accessed in July, 2011]
5.4.3 Potential for further research
Based on the analysis undertaken in this report, there are several open questions and topics for further research on business models for RET and EE measures in the built environment and on the role of policy makers in supporting these models.
On energy services As stated above there is need for further research on innovative approaches for expanding energy services to smaller residential buildings. One research direction could be to look into the added value for building owners, e.g. into the costs and benefits of service providers realizing measures compared to building owners undertaking them themselves. This would enable more insights in which situations energy services for individual home owners are suitable. Another approach would be to further analyse how such energy services can lead to business cases for service providers, e.g. by standardizing the offering. There is also need for further research into the role of energy suppliers in offering energy services to their customers, e.g. which approaches work best and why, can they be standardized, and can the (financial) attractiveness of these approaches for the consumers be improved? Based on this, recommendations for policy makers, e.g. for the design of Energy Savings Obligations, could be de-rived. On ‘green’ building certification schemes For the US market there are already a number of studies on certified ‘green’ buildings analysing savings in operating costs and additional benefits such as increased well-being and productivity of building users, as well as market value compared to non-certified buildings. However, outside the US, for the European and Japanese market, there are no such major studies, yet (Nelson et al., 2010). Certification bodies, and property developers and owners with a large portfolio of certified green buildings could take a proactive role in collecting and publishing data on the performance of certified buildings. However, to ensure credibility the studies themselves would best be undertaken by external organizations. Innovative financing schemes There are several innovative financing schemes that have not been covered in this study, such as ‘soft leases’ (leases with a lower interest rate, similar to soft loans), financial guarantees (e.g. a guarantee scheme for green mortgages) or revolving funds (e.g. for EPC projects). Moreover, there is scope for increasing the understanding of how financial institutions can be better involved in of-fering financial products for financing energy improvements in buildings.

98 IEA-RETD / ECN-E--12-014
Role of business models versus obligations As discussed above, there is a strong rational behind implementing obligations for RET and strengthening building codes as experience has shown that voluntary measures alone are not suffi-cient to drive a significantly increased deployment of RET in the built environment. In order to op-timally tailor policy interventions, there is a need for a better understanding in which situations business models can play a role as a real alternative to standards / obligations.

IEA-RETD / Business Models for Renewable Energy in the Built Environment 99
6. Recommendations for policy makers and market actors
This chapter provides recommendations for policy makers, building owners and market actors ac-tive in the built environment based on the analysis in this study.
6.1 Recommendations for policy makers
Active and strong role of policy makers required Even though a number of business models such as the Energy Contracting models do not require direct policy intervention, some others do. In any case, policy makers can support even the busi-ness models, that do not require direct intervention. New and innovative business models can help to exploit the potential of sustainable energy in the built environment. However, the analysis indi-cates that voluntary measures in support of the models are not sufficient to explore the full poten-tial of RET as other important barriers remain, such as ‘low (or no) returns on investment’ or ‘low priority of energy issues’. The business models described in the report are therefore not expected to lead to a significantly increased deployment of RET without further supporting measures. More-over, in the past regulation has been the strongest driver for increasing energy efficiency of the building stock. This points towards an active and strong role of policy makers. When supporting business models, the first step is to consider which RET are cost-competitive compared with ‘traditional’ energy sources in a specific jurisdiction, as most business models will generally only lead to a deployment of cost-competitive technologies. The second step is to deter-mine the most suitable business models given the market segment in which RET is to be deployed. The analyses of the business models evaluated in this study provide guidance for this: Table 5.1 can be used to determine which business models would work in a specific market segment. Chapter 4 this choice of model by providing more details on each business model. The following first provides recommendations for business models which lead to a deployment of cost-effective technologies, and later addresses approaches for situations where RET are not (yet) cost-competitive. Supporting business models in existing large residential, commercial and public buildings Existing buildings are a challenging market segment for increasing the deployment of RET and EE measures as the market segment is difficult to reach with building codes and obligations, pointing to an important role for business models. To support business models in this segment, policy mak-ers can:
Support Energy Contracting business models (see Box 6.1 for details on potential support measures).
Facilitate leasing of energy equipment by resolving regulatory barriers and potentially support-ing banks in offering ‘soft leases’ similar to existing ‘soft loans’.
Explore the potential for a programme similar to PACE financing such as the programme under-taken in Melbourne, Australia (see Appendix A.3).

100 IEA-RETD / ECN-E--12-014
Box 6.1 Supporting Energy-Contracting business models
Energy Contracting business models are the most complex of the models analysed in this report, as ESCOs offer comprehensive service packages to their clients. In contrast to many of the other business models, ESCOs do not directly depend on policy or financial support but are market-driven. However, there are still various approaches for governments in supporting Energy-Contracting business models, e.g. by
Financially supporting the establishment of independent third-party organisations, e.g. energy agencies, which act as market facilitators and as project facilitators between potential custom-ers and suppliers. Such organisations have proven to be key for supporting strong market growth, but are still lacking in most countries.
Creating model contracts and monitoring and verification standards, and setting up national or regional "public knowledge centers" in order to ease access to information. Transparency and trust in the market could be increased by providing for instance lists or registers of energy ser-vices offered, and performing random quality checks.
Implementing a range of instruments in order to facilitate access to financing (e.g. guarantee funds, low interests loans using revolving funds), which is frequently a challenge for ESCOs.
Changing procurement rules for public buildings to allowing and requiring decision makers in public buildings, including public housing corporations to procure equipment according to low-est life-cycle costs and allowing them to enter into long-term contracts. In addition, rules can be adapted so that RE and EE investments under an ESCO contract are not treated as public debt.
Developing and financially supporting models specifically customized for households and small and medium enterprises would significantly widen the market potential of ESCOs, which is cur-rently mostly limited to large public, commercial and residential buildings or to pools of build-ings. Governments may play a role in encouraging and promoting innovation and creativity es-pecially among small and medium-sized ESCOs by supporting research on innovative models and market actors, by supporting project development including model documents or by sup-porting pilot project implementation. A standardisation of products and contracts offered by ESCOs could for example significantly reduce transaction costs.
In most countries some of these measures need to be taken by national government, e.g. changes in procurement rules. For other measures, there is also room for action by local or regional gov-ernments, e.g. through the creation of third-party market facilitators (see for example the German and Austrian energy agencies (Energie Agenturen)).
Supporting business models in existing small residential buildings PACE financing and on-bill financing can target this market segment, as can programs undertaken by utilities in the frame of fulfilling energy savings obligations. All of these help to overcome the barriers of ‘high up-front costs’ and ‘lacking access to capital’.
Before supporting any of these business models, policy makers should consider which of the models would be suitable for the specific situation (see Box 6.2).
Utilities can have a key role, as they have direct access to building owners, i.e. the decision makers for deploying RET / EE measures in existing buildings. Policy makers can mandate, e.g. through energy saving obligations, or strongly incentivizing utilities to take a strong role, for example by restructuring a utilities revenue structure in a way that rewards energy savings and installation of RET in buildings.
To facilitate on-bill financing programs, policy makers can take additional measures such as
Clarifying legal issues around liabilities created through on-bill financing programmes;
Partnering with utilities in providing access to capital for the programme, e.g. through re-volving funds;

IEA-RETD / Business Models for Renewable Energy in the Built Environment 101
Offering the opportunity to combine the programme with subsidies to enable the installa-tion of a wider range of RET / EE measures.
PACE financing requires a change in legislation. As it is a new and innovative business model with which there is only limited experience outside of the US, it is advisable to start implemen-tation on the scale of pilot programs to gain experience on whether the approach works in the country and targeted market segment and to derive lessons learned for a potential scale-up of the programme (see also example in A.3). In the US and Australia, the required legislative change need to be undertaken by state governments, but the level of decision making may vary among countries.
National or regional governments can facilitate access to capital for the entities who undertake a programme, e.g. by establishing revolving funds which utilities or local governments can ac-cess.
To further support the uptake of RET, RET could be included in energy saving obligations for energy suppliers.
Box 6.2 Considerations for supporting business models based on new financing schemes
From the point of view of the building owner, in most of the business models based on new fi-nancing schemes the investment costs for the RET / EE measures are spread over the life-time of RET, so the building owner does not need to provide the up-front investment. However, these business models differ with regards to the involved actors. It is not possible to make a general statement which model is the best, as this depends strongly on the local circumstances. For policy makers aiming to support one of these approaches relevant considerations are:
Which actor has the financial means to offer support schemes? In economically difficult times local governments may for example face challenges in facilitating access to capital. Banks are generally best suited to provide access to capital.
Who has an intrinsic interest in facilitating a financing scheme for RET / EE measures? Support for RET / EE measures may for example not be in the direct interest of utilities or banks.
Who has the technical capacity to implement such a programme?
Who has access to the decision makers for investments in RET / EE measures, i.e. the building owners?
Out of the business models based on new financing schemes, PACE financing and on-bill financ-ing have the advantage that the debt for the RET / EE measures may stay with the property or electricity meter. This is especially important in markets where buildings change owners fre-quently. However, both schemes can be complex in terms of administrative and regulatory ef-forts required.
Supporting business models in rental buildings It is recommended that governments introduce legislative changes that allow property owners to adjust the level of rent after undertaking investments in EE, if there is significant energy savings po-tential in the regulated rental market. A few EU Member States (the Netherlands, France, Germa-ny, the UK, Italy and Sweden) have already gained experience with this.

102 IEA-RETD / ECN-E--12-014
Supporting business models in new buildings In contrast to existing buildings, in new buildings, EE measures and RET can be mandated through buildings codes and obligations. In the EU, the recast of the EU Directive on Energy Performance of Buildings (EBPD) is expected to be the main driver for moving new buildings to becoming more en-ergy efficient. ‘Green’ certification may complement regulation and building codes by supporting innovation by setting standards for highly energy-efficient and environmental buildings and in-creasing transparency on their performance and benefits. Such ‘green’ certification schemes can be supported by:
Applying ‘green’ certification to public buildings or even making them mandatory for certain types of (public) buildings as is currently happening in the UK.
Working together with certification bodies to ensure that the requirements for voluntary and mandatory systems are harmonised.
In addition, the recommendations for Energy-Contracting business models (see Box 6.1) apply to new buildings as well.
Supporting non-cost-effective technologies Business models themselves cannot address the barrier of ‘low (or no) return on investment’. To-day, there are already cost-effective opportunities for deployment of RET and EE measures (see e.g. Box 5.2). For technologies where this is not (yet) the case, business cases may be based on support-ing policy measures such as feed-in remuneration schemes (see Chapter 4.2.1), direct subsidies, fiscal measures like tax breaks, or interest rate subsidies. The advantage of feed-in remuneration schemes over direct investment subsidies and soft loans is that feed-in schemes directly incentivize the production of renewable energy and not just the in-stallation of the technology. Successful feed-in schemes are stable and predictable, so policy mak-ers should change categories and tariffs in a feed-in scheme only when technology cost reductions or changes in energy prices demand doing so while giving sufficient lead time and full transparency on reasons.
Overcoming other barriers The business models described in this report do not address all barriers for an increased deploy-ment of RET in the built environment. Some barriers, e.g. the barrier of ‘cumbersome building permitting process’ or ‘inappropriate mortgage assessment’ cannot be addressed by business models at all, but require changes in regulations instead. Removing such barriers can be a precon-dition for the business models to be successful. Thus in addition to supporting or enabling business models, additional policy measures are required to overcome these barriers.
Using policy packages to address various barriers at once Successful business models often consist of combinations of the models described in this report, simultaneously addressing several barriers. To support such approaches, a combination of policy measures or policy packages is needed. Such policy packages could for example combine energy saving obligations for energy companies with incentives such as subsidies, soft loans, or loans with guarantees, and support for the provision of tailored information through e.g. energy audits. Or there could be a number of policy measures supporting Energy Performance Contracting, such as applying EPC in public buildings and supporting market development through a government admin-istered energy agency. A differentiation of the rental price system for social housing could be com-bined with a good energy label system. Depending on the specific background situation in a certain jurisdiction and market segment, other combinations are possible.

IEA-RETD / Business Models for Renewable Energy in the Built Environment 103
6.2 Recommendations for building owners
For all building owners The business models described here offer attractive opportunities to building owners by facilitating access to capital, overcoming the barrier of ‘high up-front costs’ and offering a wide range of ener-gy related services and thus also addressing some non-financial barriers for building owners, such as the ‘hassle factor’. Building owners are encouraged to explore which business models may be advantageous in their situation. For owners of existing and new large commercial and residential buildings ESCOs present a special opportunity as they allow for outsourcing technical and economic risks of RET and purchasing a comprehensive service package. Moreover, Energy Contracting business models may spread the investment costs of RET / EE measures over the life-time of the equipment, allowing for investment in RET / EE with minimal capital outlay. For public building owners Public building owners play a special role, as they can serve as a means to drive the implementation of government targets for the deployment of RET and EE measures in the built environment. The decision to deploy RET / EE measures can only be taken by building owners. For the public housing stock, however, these decisions are under the direct influence of governments. In the EU, publicly owned or occupied buildings represent about 12% of the entire building area (Ecorys et al., 2010), indicating that the impact of government action regarding public buildings is significant. Public buildings can serve as a ‘role model’ and governments should be proactive in applying suitable business models. Public building owners can for example:
Apply certification with voluntary ‘green’ building labels to new buildings and during substantial renovation of existing facilities, and;
Directly support ESCO business models by using these models in the public building stock. This may require a change in public procurement rules.
In addition to the direct impact on its housing stock, public building owners can make other actors aware of the potential through demonstration and dissemination of the impacts of these business models. Supporting new and innovative business models in public buildings poses a unique oppor-tunity for local governments to become active in increasing the deployment of RET in the built en-vironment, as the responsibility for the public building stock usually lies withat the local level.
6.3 Recommendations for other market actors
Recommendations for market actors actively involved in business models Market actors are recommended to analyse markets well to ensure that there are no important stakeholders that can block a business model. In the example of the ‘PACE financing’ model in the US, the interests of all stakeholders were for example not taken properly into account, so that the residential scheme was stalled by an intervention of the mortgage reinsurers.
Recommendations for ESCOs ESCOs can take specific actions to support the development of the energy services market, which in most countries is still relatively young and has little structure, for example by
Supporting market facilitators and independent consultants who prepare projects for public and private building owners and put out calls for proposals;
Helping to develop and agreeing on model documents and procedures;
Establishing a sector organisation which provides market data and participates in policy devel-opment;
Being transparent regarding business models used to gain trust of the potential customers;
Participating in conferences or other public meetings to inform market actors and create awareness on energy related issues;
Further developing business models (e.g. for individual home owners).

104 IEA-RETD / ECN-E--12-014
In addition, the analysis also showed that often business models are most successful when they are based on partnerships between actors with complementary expertise and resources, e.g. regarding access to capital, technical expertise and access to the clients / building owners. An example of such a successful programme is the Tunisian PROPOSOL scheme (see Appendix A.4), which brings together key actors in the sector including the state electric utility, commercial banks, the suppliers of solar water heaters, and building owners or occupiers. Actors directly involved in business mod-els are recommended to explore partnerships with others.

IEA-RETD / Business Models for Renewable Energy in the Built Environment 105
Appendix A Case studies
A.1 LIG, Austria - Integrated Energy-Contracting Pilots
(Business model: Integrated Energy Contracting; see page 37) The Landesimmobiliengesellschaft Steiermark (LIG) (State of Styria owned real estate company) administers and manages more than 420 buildings in Styria. About 200 buildings with an overall ar-ea of more than 600,000 m² are owned by LIG. To our knowledge, LIG is the first institutional build-ing owner that has systematically applied the concept of Integrated Energy Contracting. Recently, LIG’s IEC activities have been recognized with the Energy Globe Styria Award 2009. In 2007/08, LIG made the first Europe-wide IEC call for tenders for five buildings with a net floor area of approx. 11,000 m2. In 2009, contracts for pool 2, which consisted of three properties with altogether 20,000 m2, were procured and implemented. Contracts for another pool of buildings are under preparation. The original motivation of LIG was to substitute heating oil as far as possible with energy carriers that are renewable. However, in the course of the project development, the objectives of LIG’s call for tenders for IEC contracts were extended as follows: 1. Implementing demand side saving measures with pay back times of less than 15 years in the
fields of building technology, building shell and user behavior, and improving the energy indica-tors of the buildings;
2. Comprehensive refurbishment of all oil-fired heating equipment; 3. Reducing CO2 emissions (which implies a change of energy carriers) and minimizing overall en-
ergy cost. Good practice example Retzhof The Retzhof of LIG is a complex of build-ings consisting of a castle from the 16th century as well as two seminar and guest houses from 1960 and 2009 with an overall useful area of about 4,000 m2. The buildings are used as hotel and seminar house.
Figure A.1 ‘Schloss Retzhof’: Seminar House of the
Province of Styria The initial situation before refurbishment and the construction of the new building can be summa-rized as follows: high energy costs, an inefficient natural gas boiler and no insulation of the castle building (protection of a historic monument). The old boiler house had been demolished to make room for the new guest house, including the new heating centre. Energy consumption amounted to approx. 185 kWh/m2/year.

106 IEA-RETD / ECN-E--12-014
The building owner had the following goals for the refurbishment: 1. Replacing the old boiler installation. 2. Outsourcing energy supply and financing the investments. 3. Reduction of energy demand, CO2 emissions and costs through demand side saving measures. The project was implemented with the support of Grazer Energieagentur GmbH as an Integrated Energy Contracting model. Central issues were the combination of energy efficiency measures and supply of useful energy, and using specific quality assurance instruments to substitute the EPC sav-ings guarantee. The ESCO contract was awarded in a combined competition of prices and solutions in the course of a two-phase negotiation procedure. From the building owner’s perspective, some important experiences and innovative approaches of the project can be summarized as follows: 1. The combination of energy efficiency and supply of useful energy within the IEC Model basical-
ly works. 2. From the building owner’s perspective, a coordinating and controlling function is necessary
even if the ESCO acts as a general contractor, especially if other building construction projects are simultaneously been carried out as in-house implementation (in this case the construction of the new guest house).
3. The development of comprehensive energy (efficiency) projects requires committed facilitators and a long time horizon.
4. Thanks to co-financing of the investments by using funds provided by the user of the building, the ongoing capital costs could be reduced by approx. 30 %.
5. The ESCO invested in the CHP plant upon its own risk. Re-financing will be done by selling elec-tricity to the building owner during the contractual period.
These results apply subject to a systematic monitoring and verification in the course of the annual auditing of the buildings.

IEA-RETD / Business Models for Renewable Energy in the Built Environment 107
A.2 Berkeley FIRST - the first PACE financing programme
(Business model: PACE financing; see pages 61, 90) In 2008, the City of Berkeley launched the first ever PACE financing programme, called Berkeley Fi-nancing Initiative for Renewable and Solar Technology (FIRST). The programme aimed at testing the viability of PACE financing. The small pilot programme focused exclusively on solar PV installations to keep the process simple. However, home owners were required to also undertake basic energy efficiency improvements. Funding was based on micro-bonds issues by the City of Berkeley and purchased by Berkeley’s financial partner. The participating home owners are repaying the financ-ing of their solar PV systems via their property tax bills over a period of 20 years. Table A.1 shows a sample calculation of investments and costs for a home owner. Out of the 40 slots which were available under the pilot programme, 13 projects were completed for a total of USD 336.550 of financing via micro-bonds. The interest rates offered to property owners participating in the pilot programme were relatively high at 7.75%, which was equal to 3.25% above the 10-year U.S. Treasury Note at that time. The level of interest rates was considered a barrier by many of the property owners applying to the programme who withdraw their applica-tion: Some of them still installed a PV system but used cheaper financing options. The Berkeley FIRST programme provided valuable insights into how PACE financing can be applied in practice. For the 13 projects realized under the programme, an estimate of the project econom-ics showed a negative net present value for the property owner in 9 of the 13 projects. The savings for the home owner are generated through ‘net-metering’. i.e. lower electricity bills due to auto-consumption of the generated electricity. Solar PV is generally still a relatively expensive renewable energy technology, thus the negative NPV of the initial projects is not surprising. Since 2008, the prices for solar PV systems have dropped significantly, implying that the same programme would be more cost-effective today. Moreover, it is expected that larger programme sizes could reduce the financing costs, and that future programmes could also include energy efficiency measures, which would be expected to raise NPVs of the projects (based on City of Berkeley (2010), Brown et al. (2009), RAEL (2009)).
Table A.1 Sample calculation for the installation of a solar PV plant on a residential building under the pilot Berkeley FIRST PACE financing programme
Cost of the PV installation USD 28,077 California Solar Initiative (CSI) subsidy USD -6,108 Administrative cost USD 600 Total PACE financing USD 22,569 Interest rate 7.77% Annual tax payment by the property owner to repay the loan
USD 2,199
Note: For the building owner the additional tax payment is (partly) offset by lower electricity costs. Source: Brown et al., 2010.

108 IEA-RETD / ECN-E--12-014
A.3 Financing commercial building retrofits with the help of an Environmental Upgrade Charge in Melbourne
(Business model: PACE financing; see pages 62, 90, 99, 101) In 2010, the City of Melbourne, Australia,initiated a new programme for financing energy retrofits in commercial buildings. The financing approach is similar to PACE financing and has some charac-teristics that could be replicated and scaled-up in other parts of the world. The programme is part of Melbourne’s Zero Net Emissions by 2020 Strategy, and aims to retrofit 1,200 existing office buildings to decrease the use of energy, water, and the generation of GHG emissions. The financing structure is based on a newly introduced Environmental Upgrade Charge (EUC), which was included in an amendment to the City of Melbourne Act passed by the Victorian Parliament in September 2010. This amendment enables the city council to enter into so-called en-vironmental upgrade agreements (EUAs) with commercial property owners who look for up-front financing for environmental retrofit projects, and with financial institutions which are willing to fund these retrofits. In contrast to PACE financing programs, in this case the building owners them-selves are responsible for arranging the financing terms with financial institutions. When the EUA is approved, the bank will lend money to the building owner for undertaking the retrofit project. The building owner then repays the investment and interest via an ongoing environmental upgrade charge (EUC) levied by the city council who passes these payments on to the lender. The programme does not target single buildings, but portfolios of properties. In its initial phase, top-tier nonresidential property owners are eligible for the programme that have an investment grade credit rating, own 10 or more properties with in total more than 5,000 m2 of floor area and have annual energy costs of at least $500,000. These criteria will help to lower administrative costs and improve the likelihood of long-term success. The advantages of the owner-arranged financing structure are that building owners are able to se-cure more attractive interest rates than the municipality would be able to and that lending terms can be structured specifically to the project. However, the approach would likely have to be adapted if the programme was expanded to smaller property owners. The EUC and involvement of the city council provide additional security to the participating financial institutions. Applicants must show that the planned retrofits are expected to achieve energy savings of at least 20 percent. This requirement was defined in order to promote comprehensive retrofits instead of simple add-on solutions. It is expected that the initial experiences will provide lessons learned for a future ex-pansion of the programme. (Based on Institute for Building Efficiency, 2010c)

IEA-RETD / Business Models for Renewable Energy in the Built Environment 109
A.4 PROSOL: Supporting market growth of solar water heating in Tunisia
(Business model: On-bill financing; see pages 68, 72, 95, 103) In 2005, the Tunisian Ministry for Industry, Energy and SMEs and the National Agency for Energy Conversation (ANME) together with UNEP launched the programme PROSOL, which included an innovative combination of support mechanisms to create successful business models for financing, supplying and installing solar water heaters (SWH). Financial incentives were targeted at reducing the high upfront cost of capital for the installation of equipment and at improving access to capital by reducing interest rates and organizing the repayment of loans for the SWHs through an on-bill financing mechanism. The financial mechanisms consisted of three elements:
A capital cost subsidy provided by the Tunisian government (and partly by UNEP through the Mediterranean Renewable Energy Center (MEDREP)) to customers for 20% or more of the initial cost of the SWH.
Reduction of interest rates through an agreement with commercial banks to charge lower inter-est rates due to the reduced default risks within PROSOL and through an additional interest rate subsidy. The latter has been progressively phased out over a period of 18 months.
An on-bill financing mechanism where customers who install a SWH repay the loan via their electricity bill over a period of 5 years.
The financial instruments were accompanied by a series of additional measures including supply-side promotion, development of a quality control system for SWH equipment, an awareness raising campaign and a capacity building programme with financiers to raise their understanding of RETs. The programme brings together key actors in the sector such as the state electric utility STEG (So-ciété Tunisienne d’Electricité et du Gaz), commercial banks which provided the most favourable loan conditions determined in a bidding process, the suppliers of SWH which include local manu-facturer and importers, and customers who install the equipment. An interesting component of the PROSOL scheme is that initially it relied heavily on the initiative of suppliers of SWH systems who took the role of indirect lenders of money for their customers, the home-owners. Suppliers are accredited for participation in the programme by the National Agency for Energy Conversation (ANME). Customers have to be clients of the state electric utility STEG to participate in the programme. When customers decide to purchase a SWH under the programme, they need to sign an agreement form where they commit to paying back the loan via their electrici-ty bill. Customers only need to pay a small amount in cash, e.g. 10% of the cost of the SWH. Under the first phase of the programme, the supplier guaranteed the loan for the SWH with the local bank. The bank did not have any direct contact with the customers, as customers paid the loan over 5 years through their bi-monthly electricity bills issued by STEG.

110 IEA-RETD / ECN-E--12-014
Figure A.2 Organisational structure of the PROSOL business model The innovative scheme provided various additional levels of security and benefits for involved ac-tors by aligning their interests. Through the installation of the SWH system, customers profit from lower electricity bills which compensate for the additional payment on their electricity bill. Cus-tomers also get additional security on the performance of the SWH, as the supplier guarantees for the loan with the bank and thus has an interest in maintaining the functioning of the system. The bank gets additional security because repayment of the loan is automatically recovered via the electricity bill. Moreover, in the case of default, the bank can take actions against both the supplier and (via STEG) against the consumer. In the worst case, STEG is even authorized to suspend elec-tricity supply to the customer. For suppliers and installers of SWH the scheme has opened signifi-cant new business opportunities as it contributed to a rapid growth in SWH installations. While on average only about 10,000 m2 of SHW systems were installed annually in the period be-tween 1997 to 2004, installations increased to more than 70,000 m2 in 2009. Overall, by 2010, 95,000 SWH systems with a total capacity of 285,000m2 had been installed under PROSOL. The number of companies selling SWH systems increased from 8 in 2004 to more than 40 in 2009, while the number of qualified installers grew from about 100 to 1000 in the same time. A disadvantage of the initial system was, however, that successful suppliers took on large amounts of debt by guaranteeing the loans for their customers. In the second phase of the programme this was changed and customers now deal directly with the local banks.

IEA-RETD / Business Models for Renewable Energy in the Built Environment 111
A.5 Greenchoice: Solar supply contracting in the Netherlands
(Business model: Making use of a feed-in remuneration scheme; see page 42) The Dutch energy company Greenchoice supplies 100% renewable energy. It recently launched a plan for a pilot project ‘Zonvast’ to be executed before or during the summer of 2011, in which Greenchoice invests in solar panels and markets these to around 500 homeowners. Homeowners can request a solar PV panel on their roof installed by an installation company partnering with Greenchoice. The homeowners will not own the solar panel, but will pay a fixed electricity price to Greenchoice for using the electricity produced. Electricity not used is fed into the electricity grid, for which the homeowner receives no payments. To join the project homeowners need to meet certain technical requirements. There is a risk for homeowners when they decide to move, as the contract remains binding. The contract could then be sold to the new owner, or the owner could buy the solar panels and sell them along with the house, or the owner could move the solar panels to his new house. Greenchoice already operated this business model for business customers (‘Yellow step’), proac-tively making use of the Dutch feed-in tariff SDE. Data:
A solar panel installation includes 8 to 10 solar panels per roof.
Expected electricity produced is approx. 1,950 kWh per household a year (a little more than half of the average electricity consumption of a Dutch household).
Each installation costs Greenchoice € 8,000. The expected total investments costs of the whole project are € 4 million.
There is a relatively small investment subsidy available to Greenchoice.
The contract obliges a homeowner to pay a fixed electricity tariff of 0.23 €ct per kWhe for a pe-riod of twenty years. This seems a reasonable price for electricity compared to other Dutch en-ergy companies38.
(Based on Greenchoice, 2011)
38
See for example Nuon (www.nuon.nl,) and Eneco (www.eneco.nl), (websites consulted October 26th
, 2011).

112 IEA-RETD / ECN-E--12-014
A.6 Adaptation of the rental price evaluation system in the Netherlands
(Business model: Building owner profiting from rent increases after the implementation of energy efficiency measures; see pages 57, 58) This case study describes the adaptation of the rental price evaluation system in the Netherlands to reward energy improvements. The scheme is intended to stimulate dwelling owners to invest in energy efficiency improvements, which they are allowed to undertake with consent of the tenant. Investment costs for these improvements are borne by the building owners, in this case the hous-ing corporations. In turn, owners aim to earn their investments back over the lifetime of the measures by setting higher rental prices. In the Netherlands, the rental price evaluation system determines the rental price for houses and apartments rented in the social housing sector, which is a large part of the total rental market in the country. A single-family house or apartment receives points for certain aspects such as the number of toilets or the existence of a garden or balcony. After the adaptation of the system, ener-gy performance becomes one of the evaluation criteria, i.e. a more energy efficient dwelling gets more points. Awarded points determine the maximum rental price to be charged. Assuming an av-erage rental price per point between € 4 and € 5 (WS Wonen, 2011) the difference in monthly rental price between a G and an A labelled dwelling can reach up to € 180. For tenants, the aim of the regulation as set by the government is to ensure lower living expenses as the scheme covers the social housing sector. Thus the decrease in energy costs due to energy efficiency measures should outweigh the rental price increase. Furthermore, landlords are only al-lowed to charge a higher rent when a new tenant moves in (Eerste Kamer, 2011)39. And rental pric-es are only allowed to rise when the effect of the energy efficiency measures has been proven (Woonbond, 2011) to ensure effectiveness of the regulation. A solution for the requirement to ac-quire consent of tenants can be the use of an ‘living expenses guarantee’ through which the change of living expenses level after renovation is contractually guaranteed for collectively organised ten-ants (Aides, 2009). A disadvantage of this guarantee for housing corporations are the associated transaction costs for the assessment and monitoring of energy savings. Example cash flow calculation and profit calculation The impact of the proposed adaptation of the rental price evaluation system in the Netherlands has been evaluated and described by Tigchelaar (2011). The figure A.3 from this evaluation illustrates for an average dwelling of different energy label classes the yearly benefits and costs for an aver-age tenant and landlord.
39
A low energy performance (i.e. high energy prices for the tenant) may lead to a freeze of the rental price. This is stipulated by a temporary provision of law (Eerste Kamer, 2011).

IEA-RETD / Business Models for Renewable Energy in the Built Environment 113
Figure A.3 Net costs and benefits of renovation for landlords and tenants, under the adapted rent-al price evaluation system
The example calculation shows that:
For landlords there will a small annual net cost, although housing corporations are expected to perceive these as acceptable. The calculations indicate that reaching larger energy improve-ments (i.e. better energy label classes) implies lower yearly costs for landlords. This is aimed to stimulate higher investments by landlords.
For the average tenant there will be yearly net benefits. However, for the tenant larger energy improvements lead to lower cost savings.
Furthermore, Aedes (2011) estimates that 100,000 Dutch dwellings with a bad energy performance will receive a lower rental price from this regulation. For these dwellings housing corporations re-ceive lower income.

114 IEA-RETD / ECN-E--12-014
A.7 Market introduction of small and micro CHP systems
(Business model: Leasing of RET; making use of a feed-in scheme; see pages 78, 86, 95) Across different countries, companies have used a model based on leasing of equipment to end-use customers or similar approaches in order to introduce small and micro-CHP systems to the market. The following shortly presents two examples: Tokyo Gas and Osaka Gas (Japan) Japan is one of the leading countries with regards to the development and installation of micro-CHP systems (IEA, 2008b). The installation of micro-CHP systems in residential houses is strongly driven by large gas utilities which are competing for market share in the residential heat market against electric utilities. The electricity companies promote households working completely with-out the use of natural gas, which has been the traditional energy source for hot water generation (Nishizaki, 2008). The introduction of micro-CHP systems started with systems based on internal combustion engines, such as the Ecowill model, but gas utilities such as Tokyo Gas and Osaka Gas have now also started to market fuel-cell based systems. In order to field test new fuel-cell based micro CHP systems on a large scale and prepare their market entry, the two utilities have intro-duced leasing schemes in which residential customers can test fuel-cell based micro-CHP systems in their homes (IEA, 2008b). Volkswagen / LichtBlick (Germany) In Germany, car manufacturer Volkswagen is partnering with the energy company LichtBlick in the production and distribution of natural-gas powered small CHP systems. Volkswagen produces the CHP systems, which run on the same engines as used in Volkswagen’s Touran and Caddy automo-biles. The 20 kWe systems are equipped with a heat storage, grid connection and remote data mon-itoring devices. LichtBlick distributes the systems by an approach similar to leasing the equipment to customers: The company rents the client’s ‘boiler-room’, and is responsible for installation and service, maintenance and repairs of the equipment. LichtBlick also assumes responsibility for dis-mantling the customer’s old gas heating system. The building owner or user pays an initial contri-bution of € 5000 for the installation, which is significantly cheaper than the installation of a new heating system. In addition, the building owner or user pays for the heat he consumes and a flat rate for maintenance, but receives a monthly ‘rent’ of five euro for the boiler room and 0.5 €ct from the German CHP feed-in tariff for every kWh of power fed back into the grid. According to the company, the CHP system can reduce energy consumption by up to 30-40% com-pared with conventional heat and power supply. For the scheme to be financially attractive, cus-tomers need to have a heat demand of at least 40,000 kilowatt hours. This means that the CHP plants are suitable for very large single-family homes, for buildings with two or three flats, small businesses or hotels/B&Bs and public and social facilities such as schools and churches. In November 2010, LichtBlick installed the first systems at residential and commercial customers in Hamburg, Germany. The company is already running a test set-up with 25 decentralized plants at Volkswagen’s production facilities in Salzgitter since early 2010. In the long term, the two compa-nies have ambitious targets, planning to generate a network of 100,000 of these home power plants. With these the company plans to ‘create’ a large, virtual (2 GWe) dispatchable power plant. As LichtBlick is responsible for the operation of all of the plants, it would be able to profit from pe-riods of high electricity prices by starting up the small CHP systems when the price exceeds a cer-tain minimum level. In this way the thus created electric power could complement fluctuating power from renewable energy sources such as wind and solar PV. The generated heat can be stored in the storage tanks to be extracted by the building user when needed. In addition, Licht-Blick is able to profit from the German CHP feed-in tariffs. The combination of these aspects cre-ates a viable business model. (Based on Volkswagen (2011) and Volkswagen (2010).
IEA-RETD / Business Models for Renewable Energy in the Built Environment 115
A.8 Leasing of a heat pump system
(Business model: Leasing of RET; Energy Supply Contracting; see pages 73, 74, 88) The following presents the example of a lease of a large heat pump system combined with heat-and-cold storage in a large (35,000 m2), new office building in the Netherlands. The building is cur-rently being used as national headquarters for the company T-Mobile which rents the building. The heat pump system supplies heating and cooling to the building. The lease was originated and organized in the following way:
A real estate developer (the initial building owner) realized the construction of the building in-cluding the renewable energy system.
For engineering and installation of the system, the developer hired an external energy consul-tancy and an energy service provider.
After the system was installed, it was ‘outsourced’ to the energy service provider, who took over legal and economic ownership of the system40 from the building owner. The energy service provider in turn agreed to an energy supply contract for 15 years with the building owner (who thus outsources the energy supply), and maintains the system.
After the building was finalized it was also sold to an investor, who is renting the building to a commercial organisation (T-Mobile) as tenant.
The following describes the financing structure of the lease:
The system was fully financed via a financial lease. The energy service provider invested in the system and leases it to the building owner. However, to reduce risk, the energy service provider charged the majority (80 to 90%) of the total investment of € 773,000 to the building owner at once. The energy service provider charges the remaining investment costs to the tenant spread over 15 years via the rent charged for the building.
The energy service provider also charges the building owner yearly maintenance costs € 24,000 for the system. The building owner in turn recovers these maintenance costs by periodically charging the tenant a fixed service fee.
Overall, the tenants’ payments for renting the building including the heat-pump system are based upon a share of investment costs, maintenance costs, and energy supply costs.
The costs for heating and cooling (not electricity and lighting) for the tenant are expected to be 10 to 20% lower than with a conventional energy system. Note, that in addition to energy costs, the tenant pays the fixed service fee for maintenance and a higher rent to recover the initial in-vestment costs of the energy service provider. The maintenance costs are expected to be lower than for a conventional system.
Because of the economic ownership and as a commercial party, the energy service provider was allowed to receive a tax benefit on the investment. Half of this tax benefit was passed through to the tenant via a reduction in the rental price.
The building owner is expected to have the largest cost savings after 15 years when renovation investments are required. Since a heat pump system is cheaper to replace than a conventional system, total costs savings for the owner are expected to be € 210,000.
(Based on AgentschapNL, 2010)
40
As the building is owned by the investor, to get ownership of only the energy installations the energy service provider had to obtain building and planting rights for the installations via a notarial act.

116 IEA-RETD / ECN-E--12-014
A.9 Energy supplier obligations in the UK
(Business model: Energy Saving Obligation; see pages 80, 82) The following illustrates how an energy saving obligation is implemented in practice and how it can lead to the development of business models. Background Energy supplier obligations in the UK are enforced by the policy programme ‘Carbon Emission Re-duction Target (CERT)’. The CERT programme obliges all large domestic energy suppliers to realise energy savings in households. By doing so, energy suppliers are required to deliver measures that will provide overall lifetime carbon dioxide savings of 293 MtCO2 by December 2012. CERT is im-plemented in several phases, in 2011 the fourth phase has started. Energy saving obligation schemes already begun in 2002 in the UK under a programme called ‘Energy Efficiency Commit-ment’ (EEC) programme which was the predecessor to CERT and ran until 2008. As of 2013, the ob-ligations will be enforced by a new policy programme, the Energy Company Obligation (ECO) as es-tablished in the UK Green Deal. CERT has clear energy demand and emission reduction targets with indirect aims such as reducing fuel poverty, securing jobs and realising social benefits like improved air quality and comfort. The programme targets ‘priority groups’, namely low-income households and elderly private home-owners of age 70 and older. Structure of the programme The basic business model for the energy suppliers is that they are obliged to invest in energy saving measures to be installed at their customers with the aim of reaching an energy savings target. In return, energy suppliers are allowed to pass on their investment costs by increasing the energy prices they charge to all their customers. This structure is shown in Figure A.4 below.
Figure A.4 Schematic representation of key actors in the UK CERT programme Stakeholders Key stakeholders of the programme are the Department of Energy & Climate Change (DECC) as ini-tiator, Ofgem (the energy market regulator) who administrates and monitors the programme, six large energy suppliers who have the obligation, households where savings are realised, and install-ers. The basic assumption underlying the programme is that energy suppliers working under such a
Up-front costs
Energy
saving measures
Installers/
suppliers
Energy
suppliers
Higher energy prices
(all customers)
UK
government (DECC)
Ofgem
(regulator)
Obligation
Households
Lower energy bill
(only customers with savings)

IEA-RETD / Business Models for Renewable Energy in the Built Environment 117
market mechanisms will realise the carbon reduction target more efficiently than the government would through a centralized programme. The energy suppliers hire installers to deliver measures. Furthermore, energy suppliers have part-nerships with several parties (housing corporations, municipalities, manufacturers of energy effi-cient products, etc.) who also promote and realise measures at the target groups. Energy suppliers will get a penalty from Ofgem, if they do not reach their targets. Energy suppliers pay the majority of the investment costs, fully or partly, of the saving measures either to homeowners or to suppliers like manufacturers and retailers. Investment costs are esti-mated to be on average 1 billion £ (around 1,16 billion Euro41) annually (Ofgem, 2010). Households do not finance any costs themselves, as average investment costs per households are estimated only at 500 £ (around 590 Euro¹). The largest financial risk of the scheme thus lies with the energy suppliers who need to earn their investments back via higher energy prices spread over a number of years. This level of investment is unlikely to be sufficient in the future, as only the more expen-sive saving potential remains. The future ECO system will therefore require households to finance part of the full investment themselves via an on bill financing scheme. Results achieved In the current phase of the program, a large part of the energy savings are delivered by improving building insulation, mainly through cavity and loft insulation which are the most cost-efficient eligi-ble measures. Efficient lighting, heating (heat pumps) and appliances are also common measures. The current programme restricts certain measures, e.g. the use of energy saving lamps (CFLs) which have already been massively supported by the previous UK energy supplier obligation schemes. It is estimated that over the lifetime of measures implemented between April 2008 and December 2011, the CERT programme realises around 181 Mt CO2 emission reductions (Ofgem, 2011). With these savings, the programme is expected to be on track to achieve the targeted results. The gov-ernment expects social benefits to households, including energy saved, at around 22 billion £ (around 26 billion Euro) over the period 2008-2012 (DECC, 2011b). Conclusion The main strength of the programme is the obligation to energy suppliers, which addresses many barriers to energy savings, such as low priority of energy investments, lack of upfront capital for investments etc., and leads to significant savings compared to voluntary programmes. The CERT is very attractive to participating homeowners, as energy saving measures are financed by energy suppliers and installation is taken care of. The programme is able to realise savings in the existing housing stock, where it is generally difficult to realise energy savings through voluntary measures or purely commercial activities. The focus on low income households reduces the chances of free riding, as this target group is less likely to have taken the measures anyway. However, supplying certain measures for free or at a low price can reduce the effectiveness of the programme. An ex-ample are CFLs which were actually oversupplied and partly ended up unused. The consequences are unnecessary supplier costs and a limited energy savings impact. (Based on CERT (2011), DECC (2010; 2011a; 2011b; 2012a; 2012b), Eceee (2011), OFGEM (2010; 2011))
41
Based on the average exchange rate Euro to Pound in 2010.

118 IEA-RETD / ECN-E--12-014
A.10 Power Smart Residential Loan programme of Manitoba Hydro, Canada
(Business model: On-bill financing; see pages 68, 70) The on bill financing program of Manitoba Hydro, called Power Smart Residential Loan, is the most successful on-bill financing programme in Canada and, measured by its loan volumes and loan val-ues, the largest in North America. The programme started in 2001 and is ongoing. Since the begin-ning of the loan programme, Manitoba Hydro has disbursed more than $200 million through over 50.000 loans. As the name implies, the programme focuses on the residential sector which is con-sidered more stable than the market for small businesses. As of March 2012, the minimum loan size was $500 and the maximum size $7.500 (approximately between €370 and €5.500). The maxi-mum term is 5 years at 3.9% interest (as of March 2012). If the loan (or part of the loan) is for the purchase of a high efficiency natural gas furnaces, the loan has a maximum term of 15 years. The interest rates have been adjusted various times over the lifespan of the programme and are cur-rently at a comparatively very low level. Default levels have generally been lower than 1%. The program is administered by the utility; the execution is undertaken by a strong network of contrac-tors. For the customer, the loan repayments are added as a line item to the utility bill. At the sale of the house, the loan becomes due and needs to be paid back. The following measures are eligible for financing under the programme: adding insulation, in-stalling ventilation, sealing air leaks, replacing windows and doors, upgrading the existing natural gas or electric heating system, and domestic water heaters. Geothermal Heat Pumps are financed through another Manitoba Hydro offering, the Earth Power Loan, which finances a maximum of $20.000 (about €14.700) over 15 years. When looking at the period from March 2001 to 2008/2009, $167 million in loans were disbursed. 59% of these loans were used to finance energy efficient window and door upgrades, 35% for heating system upgrades, and 6% for combination of upgrades to insulation, ventilation, and air sealing. In addition, Manitoba Hydro offers rebates for some measures, e.g. for insulation measures. These rebates partly explain the fact that insulation measures are not financed that much through the Power Smart Residential Loans, as only the bal-ance between the total cost of measures and the rebates are financed through the loan. The Power Smart Residential Loan is intended as a cost recovery program by Manitoba Hydro where the ad-ministration costs are recovered through the interest rate charged to the client. At times, Manitoba Hydro has subsidized the interest rate from its profits depending on the direction and focus of the energy efficiency and greenhouse gas emissions reduction targets set by the provincial government Reasons for the success of the programme are considered to be that fact that the loan application process is streamlined and that Manitoba Hydro has strong relationships with the contractors and retailers who execute the programme. Loan approvals normally are processed within one business day. Payments to the contractor happen within 20 business days. All suppliers have received train-ing on how the programme procedures work and have signed a Supplier Participation Agreement.
(Based on Manitoba Hydro (2011; 2012), Fuller (2009) and Brown & Conover (2009))

IEA-RETD / Business Models for Renewable Energy in the Built Environment 119
A.11 LEED certification
(Business model: Green building certification; see pages 49, 50)
The ‘Leadership in Energy and Environmental Design’ (LEED) standard ), administered by the US
Green Building Council (USGBC), is one of the largest voluntary green building standards globally. A
building can acquire one of the four LEED certification levels: certified, silver, gold and platinum
with platinum being the highest rating. Criteria42 for achieving these ratings vary, e.g. between new
and existing buildings and different building types such as residential buildings, commercial build-
ings and neighbourhood developments.
According to the US Green Building Council’s public database43, there are 45,000 registered and
LEED certified building projects worldwide up to 2012. The database shows that more than half of
the buildings are privately owned. The remaining buildings are owned by the public sector (institu-
tional, for example schools, or government owned). The average size of the buildings in this data-
base is around 200,000 gross m2, although most of the buildings are smaller. Almost 90% of all
LEED projects are realised in the US. Other countries with LEED certified developments include the
United Arabic Emirates, Brazil, Canada, China and India.
The following illustrates three case studies where LEED certification was achieved for new build-
ings.
Pearl Place, Maine, US
Pearl Place is a workforce housing project which was completed at the end of 2007. It consists of 60
affordable apartments comprising of a mix of one-, two- and three-bedroom apartments. The pro-
ject is owned and was developed by Avesta Housing, which is Maine's largest non-profit affordable
housing developer. The buildings in the Pearl Place development were certified LEED Gold in 2008.
Energy efficient features of the buildings include super-insulation and a tight building envelope,
unit compartmentalization, energy-efficient fixtures, appliances, and mechanical equipment, low-
VOC finishes and air-to-air heat exchange. Non-energy related green aspects include the use of
high-quality, permanent building materials such as brick and fiberglass and recycling facilities. Rea-
sons for pursuing the LEED certification were related to municipal regulations which require build-
ing developments that receive funds from the City of Portland to achieve at least LEED Silver certifi-
cation. However, according to one of the involved stakeholders one of the greatest benefits gained
from the integrated process used was that the development cost approximately the same as other
multi-family affordable housing projects in the region. Thus, other developers realized that green
buildings do not have to come at an additional cost to most building owners. However, the costs
for the certification and required consultants may still pose a challenge to project developers.44
42
Criteria for achieving LEED certification fall e.g. into the following categories: Sustainable Sites, Water Efficiency, Energy and Atmosphere, Materials and Resources, Indoor Environmental Quality and Innovation in Design. De-pending on what is being certified, the categories vary, e.g. for LEED for Neighbourhood Development catego-ries such as Neighbourhood Pattern and Design, and Green Infrastructure and Buildings are used.
43 See website http://www.usgbc.org/LEED/Project/CertifiedProjectList.aspx, consulted February 13th, 2012.
44 See pages 50-51 for information on certification costs and potential premiums in terms of sales price or building value of certified buildings. Whilst the cost for a combined design and construction review of a new building of 4.650 m
2 or less applying for LEED certification is around USD 2.500, the costs for consultants advising during
the project development process on how to achieve certification can be significantly higher.

120 IEA-RETD / ECN-E--12-014
Moffett Towers, California, US
The Moffett Towers complex is a new office and R&D campus in the center of California’s Silicon
Valley. Lot 1 of the development consists of three office towers and two parking garages, totaling
866,000 square feet, in the heart of the complex. Lot 1 achieved LEED for Core & Shell Gold certifi-
cation in 2009.
In terms of energy performance, Lot 1 is expected to use 30% less energy than a building which fol-
lows the baseline building code. This is achieved through a high-efficiency heating and air condi-
tioning system with variable speed fans, a sophisticated project automation system and a high-
efficiency lighting design. The fitness center located on the premises uses a solar thermal hot water
system for pool heating, which constitutes about 10% of the building’s overall energy usage. How-
ever, solar PV systems were considered to be too expensive. The design process was supported by
energy modeling which for example demonstrated that due to the site constraints it was not possi-
ble to construct all of the buildings according to an ideal north-south orientation. Moreover, the
modeling provided criteria which supported the selection of the most efficient glazing to use and of
the right amount of insulation required to meet the LEED criteria. Other important sustainability
related feature of the project are related to water consumption: the project is designed to use 40%
less water than a building that has conventional fixtures installed.
Suzlon One Earth, India
Suzlon, one of the world’s largest wind turbine manufacturers, developed a new office complex for
its global headquarters in India, the Suzlon One Earth office complex, which is considered to be
among the greenest office buildings in India. It was certified according to for LEED for New Con-
struction Platinum certification from the India Green Building Council in 2010. Five percent of its
annual energy requirements is generated on-site through conventional and building-integrated PV
panels and on-site wind turbines. The remaining electricity requirements are generated through
Suzlon’s off-site wind turbines Thus the office complex is technically a zero energy project. Moreo-
ver, energy savings are achieved through e.g. the use of LED lighting systems, solar water heating
and evaporative cooling. The operating expenses for the evaporative cooling system are more than
20% lower than for a standard air conditioning system and the new system also had lower capital
costs. Overall, the buildings’ energy performance per square meter of office space reflects energy
savings of more than 45% over conventional office buildings in India. Annual energy audits show
that, so far, the energy performance is as planned. With the LEED certification of the project, Su-
zlon aims to reflect its goal of promoting clean power globally. And according to the LEED Project
Administrator, the project development process was less costly than for commercial structured of a
comparable size and led to lower post-commissioning operating costs.
(based on USGBC (2011), USGBC (2011a), USGBC (2011b), USGBC (2011c))

IEA-RETD / Business Models for Renewable Energy in the Built Environment 121
A.12 Berlin Energy Saving Partnership
(Business model: Energy Performance Contracting; see pages 33,34,35) The Berlin Energy Saving Partnership was jointly developed by the Berlin Energy Agency and the
Berlin's Senate Department for Urban Development in 1996. It’s a model for achieving energy sav-
ings through Energy Performance Contracting (EPC), tapping into the potential for energy savings in
a pool of public buildings with different properties. Since 1996, within the Berlin Energy Saving
Partnership, 26 energy partnerships were launched, comprising more than 500 public buildings.
Some of the earlier contracts have already expired by now, thus as of May 2011, about 375 building
were under EPC contracts. The project is ongoing and the model has also been replicated in other
regions of Germany. The latest building pool in Berlin was contracted in mid 2011. Examples of
public buildings upgraded in the frame of the project in Berlin include town halls, schools, day
nurseries etc.
In the set-up of the Berlin Energy Saving Partnership, the Berlin Energy Agency acts as the inde-
pendent market and project facilitator, who moderates and manages the process, e.g. the negotia-
tions on the contract, and puts the building pools out for bidding. The EPC contracts are imple-
mented by private ESCOs (Energy Service Companies) which finance investments into energy sav-
ings. The ESCOs undertake the upfront investment into energy saving measures and recover these
initial costs through energy cost savings over the contract period, which is on average around 12
years. Average payback periods of the investments undertaken are about 5 years. Typical energy
saving measures applied are efficient lighting, heating control systems, and energy consumption
regulators; occasionally, insulation and CHP systems are applied as well.
The ESCO is also responsible for the planning, implementation and management of the energy sav-
ings measures and bears all the operational and economic risk of the project over the entire project
term. The contractor bears the responsibility for the operational performance of the technical sys-
tems, including any risks caused by a breakdown of the systems. The ESCO legally guarantees a
minimum level of energy savings. This implies that if the targeted energy savings are not achieved,
the ESCO will still compensate the building owner for them (Berliner Energieagentur, 2006). Addi-
tional cost savings are shared by the ESCO and the building owner, which is an additional incentive
for the ESCO and the building owner to participate. Once the contract period ends, the full energy
cost savings accrue to the building owner.
In the frame of the project, public buildings, typically from one administration, are ‘pooled’ to re-
duce transaction costs. This also makes it possible to include less profitable buildings in the pool.
Building pools that participate in the Berlin Energy Saving Partnership must have a minimum annual
energy bill of approximately €200,000. The average energy cost baseline is about €1.8 million/a.
The number of buildings per pool varies: some contracts include only one building, e.g. a hospital
with significant energy use on its own; the largest building pool comprises of 73 buildings.
For the building owners, the advantage of the model is that they do not bear any investment costs,
can outsource the implementation of the energy saving measures as well as the technical and eco-
nomic risks, and realize energy cost savings.
The local government in Berlin subsidizes the services carried out by the Berlin Energy Agency by
50% (New York City Global Partners, 2011). This support is critical as otherwise most building own-
ers would not be willing to engage in the EPC project (Berliner Energieagentur, 2007).

122 IEA-RETD / ECN-E--12-014
In the 26 building pools contracted under the Energy Saving Partnership overall about 11.3 m € of
guaranteed annual costs savings are achieved, 2.7 m € of which are costs savings for the govern-
ment of Berlin (Berger, 2011; Berliner Energiagentur, 2011). This is accomplished through overall
contractually guaranteed minimum investments of 51.6 m €. An example building pool are 69
schools, kindergartens and gyms in Berlin’s district Steglitz-Zehlendorf (Berger, 2011). These 69
buildings have an energy cost baseline of 1.84 m €/a. The performance contract for the building
pool foresees guaranteed savings of 29.4% or 541,679 €/a, achieved through an investment of
about €2.8 m. The contract has a duration of 14 years and includes the following measures: new
boilers in 11 buildings, a switch from coal / heating oil to gas, building automation, the modernisa-
tion of lighting systems and investment of 100,000 into renewable energy technologies such as so-
lar thermal systems. These measures lead to an expected CO2 reduction of 3,973 t/a (Berger, 2011).
Energy Performance Contracting as undertaken by the Berlin Energy Saving Partnership is a well
replicable concept which can lead to significant energy cost savings in public buildings without the
need for up-front capital investments by the involved public building owners. However, it does re-
quire independent facilitators to develop and facilitate projects, a functioning market of ESCOs
which have sufficient access to capital to bear the significant up-front investment costs. And the
concept normally does not extend to measures targeting the building shell or renewable energy
carriers. Similar initiatives are being implemented outside of Berlin in other German regions, but
also in Bulgaria, Slovenia, Romania and Chile. Moreover, know-how has been transferred to help
initiate similar programmes in Central, Eastern and Western Europe.
(based on Berger (2011), Berliner Energieagentur (2006; 2007; 2011), New York City Global Part-
ners (2011))

IEA-RETD / Business Models for Renewable Energy in the Built Environment 123
References
Activum finance (2011): Website: http://www.activum-finance.nl/informatie. Last accessed June 24th, 2011.
Aedes (2009): Woonlastenwaarborg bij energiebesparing. May 2009.
Aedes (2011): Energielabels in woningwaarderingsstelsel, available at: http://www.aedesnet.nl/content/artikelen/achtergrond/unknown/dossier-huur-en-verhuur/Energielabels-in-woningwaarderingsstelsel.xml.
AgentschapNL (2011): Stimuleringsregeling Duurzame Energie, available at: http://www.agentschapnl.nl/nl/programmas-regelingen/stimulering-duurzame-energieproductie-sde , last accessed June 30, 2011.
Bailey, M., C. Broido Johnson (2009): The American Recovery and Reinvestment Act (ARRA) of 2009: Innovative Energy Efficiency Financing Approaches. U.S. Department of Energy, Office of Energy Efficiency and Renewable Energy.
Berger, Susanne (2011): Energy Saving Partnership – Better Practice Berlin. Berliner Energieagentur. Presentation at the BETTER-PRACTICE-EXCHANGE 2011 – ENERGIE, Potsdam, 30 May 2011. Available at http://ecologic.eu/files/attachments/Projects/2358/prasentation_berger.pdf
Berliner Energieagentur (2006): Performance Contracting - Energy Saving Partnership - A Berlin Success Model. Available at www.dfhk.fi/fileadmin/ahk.../Berlin_Vortrag_BEA_englisch.pdf
Berliner Energieagentur (2007): Case study Energy Savings Partnership.C40 Large Cities Climate Summit, New York City 2007
Berliner Energiagentur (2011): Übersicht der Energiesparpartnerschaften in Berlin – Stand Mai 2011. Available at http://www.berliner-e-agentur.de/sites/default/files/uploads/pdf/pooluebersichtespaktuell.pdf
Bertoldi et al. (2009): Energy supplier obligations and white certificate schemes: comparative analysis of experiences in the European Union. P. Bertoldi, S. Rezessy, E. Lees, P. Baudry, A. Jeandel, N. Labanca. Energy Policy38, 2010, 1455-1469.
Bertoldi, P., Boza-Kiss, B., Rezessy, S. (2007): Latest Development of Energy Service Companies across Europe - A European ESCO Update. EC JRC Institute for Environment and Sustainability, Ispra 2007
Bertoldi & Rezessy (2009): Energy saving obligations and tradable white certificate schemes. CEC/JRC report. Ispra, Italy. December 2009.
Bleyl (2008): Opportunity cost tool. Preliminary version. J. W. Bleyl & D. Schinnerl, Graz Energy Agency. May 2008.
Bleyl, J., M. Suer (2006): Comparison of different finance options for energy services. In light+building, International Trade Fair for Architecture and Technology, Frankfurt, 2006.
Bleyl, J. W. (2009): Integrated Energy Contracting (IEC). A new Model to Combine Energy Efficiency and (Renewable) Energy Supply. IEA DSM Task XVI Discussion Paper. Available at www.ieadsm.org
Bleyl, J.W. (2011): Conservation First! The New Integrated Energy-Contracting Model to Combine Energy Efficiency and Renewable Supply in Large Buildings and Industry. In ECEEE Summer Studies, paper ID 485, Belambra Presqu'île de Giens, France, June 2011
Bleyl, J. W, B. Eikmeier (2009): Energy Contracting: How much can it contribute to Energy Efficiency

124 IEA-RETD / ECN-E--12-014
in the Residential Sector? Transaction and Life Cycle Cost Analyses. Market Survey and Statistical Potential. In IAEE 2009 proceedings, paper ID 520, Vienna, Austria, September 2009
Bleyl, J.W. & Schinnerl, D. (2008): “Energy Contracting” to Achieve Energy Efficiency and Renewables using Comprehensive Refurbishment of Buildings as an example. In: Urban Energy Transition edited by Peter Droege, Elsevier 2008
BMU (2011): Richtlinien zur Förderung von Maßnahmen zur Nutzung erneuerbarer Energien im Wärmemarkt Vom 11. März 2011, Berlin, March 2011.
Boland (2010): Local Governments and Federal Agency Clash Over Property Assessed Clean Energy Programs. DEFG’s Series of Regulatory Choices, No. 3, September 2010.
Boonekamp, P., P. Vethman (2010): Analysis of policy mix and development of Energy Efficiency Service. Task 2.3 of the project ‘Change Best - Promoting the development of an energy efficiency service (EES) market’.
Boot, P.A. (2009): Energy efficiency obligations in the Netherlands - A role for white certificates? ECN. September 2009.
Brealey and Myers (2003): Principles of corporate finance. R.A. Brealey and S.C. Myers. 2003.
Brown, M.H., B. Conover (2009): Recent innovations in financing for clean energy. Southwest Energy Efficiency Project, Boulder, Colorado, October 2009
Brown, M. (2009): Paying for Energy Upgrades Through Utility Bills. State Energy Efficiency Policies: Options and Lessons Learned. Brief # 3. Alliance to Save Energy.
Brown, M., Chandler, J., Lapsa, M. (2010): Policy Options Targeting Decision Levers: An Approach for Shrinking the Residential Efficiency Gap. 2010 ACEEE Summer Study on Energy Efficiency in Buildings.
Bunse, M., W. Irrek, K. Siraki, G. Renner (2009): National Report on the Energy Efficiency Service Business in Germany. Task 2.1 of the project ‘Change Best - Promoting the development of an energy efficiency service (EES) market’.
CalCEF (2009): New Business Models for Energy Efficiency. CalCEF’s Innovation White Paper, March 2009.
CERT (2011). Carbon Emission Reduction Target policy programme UK. Available at http://www.decc.gov.uk/en/content/cms/funding/funding_ops/cert/cert.aspx. Consulted on March 9, 2011.
City of Berkeley (2010): Berkeley FIRST Final Evaluation. City of Berkeley, Office of Energy and Sustainable Development, November 2010.
Clearsupport (2008): Recommendations on financial schemes for local Clearinghouse operation. Final draft version, Clearsupport project. Berliner Energie Agentur, Investitionsbank Schleswig-Holstein & Clearsupport project partners. July 2008.
Connor, P., V. Bürger, L.W.M. Beurskens, K. Ericsson, C. Egger (2009): Overview of RES-H/RES-C Support Options. part of the IEE project ‘Policy development for improving RES-H/C penetration in European Member States (RES-H Policy)’.
COWI (2008). Promoting Innovative Business Models with Environmental Benefits. Final report to the European Commission.
DECC (2010). Extending the Carbon Emissions Reduction Target to December 2012. Impact assessment. UK Department of Energy & Climate Change. June 2010.
DECC (2011): Renewable Heat Incentive. UK Department of Energy and Climate Change, April 2011.
DECC (2011a). Personal communication Mr. Alan Clifford of DECC, by mail. March 2011.

IEA-RETD / Business Models for Renewable Energy in the Built Environment 125
DECC (2011b). GB Energy company obligations (ECO), website: http://re.jrc.ec.europa.eu/energyefficiency/events/pdf/JRC%20WhC%20workshop/session%201/ITALY%20PRESENTATION.pdf. Alan Clifford, Department of Energy and Climate Change. Eceee workshop on energy saving obligations, September, 2011.
DECC (2012a). Personal communication Mr. Alan Clifford of DECC, by mail. January 11th and February 7th, 2012.
DECC (2012b). Energy consumption in the United Kingdom. Available at http://www.decc.gov.uk/en/content/cms/statistics/publications/ecuk/ecuk.aspx, consulted January 12, 2012.
Dsireusa (2011): Overview of renewable energy policy in the US, website: http://www.dsireusa.org/summarytables/rrpre.cfm. Consulted July 21st, 2011.
ECN (2011): Personal communication from C. Tigchelaar, June 24th 2011.
ECN (2011b): Energy efficiency directive impact assessment report. ECN, June 2011.
Ecorys, Ecofys and BioIntelligence (2010): Study to Support the Impact Assessment for the EU Energy Saving Action Plan.
Eerste Kamer (2011): Wijziging van de Uitvoeringswet huurprijzen woonruimte (wettelijke grondslag verschillende waardering energieprestaties huurwoningen. Ministerie van BZK, Eerste Kamer, vergaderjaar 2010-2011, 32 302, B.
Eceee (2011). Workshop on energy saving obligations. September, 2011.
Eichholtz, P., N. Kok, J. M. Quigley (2008): Doing Well by Doing Good? Institute of Business and Economic Research, Berkeley Program on Housing and Urban Policy. University of California, Berkeley.
Eikmeier, B., F. Seefeldt, J.W. Bleyl, C. Arzt (2009): Contracting im Mietwohnungsbau. Final report
Essent (2011). Personal communication Mr. G. Kempen. July, 2011.
EST (2011): Feed-in Tariff Scheme, UK Energy Savings Trust, available at http://www.energysavingtrust.org.uk/Generate-your-own-energy/Sell-your-own-energy/Feed-in-Tariff-scheme , last accessed June 30, 2011
European Commission (2002): Directive 2002/91/EC of the European Parliament and of the Council of 16 December 2002 on the energy performance of buildings
European Commission (2006): Directive 2006/32/EC of the European Parliament and of the Council on Energy End Use and Energy Services, as of 5 April 2006
European Commission (2008), Energy Sources, Production Costs and Performance of Technologies for Power Generation, Heating and Transport, Commission Staff Working Document accompanying the Communication from the Commission to the European Parliament, the Council, the European Economic and Social Committee and the Committee of the Regions, Second Strategic Energy Review, An EU Energy Security and Solidarity Action Plan, SEC(2008)2872.
European Commission (2010/11). Concerted Action – Energy Services Directive. See http://www.esd-ca.eu/CA-ESD
European Commission (2010): Directive 2010/31/EU of the European Parliament and of the Council of 19 May 2010 on the energy performance of buildings (recast).
European Committee for Standardization (EN) (2009). Energy efficiency services – Definitions and essential requirements. CEN/CLC/TF 189, draft under discussion. March 2009
Fina-ret (2008). Fina-ret project - WP 2, Review of existing financing products/mechanisms for RE and EE Technologies Applications. May, 2008.

126 IEA-RETD / ECN-E--12-014
Franklin Energy (2011): Financing Energy Improvements - Insights on Best Practices to Engage Stakeholders and Marry Dollars with Demand. Office of Energy Security, Minnesota Department of Commerce, January, 2011.
Fresh project (2011). Energy retrofitting of social housing through energy performance contracts. Fresh project, January 2011.
Foxona, T.J., R. Grossa, A. Chaseb, J. Howesb, A. Arnallc, D. Anderson (2005): UK innovation systems for new and renewable energy technologies: drivers, barriers and systems failures. In Energy Policy, Vol. 33, pp. 2123-2137
Fuerst, F., P. McAllister (2008): Does it Pay to Be Green? Connecting Economic and Environmental Performance in Commercial Real Estate Markets. The University of Reading, Business School.
Fuerst, F., P. Mc Allister (2011): Green Noise or Green Value? Measuring the Effects of Environmental Certification on Office Values. In Real Estate Economics, Volume 39, Issue 1, pp. 45-69.
Fuller, M. (2008): Enabling Investments In Energy Efficiency - A study of energy efficiency programs that reduce first-cost barriers in the residential sector. California Institute for Energy and Environment, September 2008.
Gilliand, J. (2011): Policy options for the renewable electricity and heat market, and their justification, presented at the Teagasc National Bioenergy Conference 2011, Tullamore, April 2011.
Gifford, Jason S., Robert C. Grace and Wilson H. Rickerson (2011): Renewable Energy Cost Modeling: A Toolkit for Establishing Cost-Based Incentives in the United States, NREL, May 2011.
Greenchoice (2011). Zonvast. Available at http://www.greenchoice.nl/thuis/zelf-opwekken/met-zon/ZonVast. Last accessed July 11th, 2011
Gray & Needles (1999): Financial accounting - a global approach. S. J. Gray & B. E. Needles jr., 1999.
IEA-RETD (2007). Renewables for Heating and Cooling - untapped potential. Available at http://www.dekoepel.org/documenten/Renewable_Heating_Cooling_Final_WEB.pdf
IEA-RETD (2010): Best Practices in the Deployment of Renewable Energy for Heating and Cooling in the Residential Sector. Available at http://www.iea-retd.org/files/IREHC%20Final%20Report%2020100726.pdf.
IEA (2007). Mind the gap – quantifying principal –agent problems in energy efficiency. Available at http://www.iea.org/textbase/nppdf/free/2007/mind_the_gap.pdf
IEA (2008). Promoting energy efficiency investments - Case studies in the residential sector. Available at http://www.iea.org/textbase/nppdf/free/2008/PromotingEE2008.pdf
IEA (2008b): CHP/DHC Country Scorecard: Japan. The International CHP/DHC Collaborative - Advancing Near Term Low Carbon Technologies.
IEA (2010): Money matters - Mitigating risk to spark private investments in energy efficiency. Philippine de T’Serclaes. Information Paper, available at http://www.iea.org/papers/efficiency/money_matters.pdf. September 2010.
IEA-RTD (2011): Renewable Energy for Residential Heating and Cooling, Policy handbook, Earthscan, 2011
IEE workshop (2011): Boosting the energy service market in Europe - conclusions IEE workshop. February, 2011.
Institute for Building Efficiency (2010): Property Assessed Clean Energy Financing- Benefits and Barrier Busting.

IEA-RETD / Business Models for Renewable Energy in the Built Environment 127
Institute for Building Efficiency (2010c): Unlocking the building retrofit market: Commercial PACE Financing – A guide for policy makers. Website, available at http://www.institutebe.com/clean-energy-finance/pace-finance.aspx, last accessed 11 May, 2011.
Institute for Building Efficiency (2010b): PACE: Opportunities for Owners Through Tax Lien Financing. Website, available at http://www.institutebe.com/clean-energy-finance/pace-finance.aspx, last accessed 11 May, 2011.
Institute for Building Efficiency (2010c): Unlocking the building retrofit market: Commercial PACE Financing – A guide for policy makers. Issue brief, December 2010.
IPCC (2007). Residential and commercial buildings. In Climate Change 2007: Mitigation. Contribution of Working Group III to the Fourth Assessment Report of the Intergovernmental Panel on Climate Change. B. Metz, O.R. Davidson, P.R. Bosch, R. Dave, L.A. Meyer (eds), Cambridge University Press, Cambridge, United Kingdom and New York, NY, USA.
IPCC (2011). Technical Summary. In IPCC Special Report on Renewable Energy Sources and Climate Change Mitigation. O. Edenhofer, R. Pichs‐ Madruga, Y. Sokona, K. Seyboth, P. Matschoss, S. Kadner, T. Zwickel, P. Eickemeier, G. Hansen, S. Schlömer, C. von Stechow (eds), Cambridge University Press, Cambridge, United Kingdom and New York, NY, USA.
Johnson, K., G. Willoughby, W. Shimoda, M. Volker (2011): Lessons learned from the field: key strategies for implementing successful on-the-bill financing programs. In Energy Efficiency, published online 13 January 2011.
Jumanjisolar (2011): Website, available at www.jumanjisolar.com/2011/06/autoconsumo-rentable-consumir-energia-fotovoltaica.html
JRC (2009): Energy saving obligations and tradable white certificates: purposes and outcomes. JRC, 2009.
JRC (2011): JRC workshop on energy saving obligations, website: http://re.jrc.ec.europa.eu/energyefficiency/events/WhC_Workshop.htm. Varese, Italy. January 2011.
Kats, G. et al. (2008): Greening Buildings and Communities: Costs and Benefits. Good Energies, Zug.
Manitoba Hydro (2012): Personal communication by Colleen Kuruluk , Manager - Power Smart Marketing Programs. March 27th, 2012
Manitoba Hydro (2011): Power Smart Residential Loan. Website, available at http://www.hydro.mb.ca/your_home/residential_loan.shtml, last accessed March 12th, 2012
Menichetti, E., Touhami, M. (2007): Creating a credit market for solar thermal: the PROSOL project in Tunisia. Presented at the 3rd European Solar Thermal Energy Conference, June 19-20, 2007.
New York City Global Partners (2011): Best Practice: Public-Private Partnership for Building Retrofits. Available at www.nyc.gov/html/unccp/gprb/.../pdf/Berlin_Buildings_ESP.pdf
Nishizaki, Kunihiro (2008): The Japanese experience in micro CHP for residential use. Tokyo Gas, presented at Gas Industry Micro CHP Workshop, May 29, 2008.
Labanca, N. (2010): Status and development of the energy efficiency service business in 18 EU countries. Task 2.1 of the project ‘Change Best - Promoting the development of an energy efficiency service (EES) market’.
LBNL (2011): Property Assessed Clean Energy (PACE) Financing: Update on Commercial Programs. Policy Brief.

128 IEA-RETD / ECN-E--12-014
Lensink, S.M.; X. van Tilburg, M. Mozaffarian, J.W. Cleijne (2007): Feed-in support for renewable electricity - a comparison of three European implementations (Dutch), ECN-E-007-030, Amsterdam, 2007
Mathiessan, L.F., P. Morris (2004): Costing Green: A Comprehensive Cost Database and Budgeting Methodology. Davis Langdon.
Milieucentraal (2011a). Website. Available at http://www.milieucentraal.nl/pagina.aspx?onderwerp=zonneboiler#Zonneboiler_kopen:_subsidie. Last accessed: July 11th, 2011.
Miller, N., J. Spivey, A. Florance (2007): Does Green Pay Off? November, 2007
McKinsey (2009). Pathways to a low carbon economy – Version 2 of the Global Greenhouse Gas Abatement Cost Curve.
Nelson, A. (2008): Globalization and Global Trends in Green Real Estate. RREEF Research. San Francisco, USA
Nelson, A., O. Rakau. P. Doerrenberg (2010): Green Buildings - A niche becomes mainstream. Deutsche Bank Research, April 12, 2010.
Nikolaev, A. (2010): National Report on the Energy Efficiency Service Business in Bulgaria. Task 2.1 of the project ‘Change Best - Promoting the development of an energy efficiency service (EES) market’.
Nostrand, J.M. van (2011): Legal Issues in Financing Energy Efficiency: Creative Solutions for Funding the Initial Capital Costs of Investments in Energy Efficiency Measures. In Journal of Energy and Environmental Law, Winter 2011.
NREL (2010): Property-Assessed Clean Energy (PACE) Financing of Renewables and Efficiency. Fact Sheet Series on Financing Renewable Energy Projects.
Ofgem (2010): A review of the second year of the Carbon Emissions Reduction Target - Annual report to Secretary of State for Energy and Climate Change. August, 2010.
Ofgem (2011): Carbon Emissions Reduction Target - update. Issue 14. December, 2011
Osterwalder, A. (2004). The Business Model Ontology – A proposition in a design scheme approach. PhD thesis at the University of Lausanne, Ecole des Haute Etudes Commerciale.
Osterwalder, A., Pigneur, P. and Tucci, C.L. (2005). Clarifying Business Models: Origins, present and Future of the Concept, CAIS (Communications of the Association for Information Systems), Vol. 15, Article, May 2005.
OTB (2010): Housing Statistics in the European Union 2010. K. Dol & M. Haffner, OTB Delft. September 2010.
PACENow (2011): PACENow website. Available at http://pacenow.org/blog/, last accessed 11 May, 2011.
Patterson, W. (2010): Toward Real Energy Economics. Presentation given at the International Association for Energy Economics Conference, Rio de Janeiro, 6-9 June 2010
Pivo G., J.D. Fisher (2009): Investment Returns from Responsible Property Investments: Energy Efficient, Transit-oriented and Urban Regeneration Office Properties in the US from 1998-2008. Working Paper, Responsible Property Investing Center, Boston College and University of Arizona, and Benecki Center for Real Estate Studies, Indiana University.
Porter, M. E. (2001). Strategy and the Internet. Harvard Business Review
RAEL (2009): Guide to Energy efficiency and renewable energy financing districts for local governments. Prepared by Renewable and Appropriate Energy Laboratory (RAEL), University of California, Berkely for the City of Berkely, California.

IEA-RETD / Business Models for Renewable Energy in the Built Environment 129
Rappa, M. (2001). Managing the digital enterprise - Business models on the Web, North Carolina State University. 2002.
REN21(2011): Renewables 2011 - global status report, Paris, REN21 secretariat. Available from http://www.ren21.net/Portals/97/documents/GSR/REN21_GSR2011.pdf
Satchwell, A., Goldman, C. Larsen, P., Gilligan, D., Singer, D. (2010): A Survey of the U.S. ESCO Industry: Market Growth and Development from 2008 to 2011. Lawrence Berkeley National Laboratory, LBNL-3479E. June 2010
Schafer, B., J. Konstan, et al. (2000). E-Commerce Recommendation Applications. In Journal of Data Mining and Knowledge Discovery 5(1/2): 115-152.
See, S. (2011): More Buildings Going Green. In Channel News Asia, May 17, 2011, available at http://www.channelnewsasia.com/stories/singaporelocalnews/view/1129434/1/.html
Szomolanyiova, J., V. Sochor (2011): Preliminary conclusions and recommendations. Task 5.1 of the project ‘Change Best - Promoting the development of an energy efficiency service (EES) market’.
Tigchelaar, C. (2011): Obligations in the existing housing stock: who pays the bill? C. Tigchelaar, B. Daniels & M. Menkveld, ECN. ECEEE summer study 2011.
Tukker, A. (2004). Eight types of product-service-system: eight ways to sustainability? Experiences from Suspronet. In Business Strategy and the Environment. 13: 246-260.
UIPI & CEPI (2010): Landlord/tenant dilemma. Joint statement by CEPI, the European Council of Real Estate Professions and UIPI, the International Union of Property Owners. December, 2010.
UIPI (2010): Revision of the Energy Efficiency Action Plan - strategy: contribution from private property and building owners’ organisations to meet the challenge. UIPI - GEFI - UEHHA.
UK DECC (2010): The Green Deal - A summary of the Government’s proposals. Available at http://www.decc.gov.uk/assets/decc/legislation/energybill/1010-green-deal-summary-proposals.pdf, last accessed July 10th, 2011.
UNEP (2007): Assessment of policy instruments for reducing greenhouse gas emissions from buildings. Report for the UNEP-Sustainable Buildings and Construction Initiative, available at http://www.unep.org/themes/consumption/pdf/SBCI_CEU_Policy_Tool_Report.pdf.
US Department of Energy (2010): Guidelines for Pilot PACE Financing Programs. May, 2010.
US Department of Energy (2010b): PACE Programs Primer.
US EPA (2011): Renewable Portfolio Standards factsheet. Available at http://www.epa.gov/chp/state-policy/renewable_fs.html. Consulted June 21st, 2011.
US EPA (2011b). Personal communication by Ms. Neeharika Naik-Dhungel of the US Environmental Protection Agency (EPA), August 3rd 2011
US Green Buildings Council (USGBC) (2011): Website. Available at http://www.usgbc.org
US Green Buildings Council (USGBC) (2011a): Case Study Pearl Place, incl. interviews with the Project Architect Manager, sustainability consultant and energy analyst. Available at http://demo.usgbc.name/projects/pearl-place
US Green Buildings Council (USGBC) (2011b): Case Study Moffett Towers incl. interviews with the project owner representative, the architect and a contractor. Available at http://demo.usgbc.name/projects/moffett-towers
US Green Buildings Council (USGBC) (2011c): Case Study Suzlon One Earth incl. an interview with

130 IEA-RETD / ECN-E--12-014
the Program Director, Synefra E&C Ltd . Available at http://demo.usgbc.name/projects/suzlon-one-earth
Usher, E. (2010): Engaging the Banks in Providing End-User Financing To the Solar Water Heating Sector. Presented at the Delhi International Renewable Energy Conference (DIREC), October 27-29, 2010. Available at http://www.direc2010.gov.in/pdf/Engaging%20the%20Banks%20In%20Providing%20End-User%20Financing%20To%20the%20Solar%20Water%20Heating%20Sector.pdf
Vethman, P. (2009). Het financieren van energiebesparing in woningen. ECN. Juni 2009.
Weill, P. and M. R. Vitale (2001). Place to space: Migrating to eBusiness Models. Boston, Harvard Business School Press.
Wood (2010): Loan Giants Threaten Energy-Efficiency Programs. The New York Times, June 30, 2010. Available at http://www.nytimes.com/2010/07/01/business/energy-environment/01solar.html?_r=1&pagewanted=1&hp, last accessed 11 May, 2011.
Woonbond (2011): Energielabel onderdeel van het woningwaarderingsstelsel. April 2011.
World Business Council for Sustainable Development (WBCSD) (2007): Energy Efficiency in Buildings - Business realities and opportunities. Available at http://www.wbcsd.org/DocRoot/JNHhGVcWoRIIP4p2NaKl/WBCSD_EEB_final.pdf
World Business Council for Sustainable Development (2008): TEPCO & JFS - Energy service companies (ESCO). Available at http://www.wbcsd.org/DocRoot/U0QJ1vl2BTco1JjB9UlI/TEPCO-ESCO-JFS-Hiro-hospital.pdf
World Business Council for Sustainable Development (WBCSD) (2009). Roadmap for a Transformation of Energy Use in Buildings.
World Business Council for Sustainable Development (WBCSD) (2010). Energy Efficiency in Buildings: Transforming the Market. Available at http://www.wbcsd.org/includes/getTarget.asp?type=d&id=MzQyMDU
WS Wonen (2010). Punt van de huur 2010. WijksteunpuntWonen, april 2010.
Wuestenhagen, R., J. Boehnke (2006). Business models for sustainable energy. In Andersen, M.M., Tukker, A. (eds.). Perspectives on Radical Changes to Sustainable Consumption and Production (SCP), Sheffield: Greenleaf.
Wuppertal Institute for Climate, Environment, Energy et al. (2010). Change Best – Intelligent Energy Europe Project on market development of Energy and Energy Efficiency Service Companies. See http://www.changebest.eu/

EnergeticSolutions
DDI Jan W. Bleyl