business-level strategy and strategy performance€¦ · relationship between business-level...
TRANSCRIPT

Business-level strategy andperformance
The moderating effects of environment andstructure
M.K. NandakumarIndian Institute of Management, Kerala, India
Abby GhobadianHenley Business School, Henley-on-Thames, UK, and
Nicholas O’ReganBristol Business School, UWE Bristol, Bristol, UK
Abstract
Purpose – This study aims to examine the moderating effects of external environment andorganisational structure in the relationship between business-level strategy and organisationalperformance.
Design/methodology/approach – The focus of the study is on manufacturing firms in the UKbelonging to the electrical and mechanical engineering sectors, and respondents were CEOs. Bothobjective and subjective measures were used to assess performance. Non-response bias was assessedstatistically and appropriate measures taken to minimise the impact of common method variance(CMV).
Findings – The results indicate that environmental dynamism and hostility act as moderators in therelationship between business-level strategy and relative competitive performance. In low-hostilityenvironments a cost-leadership strategy and in high-hostility environments a differentiation strategylead to better performance compared with competitors. In highly dynamic environments acost-leadership strategy and in low dynamism environments a differentiation strategy are morehelpful in improving financial performance. Organisational structure moderates the relationship of boththe strategic types with ROS. However, in the case of ROA, the moderating effect of structure was foundonly in its relationship with cost-leadership strategy. A mechanistic structure is helpful in improving thefinancial performance of organisations adopting either a cost-leadership or a differentiation strategy.
Originality/value – Unlike many other empirical studies, the study makes an importantcontribution to the literature by examining the moderating effects of both environment andstructure on the relationship between business-level strategy and performance in a detailed manner,using moderated regression analysis.
Keywords Manufacturing industries, Performance management
Paper type Research paper
1. IntroductionThe strategy of an organisation describes the way it will pursue its goals given thethreats and opportunities in the environment and its resources and capabilities (Rueand Holland, 1989). Corporate-level strategy relates to the product/market choice(s) of afirm and business-level strategy defines how it will deploy its resources in a givenproduct/market area vis-a-vis its competitors (Hatten et al., 1978). Business-levelstrategy is a powerful predictor of other organisational phenomena and perhaps the
The current issue and full text archive of this journal is available at
www.emeraldinsight.com/0025-1747.htm
Business-levelstrategy
907
Management DecisionVol. 48 No. 6, 2010
pp. 907-939q Emerald Group Publishing Limited
0025-1747DOI 10.1108/00251741011053460

most useful stream of research for practitioners is the empirical examination of itsrelationship with organisational performance (Hambrick, 1980). An effective strategywill provide sustainable competitive advantage to an organisation resulting in superiorperformance (Oosthuizen, 1997). However this can be achieved only if the strategymatches properly with the organisation’s external environment and internal conditions(Thompson and Strickland, 1996).
Strategic management literature suggests that a successful firm’s strategy andstructure must be favourably aligned with its external environment (e.g. Dess andKeats, 1987). The relationships between business-level strategy and environment havebeen widely discussed in the extant literature (e.g. Hambrick, 1983b; Kim and Lim,1988; Miller, 1988). Organisations face significant constraints and contingencies fromtheir external environments and their competitiveness depends on their ability tomonitor the environments and adapt their strategies accordingly (Boyd and Fulk,1996). Many authors have argued that a firm’s strategy must be closely aligned with itsstructure (e.g. Van de Ven and Drazin, 1985; Jennings et al., 2003). The suitability ofstrategies and structures largely depends upon the match between strategy andstructure (Chandler, 1962; Rumelt, 1974; Miles and Snow, 1978; Miller and Friesen,1984). According to Lenz (1980) the combination of environment, strategy, andorganizational structure in high-performance firms differed significantly from that oflow performance firms. A substantial number of empirical studies have examined therelationship between business-level strategy and performance (e.g. Parker and Helms,1992; Kling and Smith, 1995; Andrews et al., 2006). However, not many of them haveexamined the impact of external environment and organisational structure in thisrelationship. The matching of organisational strategies to the internal structure of theorganisation and its external environment can be termed as strategic fit. This type offit has been examined by previous researchers according to six perspectives, namely fitas moderation, fit as mediation, fit as matching, fit as Gestalts, fit as profile deviations,and fit as covariation (Venkatraman, 1989; Camillus and Venkatraman, 1984). In thisstudy we assessed the nature of fit between strategy and environment as well as the fitbetween strategy and structure using fit as moderation perspective since it is widelyused by strategic management researchers (e.g. Goll and Rasheed, 1997; Matthews andScott, 1995).
The remaining sections of this paper we discuss the conceptual model, researchmethodology, data analysis and findings. In the next section we introduce theconceptual framework on the basis of which the hypotheses have been developed. Inthe section on Research Methodology we discuss the constructs used for measurement,the sampling procedure, the execution of the survey and issue of common methodvariance. In the Data Analysis section we explain the findings from the analysis. In thelast section we summarise the inferences derived from this study and indicate some ofits limitations and a few directions for future research.
2. Research model and hypothesesIn Figure 1 we present the conceptual model used in this study.
The model shows that the relationship between business-level strategy andorganisational performance is influenced by the external environment andorganisational structure. Strategic management literature suggests that environmentcan be operationalised using three constructs namely dynamism, complexity andhostility. Dynamism is also referred to as uncertainty and is defined as the rate of
MD48,6
908
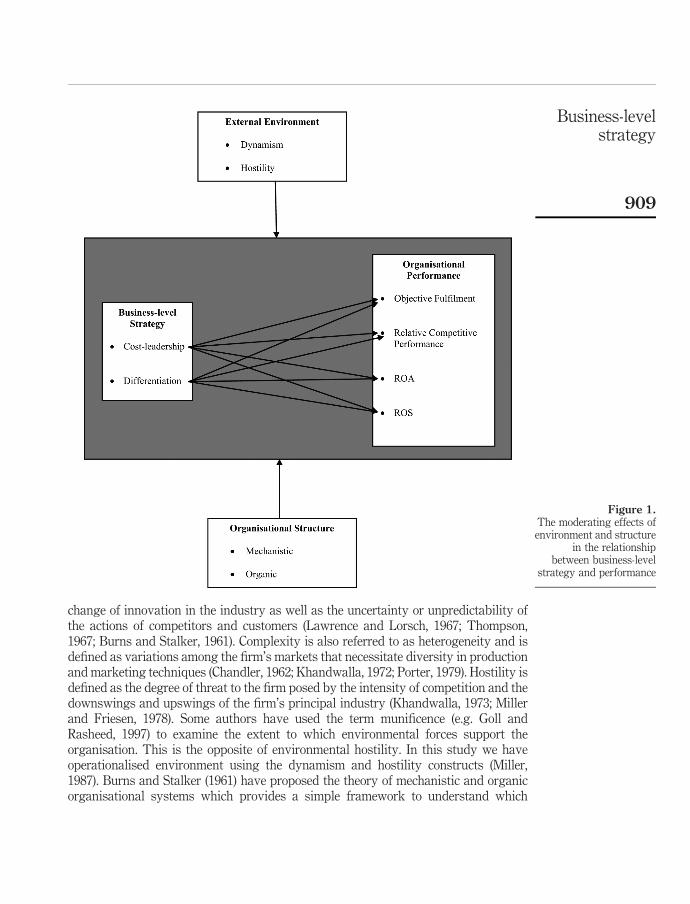
change of innovation in the industry as well as the uncertainty or unpredictability ofthe actions of competitors and customers (Lawrence and Lorsch, 1967; Thompson,1967; Burns and Stalker, 1961). Complexity is also referred to as heterogeneity and isdefined as variations among the firm’s markets that necessitate diversity in productionand marketing techniques (Chandler, 1962; Khandwalla, 1972; Porter, 1979). Hostility isdefined as the degree of threat to the firm posed by the intensity of competition and thedownswings and upswings of the firm’s principal industry (Khandwalla, 1973; Millerand Friesen, 1978). Some authors have used the term munificence (e.g. Goll andRasheed, 1997) to examine the extent to which environmental forces support theorganisation. This is the opposite of environmental hostility. In this study we haveoperationalised environment using the dynamism and hostility constructs (Miller,1987). Burns and Stalker (1961) have proposed the theory of mechanistic and organicorganisational systems which provides a simple framework to understand which
Figure 1.The moderating effects ofenvironment and structure
in the relationshipbetween business-level
strategy and performance
Business-levelstrategy
909

organisational forms are suitable for specific contexts of change and stability. Thisframework provides a distinction between mechanistic and organic forms of structurein terms of tasks, control, communication, organisational knowledge, governance,values and prestige. The attributes of mechanistic structures include centraliseddecision making, strict adherence to formal rules and procedures and carefullyconstructed reporting relationships whereas organic structures facilitate decentraliseddecision making, organisational adaptiveness and flexibility and de-emphasis onformal rules and procedures (Slevin and Covin, 1997). This study examines themoderating effects of external environment and organisational structure on therelationship between business-level strategy and performance. In the remaining part ofthis section we discuss the views of various authors regarding these contingentrelationships and the findings of some relevant empirical studies. On the basis of thisdiscussion we derive two hypotheses to be tested in this study.
Previous empirical studies suggest that there is a close relationship betweenstrategy and environment and some strategies are appropriate for some environments(e.g. Homburg et al., 1999; Ward et al., 1996). The performance of an organisationlargely depends upon the strategy-environment fit (Mintzberg, 1979). The success ofbusiness-level strategy is contingent on industry environment characteristics (Pelham,1999). Scholars have argued that a cost-leadership strategy is appropriate for stableand predictable environments and a differentiation strategy is suitable for dynamicand uncertain environments (Porter, 1980; Hambrick, 1983a; Kim and Lim, 1988; Miller,1988; Marlin et al., 1994a). Firms adopting a cost-leadership strategy are likely to scanthe external environment for opportunities and the ones adopting a differentiationstrategy may scan for environmental threats ( Jennings and Lumpkin, 1992). Inenvironments which have low levels of complexity and dynamism it may not benecessary for firms to make large fixed investments for sustaining low unit costs andhence the risks can be minimised (Marlin et al., 1994b; Miller, 1986). In suchenvironments organisations need not go for high levels of innovation and productenhancement because the main competitors do not normally make huge changes intheir strategies (Kabadayi et al., 2007). In hostile environments firms need to improveefficiency to lower the costs and they may not give high emphasis on productdifferentiation (Hambrick, 1983a; Miller, 1991; Ward et al., 1996). According to Beal(2000) firms employing integrated strategies by combining cost-leadership anddifferentiation in mature industries need to scan the external environment and analyseinformation regarding their own resources and capabilities. Some of the previousempirical studies (e.g. Jauch et al., 1980; Prescott, 1986) indicated a few significantinteractions of environment variables with strategy variables and suggested that“these interactions did not add significant R-square levels of the performance models”(Pelham, 1999, p. 36). Only a few empirical studies (e.g. Prescott, 1986; Lawless andFinch, 1989; Kotha and Nair, 1995; Lee and Miller, 1996; Hambrick, 1983a) haveexamined the impact of external environment in the relationship betweenbusiness-level strategy and performance. Previous studies have been inconclusiveabout the nature of impact of the external environment in the relationship betweenbusiness-level strategy and performance and hence there is a gap in the literature. Weformulated hypothesis H1 in order to clarify this relationship.
H1. Environmental dynamism and hostility moderate the relationship betweenbusiness-level strategy and organisational performance.
MD48,6
910
A few studies have examined the impact of organisational structure on the relationshipbetween strategy and performance. Jennings and Seaman (1994) in a study conductedamong organisations belonging to the savings and loan industry compared theperformance of firms belong to the following two groups:
(1) the organisations with a high-level of adaptation to environmental changeshaving the best prospector strategy-organic structure fit; and
(2) firms with a low-level of adaptation having the best defender strategy-mechanistic structure fit.
Jennings and Seaman found that there was no significant difference in the performancebetween these groups. According to Hutt et al. (1988) organic structures are more likelyto promote autonomous strategic initiatives than mechanistic structures. Autonomousstrategic initiatives are necessary in organisations employing either a differentiationstrategy or an integrated strategy. Previous empirical studies suggest that adecentralized, informal, and specialized organizational structure is necessary forimplementing a differentiation strategy (Miller, 1986; Ward et al., 1996). Suchstructures support the implementation of a differentiation strategy by enabling theorganisation to scan the activities of its main competitors and to understand theperceptions of its customers (Miller, 1987). While implementing differentiation strategyit may be necessary for an organisation to carry out complex tasks and a specialisedstructure will be helpful during the implementation process (Ruekert et al., 1985). Anorganic structure which is decentralised, informal and complex in nature is likely tofacilitate the innovation process in an organisation (Russell and Russell, 1992). It maybe necessary for organisations employing a differentiation strategy to promoteinnovation to a large extent and hence an organic structure is likely to be moreappropriate than a mechanistic structure for such organisations. It will be difficult toimplement a differentiation strategy through innovation within a mechanisticstructure (Burns and Stalker, 1961). Organisations implementing a cost-leadershipstrategy give emphasis to highly efficient and low cost production systems in order tominimise the prices. It may be difficult for organisations implementing such a strategyto achieve the desired levels of efficiency through specialised structures (Ruekert andWalker, 1987). For such organisations a highly formal, centralized, and unspecializedstructure will be more appropriate (Hambrick, 1980; Ruekert et al., 1985; Walker andRuekert, 1987). The formal rules and procedures enforced by such structures help theorganisations to standardise activities and minimise administrative costs (Walker andRuekert, 1987). Hence such organisations may need mechanistic structures whichemphasise cost controls and standard procedures (Miller, 1986). The nature of influenceof organisational structure in the relationship between business-level strategy andperformance has not received the empirical attention it deserves. Hence this study willexamine the moderating effect of structure in the relationship between business-levelstrategy and performance by testing hypothesis H2.
H2. Organisational structure moderates the relationship between business-levelstrategy and organisational performance.
3. Research methodologyIn this section we discuss the execution of the survey and the measures taken tominimise the impact of common method variance.
Business-levelstrategy
911

3.1 Execution of the surveyWe collected the data through a postal survey using a survey instrument which wasvalidated by a panel of strategy scholars. We received responses from 124manufacturing organisations and the respondents were all at CEO level. The dataanalysis relies on multivariate statistical methods. We used Seven-point Likert-typescales to measure the constructs. Business-level strategy was measured usingcost-leadership and differentiation dimensions and the measurement scale was adaptedfrom Luo and Zhao (2004). The items in the scale highlighted various competitiveactivities and the respondents were asked to indicate the extent to which their firmsfocused on these activities in comparison with their main competitors in the last fiveyears. We assessed the external environment using the constructs dynamism andhostility and we used a measurement scale which was adapted from Miller (1987). Weasked the respondents to indicate the changes in their organisations’ externalenvironment in the last five years. The dynamism scale examined the extent of changetaken place in the areas of technology, R&D and innovation. The hostility scale looked atthe changes in market activities of the main competitors. Organisational structure wasmeasured using nine items. One end of the seven-point scale (1) was oriented towards amechanistic structure and the other end (7) towards an organic structure. The CEOs wereasked to indicate their assessment of the organisational structure during the last fiveyears. In this study organisational performance was measured using subjective andobjective measures. Subjective measures are objective fulfilment and relativecompetitive performance and objective measures are return on assets (ROA) andreturn on sales (ROS). We have adapted the measurement scales for objective fulfilmentand relative competitive performance from Ramanujam and Venkatraman (1987a, b).Objective fulfilment is defined as the extent to which the organisation has achieved itsshort-term and long-term performance objectives and minimised the problems. Weasked the respondents to indicate the extent to which their organisation has fulfilled itsobjectives in the last five years. Relative competitive performance is defined as the extentto which organisational performance has either improved or deteriorated in terms ofsales, profit, market share, return on assets, return on equity, return on sales, currentratio, overall firm performance and competitive position. We asked the respondents tocompare their performance in the last five years with their main competitors based onthese nine factors. The literature provides strong support for the technique of subjectiveperformance measurement (e.g. Dess and Robinson, 1984; Pearce et al., 1987; Priem et al.,1995; Brews and Hunt, 1999). The measurement scales that we used in this study areshown in the Appendix. We collected the financial data for five years from 2002 to 2006for 88 out of the 124 organisations which participated in the survey from a commercialdatabase and calculated the profitability ratios namely ROA and ROS. Average values ofthese three ratios for five years were calculated.
We focused on manufacturing firms in the UK for this study. The manufacturingoutput in the UK accounts for 15 per cent of the economy and hence this study gainssignificance in this context. We selected the sample of firms for the survey from aleading commercial database. We used UK SIC (2003) codes as the basis for selectingthe sample. We included companies having more than 50 employees belonging toSection – D Manufacturing, Subsections DJ, DK, DL and DM in the sample. These SICcodes represent the Electrical and Mechanical Engineering firms in the UK. Altogetherthere were 4,511 companies in the sampling frame. According to the guidelines
MD48,6
912

provided by Salant and Dillman (1994) the minimum number of responses necessary at95 per cent confidence level and ^ 10 per cent sampling error for a population size of5,000 based on the conservative assumption that the population is relatively varied(50/50 split) is 94. We generated a list of 700 organisations from a population consistingof 4,511 companies as randomly as possible. We made telephone calls to these 700organisations to verify the names of the Chief Executives and the addresses of theorganisations. Some of the organisations clearly indicated that they did not want totake part in a survey and we removed from the sample. Eight firms had gone intoadministration and hence could not take part in the survey. A total of 16 organisationswere inactive and we had to exclude them from the sample. Finally we had a sampleconsisting of 569 organisations.
We mailed questionnaires to the Chief Executives of these 569 organisations with acovering letter and business reply envelopes. Salant and Dillman (1994) suggestedsending a follow-up postcard to the members of the sample eight days after sending thequestionnaire. However, since a telephone call is more effective than a postcard, wemade telephone calls to all the companies that had not responded eight days afterreceiving the questionnaires. Following Salant and Dillman (1994), three weeks afterthe first mailing, we mailed questionnaires with covering letters and business replyenvelopes again to the non-respondents. Our data collection process resulted in 124usable responses. Eleven questionnaires were undeliverable. The overall response rateaccording to the formula suggested by De Vaus (2002) is 22.22 per cent.
3.2 Common method varianceCommon method variance (CMV) refers to the amount of spurious covariance sharedamong variables because of the common method used in collecting data (Buckley et al.,1990). In typical survey studies in which the same rater responds to the items in asingle questionnaire at the same point in time, data are likely to be susceptible to CMV(Kemery and Dunlap, 1986; Lindell and Whitney, 2001). Potential causes for spuriouscorrelation between self-report measures are consistency motif, social desirability,behaviour due to stimuli setting and knowledge deficiency (Podsakoff and Organ,1986; Miller and Roth, 1994). The constructs used in this study required therespondents to report on discrete events reducing the likelihood of distortedself-reports and/or socially desirable responses. Hence we managed to minimise theCMV problem to a great extent. For reducing the impact of consistency motif, Salancikand Pfeffer (1997) suggested that the questionnaire could be designed in such a waythat the dependent variables follow the independent variables. In this study wedesigned the questionnaire in line with this suggestion. CMV problem can bemoderated by choosing the right informant (Miller and Roth, 1994). High rankinginformants can be a more reliable source of information than their lower rankingcounterparts (Phillips, 1981). Strategic decisions are top-level decisions and only thosedirectly involved can provide valid answers (Tan and Tan, 2005). In this study theCEOs of the participating organisations were the respondents and hence the CMVproblem is moderated. Podsakoff et al. (2003) have suggested that protectingrespondent anonymity could reduce method bias. In the covering letter accompanyingthe questionnaires we clearly indicated that all replies would be treated in the strictestconfidence and no names or identities of individual firms would be revealed ordisclosed to third parties.
Business-levelstrategy
913
The one factor test proposed by Harman (1967) offers a statistical procedure fortesting the magnitude of CMV problem. According to this test all the variables ofinterest are entered into a factor analysis. If there is a major CMV problem the testresult will indicate:
(1) emergence of a single or very small number of factors from the factor analysis;and/or
(2) one general factor accounting for the majority of covariance in the predictor andcriterion variables (Podsakoff and Organ, 1986, p. 536).
We entered all the 41 variables into an exploratory factor analysis, using principalcomponents method to determine the number of factors that are necessary to accountfor the variance in the variables. The exploratory factor analysis carried out revealedthe presence of 12 distinct factors with eigenvalues greater than 1.0, rather than asingle factor. The 12 factors together accounted for 70.78 percent of the total variance;the first (largest) factor did not account for a majority of the variance (19.45 per cent).Thus, no general factor is apparent.
4. Data analysisWe present the data analysis in two sections namely Preliminary Data Analysis andModerated Regression Analysis. In the Preliminary Data Analysis section we presentthe descriptive statistics, results of the test conducted to assess non-response bias andthe test carried out to assess the reliability of the measures.
4.1 Preliminary analysisThe means and standard deviations of the variables included in this study are shownin Table I. The most fundamental assumption in multivariate analysis is normality andif the variation from the normal distribution is sufficiently large, the statistical testsbecome invalid (Hair et al., 2006). All the variables are assumed to be normallydistributed and the normality of the variables was ascertained by examining thehistograms and Normal Q-Q plots. There were no missing data in the questionnairesused for analysis.
We used the procedure adopted by Ghobadian and O’Regan (2006) to assessnon-response bias. We examined non-response bias by comparing the means of theresponses received from early and late respondents. We conducted t-tests to find outwhether significant differences existed in the means of cost-leadership, differentiation,dynamism, hostility, structure, performance-objective fulfilment and relativecompetitive performance variables between these two groups. The p values we haveobtained from the t-tests corresponding to each of these variables are shown in Table II.
The tests indicated that no significant difference existed between the means of theresponses received from early and late respondents. We contacted some of thenon-respondents and requested to answer a few questions relating to business-levelstrategy. We compared the difference between the means of the measures of the mainsample and that of 35 respondents who answered a small number of questions,statistically by doing a t-test. The differences were not statistically significant. Werequested the non-respondents who did not agree to answer the small number ofquestions to explain the reasons for non-participation. In most of the cases they said
MD48,6
914

Var
iab
leM
ean
SD
12
34
56
78
9
Cos
t-le
ader
ship
4.83
470.
9972
1D
iffe
ren
tiat
ion
4.58
600.
9752
0.11
31
Dy
nam
ism
4.37
901.
0097
0.16
30.
449
**
1H
osti
lity
4.79
841.
0968
0.05
70.
075
0.12
71
Ob
ject
ive
fulfi
lmen
t4.
9798
0.72
930.
353
**
0.30
3*
*0.
317
**
0.06
61
Rel
ativ
eco
mp
etit
ive
per
form
ance
4.96
860.
8938
0.15
10.
094
0.12
72
0.13
00.
417
**
1R
OA
5.91
9111
.070
62
0.06
90.
016
20.
099
20.
094
20.
145
0.04
71
RO
S3.
4435
7.38
500.
069
0.12
12
0.02
32
0.02
60.
045
0.06
10.
843
**
1S
ize
2.15
0.87
10.
056
0.05
10.
162
0.04
40.
139
0.06
22
0.14
32
0.02
21
Notes:
* Cor
rela
tion
issi
gn
ifica
nt
atth
e0.
05le
vel
;*
* Cor
rela
tion
issi
gn
ifica
nt
atth
e0.
01le
vel
Table I.Correlations, means and
standard deviations ofbusiness-level strategy,
environment andperformance variables
Business-levelstrategy
915

that it was because of lack of time to complete the questionnaire. In some cases thecompany policy did not allow them to respond to surveys.
The internal consistency method is the most commonly used method to assess thereliability of measures and it assesses the consistency among the variables in asummated scale. A diagnostic measure of internal consistency which is commonlyused in management research is the reliability coefficient which assesses theconsistency of the whole scale. Cronbach’s alpha (Cronbach, 1951; Nunnally, 1979;Peter, 1979) is the most widely used reliability coefficient to measure internalconsistency. In this study we used Cronbach’s alpha to assess the reliability of thescales. Even though many authors have suggested that the lower limit of Cronbach’salpha is 0.7, in empirical research 0.6 is also acceptable (Robinson et al., 1991). TheCronbach’s alpha values we have obtained for each of the scales are shown in Table III.
4.2 Moderated regression analysisWe conducted moderated regression analysis and sub-group analysis to examine themoderating effects of environment and structure on the relationship betweenbusiness-level strategy and performance. Sharma et al. (1981) developed amethodology for carrying out moderated regression analysis and this was adoptedby Prescott (1986), Goll and Sambharya (1995), Goll and Rasheed (1997) and Goll andRasheed (2004). We adopted this procedure in our study to carry out moderatedregression analysis. A specification variable is one which specifies the form ormagnitude or both of the relationship between a predictor and a criterion variable(Lazarsfeld, 1955; Rosenberg, 1968). Moderator variables can be considered to besubset of specification variables. According to Sharma et al. (1981) there are two typesof moderator variables. One type of moderator variable influences the strength ofrelationship between the predictor (independent) variables and the criterion
Variable Cronbach’s alpha
Cost-leadership 0.825Differentiation 0.776Environmental dynamism 0.696Environmental hostility 0.786Structure 0.660Performance – Objective fulfilment 0.755Relative competitive performance 0.917
Table III.Cronbach’s Alpha valuesof the measurementscales
Variable p value (two-tailed)
Cost-leadership 0.40Differentiation 1.00Environmental dynamism 0.23Environmental hostility 0.48Structure 0.26Performance – Objective fulfilment 0.85Relative competitive performance 0.81
Table II.Results of the t-testscomparing early and laterespondents
MD48,6
916

(dependent) variable and the other type modifies the form of relationship (e.g. changingthe sign of the slope). Sharma et al. (1981) developed a typology of specificationvariables using two dimensions namely the relationship with the criterion variable andinteraction with the predictor variable. If the specification variable is related to thecriterion or predictor variable or both but does not interact with the predictor variable,the variable is referred to as an intervening, exogenous, antecedent, suppressor oradditional predictor variable depending on its other characteristics. A type ofmoderator variable known as homologiser affects the strength of the relationshipwhereas the other two types of moderator variables known as quasi moderators andpure moderators influence the form of the relationship between the predictor andcriterion variables. A homologiser does not interact with the predictor variable and isnot significantly related to either the predictor or criterion variable. This type ofvariable influences the strength of relationship between the predictor and criterionvariables. The quasi-moderator interacts with the predictor variable and is related tothe criterion and/or predictor variable. The pure moderator variable interacts with thepredictor variable but it is not related to the criterion and/or predictor variable. Thesetwo types of variables modify the form of relationship between the criterion andpredictor variables. We carried out regression analysis separately on the fourdependent variables namely objective fulfilment, relative competitive performance,ROA and ROS. The details of the analysis are presented below.
4.2.1 Hypothesis H1: The moderating effect of environment. We carried out two setsof moderated regression analyses and the details of the independent and dependentvariables are shown in Tables IV and V. In the first set of four regressions weregressed the performance measures on cost-leadership and environment and in thesecond set of four regressions, we regressed the performance measures ondifferentiation and environment. We controlled for organisational size which was
Regression Dependent variableIndependent variables forRegressions 6 to 10
Interaction terms forRegressions 6 to 10
5 Objective fulfilment Differentiation Differentiation £Dynamism
6 Relative competitiveperformance
Dynamism Differentiation £ Hostility
7 ROA Hostility Dynamism £ Hostility8 ROS Size
Table V.Variables used for
regressing performanceon business-level
strategy, environment
Regression Dependent variableIndependent variables forRegressions 1 to 5
Interaction terms forRegressions 1 to 5
1 Objective fulfilment Cost-leadership Cost-leadership £Dynamism
2 Relative competitiveperformance
Dynamism Cost-leadership £ Hostility
3 ROA Hostility Dynamism £ Hostility4 ROS Size
Table IV.Variables used for
regressing performanceon business-level
strategy, environment
Business-levelstrategy
917
measured as the total number of employees in the organisation since this variable maybe related to firm performance. The means, standard deviations and correlations of allthe variables involved in testing this hypothesis are shown in Table I.
The correlations between objective fulfilment and the two types of business-levelstrategies are significant. The correlations of these two types of strategies with relativecompetitive performance are positive but not significant. There is a negativecorrelation between cost-leadership and ROA and a positive correlation between ROAand differentiation. The correlations between ROS and the two strategic types arepositive. However, none of the correlations between the objective performancemeasures and the strategic types is significant. These variations in the correlationsbetween strategic types and performance measures suggest the need to examine therole of contextual factors as potential moderators of the relationship.
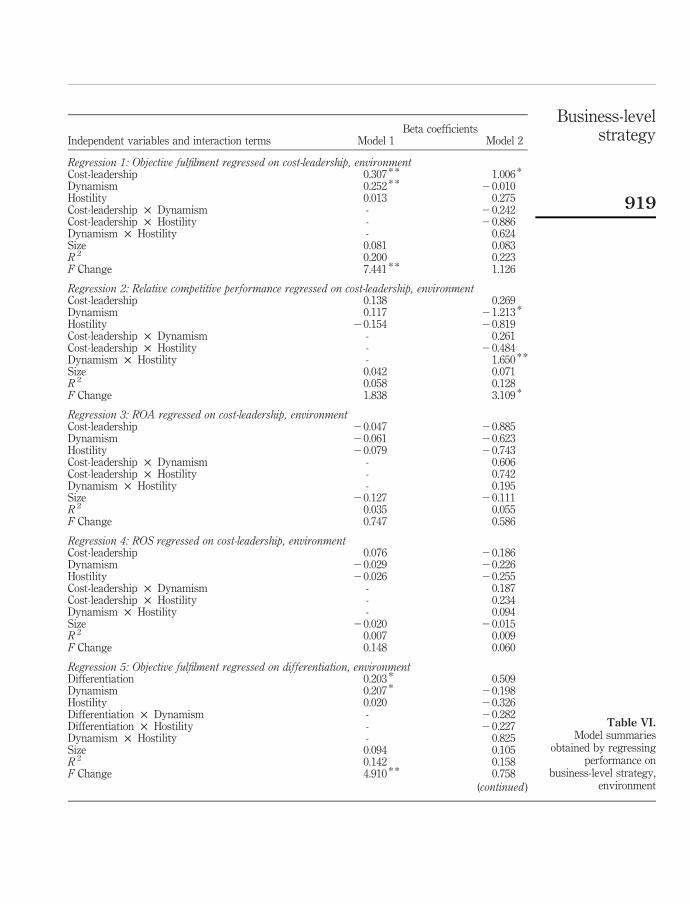
Table VI shows the models summaries obtained by regressing the performancemeasures on strategy and environment measures in the eight regressions as shown inTables IV and V.
The results of the sub-group analyses examining the relationship betweenbusiness-level strategy and the performance measures in high-low dynamism andhostility environments are summarised in Table VII. There are 51 organisations in thelow dynamism group and 73 in the high dynamism group. In the low hostility groupthere are 58 organisations and 66 in the in the high hostility group.
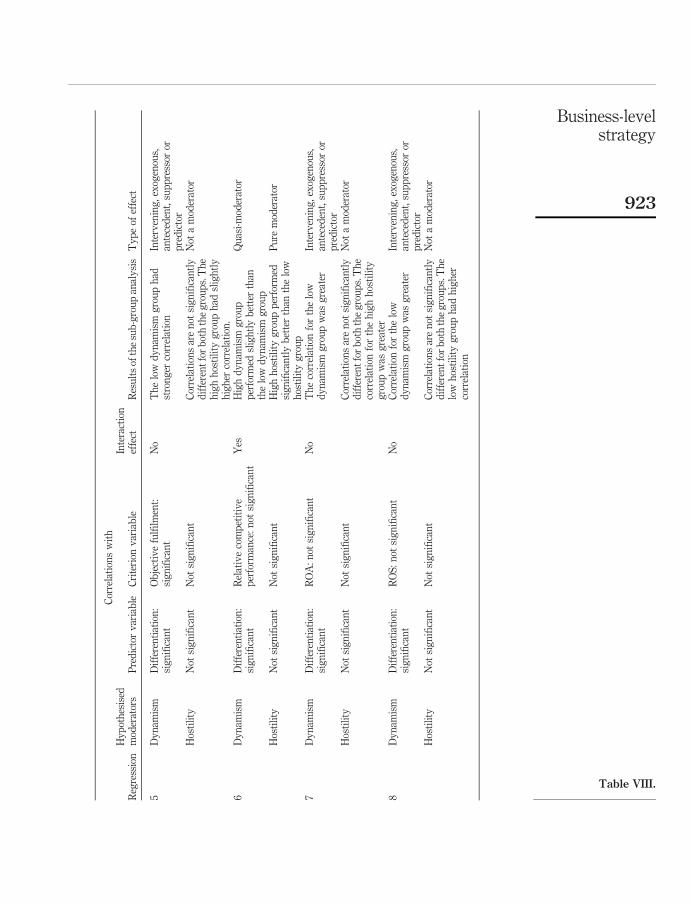
The results obtained from the moderated regression analysis are summarised inTable VIII[1].
In regression 1 objective fulfilment was regressed on cost-leadership andenvironment. Model 1 comprises of cost-leadership, dynamism, hostility and size asindependent variables and model 2 includes the interaction terms in addition to thesethree variables. We can see that the change in R 2 value is not significant and hencethere is no significant interaction between environmental variables namely dynamismand hostility and cost-leadership strategy. In the second step of the analysis weexamined the correlations between the environmental variables and both the predictorand criterion variables to determine whether they are significantly related to each otheror not. The correlation matrix shown in Table I indicates that cost-leadership is notsignificantly correlated with either environmental dynamism or hostility. Objectivefulfilment is significantly correlated with environmental dynamism but not withhostility. Hence environmental dynamism could be an intervening, exogenous,antecedent, suppressor or a predictor variable in the relationship betweencost-leadership and objective fulfilment. Further analysis (e.g. Rosenberg, 1968) isnecessary to ascertain the nature of this variable. The sub-group analysis shown inTable VII indicates that the correlations between cost-leadership and objectivefulfilment are not significantly different in high-low hostility environments. Henceenvironmental hostility does not act as a moderator in this relationship. The correlationwas much stronger for the low hostility and low dynamism groups indicating that acost-leadership strategy is more favourable in environments with low dynamism andhostility.
In regression 2, relative competitive performance was regressed on cost-leadershipand environment. The R 2 change is significant and hence environmental dynamismand hostility could be either pure or quasi-moderators in this relationship. In order toassess the nature of relationships we examined the correlations between the
MD48,6
918
Beta coefficientsIndependent variables and interaction terms Model 1 Model 2
Regression 1: Objective fulfilment regressed on cost-leadership, environmentCost-leadership 0.307 * * 1.006 *
Dynamism 0.252 * * 20.010Hostility 0.013 0.275Cost-leadership £ Dynamism - 20.242Cost-leadership £ Hostility - 20.886Dynamism £ Hostility - 0.624Size 0.081 0.083R 2 0.200 0.223F Change 7.441 * * 1.126
Regression 2: Relative competitive performance regressed on cost-leadership, environmentCost-leadership 0.138 0.269Dynamism 0.117 21.213 *
Hostility 20.154 20.819Cost-leadership £ Dynamism - 0.261Cost-leadership £ Hostility - 20.484Dynamism £ Hostility - 1.650 * *
Size 0.042 0.071R 2 0.058 0.128F Change 1.838 3.109 *
Regression 3: ROA regressed on cost-leadership, environmentCost-leadership 20.047 20.885Dynamism 20.061 20.623Hostility 20.079 20.743Cost-leadership £ Dynamism - 0.606Cost-leadership £ Hostility - 0.742Dynamism £ Hostility - 0.195Size 20.127 20.111R 2 0.035 0.055F Change 0.747 0.586
Regression 4: ROS regressed on cost-leadership, environmentCost-leadership 0.076 20.186Dynamism 20.029 20.226Hostility 20.026 20.255Cost-leadership £ Dynamism - 0.187Cost-leadership £ Hostility - 0.234Dynamism £ Hostility - 0.094Size 20.020 20.015R 2 0.007 0.009F Change 0.148 0.060
Regression 5: Objective fulfilment regressed on differentiation, environmentDifferentiation 0.203 * 0.509Dynamism 0.207 * 20.198Hostility 0.020 20.326Differentiation £ Dynamism - 20.282Differentiation £ Hostility - 20.227Dynamism £ Hostility - 0.825Size 0.094 0.105R 2 0.142 0.158F Change 4.910 * * 0.758
(continued )
Table VI.Model summaries
obtained by regressingperformance on
business-level strategy,environment
Business-levelstrategy
919
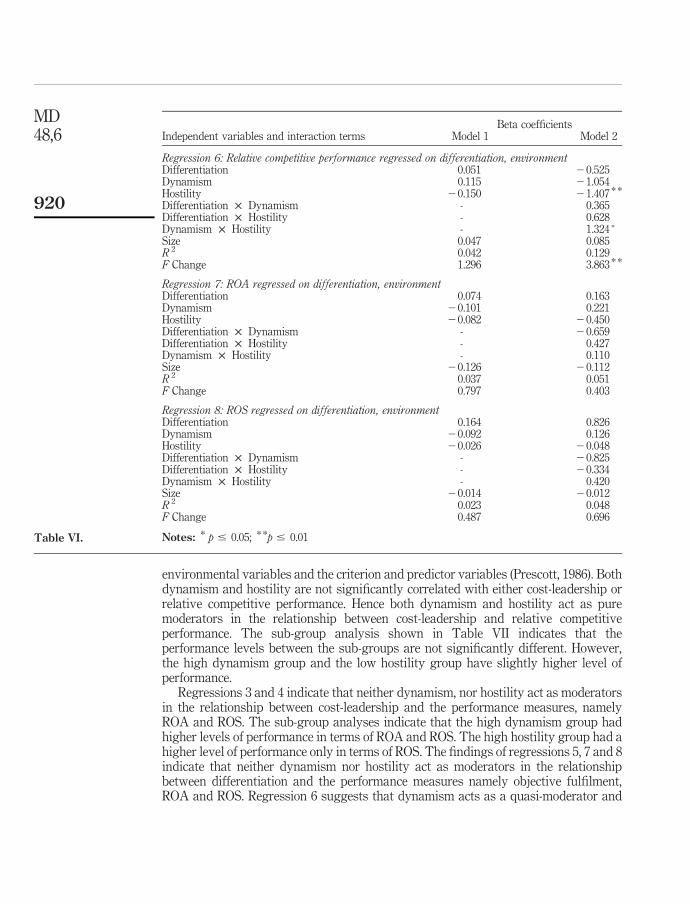
environmental variables and the criterion and predictor variables (Prescott, 1986). Bothdynamism and hostility are not significantly correlated with either cost-leadership orrelative competitive performance. Hence both dynamism and hostility act as puremoderators in the relationship between cost-leadership and relative competitiveperformance. The sub-group analysis shown in Table VII indicates that theperformance levels between the sub-groups are not significantly different. However,the high dynamism group and the low hostility group have slightly higher level ofperformance.
Regressions 3 and 4 indicate that neither dynamism, nor hostility act as moderatorsin the relationship between cost-leadership and the performance measures, namelyROA and ROS. The sub-group analyses indicate that the high dynamism group hadhigher levels of performance in terms of ROA and ROS. The high hostility group had ahigher level of performance only in terms of ROS. The findings of regressions 5, 7 and 8indicate that neither dynamism nor hostility act as moderators in the relationshipbetween differentiation and the performance measures namely objective fulfilment,ROA and ROS. Regression 6 suggests that dynamism acts as a quasi-moderator and
Beta coefficientsIndependent variables and interaction terms Model 1 Model 2
Regression 6: Relative competitive performance regressed on differentiation, environmentDifferentiation 0.051 20.525Dynamism 0.115 21.054Hostility 20.150 21.407 * *
Differentiation £ Dynamism - 0.365Differentiation £ Hostility - 0.628Dynamism £ Hostility - 1.324 *
Size 0.047 0.085R 2 0.042 0.129F Change 1.296 3.863 * *
Regression 7: ROA regressed on differentiation, environmentDifferentiation 0.074 0.163Dynamism 20.101 0.221Hostility 20.082 20.450Differentiation £ Dynamism - 20.659Differentiation £ Hostility - 0.427Dynamism £ Hostility - 0.110Size 20.126 20.112R 2 0.037 0.051F Change 0.797 0.403
Regression 8: ROS regressed on differentiation, environmentDifferentiation 0.164 0.826Dynamism 20.092 0.126Hostility 20.026 20.048Differentiation £ Dynamism - 20.825Differentiation £ Hostility - 20.334Dynamism £ Hostility - 0.420Size 20.014 20.012R 2 0.023 0.048F Change 0.487 0.696
Notes: * p # 0.05; * *p # 0.01Table VI.
MD48,6
920

hostility acts as a pure moderator in the relationship between differentiation andrelative competitive performance. The sub-group analyses suggest that the lowdynamism group had higher correlation than the high dynamism group in therelationship between differentiation and the performance measures namely objectivefulfilment, ROA and ROS. However, the high dynamism group had a higher correlationthan the low dynamism group when relative competitive performance was thedependent variable. The high hostility group had a higher correlation betweendifferentiation and the performance measures namely objective fulfilment and relativecompetitive performance. However, the low hostility group had a higher correlationthan the high hostility group when ROS was the dependent variable.
The moderated regression analysis indicates that environmental dynamism andhostility act as moderators only in the relationship between business-level strategy andrelative competitive performance. Environment does not act as a moderator in therelationship between business-level strategy and the remaining performance measuresnamely objective fulfilment, ROA and ROS. Cost-leadership strategy has a strongerrelationship with relative competitive performance when the level of dynamism ishigher. Similarly this relationship is stronger when the level of hostility is low. Therelationship between differentiation and relative competitive performance is strongerfor the high dynamism and high hostility groups. It is interesting to note that in termsof financial performance, a cost-leadership strategy is more favourable in highlydynamic environments and a differentiation strategy is more helpful in environmentswith low levels of dynamism. The sub-group analyses with the subjective performancemeasures indicate that a cost-leadership strategy is more favourable in low hostilityenvironments and a differentiation strategy is more helpful in highly hostileenvironments.
Highdynamism
Lowdynamism
Highhostility
Lowhostility
Correlations between cost-leadership andobjective fulfilment 0.276 * 0.387 * * 0.281 * 0.426 * *
Correlations between cost-leadership andrelative competitive performance 0.195 0.109 0.064 0.255Correlations between cost-leadership andROA 0.036 20.110 20.017 20.105Correlations between cost-leadership andROS 0.148 0.037 0.085 0.063Correlations between differentiation andobjective fulfilment 0.183 0.331 * 0.305 * 0.298 *
Correlations between differentiation andrelative competitive performance 0.144 0.051 0.243 * 20.021Correlations between differentiation andROA 0.051 0.136 0.070 20.005Correlations between differentiation andROS 0.053 0.341 20.023 0.255
Notes: *Correlation is significant at the 0.05 level (two-tailed); * *Correlation is significant at the 0.01level (two-tailed)
Table VII.Results of the sub-group
analysis examining therelationship between
business-level strategyand performance in
high-low dynamism andhostility environments
Business-levelstrategy
921

Cor
rela
tion
sw
ith
Reg
ress
ion
Hy
pot
hes
ised
mod
erat
ors
Pre
dic
tor
var
iab
leC
rite
rion
var
iab
leIn
tera
ctio
nef
fect
Res
ult
sof
the
sub
-gro
up
anal
ysi
sT
yp
eof
effe
ct
1D
yn
amis
mC
ost-
lead
ersh
ip:
not
sig
nifi
can
tO
bje
ctiv
efu
lfilm
ent:
sig
nifi
can
tN
oC
orre
lati
onis
stro
ng
erfo
rth
elo
wd
yn
amis
mg
rou
pIn
terv
enin
g,
exog
enou
s,an
tece
den
t,su
pp
ress
oror
pre
dic
tor
Hos
tili
tyN
otsi
gn
ifica
nt
Not
sig
nifi
can
tC
orre
lati
ons
bet
wee
nth
ep
red
icto
ran
dcr
iter
ion
var
iab
les
are
not
sig
nifi
can
tly
dif
fere
nt
for
bot
hth
eg
rou
ps.
Th
ere
isa
stro
ng
erco
rrel
atio
nfo
rth
elo
wh
osti
lity
gro
up
Not
am
oder
ator
2D
yn
amis
mC
ost-
lead
ersh
ip:
not
sig
nifi
can
tR
elat
ive
com
pet
itiv
ep
erfo
rman
ce:
not
sig
nifi
can
tY
esH
igh
dy
nam
ism
gro
up
per
form
edsl
igh
tly
bet
ter
than
the
low
dy
nam
ism
gro
up
Pu
rem
oder
ator
Hos
tili
tyN
otsi
gn
ifica
nt
Not
sig
nifi
can
tL
owh
osti
lity
gro
up
per
form
edsl
igh
tly
bet
ter
than
the
hig
hh
osti
lity
gro
up
Pu
rem
oder
ator
3D
yn
amis
mC
ost-
lead
ersh
ip:
not
sig
nifi
can
tR
OA
:n
otsi
gn
ifica
nt
No
Cor
rela
tion
sar
en
otsi
gn
ifica
ntl
yd
iffe
ren
tfo
rb
oth
the
gro
up
s.T
he
hig
hd
yn
amis
mg
rou
ph
adsl
igh
tly
hig
her
lev
elof
per
form
ance
Not
am
oder
ator
Hos
tili
tyN
otsi
gn
ifica
nt
Not
sig
nifi
can
tC
orre
lati
ons
are
not
sig
nifi
can
tly
dif
fere
nt
for
bot
hth
eg
rou
ps.
Not
am
oder
ator
4D
yn
amis
mC
ost-
lead
ersh
ip:
not
sig
nifi
can
tR
OS
:n
otsi
gn
ifica
nt
No
Cor
rela
tion
sar
en
otsi
gn
ifica
ntl
yd
iffe
ren
tfo
rb
oth
the
gro
up
s.T
he
hig
hd
yn
amis
mg
rou
ph
adsl
igh
tly
stro
ng
erco
rrel
atio
n
Not
am
oder
ator
Hos
tili
tyN
otsi
gn
ifica
nt
Not
sig
nifi
can
tC
orre
lati
ons
are
not
sig
nifi
can
tly
dif
fere
nt
for
bot
hth
eg
rou
ps.
Th
eh
igh
hos
tili
tyg
rou
ph
adst
ron
ger
corr
elat
ion
Not
am
oder
ator
(continued
)
Table VIII.Results of the moderatedregression analysis –performance regressed onbusiness-level strategy,environment
MD48,6
922
Cor
rela
tion
sw
ith
Reg
ress
ion
Hy
pot
hes
ised
mod
erat
ors
Pre
dic
tor
var
iab
leC
rite
rion
var
iab
leIn
tera
ctio
nef
fect
Res
ult
sof
the
sub
-gro
up
anal
ysi
sT
yp
eof
effe
ct
5D
yn
amis
mD
iffe
ren
tiat
ion
:si
gn
ifica
nt
Ob
ject
ive
fulfi
lmen
t:si
gn
ifica
nt
No
Th
elo
wd
yn
amis
mg
rou
ph
adst
ron
ger
corr
elat
ion
Inte
rven
ing
,ex
ogen
ous,
ante
ced
ent,
sup
pre
ssor
orp
red
icto
rH
osti
lity
Not
sig
nifi
can
tN
otsi
gn
ifica
nt
Cor
rela
tion
sar
en
otsi
gn
ifica
ntl
yd
iffe
ren
tfo
rb
oth
the
gro
up
s.T
he
hig
hh
osti
lity
gro
up
had
slig
htl
yh
igh
erco
rrel
atio
n.
Not
am
oder
ator
6D
yn
amis
mD
iffe
ren
tiat
ion
:si
gn
ifica
nt
Rel
ativ
eco
mp
etit
ive
per
form
ance
:n
otsi
gn
ifica
nt
Yes
Hig
hd
yn
amis
mg
rou
pp
erfo
rmed
slig
htl
yb
ette
rth
anth
elo
wd
yn
amis
mg
rou
p
Qu
asi-
mod
erat
or
Hos
tili
tyN
otsi
gn
ifica
nt
Not
sig
nifi
can
tH
igh
hos
tili
tyg
rou
pp
erfo
rmed
sig
nifi
can
tly
bet
ter
than
the
low
hos
tili
tyg
rou
p
Pu
rem
oder
ator
7D
yn
amis
mD
iffe
ren
tiat
ion
:si
gn
ifica
nt
RO
A:
not
sig
nifi
can
tN
oT
he
corr
elat
ion
for
the
low
dy
nam
ism
gro
up
was
gre
ater
Inte
rven
ing
,ex
ogen
ous,
ante
ced
ent,
sup
pre
ssor
orp
red
icto
rH
osti
lity
Not
sig
nifi
can
tN
otsi
gn
ifica
nt
Cor
rela
tion
sar
en
otsi
gn
ifica
ntl
yd
iffe
ren
tfo
rb
oth
the
gro
up
s.T
he
corr
elat
ion
for
the
hig
hh
osti
lity
gro
up
was
gre
ater
Not
am
oder
ator
8D
yn
amis
mD
iffe
ren
tiat
ion
:si
gn
ifica
nt
RO
S:
not
sig
nifi
can
tN
oC
orre
lati
onfo
rth
elo
wd
yn
amis
mg
rou
pw
asg
reat
erIn
terv
enin
g,
exog
enou
s,an
tece
den
t,su
pp
ress
oror
pre
dic
tor
Hos
tili
tyN
otsi
gn
ifica
nt
Not
sig
nifi
can
tC
orre
lati
ons
are
not
sig
nifi
can
tly
dif
fere
nt
for
bot
hth
eg
rou
ps.
Th
elo
wh
osti
lity
gro
up
had
hig
her
corr
elat
ion
Not
am
oder
ator
Table VIII.
Business-levelstrategy
923

4.2.2 Hypothesis H4: The role of structure. We performed eight moderated regressionanalyses to assess whether structure acts as a moderator in the relationship betweenbusiness-level strategy and performance, as shown in Tables IX and X.
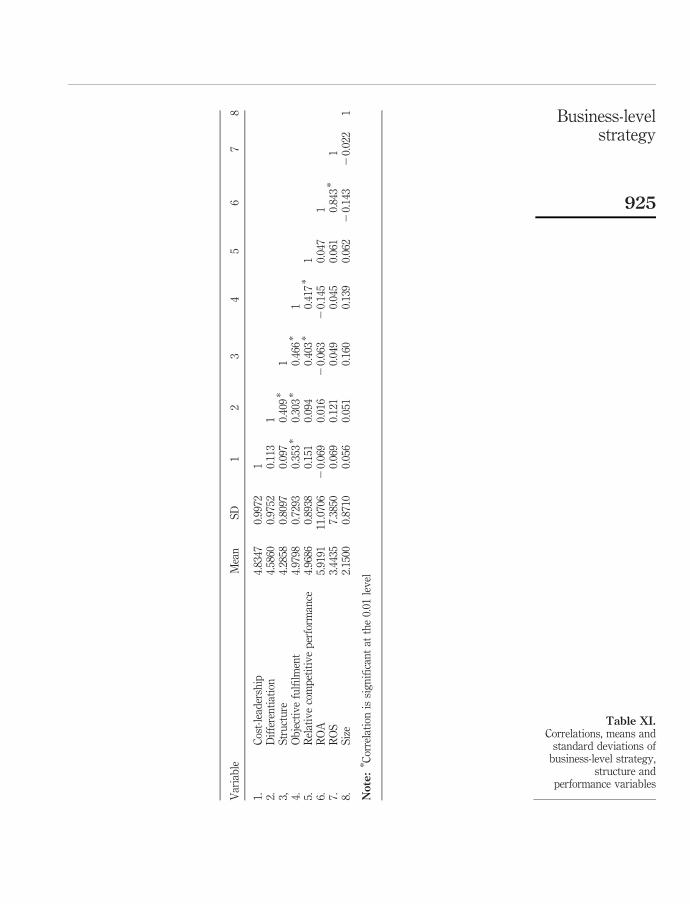
In the first set of four regressions, we regressed the performance measures oncost-leadership and structure and in the second set of four regressions, we regressedthe performance measures on differentiation and structure. We controlled fororganisational size which was measured as the total number of employees in theorganisation since this variable may be related to firm performance. The means,standard deviations and correlations of all the variables involved in testing thishypothesis are shown in Table XI.
Table XII shows the models summaries obtained by regressing the performancemeasures on strategy and structure in the eight regressions.
The results of the sub-group analyses examining the relationship betweenbusiness-level strategy and the performance measures for organisations with organicand mechanistic structures are summarised in Table XIII. The above-median grouprepresents organic structure and below-median group represents mechanisticstructure. 70 organisations belonged to the organic structure group and 54 to themechanistic structure group.
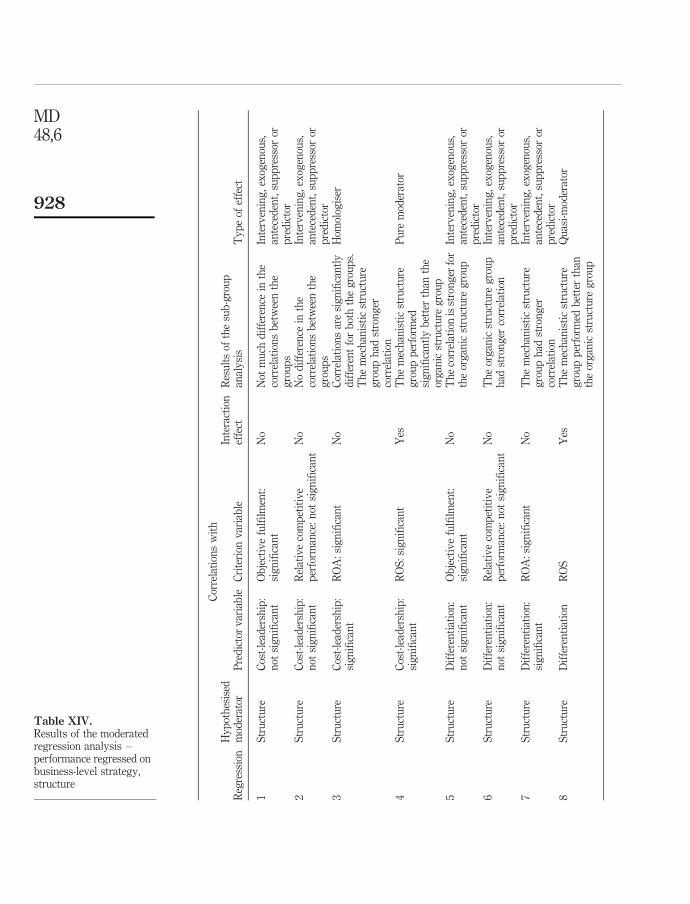
The results of the eight moderated regression analyses are summarised inTable XIV.
In regression 1, objective fulfilment was regressed on cost-leadership and structure.The change in R 2 value between model 1 and model 2 is not significant and hence thereis no interaction between structure and cost-leadership. Structure is significantlycorrelated with objective fulfilment and hence it could be an intervening, exogenous,antecedent, suppressor or a predictor variable. The sub-group analysis shown inTable XIII indicates that the performances of mechanistic and organic structure groupsare more or less at the same level.
The results of regression 2 indicate that structure does not moderate the relationshipbetween cost-leadership and relative competitive performance. Regression 3 suggests
Regression Dependent variableIndependent variables forRegressions 5 to 8
Interaction terms forRegressions 5 to 8
5 Objective fulfilment Differentiation Differentiation £ Structure6 Relative competitive
performanceStructure
7 ROA Size8 ROS
Table X.Variables used forregressing performanceon business-levelstrategy, structure
Regression Dependent variableIndependent variables forRegressions 1 to 4
Interaction terms forRegressions 1 to 4
1 Objective fulfilment Cost-leadership Cost-leadership £ Structure2 Relative competitive
performanceStructure
3 ROA Size4 ROS
Table IX.Variables used forregressing performanceon business-levelstrategy, structure
MD48,6
924
Var
iab
leM
ean
SD
12
34
56
78
1.C
ost-
lead
ersh
ip4.
8347
0.99
721
2.D
iffe
ren
tiat
ion
4.58
600.
9752
0.11
31
3,S
tru
ctu
re4.
2858
0.80
970.
097
0.40
9*
14.
Ob
ject
ive
fulfi
lmen
t4.
9798
0.72
930.
353
*0.
303
*0.
466
*1
5.R
elat
ive
com
pet
itiv
ep
erfo
rman
ce4.
9686
0.89
380.
151
0.09
40.
403
*0.
417
*1
6.R
OA
5.91
9111
.070
62
0.06
90.
016
20.
063
20.
145
0.04
71
7.R
OS
3.44
357.
3850
0.06
90.
121
0.04
90.
045
0.06
10.
843
*1
8.S
ize
2.15
000.
8710
0.05
60.
051
0.16
00.
139
0.06
22
0.14
32
0.02
21
Note:
* Cor
rela
tion
issi
gn
ifica
nt
atth
e0.
01le
vel
Table XI.Correlations, means and
standard deviations ofbusiness-level strategy,
structure andperformance variables
Business-levelstrategy
925

Beta coefficientsIndependent variables and interaction terms Model 1 Model 2
Regression 1: Objective fulfilment regressed on cost-leadership, structureCost-leadership 0.308 * * 0.969 *
Structure 0.428 * * 1.019 * *
Cost-leadership £ Structure - 20.937Size 0.053 0.056R 2 0.316 0.332F Change 18.455 * 2.907
Regression 2: Relative competitive performance regressed on cost-leadership, structureCost-leadership 0.113 20.093Structure 0.393 * * 0.208Cost-leadership £ Structure - 0.293Size 20.007 20.008R 2 0.175 0.176F Change 8.470 * * 0.230
Regression 3: ROA regressed on cost-leadership, structureCost-leadership 20.052 0.948Structure 20.031 0.839Cost-leadership £ Structure - 21.412Size 20.131 20.139R 2 0.024 0.061F Change 0.698 3.232
Regression 4: ROS regressed on cost-leadership, structureCost-leadership 0.067 1.893 * *
Structure 0.048 1.635 * *
Cost-leadership £ Structure - 22.575 * *
Size 20.038 20.052R 2 0.008 0.129F Change 0.220 11.600 * *
Regression 5: Objective fulfilment regressed on differentiation, structureDifferentiation 0.136 0.552Structure 0.400 * * 0.747 *
Differentiation £ Structure 20.648Size 0.068 0.065R 2 0.237 0.246F Change 12.421 * 1.373
Regression 6: Relative competitive performance regressed on differentiation, structureDifferentiation 20.085 20.525Structure 0.438 * 0.071Differentiation £ Structure - 0.685Size 20.004 0.000R 2 0.168 0.178F Change 8.084 * * 1.406
(continued )
Table XII.Model summariesobtained by regressingperformance onbusiness-level strategy,structure
MD48,6
926

that structure acts as a homologiser in the relationship between cost-leadership andROA. The results of the sub-group analysis indicate that a mechanistic structure ismore suitable for organisations adopting cost-leadership strategy. The findings ofregression 4 suggest that structure is a pure moderator in the relationship betweencost-leadership and ROS. The sub-group analysis indicates that a mechanisticstructure is more helpful in improving performance for organisations following acost-leadership strategy. The results of regressions 5, 6 and 7 indicate that structuredoes not act as a moderator in the relationship between differentiation and theperformance measures namely objective fulfilment, relative competitive performance
Beta coefficientsIndependent variables and interaction terms Model 1 Model 2
Regression 7: ROA regressed on differentiation,structureDifferentiation 0.053 0.376Structure 20.059 0.215Differentiation £ Structure - 20.510Size 20.135 20.143R 2 0.024 0.030F Change 0.686 0.561
Regression 8: ROS regressed on differentiation, structureDifferentiation 0.122 1.124 *
Structure 0.003 0.853 *
Differentiation £ Structure - 21.583 *
Size 20.033 20.055R 2 0.016 0.079F Change 0.443 5.690 *
Notes: *p # 0.05; * *p # 0.01 Table XII.
Mechanistic structure Organic structure
Correlations between cost-leadership and objectivefulfilment 0.358 * * 0.369 * *
Correlations between cost-leadership and relativecompetitive performance 0.149 0.149Correlations between cost-leadership and ROA 0.137 20.297 *
Correlations between cost-leadership and ROS 0.371 * 20.232Correlations between differentiation and objectivefulfilment 0.166 0.314 * *
Correlations between differentiation and relativecompetitive performance 20.003 0.037Correlations between differentiation and ROA 0.049 0.007Correlations between differentiation and ROS 0.238 20.055
Notes: *Correlation is significant at the 0.05 level (two-tailed); * *Correlation is significant at the 0.01level (two-tailed)
Table XIII.Results of the sub-group
analysis examining therelationship between
business-level strategyand performance inorganisations with
organic and mechanisticstructures
Business-levelstrategy
927
Cor
rela
tion
sw
ith
Reg
ress
ion
Hy
pot
hes
ised
mod
erat
orP
red
icto
rv
aria
ble
Cri
teri
onv
aria
ble
Inte
ract
ion
effe
ctR
esu
lts
ofth
esu
b-g
rou
pan
aly
sis
Ty
pe
ofef
fect
1S
tru
ctu
reC
ost-
lead
ersh
ip:
not
sig
nifi
can
tO
bje
ctiv
efu
lfilm
ent:
sig
nifi
can
tN
oN
otm
uch
dif
fere
nce
inth
eco
rrel
atio
ns
bet
wee
nth
eg
rou
ps
Inte
rven
ing
,ex
ogen
ous,
ante
ced
ent,
sup
pre
ssor
orp
red
icto
r2
Str
uct
ure
Cos
t-le
ader
ship
:n
otsi
gn
ifica
nt
Rel
ativ
eco
mp
etit
ive
per
form
ance
:n
otsi
gn
ifica
nt
No
No
dif
fere
nce
inth
eco
rrel
atio
ns
bet
wee
nth
eg
rou
ps
Inte
rven
ing
,ex
ogen
ous,
ante
ced
ent,
sup
pre
ssor
orp
red
icto
r3
Str
uct
ure
Cos
t-le
ader
ship
:si
gn
ifica
nt
RO
A:
sig
nifi
can
tN
oC
orre
lati
ons
are
sig
nifi
can
tly
dif
fere
nt
for
bot
hth
eg
rou
ps.
Th
em
ech
anis
tic
stru
ctu
reg
rou
ph
adst
ron
ger
corr
elat
ion
Hom
olog
iser
4S
tru
ctu
reC
ost-
lead
ersh
ip:
sig
nifi
can
tR
OS
:si
gn
ifica
nt
Yes
Th
em
ech
anis
tic
stru
ctu
reg
rou
pp
erfo
rmed
sig
nifi
can
tly
bet
ter
than
the
org
anic
stru
ctu
reg
rou
p
Pu
rem
oder
ator
5S
tru
ctu
reD
iffe
ren
tiat
ion
:n
otsi
gn
ifica
nt
Ob
ject
ive
fulfi
lmen
t:si
gn
ifica
nt
No
Th
eco
rrel
atio
nis
stro
ng
erfo
rth
eor
gan
icst
ruct
ure
gro
up
Inte
rven
ing
,ex
ogen
ous,
ante
ced
ent,
sup
pre
ssor
orp
red
icto
r6
Str
uct
ure
Dif
fere
nti
atio
n:
not
sig
nifi
can
tR
elat
ive
com
pet
itiv
ep
erfo
rman
ce:
not
sig
nifi
can
tN
oT
he
org
anic
stru
ctu
reg
rou
ph
adst
ron
ger
corr
elat
ion
Inte
rven
ing
,ex
ogen
ous,
ante
ced
ent,
sup
pre
ssor
orp
red
icto
r7
Str
uct
ure
Dif
fere
nti
atio
n:
sig
nifi
can
tR
OA
:si
gn
ifica
nt
No
Th
em
ech
anis
tic
stru
ctu
reg
rou
ph
adst
ron
ger
corr
elat
ion
Inte
rven
ing
,ex
ogen
ous,
ante
ced
ent,
sup
pre
ssor
orp
red
icto
r8
Str
uct
ure
Dif
fere
nti
atio
nR
OS
Yes
Th
em
ech
anis
tic
stru
ctu
reg
rou
pp
erfo
rmed
bet
ter
than
the
org
anic
stru
ctu
reg
rou
p
Qu
asi-
mod
erat
or
Table XIV.Results of the moderatedregression analysis –performance regressed onbusiness-level strategy,structure
MD48,6
928
and ROA. The findings of the sub-group analyses show that an organic structure ismore helpful for organisations employing a differentiation strategy to improve theirperformance in terms of objective fulfilment and relative competitive performance.However, the mechanistic structure group had a better correlation betweendifferentiation and ROA. The findings of regression 8 indicate that structure acts asa quasi-moderator in the relationship between differentiation and ROS and thesub-group analysis shows that the mechanistic structure group performed better thanthe organic structure group in terms of ROS.
The results of the moderated regression analysis indicate that structure acts as amoderator in the relationship between cost-leadership strategy and the objectivemeasures of performance. It acts as a moderator in the relationship betweendifferentiation strategy and ROS. Structure does not act as a moderator in therelationship between business-level strategy and the subjective measures ofperformance. The sub-group analyses indicate that a mechanistic structure is morehelpful for improving financial performance for organisations adopting either adifferentiation strategy or a cost-leadership strategy. However, in terms of thesubjective performance measures an organic structure seems to be more favourable.
5. ClosureThe findings of this study indicate that environmental dynamism and hostility act asmoderators in the relationship between business-level strategy and relative competitiveperformance. This result supports the findings of some previous studies which havefound the moderating effect of environment on the relationship between business-levelstrategy and performance (e.g. Prescott, 1986; Lee and Miller, 1996). For improving afirm’s performance in comparison to its competitors both cost-leadership anddifferentiation strategies are effective in environments with high level of dynamism. Inlow-hostility environments a cost-leadership strategy and in high-hostility environmentsa differentiation strategy lead to better performance in comparison to competitors.A cost-leadership strategy is more favourable for improving financial performance inhighly dynamic environments. However, in environments with low levels of dynamism adifferentiation strategy is more helpful in improving financial performance.
The relationship of both cost-leadership and differentiation with ROS is moderatedby organisational structure. However, in the case of ROA, the moderating effect ofstructure was observable only in the case of cost-leadership strategy. The sub-groupanalysis resulted in some interesting findings regarding the impact of organisationalstructure on the relationship between business-level strategy and the performance oforganisations. The results indicated that a mechanistic structure was more helpful inimproving the financial performance of organisations adopting both cost-leadership anddifferentiation strategies. This could be because of the effectiveness of a mechanisticstructure in controlling the cost and improving coordination within the organisation.
5.1 Limitations of the studyOne of the main limitations of this study is the problem of single respondents(e.g. Bowman and Ambrosini, 1997). However, a number of authors contend that theCEO is likely to provide accurate information about organisational strategies(e.g. Hambrick, 1981). Since all the respondents in this study are CEOs the information
Business-levelstrategy
929
they have provided about the strategies of their organisations can be considered to beaccurate. This approach is extensively used in strategic management research.
5.2 Directions for future researchThis study has examined only the electrical and mechanical engineering sectors of themanufacturing industry. In order to generalise the findings to the whole manufacturingindustry, it needs to be ascertained whether the relationships hold good for otherindustry sectors as well. The study may not be complete unless it is complemented byin-depth case studies examining the business-level strategies of organisations.Perceived measures have been used to measure environment in this study. Themoderating effect of environment needs to be assessed using objective measures infuture research to confirm the findings. The role of structure needs to be examined ingreater detail by using a different sample and a different measure.
The correlations between the strategic types and the performance measures indicatethat cost-leadership and differentiation strategies help organisations to fulfil theirobjectives. However, they are not very helpful in improving the financial performanceand the performance in comparison to competitors. This finding points towards thelimitations of Porter’s generic strategies in explaining performance heterogeneity. Thisstudy makes an important contribution to the literature by examining the impact ofboth environment and organisational structure on the relationship betweenbusiness-level strategy and organisational performance. To the best of ourknowledge no other study has examined the moderating effect of organisationalstructure in a detailed manner. This study has examined the moderating effect ofstructure thoroughly using moderated regression analysis.
Note
1. In order to assess whether environment moderates the relationship between integratedstrategies and performance, moderated regression analysis was carried out by includingboth cost-leadership and differentiation as predictors along with environmental dynamismand hostility. It was found that there were no interaction effects. Hence environmentaldynamism and hostility do not act as either quasi-moderators or pure moderators in therelationship between integrated strategies and the performance measures.
References
Andrews, R., Boyne, G.A. and Walker, R.M. (2006), “Strategy content and organisationalperformance: an empirical analysis”, Public Administration Review, January/February.
Beal, R.M. (2000), “Competing effectively: environmental scanning, competitive strategy,and organizational performance in small manufacturing firms”, Journal of Small BusinessManagement, Vol. 38 No. 1, pp. 27-47.
Bowman, C. and Ambrosini, V. (1997), “Using single respondents in strategy research”, BritishJournal of Management, Vol. 8 No. 2, pp. 119-31.
Boyd, B. and Fulk, J. (1996), “Executive scanning and perceived uncertainty: a multidimensionalmodel”, Journal of Management, Vol. 22 No. 1, pp. 1-21.
Brews, P.J. and Hunt, M.R. (1999), “Learning to plan and planning to learn: resolving theplanning school/learning school debate”, Strategic Management Journal, Vol. 20 No. 10,pp. 889-913.
MD48,6
930

Buckley, M.R., Cote, J.A. and Comstock, S.M. (1990), “Measurement errors in behavioral sciences,the case of personality/attitude research”, Educational Psychology Measurement, Vol. 50No. 3, pp. 447-74.
Burns, T. and Stalker, G.M. (1961), The Management of Innovation, Tavistock, London.
Camillus, J.C. and Venkatraman, N. (1984), “Dimensions of strategic choice”, Strategy& Leadership, Vol. 12 No. 1, pp. 26-31.
Chandler, A.D. (1962), Strategy and Structure, MIT Press, Cambridge, MA.
Cronbach, L.J. (1951), “Coefficient alpha and the internal structure of tests”, Psychometrika,Vol. 16, pp. 297-334.
De Vaus, D.A. (2002), Surveys in Social Research, 5th ed., Routledge, London.
Dess, G.G. and Keats, B.W. (1987), “Environmental boundary-spanning andinformation-processing effects on organisational performance”, Academy ofManagement Proceedings, pp. 21-5.
Dess, G.G. and Robinson, R.B. Jr (1984), “Measuring organizational performance in the absence ofobjective measures: the case of the privately-held firm and conglomerate business unit”,Strategic Management Journal, Vol. 5 No. 3, pp. 265-73.
Ghobadian, A. and O’Regan, N. (2006), “Innovation in NTBFs: does leadership really matter?”,The International Entrepreneurship and Management Journal, Vol. 2 No. 2.
Goll, I. and Rasheed, A.M.A. (1997), “Rational decision making and firm performance:the moderating role of environment”, Strategic Management Journal, Vol. 18 No. 7,pp. 583-91.
Goll, I. and Rasheed, A.M.A. (2004), “The moderating effect of environmental munificence anddynamism on the relationship between discretionary social responsibility and firmperformance”, Journal of Business Ethics, Vol. 49 No. 1, pp. 41-54.
Goll, I. and Sambharya, R.B. (1995), “Corporate ideology, diversification and firm performance”,Organisation Studies, Vol. 16 No. 5, pp. 823-46.
Hair, J.F. Jr, Black, W.C., Babin, B.J., Anderson, R.E. and Tatham, R.L. (2006), Multivariate DataAnalysis, 6th ed., Pearson Prentice-Hall, Englewood Cliffs, NJ.
Hambrick, D.C. (1980), “Operationalising the concept of business-level strategy in research”,Academy of Management Review, Vol. 5 No. 4, pp. 567-75.
Hambrick, D.C. (1981), “Strategic awareness within top management teams”, StrategicManagement Journal, Vol. 2 No. 3, pp. 263-79.
Hambrick, D.C. (1983a), “High profit strategies in mature capital goods industries: a contingencyapproach”, Academy of Management Journal, Vol. 26, pp. 687-707.
Hambrick, D.C. (1983b), “Some tests of the effectiveness and functional attributes of Miles andSnow’s Strategic Types”, Academy of Management Journal, Vol. 26 No. 1, pp. 5-26.
Harman, H.H. (1967), Modern Factor Analysis, 2nd ed., University of Chicago Press, Chicago, IL.
Hatten, K.J., Schendel, D.E. and Cooper, A.C. (1978), “A strategic model of the US brewingindustry: 1952-1971”, Academy of Management Journal, Vol. 21 No. 4, pp. 592-610.
Homburg, C., Krohmer, H. and Workman, J.P. Jr (1999), “Strategic consensus and performance:the role of strategy type and market-related dynamism”, Strategic Management Journal,Vol. 20 No. 4, pp. 339-57.
Hutt, M.D., Reingen, P.H. and Ronchetto, J.R. Jr (1988), “Tracing emergent processes in marketingstrategy formation”, Journal of Marketing, Vol. 52 No. 1, pp. 4-19.
Jauch, L.R., Osborn, R.W. and Glueck, W.F. (1980), “Short-term financial success in largebusiness organisations: the environment-strategy connection”, Strategic ManagementJournal, Vol. 1, pp. 49-63.
Business-levelstrategy
931
Jennings, D.F. and Lumpkin, J.R. (1992), “Insights between environmental scanning activities andPorter’s generic strategies: an empirical analysis”, Journal of Management, Vol. 18 No. 4,pp. 791-803.
Jennings, D.F. and Seaman, S.L. (1994), “High and low levels of organisational adaptation:an empirical analysis of strategy, structure, and performance”, Strategic ManagementJournal, Vol. 15, pp. 459-75.
Jennings, D.F., Rajaratnam, D. and Lawrence, F.B. (2003), “Strategy-performance relationships inservice firms: a test for equifinality”, Journal of Managerial Issues, Vol. 15 No. 2, pp. 208-20.
Kabadayi, S., Eyuboglu, N. and Thomas, G.P. (2007), “The performance implications of designingmultiple channels to fit with strategy and environment”, Journal of Marketing, Vol. 71No. 4.
Kemery, E.R. and Dunlap, W.P. (1986), “Partialling factor scores does not control methodvariance: a reply to Podsakoff and Todor”, Journal of Management, Vol. 12 No. 4,pp. 525-44.
Khandwalla, P.N. (1972), “Environment and its impact on the organisation”, International Studiesof Management and Organisation, Vol. 2 No. 3, pp. 297-313.
Khandwalla, P.N. (1973), “Viable and effective organizational designs of firms”, Academy ofManagement Journal, Vol. 16 No. 3, pp. 481-95.
Kim, L. and Lim, Y. (1988), “Environment generic strategies, and performance in a rapidlydeveloping country: a taxonomic approach”, Academy of Management Journal, Vol. 31No. 4, pp. 802-27.
Kling, J.A. and Smith, K.A. (1995), “Identifying strategic groups in the US airline industry:an application of the Porter model”, Transportation Journal, Vol. 35 No. 2, pp. 26-34.
Kotha, S. and Nair, A. (1995), “Strategy and environment as determinants of performance:evidence from the Japanese machine tool industry”, Strategic Management Journal, Vol. 16,pp. 497-518.
Lawless, M.W. and Finch, L.K. (1989), “Choice and determinism: a test of Hrebiniak and Joyce’sframework on strategy-environment fit”, Strategic Management Journal, Vol. 10,pp. 351-65.
Lawrence, P. and Lorsch, J. (1967), “Differentiation and integration in complex organizations”,Administrative Science Quarterly, Vol. 12, pp. 1-30.
Lazarsfeld, P.F. (1955), “Interpretation of statistical relations as a research operation”,in Lazarsfeld, P.F. and Rosenberg, M. (Eds), The Language of Social Research, The FreePress, Glencoe, IL.
Lee, J. and Miller, D. (1996), “Strategy, environment and performance in two technologicalcontexts: contingency theory in Korea”, Organisation Studies, Vol. 17 No. 5, pp. 729-50.
Lenz, R.T. (1980), “Environment, strategy, organization structure and performance: patterns inone industry”, Strategic Management Journal, Vol. 1 No. 3, pp. 209-26.
Lindell, M.K. and Whitney, D.J. (2001), “Accounting for common method variance incross-sectional research designs”, Journal of Applied Psychology, Vol. 86 No. 1, pp. 114-21.
Luo, Y. and Zhao, H. (2004), “Corporate link and competitive strategy in multinationalenterprises: a perspective from subsidiaries seeking host market penetration”, Journal ofInternational Management, Vol. 10 No. 1, pp. 77-106.
Marlin, D., Hoffman, J.J. and Lamont, B.T. (1994a), “Porter’s generic strategies, dynamicenvironments and performance: a profile deviation fit perspective”, International Journalof Analysis, Vol. 2 No. 2, pp. 155-75.
Marlin, D., Lamont, B.T. and Hoffman, J.J. (1994b), “Choice situation, strategy, and performance:a re-examination”, Strategic Management Journal, Vol. 15, pp. 229-39.
MD48,6
932

Matthews, C.H. and Scott, S.G. (1995), “Uncertainty and planning in small and entrepreneurialfirms: an empirical assessment”, Journal of Small Business Management, Vol. 33 No. 4,pp. 34-52.
Miles, R.E. and Snow, C.C. (1978), Organisational Strategy, Structure and Process, McGraw-Hill,New York, NY.
Miller, D. (1986), “Configurations of strategy and structure: towards a synthesis”, StrategicManagement Journal, Vol. 7 No. 3, pp. 233-49.
Miller, D. (1987), “The structural and environmental correlates of business strategy”, StrategicManagement Journal, Vol. 8 No. 1, pp. 55-76.
Miller, D. (1988), “Relating Porter’s business strategies to environment and structure: analysisand performance implications”, Academy of Management, Vol. 31, pp. 280-308.
Miller, D. (1991), “Stale in the saddle: CEO tenure and the match between organization andenvironment”, Management Science, Vol. 37 No. 1, pp. 34-52.
Miller, D. and Friesen, P. (1978), “Archetypes of strategy formulation”, Management Science,Vol. 24, pp. 921-33.
Miller, D. and Friesen, P.H. (1984), Organisations: A Quantum View, Prentice-Hall, EnglewoodCliffs, NJ.
Miller, J.G. and Roth, A.V. (1994), “A taxonomy of manufacturing strategies”, ManagementScience, Vol. 40 No. 3, pp. 285-304.
Mintzberg, H. (1979), “Patterns in strategy formation”, International Studies of Management& Organization, Vol. 9 No. 3, pp. 67-86.
Nunnally, J.C. (1979), Psychometric Theory, McGraw-Hill, New York, NY.
Oosthuizen, H. (1997), “An evaluation of the relevance of the Miles and Snow Strategic Typologyunder present-day conditions of major environmental uncertainty – the Emperor’s newclothes or a paradigm shift?”, South African Journal of Business Management, Vol. 28No. 2, pp. 63-72.
Parker, B. and Helms, M.M. (1992), “Generic strategies and firm performance in a decliningindustry”, Management International Review, Vol. 32 No. 1, pp. 23-9.
Pearce, J. II, Robbins, D.K. and Robinson, R. Jr (1987), “The impact of grand strategy andplanning formality on financial performance”, Strategic Management Journal, Vol. 8,pp. 125-34.
Pelham, A.M. (1999), “Influence of environment, strategy, and market orientation on performancein small manufacturing firms”, Journal of Business Research, Vol. 45, pp. 33-46.
Peter, J.P. (1979), “Reliability: a review of psychometric basics and recent marketing practices”,Journal of Marketing Research, Vol. 16 No. 2, pp. 6-17.
Phillips, L.W. (1981), “Assessing measurement error in key informant reports: a methodologicalnote on organizational analysis in marketing”, Journal ofMarketing Research, Vol. 18 No. 4,pp. 395-415.
Podsakoff, P.M. and Organ, D.W. (1986), “Self-reports in organisational research: problems andprospects”, Journal of Management, Vol. 12 No. 4, pp. 531-44.
Podsakoff, P.M., MacKenzie, S.B., Lee, J. and Podsakoff, N.P. (2003), “Common method biases inbehavioral research: a critical review of the literature and recommended remedies”, Journalof Applied Psychology, Vol. 88 No. 5, pp. 879-903.
Porter, M. (1979), “The structure within industries and companies’ performance”, Review ofEconomics and Statistics, Vol. 61, pp. 214-27.
Porter, M.E. (1980), Competitive Strategy – Techniques for Analysing Industries and Competitors,The Free Press, New York, NY.
Business-levelstrategy
933
Prescott, J.E. (1986), “Environments as moderators of the relationship between strategy andperformance”, Academy of Management Journal, Vol. 29, pp. 329-49.
Priem, R.L., Rasheed, A.M.A. and Kotulic, A.G. (1995), “Rationality in strategic decisionprocesses, environmental dynamism and firm performance”, Journal of Management,Vol. 21 No. 5, pp. 913-29.
Ramanujam, V. and Venkatraman, N. (1987a), “Planning system characteristics and planningeffectiveness”, Strategic Management Journal, Vol. 8 No. 5, pp. 453-68.
Ramanujam, V. and Venkatraman, N. (1987b), “Planning and performance: a new look at an oldquestion”, Business Horizons, Vol. 30 No. 3, pp. 19-25.
Robinson, J.P., Shaver, P.R. and Wrightsman, L.S. (1991), “Criteria for scale selection andevaluation”, in Robinson, J.P., Shanver, P.R. and Wrightsman, L.S. (Eds), Measures ofPersonality and Social Psychological Attitudes, Academic Press, San Diego, CA.
Rosenberg, M. (1968), The Logic of Survey Analysis, Basic Books Inc., New York, NY.
Rue, L.W. and Holland, P.G. (1989), Strategic Management: Concepts and Experiences,McGraw-Hill, New York, NY.
Ruekert, R.W. and Walker, O.C. Jr (1987), “Interactions between marketing and R&Ddepartments in implementing different business strategies”, Strategic ManagementJournal, Vol. 8 No. 3, pp. 233-48.
Ruekert, R.W., Walker, O.C. Jr and Roering, K.J. (1985), “The organization of marketing activities:a contingency theory of structure and performance”, Journal of Marketing, Vol. 49 No. 1,pp. 13-25.
Rumelt, R.P. (1974), Strategy, Structure, and Economic Performance, Harvard Business SchoolPress, Boston, MA.
Russell, R.D. and Russell, C.J. (1992), “An examination of the effects of organisational norms,organisational structure, and environmental uncertainty on entrepreneurial strategy”,Journal of Management, Vol. 18 No. 4, pp. 639-56.
Salancik, G.R. and Pfeffer, J. (1997), “Who gets power – and how they hold on to it: a strategiccontingency model of power”, Organisational Dynamics, Vol. 5, pp. 3-21.
Salant, P. and Dillman, D. (1994), How to Conduct Your Own Survey, John Wiley, New York, NY.
Sharma, S., Durand, R.M. and Gur-Arie, O. (1981), “Identification and analysis of moderatorvariables”, Journal of Marketing Research, Vol. 18 No. 8, pp. 291-300.
Slevin, D.P. and Covin, J.G. (1997), “Strategy formation patterns, performance, and thesignificance of context”, Journal of Management, Vol. 23 No. 2, pp. 189-209.
Tan, J. and Tan, D. (2005), “Environment-strategy co-evolution and co-alignment: a staged modelof Chinese SOEs under transition”, Strategic Management Journal, Vol. 26 No. 2, pp. 141-57.
Thompson, A.A. Jr and Strickland, A.J. (1996), Strategic Management, 9th ed., Irwin, Chicago, IL.
Thompson, J.D. (1967), Organizations in Action, McGraw-Hill, New York, NY.
Van de Ven, A.H. and Drazin, R. (1985), “The concept of fit in contingency theory”, in Staw, B.M.and Cummings, L.L. (Eds), Research in Organisational Behavior, JAI Press, Stamford, CT,pp. 333-75.
Venkatraman, N. (1989), “Strategic orientation of business enterprises: the construct,dimensionality, and measurement”, Management Science, Vol. 35 No. 8, pp. 942-62.
Walker, O.C. Jr and Ruekert, R.W. (1987), “Marketing’s role in the implementation of businessstrategies: a critical review and conceptual framework”, Journal of Marketing, Vol. 51 No. 3,pp. 15-33.
Ward, P.T., Bickford, D.J. and Leong, G.K. (1996), “Configurations of manufacturing strategy,business strategy, environment, and structure”, Journal of Management, Vol. 22 No. 4,pp. 597-626.
MD48,6
934
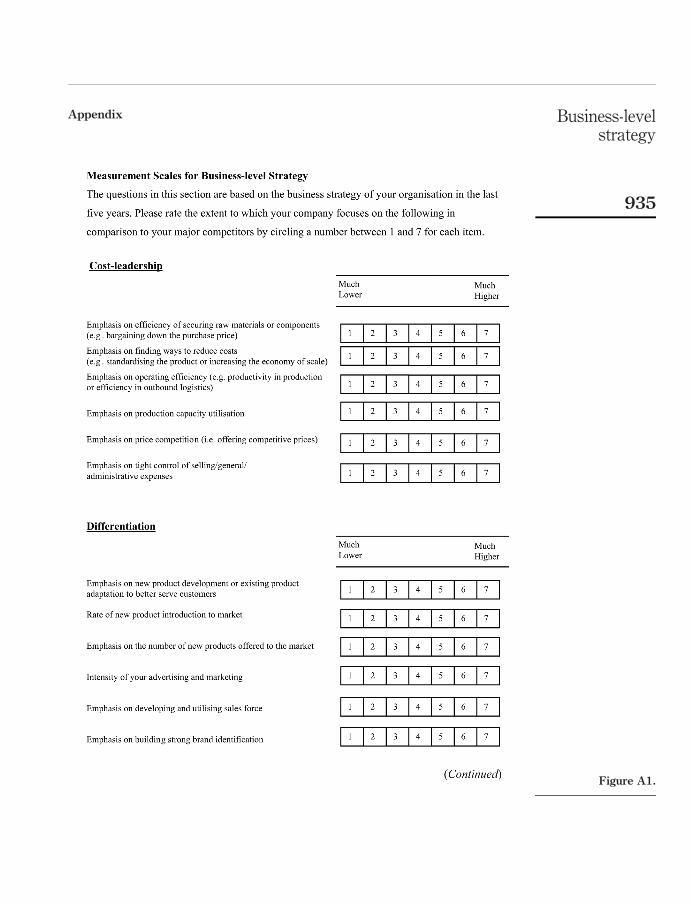
Appendix
Figure A1.
Business-levelstrategy
935

Figure A1.
MD48,6
936
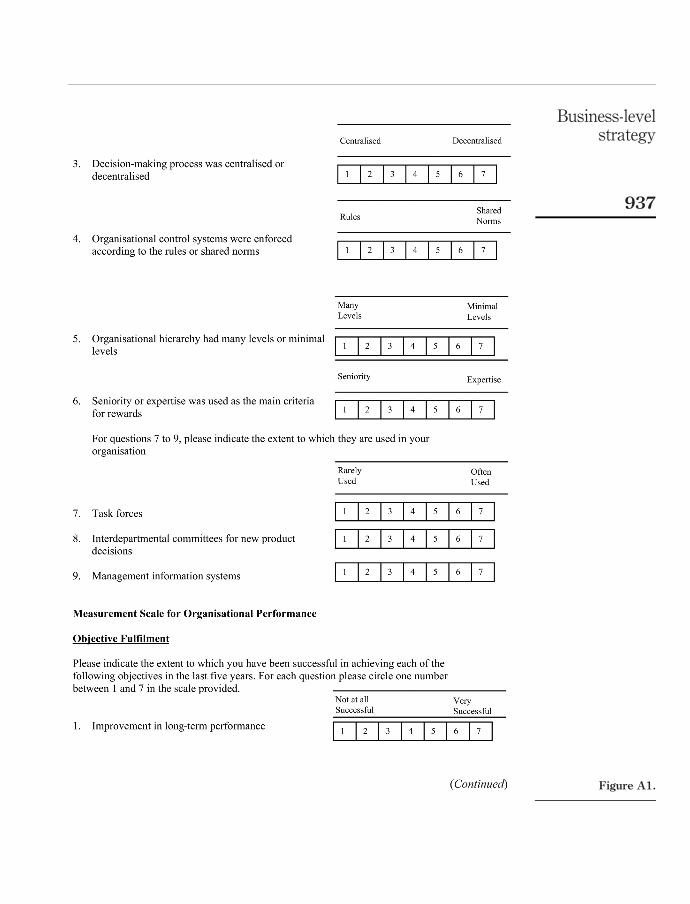
Figure A1.
Business-levelstrategy
937

About the authorsM.K. Nandakumar joined Indian Institute of Management Kozhikode in May 2009. He obtainedhis PhD from Middlesex University Business School and his thesis is entitled “Strategyformulation and implementation in manufacturing organisations – the impact on performance”.He has worked as Lecturer in Management at Middlesex University Business School for nearlyfive years. During this period he has taught Strategic Management and other Managementmodules at both the Master’s and Undergraduate levels. He has also supervised a number ofMaster’s and Undergraduate dissertations. He has also worked at University of East LondonBusiness School for a short period of time. He has presented a number of papers at majorinternational conferences including the Academy of Management Conference. He has had 14years of commercial experience in the sales and marketing area. He has worked in managerialpositions in India and in the Middle East. M.K. Nandakumar is the corresponding author and canbe contacted at [email protected]
Figure A1.
MD48,6
938
Abby Ghobadian moved to Henley as Director of the School of Projects Processes andSystems on 1 January 2007; later he became Henley’s Academic Director. Before joining Henleyhe was at Brunel University Business School where he was Professor of Management. Prior tothis he was the Director of Research at Middlesex University Business School where he held anumber of other managerial positions including that of Director of Postgraduate Programmesand Head of Business and Management Group. He was a visiting professor at Warwick BusinessSchool and Monash University in 2005. He has also worked for University of West of England,Policy Studies Institute, Imperial College, Loughborough University and BP. He has acted as aconsultant to a large number of organisations. He is a member of British Academy ofManagement (BAM) Council and Director of Research Network (DoRN) Committee. He is amember of ESRC’s virtual college. He edits the International Journal of Process Management andBenchmarking (IJPMB) and is on the editorial board of journals in the UK, USA and Hungary. Hereceived an honorary doctorate from University of Pecs in Hungary for scientific achievements inOctober 1997.
Nicholas O’Regan currently works at Bristol Business School as Professor ofStrategy/Enterprise and Innovation. Before joining Bristol, he was working at MiddlesexUniversity Business School as Professor of Strategic Management. He has published extensivelyin leading academic journals including Technovation, Strategic Change, Management Decision,International Small Business Journal and Journal of Small Business Management. He has alsopresented a number of papers at leading international conferences. His areas of specialisation areContemporary Issues in Business, Business Management and International Business. He teachesStrategic Management Modules for MBA and other Master’s programmes. Hisresearch/consultancy interests are in the areas of Corporate strategy; Organisationalleadership, culture and performance; Small business and their operating environment andE-business and technology deployment.
Business-levelstrategy
939
To purchase reprints of this article please e-mail: [email protected] visit our web site for further details: www.emeraldinsight.com/reprints