business intelligence usage determinants: an assessment of
TRANSCRIPT

Business Intelligence usage determinants: an
assessment of factors influencing individual
intentions to use a Business Intelligence system
within a financial firm in South Africa
Name: Deane Nkuna
Student Number: 9411618M
University of Witwatersrand
Supervisor: Jean-Marie Bancilhon
December 2011
Submitted in 50% fulfilment of the requirements for a Master‟s degree in
Commerce (Information Systems)

I
DECLARATION
I declare that this research is my own work and has not been submitted to any institution for
either academic or non-academic purpose. It is submitted for the first time to the school of
business and economic sciences at the University of Witwatersrand towards a Masters degree
in Information Systems.
Signed__________________
Deane Nkuna
0824988470
December 2011
ACKNOWLEDGEMENTS
Thanks are due to my supervisor, Jean-Marie Bancilhon, for his guidance throughout the
research process. My gratitude also goes to those staff members in the Department of
Information Systems at the University (between January 2010 and December 2011) whom I
have had personal encounters with, and those who directly contributed to the completion of
this project. Last, but not least, I thank God my Creator, my parents, and my wife and children
for tapping my back when it was timely to do so.

II
ABSTRACT
Although studies are conducted on economical gains due to BI system adoption, limited
knowledge is available on factors which influence BI system usage. Identifying these factors is
necessary for organisations because this may enable the design of effective BI systems, thus
increasing the chance of firms adopting them to realise the actual value inherent in the
exploitation of BI systems. The purpose of this study is, therefore, to investigate factors which
influence BI system usage. The investigation employed constructs derived from three
theoretical frameworks, namely technology acceptance model (TAM), task-technology fit
(TTF) and social cognitive theory (SCT) as follows: intention to use, perceived usefulness,
perceived ease use, task characteristics, technology characteristics, task-technology fit and
computer self-efficacy. To test the hypotheses, data was collected by administering the study
to 682 BI system users in a South African financial institution, SA-Bank, wherein 193 usable
responses were received. The findings of the study with partial least squares (PLS) analysis
indicated support for the joint use of constructs from the three theoretical frameworks,
explaining 65% of BI system usage variance. Furthermore, the perceived usefulness of a BI
system reflected a stronger influence as a factor of BI system usage over the beliefs that the
system was easy to use, and the belief that it was aligned to the performance of business tasks.
An unusual outcome in this study was the lack of influence of computer self-efficacy on BI
system usage. Nonetheless, the study extended validation of the use of constructs derived
from the three theoretical frameworks for a BI technology in the context of SA-Bank, thereby
contributing to theory. Finally, the results of hypothesis testing suggested a starting point for
practitioners towards designing BI systems, and recommendations and suggestions are
included in this report.
Keywords: decision task characteristics, BI system characteristics, decision task – BI system
fit, computer self-efficacy, perceived usefulness, perceived ease of use, intention to use.

III
Table of Contents
List of figures.............................................................................................................. VI
List of tables ............................................................................................................... VI
Definition of terms.................................................................................................... VII
Chapter 1: introduction ................................................................................................. 1
1.1 Overview .................................................................................................... 1
1.2 Business intelligence and current trends.................................................... 2
1.3 Context of study ......................................................................................... 3
1.4 The need for this study .............................................................................. 3
1.5 Research aims ............................................................................................ 4
1.5.1 Research objectives .......................................................................... 5
1.6 Delimitations .............................................................................................. 6
1.7 Conclusion and structure of the study ....................................................... 7
Chapter 2: literature review .......................................................................................... 8
2.1 Overview .................................................................................................... 8
2.2 BI usage views ........................................................................................... 8
2.2.1 Usage at SA-Bank .......................................................................... 11
2.2.2 BI usage in this study ..................................................................... 11
2.3 Theoretical background ........................................................................... 12
2.3.1 Task technology fit model .............................................................. 12
2.3.2 Computer self-efficacy ................................................................... 13
2.3.3 Technology acceptance model ....................................................... 14
2.4 Research Model and hypotheses .............................................................. 16
2.4.1 User beliefs and BI system usage ................................................... 17
2.4.2 Perceived task-BI system fit and intention to use .......................... 19
2.4.3 The effects of computer self-efficacy on usage ............................. 21
2.4.4 Decision task and BI system characteristics towards use .............. 23
2.5 Chapter summary ..................................................................................... 26
Chapter 3: Research methods ..................................................................................... 27
3.1 Overview .................................................................................................. 27
3.2 Research approach ................................................................................... 27
3.3 The BI environment ................................................................................. 28
3.4 Unit of analysis ........................................................................................ 28
3.5 Research Design ...................................................................................... 28
3.4.1 A survey methodology and the purpose of this study .................... 29
3.4.2 Scales and measurement items ....................................................... 29

IV
3.4.3 Control variables ............................................................................ 30
3.5 Sampling method ..................................................................................... 30
3.6 Pre-study analyses ................................................................................... 31
3.6.1 Pre-test .......................................................................................... 31
3.6.2 Pilot test .......................................................................................... 31
3.7 Ethical clearance ...................................................................................... 31
3.8 Study administration ................................................................................ 32
3.9 Preliminary data analysis ......................................................................... 32
3.9.1 Data Screening ............................................................................... 32
3.9.2 Non-response bias test .................................................................... 32
3.9.3 Factor analysis ................................................................................ 33
3.9.4 Multicollinearity ............................................................................. 33
3.9.5 Common method bias..................................................................... 34
3.10 PLS data Analysis .................................................................................... 34
3.10.1 Construct validity and reliability .................................................. 34
3.10.2 Hypothesis testing ......................................................................... 35
3.10.3 Control variable effects ................................................................. 35
3.11 Regression Analysis ................................................................................. 35
3.12 Limitations ............................................................................................... 36
3.13 Conclusion ............................................................................................... 36
Chapter 4: Data analysis ............................................................................................. 37
4.1 Overview .................................................................................................. 37
4.2 Preliminary instrument analysis .............................................................. 37
4.3 Data cleaning ........................................................................................... 38
4.3.1 Missing Data Analysis ................................................................... 38
4.3.2 Outliers .......................................................................................... 38
4.4 Testing for assumptions ........................................................................... 39
4.4.1 Linearity ......................................................................................... 39
4.4.2 Normality ....................................................................................... 39
4.4.3 Homoscedasticity ........................................................................... 40
4.4.4 Correlation analysis ........................................................................ 40
4.4.5 Multicollinearity ............................................................................. 41
4.5 Respondent composition analysis ............................................................ 41
4.6 Factor analysis ......................................................................................... 43
4.6.1 Principal component analysis (PCA) ............................................. 43
4.6.2 Confirmatory factor analysis (CFA) .............................................. 45
4.7 Non-bias test outcomes ............................................................................ 47
4.8 Hypotheses testing ................................................................................... 48

V
4.8.1 PLS analysis ................................................................................... 48
4.8.2 Regression analysis ........................................................................ 49
4.8.3 Summary of hypothesis testing ...................................................... 50
4.9 Conclusion ............................................................................................... 51
Chapter 5: Discussion ................................................................................................ 52
5.1 Overview .................................................................................................. 52
5.2 Validity and reliability ............................................................................. 52
5.3 The dependent variable – Intention to use ............................................... 53
5.4 Independent variables to IU (Direct effects) ............................................ 55
5.4.1 Perceived usefulness (PU) .............................................................. 55
5.4.2 Perceived ease of use (PEOU) ....................................................... 56
5.4.3 Perceived decision task – BI system fit (DBF) .............................. 57
5.4.4 Computer-self efficacy (CSE) ........................................................ 58
5.5 Independent variables to IU (Indirect effects) ......................................... 59
5.5.1 Decision task characteristics (DT) ................................................. 59
5.5.2 BI system characteristics (BIS) ...................................................... 59
5.6 Putting it all together ............................................................................... 60
5.7 Conclusion ............................................................................................... 61
Chapter 6: Conclusion ................................................................................................ 62
6.1 Overview .................................................................................................. 62
6.2 Summary of the study .............................................................................. 62
6.3 Contribution to research and theory ........................................................ 63
6.4 Limitations of study ................................................................................. 64
6.5 Future research ......................................................................................... 65
6.6 Managerial guidelines .............................................................................. 66
6.7 Conclusion ............................................................................................... 67
References ......................................................................................................... 68
Appendix A – Questionnaire ...................................................................................... 76
Business Intelligence survey ............................................................................. 76
Survey link ........................................................................................................ 80
Literature sources of items ................................................................................ 80
Appendix B – A letter to reuest participation ............................................................. 83
Appendix C – Ethics clearence letter ......................................................................... 85
Appendix D – Cover letter for study .......................................................................... 87
Appendix E – Missing value analysis ......................................................................... 89
VI
Missing value tablea,b
........................................................................................ 89
Missing value patterns ....................................................................................... 91
Appendix F – Measurement item scatterplot .............................................................. 92
Appendix G – Measurement item normality .............................................................. 93
Normal probability plot ..................................................................................... 93
Sample histogram (measurement item) ............................................................. 94
Appendix H – Scree test curve ................................................................................... 95
Appendix I – Multivariate normality (histograms)..................................................... 96
Dependent variable IU ...................................................................................... 96
Dependent variable DBF ................................................................................... 97
Appendix J - Multivariate scatterplots...................................................................... 98
Dependent variable IU ...................................................................................... 98
Dependent variable PU ..................................................................................... 99
List of figures
Figure 1: BI usage categories ..................................................................................... 10
Figure 2 : A model of TTF adapted from Dishaw and Strong (1999) ........................ 13
Figure 3: A model of TAM adapted from Venkatesh and Davis (2000) .................... 15
Figure 4: Research Model........................................................................................... 17
Figure 5: Results of PLS analysis ............................................................................... 48
Figure 6: Revised model ............................................................................................. 61
List of tables
Table 1: Response group-breakdown ......................................................................... 41
Table 2: Varimax rotated component matrix a ............................................................ 44
Table 3: Loadings and cross-loadings of the measurement model a ........................... 45
Table 4: Correlation of latent constructs and the square root of AVE ....................... 46
Table 5: Multiple regression results ........................................................................... 50
Table 6: Hypothesis test summary .............................................................................. 50

VII
DEFINITION OF TERMS
BI analytics: a term for the collective mathematical operations performed on data
which resides in the data warehouse
Convergent validity: Is the check to determine whether indicators theoretically
declared to measure a construct, significantly measure that construct.
Decision maker(s): refers to a person who is involved with handling decision tasks,
used interchangeably in this study with BI user.
Decision support systems (DSS): A class of systems which are used for organisational
decision support. Business intelligence serves as an example of DSS.
Decision task: a task which its execution depends on information processing that is
aided by a BI system (or a DSS).
Discriminant validity: Is the check to determine whether indicators theoretically
declared to measure a construct, significantly measure another construct of the same
research model.
Kurtosis: This refers to the measure of the height of the bell-shaped curve. Kurtosis is
assigned a value of zero if the height of the bell shaped curve is normal, otherwise it is
assigned either a negative or positive value depending on the direction of the
abnormality.
Measurement model: A model that enables the measurement of the reliability of
indicators making a construct.
Normal distribution (data normality): The distribution of data such that when plotted
on a graph, reproduces the popular bell-shaped curve in statistics.
Outlier: A case that deviates from the predominant observation of data gathered to be
analysed.
Skewness: The measure of symmetry of the bell shaped curve. If symmetrical, then
skewness is zero, otherwise it is assigned a positive or negative value depending on
the direction of this abnormality.

VIII
Structural equation modelling (SEM): A multi-variate technique that determines
simultaneously the significance of relationships among model constructs, and the
significance of relationships of individual constructs and their respective items.

1
CHAPTER 1: INTRODUCTION
1.1 Overview
This chapter introduces the study of business intelligence factors which influence usage
within a financial organisation in South Africa (SA), SA-Bank. SA-Bank implemented a
business intelligence (BI) system that lived up to the expectations of the managers behind this
initiative, and thus serves as an appropriate context for the purpose of the study. BI is one of
the latest innovations dominating information technology (IT) investments made by
businesses (Lawton, 2006 & Negash, 2004). It is acclaimed to be a perfect strategic initiative
by some of the organisations who have adopted it (Phan and Vogel (2009; Petrini and
Pozzebon, 2009; Ramamurthy, Sen and Sihna, 2008 & Watson, Wixom, Hoffer, Anderson-
Lehman and Reynolds, 2006), although not with fewer challenges when contrasted to related
innovations which came before its existence. For instance, literature on enterprise resource
planning systems, another innovation in its day, is made of varying views surrounding its
implementation. Some studies like Bernroider (2008) suggest enterprise performance
enhancement through using enterprise resource planning solutions, while others like Galliers
and Newell (2003) indicate performance reduction of common approaches to their
implementation. One major difference between BI and such long existing technologies is the
deficiency of formalised knowledge around BI (Petrini and Pozzebon, 2009; Lawton, 2006 &
Lönnqvist and Pirttimäki, 2006). As a concept, it lacks a universal definition and a formal
approach towards implementation. The available knowledge on BI appears insufficient to
serve as reference to practitioners towards effective design of the innovation within firms. The
study therefore aims to advance knowledge on the design of BI applications. This is achieved
through the assessment of factors proposed in this study to be determinants of business
intelligence system usage.
The chapter begins with a discussion of BI as a concept, definition, its origination and current
trends. It then proceeds to explain the context in which the study is performed, its importance
to practitioners and academia, aims and objectives, the scope, and ends with a conclusion and
the structure of the study.

2
1.2 Business intelligence and current trends
There are overlapping definitions between BI and data warehousing, a concept it strongly
relates to. Distinguishing between the two is necessary in building towards a clear definition
of BI. It is a cliché to say that the two concepts are related, even though it is unclear how they
actually relate. A data warehouse (DWH) is defined as an integrated data store upon which
tools that manipulate data can be used towards decision support (Dayal, Castellanos, Simitsis,
Wilkinson, 2009). BI is defined as a software tool for gathering, integrating and analysing
data from the different data sources of a business enterprise towards decision support (Phan
and Vogel, 2009 & Golfarelli, Rizzi and Cella, 2004). The definitions make it clear that BI
comprises a data warehouse and reporting tools which are used for data processing and
manipulation. Petrini and Pozzebon (2009) define BI as a strategy enabler, that is, a tool
which can be used to integrate information from all strategic areas of a business enterprise. It
is thus defined in this study as a strategic information system which supports organisational
decision making from an integrated data store.
The term „business intelligence‟ was coined by Howard Dressner of Gartner in the early 90‟s
(Watson and Wixom, 2007). BI has gained popularity as a tool used to track performance of
business processes and of transactional systems. Through a BI system, information generated
from all business activity is integrated and made accessible to strategy personnel towards
business performance tracking and enhancement (Phan and Vogel, 2009 & Petrini and
Pozzebon, 2009). Current trends also indicate that BI systems can be employed for varying
purposes, and thus can be named according to the needs for which they are adopted. The most
predominant terms widely used by BI practitioners are: business performance management,
real-time business intelligence and pervasive business intelligence (Watson and Wixom, 2007
& Lawton, 2006). Business performance management refers to a BI system that enables
gathering of statistics about business processes, preparation and presentation of such data as
input to organisational performance analysis (Kim and Kankanhalli, 2009). Real-time BI
systems are applied in environments where trend analysis of current business transactions is
mandatory for decision support (Watson, et al., 2006). Lastly, pervasive BI system are
designed to enable a firm share decision support functions with its strategic partners (such as
suppliers and joint venture partners) also in the process enabling such an organisation to tap
into external data sources towards decision support (Lawton, 2006).

3
The forms of BI applications defined above, although promising to match the information
needs of businesses, are described within the IS literature with little information as to how
practitioners could build them such that they are used. This emphasises the need for a study
which advance BI knowledge on factors affecting its design. SA-Bank appeared a suitable
context for such an investigation to be carried, because it was employing services of a BI
system that was popular among the employees of this firm. The context of SA-Bank is
outlined as the next section of this chapter.
1.3 Context of study
SA-Bank is a forty year old financial institution situated in South Africa. It specialises in
mobile asset financing such as cars, trucks, construction machinery and aeroplanes.
According to information kept in its intranet, it is a market leader in the business space of
automobile financing, which they define as asset financing. One of its core businesses is
passenger car sales, where individuals apply for loans to purchase cars from manufacturers
through car dealers. This line of business is supported by a business process, which is related
to most of the business activity happening at SA-Bank. Manufacturers have formed joint
ventures with SA-Bank in agreements which shift administrative responsibility for car sales to
SA-Bank. For instance, a customer intending to buy a Toyota brand from a car dealer,
supplies information to SA-Bank for credit approval assessment instead of sending it to the
Toyota manufacturer. Thus communication channels are established between SA-Bank and its
partners, such that information flow for passenger car sales is seamless between car dealers
and the firm. The BI system (referred to within the firm as the BI portal) at SA-Bank is
mainly used for data analysis generated from the business activity of this process. Although
support for other processes is also happening, it is not as intensive as for the process referred
to here. Access to the BI system is also granted to SA-Bank partners, enabling them to view
business trends within the firm that are applicable to their respective businesses.
1.4 The need for this study
Lawton (2006) states that BI systems only add value when they are used by the people for
whom they are built. The value, however, is only generated once these users have interpreted
data and information towards decision support. Therefore, determining factors which lead to
BI usage is important towards ensuring that users get applications that are relevant to their

4
needs. As an example, Zhong, Liu and Yao (2007) have found that a dashboard, i.e. a
graphical web interface through which data is presented to users, can limit users from fully
exploiting web based intelligence with the choice of layout that display data to users. This
example emphasises how useful it is to know about the factors which are likely to motivate
users to use a computer application prior to its implementation. In addition, Benroider (2008)
argues that if proper standards towards IT implementation are established, adoption becomes
less demanding both in cost and effort. The ultimate goal for practitioners is to develop and
implement BI systems that are useful towards helping users solve decision problems, and do
so in a cost effective manner. Given that BI system usage is voluntary, a challenge is raised to
BI practitioners to convince decision makers that it is worth using BI systems. More
importantly, is the fact that usage is necessary towards realising the value of a BI innovation.
This is suggested by DeLone and Mclean‟s (1995) model of information system success
which shows that technology usage precedes benefits.
Ramamurthy et al. (2008) found that the environment in which a computer application is
implemented also affects user behaviour towards the system. They further suggested that
different environments are likely to influence user perceptions of the same technology
differently. This suggests that there could be environmental issues that are specific to the SA-
Bank setting, especially where BI system usage is concerned. Thus, the current context
extends the range of contexts investigated in IS research, implying knowledge is also
advanced in terms of factors arising specifically from the setting wherein the BI technology is
applied.
1.5 Research aims
The aim of the study is to determine factors which influence the usage of a business
intelligence system within a banking institution in South Africa. Analysis is performed in
three areas within this context. The first area, which is the BI application, analysis is
performed in order to determine factors influencing usage arising from system attributes. The
second area is the work activity for which the system is used, that is, decision tasks. These
(decision tasks) are analysed for characteristics which influence BI system usage. Finally, BI
users are assessed for capability in relation to BI usage. Thus the aim is to assess the effect of
system, decision task and user capability characteristics on BI system usage.

5
1.5.1 Research objectives
The main question that the research answers is: How do the system, decision task, and user
capability characteristics impact on BI system usage? In order to answer this main question,
the research is broken down into research objectives presented as sub-questions below:
1 What are the combined decision task and BI system characteristics that lead to BI system
usage?
2 What are the capability beliefs that influence BI system usage?
3 What are the beliefs that influence decision makers to use a BI system?
Question 1 focuses on the assessment of user perceptions on the combined effect of the BI
system and decision task characteristics on usage. The objective aimed at by this question was
motivated by most users at SA-Bank relying on decision support systems to complete their
business activity, hinting that the BI system should be investigated in light of decision tasks
that are processed by users. Therefore, analysis of the combined effect of the BI system and a
decision task on usage aligns with the observed BI user behaviour at SA-Bank. For this
purpose Goodhue and Thompson (1995) suggested a model they termed, task-technology fit,
which measures the combined effect of task and IT system characteristics on technology
utilisation. Task technology fit suggests that a technology will be used only if it is aligned to
the needs of the task to be executed. Thus it may be appropriate to answer this question of the
study.
Question 2 seeks to determine characteristics of individual user capability that influence the
use of a BI system. Lawton (2006) views users to be an integral part of an organisation‟s BI
initiative. Users interpret data and information generated and distributed by the BI system to
service decision task needs. Through interpretation they create value from the data and
information generated with the use of a BI system. Therefore, the inclusion of user capability
in BI system usage determinant analysis is inevitable. User capability quality is measured
with the computer self-efficacy scale adapted from Compeau and Higgins (1995). Computer
self-efficacy is defined by these authors as one‟s perceived capability to use a computer
system. Hsu and Chiu (2004) stated that computer self-efficacy does not measure the skills

6
which a person has, but the perception of whether one is able to apply the skills to use a
computer. This aspect of computer self-efficacy makes it even more suitable for the intended
analysis of individual users in this study, because it enables capture of the belief of capability
to use a BI system and not a specific BI skill. Given that there is a wide variety of computer
skills at SA-Bank, the intention was therefore not to measure these varying skills, but how
users irrespective of what they know interact with the BI system.
The last objective likely to be achieved by an answer to question 3, determines user beliefs
influencing BI system usage. The inclusion of user beliefs as determinants of a BI system
usage is supported by Vessey and Galletta (1991) who suggested that technology usage
depends on a user forming a mental view of whether applying it assists with problem solving
or not. This also boded well with studying a technology that was non-mandatory, that is,
where the only factor motivating usage was the user perceived reward that is inherent in
applying the technology when executing decision tasks. Two user beliefs, perceived ease of
use (PEOU) and perceived usefulness (PU), found to affect IT system use by Davis (1989)
were adopted for this study. These two belief constructs form part of the technology
acceptance model (TAM), which suggests that an IT application will be used based on the
belief that it is useful and it is easy to use (Venkatesh and Davis, 2000). In this study these
belief constructs present a measure of the mental view that a user forms about the BI system
as a decision aid, taking into account his/her ability to operate the BI system, and the match
between decision tasks and BI system characteristics.
1.6 Delimitations
This study analysed operational decision tasks, which are defined in this study to be tasks that
are executed by any user who is not a senior manager. For example, credit personnel drew
statistics that enabled them complete tasks related to bad-debts and credit risk trends, call-
centre managers depend on statistical data to be able to manage workforce and team-agent
performance. Ideally, analysis of decision tasks would be performed for only managerial
activity because that is where strategic decision making happens (Chan and Huff, 1992). The
current study, however, does not focus on the analysis of these tasks due to the small number
of users at this level in SA-Bank.

7
1.7 Conclusion and structure of the study
The chapter gives a background of business intelligence technology and the purpose of the
study, which is assessment of BI system usage determinants. It also introduces the context in
which the study is performed, the aims and objectives of the study, and the description of the
scope of study. The rest of the study is made up of the following chapters:
Chapter Two – Literature review
The model upon which the study is based is developed, and the theories are discussed
in detail.
Chapter Three – Methodology
The sampling method and methods used to gather and analyse the data are discussed.
Chapter Four – Data analysis
The data is analysed using statistical rigor adapted from past information system
studies.
Chapter Five – Findings and discussion
Inferences are drawn based on the data analysis, aims and objectives of the study.
Chapter Six – Conclusion
Conclusions to the aims of the research, the limitations of the research, emerging
limitations during data gathering and analysis are discussed together with future
research suggestions in light of the studied IS phenomenon.

8
CHAPTER 2: LITERATURE REVIEW
2.1 Overview
This chapter outlines the theoretical basis for the study of business intelligence system usage
determinants. It begins with a discussion of the dependent variable of the study, explaining it
from the various perspectives given in existing BI literature. This is done in order to isolate
the kind of usage focused upon in this study from other kinds of BI system usage. The
discussion of this chapter also covers in detail the theoretical frameworks, task-technology fit,
technology acceptance, and the construct, computer self-efficacy, applied jointly to form a
measurement instrument for the purpose of this study. Furthermore, the relationships between
the proposed determinants as measured by the instrument are discussed, leading to the
formulation of hypotheses to be tested in this study. This chapter culminated in the
identification of measurement items from past studies (Gefen, Straub and Boudreau, 2000),
which were used in scales that measure the concepts introduced in this chapter (see Appendix
A).
2.2 BI usage views
BI usage takes various forms depending on the objectives that an organisation sets to achieve
through its BI system (Vandenbosch and Huff, 1997). It is mainly used to analyse internal
business data and information that is generated from operational activity, for the purposes of:
business process monitoring, customer relationship management and business strategy
monitoring and evaluation (Negash, 2004; Phan and Vogel, 2009; Leidener and Elam, 1995;
Wixom, 2004 & Xu, Kaye and Duan, 2003). BI can also be used to analyse threats and
opportunities through using data and information from the external environment in which an
organisation operates (Rouibah and Ould-ali, 2002), or from merged data of both the external
and the internal environments (Lönnqvist and Pirttimäki, 2006).
Elbashir, Collier and Davern (2008) discuss two types of BI usage, evaluative and diagnostic,
and further define these terms as briefly explained here. Evaluative usage is the utilisation of a
BI system by a firm in order to determine whether organisational performance levels match
the target of performance projected by strategic decision makers. Diagnostic usage is about
user interaction with a BI system to draw information towards identifying causes to

9
operational events. There are two usage patterns, however, that emerge from most of the
existing BI studies. BI systems either emerges as tactically oriented (Negash, 2004; Watson
and Wixom, 2007; Bowman, 2002), or as tools for strategy development and enhancement
(Chen, Soliman, Mao and Frolick, 2000; Little and Gibson, 2003; Lönnqvist and Pirttimäki,
2006 & Vandenbosch and Huff, 1997). In the tactical usage pattern, referred to as tactical
usage, BI is used to monitor and adjust operational activity from the analysis of business data
as they are generated from business transactions. One good example of such usage can be
found in Watson, et al.‟s (2006) study of real time intelligence at Continental Airlines, where
BI is used to manage information related to flight movement, such as plane delays and
boarding gate problems as and when captured in transactional systems. The other usage
pattern, referred to as strategic usage, relates to management usage of data and information to
act on strategy development and organisational planning (Lönnqvist and Pirttimäki, 2006).
There is however a connection between tactical BI usage as observed from BI literature, and
diagnostic usage as defined by Elbashir et al. (2008). They are both linked to operational
activity. They, however, differ in that tactical usage means supporting decision actions based
on the analyses of current data (Lawton, 2006 & Watson and Wixom, 2007), while diagnostic
usage analyses historical data (Elbashir et al., 2008).
Similar to tactical and diagnostic usages, there is a connection between strategic and
evaluative usage. They are both linked to senior management assessment of overall business
activity. Strategic usage, however, relies more on historical data (Negash, 2004), while
evaluative usage as defined above is reviewing business performance (effected with the
analysis of current data) in comparison with a preferred state of performance that was
projected by managers (or strategic personnel). Figure 1 summarises this categorisation.
Tactical usage located in the bottom left corner of Figure 1 reflects that this form of BI usage
relies on current data and is performed mainly by low level (operational) employees. This can
be usage associated with operational performance adjustment, which users are able to achieve
through the analysis of BI data and information recently generated from business transactions.
Moving horizontally from tactical usage in Figure 1 above is diagnostic usage. In this type of
usage, users are interested in finding out about causes to events in business transactions at the
operational level. Users derive trends on historical activity in order to support decisions
related to business process performance.

10
Although Elbashir et al. (2008) view diagnostic usage as a managerial responsibility, it is
suggested in this study that unless operational activity trends are interpreted in a language
understood by senior management, they will be less meaningful to them, and thus this usage
remains a low level (or non-managerial) activity. Diagnostic usage is thus the interaction of
decision makers with the BI system at low level, but by decision makers who are more
interested in historical data. Also depicted in Figure 1 is evaluative usage shown to depend on
real-time data, and to be an activity performed by senior employees of a firm. Finally,
strategic usage appears to be a usage type that is dependent on historical data, because high
level users (or senior managers) are likely to analyse data that span time and space, because of
the focus of their roles on strategy formulation.
It is important to note that one BI application can be classed in all the usage categories
described in Figure 1, but what makes a difference in BI usage types is who uses the system,
and what data from it is of interest to them. An answer to who uses a BI system will help to
identify the level of usage, that is, whether it is senior organisational employees or operational
employees. What data are of interest to users, will further help to identify the exact
quadrant(s) of usage (as per Figure 1) in which a firm belongs.
Evaluative Strategic
Tactical Diagnostic
Figure 1: BI usage categories

11
2.2.1 Usage at SA-Bank
SA-Bank employs its BI system for two purposes, diagnostic and strategic usages. Diagnostic
usage at this firm is seen from the predominant usage of the BI system by low level users.
Mainly credit risk assessment employees rely on BI statistics to perform their daily duties.
These users draw statistics to assess whether current credit approval processes are effective,
or need enhancement. On the other hand, for customer relationship management, which is
achieved through a call-centre setup at SA-Bank, team leaders use BI statistics for business
activities such as monitoring call handling of call agents, and planning of the distribution of
call-agents across responsibilities. Another source of evidence of a diagnostic BI system at
SA-Bank is the age of data that is used for BI analytics. Data kept in the SA-Bank data
warehouse (DWH) is all data generated from business activity exclusive of data generated on
the current day. For example, users interacting with the BI system on any day, see all data of
past transactions except transactions that are processed on that day. In addition to diagnostic
usage, SA-Bank employs its BI system for strategic usage as well. This is evident on the
interest that executives within the firm have in the BI system. Executive users are interested in
high level summaries of data. To recap, SA-Bank seems to have few users at this level, since
a large component of users is made up of users who are performing diagnostic type usage.
2.2.2 BI usage in this study
The study focuses on BI usage as a diagnostic usage type. The choice is influenced by the
number of users in the chosen category at SA-Bank. In this category at the firm, users are
numerous enough to make up the statistical thresholds required for data analysis (more details
on this topic are covered in Chapter Three). On the same note, the number of strategic BI
users cannot meet the minimum size requirement for quantitative IS research. The next
section covers the theoretical frameworks from which constructs that are used to measure
determinants of BI system usage are derived.

12
2.3 Theoretical background
2.3.1 Task technology fit model
According to Goodhue (1998), the task technology fit model was developed to gather user
evaluations on IS performance. The task-technology fit (TTF) is defined as the combined
effect of task and technology features on the usage of a technology (Goodhue and Thompson,
1995). The combined effect, determines whether an information system will be used or not. If
a match of the task to be executed through a technology and the features of the technology is
perceived to exist by users, it implies that a fit exists and thus that the technology is likely to
be used (Zigurs and Buckland, 1998). On the other hand, if a match is hardly perceived to
exist between the task and the technology, it means that there is a misfit between the two and
the likelihood is that the technology is not going to be used. The TTF model therefore
measures the task and technology characteristics in order to determine a set of these
characteristics that result in usage of technology.
TTF has been tested in various contexts and for different information systems (Lin and
Huang, 2008; D‟Ambra and Rice, 2001 & Goodhue, 1998) and has so far stood the test of
time. There are some views, however, that oppose the views of its current success in IS. The
model is discussed by DeSanctis and Poole (1994) to have measurement limits. In their study,
these authors show that TTF assumes that the effects of the environment in which a
technology is used, remain the same across all contexts. The same view is shared by Dennis,
Wixom and Vandenberg (2001) who emphasise that social effects should be incorporated in
this model to correct for the disregard of context. With this limitation not taken for granted, in
this study the measurement model of TTF that was developed by Goodhue and Thompson
(1995) is adopted with additional theories, which promise to mitigate this incapacity of the
model. TTF usage in this study is backed by the evidence that it has so far proven to be a
valid measure specifically in the category of information systems, decision support systems,
which BI belongs to (Lee, Cheng and Cheng, 2007; D‟Ambra and Rice, 2001 & Lin and
Huang, 2008).

13
A graphical depiction of the TTF model adapted from Dishaw and Strong (1999) is shown in
Figure 2. This figure simply shows the variables for which this model enable analysis at SA-
Bank, that is, qualities of decision tasks that are executed with the BI system, the BI system
qualities and the user perception of fit in light of these two sets of qualities. The ultimate
objective of performing this analysis is to determine how the user perception of fit between
decision tasks and BI system qualities influences BI system usage at SA-Bank.
2.3.2 Computer self-efficacy
Computer self-efficacy (CSE) is defined to be a belief which a user has in his/her ability to
execute a task with a computer system (Compeau, Higgins and Huff, 1999 & Compeau and
Higgins, 1995). CSE, a construct derived from social cognitive theory (SCT) (Compeau,
Higgins and Huff, 1999), was created to measure what one can do with the skill one
possesses, and does not measure the exact skill possessed (Hsu and Chiu, 2004). An
illustration also given in Compeau and Higgins (1995) is by an analogy of a driving skill and
the driving process. In this analogy a driving skill and the driving process are differentiated by
the fact that different people with the same driving skill could engage in the driving process of
a motor car differently. How the brakes, accelerator and the steering-wheel are used among
others could be jointly used to describe the driving process. Although the same driving skill
could be possessed by different drivers, examining the driving process for the different drivers
Task
characteristics
BI System
characteristics
Task- BI
System fit
Intention to
use
Figure 2 : A model of TTF adapted from Dishaw and Strong (1999)

14
could lead to different outcomes. Similar to this analogy, the same computer skill can be
possessed by different people, but their approach to the execution of tasks with a computer
program could be different. Thus CSE measures the characteristics of the perceived ability to
execute tasks given a specific computer program, a time saving measure to study users who
possess numerous computer skills as observed at SA-Bank.
At SA-Bank, users possess computer skills such as skills for operating Microsoft windows
platform, operating online communication tools and internet operation to mention but a few.
This measure thus eliminates the seemingly difficult task of having to analyse the individual
computer skills of users by enabling the focus to only be on what users can perform on the BI
systems regardless of the computer skills they have acquired. In addition, it enables the
measurement of social effects that impact on IT usage at individual level (Easley, Devaraj and
Crant, 2003; Lin and Huang, 2008; Hsu and Chiu, 2004 & Gallivan, Spliter and Koufaris,
2005), which is the surrogate unit of analysis in this study.
Embedded in the CSE construct is the interaction between the environment in which a
computer application is used, and the behaviour of individual users towards a computer
application (Compeau and Higgins, 1995; Compeau et al., 1999 & Thong, Hong and Tam,
2004). These authors suggest that the CSE for a user at any point in time is a reflection of the
user behaviour and the overall environmental attitude of users about a technology. Thong et
al. (2004) have further shown that positive usage of technology from the environment
positively influences one‟s perceived ability to use a system. Thus users could be encouraged
or discouraged to use a computer application based on whether the majority of the
surrounding users apply or avoid this technology. This aspect of CSE also justifies applying
the construct in this study, because it satisfies the highlighted need by DeSanctis and Poole
(1994) & Dennis et al. (2001) that measuring IT usage with only TTF excludes the effects of
the environment wherein the computer system and executed task exist.
2.3.3 Technology acceptance model
The technology acceptance model (TAM) was developed to explain and to predict technology
usage as a self-reported measure (Doll, Hendrickson and Dong, 1998). It has its foundation in
the theory of reasoned actions (TRA), which shows that beliefs influence attitudes, which in

15
turn influence behaviour (Argawal and Karahana, 2000 & Venkatesh, 2000). TAM suggests
that an individual‟s intention to use a technology is influenced by two beliefs, perceived ease
of use (PEOU) and perceived usefulness (PU) (Venkatesh and Davis, 2000 & Venkatesh,
2000). Venkatesh and Davis (2000) define PU as the belief by a user that using a technology
will improve the execution of his/her task. In addition, they define PEOU as a user belief that
using a technology will require no additional effort other than the perceived minimum effort
necessary to complete a task. Figure 3 shows the model, its constructs and their relationships.
PEOU is shown to impact on the intention to use a technology and in addition, to impact on
the usefulness of a computer system. PEOU has however reflected stronger effects as a
determinant of perceived usefulness than as factor impacting on usage (Doll et al., 1998 &
Venkatesh, Speier and Morris, 2002), suggesting that the model should be adjusted such that
PEOU only determines perceived usefulness. These (PEOU and PU) are two widely tested
belief constructs, which so far have given consistent results in assessing intentions towards
using a technology (Cheng, 2011; Chau, 1996; Koufaris, 2002 & Lee, Kozar and Larsen‟s
(2003). TAM as a model for IS adoption, however, has been mainly tested with students as
participants, thus validation of the model in non-academic settings is lacking (Lee et al.,
2003).
The consistent manner in which TAM has performed in previous studies leads to its choice to
measure user beliefs on the BI system at SA-Bank. A measure of beliefs towards using a BI
Perceived
usefulness (PU)
Perceive ease of
use (PEOU)
Intention to
use
Figure 3: A model of TAM adapted from Venkatesh and Davis (2000)

16
system as enabled by TAM, a self-reported measure, is inevitable given the motive of the
study to solicit individual user views. Moreover, the choice to use a technology is preceded by
the beliefs that users have regarding the capability of the technology (Vessey and Galletta,
1991). Thus TAM appears to fit the objectives of the current study.
There are however limitations to applying only TAM for measuring IS usage. The first one is
highlighted by Dennis and Reinicke (2004), who noted that TAM disregards the effect exerted
by the environment wherein a technology is applied. CSE was however identified in this
study as a measure which could enable the inclusion of the environmental effect. Thus, the
application of CSE to extend the measurement capacity of TAM is justified. Wixom and Todd
(2005) & Venkatesh (2000) also suggested that TAM applied as the only measure for IS
adoption does not result in information that is useful for system design, because only two
views, usefulness and ease of use, are delivered as an outcome of such measurement and not
practicable information. In contrast to this view, Dennis and Reinicke (2004) suggested that
TAM enables analysis of technology perceptions of a user in the light of the tasks that are to
be performed, suggesting that it results in implementable outcome. Whether the view by these
authors is correct or not, TAM still cannot result in system details or descriptive qualities of
tasks that are executed with the system, because system and task qualities are not beliefs but
possibly determinants of beliefs (Wixom and Todd, 2005). Thus, TTF is used as an extension
to TAM in order to enable capture of both the task and system features that influence BI
system usage.
2.4 Research Model and hypotheses
Figure 4 shows the research model. The intention to use a BI system at SA-Bank appears to
be influenced by user capability characteristics and the combined effect of system and task
features. The model joins constructs from the theoretical frameworks discussed above in
performing this analysis as follows: TAM assesses user beliefs of the extent to which the BI
system is perceived useful (PU) and easy to use (PEOU), and the intention to a BI system
(IU); CSE measures the user capability to operate the BI system and TTF measures the fit
between decision tasks and the BI system, and the system and task features.

17
2.4.1 User beliefs and BI system usage
TAM is applied to analyse the beliefs that users have of the BI system (an existing system) at
SA-Bank. PEOU, one of the two belief-constructs comprised in TAM, is a user view of the
effort necessary to execute a task (Argawal and Karahana, 2000). During decision task
execution, a user applies his/her judgement with regards to the decision task at hand, and how
much effort is needed to execute this task. Therefore, the effort to be expended will determine
whether the user goes on to apply the technology aid when performing a decision task or not.
To reiterate, decision makers use a BI system according to what Moon and Kim (2001) term
intrinsic motivation, which means technology utilisation arises only from the belief that it is
rewarding to apply a computer system. In this context, the reward for using a BI system is the
perception by users that using it will help them perform their decision tasks with the
minimum required effort. Thus, the perception that the BI system only requires an effort
perceived to be necessary to complete a task will encourage usage, while the perception that
the BI system requires more effort than could be expended to complete a decision task will
discourage usage. The impact of PEOU on the intention to use a technology is supported in IS
H6
H7
H2
H1
H3
H4c
H4b
H5b
H4a
H5a
Decision task
characteristic
(DT)
BI System
characteristics
(BIS)
Perceived
decision task-
BI fit (DBF)
Computer Self-
efficacy (CSE)
Perceived
usefulness (PU)
Perceived ease
of use (PEOU)
Intentions to
use (IU)
Figure 4: Research Model
18
research (Koufaris, 2002 & Venkatesh and Davis, 2000). A study by Venkatesh (2000) which
was done to determine technology usage over time also extends the view that PEOU has a
significant direct effect on the intention to use a new technology, but with such an effect
diminishing over elapsed time. Therefore, it is suggested that for a BI system, the PEOU of
decision makers is positively related to the intentions to use a BI system.
H1: The perceived ease of use of a BI system will positively affect the intention to use the BI
system.
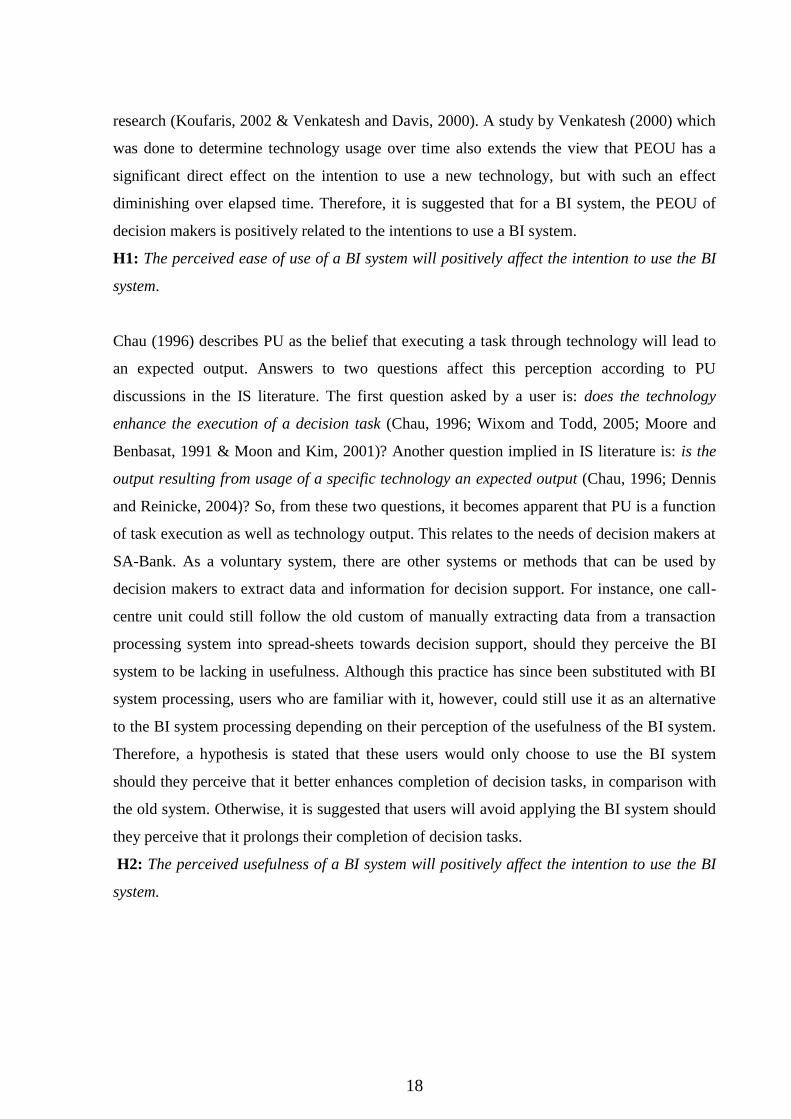
Chau (1996) describes PU as the belief that executing a task through technology will lead to
an expected output. Answers to two questions affect this perception according to PU
discussions in the IS literature. The first question asked by a user is: does the technology
enhance the execution of a decision task (Chau, 1996; Wixom and Todd, 2005; Moore and
Benbasat, 1991 & Moon and Kim, 2001)? Another question implied in IS literature is: is the
output resulting from usage of a specific technology an expected output (Chau, 1996; Dennis
and Reinicke, 2004)? So, from these two questions, it becomes apparent that PU is a function
of task execution as well as technology output. This relates to the needs of decision makers at
SA-Bank. As a voluntary system, there are other systems or methods that can be used by
decision makers to extract data and information for decision support. For instance, one call-
centre unit could still follow the old custom of manually extracting data from a transaction
processing system into spread-sheets towards decision support, should they perceive the BI
system to be lacking in usefulness. Although this practice has since been substituted with BI
system processing, users who are familiar with it, however, could still use it as an alternative
to the BI system processing depending on their perception of the usefulness of the BI system.
Therefore, a hypothesis is stated that these users would only choose to use the BI system
should they perceive that it better enhances completion of decision tasks, in comparison with
the old system. Otherwise, it is suggested that users will avoid applying the BI system should
they perceive that it prolongs their completion of decision tasks.
H2: The perceived usefulness of a BI system will positively affect the intention to use the BI
system.

19
The effect of PEOU in TAM literature is reflected to be significant and positive to both
perceived usefulness and the intention to use a technology, indicating practical significance of
PEOU as a predictor of IS usage. In this study, a proposal similar to the relationship suggested
in TAM (between PEOU and PU) is stated as follows: the ease of using a BI system exerts a
positive influence on the extent to which a BI system is perceived to be useful. The ease of
using a BI system could lead to the perception that the BI system is useful, only if users
perceive the system to require effort that is necessary to complete decision tasks. The lowest
possible effort to execute a task means that time is spent in doing only what is necessary to
complete a decision task. It further implies that the task is completed in the minimum possible
time. To recapitulate, PU is also a belief about how technology enhances task performance,
implying that the speed with which a task is completed is fundamentally important where
perceived usefulness is concerned. Therefore, if the interaction with a BI system is regarded
as effortless, a PEOU attribute, then the BI system could be perceived as efficient, a PU
attribute, because effortless could also be interpreted to mean reduced time, hence enhanced
task performance. Therefore, the perceived ease of using a BI system appears to positively
relate to the perceived usefulness of the system. The influence of the perceived ease of use on
the perceived usefulness of a technology is supported in several studies in IS (Chau and Hu,
2002; Argawal and Karahanna, 2000; Venkatesh et al., 2002 & Venkatesh and Davis, 2000),
leading to hypothesis H3 about a BI system.
H3: The perceived ease of use of a BI system will have a positive effect on the perceived
usefulness of the system.
2.4.2 Perceived task-BI system fit and intention to use
TTF studies show that the fit between a technology and a decision task leads to the utilisation
of a technology (D‟Ambra and Rice, 2001 & Dennis et al., 2001). The perceived extent to
which a technology matches the task that users perform with it determines whether utilisation
will occur or not. The same is suggested for the BI system at SA-Bank, namely that how users
perceive it to be matching the needs of decision tasks as processed by users, will affect the
extent to which the technology is used. It implies that as users attempt decision tasks with the
BI system and find that it has all functions that are needed to complete these tasks, they then
will be inclined to use the system. The opposite could also be true, namely that if users find it
difficult to perform tasks with the BI system, because it lacks some or all of the functions

20
needed to solve decision problems, then users will be disinclined to use it. Although Zigurs
and Buckland (1998) suggest that the only usage that leads to performance enhancement is
good usage, this is only noted but not tested in this study, viz. that more usage could be
problematic if it results in negative consequences. Therefore, the idea of more usage in this
study is one resulting in the organisation benefiting from employing the services of a BI
system. It is thus hypothesised that the perceived fit between a BI system and decision tasks
(DBF) constituting a user‟s task profile, will affect the intention to use a BI system.
H4a: The perceived decision task-BI fit will positively impact on the intention to use the BI
system.
As mentioned above, a technology is perceived useful if it helps users perform their tasks
efficiently, and when the resulting output aligns with user expectations of the details that are
necessary to resolve decision tasks. With positive perceptions of the usefulness of technology,
users could conclude that using it will result in their performance of decision tasks being
enhanced. This view is also shared by Lee et al. (2007) that, aligning a technology to the
decision task needs is equivalent to facilitating task performance. This therefore leads to the
suggestion that matching BI system functions to decision task needs could also have a direct
impact on the perceived usefulness of this technology. A contrasting view to this could be
stated as follows: a misalignment of decision task and the BI system qualities could imply that
the BI system lacks in the functions that are needed to complete decision problems (or
decision tasks). It could be that the BI system has functions which match some of the decision
task needs, or functions that are totally misaligned to the needs of decision tasks. Whether it
meets some needs or none of the decision task needs, it is regarded as a misfit to the decision
task needs, thus negatively impacting on perceived usefulness. It is thus proposed that for the
BI system being studied, the perceived fit between the system and the decision tasks
positively relates to the perceived usefulness of the BI system.
H4b: The perceived decision task-BI fit is positively related to the perceived usefulness of the
BI system.
The perceived fit between a technology and a task is found to have a positive influence on
usage (Goodhue, 1998). In this discussion a contextualised view (to the BI system at SA-
Bank) is suggested, that the perceived fit between a BI system and a decision task will have a

21
positive influence on a user‟s belief that the BI system is easy-to-use. This perception, of
course, subsequently leads to the intention to use or not to use the BI system. A BI system is a
technological aid facilitating execution of decision tasks (Lawton, 2006). This suggests that
the BI system should be equipped with every function that is necessary to complete decision
tasks, because only then would the system assist users meet their goals. Lee et al. (2007)
extended support of this view in their statement that, when a technology has all the functions
a user could possibly need to execute a task, and these functions indeed support the execution
of the task, then the task is performed easily and effectively. Further, Mathieson and Keil
(1998) stated that the ease of using a technology is beyond the layout design of the user
interface of a computer technology. They suggested that the ease of computer usage is not
only dependent on how easy it is to perform commands from the computer interface or how
user-friendly the computer interface is, but also about how effective are the computer
functions when a user performs tasks. It is thus implied that the effort to complete a task is
minimised when the computer functions deliver information exactly according to the
requirement of decision tasks, suggesting that task–technology fit influences the ease of using
a system. Support was found in Mathieson and Keil (1998), that the perceived fit between a
task and technology is positively related to the ease of using a computer application. Thus the
hypothesis that the perceived fit between a BI system and a decision task will positively
influence the ease of using a BI system.
H4c: The perceived decision task-BI fit is positively related to the perceived ease-of-use of
the BI system.
2.4.3 The effects of computer self-efficacy on usage
Venkantesh (2000) views the ability to control a computer application as one factor that could
inhibit or enable execution of tasks through the computer software. The perception formed by
a user of his/her computer-control ability is known as computer self-efficacy (Compeau and
Higgins, 1995). Computer self-efficacy has been shown to influence PEOU and PU,
constructs of TAM (Lewis, Agarwal and Sambamurthy, 2003), to directly predict task
performance (Yi and Davis, 2003), and to influence the perceived fit between decision tasks
and technology (Lin and Huang, 2008).

22
In this study, it is suggested that for a BI system, one‟s computer self-efficacy influences
his/her perception of fit between decision task and the BI system. A fit implies that a user has
conceived the needs of the task to be executed, and has identified the functions to be executed
(Goodhue, 1998). A user could require a certain level of ability on how to operate these
functions in order to accurately assess whether a fit exists between a task and a technology.
Furthermore, even if a user knows that the functions that could enable him/her to perform a
task are available, this information will not help with task completion if the user perceives
that s/he is not capable of executing the identified functions. Thus although the match
between a task and technology could be perceived to exist by a user, the evidence of a fit
would only be available after the execution of the task is completed. This implies that when a
user fails to complete task execution because he or she was unable to operate a computer
function, then there is a greater likelihood that the user will perceive the technology to not
match the task needs, because there is no evidence of system meeting task needs. Therefore,
whether a fit between task and technology exists or not also depends on one‟s perceived
computer self-efficacy. This could also be true for a BI system that, users with a positive
perception of ability to operate BI functions will view the BI system as matching the task
needs, while users with a negative perception of ability to operate BI functions will view the
BI system as misaligned to task needs. Thus it is proposed that computer self-efficacy
positively impacts on the fit between decision tasks and the BI system.
H5a: Computer self-efficacy positively relates to the perceived decision task-BI fit.
CSE is found to positively impact on both actual usage and self-reported usage of a
technology (Easley et al., 2003 & Compeau and Higgins, 1995), but also suggested by Strong,
Dishaw and Bandy (2006) is that CSE affects technology usage via a combined effect with
technology qualities. In the BI environment at SA-Bank, it is suggested that usage depends on
how well users perceive that they have the ability to execute decision tasks with a BI system.
This perceived ability can also be explained by the level of confidence that a user has towards
executing a task (Thong et al., 2004 & Lee et al., 2007).
If a user perceives that s/he is able to perform a task with a technology, without challenges of
identifying and executing relevant functions, then the user will be inclined to use the
technology given an opportunity. Again if a user doubts his/her ability to use a technology,

23
there is a greater likelihood that the user will avoid using the technology under any
circumstances. Computer self-efficacy also encapsulates the effects of the environment
wherein a user operates (Gallivan et al., 2005 & Compeau and Higgins, 1995). This implies
that when positive usage dominates the environment wherein a technology is adopted, then
there is a chance that the CSE of a user will be positively influenced, resulting in more usage.
On the contrary, when there is generally a negative attitude towards a technology by the
intended user community, then a user could form beliefs that he/she is less capable to use the
technology, resulting in the rejection of the technology. A hypothesis is thus stated that at SA-
Bank, the computer self-efficacy of a user will positively affect his/her intention to use the BI
system.
H5b: Computer self-efficacy positively relates to the intentions to use the BI system.
2.4.4 Decision task and BI system characteristics towards use
Zigurs and Buckland (1998) define a decision task as a task that has several potential
outcomes. A BI system as a decision support aid enables a user to reach these outcomes, upon
which this user applies his/her knowledge to pick an outcome that resolves a problem.
Depending on the nature of the decision task or the time and effort required to interact with
the BI system towards these outcomes, the system could have varied levels of usefulness
towards solving a decision task.
Zigurs and Buckland (1998) also suggested the complexity of a task as one attribute that
could increase both the information load processed by a user to complete a task, and the
length of processing time taken by a user to complete a task. The complexity of a task could
thus affect the manner in which a user interacts with a BI system with regards to time and
effort.
Goodhue and Thompson (1995) found support for two other task attributes which affect the
nature in which a user interacts with technology, task ambiguity and interdependence. The
authors define task ambiguity as the extent to which a user believes that what s/he
understands as a requirement of the task is indeed a requirement of the task. If a decision task
is conceived to be unclear or if its requirements are not clearly specified, then identifying
relevant functions from the BI system could be difficult for the user. This could imply

24
prolonged interaction of a decision maker with the BI system. The opposite could also be true,
namely that clearly defined decision tasks lead to completion of a decision task in just the
time necessary to complete it, because a user is not left to guess the likely meaning of a
requirement in order to pick a relevant function from the BI system. Task interdependence is
discussed by Goodhue and Thompson (1995) as the degree to which users communicate while
attempting execution of decision tasks. A decision task could incite communication from
different users, an action which can facilitate performance of the task, because different users
could possess different views of performing the same decision task. Therefore, the need to
share information between co-workers (task-interdependence) could also imply that the time
and effort that is spent executing decision tasks with a BI system are reduced.
When tasks are executed in just the time and effort necessary for their completion, because
they are clearly stated, easy or encourage solicitation of co-worker input, then users could
perceive the BI system as meeting decision task need. Conversely, when tasks are executed
with effort and time that are in excess of the effort and time necessary for their completion,
because they are unclearly stated, complex or reliant only on independent user effort, then
users could perceive the BI system as misaligned to decision task need. Thus it is
hypothesised that, for a BI system, decision task characteristics (DT) positively impact on the
fit between task and technology.
H6: Decision task characteristics positively impact on the perceived decision task-BI fit.
Four attributes of a computer technology are considered in this discussion, namely: the extent
to which users find the BI system available to service their information needs; the extent to
which the BI system meets the changing decision task need; the ease with which the BI
systems makes information available to users and the rate at which the BI system processes
user requests.
Firstly, a BI system that is seldom available when users need it for executing decision tasks
delays the process of decision making and prolongs the time necessary to complete tasks.
Conversely, a system that is available every time it is needed enables execution of decision
tasks as and when business activity calls decision users to do so.

25
Secondly, the extent to which a BI system matches the needs of decision tasks as they change,
could also affect the effort and time necessary complete decision tasks. New or changed
business needs could imply that users are now required to process more information than
before, or engage in more interaction with the BI system than before, therefore, both these are
likely to increase the effort and the time to complete tasks. An IS, however, can be designed
such that users are not affected by the changing business needs in terms of their interaction
with the system, a design that could positively impact the user perception of fit between task
and technology.
Thirdly, the user view of the ease with which information can be accessed from the system is
another attribute of a BI system which is of interest in this study. Should a system require that
users engage in lengthy interaction with it before they get the required outcome, then users
could believe that the system delays task performance and requires more time than necessary
to complete tasks.
Lastly, the rate at which a computer system processes the output that is requested by users
impacts on the time necessary for task completion. Lengthy processing times of user requests
imply delayed execution of tasks, and could lead into a belief that the BI system is not aligned
to the requirements of decision tasks.
These BI system features could lead to a belief that the BI system does not match the decision
task profiles of individual users, should they negatively affect the time perceived necessary to
complete decision tasks. On the other hand, should the BI system require only time and effort
necessary to complete tasks, users could perceive that it meets decision task needs.
H7: BI system characteristics positively impact on the perceived decision task-BI fit.

26
2.5 Chapter summary
This chapter discussed the usage types of a BI system, leading to the identification of the kind
of BI system usage focused upon in this study. Four types of BI system usage, tactical,
diagnostic, evaluative and strategic, were identified and these were also distinguished from
one another. The BI system at SA-Bank employed two types of usage, diagnostic and
strategic, but the study focused on diagnostic usage because the number of users employing
this usage type exceeded the required minimum for statistical analysis. The chapter also
discusses three theoretical frameworks, TTF, TAM and CSE from which constructs to
measure the properties of a BI system usage are derived. These constructs are adapted in the
study for their consistency in measuring IT usage. Finally, covered in the chapter is the
research model which is a basis for hypothesis testing.

27
CHAPTER 3: RESEARCH METHODS
3.1 Overview
This chapter focuses on the description of methods that were used to gather and analyse data
for purposes of this study. The discussion begins with an outline of the paradigm in which the
study is based. This lays the ground for subsequent discussions in this chapter as different
paradigms have different techniques for research (Orlikowski and Baroudi, 1991). The
chapter further covers the design layout of the method used to gather data, looking
specifically at the operationalisation of the constructs discussed in Chapter Two, and the
control variables focused upon in the study. Furthermore, the environment wherein the sample
was drawn together with the sampling technique deployed, is discussed. Discussion of the
validation of the instrument used to gather data is also covered, followed by a discussion of
the approach employed when applying for an ethical clearance certificate, a prerequisite for
data collection. Finally, before concluding the chapter, methods performed to clean data,
assess construct validity and reliability and test hypothesis are outlined.
3.2 Research approach
The research approach followed in conducting this study draws from a positivist paradigm.
This paradigm was chosen since the aim of this study was to determine factors which impact
on BI system usage and specifically assessing the extent to which identified factors impact on
the usage of a BI system. In line with the discussion of Kaplan and Duchon (1988), a
positivist paradigm presented a wide choice of statistical techniques, which satisfied this need.
Moreover, in comparison to using a qualitative paradigm, associated with methods that seek
to explain in depth how a specific context influences an IS phenomenon, thereby binding
research outcomes to context (Lee and Hubona, 2009), the finding of this study can be applied
in contexts beyond the SA-Bank boundaries.

28
3.3 The BI environment
There were over 2000 users of the BI application at SA-Bank at the time of study, and
approximately 2500 users when including partners of SA-Bank. Several examples of how BI
usage takes place within SA-Bank were discussed in Chapter One and Two, but essential to
note is that the BI system within SA-Bank spanned all business units, that is, it was applied
within other business units besides the credit and call-centre unit as stated in the examples.
The BI system was non-mandatory to the BI user community, which is normally a condition
for decision support systems (Nagesh, 2004 & Lönnqvist and Pirttimäki, 2006). Therefore,
usage at this firm arose from the user view of whether the decision task one is about to
execute required data processing from the BI or not.
3.4 Unit of analysis
The unit of analysis was the BI system, however, individual user views were used as
surrogate units of analysis. Such an approach was appropriate given that the BI system had
not reached organisation wide usage (Leidener and Elam, 1995), that is, users in some areas
of the organisation were not relying on the system for task completion. Consistent with the
statement by the same authors, namely that low level analysis can be transformed into
organisational level conclusions, analysis was performed at individual level and not
organisational as would have been ideal. The implications, however, were interpreted to apply
at organisational level.
3.5 Research Design
A survey methodology was chosen for the purpose of this study for reasons subsequently
discussed. This section is made up of three parts as follows:
A background of the survey methodology in light of the purpose of the study.
A discussion of the constituents of the survey questionnaire.
Control variables.

29
3.4.1 A survey methodology and the purpose of this study
The aim of the study encapsulated the intention to extend validation of BI system design
factors beyond the context of SA-Bank. The challenge therefore was to ensure that all aspects
from the BI system user community at SA Bank relevant to this investigation are captured,
because BI system usage at SA-Bank spanned various geographical locations in South Africa.
Applying a survey technique promised attainment of this goal, because it offered the
flexibility of applying communication techniques that enabled a reach to participants that is
unlimited by geographical space, such as Post Office facilitated communication, internet and
email (King and He, 2005). In this study email was therefore used to administer the survey
instrument for the reason of enabling wide coverage. More importantly, email was adopted
because of the limited time allocated for this study (Yu, 2003 & Sivo, Saunders, Chang and
Jiang, 2006).
3.4.2 Scales and measurement items
The survey was made up of two sections, A and B. Section A had items measuring the
theoretical constructs of the study, while Section B comprised the questions that were used to
get demographic information from respondents. This order of sections was used to avoid
alienating respondents from participating in the study due to asking personal questions before
the main survey questions were presented to them (Bailey, 1994).
A literature review was conducted to identify measurement items from past studies which
were used in this study. Based on this exercise, validated measurement items were identified
for all the constructs (or scales). A few of the measurement items were taken as they were
used in past studies, but the majority had to be adapted to suit the purposes of this study.
Additionally, as recommended by Churchill (1979), scales should be made up of multiple
measurement items in order to reduce measurement error. Therefore, each of the scales of this
study comprised four items. Each item that measured a concept of the study beared a 7-point
Likert-type design ranging from 1 “strongly disagree” to 7 “strongly agree”, because such a
format is known to improve the reliability and validity of scales when variation in answers is
anticipated to be wide, as was the case in this study (Hair, Black, Babin, Anderson and
Tatham, 2010).

30
An example of the scale „intentions to use‟ (IU) is used to illustrate how the majority of
measurement items were adapted from various studies. Items for construct IU were adapted
from Cheng (2011) & Wixom and Todd (2005). These items were taken as they were in the
above mentioned studies, with only a few terms changed to make them relevant to the context
of this study. For example, „I intend to use the system at every opportunity‟ from the study by
Wixom and Todd (2005), was changed to „I intend to use the BI system at every opportunity‟
(see Appendix A for a complete list of items).
3.4.3 Control variables
The study comprises five control variables: job-role, age, gender, education level and user BI
experience. Job-role, represented by item 2 of section B of the survey instrument, was created
to solicit the level of employment of respondents. To recapitulate, the BI system usage that is
of focus in this study is diagnostic usage, but given that there was another type of usage,
strategic usage, observed within the SA-Bank context, diagnostic usage had to be isolated
from strategic usage. Thus job-role served this purpose. With senior managers (executives
included) only using aggregated data, that is, data spanning business units and time, and lower
management levels using data that were bound by their respective areas of responsibility, job
role appeared to be a valid proxy for differentiating between usage types. In addition, age,
gender, education-level and user BI experience were also controlled in order to assess their
influence on the findings of this study (Gallivan, et al., 2005, Srite and Karahanna, 2006 &
Burton-Jones and Hubona, 2006).
3.5 Sampling method
From the discussion of the study context, 2000 users were identified as participants. With
partial list squares (PLS) identified as a primary data analysis technique for reasons discussed
in Section 3.9 below, a minimum of 150 responses was necessary (Hair et al., 2010). This
sample size is also a threshold for a study that is comprised of seven variables according to
these authors, a condition for this study. PLS literature, however, suggests that researchers
applying this technique should use the following as a rule of thumb for determining the
minimum sample size of a study: count the number of paths pointing to the different
constructs in a research model, pick the highest count and multiply by 10. This exercise
resulted in a minimum sample size of 40 responses being identified as necessary for the

31
statistical analysis of this study. Multiple regression, however, was also used as a validation
technique thus the sample requirement also had to meet the need for this technique over and
above that for PLS. A minimum sample size of 150 was thus an automatic choice for this
study, because it is a denominator of minimum data requirement for the two techniques to be
applied in the data analysis of the study (Pallant, 2007 & Hair et al., 2010). Taking into
account also that for IS studies, 22% is recorded as an average response rate (Sivo et al., 2006
& Yu, 2003), the study was therefore administered to 682 (150 x 22%).
3.6 Pre-study analyses
The survey instrument was pre-tested and pilot tested to ensure content validity (Moon and
Kim, 2001; Moore and Benbasat, 1991; Chau and Hu, 2002 & Straub, 1989). A pre-test was
done to ensure that each individual question in the survey instrument only identified with the
construct it theoretically related to and to guarantee that every set of items making up a scale,
collectively represented all aspects of the corresponding concept (Chau and Hu, 2002). A
pilot test was performed to examine the respondents‟ likely perceptions of the wording and
layout design of the content of the survey instrument (Leidener and Elam, 1995).
3.6.1 Pre-test
Ten industry experts with more than 2 years experience in the BI environment and 4
experienced academics participated in a pre-test exercise of the study.
3.6.2 Pilot test
A pilot test was run on a sub-sample that was representative of the primary sample of the
study. This test was conducted in the same manner as the approach which was used to
administer the main study (covered in Section 3.8).
3.7 Ethical clearance
Using Chau and Hu (2002) as guide because of the similarity in settings between the one in
their study and SA-Bank, before sending out the questionnaire, a request letter (see Appendix
B) to solicit participation was sent to managers of the various SA-Bank units which use the BI
system. This letter explained the purpose of the study, ensured confidentiality and anonymity
and explained the voluntary nature of the study, which are mandatory requirements for ethical

32
research conduct (Human Science Research Council, 2011). Consenting managers responded
with a list of potential participants. These unit members were subsequently sent the same
letter soliciting their participation. A database was created with names and corresponding e-
mail contacts of individuals who responded positively. This database is the same list that
formed the sample frame of this study. An ethical clearance with protocol number,
CINFO/1010, was obtained from the University‟s ethics committee and the letter declaring
approval of the ethical clearance application appears as Appendix C of this study.
3.8 Study administration
Freeonlinesurveys, an internet application for conducting surveys was employed as a survey
presentation interface to participants, and also as a data capturing instrument. The
questionnaire was e-mailed to the various subjects with a cover letter (see Appendix D) which
re-assured confidentiality, anonymity and voluntariness, and a link (see Appendix A)
referring participants to the Freeonlinesurveys interface which was configured to present the
study.
3.9 Preliminary data analysis
The following analysis was performed with IBM‟s SPSS trial version 18.
3.9.1 Data Screening
The data was screened for missing data entries and systematic response error patterns. In
addition, measurement items were assessed for outliers, linearity, homoscedasticity and
normality, which are assumptions for regression analysis. This exercise was performed as a
further data cleaning exercise in research (Hair et al., 2010).
3.9.2 Non-response bias test
One way to determine the existence of non-response bias is to check if there is a pattern in
responses between early and late respondents (Sivo et al., 2006). This same approach was

33
chosen for detecting non-response bias in this study, because it was convenient for one to rely
on results that were already available rather than using for instance, weighting adjustment,
which involves making telephone calls to people who did not want to respond in the first
place. A multi-variate analysis of variance (MANOVA) was used for this exercise (Doll et al.,
1998).
3.9.3 Factor analysis
Principal component analysis (PCA) with non-orthogonal rotation was used. Prior to this
analysis, however, the Bartlett test of sphericity (significance shown by a magnitude more
than 0.5) was performed to determine whether the measurement items of the study exhibited
sufficient correlations to warrant factor analysis to proceed. The latent root criterion was
therefore analysed to determine valid factors, with eigenvalues of greater than 1.0 used as cut-
off for factor selection. This method was supplemented by a scree test curve analysis to
guarantee a correct selection of factors (Pallant, 2007). Convergent and discriminant analyses
were assessed by the test for unidimensionality (Hair et al., 2010). Finally, Cronbach‟s alpha
was used to determine internal consistency (or reliability), and only magnitudes in excess of
0.7 were considered significant (Gefen et al., 2000).
3.9.4 Multicollinearity
To increase the chances of detecting the existence of collinear factors, tolerance and variance
inflation factor (VIF) values for independent variables were assessed (Grewal, Cote, and
Baumgartner, 2004) together with bi-variate correlation values (Zhang and Watts, 2008).
Multicollinearity was considered a significant problem when the tolerance value for any
variable was 0.1 or above, which corresponds to a VIF of 10 or higher, coupled with a
correlation value of 0.7 or higher between any pair of variables (Hair et al., 2010).

34
3.9.5 Common method bias
Common method bias, a term in research describing the distortion of findings due to asking
participants to respond to questions on both the dependent and independent variables
(Podsakoff, MacKenzie, Jeong-Yeon and Podsakoff, 2003), was assessed with Harman‟s
single factor analysis and the latent common factor approach. With Harman‟s single factor
approach, the data gathering method of this study was regarded to be free of common method
bias when one factor (the first factor in PCA) accounted for insignificant (less than 50%) of
covariance among research model measures (Podsakoff et al., 2003). The latent common
factor approach was applied to confirm the existence of trivial method bias. With this
approach, bias was considered problematic when the variance accounted for by a latent factor,
made up by all measurement items of this study, was less than 25 % (Zhang and Watts, 2008).
3.10 PLS data Analysis
SmartPLS version 2.0 was used for primary data analysis. PLS was chosen because it is
designed to maximise variance explained by predicting variables unlike its counterpart linear
structural relations (LISREL), which seeks to reproduce the observed covariance of constructs
(Hair et al., 2010). The intention of this study was to assess the extent to which factors impact
on the BI system usage, thus use of PLS satisfied this need of the study. Also, the exemption
of PLS from most of the assumptions of statistical analysis techniques has made it a preferred
choice for this study over the LISREL technique.
3.10.1 Construct validity and reliability
Convergent and discriminant validity were performed to confirm the findings of factor
analysis above. In addition, reliability checks were performed as a way of showing both
convergent validity and internal consistency of the scales (Strong et al., 2006; Pitt, Watson,
and Kavan, 1995). Convergent validity was evidenced when the loadings of related
measurement items were significant, above 0.7, on the construct they are theoretically
assigned to measure, and the construct reliability was likewise significant above 0.7 (Strong et
al., 2006). The test of significance was based on the t-values obtained from the bootstrapping
algorithm with a critical threshold of ±1.96 (Gefen, 2002).

35
One method of showing discriminant validity is by observing the average variance extracted
(AVE) of individual constructs (Igbaria, Guimaraes and Davis, 1995 & Nelson, Todd and
Wixom, 2005). With this approach, discriminant validity would have been shown when the
AVE for any construct is larger than that of correlated constructs in the research model
(Gefen and Straub, 2005; Compeau et al., 1999 & Nelson et al., 2005). For the purposes of
this study, however, a confirmatory method which entails analysis of latent variable
crossloadings was applied (Lewis et al., 2003). A construct reflected discriminant validity
when related items collectively indicated higher values for the construct they are theoretically
assigned to measure when compared with items from other constructs of the study. Internal
consistency, or reliability assessment, was statistically significant when the composite
reliability coefficients were 0.8 and above (Gefen et al., 2000).
3.10.2 Hypothesis testing
The strength of the model for predicting dependent variables was assessed with analysis of the
coefficient of determination (R2). A high R
2 was regarded as a sign for good model strength
(Gefen, 2002 & Hair, et al., 2010). Path coefficients were used to determine the strength
between dependence relationships (that is, relationships between independent and dependent
variables), while corresponding t-values were used as indicators for statistical significance
(Igbaria et al., 1995). A strong relationship was reflected by a combination of high coefficient
magnitude and the extent to which a p-value is above the statistical significance level.
Statistical significance was shown when t-values (of paths) reflected values in excess of ±1.96
or alpha levels of 0.05. (Gefen et al., 2000).
3.10.3 Control variable effects
An analysis of variance (ANOVA) and multivariate analysis of variance (MANOVA) were
used where necessary to test for any difference within the groups of the control variables of
this study. Significance testing of both analysis techniques followed the guideline given by
Hair, et al. (2010) & Pallant (2007).
3.11 Regression Analysis
Multiple regression analysis was performed as a confirmatory approach for the PLS
hypothesis test outcomes, especially to assess whether individual predictors impacted

36
consistently on the criterion when considered in isolation of other predictors (Gefen, 2002).
From this approach, a standard multiple regression analysis was performed in this study.
Conditions required for multiple regression analysis, namely, outliers, linearity,
homoscedasticity and normality, were performed as recommended in research (Pallant, 2007).
The multiple regression statistics of interest were the coefficient of determination (R2),
Adjusted R2, beta-coefficients and the ANOVA F ratio. Interpretation of the statistics
followed the same standards explained in the discussion for hypothesis testing above except
for the Adjusted R2 and ANOVA F ratio which was interpreted according to IS established
multiple regression standards.
3.12 Limitations
Limitations were inherent in the paradigm in which the study is based and data analysis
techniques which are used in this study. The method of incorporating social context to the
investigation of a study with only computer self-efficacy assessment, entails fixing other
environmental variables which could be exerting impact on the examined phenomenon
(Orlikowski and Baroudi, 1991). A distortion of findings therefore could arise when the
effects of these (unidentified) variables are non-trivial to the phenomenon of this study.
Finally, the limitations inherent in the statistical techniques used in this study (PLS and
multiple regression) such as the lack of agreement on the minimum required sample to
perform PLS (Jarvenpaa, Shaw and Staples, 2004), and the dependence of multiple regression
on data linearity, normality and homoscedasticity (Hair et al., 2010) set the upper bound for
the accuracy of the results of this study.
3.13 Conclusion
This chapter discussed the background of the procedure followed in gathering and analysing
data, and the paradigm in which this methodology is based. The next chapter outlines the
results of applying all the techniques discussed in this chapter.

37
CHAPTER 4: DATA ANALYSIS
4.1 Overview
This chapter presents analysis of the results of the study. The chapter begins with the stating
of the findings of pre-study instrument validation before the exercises of data cleaning and
normality checks are discussed. The make-up of responses in light of the control groups used
in this study is also stated. Thereafter, the outcomes of factor analysis and confirmatory factor
analysis are explained in the listed order. Furthermore, the outcome of the analysis of non-
bias tests (both response and method biases) are presented. Lastly, the results of hypothesis
testing are discussed followed by the stating of the conclusion of the chapter.
4.2 Preliminary instrument analysis
Pretesting the instrument highlighted that measurement items of two constructs, intentions to
use (IU) and computer self-efficacy (CSE), were overlapping, which necessitated rewording
of the items. The outcome also highlighted issues relating to the layout of the questionnaire
such as the order of measurement items making up the questionnaire. All the suggested
changes were subsequently included in the design layout of the study.
A pilot test was run after the necessary modifications mentioned above were made. Of the 33
participants who were selected to participate in the pilot study only 18 responded with
answers to all the questionnaire items, thereby yielding a 55% response rate. The results of
the pilot test highlighted a need for further modification of the instrument content, because of
the concern raised by some respondents that measurement items were being repeated in the
questionnaire. This was resolved by rewording some of the items and grouping related
measurement items together. An exploratory factor analysis was then run on the data resulting
from the pilot study which reflected that a four factor solution was represented by the data.
This result reflected a solution whereby TTF and PU loaded highly on one factor, an outcome
which Dishaw and Strong (1999) suggest is likely to happen when TTF and TAM are joined
to study an IS phenomenon. Therefore, a decision was made to proceed with the
administration of the study to the, 682, identified potential participants.

38
A questionnaire, built with the Freeonlinesurveys online application, was randomly sent to
individual participants by email. Due to time limitations, the length of the period of the study
was set to three weeks. After this period a spreadsheet was downloaded from the online
application, which reflected that 193 responses were received. Of the 193 who responded, 13
were at senior management level. These 13 responses were therefore excluded from further
use in statistical analysis (see details in Chapter Two), thus leaving 180 analysable cases.
4.3 Data cleaning
All the mentioned tests in this section were performed with SPSS (version 18).
4.3.1 Missing Data Analysis
The outcome of the analysis of missing data reflected that all research variables have less than
5% missing data with no observable systematic patterns on the values that are missing (see
Appendix E for table and pattern analysis outcome). Little‟s missing completely at random
(MCAR) test was insignificant (sig. = .239), which indicated that the occurrence of missing
data was completely random (Hair et al., 2010). Due to the low percentage of missing data of
variables, coupled with the randomness of missing data, all the missing entries were replaced
by mean scores of variables (Hair et al., 2010).
4.3.2 Outliers
The variables were first scanned for outliers with boxplots produced for each measurement
item. The results of this analysis reflected that one case was an outlier in 10 of the 28
variables, and thus was subsequently deleted from the data set. Bivariate tests with
scatterplots of measurement items grouped by scale, did not reflect any outlier. A multivariate
inspection of outliers of all items with the Mahalanobis D2 measure further highlighted 5
cases with magnitudes beyond the critical value of 24.32 applying a guideline by Pallant
(2007). The five cases were also removed from further analysis. Finally, descriptive statistics
were run for each of the measurement items and the table of means reflected that extreme
values were not posing any serious effects, since the mean and the 5% trimmed-mean scores
of all measurement items only differed by small margins. The similarity of the above
compared means was also an indication that variable normality would be less impacted by
further modification relating to outliers (Hair et al., 2010).

39
4.4 Testing for assumptions
4.4.1 Linearity
Scatterplots were run for items of each construct to assess inter-item linearity between
theoretically related measurement items of this study. Analysis of the outcome did not reflect
any deviation from linearity except for item DT3 which appeared to have a non-linear
relationship with the rest of the items measuring decision task characteristics. This item was
then deleted from further analysis (Gefen et al., 2000). A sample of one of the bivariate
scatterplots produced in this analysis to inspect linearity is attached as Appendix F of the
study. The rest of the scatterplots reflected a similar trend to that depicted in the referred
appendix, suggesting that the required state of linearity was met by the items retained for
further statistical exploration.
4.4.2 Normality
Normality was assessed with normal probability plots, histograms and statistical tests. Normal
probability plots indicated no serious violation of normality of the measurement items.
Histograms with normal curve on the other hand, showed deviation of measurement items
from normality. This deviation was also noted from analysis of the statistical values for
kurtosis and skewness associated with the items. This analysis reflected that skewness values
for all but two measurement items were above the critical value of ± 1.96 recommended by
Hair et al. (2010). Further removal of cases which appeared as outliers from measurement
items of concern did not result in any improvement on the magnitudes of kurtosis and
skewness. Thus these cases were restored in the data set. Appendix G reflects a normal
probability plot and a histogram of a decision task characteristics item, DT2, which reflected
skewness and kurtosis values of -2.10 and -1.85 respectively. All other items reflected a
similar trend of normality with the exception of PEOU1, BIS2 and CSE3, which had both
skewness and kurtosis values extremely out of bounds. These items were removed from the
measurement item set due for further analysis.
Two issues highlighted by Hair et al. (2010) on normality informed the decision that the
observed violation of normality of the remaining measurement items would not distort the
findings of multivariate analysis. One, the effective sample of the study was way above 50 (at

40
174), the implication is that the impact of non-normality would be minimal. Two, with the
sample size of the study considered medium, and the modest violation of normality which
was also mainly due to skewness, the data did not pose threats of outcome distortion.
4.4.3 Homoscedasticity
The scatterplots produced in the linearity sub-section above were further inspected for the
presence of heteroscedasticity. Bivariate scatterplots of measurement items for each scale
plotted against one another resulted in points shaping up to resemble an imaginary rod-like (or
cigar) shape, suggesting homoscedasticity (Leidener and Elam, 1995). This observation was
true between items grouped per scale for all constructs except for plots of items constituting
the computer self-efficacy (CSE) scale. Therefore, CSE items reflected heteroscedasticity
with points that were randomly scattered on the plot (Hair et al, 2010). Appendix F in
addition to delineating linearity also reflected what was considered as a homoscedastic
relationship in this study according to the same authors. The modest violation of
homoscedasticity as reflected by CSE items was expected since the non-normality of these
items was due to skewness (Hair et al., 2010). Thus all the remaining measurement items
were retained for further analysis.
4.4.4 Correlation analysis
A correlation table was computed for all measurement items, and comparisons between
related items indicated statistically significant values of the Pearson product moment (r)
(Pallant, 2007). The corresponding r values were also greater than the threshold of 0.3 as
suggested by the same author. One perceived usefulness item, PU1, however correlated
strongly (r > 0.7, sig. = 0.000) with items of perceived decision task – BI system fit, DBF2
and DBF4, implying that PU1 could be measuring the perceived decision task – BI system fit
concept instead of perceived usefulness (Gefen, 2002). Therefore, it was deleted from the
measurement item set intended for multivariate analysis. A factor analysis was then
performed for each construct to determine the variance explained by each item. This value
was above the threshold of 60% for all items, therefore all items remaining thus far were
retained for the next step of analysis.

41
4.4.5 Multicollinearity
After removal of PU1 as discussed above, all non-related measurement items (that is, items
from different theoretical constructs) showed low to medium strength (r < 7, sig. = 0.000)
correlations, an indication that multicollinearity was insignificant in this study.
4.5 Respondent composition analysis
Table 1 lists the make-up of the responses in terms of the control groups that were focused
upon in this study. In terms of the three categories of seniority (or job levels) no noticeable
difference was observed towards the intention to use a BI system at SA-Bank. Vandenbosch
and Huff (1997) have, however, shown that usage of a decision support system differs based
on job characteristics. Nonetheless, the similarity in usage across the seniority groups of this
study could have been caused by the extent to which the decision task profiles of users
Table 1: Response group-breakdown
Group Category Percentage
Seniority Junior managers 30.9%
Middle managers 32.6%
Non-managers 36.6%
Age 20 to 30 25%
31 to 40 31.7%
41 to 50 27.2%
51 to 60 12.2%
Experience 1 to 2 21.2%
2.1 to 4 32.8%
4.1+ 38.7%
Gender Males
Female
47.6%
52.4%
Education Completed school 35.6%
Completed a skills course 29.3%
Bachelor degree 13.8%
Master‟s degree 2.1%
across these groups were similar. In other words, although the seniority groups differed in
terms job description, they were however similar in terms of task requirement. Perhaps

42
analysis of usage trends inclusive of the most senior category, ignored in this study, could
have supported the suggestion by Vandenbosch and Huff (1997) since the scope of decision
tasks would have been widened by this inclusion.
A surprising outcome was the insignificant empirical difference among the categories of age
on all the variables of the study. The influence of age on IT usage has been shown, dating
back to studies such as the one by Zmud (1979) from which it was suggested that young IT
users behave differently from old IT users towards the adoption of IT. Current studies still
suggest the view that age has a significant impact on usage intention (Burton-Jones and
Hubona, 2006), with younger users more inclined to use technologies than older users. The
similarity in behaviour across age categories could have been due to fact that the BI domain at
SA-Bank seldom changes, thus allowing old users sufficient time to adjust between new BI
change initiatives. The authors (Burton-Jones and Hubona, 2006) also reflected in their
findings that education has a positive effect on IT usage. At SA-Bank, however, education
had no impact on usage. Perhaps knowledge acquired through formal education plays no role
in this organisation, but experience acquired with the length of service in this institution. Or it
could also be that the decision tasks require no additional knowledge from users other than
the direct interpretation of data towards decision task completion (Burton-Jones and Hubona,
2006).
Gefen and Straub (1997) & Venkatesh and Morris (2000) mention that differences in gender
have varying effects on IT usage. There was, however, no sign of such behaviour on the
gender categories of this study. Both studies showed that women are less inclined to
familiarise themselves with new technology, while man were keen to adopt or learn new
technological features. This study is based on a BI system which has been in place for a long
time, suggesting that women at SA-Bank could have long overcome the resistance of adopting
a BI system, hence showing behaviour that is similar to their male counterparts.
Lastly, experience is the only group which had observable different behaviours across its
categories. As expected, computer self-efficacy appeared to be increasing with the number of
years spent using the BI system at SA-Bank (Compeau and Higgins, 1995). Further analysis
showed that the relation between experience and the decision task characteristics (DT)

43
construct was contrary to findings of past IS studies (Venkatesh and Morris, 2000). Users at
SA-Bank found their decision tasks to lack clarity and more dependent on colleague
interaction as they gained more experience on the BI system. This could be attributed to
failure of the BI system to meet the changing business need (over time) or a limitation in
functionality of the BI system which becomes more visible as users gain knowledge of both
the system and the business environment in which they operate (Venkatesh and Morris,
2000).
4.6 Factor analysis
Following Hair et al.‟s (2010) guideline for deriving a factor solution in research, principal
component analysis was performed with SPSS version 18, and confirmatory factor analysis
was performed with the partial least squares software application, SmartPLS version 2.0.
4.6.1 Principal component analysis (PCA)
One of the required conditions for factor analysis, correlation, was satisfied as per the analysis
of sub-section 4.4.6. Furthermore, other required conditions of exploratory factor analysis
were performed after the first output of PCA with Varimax rotation was computed from
SPSS. The Bartlett‟s test of Sphericity was statistically significant, indicating factorability of
the correlation matrix of this study (Moon and Kim, 2001) and the Kaiser-Meyer-Olkin value
was 0.891 showing adequate sampling (Pallant, 2007 & Moon and Kim, 2001). In addition,
adequate sampling was inspected with the analysis of the ratio of sample to variable. This
ratio exceeded the minimum of 5:1 at 7:1 given an absolute sample size of 174 and 7
variables (Hair et al., 2010). To a reasonable degree of error all the necessary assumptions
were met for a PCA analysis to be performed.
Analysis of a Varimax rotated matrix indicated that PU items loaded significantly (above
0.45) on one factor where DBF items loaded the highest and on another factor where only PU
items loaded. Thus these items were removed and factor analysis was computed again (Hair et
al., 2010). A convincing structure emerged after all BIS items were removed in addition to the
deletion of PU items, following similar reasoning of cross-loading analysis. A latent root
criterion method showed that the data represented a 4 factor solution (with eigenvalues
greater than 1) explaining 72.4% of total variance. Analysis of the scree test plot (see

44
Appendix H), however, indicated the possibility of a five factor solution. Therefore, risking
an error of inclusion, five factors were forced with a Varimax rotation to obtain a solution
which explained 79.6% of total variance (Straub, Boudreau and Gefen, 2004). The five scales
were analysed for reliability and the outcome suggested that better reliabilities for factors 3
and 5 (in Table 2 below) could be obtained if items IU1 and DT4 were removed. PCA was
recomputed taking this suggestion into account and 82.9% of total variance was explained by
factors made up of the remaining items. Table 2 shows the results of a PCA with Varimax
rotation (which converged after 6 iterations). Items loaded high on their respective factors,
thereby showing unidimensionality (Hair et al., 2010). By reflecting unidimensionality, the
constructs had also indicated both convergent and discriminant validity (Gefen et al., 2000).
Also shown in Table 2 are the Cronbach‟s alphas for the 5 scales which resulted from PCA.
The magnitudes indicated that the scales are reliable with values above the 0.7 threshold
given in quantitative IS studies (Straub et al., 2004).
Table 2: Varimax rotated component matrix a
Variable Factor
1 2 3 4 5
DBF1 .811
DBF2 .810
DBF3 .801
DBF4 .714
CSE1 .896
CSE2 .830
CSE4 .820
PEOU2 .742
PEOU3 .792
PEOU4 .796
IU2 .855
IU3 .839
IU4 .807
DT1 .820
DT2 .798
Cronbach‟s
Alpha
.907 .821 .919 .925 .812
a Items, BIS2, CSE3, DT3,IU1, PEOU1 and PU1 were not considered due to PCA analysis and data abnormality explained in
the data cleaning section.

45
4.6.2 Confirmatory factor analysis (CFA)
CFA was shown applying three approaches, one approach to determine convergent validity
and two approaches for discriminant validity. Convergent validity was shown with the
analysis of factor loadings of related items. Meanwhile discriminant validity was shown with
the analysis of item cross-loadings, and average variance extracted (AVE) together with the
construct correlation matrix. The research model of the study was created in SmartPLS
without items BIS2, CSE3, DT3, IU1, PEOU1 and PU1 for reasons explained in the data
cleaning and exploratory factor analysis sections above.
Table 3: Loadings and cross-loadings of the measurement model a
Variables BIS CSE DBF DT IU PEOU PU
BIS1 0.768 0.039 0.545 0.449 0.417 0.501 0.496
BIS3 0.812 -0.111 0.600 0.524 0.439 0.513 0.616
BIS4 0.856 -0.197 0.666 0.548 0.523 0.613 0.665
CSE1 -0.112 0.798 -0.106 -0.077 -0.087 -0.307 -0.160
CSE2 -0.050 0.843 -0.062 -0.049 -0.074 -0.232 -0.155
CSE4 -0.155 0.805 -0.168 -0.188 -0.095 -0.191 -0.174
DBF1 0.687 -0.154 0.894 0.536 0.599 0.621 0.726
DBF2 0.669 -0.156 0.912 0.499 0.676 0.650 0.759
DBF3 0.699 -0.091 0.870 0.504 0.561 0.628 0.693
DBF4 0.693 -0.177 0.868 0.565 0.630 0.635 0.762
DT1 0.560 -0.184 0.544 0.869 0.581 0.501 0.641
DT2 0.603 -0.168 0.563 0.873 0.545 0.544 0.620
IU2 0.502 -0.054 0.569 0.525 0.878 0.528 0.633
IU3 0.557 -0.158 0.644 0.552 0.938 0.643 0.741
IU4 0.527 -0.113 0.631 0.597 0.916 0.593 0.732
PEOU2 0.631 -0.304 0.679 0.477 0.629 0.927 0.734
PEOU3 0.617 -0.386 0.585 0.547 0.567 0.906 0.649
PEOU4 0.608 -0.289 0.592 0.461 0.569 0.886 0.654
PU2 0.677 -0.218 0.711 0.643 0.705 0.666 0.921
PU3 0.687 -0.160 0.747 0.655 0.742 0.649 0.947
PU4 0.686 -0.167 0.773 0.550 0.707 0.764 0.850
a Items, BIS2, CSE3, DT3,IU1, PEOU1 and PU1 were not considered due to PCA analysis and data abnormality explained in
the data cleaning section.

46
The PLS algorithm was then executed to generate factor loadings. The item loadings of
related items were above the threshold of 0.7 suggested by Gefen et al. (2000) & Straub et al.
(2004). The outcome of CFA, shown in Table 3, reflected high loadings of related items and
no sign of serious cross loadings. Significance testing with the SmartPLS bootstrapping
algorithm indicated that the t-values are greater than the critical value (±1.96), which
suggested that all items loaded statistically significantly on their respective constructs. Thus
discriminant validity was exhibited by all analysed scales.
Table 4: Correlation of latent constructs and the square root of AVE
Variable Mean
(STD)
Composite
Reliability
BIS CSE DBF DT IU PEOU PU
BIS 5.160
(1.195)
0.894 0.824
CSE 2.549
(1.391)
0.895 -0.148 0.825
DBF 5.710
(1.076)
0.936 0.775 -0.164 0.887
DT 5.074
(1.078)
0.821 0.631 -0.154 0.594 0.738
IU 5.812
(1.060)
0.936 0.609 -0.132 0.697 0.645 0.887
PEOU 5.604
(1.098)
0.932 0.694 -0.297 0.715 0.545 0.664 0.880
PU 5.641
(1.178)
0.951 0.751 -0.207 0.830 0.692 0.800 0.759 0.910
Table 4 shows among other values (discussed shortly) the composite reliability of constructs,
which according to Gefen et al. (2000) is the Fornell and Larcker‟s (1981) equivalent measure
to Cronbach‟s alpha. Magnitudes of composite reliabilities were well above the threshold of
0.7 suggested by Park and Keil (2009), an indication that the scales were reliable measures of
what they were theoretically assigned to measure. Also shown in this Table 4 are the mean
scores and standard deviations for each scale as derived from SPSS version 18. The square
root of AVE with latent construct correlation criterion also suggested that all scales have
discriminant validity (see bold figures in Table 4 below). This result is evidenced by the fact
that the square root of AVE for any specific construct is greater than that of correlated

47
magnitudes. Worth noting was the similarity between the PCA and CFA structures. Even
though both convergent and discriminant validity were evident from the outcome of CFA,
Table 3 reflected high correlations between BIS and DBF, and DBF and PU a result which
has seen BIS and PU items removed from principal component analysis.
4.7 Non-bias test outcomes
A „Response time‟ control group was created to separate early respondents from late
respondents. All responses received within the first week of study administration were
grouped as early respondents and the rest as late respondents. Early respondents therefore
constituted 58% (N = 101) of responses, while late respondents made up the balance of 42%
(N = 73). A MANOVA analysis was performed with response time as an independent
variable. Box‟s M test and the Levene‟s test, both used to assess homogeneity of variance, did
not reflect violation of this assumption for the response time groups, „week 1‟ and „week 2 to
3‟, both showing sig. < 0.001 and sig. > 0.05 respectively (Pallant, 2007). Analysis of a
MANOVA then indicated that there was no significant difference between early and late
respondents, Wilks‟s Lambda = 0.943, p = 0.382, thereby suggesting that the study was free
of non-response bias.
A Harmon‟s single factor test indicated significant effects of common method-bias, because
the first factor in PCA analysis accounted for more than 50% of total variable variance
(Podsakoff et al., 2003). As an additional validation approach, a common factor was created
and added to the measurement model in PLS. The change in variance explained was 0%, an
indication of non-method bias according to Zhang and Watts (2008). With the contrasting
results, common method-bias (CMV) appears to be a concern in the study even though one
method, the common method factor, showed a positive result. There is, however, limited
documentation about the second method in IS literature and it is only used in this study for its
ease of execution. On the other hand, the Harmon‟s single factor is known for weaknesses
which could have negatively influenced the findings of the CMV test in this study, one being
lack of precision (Malhotra, Kim and Patil, 2006). Overall, the CMV tests performed in this
study resulted in an inconclusive outcome.

48
4.8 Hypotheses testing
4.8.1 PLS analysis
The hypotheses were tested using PLS with all constructs modelled as reflective variables
(Straub et al., 2004). A sample of 174 entries was used for this analysis. This sample size
exceeded the recommended sample size required for a PLS analysis (Gefen et al., 2000). The
final structure of a CFA was computed to generate output to test the hypotheses of the study.
The results of the analysis are summarised in Figure 5 below. Standardised coefficients are
shown on the paths of the diagram with corresponding t-values in brackets.
** significant at the 0.01 level (2-tailed).
* significant at the 0.05 level (2-tailed).
supported.
not supported.
The determinants proposed in this study of BI system usage predicted 65% (R2
= 0.65) of
intention to use (IU) a BI system at SA-Bank, an improved prediction when compared to past
similar IS studies (Strong, et al., 2006 & Dishaw and Strong, 1999). Of the four theoretically
proposed predictors, DBF (β = 0.07, t = 0.48), CSE (β = 0.06, t = 0.81), PU (β = 0.65, t =
0.17* (2.33)
0.68** (9.42)
0.65** (5.68)
0.14 (1.25)
0.34** (4.61) 0.72** (11.98)
0.59** (8.31)
0.06 (0.81)
0.07(0.48)
-0.04 (0.61)
DT
BIS
DBF
R2 = 0.62
CSE
PU
R2 = 0.75
PEOU
R2 = 0.51
IU
R2 = 0.65
Figure 5: Results of PLS analysis

49
5.68) and PEOU (β = 0.14, t = 1.25), of IU only PU was statistically significant, supporting
hypothesis H2. The non-significance of the impact on IU of DBF, PEOU and CSE indicated
lack of support for hypothesis H4a, H1 and H5b respectively. Furthermore, PU was
significantly affected by PEOU (β = 0.34, t = 4.61) and DBF (β = 0.59, t = 8.31), thereby
supporting hypotheses H3 and H4b respectively. Both predicted 75% (R2
= 0.75) of the
perceived usefulness of the BI system at SA-Bank. DBF (β = 0.72, t = 11.98) explained 51%
(R2
= 0.51) of perceived ease of use, an indication of support for hypothesis H4c. 62% of the
variance in DBF was explained by CSE (β = -0.04, t = 0.6111.98), DT (β = 0.17, t = 2.33) and
BIS (β = 0.68, t = 9.42), an indication of support for hypotheses H6 and H7 and lack thereof
for hypothesis H5a.
4.8.2 Regression analysis
A standard multiple regression was performed for two models as follows: One: DBF, PU and
PEOU as independent variables of IU, a dependent variable. Two: DT and BIS as independent
variables and DBF as a dependent variable. After a preliminary analysis, of linearity with P-P
plots, and homoscedasticity with residual scatterplots, no violation of these assumptions was
detected for both proposed models (see Appendix I & Appendix J for the histograms and
scatterplots of both models respectively). The tolerance and variance inflation factor (VIF)
magnitudes did not indicate any serious problems of multicollinearity, tolerance values were
greater than 0.1 and VIF less than 10 (Hair et al., 2010). The results of the two regressed
models are shown in Table 5 below. On the first model, the three factors explained 57% of
IU, F (3, 173) = 38.46, p < 0.05 with only PU impacting significantly on IU. When DBF was
considered separately it significantly explained 43% of IU, β = 0.657, t = 11.44 and sig. <
0.05. Furthermore, PEOU assessed as the only independent variable to IU explained 36%, β =
0.597, t= 9.763 and p < 0.05. A test to determine whether DBF and PEOU have independent
individual effects on PU was positive, with DBF still appearing to be a stronger predictor of
PU than PEOU. Analysis of the second regression reflected that 61% of DBF was explained
by DT and BIS, F (2, 173) = 132.52, p < 0.05.

50
Table 5: Multiple regression results
Dependent
Variable
Independent
Variable
R2 β t-statistic Sig. Mean STD
IU 0.57 5.84 1.080
PEOU 0.098 1.326 0.187 5.57 1.142
DBF 0.098 1.082 0.281 5.69 1.089
PU 0.598 6.083 0.000 5.63 1.480
DBF 0.61
DT 0.212 10.270 0.000 4.98 1.337
BIS 0.630 3.453 0.001 5.18 1.890
4.8.3 Summary of hypothesis testing
Table 6 below summarises the hypothesis testing outcome from PLS. Of the 10 hypotheses
proposed in the theoretical section of the study, six were supported. An unusual outcome was
the lack of support for H1, which deviated from most past quantitative IS research (Venkatesh
and Davis, 2000 & Igbaria et al., 1995). Also uncommon in quantitative IS research was the
unsupported paths between DBF and IU, and CSE and IU. Dishaw and Strong (1999) found
that the fit between a computer system and task has a significant impact on the intention to
use a computer, while Strong et al. (2006) have later shown that computer self-efficacy does
the same to the intention to use.
Table 6: Hypothesis test summary
Research Model Path Hypothesis Outcome
PEOU => IU H1 Unsupported
PU => IU H2 Supported
PEOU => PU H3 Supported
DBF => IU H4a Unsupported
DBF => PU H4b Supported
DBF => PEOU H4c Supported
CSE => DBF H5a Unsupported
CSE => IU H5b Unsupported
DT => DBF H6 Supported
BIS => DBF H7 Supported

51
4.9 Conclusion
The chapter covered the discussion of all statistical examinations performed for the study.
Beginning with data normality checks, the data collected was found to deviate from univariate
normality rules. Parametric tests were still performed, however, because multivariate
normality was satisfied by the data. The findings of hypothesis testing as reflected by the
main analysis technique of the study, PLS, reflected that 60% of the paths in the research
model were supported while the rest did not lend support. This result was supported by linear
regression analysis with which discrete analysis of relationships was also performed. This
analysis of individual relationships suggested that except for CSE, all the factors proposed to
be determinants of intention to use were statistically significant.

52
CHAPTER 5: DISCUSSION
5.1 Overview
This chapter discusses the results of data analysis presented in chapter four in light of the
theoretical framework of the study. In this discussion, the outcome of data analysis is linked
back to the three objectives listed below, which were first introduced in Chapter One of the
study:
What are the combined decision task and BI system characteristics that lead to BI system
usage?
What are the user capability characteristics that influence BI system usage?
What are the beliefs that influence decision makers to use a BI system?
Each variable making the research model of the study is discussed individually, specifically
assessing the confidence with which scales (measuring these variables) can be regarded as
valid and reliable, and the meaning of relationships among constructs in light of BI system
usage determinants at SA-Bank. A summary of factors and their order of importance are
thereafter outlined, because the aim of the study was to assess determinants of BI system
usage. Finally, taking all discussion covered in the chapter into account, a conclusion is
presented.
5.2 Validity and reliability
The scales reflected an outcome which did not deviate significantly from past IS studies.
Guided by scale validity and reliability thresholds recommended for IS studies in Hair et al.
(2010); Gefen et al. (2000) & Straub et al. (2004), this outcome also suggested that the scales
were both reliable and valid with the exception of decision task characteristics (DT). More on
the reliability and validity of DT is covered in the discussion of this scale below. Therefore,
the extent to which the context of this study differed from other contexts where the same
scales had been applied successfully, this outcome extends validation of the scales in the
context of SA-Bank.

53
Common method variance, which is measurement error due to collecting data of both the
dependent and the independent variables at one point in time (Malhotra and Grover, 1998),
resulted in inconclusive findings, which therefore limited the certainty that the results were
indeed subjected to insignificant measurement error. Non-response bias, which is the
distortion of findings due to withdrawal from study of participants who share common
characteristics, was not violated, indicating that respondents could have been representative of
the sample (King and He, 2005).
5.3 The dependent variable – Intention to use
The scale outcome reflected that BI users at SA-Bank are inclined to increase their use of the
BI system in the near future. This extends the suggestion that the system has always been
viewed in a positive light within the firm.
The model of the study explained 65% of the variance of intention to use a BI system, an
above average explanation when contrasted to past IS studies (Burton-Jones and Hubona,
2006; Gefen and Straub, 1997 & Venkatesh and Morris, 2000). Such a high value could be
attributed to applying the model to study a BI system which is a problem solving aid by
design. This follows from Goodhue‟s (1998) three step view of problem solving: user
conception of a problem; user development of a mental belief about the capability of the
system and a user decision whether to (or not to) engage the technology to solve the problem.
The model applied in this study captured the capability of the BI system such that users were
enabled to judge on system capability in light of decision problems. Such measurement (of
both system and task) was indeed inevitable for the investigation of this study, where users
were extremely depended on aggregated data from a decision support system to complete
decision tasks. So the degree to which the BI system was useful or easy to use was assessed
based on the function and outlook of a technology which was synonymous with task
execution or problem solving. Thus the improved explained variance could imply that the
model matched a study where a technology is an integral part of problem solving. Dishaw and
Strong (1999) demonstrated that a measure of the alignment of computer system and task was
a significant factor towards determining whether a system is useful or is easy to use. This
further suggested that a measure which focuses on technology and task enhances the

54
measurement of technology use, better still for a setting such as that of SA-Bank because of
the high dependence of users on decision support systems. Finally, although this result is
higher than commonly seen in IS studies, it is nevertheless comparable to a few available
studies such as Cheng (2011) which reflected a variance of 64% explained for IT usage. This
study was similar to Cheng‟s (2011) study in that it focused on specific system features like
response time and output quality, towards IS adoption, but differed in that it was based on
constructs derived from three theoretical frameworks. Therefore, another reason high variance
was explained in this study could be that users were able to identify with the BI system
qualities that were analysed, that is, the investigated system features overlapped to a certain
extent with the actual features possessed by the BI system at SA-Bank.
The intention to use a BI system correlated significantly with all the other variables of the
study, and the strongest correlation was with perceived usefulness (PU). This result was
consistent with the outcome of regression analysis where PU was the only variable exerting a
significant direct effect on BI system usage over the perceived decision task – BI system fit
(DBF), the perceived ease of use (PEOU) and computer self-efficacy (CSE). A similar effect
of PU on the intention to use a technology has been shown in Venkatesh and Davis (2000) &
Wixom and Todd (2005) among other studies in IS. Thus validation of the relationship
between the two constructs, perceived usefulness and intention to use, was extended for a BI
system. This outcome highlighted that BI system usage strongly depended on a system which
enhanced performance of decision tasks and/or which delivered information that was
pertinent to user requests, PU. BI system usage still depended on the alignment of the system
to decision tasks (DBF) and the ease with which the system was operable (PEOU), because
they reflected a significant effect in the absence of PU, while computer self-efficacy remained
insignificant even in this case. The overall outcome of the assessment of factors with direct
effects on IU, however, contradicts the hypothesis that, CSE, DBF and PEOU are all factors
in the presence of perceived usefulness, also an uncommon finding in IS (Wixom and Todd,
2005 and Strong et al., 2006). Nonetheless, the lack of influence of the three factors could be
explained following trends related to their application in IS research. DBF was reported by
Dishaw and Strong (1999) to overlap with perceived usefulness (PU), a likely cause of the
weak impact it reflected on IU in this study. Perceived ease of use was reported in IS research
to exert a significant impact on IU, but the effect was lower than that shown on perceived

55
usefulness (Venkatesh and Davis, 2000). Thus the strength of the relationship between
usefulness and IS usage shown in IS adoption implies that the effect of PEOU on the intention
to use a BI system is subsumed by the effect of PU as a co-factor. This is also evidenced by
the high correlation between perceived usefulness and perceived ease of use. Finally,
computer self-efficacy (CSE), the perceived ability of using a technology (Compeau and
Higgins, 1995), is dependent on the usage attitude in the environment of adoption as much as
on how it influences technology usage (Thong et al., 2004). The high usage reflected by the
variance explained in this study, imply that users were not bothered by their ability to operate
the BI system, resulting in the insignificance of CSE.
5.4 Independent variables to IU (Direct effects)
5.4.1 Perceived usefulness (PU)
Consistent with the suggestion that the model deployed in this study suited the nature of the
study, a higher variance than reported in past IS studies was obtained for PU (Wixom and
Todd, 2005 & Chau and Hu, 2002). This variance was significantly explained by two factors,
decision task – BI systems fit (DBF) and perceived ease of use (PEOU), proposed to have
direct effects on PU. This outcome indicated that the perceived usefulness of the BI system at
SA-Bank depended on how easy it was to operate its functions, and the extent to which it
aligned to decision tasks. In other words, the BI system required no additional effort from
users other than what was necessary to complete decision tasks, and it satisfied user
information requests. The greater influence of DBF, however, implied that ensuring the
system meets the needs of decision tasks was more important to the BI user community than
simplifying user interaction with the system. It was still important, however, that users
execute decision tasks with minimum effort possible, given that PEOU still had a significant
impact on the usefulness of a BI system.
A search of top IS journals resulted in no BI study found which could be used as comparison
with the findings of this study. The closest study to the investigation performed was by
Wixom and Todd (2005), who showed that the satisfaction of users on the quality of
information of a data-warehouse has a significant and higher influence on PU than exerted by
the ease of using a system. In their study, the authors surveyed organisations which had data

56
warehouse systems that were already functional. The results came close to the variance of PU
explained in this study, but information satisfaction was used instead of DBF. Therefore, to
the degree which DBF as measured in this study compared to information quality as measured
by Wixom and Todd (2005), this study extended validation of the determinants of PU within
the SA-Bank context.
5.4.2 Perceived ease of use (PEOU)
PEOU was predicted by only one independent variable, namely decision task – BI systems fit
(DBF). Mathieson and Keil (1998) performed a similar study to assess the effect that DBF has
on the perceived ease of use. Similar to the findings of this study, the outcome of their
investigation showed that DBF was a significant predictor of PEOU, although with lesser
variance explained than in the present study. Therefore, this study extended validation that
DBF predicts the extent to which a system is easy to use, implying that at SA-Bank BI users
believed that the system was easy to use because it met the needs of BI executable tasks. This
is also the same view shared by Goodhue and Thompson (1995) that the effort a user spends
on completing tasks, PEOU, depends on the fit between system functions and task needs. The
difference in variance explained between the two studies could have been caused by a similar
suggestion that the model applied in this study suits a BI study.
PEOU reflected an insignificant influence on the intention to use a BI system, thus not
lending support to the hypothesis that it is a factor of BI system usage. As the only factor to
BI system usage, however, the assessment outcome reflected that it was a significant factor. It
is thus an important factor of BI system usage on its own. Supporting the same view is Vessey
and Galletta (1991) who stated that decision makers have limited capacity for processing
information towards making decisions, because more information than can be processed with
a human mind is normally input to decision making. Thus users are induced to search for
alternatives in an attempt to reduce the effort required by the process of decision problem
execution. Put in other words, whenever a user is faced with a decision problem, as much as it
will induce a search for a solution, the user also seeks to resolve the decision task with the
lowest effort possible. PEOU was thus a necessary requirement for BI system usage. In the
SA-Bank context it meant that, even though users were inclined to use a system because it
enhances performance of decision tasks (PU) over the view that it required minimum effort

57
during performance of tasks (PEOU) they, however, would still use a system for only offering
the benefits of PEOU. In BI terms, minimum effort, could translate to extracting data with the
least necessary set of keyboard strokes or mouse clicks, and data processing that minimises
duplication of effort.
5.4.3 Perceived decision task – BI system fit (DBF)
BI users at SA-Bank reported reasonable satisfaction about the degree to which the BI system
qualities matched decision task profiles. For this construct, items could not be stated without
capturing the essence of ease of use, of usefulness and of system adequacy (Dishaw and
Strong, 1999). Thus DBF highly correlated with perceived ease of use, perceived usefulness
and BI system characteristics, hinting a potential overlap between DBF and these mentioned
constructs.
It was not surprising that the three independent variables of DBF namely, computer self-
efficacy (CSE), decision task characteristics (DT) and BI system characteristics (BIS) also
predicted a variance higher than seen in past IS studies (Lin and Huang, 2008 & Strong et al.,
2006). Firstly, it is implied in Vessey and Galletta (1991) that CSE, DT and BIS are all
important determinants of the perceived fit between task and technology. Secondly, at SA-
Bank decision tasks and technology are inseparable at the level of usage (diagnostic usage)
considered in this study. Thus the improved variance could have been influenced by the
simultaneous effect of proposing correct determinants for DBF and applying measures that
befitted the setting of SA-Bank.
Two independent variables, decision task characteristics and BI system characteristics,
exerted a significant influence on DBF, with computer self-efficacy (CSE) being the only
insignificant predictor. This result was consistent with the low correlation that was observed
between CSE and DBF. Contrary to this result Strong et al. (2006) & Lin and Huang (2008)
have shown that CSE has a significant impact on DBF. The reported high rate of BI system
usage at SA-Bank, however, could have positively influenced user capability towards the BI
system, because behaviour from the environment positively affect computer self- efficacy
(Compeau and Higgins, 1995; Gallivan et al., 2005 & Thong et al., 2004).

58
Consistent with past IS studies (Lin and Huang, 2008 & Goodhue and Thompson, 1995) the
decision task characteristics (DT) and BI system characteristics (BIS) impacted significantly
on the perception of BI system and decision task fit (DBF). Emphasising this point is Vessey
and Galleta (1991) who suggested that presenting graphical data to users has different
consequences to delivering tabulated output, depending on user information needs. These
authors state that a user will comprehend a technology data presentation format that
corresponds to his/her mental framework of the likely solution for the decision problem. The
outcome of DBF determinants therefore extended validation of the task technology fit model
for the BI system usage study.
5.4.4 Computer-self efficacy (CSE)
The scale result has shown that SA-Bank employees are able to execute decision tasks
without help from BI technicians or user manuals. The importance of CSE in IS adoption has
been shown in many settings and for many technologies (Lin and Huang, 2008; Strong et al.,
2006 & Gallivan et al., 2005). Contradicting effects of CSE on usage were, however, found in
this study.
Computer self-efficacy (CSE) was expected to have a significant effect alongside the
perceived usefulness (PU) towards determining BI system usage, because of similar evidence
in past IS research (Strong et al., 2006). CSE, however, it neither showed a significant impact
on BI system usage nor on perceived decision task – BI system fit (DBF), even when
considered as the only factor to both the intention to use a BI system (IU) and DBF. Further
analysis reflected that the relationship between CSE and IU was consistent with the
hypothesised relationship between the two constructs in this study, that is, users capable of
executing the functions of the BI system would be inclined to use the system, while those who
are incapable would be disinclined to use it. Given that the effect was statistically
insignificant, however, implied that SA-Bank users were not concerned about their ability to
operate the BI system. One factor which could have contributed to CSE being a non-factor
was the positive attitude of users towards the BI system at SA-Bank. Users are likely to learn
to use a system from colleagues in an environment where the dominant attitude is positive use
(Gallivan et al., 2005). Another factor which could have also contributed to the insignificant
effect of CSE on IU was the length of time for which the system had existed at the time of

59
study (Koufaris, 2002). Users are likely to be anxious about their ability to use a technology
during the first few days of being exposed to it, while such anxiety is likely to diminish with
successive encounters (Compeau and Higgins, 1995). Even though it is tempting to include
the length of existence of the BI system at SA-Bank as another factor contributing to the
insignificance of computer self-efficacy (CSE), the lack of knowledge of how CSE would
have influenced BI usage when the system was first implemented, made this suggestion
inconclusive.
5.5 Independent variables to IU (Indirect effects)
5.5.1 Decision task characteristics (DT)
Only two items, DT1 & DT2, remained from a data reduction exercise performed in Chapter
Four. The two items were related to the dimension of task-routineness as given by Goodhue
and Thompson (1995). In addition, the scale formed by these two items was a significant
predictor of decision task – BI systems fit (DBF). A similar result was suggested by Ling and
Huang (2008) who has shown that the task-routineness dimension of DT was a significant
determinant of a knowledge management system. The fact that only two items formed the DT
scale in this study, however, suggested the possibility that the applied scale could have an
error of exclusion, because other aspects of task-routineness could have been omitted
(Churchill, 1979). Nonetheless, the degree to which properties of decision task characteristics
were captured by the DT scale, its validation was extended in this study. The outcome of this
scale suggested that users at SA-Bank executed decision tasks that are unstructured and non-
routine. Worth noting is that DT has also shown a high correlation with IU, a hint that it could
be another direct factor of BI system usage.
5.5.2 BI system characteristics (BIS)
If the collected data are anything to go by, a conclusion can be drawn that the system at this
organisation possessed qualities which to a certain extent aligned to the executed decision
tasks. Moreover, analysis of statistical outcome indicated that this variable is the most
important predictor of the fit between task and technology (DBF) for the BI system at SA-
Bank. This finding was consistent with past research (Wixom and Todd, 2005 & Lin and
Huang, 2008). At SA-Bank, the BI system was reflected to be that which responded quickly

60
to data request, was often available, had functions which could be adjusted to meet new
business demands and presented users with reliable data. These qualities were more
appropriate for decision task profiles that are unstructured and non-routine. As with decision
task characteristics, BIS had a high correlation with IU, hinting at a possibility that it could
have a direct effect on BI system usage as well. In addition, BIS also showed a high
correlation with PU, indicating that it also could have a direct effect on the perceived
usefulness of a BI system.
5.6 Putting it all together
With the context of generalising the findings limited to the bounds of SA-Bank and the
technology of focus being a BI system, the study resulted in the following outcomes as guided
by the objectives of the study:
Objective 1, the decision task characteristics were identified to be non-routine and
unstructured, and the corresponding BI system characteristics were identified to be
quick response to data request, consistent availability, flexibility and reliability.
Objective 2, none of the investigated BI user capabilities appeared to influence BI
system usage.
Objective 3, perceived usefulness, perceived ease of use and the perceived alignment
between decision task and technology all positively impacted on BI system use.
Although when all were considered at once, perceived usefulness was the only
variable to influence BI system usage significantly, however, they all had a significant
influence when considered individually. The order of the magnitude of influence
which they exerted on BI system usage followed the sequence in which they are listed.
Figure 6 below summarises the outcome of hypothesis testing performed in this study. Only
paths which were statistically significant are considered to suggest a model that could be
applied for further assessment of BI system usage determinants.
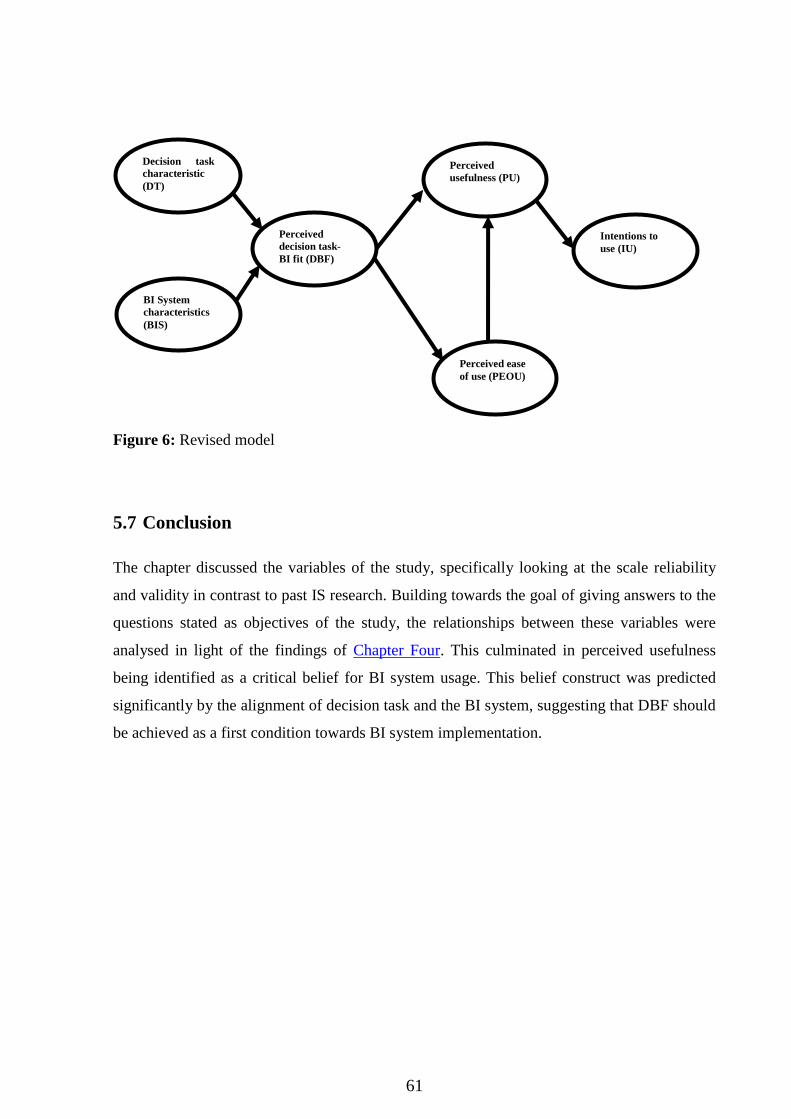
61
5.7 Conclusion
The chapter discussed the variables of the study, specifically looking at the scale reliability
and validity in contrast to past IS research. Building towards the goal of giving answers to the
questions stated as objectives of the study, the relationships between these variables were
analysed in light of the findings of Chapter Four. This culminated in perceived usefulness
being identified as a critical belief for BI system usage. This belief construct was predicted
significantly by the alignment of decision task and the BI system, suggesting that DBF should
be achieved as a first condition towards BI system implementation.
Decision task
characteristic
(DT)
BI System
characteristics
(BIS)
Perceived
decision task-
BI fit (DBF)
Perceived
usefulness (PU)
Perceived ease
of use (PEOU)
Intentions to
use (IU)
Figure 6: Revised model

62
CHAPTER 6: CONCLUSION
6.1 Overview
This chapter concludes the study by mapping the discussion of the findings to the identified
gap in IS research. The benefits accruing to both academia and practice are stated, while
highlighting areas in IS research which, if covered, promise to complement the extension of
knowledge achieved in this study. The discussion of the chapter is thus sub-divided into the
summary of the study, the contribution to theory, limitations, suggested further research and
managerial guidelines and, finally concluding remarks.
6.2 Summary of the study
The limited knowledge on business intelligence in the IS domain motivated this study with
primary focus on identifying factors which influenced BI system usage within SA-Bank. The
study applied constructs backed by three theoretical frameworks, task technology fit (TTF),
technology acceptance model (TAM) and social cognitive theory (SCT), to measure the
influence of BI system usage factors. Consistent with the tradition of cumulative knowledge
in the positivist paradigm, the research domain upon which this study is based, the study
intended to advance IS knowledge by the application of the constructs from the three
theoretical frameworks in a physical context, a financial firm – SA-Bank, together with a
technological context, a BI system. Thus IS knowledge extension was achieved by applying
these constructs in a seldom mentioned context in IS studies, which combines a financial
institution and BI technology (Petrini and Pozzebon, 2009; Lawton, 2006 & Lönnqvist and
Pirttimäki, 2006). Even though the identification of the determinants for BI system usage was
the main aim of the study, of equal importance was the investigation of the BI phenomenon in
the SA-Bank context.
The data collected for the study exceeded the minimum number of responses required for
partial least squares (PLS) analysis, a data analysis technique applied in this study.
Furthermore, a data reduction exercise resulted in all proposed scales in this study being
retained for statistical analysis. These scales were also measured with the recommended
minimum of three items (Churchill, 1979) with the exception of decision task characteristics
(DT), suggesting that except for DT the scales employed a greater likelihood of correctness in

63
measuring BI system properties (Malhotra and Grover, 1998). Analysis outcome reflected that
of all the proposed factors, only computer self-efficacy (CSE) was non-influential as a
determinant of both BI system usage, and the fit between BI system and decision task (DBF).
Only the usefulness of a BI system reflected significant impact on usage when all the factors
were considered together. Nevertheless, each one of the factors, perceived usefulness,
perceived ease of use, decision task – BI system qualities fit, excluding the non-significant
CSE, have shown significant impact when considered as the only determinants, a reflection
that they were all important determinants of BI system usage. The usefulness of a BI system
was in turn influenced by the fit between decision task and BI system (DBF) and perceived
ease of use (PEOU), emphasising that DBF and PEOU were mandatory factors of usage,
though they only had strong indirect effects when assessed alongside perceived usefulness as
a factor.
6.3 Contribution to research and theory
The application of the technology acceptance model (TAM) and task-technology fit (TTF) in
a merged form was shown in IS research to possess more strength for predicting technology
usage in many settings than when either model was considered individually (Dishaw and
Strong, 1999; Mathieson and Keil, 1998 & Pagani, 2006). Guided by such findings, the study
investigated the validity of the linked-up model for a BI system, an unusual approach for BI
technology investigations according to the outcome of literature review performed in this
study. Better still was the incorporation of the computer self-efficacy construct (CSE) to the
linked-up (TAM and TTF) model, a strategy that was motivated by the intention to analyse
qualities attributable to the social aspect of SA-Bank. As far as the literature review of this
study is concerned, very few studies applied the set of constructs as exploited here, despite a
combined assessment of the constructs for their IT usage prediction strength, suggesting that
they could complement one another for investigations similar to the one performed in this
study. A better explanation of usage was indeed obtained, possibly an indication of the
strength of the model. The narrow context of the study, however, limited generalising the
results across settings. Nonetheless, the high predicted variance of BI system usage hinted
that there could be theoretical value in joining the constructs towards studying a BI system as
performed in this study. For this reason the study extended validation of a model (of joined
64
theoretical frameworks) which further IS research can explore to enrich IS knowledge on BI
system usage.
Additionally, the study context, SA-Bank, extended the range of settings which were
exploited in IS research prior to performance of this study. The context of SA-Bank in light of
the findings of the study also forms a basis upon which financial institutions in South Africa
can advance the knowledge of business intelligence. Finally, the methodological approach
adapted from Gefen (2002) of backing PLS analysis with regression analysis, suggests that
more insight could be discovered by this analysis approach. This can be evidenced by the fact
that some constructs (such as the perceived ease of use) which appeared to be non-factors
with PLS became significant factors with regression analysis.
6.4 Limitations of study
Limitations were identified as stated concisely in this discussion. Using e-mail to administer
the study could have resulted in coverage error, an error arising due to reaching out to only a
portion of the intended potential participants (Sivo, et al., 2006). Surveys are known for wide
area coverage in research (King and He, 2005), but there was however no guarantee that
every characteristic of the population at SA-Bank was covered with the survey distribution
technique of this study. One limitation therefore is inherent in relying on the assumption that
every aspect of influence on the investigation of this study was captured by the study method
from the SA-Bank population. Nonetheless, whether the above was the case needed a separate
and independent sample from that which was analysed in this study, an exercise which could
not be afforded due to resource and time constraints. Internal validity, the degree to which the
change of the dependent variable is caused by a corresponding change on the independent
variable (Malhotra and Grover, 1998), could not be assured by this study alone. A study
which is only performed by gathering data at a single point in time is likely to only be
showing the existence of correlation among factors and not causation (Gefen, 2002). Thus the
causal links depicted in the research model of the study still remain hypothetical. Also,
according to this author, the use of a self-reported measure may have contributed to the high
variance explained in this study. Furthermore, the revised model could be applicable to only
the type of usage, diagnostic usage, investigated in this study and it could also be valid in

65
settings where the condition of usage is non-mandatory as is the case at SA-Bank. Finally, the
use of e-mail to gather responses could have skewed the results, because the origin of these
responses was not traced.
6.5 Future research
The revised research model needs to be piloted in other financial institutions in South Africa
in order to verify whether it equally applies in these institutions. This could enable a
conclusion to be drawn about the relationship between the model and financial institutions in
general. Perhaps a trend could also emerge which enables organisations spanning space and
industries to utilise this solution. Research is also needed to verify whether the model equally
applies to organisational contexts that can be differentiated by the brand of technology which
they apply for business execution. SA-Bank, for example, applied Oracle technologies for all
business operation that was related to IT processing, and thus further research was needed to
investigate the dependence/independence of the model to the type of technology upon which a
BI system is based. Moreover, there was a need to study whether the model is only applicable
to usage of an in-house developed BI solution as is the case at SA-Bank, or whether it also
applies to usage of turnkey BI solutions, that is, BI solutions that are purchased off an IT
vendor‟s shelf.
Research is needed to verify whether the revised research model of this study also applies to
tactical, evaluative and strategic usage types discussed in Chapter Two, or even so in settings
where the BI system is used for multiple strategic foci. This model is a high level framework
which requires further refinement in order to be converted into practical significance with
ease. Thus research, which focuses on the individual components of the model, could bring to
light information which enables this framework to be put to practice with minimal effort. For
instance, a reference to time was made in one of the measurement items for BI system
characteristics (BIS), „the BI system quickly responds to my data requests‟. Therefore, further
studies should focus on quantifying some of the factors inherent in words which are
subjective in nature, such as the word, „quickly‟, used above. Last, but not least, is the fact
that CSE has been widely shown to be a significant determinant of IT. In this study, however,
it was found to be a non-factor with the reason for its lack of influence attributed to the effects
of high environmental usage of the BI system on individual users, and the length of time for

66
which the BI system has existed. Whether a similar outcome would be obtained for a new BI
system is thus a subject for future research.
6.6 Managerial guidelines
The study confirms the importance of the perceived usefulness and the perceived ease of use
towards using a technology. Over half of the variance of intentions to use a BI system was
explained by the perceived usefulness of the system, an indication that BI design should
primarily focus on delivering relevant information to designated users. This is important
because of two reasons. Firstly, BI systems process data that resides in a data warehouse, that
is, a data store keeping data from all transactional systems within a firm, thus identifying
which user should get what information is inevitable. Secondly, a BI system supplies varying
levels of aggregated data to users, therefore the importance of allowing users to access only
information applicable to their business needs is emphasised. The results, however,
corroborated this view but more studies are needed to generalise it across settings. On the
other hand, the perceived ease of use did not show a significant influence on the intention to
use a BI system in light of the perceived usefulness, but was a significant determinant of the
perceived usefulness. Thus, the outlook of the interface and the performance of functions also
contribute to the user judgement that a BI system is useful. Therefore, it should go without
mention that the interface of a BI system should be consistent in outlook with other business
technological interfaces with which users are familiar. BI functions should offer flexibility
such that users are able to access the whole range of data residing in the data warehouse that
is relevant to their needs. Moreover, these functions should be tuned to minimise processing
time of user requests.
What is perceived usefulness and perceived ease of use of a BI system? What should be done
in order to increase these factors? To answer the first question, these two can be associated
with the perception that applying a BI system enhances performance of tasks and in just the
time necessary to do so. Apparently, the type of decision tasks and the quality of the BI
system have direct influence on these user perceptions. Users commonly dealing with non-
routine decision tasks, or in a frequently changing business environment, should consider
investing in a BI system with the following qualities: quick response time, high availability,
high flexibility and high reliability.

67
6.7 Conclusion
This study contributes to IS knowledge by increasing understanding of how factors which are
known to affect IT usage in the IS domain affect usage of the BI system at SA-Bank. The
influence of BI systems information is increasingly dominating non-academic IS article
sources such as Gartner Inc. and Information Management, while top academic IS journals
are not growing by an equivalent information pack. This study, however, suggested a model
which if further exploited promises to positively affect knowledge advancement of BI systems
both academically and practically. This model suggests that BI system usage is determined by
the perceived usefulness of a BI system, which in turn is positively affected by the perceived
ease of use and perceived decision task – BI system fit.

68
References
Argawal, R. and Karahana, E. (2000). Time flies when you are having fun: Cognitive
absorption and beliefs about information technology use. MIS Quarterly 24(4):665:694
Bailey, K.D. (1994). Methods of Social Research (4th
Ed.). Free Press, New York, NY
Bernroider, E.W.N. (2008). IT governance for enterprise resource planning supported by the
Delone-Mclean model of information success. Information & Management 45:257:269.
Bowman, B.J. (2002). Building knowledge management system. Information Systems
Research 19(3):32:40
Burton-Jones, A. and Hubona, G.S. (2006). The mediation of external variables in the
technology acceptance model. Information and Management 43(2006):706:717
Chan, Y.E. and Huff, S.L. (1992). Strategy: an information systems research perspective.
Journal of Strategic Information Systems 1(4):191:202
Chau, P.Y.K. (1996). An empirical assessment of a modified technology acceptance model.
Journal of Management Information Systems 13(2):185:204
Chau, P.Y.K. and Hu, P.J. (2002). Examining a model of information technology acceptance
by individual professionals: An exploratory study. Journal of Management Information
Systems 18(4):191:229
Chen, L., Soliman, K.S., Mao, E. and Frolick, M.N. (2000). Measuring User Satisfaction with
Data Warehouses: An exploratory study. Information and Management 37(3):103:110
Cheng, Y. (2011). Antecedents and consequences of e-learning acceptance. IS journal
21:269:299
Churchill, G.A., Jr. (1979). A Paradigm for Developing Better Measures of Marketing
Constructs. Journal of Marketing Research 16(1):64:73
Compeau, D., Higgins, C.A. and Huff, S. (1999). Social cognitive theory and individual
reactions to computing technology: A longitudinal study. MIS Quarterly 23(2):145:158
Compeau, D.R. and Higgins, C.A. (1995). Computer self-efficacy: Development of a measure
and initial test. MIS Quarterly 19(2):189:211
D‟Ambra, J. and Rice, R.E (2001). Emerging factors in user evaluation of the World Wide
Web. Information & Management 38:373:384
Davis, F.D (1989). Perceived usefulness, perceived ease of use, and user acceptance of
information technology. MIS Quarterly 13(3): 319:340

69
Dayal, U., Castellanos, M., Simitsis, A., Wilkinson, K. (2009). Data integration flows for
business intelligence. Communication of the ACM
DeLone, W. H. and McLean, E.R. (1995). Information systems success: the quest for
dependant variables. Information systems research 3(1):60:95
Dennis, A.R. and Reinicke, B.A. (2004). Beta versus VHS and the acceptance of electronic
brainstorming technology. MIS Quarterly 28(1):1:20
Dennis, A. R., Wixom, B. H., & Vandenberg, R. J. (2001). Understanding Fit and
Appropriation Effects in Group Support Systems via Meta-Analysis. MIS Quarterly
25(2):167:193
DeSanctis, G. and Poole, M.S. (1994). Capturing the complexity in advanced technology use.
Organisation Science 5(2)
Dishaw, M.T. and Strong, D.M. (1999). Extending the technology acceptance model with
task-technology fir constructs. Information & Management 36:9:21
Doll, W.J., Hendrickson, A. and Dong, X. (1998). Using Davis‟s perceived usefulness and
ease of use instruments for decision making: A confirmatory and multigroup invariance
analysis. Decision Sciences 29(4):839:869
Easley, R.F., Devaraj, S. and Crant, J.M. (2003). Relating collaborative technology use to
team work quality and performance: An empirical analysis. Journal of management
information systems 19(4):247:268
Elbashir, M.Z., Collier, P.A., and Davern, M.J. (2008). Measuring the effects of business
intelligent systems: The relationship between business process and organisational
performance. International journal of accounting information systems 9:135:153
Fornell, C., D. F. Larcker. 1981. Evaluating structural equation models with unobservable
variables and measurement error. J. Marketing 18(1):39:50.
Galliers, R.D. and Newell, S. (2003). Back to the future: from knowledge management to the
management of information and data. Information Systems and e-Business Management
1:5:13.
Gallivan M.J., Spliter, V.K. and Koufaris M. (2005). Does information training really matter?
A social information processing analysis of coworkers‟ influence on IT usage in the
workplace. Journal of Management Information Systems 22(1):153:192
Gefen, D. (2002). Customer loyalty in e-commerce. Journal of the Association for
Information Systems 3:27:51

70
Gefen, D. and Straub, D. (2005). A practical guide to factorial validity using pls-graph:
tutorial and annotated example. Communication of the Association for Information Systems
16:91:109.
Gefen, D. and Straub, D.W. (1997). Gender differences in the perception and use of e-mails:
An extension to the task technology model. MIS Quarterly 21(4):389:400
Gefen, D., Karahanna, E. and Straub, D.W. (2003). Trust and TAM in online shopping: An
integrated model. MIS Quarterly 27(1):51:90
Gefen, D., Straub, D.W. and Boudreau, M. (2000). Structural equation modelling and
regression: guidelines for research practice. Communications of AIS 4(7)
Golfarelli, M., Rizzi, S. and Cella, L. (2004). Beyond data warehousing: what‟s next in
business intelligence? ACM Conference on Information and Knowledge Management.
Goodhue, D.L. (1998). Development and measurement validity of a task-technology fit
instrument for user evaluations of information system. Decision Sciences 29(1):105:138
Goodhue, D.L. and Thompson, R.L. (1995). Task-technology fir and individual performance.
MIS Quarterly 19(2):213:236
Grewal, R., Cote, J.A. and Baumgartner, H. (2004). Multicollinearity and measurement error
in structural equation models: Implications for theory testing. Marketing Science
23(4):519:529
Hair, J.F., Black, W.C., Babin, B.J., Anderson, R.E. and Tatham, R.L. (2010). Multivariate
data analysis (7th
Ed.). Upper Saddle River: Pearson/Prentice Hall
Hsu, M. and Chiu, C. (2004). Internal self-efficacy and electronic service acceptance.
Decision Support Systems 38:369:381.
Human Science Research Council (2011). HSRC code of research ethics. Retrieved June 29,
2011, from
http://www.hsrc.ac.za/index.php?module=pagesetter&func=viewpub&tid=132&pid=168
Igbaria, M., Guimaraes, T. and Davis, G.B. (1995). Testing the determinants of
microcomputer usage via a structural equation modelling. Journal of Management
Information Systems 11(4):87:114
Jarvenpaa, S.L., Shaw, T.R. and Staples, D.S. (2004). Towards contextualised theories of
trust: The role of trust in global virtual teams. Information Systems Research
15(3):250:267

71
Kaplan, B. and Duchon D. (1988). Combining qualitative and quantitative in information
systems research: A case study. MIS Quarterly 12(4):571:586
Kim, H. and Kankanhalli, A. (2009). Investigating user resistance to information systems
implementation: A status quo bias perspective. MIS Quarterly 33(3):567:582
King, W.R. and He, J. (2005). External validity in IS research. Communication of the
Association for Information Systems 16:880:894
Koufaris, M. (2002). Applying the technology acceptance model and flow theory to online
consumer behavior. Information Systems Research 13(2):205:223
Lawton, G. (2006). Making business intelligence more useful. IEEE Computer Society 14:16.
Lee, A.S. and Hubona, G.S. (2009). A scientific basis for rigor in information systems
research. MIS Quarterly 33(2):237:262
Lee, C., Cheng, H.K. and Cheng, H. (2007). An empirical study of mobile commerce in
insurance industry: Task-technology fit and individual differences. Decision support
systems 43:95:110
Lee, Y., Kozar, K.A. and Larsen, K.R.T (2003). The technology acceptance model: Past
present and future. Communication of the Association for Information Systems
12(50):752:780
Leidener, D.E. and Elam, J.J. (1995). The impact of organisation information systems on
organisation design, intelligence, and decision making. Organisation Science 6(6):645:664
Lewis, W., Agarwal, R. and Sambamurthy, V. (2003). Sources of influence on beliefs about
information technology use: An empirical study of knowledge workers. MIS Quarterly
27(4):657:678
Lin, T. and Huang, C. (2008). Understanding knowledge management systems usage
antecedents: An integration of social cognitive theory and task technology fit. Information
and Management 45:410:417
Little, R. G., Jr. and Gibson, M. L. (2003). Perceived Influences on Implementing Data
Warehousing. IEEE Transactions on Software Engineering 29(4):290:296
Lönnqvist, A. and Pirttimäki, V. (2006). The measurement of business intelligence.
Information Systems Management 23(1):32:40
Malhotra, M.K. and Grover, V. (1998). An assessment of survey research in POM: from
constructs to theory. Journal of Operation Management 16(4):407:425Research Ethics

72
Malhotra, N.K., Kim S.S. and Patil, A. (2006). Common method variance in IS research: a
comparison of alternative approaches and a reanalysis of past research. Management
Science
Mathieson, K. and Keil, M. (1998). Beyond the interface: Ease of use and task-technology fit.
Information and Management 34:221:230
Moon, J and Kim, Y. (2001). Extending the TAM for a world-wide-web context. Information
and Management 38:217:230
Moore, G.C. and Benbasat, I. (1991). Development of an instrument to measure the
perceptions of adopting an information system. Information Systems Research
2(3):192:222
Negash, S. (2004). Business intelligence. Communications of the Association for Information
Systems 13(1):177:195
Nelson, R.R., Todd, P.A. and Wixom, B.H. (2005). Antecedents of information and system
quality: An empirical examination within the context of data warehousing. Journal of
Management Information Systems 21(4):199:235
Orlikowski, W.J. and Baroudi, J.J. (1991). Studying information technology in organisations:
Research approaches and assumptions. Information Systems Research 2(1):1:28.
Pagani, M. (2006). Determinants of adoption of High Speed Data Services in the business
market: Evidence for a combined technology acceptance model with task technology fit
model. Information and Management 43:847:860
Pallant, J. (2007). SPSS survival manual: A step-by-step guide to data analysis using SPSS
version 15 (3rd
Ed.). McGraw-Hill House
Park, C.W. and Keil, M. (2009). Organisational Silence and Whistle-Blowing on IT Projects:
An Integrated Model. Decision Sciences 40(4):901:918
Petrini, M. and Pozzebon, M. (2009). Managing sustainability with the support of business
intelligence: Integrating socio-environmental indicators and organisational context.
Journal of Strategic Information Systems 178:191
Phan, D.D. and Vogel, D.R. (2009). A model of customer relationship management and
business intelligence systems for catalogue and online retailers. Information &
Management 47:69:77
Pitt, L.F., Watson, R.T. and Kavan, C.B. (1995). Service quality: A measure of information
system effectiveness. MIS Quarterly 19(2):173:187

73
Podsakoff, P. M., MacKenzie, S. B., Jeong-Yeon, L. and Podsakoff, N. P. (2003). Common
Method Biases in Behavioral Research: A Critical Review of the Literature and
Recommended Remedies. Journal of Applied Psychology 88(5):879:903
Ramamurthy, K., Sen, A. and Sihna, A.P. (2008). Data warehouse infusion and organisational
effectiveness. IEEE Transaction on system, man, and cybernetics 38(4):976:994
Rouibah, K. and Ould-ali, S. (2002). PUZZLE: a concept and prototype for linking business
intelligence to business strategy. Journal of Strategic Information systems 11:133152
Sivo, S.A., Saunders, C., Chang, Q. and Jiang, J.J. (2006). How low should you go? Low
response rate and the validity of inference in IS questionnaire research. Journal of the
association for information systems 7(6):351:414
Srite, M. and Karahanna, E. (2006). The role of espoused national cultural values in
technology acceptance. MIS Quarterly 30(3):679:704
Straub, D., Boudreau, M. and Gefen, D. (2004). Validation guidelines for IS positivist
research. Communications of AIS.
Straub, D.W. (1989). Validating instruments in MIS research. MIS Quarterly 13(2):147:169
Strong, D.M., Dishaw, M.T. and Bandy, D.B. (2006). Extending task technology fit with
computer self-efficacy. The DATA BASE for Advances in Information Systems 37( 2 &
3):92:107
Thong, J.Y.L., Hong, W. and Tam, K.Y. (2004). What leads to user acceptance of digital
libraries? Communication of the ACM 47(1):79:83
Vandenbosch, B. and Huff, S.L. (1997). Searching and scanning: how executives obtain from
executive information systems. MIS Quarterly 21(1):81:107
Venkatesh, V. (2000). Determinants of perceived ease of use: Integrating control, intrinsic
motivation, and emotion into the task technology model. Information Systems Research
11(4):342:365
Venkatesh, V. and Davis F.D. (2000). A theoretical extension of the technology acceptance
model: Four longitudinal field studies. Management Science 46(2):186:204
Venkatesh, V. and Morris, M.G. (2000). Why don‟t men ever stop to ask for directions?
Gender, social influence, and their role for technology acceptance and usage behaviour.
MIS Quarterly 24(1):115:139

74
Venkatesh, V., Speier, C. and Morris, M.G. (2002). User acceptance enabler in individual
decision making about technology: Toward an integrated model. Decision Sciences
33(2):297:316
Vessey, I. and Galletta, D. (1991). Cognitive fit: An empirical study of information
acquisition. Information Systems Research 2(1):63:84
Watson, H.J. and Wixom, B.H. (2007). The current state of business intelligence. IEEE
Computer Society 96:99
Watson, H.J., Wixom, B.H., Hoffer, J.A., Anderson-Lehman, R. and Reynolds, A.M. (2006).
Real-Time Business Intelligence: Best Practices at Continental Airlines. Information
Systems Management 22(1):7:18
Wixom, B.H. (2004). Business intelligence software for the classroom: microstrategy
resources on the teradata university network. Communications of the AIS 234:246
Wixom, B.H. and Todd P.A. (2005). A theoretical integration of user satisfaction and
technology acceptance. Information Systems Research 16(1):85:102
Xu, Z.M., Kaye, G.R. and Duan, Y. (2003). UK executives‟ vision on business environment
for information scanning: A cross industry study. Information and management
40:381:389
Yi, M.Y. and Davis, F.D. (2003). Developing and validating an observational learning model
of computer software training and skills acquisition. Information Systems Research
14(2):146:169
Yu, C. (2003). Toward an understanding of MIS survey research methodology: current
practice, trends and implications for future research. Information and Management Journal
6(1):39:55
Zhang, W. and Watts, S.A (2008). Capitalising on content: Information adoption in two
online communities. Journal of the Association for Information Systems 9(3):73:94
Zhong, N., Liu, J. and Yao, Y. (2007). Envisioning intelligent information technologies
through the prism of web intelligence. Communication of the ACM 50(3):89:94
Zigurs, I. and Buckland, B.K. (1998). A theory of task/technology fit and group support
systems effectiveness. MIS Quarterly 313:334
Zmud, R.W. (1979). Individual differences and MIS success: A review of the empirical
literature. Management Science 25(10):966:979

75
Bibliography
Albert, T. C., Goes, P. B. and Gupta, A. (2004). GIST: A model for design and management
of content and interactivity of customer-centric web sites. MIS Quarterly 28(2):161:182
Ballou, D. P. and Tayi, G. K. (1999). Enhancing Data Quality in Data Warehousing
Environments. Communications of the ACM 42(1):73:78
Doll, W.J., Xia, W. and Torkzadeh, G. (1994). A confirmatory factor analysis of the end-user
computing satisfaction instrument. MIS Quarterly 18(4):453:461
Foshay, N., Mukherjee, A. and Taylor, A. (2007). Does the data warehouse end-user metadata
add value? Communication of the ACM 50(11):70:77
Gangadharan, G.R. and Swami, S.N (2004). Business intelligence systems: Design and
implementation strategies. 26th
Int. Conf. Information Technology Interfaces IT1 June 7-
10, 2004, Cavtat, Croatia.
Glassey, K. (1998). Seducing the End User. Communications of the ACM 41(9):62:69
Goodhue, D., Lewis, W. and Thompson, R. (2007). Statistical power in analysing interaction
effects: Question the advantage of PLS with product indicators. Information System
Research 18(2):211:227
Jourdan, Z., Rainer, R.K., Marshall, T.E. (2008). Business intelligence: An analysis of the
literature. Information Systems Management 25:121:131
Jurison, J. (1996). The temporal nature of IS benefits: A longitudinal study. Information &
management 30:75:79
Lee, A.S. and Baskerville, R.L. (2003). Generalising generalisability in information systems
research. Information Systems Research 14(3):221:243
Looney, C.A., Valacich, J.S., Todd, P.A., Morris, M.G. (2006). Paradoxes of on-line
investing: Testing the influences of technology on user expectancies. Decision Sciences
37(2):205:246
Nicolaou, A.I. and McKnight, D.H. (2006). Perceived information quality in data exchanges:
Effects on risk, trust, and intention to use. Information Systems Research 17(4):332:351
Sutcliffe, K.M. and McNamara, G. (2001). Controlling decision making practice in
organisation. Organisation Science 12(4):484:501
Whitten, D. and Leidner, D. (2006). Bringing IT back: An analysis of the decision to
backsource or switch vendors. Decision Sciences 37(4):605:621

76
APPENDIX A – QUESTIONNAIRE
Business Intelligence survey
All references to the “BI system” in this survey refer to the BI portal application at SA-Bank.
Section A
In item 1 to 28, Please select the most appropriate choice in light of your BI Portal
application experience at SA-Bank (1 refers to strongly Disagree and 7 to strongly
Agree).
1. The functions of the BI system are very adequate.
1 2 3 4 5 6 7 Strongly Disagree Strongly Agree
2. The functions of the BI are useful.
1 2 3 4 5 6 7 Strongly Disagree Strongly Agree
3. The capability of the BI system is compatible with my decision task profile.
1 2 3 4 5 6 7 Strongly Disagree Strongly Agree
4. The functions of the BI system make the performance of decision tasks to be easy.
1 2 3 4 5 6 7 Strongly Disagree Strongly Agree
5. I often need the BI system to assist me with completing unstructured decision tasks.
1 2 3 4 5 6 7 Strongly Disagree Strongly Agree
6. I often solve decision problems that are non-routine.
1 2 3 4 5 6 7 Strongly Disagree Strongly Agree
7. My decision tasks are dependent on me receiving accurate information from
colleagues.
1 2 3 4 5 6 7 Strongly Disagree Strongly Agree
8. I frequently must coordinate my decision task activities with others.

77
1 2 3 4 5 6 7 Strongly Disagree Strongly Agree
9. The BI system quickly responds to my data request.
1 2 3 4 5 6 7 Strongly Disagree Strongly Agree
10. I would give the information provided by the BI system a high rating in terms of
quality.
1 2 3 4 5 6 7 Strongly Disagree Strongly Agree
11. The BI system can flexibly adjust to meet new demands.
1 2 3 4 5 6 7 Strongly Disagree Strongly Agree
12. The BI system is often available to service my data requests.
1 2 3 4 5 6 7 Strongly Disagree Strongly Agree
13. Using the BI system improves my performance of decision tasks.
1 2 3 4 5 6 7 Strongly Disagree Strongly Agree
14. Using the BI system increases my decision making productivity.
1 2 3 4 5 6 7 Strongly Disagree Strongly Agree
15. Using the BI system increases my decision making effectiveness.
1 2 3 4 5 6 7 Strongly Disagree Strongly Agree
16. I find BI system to be generally a useful system.
1 2 3 4 5 6 7 Strongly Disagree Strongly Agree
17. The data presentation format from the BI system is clear.
1 2 3 4 5 6 7 Strongly Disagree Strongly Agree

78
18. I find the BI system easy to use.
1 2 3 4 5 6 7 Strongly Disagree Strongly Agree
19. Learning to use new features on the BI system is easy.
1 2 3 4 5 6 7 Strongly Disagree Strongly Agree
20. It‟s easy to interact with the BI system.
1 2 3 4 5 6 7 Strongly Disagree Strongly Agree
21. I would only be able to use the BI system if there was someone to tell me what to do.
1 2 3 4 5 6 7 Strongly Disagree Strongly Agree
22. I would only be able to use the BI system if I could call someone for help when I get
stuck.
1 2 3 4 5 6 7 Strongly Disagree Strongly Agree
23. I would only be able to use the BI system if I had a reference manual.
1 2 3 4 5 6 7 Strongly Disagree Strongly Agree
24. I would only be able to use the BI system if someone showed me what to do first.
1 2 3 4 5 6 7 Strongly Disagree Strongly Agree
25. I will recommend others to use the BI system towards performing decision tasks.
1 2 3 4 5 6 7 Strongly Disagree Strongly Agree
26. I plan to increase my use of the BI system over the next year.
1 2 3 4 5 6 7 Strongly Disagree Strongly Agree

79
27. I intend to use the BI system at every opportunity over the next year.
1 2 3 4 5 6 7 Strongly Disagree Strongly Agree
28. I intend to use the BI system as a routine part of my job over the next year.
1 2 3 4 5 6 7 Strongly Disagree Strongly Agree
Section B
In item 29 to 34, Please give one answer for each item.
29. What is the function of your business unit?
30. Which of the following describes your role?
Executive
Senior Manager
Middle Manager
Junior Manager
Other (please specify)
31. Please specify the number of years which you have spent using the BI system:
32. Please select the age range that applies to you.
20 to 30
31 to 40
41 to 50
51 to 60
60+
33. Please choose the gender description that applies to you.
Female

80
Male
34. What is the highest education level which you completed?
Completed school
Completed a skills training course
Completed a bachelor‟s degree
Completed a masters degree
Completed a PhD degree
Other (please specify)
Thank you for your consideration to participate in this survey.
Survey link
http://FreeOnlineSurveys.com/rendersurvey.asp?sid=wubwbzzy896d6xt928736
Literature sources of items
Item Code Descriptions Agree Disagree Author
Perceived decision task – BI fit
(DBF)
1 2 3 4 5 6 7 Lin and Huang (2008)
DBF1 The functions of the BI system
are very adequate.
DBF2 The functions of the BI system
are useful.
DBF3 The capability of the BI system
is compatible with my
decision task profile.
DBF4 The functions of the BI

81
system make the performance of
decision tasks to be easy.
Decision task Characteristics
(DT)
1 2 3 4 5 6 7
DT1 I often need the BI system
to assist me with
completing unstructured
decision tasks.
Goodhue and
Thompson (1995)
DT2 I often solve decision problems
that are non-routine.
Goodhue and
Thompson (1995)
DT3 My decision tasks are dependent
on me receiving accurate
information from colleagues.
Lin and Huang (2008)
DT4 I frequently must coordinate my
decision task activities with
others.
Lin and Huang (2008)
BI System characteristics (BIS) 1 2 3 4 5 6 7
BIS1 The BI system quickly responds
to my data request.
Wixom and Todd
(2005)
BIS2 I would give the information
provided by the BI system a
high rating in terms of quality.
Wixom and Todd
(2005)
BIS3 The BI system can flexibly
adjust to meet new demands.
Wixom and Todd
(2005)
BIS4 The BI system is often available
to service my data requests.
Goodhue and
Thompson (1995)
Intension to use a BI system
(IU)
1 2 3 4 5 6 7
IU1 I will recommend others to use
the BI system towards
performing decision tasks.
Cheng (2011)
IU2 I plan to increase my use of the Wixom and Todd

82
BI system over the next year. (2005)
IU3 I intend to use the BI system at
every opportunity over the next
year.
Wixom and Todd
(2005)
IU4 I intend to use the BI system as a
routine part of my job over the
next year.
Wixom and Todd
(2005)
Perceived usefulness (PU) 1 2 3 4 5 6 7 Venkatesh and Davis
(2000)
PU1 Using the BI system improves
my performance of decision
tasks.
PU2 Using the BI system increases
my decision making
productivity.
PU3 Using the BI system increases
my decision making
effectiveness.
PU4 I find the BI system to be
generally a useful system.
Perceived ease of use (PEOU) 1 2 3 4 5 6 7
PEOU1 The data presentation format
from the BI system is clear.
Venkatesh and Davis
(2000)
PEOU2 I find the BI system easy to use. Venkatesh and Davis
(2000)
PEOU3 Learning to use new features on
the BI system is easy.
Gefen et al.(2003)
PEOU4 It‟s easy to interact with the BI
system.
Gefen et al.(2003)
Computer self-efficacy (CSE) 1 2 3 4 5 6 7 Compeau and Higgins
(1995)
CSE1 I would only be able to use the

83
BI system if there was someone
to tell me what to do.
CSE2 I would only be able to use the
BI system if I could call
someone for help when I get
stuck.
CSE3 I would only be able to use the
BI system if I had a reference
manual.
CSE4 I would only be able to use the
BI system if someone showed
me what to do first.
APPENDIX B – A LETTER TO REUEST PARTICIPATION
Date: 09 August 2011
Good day,

84
My name is Deane Nkuna, and I am conducting a study in business intelligence (BI) usage
determinants.
The study aims to assess factors which impact on the usage of BI system. Therefore, the
results will be used towards helping practitioners understand influences to BI system usage.
You have been identified as someone who could help in this regard, because of your
knowledge on the Wesbank BI environment. I would also appreciate if you could identify
colleagues whom you are aware use the BI system, and forward their names to me. These
could be people reporting to you or peers.
Should you consider participating in this study, the survey will take you only 15 - 20 minutes
to complete. If you would like to know about the findings of the study, please indicate in your
response to this request. The results will only be shared in an aggregated format to ensure
confidentiality. Again, confidentiality will be further guaranteed by securing the data from
unauthorised access via password protection.
Please also note that:
1. By completing this survey you are consenting to your responses being used for
research purposes.
2. This survey is completely voluntary and you may choose to exit at any time. All
responses will be treated in the strictest of confidence.
3. Should you choose to participate, please answer all questions to the best of your
ability and remember that there is no right or wrong answer.
4. Anonymity is ensured by configuring the survey application to disregard respondent
identification information.
Thank you for your consideration to participate in this survey.
Regards,
Deane
Tel: (011) 649 5221
E-mail: [email protected]

85
APPENDIX C – ETHICS CLEARENCE LETTER
08th
August, 2011

86
Dear Deane,
Re: STUDENT NAME DEANE NKUNA
STUDENT NUMBER 9411818M
Your Ethics application has been reviewed and the committee has decided to grant your ethics
approval pending the following being executed
The letter for participation must be explicit in “inviting” participation and not “asking”
for participation.
Under does the research expose the participants? You need to say that it in fact does
and you need to address how the demographics will be dealt with in this regard.
Interests with the organisation must be checked for potential conflicts, as you do in
fact have an association with the company being researched and you need to explain
how you will manage the conflicts.
Please ensure that these changes are implemented by the 15th
of August, 2011 to the
satisfaction of your supervisor. Please submit a copy of your form, with the changes clearly
highlighted to Sibongile Dhladhla. Once your supervisor confirms that your corrections are
done (by email to the Chair of the Committee), your Ethics Number will be issued by the
Ethics Committee.
Please note you are not allowed to collect data without an Ethics Number being issued.
Regards
Ethics IS Committee

87
APPENDIX D – COVER LETTER FOR STUDY
Date: 20 August 2011
Good day,
My name is Deane Nkuna, and a few days ago I have sent you a letter asking for your
participation in a survey of business intelligence usage determinants. This is a follow up letter
to kindly ask you to complete the survey included below as a link.
Your participation will contribute towards a better understanding of factors that determine BI
systems design, and thus highly valued.

88
The survey should take you only 15 - 20 minutes to complete. If you would like to know
about the findings of the study, please indicate by forwarding your e-mail address to
[email protected]. The results, however, will only be shared in an aggregated format to
ensure confidentiality. In addition, confidentiality will be further guaranteed by securing the
data from unauthorised access via password protection.
To participate in the survey click on the following link:
http://FreeOnlineSurveys.com/rendersurvey.asp?sid=wubwbzzy896d6xt928736
If the link doesn't open please copy and paste it to the browser's address bar. For any
assistance related to the study please call me on my landline: (011) 649 5221, on my cell
phone: 0824988470, or my e-mail: [email protected] .
Please also note that:
1. By completing this survey you are consenting to your responses being used for
research purposes.
2. This survey is completely voluntary and you may choose to exit at any time. All
responses will be treated in the strictest of confidence.
3. Should you choose to participate, please answer all questions to the best of your
ability and remember that there is no right or wrong answer.
4. Anonymity is ensured by configuring the survey application to disregard respondent
identification information.
Thank you for your consideration to participate in this survey.
Regards,
Deane
Tel: (011) 649 5221
E-mail: [email protected]

89
APPENDIX E – MISSING VALUE ANALYSIS
Missing value tablea,b
Missing
Valid N Mean Std. Deviation N Percent
Gender 8 4.5% 171
BI Experience 8 4.5% 171 4.07 1.972
Age 7 3.9% 172
Intention to Use1 6 3.4% 173 5.72 1.278
Perceived Usefulness1 6 3.4% 173 5.50 1.319
Decision Task Characteristics4 6 3.4% 173 4.96 1.472
Educational Level 5 2.8% 174
Job Role 5 2.8% 174
Intention to Use2 5 2.8% 174 5.74 1.168
Perceived Usefulness3 5 2.8% 174 5.50 1.325
BI System Characteristics4 5 2.8% 174 5.27 1.373
Decision Task Characteristics3 5 2.8% 174 5.31 1.465

90
Decision Task Characteristics2 5 2.8% 174 4.95 1.533
Perceived Usefulness2 4 2.2% 175 5.47 1.325
Decision Task Characteristics1 4 2.2% 175 4.99 1.480
Computer Self-Efficacy4 3 1.7% 176 2.92 1.896
Computer Self-Efficacy3 3 1.7% 176 2.29 1.508
Computer Self-Efficacy2 3 1.7% 176 2.49 1.670
Perceived Ease of Use3 3 1.7% 176 5.41 1.248
Perceived Ease of Use1 2 1.1% 177 5.68 1.354
Perceived Usefulness4 2 1.1% 177 5.92 1.218
BI System Characteristics3 2 1.1% 177 4.84 1.507
Perceive Decision Task - BI
Fit3
2 1.1% 177 5.56 1.256
a. Maximum number of variables shown: 25
b. Minimum percentage of missing values for variable to be included: 1.0%
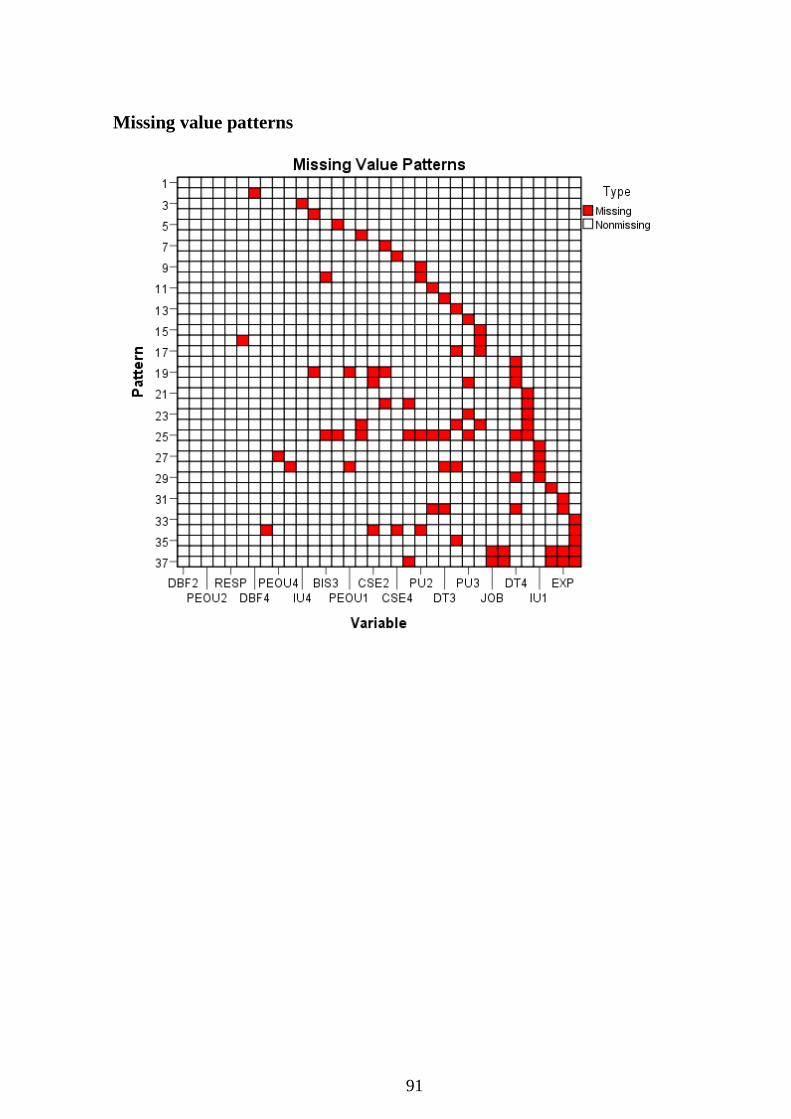
91
Missing value patterns

92
APPENDIX F – MEASUREMENT ITEM SCATTERPLOT

93
APPENDIX G – MEASUREMENT ITEM NORMALITY
Normal probability plot

94
Sample histogram (measurement item)

95
APPENDIX H – SCREE TEST CURVE

96
APPENDIX I – MULTIVARIATE NORMALITY (HISTOGRAMS)
Dependent variable IU

97
Dependent variable DBF

98
APPENDIX J - MULTIVARIATE SCATTERPLOTS
Dependent variable IU

99
Dependent variable PU