business intelligence & data analytics - leeds.ac.uk intelligence and data... · stewards...
TRANSCRIPT

1 of 25
Business Intelligence & Data Analytics Service remit, principles, scope
December 2018

2 of 25
About this consultation This document describes our approach to delivering a strategically aligned Business Intelligence and
Data Analytics service at the University of Leeds. The document outlines the remit, key principles,
scope and structure of the service. It does not cover full details of implementation. The document is
similar to a 'green paper' or 'statement of direction' which aims to inform discussion and feedback.
The document is split into several sections, each of which discuss aspects of the service’s role and
purpose which are then crystallised into a set of principles.
The Business Intelligence and Data Analytics service is one of three strands of work focused on
unleashing our data capability by improving our data quality and then exploiting it. The other work
strands cover Data Governance and Stewardship, and Data Management and Architecture. These
are being developed in parallel and in partnership.
Within the Delivering Results lifecycle, this document aims to cover the Establish the Need and part of
the Define the Scope stages of the lifecycle. The document was presented in autumn 2018 to a range
of interested individuals and fora including the International Strategy Board and the Metrics Steering
Group, and feedback was supportive throughout. The service will therefore adopt the principles as set
out; if readers have any further feedback or queries, please contact Alistair Knock (x30850,
Format The document uses narrative and diagrams to present the case for 12 key principles underpinning the
service. These principles are presented in tables of the following form:
Principle X: a concise statement summarising the principle
Examples: Tangible examples of how the principle might
apply to a University of Leeds environment
(though inclusion of a tangible example here
does not necessarily mean it will continue in this
form into practice)
Facilitating actions: Steps which need to be taken – or recognised as
risks to be mitigated – in order for the principle to
be successfully embedded into the service
Relative impact of failure: an indication of the
level of negative impact if the service were to fail
to embed this principle, measured relatively
against the failure impact of other principles
Relative cost of implementation: an indication of
the amount of effort and/or additional resource
required to successfully implement the principle,
measured relatively against the cost of other
principles
Cover image:
False colour variant of ‘History II’, Kejser Franz Joseph Fjord, Greenland.
Alistair Knock CC BY-NC-SA 4.0 International
3 of 25
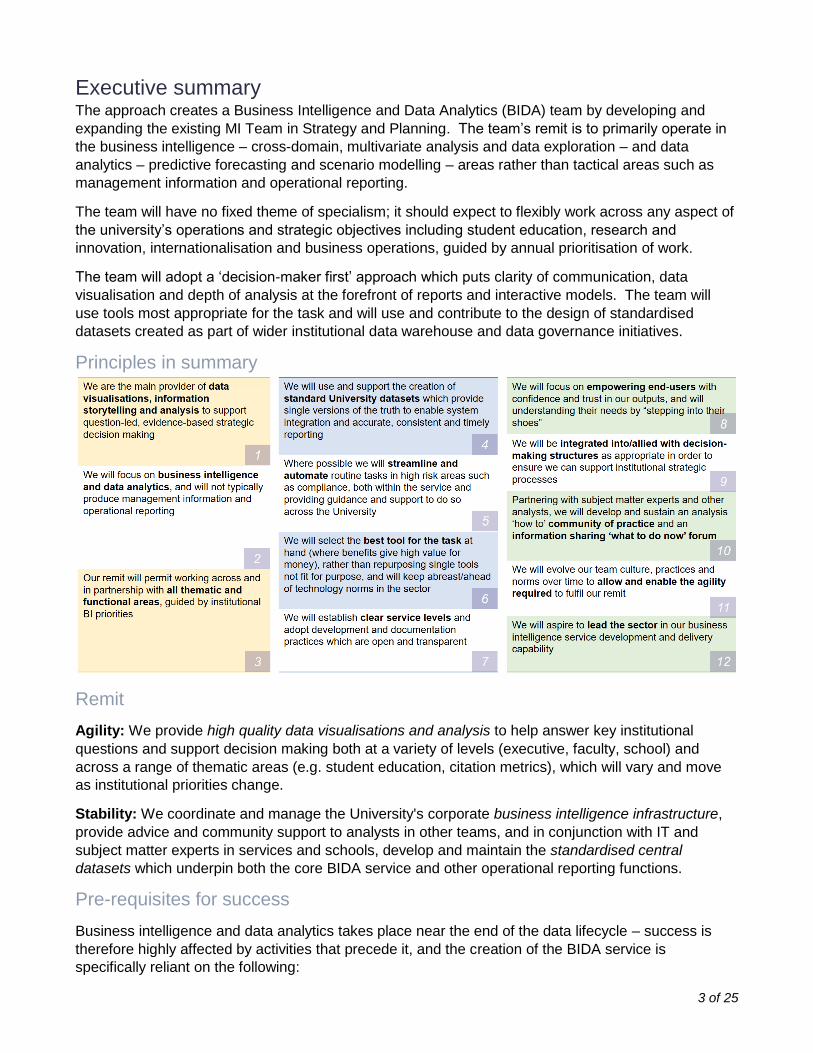
Executive summary The approach creates a Business Intelligence and Data Analytics (BIDA) team by developing and
expanding the existing MI Team in Strategy and Planning. The team’s remit is to primarily operate in
the business intelligence – cross-domain, multivariate analysis and data exploration – and data
analytics – predictive forecasting and scenario modelling – areas rather than tactical areas such as
management information and operational reporting.
The team will have no fixed theme of specialism; it should expect to flexibly work across any aspect of
the university’s operations and strategic objectives including student education, research and
innovation, internationalisation and business operations, guided by annual prioritisation of work.
The team will adopt a ‘decision-maker first’ approach which puts clarity of communication, data
visualisation and depth of analysis at the forefront of reports and interactive models. The team will
use tools most appropriate for the task and will use and contribute to the design of standardised
datasets created as part of wider institutional data warehouse and data governance initiatives.
Principles in summary
Remit
Agility: We provide high quality data visualisations and analysis to help answer key institutional
questions and support decision making both at a variety of levels (executive, faculty, school) and
across a range of thematic areas (e.g. student education, citation metrics), which will vary and move
as institutional priorities change.
Stability: We coordinate and manage the University's corporate business intelligence infrastructure,
provide advice and community support to analysts in other teams, and in conjunction with IT and
subject matter experts in services and schools, develop and maintain the standardised central
datasets which underpin both the core BIDA service and other operational reporting functions.
Pre-requisites for success
Business intelligence and data analytics takes place near the end of the data lifecycle – success is
therefore highly affected by activities that precede it, and the creation of the BIDA service is
specifically reliant on the following:
4 of 25
1. Capture of high-quality data at source (‘right first time’) rather than requiring costly data
cleansing. This requires process improvements and good system workflows and validations,
and improving data quality should be a key part of transformational programmes such as
Student Lifecycle and Corporate Processes & Systems
2. Clear governance of responsibility and accountability for data, including identifying data
stewards across the organisation who are key in establishing and deciding the business rules
and definitions used to transform raw data into business intelligence
3. Institutional work prioritisation and coordination practices which ensure that competing
demands and projects are managed, sequenced and prioritised so that services like BIDA can
remain highly effective and focused on work within their remit
4. An institutional data repository and toolkit, facilitated by IT, which enables the central
curation of ‘single version of the truth’ through collaboration and knowledge sharing between
professional services, IT, BIDA and schools and faculties
5. Selection and investment in appropriate analytical tools, training and staff to enable
delivery of high quality, clear and incisive analysis while using technology to operate efficiently
Benefits summary
The benefits of running a strategically-aligned business intelligence and data analytics service using
the principles outlined in this document include:
1. Enhanced data visualisation capability, using interactive dashboards and best-practice
chart design to clearly compare and contrast data, supported by tables where appropriate
2. Reports which are more closely aligned to the key questions being asked and decisions to
be made, through analysts working proactively and collaboratively with decision-makers
3. Potential for business intelligence development in any area of the university, building on the
current provision in student education management information
4. Reducing disagreement around accuracy of statistics by standardising datasets through an
institutional data warehouse, and standardising look-and-feel of reports
5. Reports produced in a more timely and integrated way, using technology solutions to
automate and streamline data refreshes
6. Increasingly mature data capability across the institution, through building informal and
formal communities working together on common goals and the recognition of data as a key
asset
Context and current state The University of Leeds does not currently have services delivering an institutional data warehouse or
an end-to-end management information/business intelligence capability, and this is compounded by
the absence of an institutional approach to data governance and control. The current approach for
integrating systems and extracting data is inefficient, ineffective and the process is duplicated across
many functions and teams which is both time consuming and costly. Specifically:
1. There are significant operational issues due to the existence of too many information silos,
which often require the same information being extracted from the same source systems
multiple times for the same purposes
2. There is a lack of confidence in data, and with no formal data governance, controls or tools for
managing data quality, this often results in heavily manual and costly data processing activities
5 of 25
3. There is a lack of standardised extract-transform-load (ETL) tools and processes across the
organisation, creating duplication and a multiplicity of technologies, methods and
inconsistencies in extracting data and a complex environment within which to implement
GDPR
4. There is an absence of an institutional data model, including semantics and formats which
would promote standardization
5. Processes to generate reports and analytics are time consuming, with long delays in
transporting data to recipients
6. Often there are security issues, with uncontrolled data extracted and replicated across campus
7. Limited quality data can result in poor or untimely business decisions as well as inability to plan
and forecast accurately
8. Overall, heavily manual and fragmented methods for data processing resulting in an inability to
respond quickly to changing environments and priorities
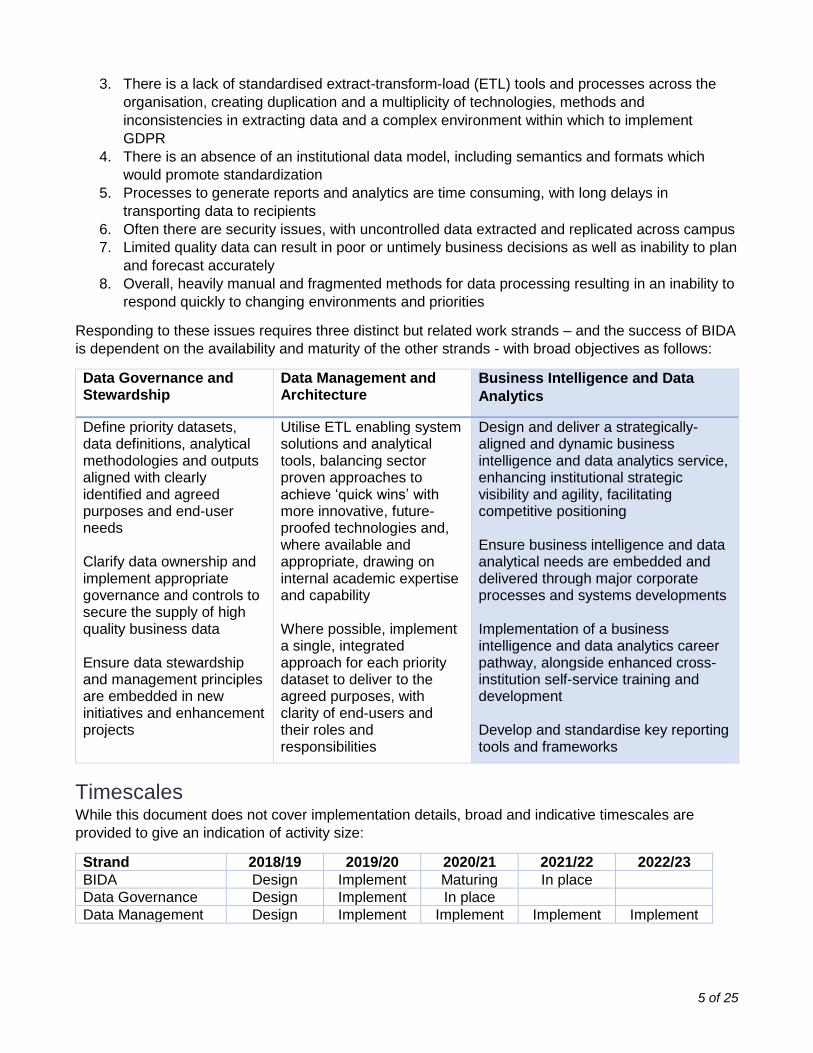
Responding to these issues requires three distinct but related work strands – and the success of BIDA
is dependent on the availability and maturity of the other strands - with broad objectives as follows:
Data Governance and Stewardship
Data Management and Architecture
Business Intelligence and Data
Analytics
Define priority datasets, data definitions, analytical methodologies and outputs aligned with clearly identified and agreed purposes and end-user needs Clarify data ownership and implement appropriate governance and controls to secure the supply of high quality business data Ensure data stewardship and management principles are embedded in new initiatives and enhancement projects
Utilise ETL enabling system solutions and analytical tools, balancing sector proven approaches to achieve ‘quick wins’ with more innovative, future-proofed technologies and, where available and appropriate, drawing on internal academic expertise and capability Where possible, implement a single, integrated approach for each priority dataset to deliver to the agreed purposes, with clarity of end-users and their roles and responsibilities
Design and deliver a strategically-aligned and dynamic business intelligence and data analytics service, enhancing institutional strategic visibility and agility, facilitating competitive positioning Ensure business intelligence and data analytical needs are embedded and delivered through major corporate processes and systems developments Implementation of a business intelligence and data analytics career pathway, alongside enhanced cross-institution self-service training and development Develop and standardise key reporting tools and frameworks
Timescales While this document does not cover implementation details, broad and indicative timescales are
provided to give an indication of activity size:
Strand 2018/19 2019/20 2020/21 2021/22 2022/23
BIDA Design Implement Maturing In place
Data Governance Design Implement In place
Data Management Design Implement Implement Implement Implement
6 of 25
Information and organisational scope All three strands relate primarily to administrative and corporate information – raw data obtained
from business systems or benchmarking data from other organisations (e.g. HESA, UCAS) and held in
order to enable the organisation to achieve its aims, and the higher order reports and analysis which
underpin effective decision making. Research data and their analysis are not covered by these work
strands, though we recognise that in some areas (e.g. student outcomes) there is potential benefit in
seeking to utilise academic expertise and facilities.
The organisational scope of the work strands is institution-wide, in activities which are considered
core (e.g. student education, research and innovation, internationalisation, operations) and so extends
across both professional services and relevant activities which are carried out in academic units.
Unless otherwise noted, inter-institutional centres and subsidiary companies which use alternative
administrative structures and systems are not covered by these work strands.
Section 1: Remit, scope and purpose of the service
Strategic focus and breadth of mission
The need for high-quality data analysis and visualisation has developed rapidly in UK higher education
over the past 10 years, as market forces, demographic changes, and new forms of teaching and
learning emerge to form a more competitive and regulated environment where the exploitation and
protection of data is critical.
Most UK higher education institutions have their management information (MI) or business intelligence
(BI) function located in the Strategy and Planning team because these teams are central in helping
navigate the immediate obstacles and setting future direction of the institution. Often the MI team has
historically played a supportive and facilitating technical role, translating system data into static or
interactive master datasets and models, from which other stakeholders can frame the questions and
attempt to discover answers. These activities are often centred on a single theme – for instance,
student progression, or quarterly financial forecasts – and tend not to interrogate cross-system data.
Where these stakeholders are experienced, sufficiently technical and have the time and opportunity,
this model has been satisfactory, particularly where an institution has few ‘burning platform’ problems,
is relatively secure, or has moderate ambition. This scenario is now rare, and universities are
increasing designing business intelligence and data analytics teams to provide clear, concise, often
visual suites of analytical material. Importantly, the role of such teams is flexible and wide – using
data from multiple domains such as staff, estate, finance and student information is the norm rather
than exception due to the added clarity and value which emerges from being able to paint a holistic
and complete picture. These teams still tend to reside in the Strategy and Planning area but have a
widened reach, partnering with subject matter experts in services and academic areas, as well as
building up extended communities of satellite analysts where it is optimal that they operate in a
different functional area but under the umbrella oversight and guidance from the central BI service.
7 of 25
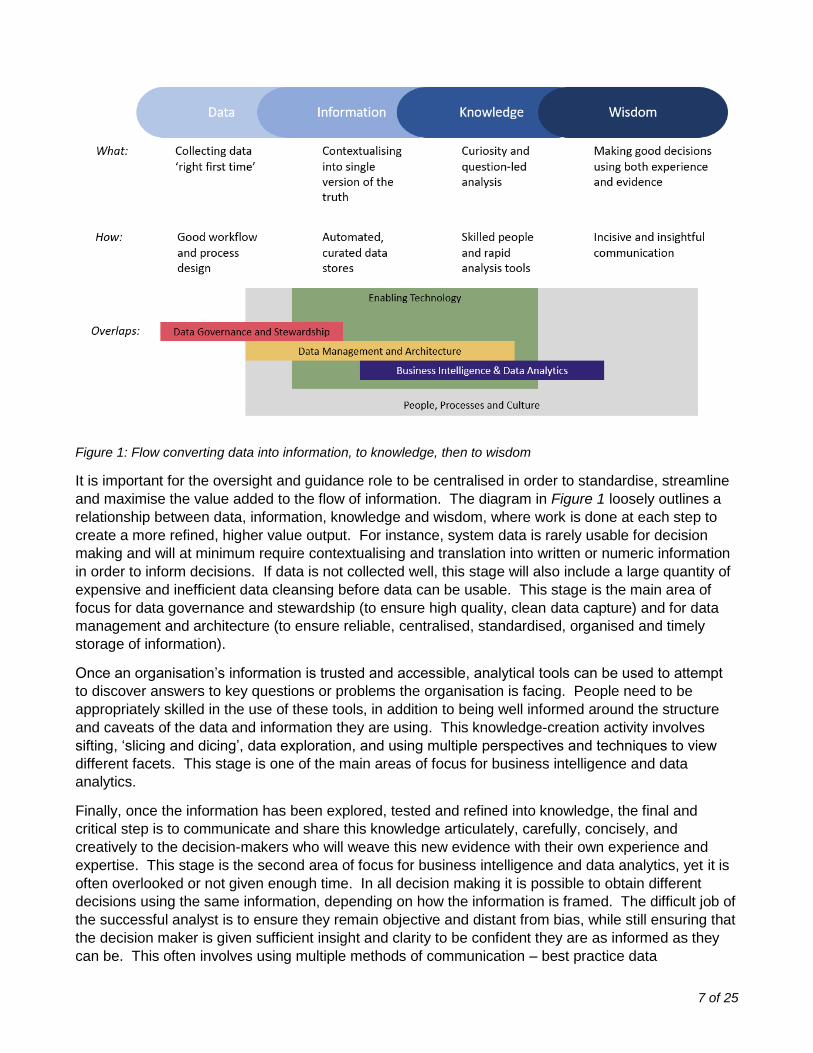
Figure 1: Flow converting data into information, to knowledge, then to wisdom
It is important for the oversight and guidance role to be centralised in order to standardise, streamline
and maximise the value added to the flow of information. The diagram in Figure 1 loosely outlines a
relationship between data, information, knowledge and wisdom, where work is done at each step to
create a more refined, higher value output. For instance, system data is rarely usable for decision
making and will at minimum require contextualising and translation into written or numeric information
in order to inform decisions. If data is not collected well, this stage will also include a large quantity of
expensive and inefficient data cleansing before data can be usable. This stage is the main area of
focus for data governance and stewardship (to ensure high quality, clean data capture) and for data
management and architecture (to ensure reliable, centralised, standardised, organised and timely
storage of information).
Once an organisation’s information is trusted and accessible, analytical tools can be used to attempt
to discover answers to key questions or problems the organisation is facing. People need to be
appropriately skilled in the use of these tools, in addition to being well informed around the structure
and caveats of the data and information they are using. This knowledge-creation activity involves
sifting, ‘slicing and dicing’, data exploration, and using multiple perspectives and techniques to view
different facets. This stage is one of the main areas of focus for business intelligence and data
analytics.
Finally, once the information has been explored, tested and refined into knowledge, the final and
critical step is to communicate and share this knowledge articulately, carefully, concisely, and
creatively to the decision-makers who will weave this new evidence with their own experience and
expertise. This stage is the second area of focus for business intelligence and data analytics, yet it is
often overlooked or not given enough time. In all decision making it is possible to obtain different
decisions using the same information, depending on how the information is framed. The difficult job of
the successful analyst is to ensure they remain objective and distant from bias, while still ensuring that
the decision maker is given sufficient insight and clarity to be confident they are as informed as they
can be. This often involves using multiple methods of communication – best practice data
8 of 25
visualisation, written narrative, data tables, face-to-face discussion or presentation – in order to
engage different audiences and perspectives and ensure the full picture is painted.
“No one ever made a decision because of a number. They need a story.” (Daniel Kahneman,
quoted by Michael Lewis in The Undoing Project: A Friendship that Changed the World)
It is important to note that while technology plays a heavy facilitating role, particularly in translating
data to information through data warehousing, and in contextualising information into knowledge
through powerful analysis tools, it is only effective when supported by people, processes and a culture
which understands and advocates high quality data at the point of capture, and which devotes effort to
the clear communication and dissemination of findings. It is also a cross-institutional effort: in any
large organisation, rarely would a single team would be responsible for all stages and each might be
considered a discrete area of work.
Separating layers of reporting and expertise
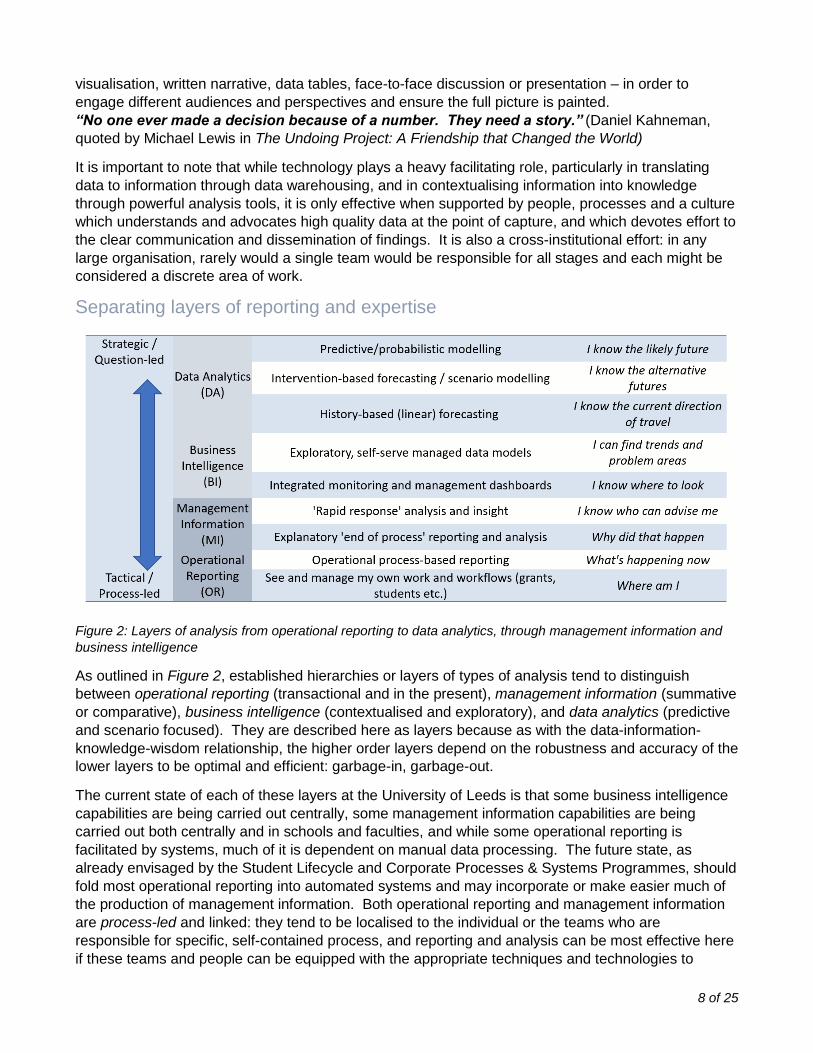
Figure 2: Layers of analysis from operational reporting to data analytics, through management information and
business intelligence
As outlined in Figure 2, established hierarchies or layers of types of analysis tend to distinguish
between operational reporting (transactional and in the present), management information (summative
or comparative), business intelligence (contextualised and exploratory), and data analytics (predictive
and scenario focused). They are described here as layers because as with the data-information-
knowledge-wisdom relationship, the higher order layers depend on the robustness and accuracy of the
lower layers to be optimal and efficient: garbage-in, garbage-out.
The current state of each of these layers at the University of Leeds is that some business intelligence
capabilities are being carried out centrally, some management information capabilities are being
carried out both centrally and in schools and faculties, and while some operational reporting is
facilitated by systems, much of it is dependent on manual data processing. The future state, as
already envisaged by the Student Lifecycle and Corporate Processes & Systems Programmes, should
fold most operational reporting into automated systems and may incorporate or make easier much of
the production of management information. Both operational reporting and management information
are process-led and linked: they tend to be localised to the individual or the teams who are
responsible for specific, self-contained process, and reporting and analysis can be most effective here
if these teams and people can be equipped with the appropriate techniques and technologies to

9 of 25
answer their own questions. The OR/MI analyst is the data producer and also the data consumer, and
should be empowered through the support and guidance of central services to introspect on their
processes and make improvements.
In contrast, business intelligence and data analytics tend to be problem or question-led, where
outcomes and decisions are less clear and less tied to a single, specific process. Working across
business systems is a key component of this type of reporting, which brings together information from
different thematic areas (e.g. operating costs per student, research income per academic) and
employs multivariate analysis techniques to explore complex areas (e.g. causes of student withdrawal,
relationships between entry qualifications and degree classification). The BI/DA analyst is the data
consumer but is not the data producer or the owner of processes, and so is reliant on high quality data
produced and documented in the operational reporting/management information layers, and stored
and governed in the institutional data warehouse.
Figure 3: Matrix of current reporting capability by thematic area and analysis layer
Universities are complex organisations, with many different and discrete thematic areas in addition to
many, diverse academic and functional areas and needs. It is not feasible nor sensible to tackle data

10 of 25
quality and analysis across all areas at the same time – prioritisation is essential depending on the
current external environment and internal strategic objectives (Figure 3 provides a visual illustration of
how the current state and maturity could be assessed as a precursor to service implementation). A
framework can be articulated, however, which allows for and enables these future needs to be met.
Firstly, an underpinning data foundation can be designed to cover all areas. This foundation would
include an institutional data warehouse with master data management, resilient storage and enterprise
data architecture, consistent data definitions and structures for governance.
Secondly, an overarching business intelligence and data analytics service can be designed, which has
the flexibility to work within and across many different thematic areas, but which will focus on specific
priorities at any given moment. This service would have overall oversight of institutional business
intelligence provision and content, establish design standards and implement visualisation best
practice, and would act as a guidance and training hub for satellite analysts working on local problems
and reporting within other services.
Finally, recognising the expertise held in services and academic-unit support teams, a patchwork of MI
and BI capability would develop between this umbrella service and underpinning data fabric gradually,
as priorities shift and reporting matures in each area. This patchwork would be formed in partnership
between the BIDA service and the experts in each area, with the balance of work shifting depending
on the level of BI capability required.
In essence, the data foundation provides a safe and stable platform on which teams can work together
develop insight and help answer key organisational questions; the BIDA service provides a sheltering
and supportive framework to enable this to be done incisively and effectively.
Principle 1: we are the main provider of data visualisations, information storytelling and analysis to support question-led, evidence-based strategic decision making
Examples: A new government dataset and policy is
released around the impact of universities on
society, with a short consultation period. BIDA
rapidly produces a set of data visualisations
which assess and analyse our position in the
dataset, working with the key partners who will
be deciding on our response to the consultation.
BIDA co-develop a consolidated school-level
research dashboard with RIS, drawing together
internal grant, quality and impact information
combined with external metrics and indicators
including REF, UKRI award information and
international league tables.
Facilitating actions: Creation and stable operation of BIDA service
Assessment and review of current data
visualisation and analysis tools and
communication methods
Creation of an overall ‘reporting timetable’ for
all MI/BI, with roles and responsibilities
discussion about who leads each piece of work
Relative impact of failure: High Relative cost of implementation: Medium
11 of 25
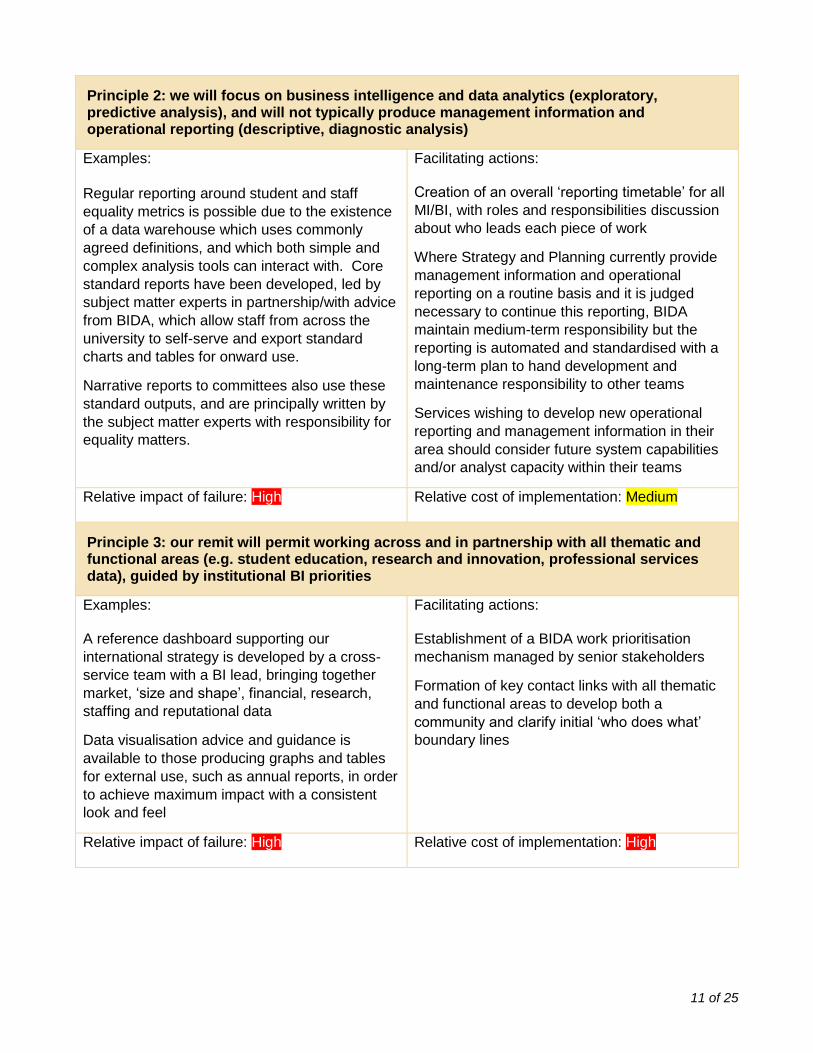
Principle 2: we will focus on business intelligence and data analytics (exploratory, predictive analysis), and will not typically produce management information and operational reporting (descriptive, diagnostic analysis)
Examples:
Regular reporting around student and staff
equality metrics is possible due to the existence
of a data warehouse which uses commonly
agreed definitions, and which both simple and
complex analysis tools can interact with. Core
standard reports have been developed, led by
subject matter experts in partnership/with advice
from BIDA, which allow staff from across the
university to self-serve and export standard
charts and tables for onward use.
Narrative reports to committees also use these
standard outputs, and are principally written by
the subject matter experts with responsibility for
equality matters.
Facilitating actions: Creation of an overall ‘reporting timetable’ for all
MI/BI, with roles and responsibilities discussion
about who leads each piece of work
Where Strategy and Planning currently provide
management information and operational
reporting on a routine basis and it is judged
necessary to continue this reporting, BIDA
maintain medium-term responsibility but the
reporting is automated and standardised with a
long-term plan to hand development and
maintenance responsibility to other teams
Services wishing to develop new operational
reporting and management information in their
area should consider future system capabilities
and/or analyst capacity within their teams
Relative impact of failure: High Relative cost of implementation: Medium
Principle 3: our remit will permit working across and in partnership with all thematic and functional areas (e.g. student education, research and innovation, professional services data), guided by institutional BI priorities
Examples: A reference dashboard supporting our
international strategy is developed by a cross-
service team with a BI lead, bringing together
market, ‘size and shape’, financial, research,
staffing and reputational data
Data visualisation advice and guidance is
available to those producing graphs and tables
for external use, such as annual reports, in order
to achieve maximum impact with a consistent
look and feel
Facilitating actions: Establishment of a BIDA work prioritisation
mechanism managed by senior stakeholders
Formation of key contact links with all thematic
and functional areas to develop both a
community and clarify initial ‘who does what’
boundary lines
Relative impact of failure: High Relative cost of implementation: High
12 of 25
Section 2: Data fabric, standards and tools
Efficiency
Developing business intelligence and performing data analytics requires the stages outlined in figure 1
– data needs to be collected, then comprehended and cleansed; it is then safely stored,
contextualised, and standardised, before being analysed, interrogated, and explored ready for
communication and action. Where there is no supporting infrastructure, every report requires each of
these stages to be performed, every time the report is created or updated. In the case of a new
report, data used for another report might be re-usable but often does not fully meet requirements. In
the case of updated reports, new uncleansed data is received which again needs processing. As the
number of reports increases and as their complexity increases and sophistication improves, the task of
coercing data into information becomes inefficient, if not unmanageable. In essence, creating
management information in this way is like building a house on sand – a constant cycle of
maintenance is required as the tide washes the supports away, leaving little time for improvement.
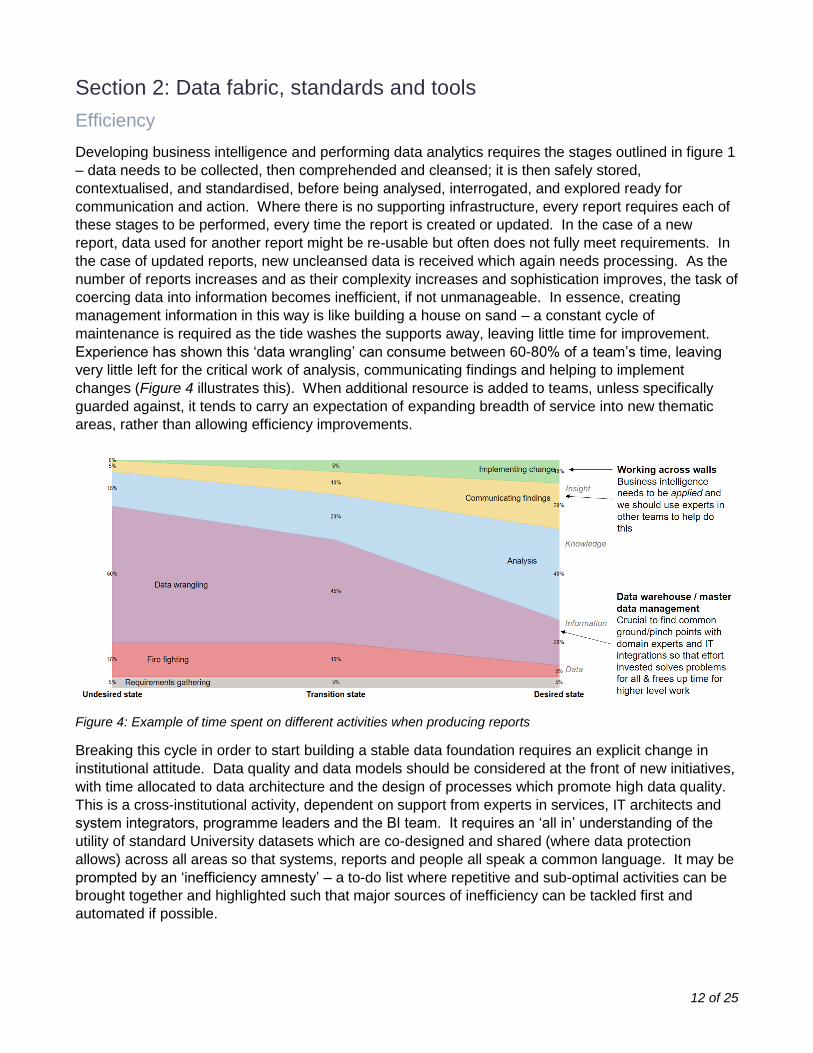
Experience has shown this ‘data wrangling’ can consume between 60-80% of a team’s time, leaving
very little left for the critical work of analysis, communicating findings and helping to implement
changes (Figure 4 illustrates this). When additional resource is added to teams, unless specifically
guarded against, it tends to carry an expectation of expanding breadth of service into new thematic
areas, rather than allowing efficiency improvements.
Figure 4: Example of time spent on different activities when producing reports
Breaking this cycle in order to start building a stable data foundation requires an explicit change in
institutional attitude. Data quality and data models should be considered at the front of new initiatives,
with time allocated to data architecture and the design of processes which promote high data quality.
This is a cross-institutional activity, dependent on support from experts in services, IT architects and
system integrators, programme leaders and the BI team. It requires an ‘all in’ understanding of the
utility of standard University datasets which are co-designed and shared (where data protection
allows) across all areas so that systems, reports and people all speak a common language. It may be
prompted by an ‘inefficiency amnesty’ – a to-do list where repetitive and sub-optimal activities can be
brought together and highlighted such that major sources of inefficiency can be tackled first and
automated if possible.
13 of 25
Principle 4: we will use and support the creation of standard University datasets which provide single versions of the truth to enable system integration and accurate, consistent and timely reporting
Examples: In designing a new student progression
multivariate analysis, most of the data
components (e.g. VLE engagement, assessment
marks) are already available in an institutional
data warehouse, guided by a data dictionary,
and a minority of analyst time is spent retrieving
and cleansing data directly from source systems
When discussing student recruitment patterns
with staff in schools, quantitative data and
metrics have been obtained from the same
source, allowing discussion to focus on
additional qualitative and contextual factors and
what decisions to make
Facilitating actions: University-wide investment and collaboration in
designing and maintaining institutional data
repositories
Embedding of good data governance and
stewardship practice across all functional areas
and processes
Relative impact of failure: High Relative cost of implementation: High
Principle 5: where possible we will streamline and automate routine tasks in high risk areas such as compliance, both within the service and providing guidance and support to do so across the University
Examples: Information and pre-designed charts to support
Athena SWAN applications are available on a
self-serve basis for all schools, with ad-hoc
requests fulfilled only an exceptional basis
Knowledge currently held individually around
statutory returns such as Unistats moves into
operational databases and systems such as a
curriculum management tool, which also fulfils
the statutory data submission activity and
standard reporting
Facilitating actions: In-service review of current contributions to
repetitive and compliance tasks, with action plan
for automation and streamlining
Recommendations to key change activities such
as Student Lifecycle and Corporate Processes
and Systems Programmes on areas of
inefficiency which could be addressed by
systems and process improvement
Relative impact of failure: Medium Relative cost of implementation: Medium
Effectiveness and service excellence
A cursory glance at Gartner Magic Quadrants for analytics, business intelligence and data
management tools shows that much has changed in these sectors over the past 10 years. Traditional
‘stack’ vendors (such as IBM or Microstrategy) who claim to offer fully integrated business systems,
14 of 25
warehousing and analytical capability have been overtaken by best-of-breed ‘targeted’ software
toolkits which perform specific tasks very well rather than attempting to address all areas. Of course,
the next ten years will be different – already the tools considered innovative five years ago are slowing
and broadening, creating conditions for another ‘S-curve’ where other innovators create new ways to
solve BI problems. Machine learning, a field of computer science connected with AI, is relatively
mature and accessible due to advances in cloud and distributed computing – it can be used for pattern
recognition and making data-driven predictions through the algorithmic exploration of large datasets.
For a business intelligence service to be nimble, adaptive and trusted, it must find ways to be flexible
and skilled enough to choose the best tool for the task from a range of options, while ensuring that the
outputs follow a standard form which creates confidence and clarity of communication. Some tools
excel in creating high definition, interactive data visualisations; some excel at producing static, print-
perfect operational reports; others encourage ‘deep dive’ exploration into datasets with numerous
combinations of parameters. Effective communication to a diverse and large audience is likely to
require use of all these tools and techniques, and the service should be organised such that it can
freely select from this toolkit, supported by a set of baseline service levels, design standards, and
published documentation which aims to use standard definitions, colour schemes, and information
classifications.
Principle 6: we will select the best tool for the task at hand (where benefits give high value for money), rather than repurposing single tools not fit for purpose, and will keep abreast/ahead of technology norms in the sector
Examples: Since most data is available from a standard data
repository which any tool can interact with, an analyst
working on complex patterns in student behaviour will
use R or Stata, while an analyst working on clear
compare-and-contrast benchmarking dashboards will use
interactive data visualisation tools like QlikSense,
Tableau or PowerBI depending on the most appropriate
and clearest depiction of information. The use of
common design standards and a common ‘gateway to BI’
will mean the choice of tool is largely invisible to the end
user
When publishing key performance indicators for public
use, instead of exporting static images from existing
internal reports, data is presented using specific
interactive, accessible web technologies which allow tight
alignment with corporate identity guidelines
Facilitating actions: Experimentation with and potential
adoption of a variety of software tools
and practices
Continued development of internal best
practice guidance and design standards
to enable use of multiple tools while
managing support and training
requirements and avoiding user
confusion
Relative impact of failure: Medium
Relative cost of implementation: Medium
15 of 25
Principle 7: we will establish clear service levels and adopt development and documentation practices which are open and transparent
Examples: Reports describing entry qualification profiles across the
institution clearly state and link to the data definitions
used (which are common with the underlying operational
student recruitment reports), openly detail any caveats
applicable to the analysis, and describe any limits on
scope and frequency of reporting
Ad-hoc requests will reduce in volume through improved
signposting to existing reports, but where bespoke
analysis is required it will be clear who is currently
handling the request and what the usual turnaround
times are expected to be. If the request cannot be
fulfilled this will be communicated rapidly.
Facilitating actions: Collaborative development of advice
and guidance on methods and criteria
used in developing datasets and
metrics, e.g. progression rules, census
date cut-off points and population
bounds
Use of open ‘wiki’ and service
management tools such as Sharepoint
to allow sharing and editing of
documentation, current priorities and
workload capacity limits
Relative impact of failure: Medium Relative cost of implementation: Low
Section 3: Relationships and approach
Decision makers first
A report is requested, produced and presented to a group which finds it interesting but then takes no
action: this process is deficient in some way. The deficiency may be in the request itself, which may
have been unnecessary or ill-formed; the deficiency may be in the production and compilation of the
report, which may use sub-standard data or does not explore and assess the data sufficiently; or the
deficiency may be in the presentation, either through the written or visual depiction, the
recommendations (or absence of them), or in the physical discussion and deliberation of the group.
Some analysis and research should purely be interesting, of course, but assuming that the function of
a deliberative group is to deliberate and then act, then the report should enable and empower the
group to do so through the compilation and communication of evidence.
It is therefore key that report-writers take the approach of putting the decision-maker first, taking time
to fully understand the problem, the impact and complexity of the decision, and the context in which
the decision is being made. The judgement-based nature of decisions often means that questions are
difficult to pose at the outset – iteration and collaboration is required, sifting through data a number of
times and adopting different perspectives and techniques to understand the true nature of the
problem. The report-writer is not responsible for making the decision, and analysts are naturally
drawn to an objective stance. But they must understand the situation and circumstances of the
decision in order that they invest sufficient effort into the research. This will sometimes involve being
privy to sensitive information and both the decision-maker and report-writer need to establish a trust
relationship and level of confidence in one another.
This trust can be established both interpersonally and through consistency of outputs – a deliberative
group which routinely receives reports which use standard colours, chart choices, definitions and
competitor groups, irrespective of the team which produced the report, is a group which will have high

16 of 25
confidence in the report and importantly will be able to digest the report quickly and efficiently,
focusing effort on the decision rather than on interpreting the information.
Principle 8: we will focus on empowering end-users with confidence and trust in our outputs, and will “step into people’s shoes” to understand the needs of those users
Examples: Before looking at sector data on research grant awards,
the BIDA analyst first spends time with the DVC-R to
understand the context of the decisions to be made,
and to try to jointly articulate the ‘data questions’ being
asked. The process continues iteratively as new
insights are uncovered.
Student education monitoring dashboards are
sufficiently clear and easy to understand that they are
included as the primary component of a report, rather
than requiring a subject-matter expert to distill and
interpret data into a narrative suitable for a decision
maker to assess.
Consistent methods of presenting information, such as
always showing trend data as line charts rather than
bar charts, acts as an informal ‘kitemark’ indicating
certain standards have been employed
Facilitating actions: A standard ‘working practice’ template is
developed to help both end-user and
analyst, outlining the lead times for new
analysis, types of questions and
perspectives which might be adopted
Design standards are developed and
agreed all main analyst groups, applied to
all new developments and gradually
retro-fitted to existing analysis
Data visualisation training and materials
are made available in a ‘best practice
library’
Relative impact of failure: High Relative cost of implementation: Low
Principle 9: we will be integrated into/allied into decision-making structures as appropriate in order to ensure the service can fully support institutional strategic processes
Examples: The committee secretary for a given sub-committee
routinely checks in with a named member of BIDA
when setting agendas and annual reporting schedules,
so that pre-existing business intelligence can be
incorporated into deliberations and any new, sufficiently
high priority, requests for work can be built into BIDA
timelines
Leading from principle 1, it becomes normal (though not
essential) to expect BIDA input into key papers
considered by senior governance structures including
Council, UEG, TSEB, ISB and RIB.
Facilitating actions: Formation of key contact links with
committee chairs and secretaries
Gradual development of BIDA ‘named
contacts’ for each area of expertise
Relative impact of failure: Medium Relative cost of implementation: Low
17 of 25
Community building
Business intelligence is about business problems, business opportunities, as obtained from business
processes and business operations. Translated into the university world, this means drawing insight
from across all areas of core activities, including student education, research and innovation,
international engagement and collaboration, and core operations like HR, finance and managing the
estate. In the US, these teams tend to be called ‘Institutional Research’ units – effectively carrying out
analytical research on a data domain which covers the activities of higher education institutions.
Universities have expertise and experience distributed across both central professional services and
within the support teams in academic schools and faculties. No single team can acquire and sustain
this expertise (nor would it necessarily wish to!), but by partnering the BIDA service with both subject
matter experts and with existing or developing analysts in other professional services, this theme-
specific expertise can be bolstered with the tools, techniques and good practice maintained by BIDA,
working with standard datasets created by cross-institutional groups. By creating a community of
practice for analysts to share experiences and ask for advice, the whole becomes greater than the
sum of its parts and strengthened relationships will start to create standard practices and build
confidence in the reports produced. The community can then act as a network for information sharing,
signposting ‘where to look’ for information as well as feeding back questions and enhancements.
When priorities necessarily shift from year to year and when these work across multiple thematic
areas - some of which will be previously ‘untouched’ in terms of business intelligence – the team will
need to embed agility and flexibility in its working practices. Over time these will develop away from
the high-cost ‘data wrangling’ currently required due to the absence of data management and
governance, and enable a more proactive and rapid, iterative approach to the production of
information. The form this will take will evolve over time but will incorporate many of the principles
driving agile software development – working together, delivering frequently, creating an environment
of trust, self-reflection and taking time out to deal with inhibiting factors – in order to become both
adaptive and able to shift direction quickly, as well as instilling a culture of excellence and
professionalism. As part of one of the best universities in the UK, the business intelligence and data
analytics team should reasonably aspire to be sector-leading and at the forefront of new initiatives.
Principle 10: partnering with subject matter experts and analysts in other teams, we will develop and sustain an analysis ‘how to’ community of practice and an information sharing ‘what to do now’ forum
Examples: An analyst in a service is having difficulty deciding the most effective way to represent multi-dimensional data. They share a screenshot on Leeds chat forum dedicated to data visualisation good practice and quickly receive suggestions from across the community. A Yammer feed read by interested parties across the University routinely announces new analytical models or updates to existing datasets, including links to guidance.
Facilitating actions: BIDA create virtual and physical networks for analysts and information users Heads of Services/Schools recommend interested parties to join the networks
Relative impact of failure: Medium
Relative cost of implementation: Medium
18 of 25
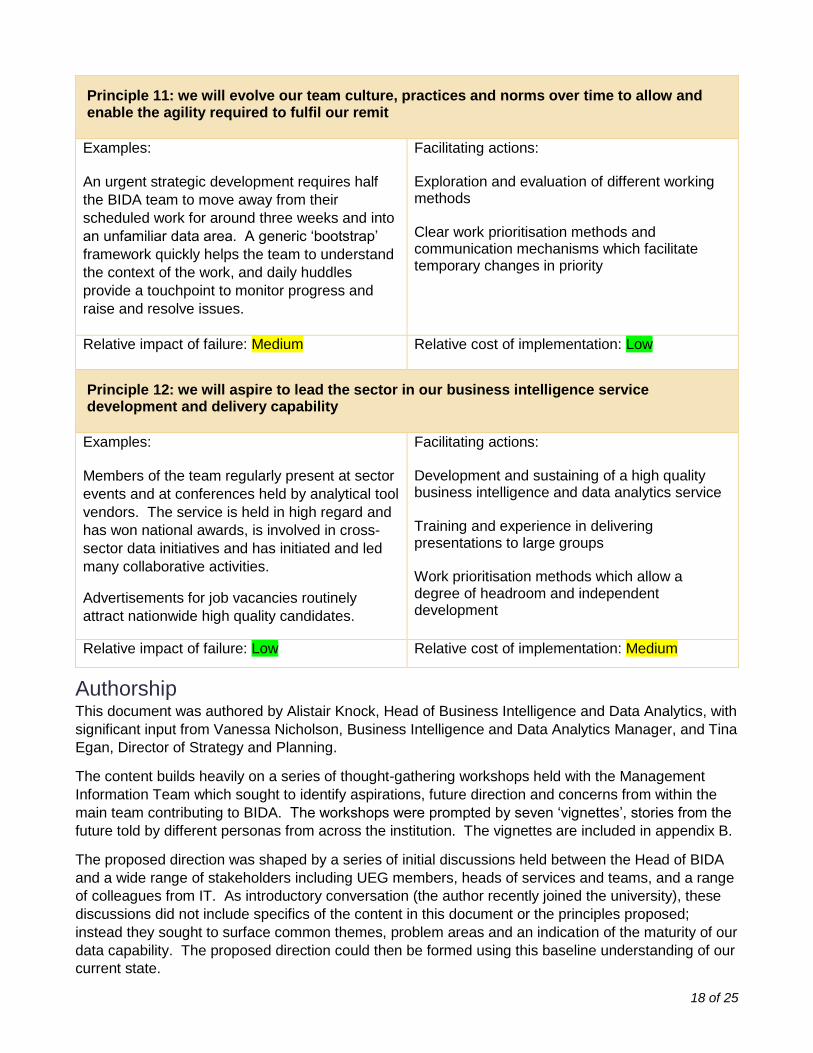
Principle 11: we will evolve our team culture, practices and norms over time to allow and enable the agility required to fulfil our remit
Examples: An urgent strategic development requires half
the BIDA team to move away from their
scheduled work for around three weeks and into
an unfamiliar data area. A generic ‘bootstrap’
framework quickly helps the team to understand
the context of the work, and daily huddles
provide a touchpoint to monitor progress and
raise and resolve issues.
Facilitating actions: Exploration and evaluation of different working methods Clear work prioritisation methods and communication mechanisms which facilitate temporary changes in priority
Relative impact of failure: Medium Relative cost of implementation: Low
Principle 12: we will aspire to lead the sector in our business intelligence service development and delivery capability
Examples: Members of the team regularly present at sector
events and at conferences held by analytical tool
vendors. The service is held in high regard and
has won national awards, is involved in cross-
sector data initiatives and has initiated and led
many collaborative activities.
Advertisements for job vacancies routinely
attract nationwide high quality candidates.
Facilitating actions: Development and sustaining of a high quality business intelligence and data analytics service Training and experience in delivering presentations to large groups Work prioritisation methods which allow a degree of headroom and independent development
Relative impact of failure: Low Relative cost of implementation: Medium
Authorship This document was authored by Alistair Knock, Head of Business Intelligence and Data Analytics, with
significant input from Vanessa Nicholson, Business Intelligence and Data Analytics Manager, and Tina
Egan, Director of Strategy and Planning.
The content builds heavily on a series of thought-gathering workshops held with the Management
Information Team which sought to identify aspirations, future direction and concerns from within the
main team contributing to BIDA. The workshops were prompted by seven ‘vignettes’, stories from the
future told by different personas from across the institution. The vignettes are included in appendix B.
The proposed direction was shaped by a series of initial discussions held between the Head of BIDA
and a wide range of stakeholders including UEG members, heads of services and teams, and a range
of colleagues from IT. As introductory conversation (the author recently joined the university), these
discussions did not include specifics of the content in this document or the principles proposed;
instead they sought to surface common themes, problem areas and an indication of the maturity of our
data capability. The proposed direction could then be formed using this baseline understanding of our
current state.
19 of 25
Appendices
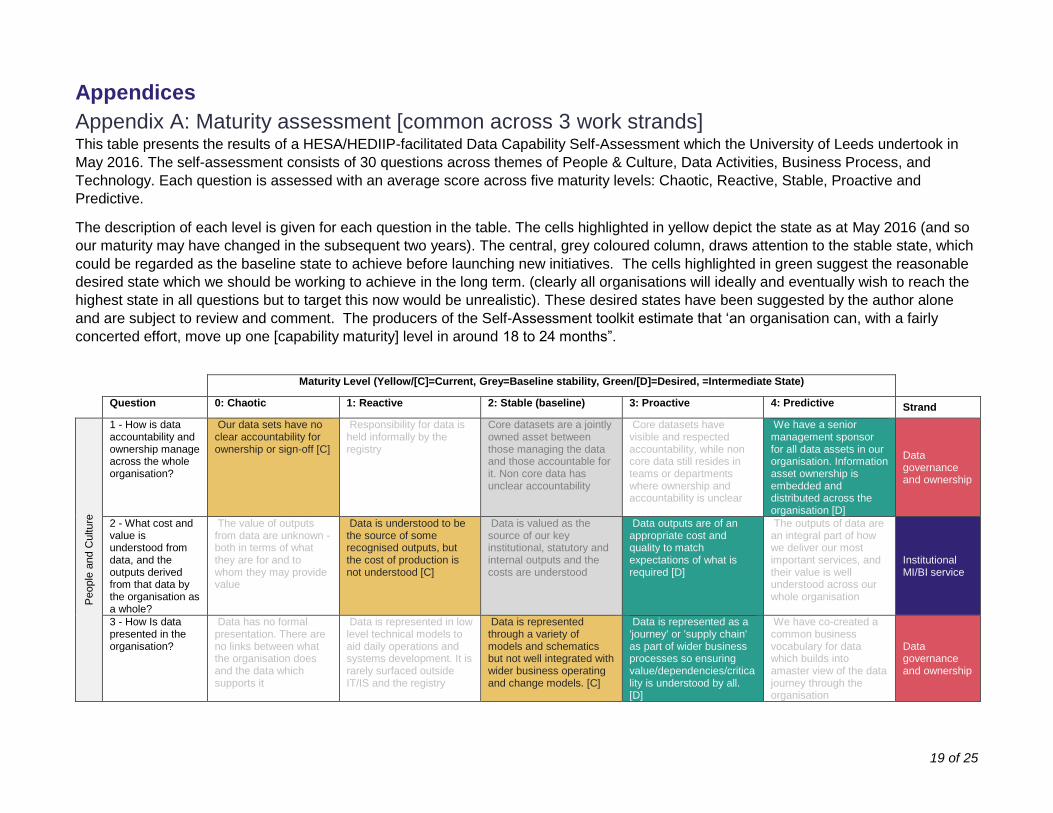
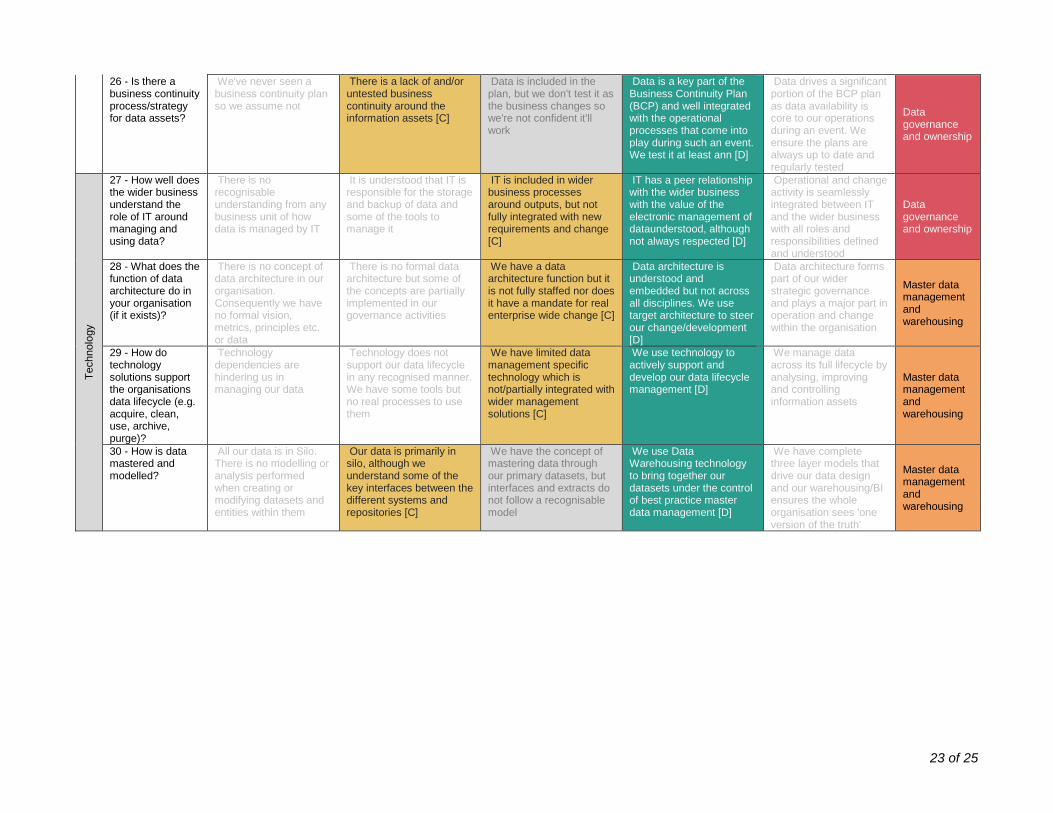
Appendix A: Maturity assessment [common across 3 work strands] This table presents the results of a HESA/HEDIIP-facilitated Data Capability Self-Assessment which the University of Leeds undertook in
May 2016. The self-assessment consists of 30 questions across themes of People & Culture, Data Activities, Business Process, and
Technology. Each question is assessed with an average score across five maturity levels: Chaotic, Reactive, Stable, Proactive and
Predictive.
The description of each level is given for each question in the table. The cells highlighted in yellow depict the state as at May 2016 (and so
our maturity may have changed in the subsequent two years). The central, grey coloured column, draws attention to the stable state, which
could be regarded as the baseline state to achieve before launching new initiatives. The cells highlighted in green suggest the reasonable
desired state which we should be working to achieve in the long term. (clearly all organisations will ideally and eventually wish to reach the
highest state in all questions but to target this now would be unrealistic). These desired states have been suggested by the author alone
and are subject to review and comment. The producers of the Self-Assessment toolkit estimate that ‘an organisation can, with a fairly
concerted effort, move up one [capability maturity] level in around 18 to 24 months”.
Maturity Level (Yellow/[C]=Current, Grey=Baseline stability, Green/[D]=Desired, =Intermediate State)
Question 0: Chaotic 1: Reactive 2: Stable (baseline) 3: Proactive 4: Predictive Strand
People
and C
ulture
1 - How is data accountability and ownership manage across the whole organisation?
Our data sets have no clear accountability for ownership or sign-off [C]
Responsibility for data is held informally by the registry
Core datasets are a jointly owned asset between those managing the data and those accountable for it. Non core data has unclear accountability
Core datasets have visible and respected accountability, while non core data still resides in teams or departments where ownership and accountability is unclear
We have a senior management sponsor for all data assets in our organisation. Information asset ownership is embedded and distributed across the organisation [D]
Data governance and ownership
2 - What cost and value is understood from data, and the outputs derived from that data by the organisation as a whole?
The value of outputs from data are unknown - both in terms of what they are for and to whom they may provide value
Data is understood to be the source of some recognised outputs, but the cost of production is not understood [C]
Data is valued as the source of our key institutional, statutory and internal outputs and the costs are understood
Data outputs are of an appropriate cost and quality to match expectations of what is required [D]
The outputs of data are an integral part of how we deliver our most important services, and their value is well understood across our whole organisation
Institutional MI/BI service
3 - How Is data presented in the organisation?
Data has no formal presentation. There are no links between what the organisation does and the data which supports it
Data is represented in low level technical models to aid daily operations and systems development. It is rarely surfaced outside IT/IS and the registry
Data is represented through a variety of models and schematics but not well integrated with wider business operating and change models. [C]
Data is represented as a 'journey' or 'supply chain' as part of wider business processes so ensuring value/dependencies/criticality is understood by all. [D]
We have co-created a common business vocabulary for data which builds into amaster view of the data journey through the organisation
Data governance and ownership

20 of 25
4 - Do specific roles exist for data management activities e.g. Data Steward, Data Architect, Data Analyst, Report Developer?
We don't have specific roles or any concept of why we would need them
We perform the most basic data management roles, mainly around data cleaning - but they are not formalised [C]
We have some formal data management roles, primarily in operations but the stewardship roles are not filled outside of the registry
We have a number of data specific roles which confer accountability across a variety of departments, for both operations and business change [D]
Our organisation has a range of data 'super-users' in every part of the business advocating and supporting data as an organisational asset
Data governance and ownership
5 - Are data improvement proposals sponsored at a senior management level?
We have no data improvement proposals sponsored at a senior level
We have some ideas that tend to be specific to big problems we're trying to fix. These initiatives can get priority if they are deemed important [C]
Senior management are aware of the value of data improvement, but support is project or issue based
Some data improvement initiatives are supported/run at a senior management level although they often lose support in the long-term
All data improvement initiatives are sponsored by senior management with strong support for providing the resources needed to undertake them [D]
Data governance and ownership
6 - Are data management issues and/or risks recorded in auditable logs and/or risk registers?
We do not perform risk assessments on our datasets. Therefore nothing is recorded in any logs
We record risks and issues in our business unit / departmental risk logs although not always with mitigation [C]
We record and review risks and issues in our corporate risk logs
We effectively manage risk with data using appropriate governance, mitigation, escalation and regular assurance [D]
Risk and quality are actively managed for all datasets. Breaches and metrics are flagged and responded to by senior management
Master data management and warehousing
7 - How are data management principles and goals embedded into wider policy documents?
We don't believe data is referenced in any organisational policies
We have some policies around data but they are not well communicated nor respected
We have data policies, but rarely invoke sanctions if they are breached [C]
We have built actionable policies across multiple functions and they form part of our wider policy library [D]
We ensure that the principles and goals of best practice data management are embedded and advocated in all appropriate policy documents
Data governance and ownership
8 - What is the organisations approach/capability around data analytics?
We have no analytics capability other than spreadsheets in individual departments
Data cannot be easily analysed to support operational or strategic decision making
We have a basic, people driven analytical capability for one or two datasets [C]
A Business Intelligence (or similar) function is in place and providing decision support to more than one department/faculty [D]
We have made an investment in predictive analytics capability and supporting technology in support of our most important activities and aspirations
Institutional MI/BI service
Data
Activitie
s
9 - Is data collected for which there is no obvious purpose or value?
We continue with data collections for no obvious rationale other than 'we've always done this'
We definitely collect data we don't use or collect more than once. We don't know if something will break if we stop collecting it [C]
There is some confusion around why some data is collected, but we understand our primary data feeds and where the master copies are
We use our data models, data governance and business processes to root out unneeded data [D]
We regularly review our data collection activities in line with our operational and strategic needs. Data collection is driven directly from these models
Data governance and ownership
10 - Is the quality of data regularly problematic in terms of frequent and/or repeatable operations?
Data is of inconsistent quality, and that quality is impossible to measure
We clean data far too late so we spend a huge amount of time manually modifying it to get it to a minimum quality state [C]
Our core datasets are of an acceptable quality, but its hard work to keep them that way
We set, monitor and maintain quality metrics for the majority of our data, and at least some of the remedial work is automated [D]
We ensure our data is rigorously maintained to the published levels of quality using well understood metrics
Master data management and warehousing
21 of 25
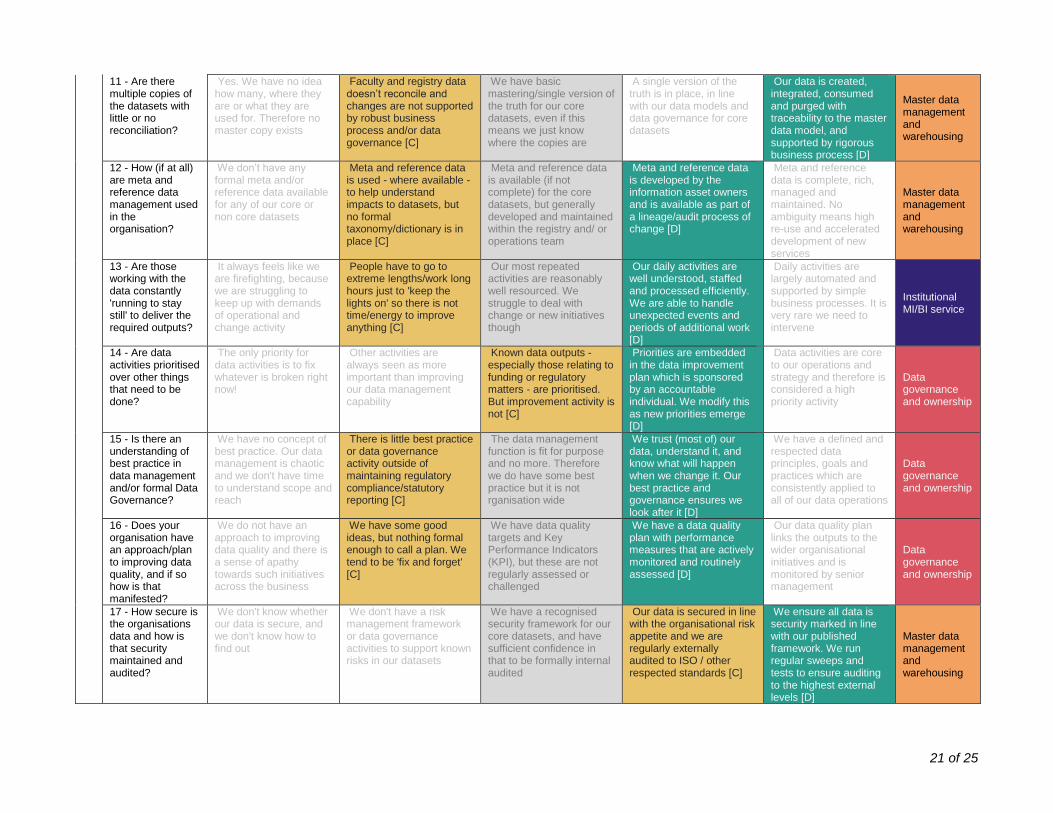
11 - Are there multiple copies of the datasets with little or no reconciliation?
Yes. We have no idea how many, where they are or what they are used for. Therefore no master copy exists
Faculty and registry data doesn’t reconcile and changes are not supported by robust business process and/or data governance [C]
We have basic mastering/single version of the truth for our core datasets, even if this means we just know where the copies are
A single version of the truth is in place, in line with our data models and data governance for core datasets
Our data is created, integrated, consumed and purged with traceability to the master data model, and supported by rigorous business process [D]
Master data management and warehousing
12 - How (if at all) are meta and reference data management used in the organisation?
We don’t have any formal meta and/or reference data available for any of our core or non core datasets
Meta and reference data is used - where available - to help understand impacts to datasets, but no formal taxonomy/dictionary is in place [C]
Meta and reference data is available (if not complete) for the core datasets, but generally developed and maintained within the registry and/ or operations team
Meta and reference data is developed by the information asset owners and is available as part of a lineage/audit process of change [D]
Meta and reference data is complete, rich, managed and maintained. No ambiguity means high re-use and accelerated development of new services
Master data management and warehousing
13 - Are those working with the data constantly 'running to stay still' to deliver the required outputs?
It always feels like we are firefighting, because we are struggling to keep up with demands of operational and change activity
People have to go to extreme lengths/work long hours just to 'keep the lights on' so there is not time/energy to improve anything [C]
Our most repeated activities are reasonably well resourced. We struggle to deal with change or new initiatives though
Our daily activities are well understood, staffed and processed efficiently. We are able to handle unexpected events and periods of additional work [D]
Daily activities are largely automated and supported by simple business processes. It is very rare we need to intervene
Institutional MI/BI service
14 - Are data activities prioritised over other things that need to be done?
The only priority for data activities is to fix whatever is broken right now!
Other activities are always seen as more important than improving our data management capability
Known data outputs - especially those relating to funding or regulatory matters - are prioritised. But improvement activity is not [C]
Priorities are embedded in the data improvement plan which is sponsored by an accountable individual. We modify this as new priorities emerge [D]
Data activities are core to our operations and strategy and therefore is considered a high priority activity
Data governance and ownership
15 - Is there an understanding of best practice in data management and/or formal Data Governance?
We have no concept of best practice. Our data management is chaotic and we don't have time to understand scope and reach
There is little best practice or data governance activity outside of maintaining regulatory compliance/statutory reporting [C]
The data management function is fit for purpose and no more. Therefore we do have some best practice but it is not rganisation wide
We trust (most of) our data, understand it, and know what will happen when we change it. Our best practice and governance ensures we look after it [D]
We have a defined and respected data principles, goals and practices which are consistently applied to all of our data operations
Data governance and ownership
16 - Does your organisation have an approach/plan to improving data quality, and if so how is that manifested?
We do not have an approach to improving data quality and there is a sense of apathy towards such initiatives across the business
We have some good ideas, but nothing formal enough to call a plan. We tend to be 'fix and forget' [C]
We have data quality targets and Key Performance Indicators (KPI), but these are not regularly assessed or challenged
We have a data quality plan with performance measures that are actively monitored and routinely assessed [D]
Our data quality plan links the outputs to the wider organisational initiatives and is monitored by senior management
Data governance and ownership
17 - How secure is the organisations data and how is that security maintained and audited?
We don't know whether our data is secure, and we don't know how to find out
We don't have a risk management framework or data governance activities to support known risks in our datasets
We have a recognised security framework for our core datasets, and have sufficient confidence in that to be formally internal audited
Our data is secured in line with the organisational risk appetite and we are regularly externally audited to ISO / other respected standards [C]
We ensure all data is security marked in line with our published framework. We run regular sweeps and tests to ensure auditing to the highest external levels [D]
Master data management and warehousing
22 of 25
Busin
ess P
rocess
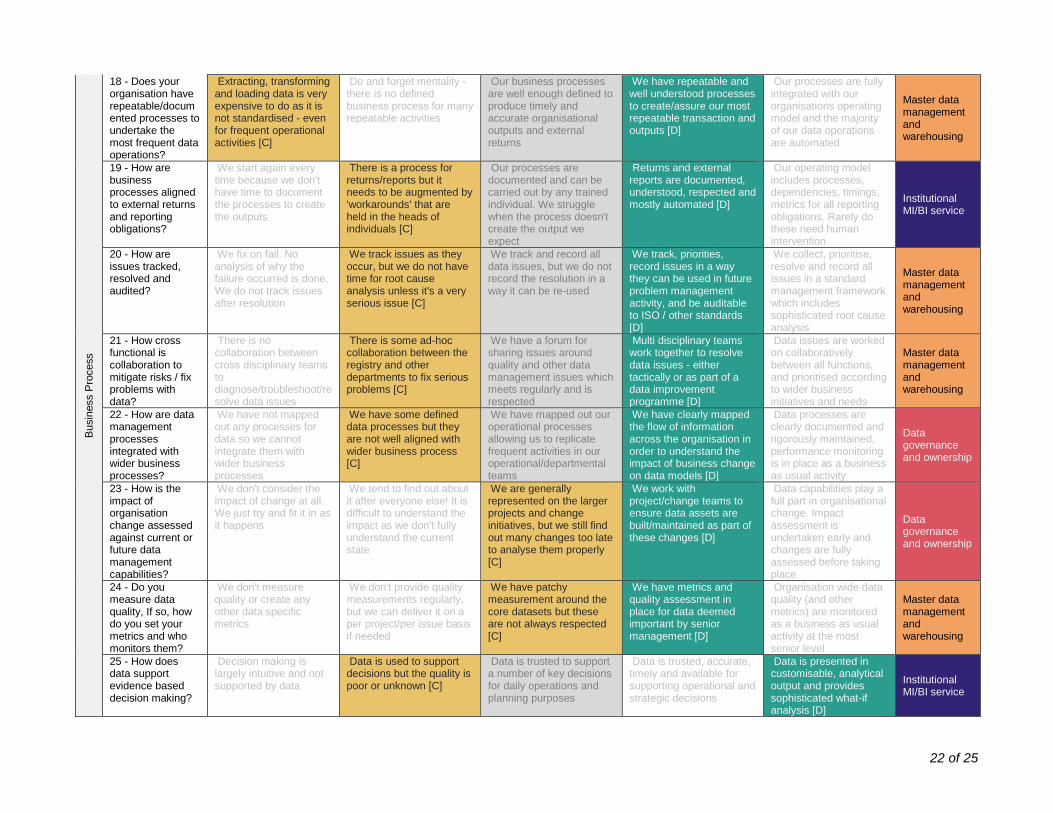
18 - Does your organisation have repeatable/documented processes to undertake the most frequent data operations?
Extracting, transforming and loading data is very expensive to do as it is not standardised - even for frequent operational activities [C]
Do and forget mentality - there is no defined business process for many repeatable activities
Our business processes are well enough defined to produce timely and accurate organisational outputs and external returns
We have repeatable and well understood processes to create/assure our most repeatable transaction and outputs [D]
Our processes are fully integrated with our organisations operating model and the majority of our data operations are automated
Master data management and warehousing
19 - How are business processes aligned to external returns and reporting obligations?
We start again every time because we don't have time to document the processes to create the outputs
There is a process for returns/reports but it needs to be augmented by 'workarounds' that are held in the heads of individuals [C]
Our processes are documented and can be carried out by any trained individual. We struggle when the process doesn't create the output we expect
Returns and external reports are documented, understood, respected and mostly automated [D]
Our operating model includes processes, dependencies, timings, metrics for all reporting obligations. Rarely do these need human intervention
Institutional MI/BI service
20 - How are issues tracked, resolved and audited?
We fix on fail. No analysis of why the failure occurred is done. We do not track issues after resolution
We track issues as they occur, but we do not have time for root cause analysis unless it's a very serious issue [C]
We track and record all data issues, but we do not record the resolution in a way it can be re-used
We track, priorities, record issues in a way they can be used in future problem management activity, and be auditable to ISO / other standards [D]
We collect, prioritise, resolve and record all issues in a standard management framework which includes sophisticated root cause analysis
Master data management and warehousing
21 - How cross functional is collaboration to mitigate risks / fix problems with data?
There is no collaboration between cross disciplinary teams to diagnose/troubleshoot/resolve data issues
There is some ad-hoc collaboration between the registry and other departments to fix serious problems [C]
We have a forum for sharing issues around quality and other data management issues which meets regularly and is respected
Multi disciplinary teams work together to resolve data issues - either tactically or as part of a data improvement programme [D]
Data issues are worked on collaboratively between all functions, and prioritised according to wider business initiatives and needs
Master data management and warehousing
22 - How are data management processes integrated with wider business processes?
We have not mapped out any processes for data so we cannot integrate them with wider business processes
We have some defined data processes but they are not well aligned with wider business process [C]
We have mapped out our operational processes allowing us to replicate frequent activities in our operational/departmental teams
We have clearly mapped the flow of information across the organisation in order to understand the impact of business change on data models [D]
Data processes are clearly documented and rigorously maintained, performance monitoring is in place as a business as usual activity
Data governance and ownership
23 - How is the impact of organisation change assessed against current or future data management capabilities?
We don't consider the impact of change at all. We just try and fit it in as it happens
We tend to find out about it after everyone else! It is difficult to understand the impact as we don't fully understand the current state
We are generally represented on the larger projects and change initiatives, but we still find out many changes too late to analyse them properly [C]
We work with project/change teams to ensure data assets are built/maintained as part of these changes [D]
Data capabilities play a full part in organisational change. Impact assessment is undertaken early and changes are fully assessed before taking place
Data governance and ownership
24 - Do you measure data quality, If so, how do you set your metrics and who monitors them?
We don't measure quality or create any other data specific metrics
We don't provide quality measurements regularly, but we can deliver it on a per project/per issue basis if needed
We have patchy measurement around the core datasets but these are not always respected [C]
We have metrics and quality assessment in place for data deemed important by senior management [D]
Organisation wide data quality (and other metrics) are monitored as a business as usual activity at the most senior level
Master data management and warehousing
25 - How does data support evidence based decision making?
Decision making is largely intuitive and not supported by data
Data is used to support decisions but the quality is poor or unknown [C]
Data is trusted to support a number of key decisions for daily operations and planning purposes
Data is trusted, accurate, timely and available for supporting operational and strategic decisions
Data is presented in customisable, analytical output and provides sophisticated what-if analysis [D]
Institutional MI/BI service
23 of 25
26 - Is there a business continuity process/strategy for data assets?
We've never seen a business continuity plan so we assume not
There is a lack of and/or untested business continuity around the information assets [C]
Data is included in the plan, but we don't test it as the business changes so we're not confident it'll work
Data is a key part of the Business Continuity Plan (BCP) and well integrated with the operational processes that come into play during such an event. We test it at least ann [D]
Data drives a significant portion of the BCP plan as data availability is core to our operations during an event. We ensure the plans are always up to date and regularly tested
Data governance and ownership
Te
chnolo
gy
27 - How well does the wider business understand the role of IT around managing and using data?
There is no recognisable understanding from any business unit of how data is managed by IT
It is understood that IT is responsible for the storage and backup of data and some of the tools to manage it
IT is included in wider business processes around outputs, but not fully integrated with new requirements and change [C]
IT has a peer relationship with the wider business with the value of the electronic management of dataunderstood, although not always respected [D]
Operational and change activity is seamlessly integrated between IT and the wider business with all roles and responsibilities defined and understood
Data governance and ownership
28 - What does the function of data architecture do in your organisation (if it exists)?
There is no concept of data architecture in our organisation. Consequently we have no formal vision, metrics, principles etc. or data
There is no formal data architecture but some of the concepts are partially implemented in our governance activities
We have a data architecture function but it is not fully staffed nor does it have a mandate for real enterprise wide change [C]
Data architecture is understood and embedded but not across all disciplines. We use target architecture to steer our change/development [D]
Data architecture forms part of our wider strategic governance and plays a major part in operation and change within the organisation
Master data management and warehousing
29 - How do technology solutions support the organisations data lifecycle (e.g. acquire, clean, use, archive, purge)?
Technology dependencies are hindering us in managing our data
Technology does not support our data lifecycle in any recognised manner. We have some tools but no real processes to use them
We have limited data management specific technology which is not/partially integrated with wider management solutions [C]
We use technology to actively support and develop our data lifecycle management [D]
We manage data across its full lifecycle by analysing, improving and controlling information assets
Master data management and warehousing
30 - How is data mastered and modelled?
All our data is in Silo. There is no modelling or analysis performed when creating or modifying datasets and entities within them
Our data is primarily in silo, although we understand some of the key interfaces between the different systems and repositories [C]
We have the concept of mastering data through our primary datasets, but interfaces and extracts do not follow a recognisable model
We use Data Warehousing technology to bring together our datasets under the control of best practice master data management [D]
We have complete three layer models that drive our data design and our warehousing/BI ensures the whole organisation sees 'one version of the truth'
Master data management and warehousing

24 of 25
Appendix B: Thought-gathering ‘vignettes’ or ‘personas’

25 of 25