business intelligence and learning, drivers of quality and
TRANSCRIPT

Cleveland State University Cleveland State University
EngagedScholarship@CSU EngagedScholarship@CSU
ETD Archive
2010
Business Intelligence and Learning, Drivers of Quality and Business Intelligence and Learning, Drivers of Quality and
Competitive Performance Competitive Performance
Joseph M. Woodside Cleveland State University
Follow this and additional works at: https://engagedscholarship.csuohio.edu/etdarchive
Part of the Business Commons
How does access to this work benefit you? Let us know! How does access to this work benefit you? Let us know!
Recommended Citation Recommended Citation Woodside, Joseph M., "Business Intelligence and Learning, Drivers of Quality and Competitive Performance" (2010). ETD Archive. 151. https://engagedscholarship.csuohio.edu/etdarchive/151
This Dissertation is brought to you for free and open access by EngagedScholarship@CSU. It has been accepted for inclusion in ETD Archive by an authorized administrator of EngagedScholarship@CSU. For more information, please contact [email protected].
BUSINESS INTELLIGENCE AND LEARNING, DRIVERS OF QUALITY AND
COMPETITIVE PERFORMANCE
JOSEPH M. WOODSIDE
Bachelor of Science Computer Information Science
Cleveland State University
2002
Master of Business Administration
Cleveland State University
2003
submitted in partial fulfillment of requirements for the degree
DOCTOR OF BUSINESS ADMINISTRATION IN INFORMATION SYSTEMS
at the
CLEVELAND STATE UNIVERSITY
2010

Exhibit 7
This dissertation has been approved
For the College of Business Administration
And the College of Graduate Studies by
Dr. Adam Fadlalla Dissertation Committee Chairperson
Computer Science, 5/1/11
Dr. Radha Appan Computer Science, 5/1/11
Dr. Iftikhar Sikder Computer Science, 5/1/11
Dr. Yongjian Fu Engineering, 5/1/11

iii
ABSTRACT
Purpose: As healthcare organizations expand the scope of their operations with an eye
towards cost reductions, quality improvements, sustainability, increased stakeholder
satisfaction and increased performance, they are increasingly investing significant
resources into information systems in general and Business Intelligence Systems (BIS) in
particular to provide the necessary operational and decision support information. This
paper seeks to model the relationships between BIS, learning, quality organization and
competitive performance, as well as measure the influence BIS has on end-user
perceptions of quality and competitive performance from a learning point of view.
Methods: Qualitative and quantitative methods including survey, interview, and case
study instruments to measure the link between BIS, learning models of mental-model
building and mental-model maintenance, quality organization, and competitive
performance. Individual, organizational, system, information, and service characteristics
are explored to measure the relationship between variables. Extending models from
prior-literature, a proposed model is introduced to improve the explanatory power of the
prior model, and extend theoretical, practical, and policy contributions within a
healthcare setting.
Results: Results demonstrate a significant relationship between learning, quality and
competitive performance when utilizing BIS. Information and system quality
characteristics also influence the level of learning. The model increases the explanatory

iv
power over the prior information support systems and learning models and adds
important contributions to healthcare research and practice.
Contribution: Technology improvements and cost reductions have allowed BIS to be
extended to the entire set of organizational stakeholders to provide information for
various forms of decision making. Despite these improvements, there is still a significant
organizational investment and risk to implement and maintain BIS. Expectations and
funding for BIS in healthcare are based on the desire for improved quality and
competitive performance across all levels of the organization. Previous information
systems have not demonstrated a link between multiple forms of learning and competitive
performance. In addition research does not directly address how BIS and learning impact
healthcare quality or discuss BIS specific relationships specifically within a healthcare
setting. BIS which expand the inherent information analysis capabilities and expands
usage to all stakeholders demonstrates a link between both mental-model building,
mental-model maintenance as a component of learning, quality organization and
competitive performance. Through democratizing BIS, organizations can become
sustainable through improved healthcare quality and competitive performance across all
employee levels.

v
TABLE OF CONTENTS
LISTING OF TABLES...................................................................................................... xi
LISTING OF FIGURES .................................................................................................. xiii
DISSERTATION SUMMARY ........................................................................................ xv
CHAPTER
I. INTRODUCTION........................................................................................................... 1
1.1 Background............................................................................................................... 1
1.2 Problem Statement.................................................................................................... 2
1.3 Significance .............................................................................................................. 3
1.4 Research Support and Theoretical Foundations ....................................................... 5
II. LITERATURE REVIEW............................................................................................. 12
2.1 Road to Business Intelligence................................................................................. 12
2.2 Business Intelligence .............................................................................................. 15
2.3 Transactional Systems vs. BIS................................................................................ 17
2.4 Learning .................................................................................................................. 18
2.5 Use vs. Learning as a Success Measure.................................................................. 24
2.6 Healthcare Services Review ................................................................................... 24
2.7 Healthcare Information Systems............................................................................. 26
2.8 Healthcare Organization Quality ............................................................................ 28
2.9 Quality Organization Management......................................................................... 33
2.10 Organization Information Processing Theory....................................................... 34
2.11 Knowledge-Based Theory .................................................................................... 35
III. MODEL & RESEARCH DESIGN............................................................................. 37
vi
3.1 Overview................................................................................................................. 37
3.2 Model Design.......................................................................................................... 40
3.3 Hypothesis and Construct Definition...................................................................... 47
3.3.1 Individual Learning.......................................................................................... 47
3.3.2 Information Quality ......................................................................................... 49
3.3.3 System Quality................................................................................................. 50
3.3.4 Service Quality................................................................................................. 50
3.3.5 Organizational Learning .................................................................................. 51
3.3.6 Quality Organization........................................................................................ 52
3.3.7 Competitive Performance ................................................................................ 53
3.4 Methods .................................................................................................................. 55
3.5 Instruments.............................................................................................................. 55
IV. CASE STUDY ANALYSIS AND RESULTS........................................................... 58
4.1 Organizational background..................................................................................... 58
4.2 BIS Overview ......................................................................................................... 59
4.3 BIS Initiative Team................................................................................................. 60
4.4 BIS Risks ................................................................................................................ 62
4.5 BIS Communication Standards............................................................................... 63
4.6 BIS Problem Statement........................................................................................... 64
4.7 BIS Purpose ............................................................................................................ 64
4.8 BIS Features and Architecture................................................................................ 64
4.9 BIS System Quality ................................................................................................ 66
4.10 BIS Information Quality ....................................................................................... 66

vii
4.11 BIS Service Quality .............................................................................................. 68
4.12 Individual Learning............................................................................................... 69
4.13 Organizational Learning ....................................................................................... 69
4.14 Quality Organization............................................................................................. 71
4.15 Competitive Performance ..................................................................................... 72
4.16 CASE STUDY – Quality Organization ................................................................ 73
4.16.1 Quality Quadrant............................................................................................ 74
4.16.2 Quality Correlation Matrix ............................................................................ 77
4.16.3 Quality Model ................................................................................................ 78
4.16.4 Quality Results............................................................................................... 80
4.17 CASE STUDY – Physician Healthcare Services Review .................................... 81
4.17.1 Overview........................................................................................................ 82
4.17.2 Physician Activity Monitoring....................................................................... 82
4.17.3 Physician Review Results .............................................................................. 83
4.18 CASE STUDY – ITS Service Management ......................................................... 84
4.18.1 Service Management...................................................................................... 84
Service Management Monitoring ............................................................................. 85
4.18.3 ITS Results..................................................................................................... 86
4.19 CASE STUDY – Information Quality Monitoring............................................... 87
4.19.1 Overview........................................................................................................ 87
4.19.2 Information Quality (IQ) Score ..................................................................... 87
4.20 Model Components and Data Triangulation Informing Research Study ............. 88
4.21 Respondent Characteristics................................................................................... 91

viii
V. ANALYSIS METHODS.............................................................................................. 93
5.1 Partial Least Squares............................................................................................... 93
5.2 Assumptions.......................................................................................................... 104
VI. RESULTS................................................................................................................. 105
VII. DISCUSSION ......................................................................................................... 109
7.1 Overview............................................................................................................... 109
7.2 BIS Implications ................................................................................................... 112
7.3 Learning Implications ........................................................................................... 120
7.4 Healthcare Implications ........................................................................................ 123
7.5 Practical Implications ........................................................................................... 125
7.6 Lessons Learned and Identified Best Practices..................................................... 128
7.6.1 Collaborative Culture..................................................................................... 128
7.6.2 Communication.............................................................................................. 128
7.6.3 Customization ................................................................................................ 129
7.6.4 Project Management ...................................................................................... 130
7.6.5 Resources ....................................................................................................... 130
7.6.6 Top Management Support.............................................................................. 131
7.6.7 Training.......................................................................................................... 132
7.6.8 Vertical Architecture...................................................................................... 132
7.6.9 Perception-Based Success Factors................................................................. 133
7.7 Success Components............................................................................................. 135
7.7.1 BI Platform Metrics (KPI’s) .......................................................................... 136
7.7.2 Unique Visitors .............................................................................................. 137

ix
7.7.3 Average Action Time..................................................................................... 137
7.7.4 Usage.............................................................................................................. 138
7.7.5 Release Management ..................................................................................... 138
7.7.6 Departmental Survey ..................................................................................... 139
7.8 Return on Business Intelligence Investment (ROBII) .......................................... 140
7.9 CSF Key Findings................................................................................................. 141
7.10 Business Intelligence Research and Competency Center (BIRCC) ................... 142
7.11 BIS Governance Plan.......................................................................................... 144
7.12 Combined BIS Model Specification ................................................................... 146
7.13 Limitations .......................................................................................................... 146
7.14 Contributions ...................................................................................................... 147
VIII. CONCLUSION...................................................................................................... 149
IX. FUTURE DIRECTIONS.......................................................................................... 151
9.1 Business Intelligence 2.0 ...................................................................................... 153
9.2 Enterprise Integration ........................................................................................... 154
9.3 Healthcare Applications........................................................................................ 155
9.4 Model .................................................................................................................... 158
9.5 Future Directions Conclusion ............................................................................... 162
REFERENCES ............................................................................................................... 163
APPENDIX..................................................................................................................... 171
Measurement Tool ...................................................................................................... 171
Interview Questions .................................................................................................... 177
Construct Development & Definitions ....................................................................... 179

x
Analysis Methods ....................................................................................................... 182
xi
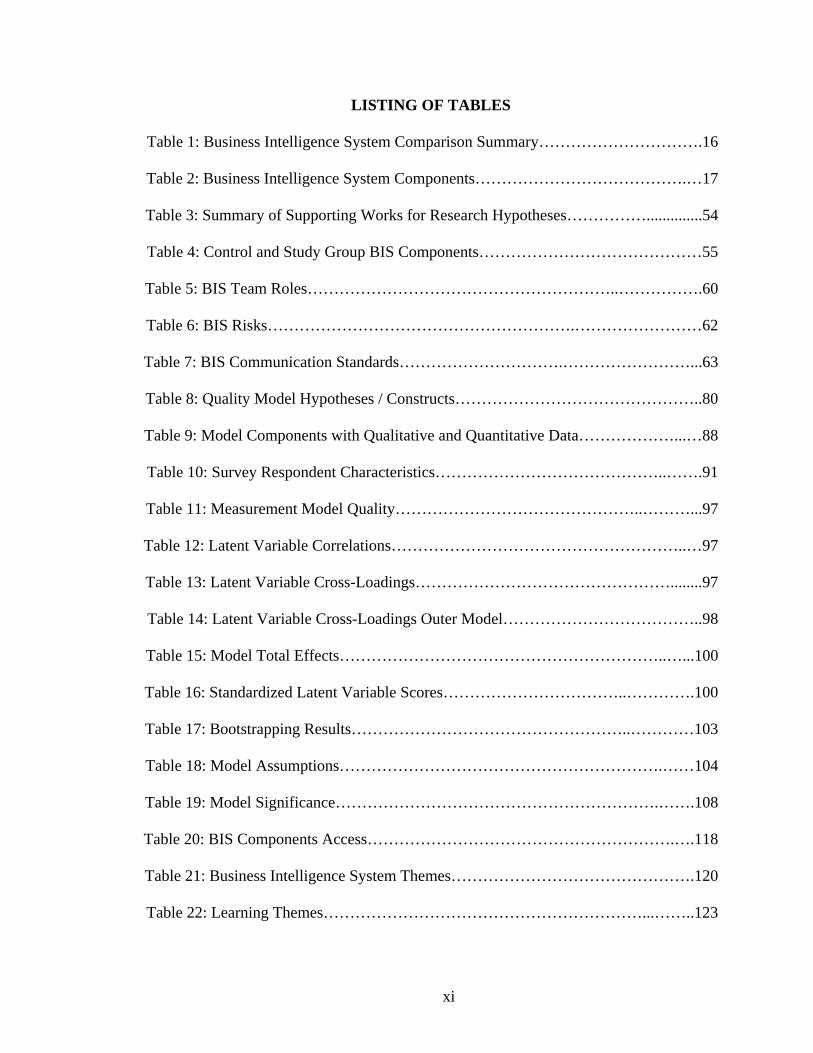
LISTING OF TABLES
Table 1: Business Intelligence System Comparison Summary………………………….16
Table 2: Business Intelligence System Components………………………………….…17
Table 3: Summary of Supporting Works for Research Hypotheses……………..............54 Table 4: Control and Study Group BIS Components……………………………………55
Table 5: BIS Team Roles…………………………………………………..…………….60 Table 6: BIS Risks………………………………………………….……………………62 Table 7: BIS Communication Standards………………………….……………………...63 Table 8: Quality Model Hypotheses / Constructs………………………………………..80 Table 9: Model Components with Qualitative and Quantitative Data………………...…88 Table 10: Survey Respondent Characteristics……………………………………..…….91 Table 11: Measurement Model Quality………………………………………..………...97 Table 12: Latent Variable Correlations………………………………………………..…97 Table 13: Latent Variable Cross-Loadings…………………………………………........97 Table 14: Latent Variable Cross-Loadings Outer Model………………………………..98 Table 15: Model Total Effects……………………………………………………..…...100 Table 16: Standardized Latent Variable Scores……………………………..………….100 Table 17: Bootstrapping Results……………………………………………..…………103 Table 18: Model Assumptions…………………………………………………….……104 Table 19: Model Significance…………………………………………………….…….108 Table 20: BIS Components Access………………………………………………….….118 Table 21: Business Intelligence System Themes……………………………………….120 Table 22: Learning Themes……………………………………………………...……..123

xii
Table 23: Summary of Supporting CSF Works……………….………………………..133
Table 24: CSF Measurement Model Quality……………………………...……………135 Table 25: Return on Business Intelligence Investment Components…………………..140 Table 26: BIS Governance Plan Components………………………………………….145
Table 27: Healthcare Data Mining Applications……………………………………….156

xiii
LISTING OF FIGURES Figure 1: Transactional Systems vs. BIS………………………………………………...19 Figure 2: Healthcare Services Review Decision Process……………………………..…40 Figure 3: IS Success Model………………………………………………...……………41 Figure 4: ESS Model…………………………………………………..…………………43 Figure 5: Learning Model……………………………………………..…………………44 Figure 6: BIS Model…………………………………………..…………………………46 Figure 7: BIS Features and Architecture Releases and Iterations…………………..……65 Figure 8: Quality Quadrant………………………………………………………………77 Figure 9: Quality Correlation Matrix……………………………….……………………78 Figure 10: Quality Model ………………………………………………………...……80 Figure 11: Quality Organization Relative Improvements…………………………..……81 Figure 12: Relative Physician Productivity………………………………………...……83 Figure 13: Physician Activity……………………………………………………………83 Figure 14: Physician Productivity Improvements……………………………..…………84 Figure 15: ITS Scorecard…………………………………………………...……………85 Figure 16: Server Dashboard………………………………………………….…………86 Figure 17: Self-Service BIS Runs…………………………………..……………………87 Figure 18: Information Quality (IQ) Score………………………………………………88 Figure 19: Study Group Model Significance…………………………...………………106 Figure 20: Control Group Model Significance…………………………………………107 Figure 21: Final BIS Model Specification…………………………………………...…108 Figure 22: Sample BI Vertical Architecture……………………………………………116

xiv
Figure 23: BIS Learning Tools…………………………………………………………121 Figure 24: HIT Quality Project Plan……………………………………………………127 Figure 25: BI Implementation Success Model…………………………………….……134 Figure 26: Business Intelligence Project Scorecard……………………………….……136 Figure 27: Percentage of Active Users as Number of Employees………………...……137 Figure 28: BI Contribution Pre-Post Implementation for Select Measures……….……139 Figure 29: BIRCC Structure……………………………………………………………144 Figure 30: Combined BIS Model Specification………………………………...………146 Figure 31: Healthcare Data Mining Services Architecture………………………......…160 Figure 32: Healthcare Data Mining Services Example…………………………………161
xv
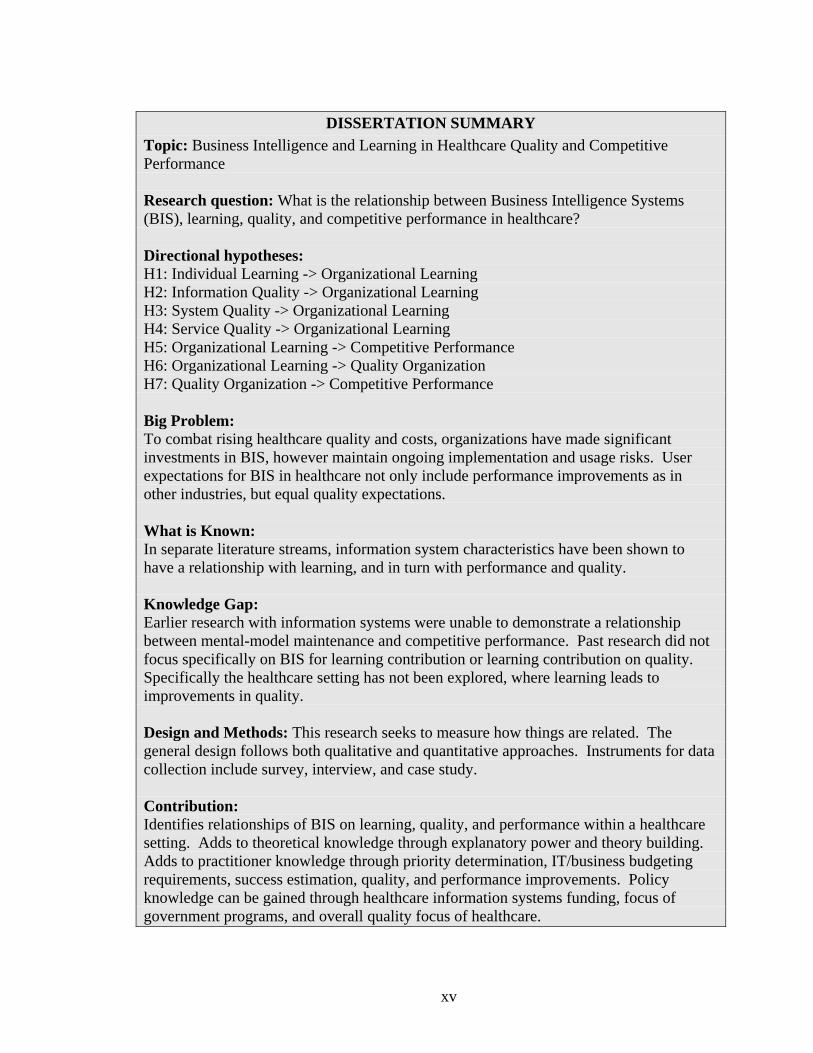
DISSERTATION SUMMARY Topic: Business Intelligence and Learning in Healthcare Quality and Competitive Performance Research question: What is the relationship between Business Intelligence Systems (BIS), learning, quality, and competitive performance in healthcare? Directional hypotheses: H1: Individual Learning -> Organizational Learning H2: Information Quality -> Organizational Learning H3: System Quality -> Organizational Learning H4: Service Quality -> Organizational Learning H5: Organizational Learning -> Competitive Performance H6: Organizational Learning -> Quality Organization H7: Quality Organization -> Competitive Performance Big Problem: To combat rising healthcare quality and costs, organizations have made significant investments in BIS, however maintain ongoing implementation and usage risks. User expectations for BIS in healthcare not only include performance improvements as in other industries, but equal quality expectations. What is Known: In separate literature streams, information system characteristics have been shown to have a relationship with learning, and in turn with performance and quality. Knowledge Gap: Earlier research with information systems were unable to demonstrate a relationship between mental-model maintenance and competitive performance. Past research did not focus specifically on BIS for learning contribution or learning contribution on quality. Specifically the healthcare setting has not been explored, where learning leads to improvements in quality. Design and Methods: This research seeks to measure how things are related. The general design follows both qualitative and quantitative approaches. Instruments for data collection include survey, interview, and case study. Contribution: Identifies relationships of BIS on learning, quality, and performance within a healthcare setting. Adds to theoretical knowledge through explanatory power and theory building. Adds to practitioner knowledge through priority determination, IT/business budgeting requirements, success estimation, quality, and performance improvements. Policy knowledge can be gained through healthcare information systems funding, focus of government programs, and overall quality focus of healthcare.
1
I. INTRODUCTION 1.1 Background
Organizations are increasingly widening their focus to all stakeholders. These
stakeholders include executives, line level employees, partners, and individual customers.
Sustainability is becoming an apparent theme throughout various industries, and refers to
the balance between short and long term requirements, as well as the balance between the
individual and their environment. Sustainability should be integrated into the business
and as a part of performance management culture and program to improve individual
learning. One key to learning is generating goals, and monitoring those goals through an
information system, and creating action plans. When fully applied, this can become a
competitive advantage for the organization through early identification of potential risks
and opportunities. Organizations require full integration of diverse requirements in a
manner that benefits all stakeholders during decision making processes. To address and
support the needs of all stakeholders, organizations increasingly turn to advanced BIS in

2
order to sustain and improve learning and associated quality and competitive
performance [1, 2].
1.2 Problem Statement
Business Intelligence (BI) is a high adoption and high growth area, as users
quickly value the capabilities and increasingly demand more BI capabilities. However,
from a return on investment (ROI) standpoint, BI is similar to ERP and CRM, in that it
has a poor risk/reward profile, as it regularly runs into cost overruns, due to scope creep
and limitless requests for support from end-users [3]. Unlike operational systems which
often have specific requirements and implementation completion timelines, BI
environments are constantly evolving to meeting business and information requirements
[4]. In order to effectively measure BI success, multiple constructs can be utilized, and
several approaches should be chosen to identify success measures based on research
objectives and investigation during development of the research model [5].
In response to stakeholder and organizational requirements of increased
information accessibility, generated technology value, healthcare quality and cost
improvements, BIS are implemented to provide data warehousing, performance
management, reporting, and analysis capabilities to the organization in support of
decision making and learning, in order to achieve sustained quality and competitive
performance. Prior studies with alternative systems to BIS, were not able to demonstrate
a link between multiple forms of learning and competitive performance. When
discussing sustainability, the modern healthcare organization must be provided with the
tools necessary to improve upon existing information and decision making capabilities.

3
This study addresses the relationship between BIS, quality and competitive performance
when viewed through a learning perspective and empirically demonstrates that
relationship through use of survey, interviews, and case study within the healthcare
setting. This study also presents several key findings and best practices as identified
through prior literature review and a formal case study, which extends and enhances prior
literature and understanding of BI.
1.3 Significance
Due to recent economic downturn, organizations are increasing modifying various
strategies and quality improvement initiatives to continue viability. Organizations have
invested substantial resources and time into information systems, yet still have difficulty
achieving quality improvements and competitive advantages [6]. While research has
addressed general quality aspects within an industry [7], it does not directly address (1)
how BIS information quality practices affect quality across the entire organization (2)
what BIS factors lead to and sustain a quality organization and competitive performance.
Additionally no known literature specifically addresses quality organizations and
competitive performance effects of BIS information quality through learning. Further
investments have been made within BIS for streamlined access and analysis of
information for decisions, and is touted as the next step for companies to achieve
competitive performance [6-8].
While many other industry sectors have seen budget reductions, the healthcare
industry is seeing renewed interest in information technology spending due to recent
government initiatives, with $19 billion earmarked for computerized systems to help to
4
reduce costs and improve quality [9]. Despite this, computerization alone does not cause
automatic increases in productivity, but rather is a critical component of organizational
improvements [10]. Healthcare executives have noted that while federal programs and
incentives for health IT are valuable, the key driver is quality, through improved health
outcomes and organizational excellence. The value is justified through improving patient
care, and providing a global patient view, through improved systems, interoperability,
efficiencies, cost savings, and revenue growth [11]. Typically, major general purpose
technologies require substantial resource commitments, and occur over time. BIS are
increasingly addressing key areas of need within healthcare in a more timely manner such
as errors, closed system architectures, data integration, partial standards, master data
management, and competing vendors [12].
Although there is a small body of growing research on BIS, literature specifically
addressing learning, quality, and competitive performance relationships of BIS is
missing. Additionally, while a significant amount of effort and funding is occurring
presently within the healthcare information technology sector, no known literature
specifically addresses healthcare quality and competitive performance effects of BIS
through learning. This study will demonstrate relationship significance of BIS on
learning, quality and competitive performance improvements over prior methods,
specifically within the healthcare industry.
To achieve a quality organization, healthcare entities are increasingly adopting
BIS capabilities to assist with performance management and continuous improvement. A
BIS process framework is presented for managing a quality organization and improving
operational efficiencies, through presentation of a case study for achieving a quality

5
organization as measured through stakeholder satisfaction. The BIS capabilities and
processes allow for individual organization’s to focus specifically on those areas which
have the greatest impact on becoming a quality organization. Significant results are
demonstrated following the proposed process framework, leading to improved
organizational quality. As healthcare organizations seek to continually improve overall
quality, BIS plays a critical role in providing streamlined access to summarized
information utilized for decision making.
While there is a well-documented link between quality and customer, employee,
and shareholder satisfaction in prior management literature, past studies have shown
conflicting results in the directional relationships between customer, employee, and
shareholder satisfaction. This is often attributed to the need for measurements over time
and firm variability. Within the healthcare industry, organizations have not always had
the appropriate healthcare information technology (HIT) to monitor, analyze, and
improve all aspects of customer, employee, and shareholder satisfaction simultaneously,
utilizing a formal process framework. In addition healthcare quality is often difficult to
define and measure based on the various stakeholder requirements. There are often
considerable variances between healthcare and non-healthcare industries, as well as
variances within organizational sub-units, requiring a method for continuous monitoring
and improvement that is tailored to the individual healthcare organization. A case study
is employed, along with a descriptive process framework, to monitor, analyze, and plan
for organizational quality management.
1.4 Research Support and Theoretical Foundations

6
Support for applying BIS to mental-model maintenance, mental-model building,
quality, and competitive performance improvements occurs from the following areas:
learning and knowledge theories, user base, utilized methods, healthcare information
systems research, and current industry research. Healthcare represents a complex and
knowledge-rich domain, requiring multiple learning theories to explain. Collaboration
occurs regularly, with cognition formed by social and technical components. The
environment requires efficient information gathering and decision making for patient
care. Research such as technology-based decision support, web-based health care
information, online learning environments, and collaboration tools have contributed to
cognitive and learning sciences. Learning theories have evolved from looking at
memorization to understanding, and have often influence organizational practices.
Complementary theories have been developed to address a variety of learning scenarios
from simple structured learning domains to complex unstructured learning domains.
Learning in complex unstructured domains require a strong basis of knowledge and self-
monitoring of practice, understanding beyond memorization, include multiple problem
scenarios, prior experience, and regular assessment of learning [13].
Many systems do not provide the necessary capabilities that all users require such
as adapting to rapidly changing environments, scalability, and real-time decision making.
In order to make the required decisions, users must sift through increasing amounts of
information, while maintaining production efficiency. Information processing theory,
from cognitive physiology discusses limitations to the amount of information received,
processed, and remembered. These cognitive concepts allow further support for research
into learning [14-16]. Organizations have invested in information systems in order to

7
increase information processing capabilities and drive performance. Today’s technology
savvy users increasingly require their own dashboards, analytics, and report generation
through a web-based interface to aid in decision making [8, 14-18].
Nonaka (1994) discusses dynamic theory of organizational knowledge creation,
which is created through tacit and explicit knowledge patterns. Organizational
knowledge is an upward spiral from individuals, to groups, to organizations, and inter-
organizations. BIS can assist with internalizing explicit knowledge is to increase the
user's understanding of the knowledge or mental-model maintenance. Understanding
includes the purpose or what the user wants to understand, system or process to be
understood, and arguments about the design purpose. BIS can also assist with
internalizing explicit and new knowledge, or helping a user to learn through mental-
model building. Modification to an internal mental model can be one form of
internalizing explicit knowledge. A user may modify their mental model based on
discovery of relationships for example. Another mental model modification may be
relative weighting of factors. Quality may also be dependent on the ability balance
control and learning. Control is maintained through formal methods and elimination of
variances. Learning is maintained through organizational learning and continuous
improvement [19-22].
The historical user base for ESS was small, representing only top level employees
due to cost or perceived need. With BIS, the user base is expanded to all or most
stakeholders, significantly improving usage and user base over ESS. Mental models have
been linked with performance and effectiveness of a team. These teams can demonstrate
better planning, coordination, and effectiveness through a shared mental model. When

8
organizational members share information or mental model similarity, task processes and
outcomes, they understand perspectives, communicate easier, and coordinate more
effectively, leading to improved performance. Decisions based on shared knowledge and
understanding yields improved decision making quality [17, 18, 23, 24].
Knowledge-based theory of the firm posits knowledge as a strategic firm
resource, and a source of sustained competitive advantage. In the past, ESS decisions
were typically made periodically regarding strategic items of importance and only within
executive staff or only a small percentage of users, as they are expected to yield the most
decision making ability. Their use was mandatory, and as a result is often dependent on
the support of the executives or individual users. Today BIS not only supports strategic
decision making, but additional capabilities are employed to support wider ranges of
business functions such as operational process improvement, and use of BIS is now
increasingly being used by various levels of the organization. These systems also focus
on the capability to move between aggregated and detailed data, and use key performance
indicators to track organizational items This has allowed line and operational level
employees full access to information to make day-to-day decisions [17, 18, 25, 26].
Research has shown that increased quality services are relational to increased
market share, profits, cost savings, and competitive performance. Quality is also often
identified as a marketing and financial performance driver. Quality perceptions of patient
have been found to account for up to 27% of financial variances in earnings, revenue, and
asset returns. In addition negative word of mouth advertising can cost upwards of
$400,000 in revenue loss throughout a patient’s lifetime. Quality literature also
recommends empowerment of line-level employees, through self-management. In

9
quality literature however, there is only fractional discussion to participation by non-
managerial users. Many managers, including top executives, have difficulty delegating
authority and responsibility down through the organization. To resolve, information
control which once gave middle management power where decisions were made up the
chain, can be completed by the individual employees [21, 27-29].
Due to the complexities of healthcare application architectures, effectiveness and
positive outcomes of BIS are not a given. Healthcare software and hardware vendors are
considered less mature than in other industries. Additional healthcare challenges include
technology, leadership, resource allocation, governing structures, healthcare practices
changes, and social challenges. Research analysis has shown the importance of research
within the healthcare context, when compared within more general IS research. A vast
majority of studies focused on IS theory building or reference within a healthcare setting,
which suggests the healthcare industry has differing intentions and organizations than
traditionally studied IS industries. While traditional formulation and testing of IS
theories have focused their attention on studies of social context, organizational systems,
national organizations, socio-economic, government, or culture influences, relatively few
have focused on interaction of IS with regard to industry characteristics. Healthcare
industry characteristics and organizations differ significantly from traditional IS studies
industries such as manufacturing, airlines, financial, and information technology. The
healthcare industry has additional regulatory requirements, national differences, structure,
financial profit models, and professional roles of medical and administration staff. The
complex healthcare structures increase complexity for information systems development
and implementation. Healthcare measurements include cost, profit, customer satisfaction

10
similar to other industries, but also include social measures including quality of life,
disease prevalence, and overall health. When considering existing IS theory, topics, and
constructs within healthcare, theories require reshaping and modification to details with
specific contextual issues. General theory development poses challenges when applied to
healthcare research, as the theory must be beyond the healthcare context, which social
scientists have questioned as viable [30].
Health information systems research (HISR) describes the multidisciplinary body
of knowledge related to design, development, implementation, and use of information
systems in healthcare, with the largest contributor being medical informatics described as
optimal problem-solving and decision making using biomedical information. The field
draws from medicine, computer science, and information science, sociology, diffusion of
medical technologies, information systems, health science, and information science.
Analysis of HISR publications within IS showed a small but growing literature set. HRIS
analysis also recommends utilizing both generalized and specialized theory, due to the
technical and institutional requirements of traditional firms vs. healthcare in IS research.
IS theory may be modified to apply to the healthcare context, and also more general to
apply beyond healthcare. In healthcare, IS theory is often far from practitioners and
researchers, and healthcare context is far from many IS researchers. Development of
healthcare contextual research within IS is recommended to build theoretical bridges to
assist with information collaboration and exchange [30].
Current industry research supports the notion of democratization, which is the
idea of allowing information to be available to all stakeholders, driving improved
learning across the organization. Resource-based view and extended dynamic

11
capabilities, discusses how resources are utilized within a firm for sustained competitive
advantage. IS are key to adapting in dynamic environments, and development,
integration and release of resources. Leading vendors have recently deployed software
aimed at bringing BIS capabilities to all users in order to increase efficiency and decision
making. In the past these vendors focused on technology experts only, but now attempt
to cater to everyone in the organization. In a recent Gartner survey [17], the majority of
respondents indicate that improving decision making through social software and
collaboration is a top trend as opposed to formal, top down decision making. Savvy IT
leaders are driving this change, as they exploit current interest in sites such as Facebook
which allow collaboration and sharing. Meanwhile data used for decision making,
traditionally was pulled from only databases, but now comes from a variety of sources
[17, 18, 31, 32]. We hypothesize these fundamental shifts and associated improvements
within BIS will lead to enhanced learning, a quality organization, and competitive
performance.

12
II. LITERATURE REVIEW
Literature review from healthcare, BIS, learning, quality, and competitive
performance were utilized to develop the research model and relationships between those
areas. BIS literature added studies which described learning through BIS usage, and the
evolution of earlier information systems to BIS. Learning literature discussed theories to
the way individuals and organizations learn. Healthcare literature described the current
challenges and opportunities facing healthcare, as well as the quality imperative
contained within the healthcare framework. Management and organizational literature
discussed the individual and system attributes which effected success and had a BIS
impact on learning and competitive performance.
2.1 Road to Business Intelligence
Beginning in the late 1960s, experiments began with Decision Support Systems
(DSS), utilizing computers to analyze data and offer decision-making support. DSS were

13
typically used for narrowly focused activities such as production planning, investment
management, and transportation applications. With the introduction of software
applications such as SAS and SPSS in the 1970s, statistical software became more
available and accessible to end users. Despite this introduction, DSS did not prosper and
evolved into Executive Support Systems (ESS). ESS were utilized by executives for
viewing performance and focused less on decision making support. ESS also didn't enjoy
widespread usage due to resistance by executives to hands-on usage. Since then, data
warehousing and querying is most frequently used to monitor performance and decision
making support. The entire field today is known as Business Intelligence (BI) and
includes collection, management, and reporting of decision making data and information.
BIS are the number one technology priority for organizations according to industry
surveys [8, 33].
As organizations looked for new sources of competitive advantage and
differentiation they turned to data, which was becoming more available than ever before,
through use of Enterprise Resource Planning (ERP) systems, point-of-sale (POS), web,
and other transactional and operational systems. This data was commonly fragmented,
incomplete, and in a non friendly form to users. Unbeknownst to users at the time, this
data was a significant organizational asset, which would later be leveraged for success
and competitive advantage. In order to realize these benefits however, the data must be
developed into an enterprise wide unified view. Construction and integration of
knowledge is a key to succeeding in the competitive global market. Information
Technology moved to support day-to-day operations and all aspects of decision making,
with differentiation through technology becoming increasingly important [8, 33].

14
Firms have made major investments in such systems as enterprise resource
planning (ERP), supply chain management (SCM) and customer relationship
management (CRM), yet struggle to achieve competitive advantage. Firms need
streamlined access and analysis of the underlying information in order to make
operational decisions. Strategic organizations sought to improve efficiency through
faster and better-informed decision making, and looked to technology to enhance
strategic and tactical results to improve time to market, connectivity, integration, and
visibility into their business. New generations of technology savvy users and executives
were finding ways to utilize previously untapped information [8, 33].
ESS were utilized to provide senior managers relevant information to their
activities. Decision making is an important role for executives; however they must rely
on information systems for their decision making in a data-centric world. Decision
support systems were in place in the late 1970s and are found in most organizations.
However DSS tend to focus only on a particular decision or set of decisions, and several
inputs are required to prepare the analysis [34].
The feature found in most ESS was single database access with current
organizational information, in an easy to access manner. ESS usage was also found to be
positively related to problem identification, decision making, and analysis. Other ESS
features included non-keyboard interface, organizational database, drill-down
capabilities, trend analysis, exception reports, graphics, and critical information
monitoring. The focus of an ESS was on the organizations day-to-day activities as well
as marketplace indicators. A DSS by contrast was intended to allow on demand
decisions and routine analysis [34].

15
ESS are sometimes referred to as high-risk/high-return systems, as the systems
serve executives whose information needs are complex, but also have greater influence.
Organizations and executives require constant information to quickly and proactively
respond to technology, competition, regulation, and economic changes. ESS provide
executives easy to use information that supports their critical success objectives. The
identified critical success factors of ESS included sponsor support, timely data, and
overcoming political resistance. Continuous and detailed interaction was required
between executives and developers to ensure operational success. Data management,
requirements documentation, easy to use interface, relevant, accurate, and timely data
was also required. Prototyping was recommended to capture executive interest at the
highest level [35].
2.2 Business Intelligence
BI is not a single product, application, program, user, area, or system, rather an all
encompassing architecture of integrated systems and methods that provide all
stakeholders with information for decision making and learning. Competitive pressures
cause organizations to continually improve and adapt in order to be successful in the ever
changing business environment, and information is required by employees throughout all
levels of the organization for ongoing decision making [4, 6, 8, 36-38].
BIS refers to applications and technologies used to gather, capture, access,
consolidate, and analyze information to improve decision making. These systems capture
important metrics on business operations, as well as providing a mechanism for improved
decision making. At the various levels these information items may include documents,

16
calendars, wikis, links, reports, dashboards, scorecards, search, databases, lists, user
knowledge, and much more. For example, these technologies can help coordinate
projects, calendars, schedules, discuss ideas, review documents, share information, keep
in touch with others, utilize Key Performance Indicators (KPI) to gauge operational
status, and generate reporting information on-demand. The BIS process is one that
allows large amounts of disparate data to come together into a single repository and turn
that data into meaningful information for decision support processes. BIS can include
various forms of analysis, data mining, scorecards, dashboards, metrics, reporting,
portals, data warehouse, OLAP, decision support, knowledge management, etc. This
information is available to all levels of the organization and associated stakeholders, on-
demand, and in an easy-to-use fashion [4, 8, 38, 39].
BIS are becoming more critical to organizations. These capabilities are utilized to
increase power of workers to make decisions on factual data. Typically however, only a
fraction of this data is housed, and a significant portion resides within firm employees,
requiring systems to capture, store, and disseminate this data. The effectiveness of BIS
will be measured on its ability to promote and enhance knowledge, mental models,
decision making, learning, and ultimately firm performance [40].
Table 1. Business Intelligence System Comparison Summary
BIS Component DSS ESS BIS Knowledge Management X Content Management X Performance Management X X End-User Tools X X X Querying / Reporting X X X Analysis X X X Database Management System X X X

17
Table 2. Business Intelligence System Components
BIS Components Description Online Analytical Processing (OLAP) Multi-dimensional analysis; "slice and dice"
Data Mining Uncovering hidden relationships and patterns in data
Predictive Analysis Identify future values or events, based on historical data
Business Analysis Understanding of business problem or opportunity
Statistical Analysis Hypothesis testing on numerical data Geospatial Analysis Geographic or time based data review Scorecard Ties operations with strategy; multiple KPIs
Strategy Maps Illustrates cause and effect of key indicators; long-term strategy with operational activities
Key Performance Indicators Metric tied to a target Querying Data retrieval programming Reporting Output used to analyze raw data Knowledge Management Information collection and management Portal Central landing point Dashboard Focus on operational goals; visual summary Charting Way of presenting data via graphic Data Warehouse Collects and stores data from various sources Data Mart Single distinct collection of data Operational Data Store Transactional storage for operational purposes Content Management Storage and retrieval of information Search Location of information Operational System Integration CRM, ERP extensions and integration points ETL Extract, Transform, Load data processing MetaData Data about data
2.3 Transactional Systems vs. BIS
Many companies store data readily, yet struggle to utilize this information in
meaningful ways. Transactional systems are often relied on to review information and

18
make decisions, however these systems are often ill-equipped. Transactional systems are
not designed for advanced analytics and business intelligence, and impact technical
infrastructures through increased complexity to allow for business intelligence.
Specialized BIS are required to conduct ad-hoc analysis, data mining, and complex
queries across multiple datasets. Transactional systems are optimized for transaction
processing and write speed. BIS are designed for immediate access to volumes of data
and read speed. These systems work in conjunction with one another to achieve best
results and firm performance [41]. The figure below describes the common components
contained within a transactional and BIS.
2.4 Learning
Mental models are psychological representations of real, hypothetical, or
imaginary situations, and the individual representation used for reasoning. Mental
models allow users to understand phenomena, make inferences, respond appropriately to
a situation, and define strategies, environment, problems, technology, and tasks. An
example of a definition problem may be resource allocation or organizational strategy.
These mental models can be based on one's belief of the truth, and are often simpler than
the represented phenomenon, composed of knowledge/behavior/attitude, created through
interactions with the environment. Mental models influence behavior and create
reasoning basis, which improve human decision making, by allowing pre-defined models,
which speed information processing. This permits information systems to fill in any
gaps, and improve information management. Some drawbacks may include human bias
to confirm pre-existing models [18, 23, 24].

19
Figure 1: Transactional Systems vs. BIS
BIS are intended to provide all stakeholders with high quality, easy to use, and
relevant information for decision making. They are flexible enough to provide support
for a variety of user requirements. To measure their success, one may gauge whether
they help users learn. Learning is defined as a purposeful remembering displayed

20
through skillful performance, and measured as potential change in performance behavior,
as the change may occur at a point in time after the information is collected [18].
In order to gain insight into how BIS support competitive performance, it is
important to understand which factors distinguish mental model development.
Competitive performance can be operationalized at a lower level to improve survey
results. Future research can determine how mental model maintenance influences
performance such as efficiency, effectiveness, innovation, and consensus building, due to
its multidimensional nature and assumption of benefit. Authors recommend quantitative
and qualitative research, as well as case studies to understand why information systems
are used and the results of those systems, as well as allowing more precise
operationalization of constructs for measurement and observation. Here, the view of
success is based on learning rather than typical metrics of usage and technical
characteristics such as accuracy, timeliness and reliability [18].
Organizational learning has become a critical component of enhancing the
competitiveness of a firm. Organizational learning is a key strategy in enhancing
competitive advantages, achieving superior performance, and sustainability [42].
Organizational learning can be regarded as a group of people who decide to enhance their
capabilities to produce desired outcomes. Organizational learning refers to a set of
measureable changes, and closely match individual learning models. Specifically key
aspects of organizational learning include the ability to develop goals, modify goals over
time, and monitor progress of common goals. Individual learning and organizational
learning effectiveness can be measured similarly. For example, when an individual is
able to set a goal, monitor, progress, and achieve that goal they are deemed effective at
21
learning. Similarly, when an organization is able to set goals, monitor, progress, and
achieve those goals they are also able to be effective [43].
A required component of organizational learning is individual learning. In
individual learning, mental models are used and cannot be directly shared, but rather
represented thereby enabling others to observe, share, and investigate. A learning
organization allows individual to use facilitating tools to allow organizational observation
and representation of structure and performance. Individual in an organization form their
own mental models, but also observe and share mental models with others, eventually
resulting in a shared vision of common goals. Diffusion and manifestation of ideas over
time is a key indicator of a learning organization [43]. Organizational theorists recognize
that individuals process and interpret information, yet assume that organizations are
beyond mere individuals due to individual changes, with organizational knowledge,
behaviors, mental models, and visions. The distinguishing feature can be classified as
sharing, many sub-systems exist for completing tasks and requirements, which is then
converges and is aggregated at an organizational level [44].
Organizational learning has increased complexity over a simple extension of
individual learning. This complexity is evidence as the scope is broadened from a single
individual to a group of individuals with varying characteristics. Learning terms remain
similar, though the learning process is changed at an organizational level, with the
organizational learning vs. an individual. As an organization increases the number and
background of individuals, and increasing shift occurs from individual learning to
organizational learning. A seemingly apparent conflict arises, such that an organization
is more than just individuals, and an organization exists only through its individuals. In

22
an integrated model proposed by Kim (1993), individual learning effects organizational
level learning through changes in shared mental models. Organizational memory in the
form of shared mental models are then accessible by the organizational, and continually
improved by individuals learning, with the entire process independent of any one
individual. [45].
To achieve organizational learning, a commitment to learning must occur through
employee training, development, and vision. Shared visions throughout the organization,
and open mindedness to encourage innovation and follow consistent practices. The
organizational learning process includes aggregation of internal and external information,
which is then analyzed and interpreted collectively to allow organizational
comprehension and consensus, and incorporated into activities [46]. Structural and
sociological issues have traditionally limited organizational learning in health care. New
systems of care delivery and reimbursement are requiring physicians and providers to
collaborate with others. Organizational learning is required, along with information
systems to ensure clinical, economic, and customer satisfaction information is measured
to improve quality and cost of care [47].
Organizational learning can be driven by technology, and help improve other
output measures beyond financial measures, to measures such as such as quality or new
business opportunities. Learning organizations are competent is systematic problem
solving, attempting new approaches, learning from past experience an best practices, and
knowledge transfer, which can by driven by information systems. Historical measures of
learning focused on learning curves or cost of goods reduction, however these measures
only provide a partial picture. To accurately measure learning, organizations must also

23
include variables such as quality or innovation. Organizational learning is able to be
tracked over cognitive, behavioral, and performance improvements, with cognitive and
behavioral changes leading to performance through new ways of thinking and methods.
Surveys, questionnaires, interviews, and performance measures must be utilized to
accurately gauge organizational learning [48].
Theories of learning have developed from behavioral theories to knowledge
application theories. The set of cognitive theories studies information organization in
memory, learning, and decision making in an effort to maximize learning. Situative or
situated learning theory is concerned with organizations instead of individuals, and views
cognition as a component of a collection of individuals and the environment. All
interactions and activities are determined utilizing the available information and artifacts,
and learning can take place though any social activity. An organization following the
situtative approach would develop collaborative learning environments, where learning is
encouraged and knowledge valued. Cognitive flexibility theory (CFT) is intended to
describe learning in complex domains, and where knowledge application requires
interaction of multiple complex components. CFT is based on constructivism, where
learners develop models of reality and incorporate meaning based on prior knowledge.
CFT promotes constructive processing which allows flexibility with regard to combining
prior and current information to the specific application. This concept is required in
advanced knowledge domains, where everyday problem solving must adapt to changing
contexts and requirements. Healthcare is an example where complex medical tasks
require various strategies to diagnosis conditions and identify all potential factors
involved [13].

24
2.5 Use vs. Learning as a Success Measure
In DeLone and McLean (2003) IS Success review, some authors discuss
removing system use as it is a behavior and must precede net benefits, but does not cause
them. DeLone and McLean argue that use is appropriate for a success measure. One of
the challenges is that use is a simplified approach to a complex component. Implications
that increased use will lead to increase benefits is unlikely without determining the
factors that go into use such as type, duration, intention, etc. In DeLone and McLean use
measures effectiveness success, with use capturing a variety of tasks such as web visits,
information capture, or transactions. DeLone and McLean recommend for each
individual research study, IS success measures should be based on the investigation and
tested where possible. Use should not measure frequency alone, but instead capture the
nature, level, and appropriateness of usage. Also practical research should be conducted
to expand net benefits ideas [49].
In Vandenbosch and Higgins (1995), the authors found that performance from
ESS use were only related to mental model building, but not mental model maintenance,
implying that use alone may not affect learning models. The description is that learning
developed from any system cannot occur unless through using said system to some
degree. The view of success is not simply that the system is used, but rather that they
contribute to learning, which was viewed as a more appropriate way to measure success
[18].
2.6 Healthcare Services Review

25
As one of the major efforts to reduce healthcare costs and ensure consistency
between healthcare entities, Electronic Data Interchange (EDI) standards have been
created for healthcare information exchange. The Health Insurance Portability and
Accountability Act of 1996 (HIPAA) includes provisions for Administrative
Simplification, which require the Secretary of Department of Health and Human Services
to adopt standards to support the electronic exchange of administrative and financial
health care transactions primarily between health care providers and plans. Transaction
standards and specifications were adopted by the secretary to enable health information to
be exchanged electronically. Implementation Guides for each standard have been
produced at the time of adoption, and consistent usage of the standards including loops,
segments, data elements, etc., across all guides is mandatory to support the Secretary’s
commitment to standardization [50].
Healthcare services reviews are typically exchanged through the 278 HIPPA EDI
transaction set. Business events covered under the HIPAA 278 healthcare services and
review transaction include: admission certification review request and response, referral
review request and associated response, health care services certification review request
and response, extended certification review and response, and dental referrals and
certifications. Additional business events can be represented, as well as notification such
as patient arrival, patient discharge, patient certification change, and certification notice
to provider or utilization management organization. In a typical process, information is
sent from the requesting entity such as a primary provider and received by a receiving
entity which can determine the outcome of the request, such as an utilization management
organization or service provider. Information can flow bi-directionally to allow for

26
inquiries on pending certifications, as well as response of certification result. Both batch
and real-time information may be sent between entities, however real-time is preferable
due to immediate result during patient presence and processing [51].
2.7 Healthcare Information Systems
Traditionally, healthcare organizations investments in information systems have
lagged any other information-intensive industries such as financial or aviation industries.
During the late 1990s, investment by American industry in information technology was
an average of eight times higher per worker than within the healthcare industry. Despite
additional spending on health information technology, there are still issues relating to
costs, errors, efficiency and coordination of care, which reflect the limited saturation of
health information technology within healthcare systems. For example, inefficient paper
based systems, inaccessible medical information during care, limited patient access to
health information, misinterpreted handwriting and unavailable best treatment options
affect current healthcare systems [52, 53].
Most current hospital systems have little to no clinical decision support, such as
patient information displays, alerts, reminders, and guidelines. Studies have shown that
computerized reminders are useful in chronic care, and healthcare safety is improved
through checking common problem areas and key abnormalities. Computerized decision
support can also improve both efficiency and quality of healthcare through real-time
access to information that is highly integrated. Typically those systems cannot easily
communicate between one another, which makes extracting data for decision support
even more difficult. In addition, communication aspects are also improved between

27
patients, providers, and hospitals. Through integration of multiple electronic data
sources, patients can be proactively identified for certain conditions or issues [52].
Healthcare stakeholders promote the use of HIS as a way to provide safe,
affordable and consumer-oriented healthcare. This includes avoiding medical errors, the
improved use of resources, accelerated diffusion of knowledge, reduction in access
variability, consumer role advancement, privacy and data protection, and public health
and preparedness. HIS have been shown to decrease billing issues, medical and drug
errors, and improve patient health, use of medical evidence, cash flow and collections,
paper cost, quality, safety, research, compliance, and preventative care. In addition, the
need for quality measures is driving HIS adoption. Increasingly, providers are being
measured on quality, and that quality is tied to pay for performance or other programs
that directly affect the payment to the provider. EHR systems make quality measures
available for reporting and compliance requirements. In perhaps one of the largest EHR
implementation case studies, the Veterans Health Administration showed improvements
in employee-patient ratios and cost-per-patient decreases as compared with the US
consumer price index increase. Quality also is improved through preventative screening
measures and disease management [53].
Today, health care organizations are becoming increasingly computerized,
thereby capturing increasing amounts of data in various places. In other industries,
information systems use increase, can be tied to improved quality and competitive
advantage. Extracting, formatting, analyzing, and presenting this data, can improve
quality, safety, and efficiency of delivery within a healthcare system. For example BIS
has been used in radiology to address the complex, poorly integrated, and functionally
28
limited legacy systems as practices transitioned from analog to digital. BIS allow the
decision making to develop trends and interactively perform drill downs to answer further
questions as they become apparent. Procedural and performance metrics can be tracked
to improve patient care and reduce costs. Some examples include resource utilization by
scanner, time variances between scheduled and actual time, evidence-based outcomes,
billing tracking, and quality outcomes measurements such as length of stay and charge
costs [52, 54].
Recent driving forces by technology-enabled stakeholders, have created electronic
medical records as a component of HIS, and allowed access by patients, providers, and
affiliated users. It is believed that access to information will allow patients and providers
to have joint responsibility for health records, including up to date information, and self-
management of conditions, ultimately leading to active management of care and
improved quality. Literature has shown the right information in the hands of patients,
providers, case managers, and others leads to improved patient outcomes and quality.
The introduction of information systems to collect, store, and analyze data, has also
allowed payors and administrators to track providers against their peers to create
accountability for evidence-based medicine and best practices for quality of care [55-57].
2.8 Healthcare Organization Quality
Quality has become an organizational phenomenon over the past few decades, due
to increasing competition, uncertain business environments, technological advances and
stakeholder requirements. Quality occurs through meeting and exceeding past, present,
and future stakeholder requirements. A typical continuous improvement cycle includes

29
developing stakeholder requirements, meeting those requirements, measuring success,
and periodic reevaluation of requirements for improvement identification. Quality
traditionally was used to describe products, but has been extended to include stakeholder
expectations and associated satisfaction. In order to exceed stakeholder requirements
beyond simply contractual or legislative items, organizations are monitoring quality of
organizational service offerings. The past decade has given rise to a notion of a quality
organization, in which goods and services must achieve the highest possible quality
throughout the organization [7, 21, 27, 28, 58-60].
Global competition has required organizations to implement quality services,
products, and programs. Total quality management (TQM) which contains a similar set
of practices across industries, began in the 1980's, and improved organizational positions
by superseding global competition and environment changes. Total quality management
may be defined as continuous improvement of quality throughout all systems and
processes, with active participation by all levels and units of stakeholders internally and
externally to the organization, and through information integration and quality outputs.
For organization wide total quality, cross-functional management and communication
structures are required, in order to bring together competing priorities, and range of
individual abilities to achieve set objectives. When total quality management fails, it is
typically due to missing complementary resources required for competitive advantage. In
order to succeed and achieve organizational quality strategies, strong backing by top
management, information systems, and a stakeholder focused culture are required.
Additional requirements include application of quality assurance and improvement to all
organizational subsystems, such as individual department or business process areas.

30
However, typically either individual subsystems are reviewed, or the total integrated
system is reviewed, versus a preferred look at each individual subsystem, with total
integration secondarily [7, 21, 28, 58, 59, 61].
Organizations must link strategies, actions, and measures in order to achieve
quality benefits. Performance management components should be based on the
organizational success factors, and tracked systematically. Healthcare service
organizations experience additional difficulty in process identification and management
due to low IS utilization, whereas historic manufacturing organizations have high
utilization of IS, such as ERP, SCM, and CRM systems to measure performance. In a
healthcare setting, IS can be used to connect employers, healthcare providers, and
patients to efficiently monitor and manage patient status during treatment and
employment return. One framework for assessing and improving organizations for
sustainable advantage is the Excellence Model Framework. The framework identifies
many ways to achieve sustainable excellence, and key concepts include: results
orientation, customer focus, leadership and constancy of purpose, management by
processes and facts, people development and involvement, continuous learning,
innovation and improvement, partnership development, and corporate social
responsibility. Organizational excellence is optimal usage of resources and information
to maximize results, with increasing levels of stakeholder interaction, to allow continued
performance [21, 62].
Despite the need for quality, TQM has led initially to high levels of turnover.
Organizations must find ways to continue to motivate and retain employees, with
employee participation a critical component to quality, and the associated personal

31
enrichment which goes along with direct involvement and decision making. In an
employee improvement process, individual transformation and understanding of
knowledge will occur, in which the individual will add new meaning to events and
interactions. Second, they will have a judgment and decision basis for organizational
transformations. They will also assist others to move into similar practices and
capabilities, leading to improved organizational quality. In one case example, a quality
database was developed to track and provide updated information to employees for
improving quality. As a result of the employee’s quality efforts and assistance of
information systems, rejection levels were reduced from 10% TO 5% [27, 59].
Quality of health care delivery and rapid, measurable, and sustainable
improvements are a high priority for health systems. Like quality in most services,
healthcare quality is difficult to measure owing to inherent intangibility, heterogeneity
and inseparability features. For example, quality in healthcare is more challenging to
determine than in financial or aviation industries, as in healthcare the output is
individually perceived quality of life. AHRQ identifies improving quality of health care,
and ensuring no one is left behind in quality improvement, as two key public policy
challenges. Required annual congressional NHQR and NHDR reports, examine health
care system quality and disparities through key measures. The reports identify several
improvement areas such as recommended cancer screenings, nutrition counseling,
environment changes to improve asthma related conditions, and recommended diabetes
screenings. Overall access and quality of care is often determined based on racial, ethnic,
or economic grouping. Successful quality improvement has been demonstrated at a
state and national level, and most measures of quality are improving, however at only a

32
modest pace, with a 3.1% improvement rate over the last 3 years. AHRQ has turned to
more advanced information systems capabilities through web-based tools and improved
data, graphing, and reporting, to increase access and insight into quality trends. For
example, state snapshots, allow graphical dashboard comparison of measures, and
identify quality improvement areas [29, 63].
Organizational variables are often used to explain patterns and differences in
quality of care. Research has identified the importance of system and organizational
influences on provider beliefs and behavior towards implementations [16]. Quality
improvement proponents have recommended a healthcare quality information system
(HQIS) to accurately measure and mange healthcare quality information collection,
analysis, and reporting. Outcomes and treatment cost improvements exist, and the public
is seeking more information regarding healthcare quality, in order to make informed
decisions. To ensure successful HQIS, hardware, software, and a complete information
framework of standard data fields and processes must be developed [64].
A number of studies have identified patient views and satisfaction as a tool in
monitoring and improving healthcare quality. A patient-centered data structure is often
implemented, linked by a patient id, and utilized to manage quality of care. Quality
typically includes both a technical dimension, and a functional dimension. Patients may
be unable to accurately determine technical quality, and typically functional quality is
used as the primary method. Despite much literature on healthcare quality, few tools
exist for assessing and managing said quality. Within the healthcare services review
sector, direct patient care is affected, and key components of quality are supported
through BIS capabilities [29, 64, 65].

33
2.9 Quality Organization Management
To achieve a quality organization, healthcare entities must balance the needs of
various stakeholders. For example financial returns must be weighed against quality of
care provided to customers, and training provided to employees. Within service sectors
such as healthcare, employee requirements, resulting interaction with customers, and
impact on shareholder returns all must be considered with a greater degree. Other
industries have experienced similar challenges in balancing stakeholder requirements.
For example, financial companies such as Citigroup, Goldman Sachs, and Bank of
America, were recently targeted for allocating large contributions directly to employee
salaries in preference over shareholders. The average payout ratio for employee
compensation was roughly 60 cents per dollar, similar to retail and healthcare, though
payout ratios vary widely, in some cases exceeding total profit [66].
Due to competitive markets and globalization, organizations must continually
seek to add value to their services, deliver additional profits, and exceed customer
expectations. Satisfied employees tend to be more involved and dedicated to quality.
Presenting positive employees leads to a positive customer attitude towards a given
product. Dissatisfied or hostile employees create hostile customers regardless of the
organization’s tasks and service performance. Customer satisfaction has also been shown
to have a long-term profit impact. Satisfied customers are more likely to purchase in
greater quantity, with greater frequency, and add additional services. Satisfied customers
are also more willing to pay premiums and are less-price sensitive than non-satisfied
customers [67].

34
2.10 Organization Information Processing Theory
Organizational information processing theory addresses the ability to satisfy
information processing needs and is a major task in organizational design. To resolve
uncertainty, the organization must take steps to reduce information needs, or increase
information processing capability through information systems. The information system
output may be a vast amount of information detail, as well as capabilities for identifying
required information. Uncertainty can be describes as limited information regarding
tasks, environment, etc. and may change between individuals and units of the
organization. OIPT identifies performance benefits from integrated and standardized
information systems, and are related to interdependence between organizational units.
Interdependence can be described as the level to which units share information in order to
complete their appropriate tasks. In situations of low interdependence simple procedures
are acceptable, however high interdependence requires increases information
requirements. Firms have implemented ERP and other information systems to improve
information flow and develop standards for improved information exchange by removing
conversion or translation needs [16, 56, 68].
Information quality is vital as for organizations to reduce uncertainty and enhance
their decision making capabilities. System quality is addressed through information
processing needs, or the supported communication requirements based on individual and
unit interactions as well as system support for information processing capability through
use of technologies. Service quality may also be described through information

35
processing capability through the information technology support given to end users to
assist with performance outcomes [69].
2.11 Knowledge-Based Theory
The main intention of the knowledge-based view (KBV) of the firm is leveraging
knowledge for improved net benefits. Knowledge may be defined as the repository of
intellectual assets which have been combined from experience, learning, and practice.
Knowledge is often described in terms of data and information; however knowledge can
only be distinguished through an individual's personalization, and interpretability to
others. Increasing amounts of information are only useful when processed by an
individual through learning processes. Knowledge is also often the basis for quality
improvement activities within the organization. Under conditions of uncertainty and
complexity, total quality control and total quality learning have been found to result in
improved performance over total quality control alone. Quality is found to influence
organizational performance through effective deployment. The Knowledge Based View
of the firm provides a theoretical basis for this concept, in that quality management leads
to knowledge generation and associated performance [70-72].
Human knowledge may be classified into explicit and tacit knowledge. Explicit
knowledge is easily transferred, whereas tacit knowledge is difficult to transfer. Explicit
knowledge is codified and may be transmitted in a formal language. Tacit knowledge is
personal, making communication in a formal language difficult. Tacit knowledge
includes cognitive elements and technical elements. The cognitive elements include
mental models, in which beliefs, viewpoints, paradigms, and schemas help an individual

36
to see their world, and develop reality and visions for the future. The technical elements
involve know-how, crafts, and skills in specific settings. At the lowest level of grain,
knowledge is developed through individuals, to which the organization supports
individuals and provides a forum for knowledge creation and exchange, and amplifies
individual knowledge at an organizational level. Knowledge begins with the individual,
then flows to higher-level groups, organizations, and inter-organizations. Knowledge
conversion was developed from the ACT model in cognitive psychology. There
knowledge is separated into declarative and procedural, roughly matching explicit and
tacit respectively. The ACT model proposes that declarative knowledge must be
transformed into procedural knowledge to acquire cognitive skills, and is similar to
know-why vs. know-how [20, 71].
Knowledge creation can be described as an interacting spiral between explicit and
tacit knowledge, including socialization, externalization, combination, and
internalization. Socialization, or tacit to tacit interaction, involves sharing experiences
and creating shared mental models. Socialization requires individual interaction through
discussion, mentoring, observation, imitation, and practice. Externalization, or tacit to
explicit interaction, involves the use of metaphors, analogies, concepts, or models, and is
known as conceptual knowledge. Combination, or explicit to explicit interaction, may be
developed through sorting, adding, combining, categorizing existing explicit knowledge.
Internalization, or explicit to tacit knowledge, involves utilizing documentation, manuals,
or stories, and internalizing the knowledge. Internalization may occur thorough learning
by doing, and referred to as operational knowledge [20, 71].

37
III. MODEL & RESEARCH DESIGN
3.1 Overview
This study seeks to model healthcare industry components, and more specifically
includes the healthcare services review decision process and associated
support/administrative processes, as the basis for BIS, organizational learning, healthcare
quality, and competitive performance. Healthcare services reviews are typically
exchanged through the 278 HIPPA EDI transaction set. Business events covered under
the HIPAA 278 healthcare services and review transaction include: admission
certification review request and response, referral review request and associated response,
health care services certification review request and response, extended certification
review and response, and dental referrals and certifications. Additional business events
can be represented, as well as notification such as patient arrival, patient discharge,
patient certification change, and certification notice to provider or utilization
management organization (WPC 2000). This is a critical administrative component of

38
care, more largely known as Medical Management, with decisions made that affect
coverage and access to care, and is intended to improve quality and cost of care. The
healthcare services review decision process begins with data entry or electronic
transmission, online through a web-based interface either directly by the provider of
service or the review organization. The next phase may include automatic decision rules,
and/or non-physician determinations. Upon physician decision, an appeal may be levied
upon presentation of additional information or re-review, in which case the initial
decision may be upheld or overturned. As the number of decisions in the healthcare
services review process increase, the overall cost and time increase. Key Performance
Indicators (KPI) are tracked to monitor performance, improvement, quality, and
competitive performance. The process is shown in the figure below.
The services covered under medical management include utilization management,
case management, disease management and services reviews. Medical management also
includes the associated systems which permit integrated delivery of care and information,
which support quality and cost improvements, and HIS applications have been found to
improve medical management programs. While much progress from paper to
computerized systems has occurred over the past decade, further analysis found that a
low percentage of organizations had a truly integrated system, with information and data
readily accessible to clinical and administrative staff [73].
During interviews with executives, managers, and professional staff, before,
during, and after BIS implementation and from review of prior literature, a path-analytic
BIS learning model was proposed as shown in Figure 1. Literature review from
healthcare, BIS, learning, management, and information systems were utilized to develop

39
the research model and relationships between those areas. The model displays the impact
of BIS information quality on perceptions of healthcare quality and competitive
performance when utilized to support organizational learning. A path-analytic model
with latent variables is chosen to allow assessment of validity and determination of
hypothetical constructs. The model also accounts for variable measurement error, to
allow the underlying relationships to be measured rather than the individual manifest
variables, by removing the error variance from the latent factors and modeling separately.
Information quality is included as an antecedent to learning in the model. The objective
of this paper was to better explain the elements which influence learning models, and if
organizational learning, healthcare quality and competitive performance are dependent on
BIS characteristics.

40
Figure 2: Healthcare Services Review Decision Process
3.2 Model Design
DeLone and McLean (1992, 2003) identified factors which contribute to
information systems success, and developed a model to combine various segmented
research studies into the topic of IS success. Their overall model consists of 7 main
components for IS success: system quality, information quality, service quality, use, user
satisfaction, individual impact and organizational impact. The authors recommend that

41
dependent and independent variable selection should consider organizational strategy,
structure, size, environment, technology used, task characteristics, and individual
characteristics. DeLone and McLean (2003) also introduce the notion of net benefits as
the most important outcome, which incorporates overall IS impacts beyond the initial
user, and include all stakeholder impacts of IS. The impacts which are measured should
depend on the systems and purpose of the study. The model is shown in the figure below
[49, 74]. For this study, this model is relevant to providing factors and measures for BIS
antecedents to learning, with healthcare specific net benefits of quality and competitive
performance.
Figure 3: IS Success Model
Vandenbosch and Higgens (1995) studied ESS and associated success, a
precursor to BIS. The authors incorporated a learning construct to gauge individual
impact. While both mental-model maintenance and mental-model building contribute to
an organizations success, maintenance is considered to be the more likely behavior, and

42
implies routine use of the learned techniques. Model-building however is found to be of
higher risk in organizations, and benefits are more difficult to produce. New
organizational endeavors or areas of interest have longer life spans and a higher degree of
uncertainty. Competitive sustainability requires the ability to explore model-building, but
also relies on the organizations ability to continuously monitor performance.
Organizations should ensure the appropriate criteria is in place to promote mental model
building and mental model maintenance [18].
Vandenbosch and Higgens (1995) found significance with regard to mental model
building, but not mental model maintenance. Possible explanations for no significant link
between mental-model maintenance and perceived competitive performance when
utilizing ESS include: high-level operationalization of competitive performance in the
survey, competitive performance attributable to mental-model maintenance is too small
to measure, executives utilize varying information sources and do not relate competitive
performance to ESS use, previous management literature suggests that mental-model
maintenance is not as critical to long-term competitive performance as with mental-
model building and survey items may have influenced a long-term perspective when
considering competitive performance [18].
The presence of an analysis capability was identified by Vandenbosch and
Higgens (1995) as the best method for differentiating between mental-model maintenance
and mental-model building. In order to aid comparison of pre-existing research of ESS
with BIS, the prior model by Vandenbosch and Higgens (1995) is utilized as shown in the
figure below [18]. BIS is seen as having improved analysis capabilities and reach over
prior ESS and DSS applications. Incorporating the sustainability considerations, and the

43
intended use of BIS across the stakeholder group, the model seeks to identify the
capability of BIS to support both mental-model building and mental-model maintenance
through organizational learning and contribute to sustained success for the organization
through improved quality and perceptions of competitive performance.
Figure 4: ESS Model
Ruiz et. al (2006) developed a model for technology, individual learning, and
organizational learning. Organizational learning is a shared understanding which is
increased through individual contributions of tacit and explicit information resulting from
combinations of socialization, externalization. Research studies which apply information
system design to support organizational learning are applicable to knowledge
management. Organizational learning was found to be improved through information
systems and individual learning, however organizational performance was found to be
improved only through individual and organizational learning, but not information
systems, such that performance can be improved vis-à-vis learning [75].

44
Figure 5: Learning Model This study, similar to Kim (1993), considers organizational learning to be the
integration of individual and team learning to the organization's systems, structures,
strategies, procedures, culture, and environment adaptation. Several organizational
learning theories are based on individual learning, however the link between individual
and organizational learning must be explicit to avoid ignoring the role of the individual in
organizational learning or over simplify the organizational complexity. An integrated
model or organizational learning is proposed to address learning and shared mental
models. Individual learning effects organizational learning through influences on the
shared mental models of organization. An organization can only learn through
individuals, but any one individual does not affect organizational learning. In the study
organizational learning was comprised of the various learning levels and information
flows contained within [45, 76].
In Chan et. al (2003) the organizational learning model explores linkages between
individual learning and organizational learning. Organizational learning is often pursued

45
to allow for adaptation to change, in response to failed management and planning, and
seek to eliminate set behaviors or patterns [45]. Many researchers and studies identify
learning at individual, team, and organizational levels in order to lead to improved
performance. Skills, approaches, and commitment of individuals are transferred to
collective team capabilities, and in turn leads to organizational learning. However,
empirical evidence demonstrating these linkages is limited [45].
Organizations deploy BIS to aid decision making and competitive advantage. To
achieve these advantages BIS should be integrated into managerial and operational
processes, thereby leading to performance through business processes, and outperforming
competitors. The business value of BIS can be defined and operationalized through
business process performance, or operational efficiencies that are achieved through BIS,
such as cost reduction and improved productivity, as well as value chain activities, which
in turn influence organizational performance. Organizational performance is the
aggregated BIS performance outcomes. This performance allows the firm to remain
competitive in relation to others. Perception-based measures are used as some BIS
benefits are intangible or qualitative, and many items are confidential and not readily
available publicly. BIS has been shown to require customization to fit uniqueness of a
firm, as well BIS may provide differing benefits based on organizational structure or
industry [25].
During interviews with executives, managers, and professional staff, before,
during, and after BIS implementation and from review of prior literature, information,
system, service, and user factors were identified that may better explain learning within
BIS. Users had also identified the separation between quality and performance outputs.

46
Quality was seen to encompass quality of healthcare review services, as well as the
overall quality of the organization measured by stakeholder satisfaction metrics. Key to
the customer satisfaction metrics were components of quality reviews, and surveys.
Competitive performance was seen to take into account perceived ability to remain active
in the marketplace and secure advantages. Based on the interview data, and prior models,
a BIS learning model was developed. This model separates the systems component into
service, system and information quality, as well as adds additional satisfaction and
quality elements to measure a quality organization and competitive performance. The
intent is to better explain the elements which influence learning models, and if learning,
quality and competitive performance are dependent on individual, service, system, or
information characteristics. In addition to exploring the resulting outcomes when
utilizing BIS, a feature-rich architecture extended to a large stakeholder audience.
Figure 6: BIS Model
The model displays the impact of BIS on perceptions of quality and competitive
performance when utilized to support organizational learning. Individual learning,
information quality, system quality, and service quality are included as antecedents to
47
learning in the model. Learning is an important factor in the quality and competitive
success of the organization, in order to avoid failure and ensure continuous improvement
and overall quality of life.
Figure 6 displays a path-analytic model with Individual learning, information
quality, system quality, service quality, organizational learning, quality organization, and
competitive performance as latent variables. A path-analytic model with latent variables
is chosen to allow assessment of validity and determination of hypothetical constructs.
The model also accounts for variable measurement error, to allow the underlying
relationships to be measured rather than the individual manifest variable, by removing the
error variance from the latent factor and modeling separately.
3.3 Hypothesis and Construct Definition
3.3.1 Individual Learning
H1: There is a positive impact from individual learning on organizational learning
Individual factors play a role in organizational learning, as it takes into account
past experience, role and information system knowledge. Individual learning effects
organizational learning through updating an organization's shared mental models, with
organizational learning occurring through individuals [77]. Ruiz et. al (2006) studied
individual learning and impact on organizational learning, and found a significant
positive relationship, based on the ability for an individual to process information and
create knowledge [75]. Yu (2009) describes individual learning as continuous
improvement and changing cognition and behavior, with individual learning as a required

48
condition for organizational learning [76]. In Chan (2003), individual learning was not
significantly associated with organizational learning, and team learning partially related
to organizational learning. Cross-functional team learning was significantly related to
organizational learning, though considered similar to organizational learning [45].
Learning includes the two referenced mental models; mental-model maintenance,
and mental-model building. Mental-model maintenance is when new information is
incorporated into existing mental models and reinforcement occurs. Mental-model
building is when mental models are modified based on the new information.
Achievement of both mental-models is important to achieving quality and sustained
competitive performance [18].
Within Social Cognitive Theory, viewing others interacting with a BIS, influences
the observer perceptions of their own ability to perform the behavior, also known as self-
efficacy. Self-efficacy can impact behaviors undertaken, efforts, and persistence to
performance. Vandenbosch and Higgins (1995) studied self-efficacy, along with mental
model maintenance and mental model building. Vandenbosch and Higgens (1995)
proposed a model which describes the impact of ESS on competitive performance when
learning is incorporated. The model includes two individual learning types, namely
mental-model maintenance, and mental-model building. Mental-model maintenance is
when new information is incorporated into existing mental models and reinforcement
occurs. Mental-model building is when mental models are modified based on the new
information. The survey research on executives show that competitive performance
perceptions are found with regard to mental-model building, but not mental-model
maintenance [18].

49
3.3.2 Information Quality
H2: There is a positive impact from information quality on organizational learning
Additional research has been targeted to quality of information systems output.
Information quality refers to information that is accurate, complete, timely, and
meaningful in format. Accuracy refers to correctness as measured by reference systems
or experts. Timeliness is the delay time between input of information, and output of
information to the end user for decision making. Currency is the overall age of the
information and reflection of the current information state. Format is the layout design
and display of the information output [74, 78].
King (2001) describes the information strategy for learning, which includes
collection of data and transformation into useful and valuable information to support
learning. The data may be numerical or textual information typically found in reports, as
well as multimedia such as images or sound clips. The applications transform data into
more meaningful information for decision making activities in pursuit of learning. Lucas
and Nielson (1980) found that additional information did not necessarily result in greater
learning, however users deprived of information exhibited lower levels or learning. The
authors also found that information presentation, in particular with graphics and modes of
presentation had an effect on greater learning. Vandenbosch and Higgens (1995)
describe information quality as the most important attribute of ESS, and enabler of
mental-model enhancement. Attributes of information quality were completeness,
accuracy, timeliness, format, and relevance [18, 79, 80].

50
3.3.3 System Quality
H3: There is a positive impact from system quality on organizational learning
System quality includes the ease of system interaction and use, features and
analysis capabilities, reliability or uptime/data consistency, architecture, and accessibility
from various areas on-demand, and system factors are seen to promote learning and
usage. Ease of use includes the system design and interface; the goal is that if the relative
ease of use is high, users will be more inclined to learn the systems. Analysis capabilities
include the features and technical characteristics, and have the ability to improve
performance of the end-users. Architecture refers to the integration between system
services and components. These items is important to learning, as it allows the user to
more quickly make decisions and learn additional areas of importance based on system
related quality [18, 74, 78].
Lucas and Nielson (1980) found support for system quality of terminal hardware
in support of learning. Vandenbosch and Higgins (1995) described system quality in
terms of reliability, ease of use, analysis capability and reliability. Analysis capability in
particular was noted for enabling mental-model enhancement and learning. Significance
found for ESS system quality in support of learning. Chen (2003) discusses that most
traditional systems are not designed to support learning, and must be designed with
capabilities and flexibility to capture and distribute knowledge to aid learning [18, 80,
81].
3.3.4 Service Quality
H4: There is a positive impact from service quality on organizational learning
51
DeLone and McLean (2003) add service quality as another measure of IS
effectiveness. This is added in response to the changing IS roles of information provider
and service provider, and the view of end-users as customers. This allows focusing not
only on products but also services of IS area. Applied from marketing measures, the
service quality dimensions include reliability, responsiveness, assurance and empathy.
The measures apply regardless of whether the IS support occurs through an existing IS
department, new unit, or external organization [49].
King (2001) discusses IS strategies to build a learning organization. IS
traditionally reflects the management of information rather than learning, through IS
employees add an important component to organizational learning. Typically after the
infrastructure has been established, IS turns it over to users to go about using the system
the way they see fit, and takes a passive approach to allowing individuals, groups, and the
organization to learn as best suited. Some companies take a more active approach
through motivating users to learn the software and systems, conduct training both
formally and informally, and provide hands-on user support to enhance the learning
outputs of the system and users [79].
3.3.5 Organizational Learning
H5: There is a positive impact from organizational learning on competitive performance
Mock (1971), describes increases in performance over initial decision periods,
which can be attributed to learning. Additionally, differences in real-time vs. period
information, were found not significant in terms of learning value of information systems
between groups. In statistical decision theory, economic theory, and game theory,

52
alternatives, states, outcomes, and probabilities are evaluated. However, in
organizational environments, decision components are more ambiguous. Information
value in economic terms, is when changes occur in events which aids decision making
and payoffs. Ackoff (1957) describes useful information as informing in information
economics [82, 83].
Vandenbosch and Higgins (1995) studied paths between learning and competitive
performance. Mental model building was supported, whereas mental model maintenance
was not supported, though different than anticipated with both forms of learning expected
to influence performance. Janz and Prasarnphanich (2003) found support for work
performance as a result of learning, in order to identify how knowledge and learning are
gained and applied to generate organizational benefits. Lambert and Ouedraogo (2008)
identified learning as significant factors in a firm's short-term and long-term
performance. Learning helps solve current and urgent problems, thereby enabling short-
term performance. Learning also enables short-term goal achievement, through
continuous improvement of processes, work procedures and instructions, geared towards
exploitation of existing information. Long-term performance requires a combination of
existing information and new research and discovery, in order to understand complex
systems and develop new theories, with appropriate systems and functions required to
create and diffuse knowledge and information [18, 84, 85].
3.3.6 Quality Organization
H6: There is a positive impact from organizational learning on being a quality
organization

53
A quality organization is an organization which has developed a set of behaviors
to achieve stakeholder satisfaction. These stakeholders include internal employees,
shareholders, and external clients or customers. The behaviors that underlie satisfaction
include responsiveness to needs, information delivery, cooperation, program
participation, incentives system, employee ownership, training and development [61].
Another component of a quality organization is quality of healthcare services delivery,
with organizational variables of meeting review standards measured through audits, and
timeliness of reviews measured through the system [52, 63].
Janz and Prasarnphanich (2003) found support for work satisfaction, a component
of a quality organization, as a result of learning. Chang (2007) discusses learning aimed
at increasing stakeholder satisfaction and quality of relationships, through learning
customer needs and developing products or services to satisfy them. The study
determined that there was a positive relationship between learning and quality.
Ussahawanitchakit (2008) describes quality of services as an outcome of learning
organizations. This refers to the gap between stakeholder expectations and perceptions
[42, 46, 85].
3.3.7 Competitive Performance
H7: There is a positive impact from being a quality organization on competitive
performance
Competitive performance is the ability to satisfy all stakeholders and hold a
favorable position within a competitive segment. Measures include perceived parity with
competitors, perceived advantage over competitors, profitability, revenue, and overall
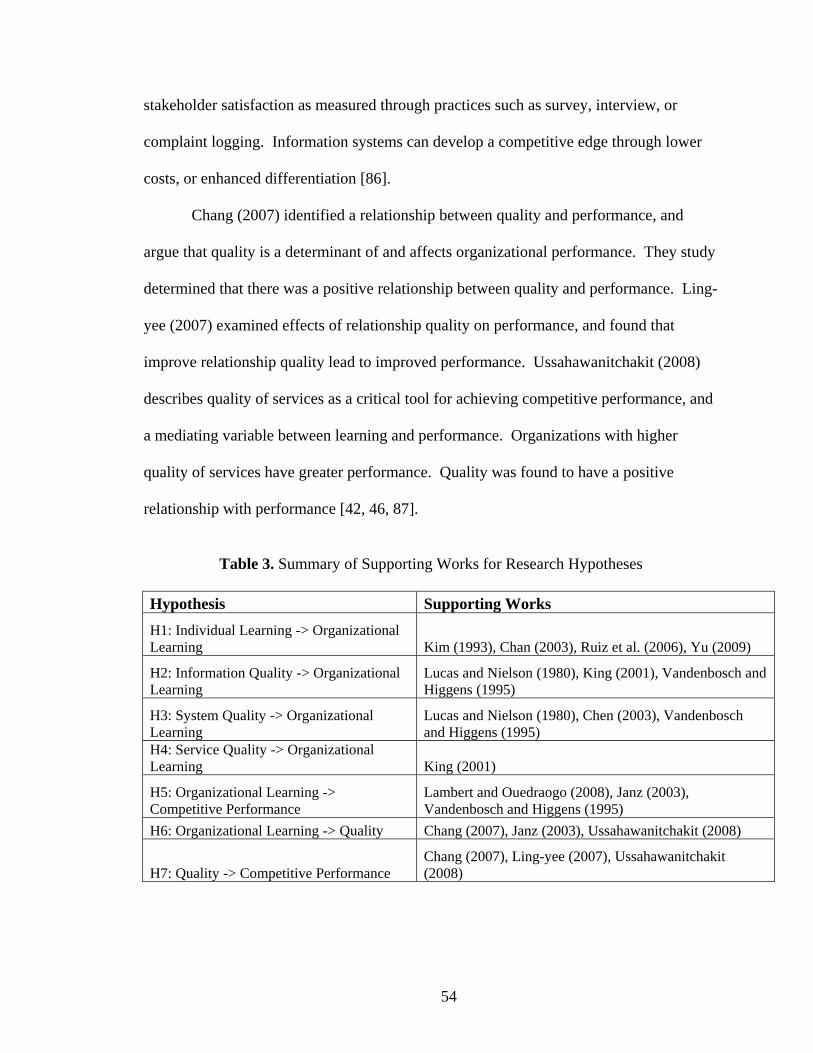
54
stakeholder satisfaction as measured through practices such as survey, interview, or
complaint logging. Information systems can develop a competitive edge through lower
costs, or enhanced differentiation [86].
Chang (2007) identified a relationship between quality and performance, and
argue that quality is a determinant of and affects organizational performance. They study
determined that there was a positive relationship between quality and performance. Ling-
yee (2007) examined effects of relationship quality on performance, and found that
improve relationship quality lead to improved performance. Ussahawanitchakit (2008)
describes quality of services as a critical tool for achieving competitive performance, and
a mediating variable between learning and performance. Organizations with higher
quality of services have greater performance. Quality was found to have a positive
relationship with performance [42, 46, 87].
Table 3. Summary of Supporting Works for Research Hypotheses
Hypothesis Supporting Works H1: Individual Learning -> Organizational Learning Kim (1993), Chan (2003), Ruiz et al. (2006), Yu (2009)
H2: Information Quality -> Organizational Learning
Lucas and Nielson (1980), King (2001), Vandenbosch and Higgens (1995)
H3: System Quality -> Organizational Learning
Lucas and Nielson (1980), Chen (2003), Vandenbosch and Higgens (1995)
H4: Service Quality -> Organizational Learning King (2001)
H5: Organizational Learning -> Competitive Performance
Lambert and Ouedraogo (2008), Janz (2003), Vandenbosch and Higgens (1995)
H6: Organizational Learning -> Quality Chang (2007), Janz (2003), Ussahawanitchakit (2008)
H7: Quality -> Competitive Performance Chang (2007), Ling-yee (2007), Ussahawanitchakit (2008)
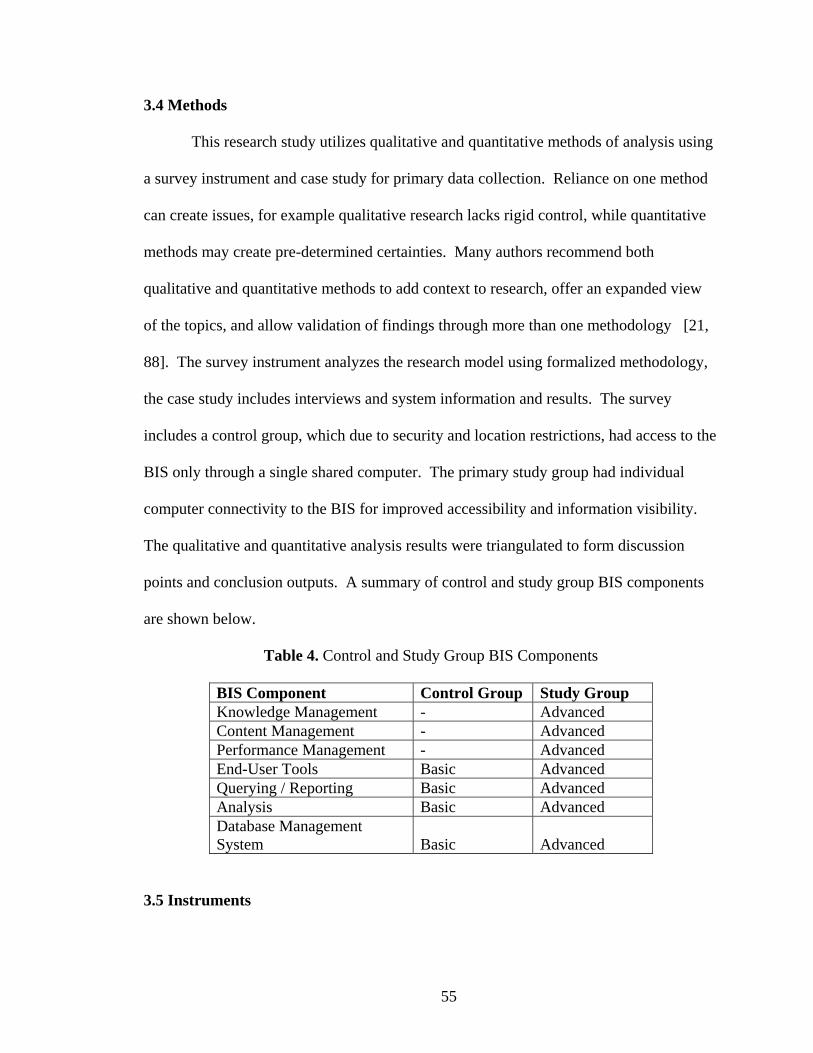
55
3.4 Methods
This research study utilizes qualitative and quantitative methods of analysis using
a survey instrument and case study for primary data collection. Reliance on one method
can create issues, for example qualitative research lacks rigid control, while quantitative
methods may create pre-determined certainties. Many authors recommend both
qualitative and quantitative methods to add context to research, offer an expanded view
of the topics, and allow validation of findings through more than one methodology [21,
88]. The survey instrument analyzes the research model using formalized methodology,
the case study includes interviews and system information and results. The survey
includes a control group, which due to security and location restrictions, had access to the
BIS only through a single shared computer. The primary study group had individual
computer connectivity to the BIS for improved accessibility and information visibility.
The qualitative and quantitative analysis results were triangulated to form discussion
points and conclusion outputs. A summary of control and study group BIS components
are shown below.
Table 4. Control and Study Group BIS Components
BIS Component Control Group Study Group Knowledge Management - Advanced Content Management - Advanced Performance Management - Advanced End-User Tools Basic Advanced Querying / Reporting Basic Advanced Analysis Basic Advanced Database Management System Basic Advanced
3.5 Instruments

56
A survey was development followed Moore and Benbasat's (1991) identified
stages of item creation, scale development, and testing: Item creation, in which existing
items were utilized from prior literature, then additional items added to those components
which fit the definitions. Scale development, where similar categories of items were
created and refined as needed. Testing, in which sample surveys were conducted, and
then was followed by revisions and larger distribution [89]. A full copy of the survey
instrument is included in the Appendix. The final survey is randomized to reduce order
effects. Additional information is collected from non-survey sources such as system,
case study, and interview information. The survey consists of user characteristic
questions such as location, tenure, and position/level, followed by individual items to
measure the remaining constructs. The survey uses a seven point likert scale, and
measures the level of agreement with each statement, with 1 being strong disagreement
and 7 strong agreement. The survey was reviewed by colleagues in and across
organizational levels as part of a pre-test to resolve any concerns or address any identified
discrepancies, as well as re-word identified items, or remove non-weighting or
duplicative manifest variables. The study sample includes BIS active user respondents,
and includes employees across various levels of the organization.
A case study is also used to assist with development, testing, and explanation of
the conceptual model, following methodologies outlined by Eisenhardt (1989) and Dube
and Pare (2003). Qualitative research methods to study IS phenomena is growing, with
case study research as an accepted method in the IS field. Case research is fitting, as
information systems as a component of organizational issues are studied. Access to real-
life experiences allows both academic and practitioner feedback, increased understanding

57
of the complex interactions between organizations, technologies, and people are
developed. A case study approach allows new ideas, opportunities, challenges, and
issues to be identified, and can be used for hypothesis generation, explanation, and
testing. All of these items allow for improved knowledge generation and contribution
within the IS field [88, 90].

58
IV. CASE STUDY ANALYSIS AND RESULTS
4.1 Organizational background
A national quality improvement and care management company whose solutions
focus on improving health outcomes while reducing health care administrative costs for
commercial and public clients. URAC accredited in utilization health management and
case management, with six offices across the county in Harrisburg, Tampa, Baltimore,
Cleveland, Nashville, and Richmond, with employment of 300 physicians, nurses, social
workers, case managers, information technologists, analysts, and communications and
administrative professionals, and access to a physician review panel of over 3,200,
including representation for all major subspecialties. Clients include Medicaid, state
programs, federal agencies, employers, the Department of Defense, managed care
organizations, providers, large commercial health plans, and third party administrators.
The organization has assessed health care in some capacity for approximately 17 million
lives in both the public and commercial marketplaces.
59
4.2 BIS Overview
The organization identified HIT as a critical component to a quality organization
and designated a HIT Quality Project to enable Business Intelligence and Performance
Management capabilities to meet and exceed stakeholder requirements and improve
organizational quality. The organizational solutions focus on improving health outcomes
while reducing health care administrative costs for commercial and public clients,
requiring the need for advanced HIT capabilities to analyze the various stakeholder
requirements and relationships.
The Business Intelligence (BI) Initiative, which officially began in late 2007, with
BIS feature rollout occurring through 2009, addressed organizational requirements for a
scalable, feature rich, and value added technology architecture (platform) to support
current and long-term requirements for data, information and intelligence. The
development and deployment of a comprehensive BIS represented a critical, strategic
need that would be aligned with business and medical initiatives. Among the initiatives
scope and objectives were:
• Provide a scalable enterprise BIS
• The physical location of data is transparent to end users
• Data is easily accessible, accurate, consistent and high quality
• Provide a standard reporting and analysis toolkit
• The BIS is accessible through single point of entry (portal)
• The BIS provides advanced decision support, analytics, informatics and data
mining

60
• The BIS enables enterprise wide performance management
• The BIS generates a sustained competitive advantage
4.3 BIS Initiative Team
The Business Intelligence (BI) Initiative also sought to identify key roles and
responsibilities, to ensure successful deployment and objective achievement. Having a
dedicated set of resources with clearly described areas of focus was seen as an important
component of the initiative. The resources may occupy more than one role at a given
time, however having full-time availability is commonly found as a critical factor in prior
BI projects [4]. The key roles and descriptions identified as part of the initiative are
listed below.
Table 5: BIS Team Roles
Role Title Role Description
Sponsors
- Primary driver of new requirements - Business need for data - Provides budget support - Provides political support - Ensures resource availability - Champion and promoter of Initiative
Initiative Manager
- Defines, plans, schedules Initiative deliverables - Assigns tasks and monitors completion - Develops Initiative charter and comprehensive delivery document - Measure costs and benefits - Resource planning - Measures success metrics - Compiles and communicates status
Information Technology Planning Council (ITPC)
- Makes critical decisions - Authorizes resources - Determines priorities - Approves platform - Approve objectives and measures of success - Reviews major milestones and deliverables

61
Subject Matter Expert (SME)
- Business area experts - Establishes true data definitions - Determines what data is needed - Determines data format - Determines level of detail or summary - Identifies what security or authorization access is needed for the data - Monitors quality - Determines requirements - Sets priorities - Determines historical data needs - Documents business definitions - Owns data - Identifies data sources - Determines needed system availability - Writes test cases - Identifies transform rules - Defines cleaning rules
Business Analyst
- Knowledge of business processes and data - Captures requirements - Identifies possibilities and improvements - Facilitates discussions between groups of users - Identifies future business needs and opportunities - Full cycle preparation of queries and reports - Monitors data - Understands data meaning, timeliness, and sources
Data Administrator / Modeler
- Models the data according to business rules and policies - Documents and maintains the mapping between logical data model, the physical database design and the source data and data warehouse - Develops naming standards - Utilizes ETL/CASE tools
Data architect
- Develops architecture of tools and interfaces - Determines best method for integrating data sources - Develops data standards and procedures - Defines ETL process - Defines testing procedures
Application Developer
- Back-end ETL process - Utilizes ETL/CASE tools - Tie-outs (extracted records match loaded records, error handling, error definition) - Front-end delivery applications - ETL data cleansing
Security Architect
- Determines access control - Develops security policies and procedures - Identifies data security and level of granularity - Determines capabilities and approach to establishing security - Identifies of security issues and resolution - Determines system integration security
Database Administrator
- Develops physical design - Database performance - Backup and recovery - Tuning and optimization (indexes, summaries) - Monitors query performance and improve systems or provide recommendation to users - ETL performance - Capacity planning (size, cpu, disk speed).
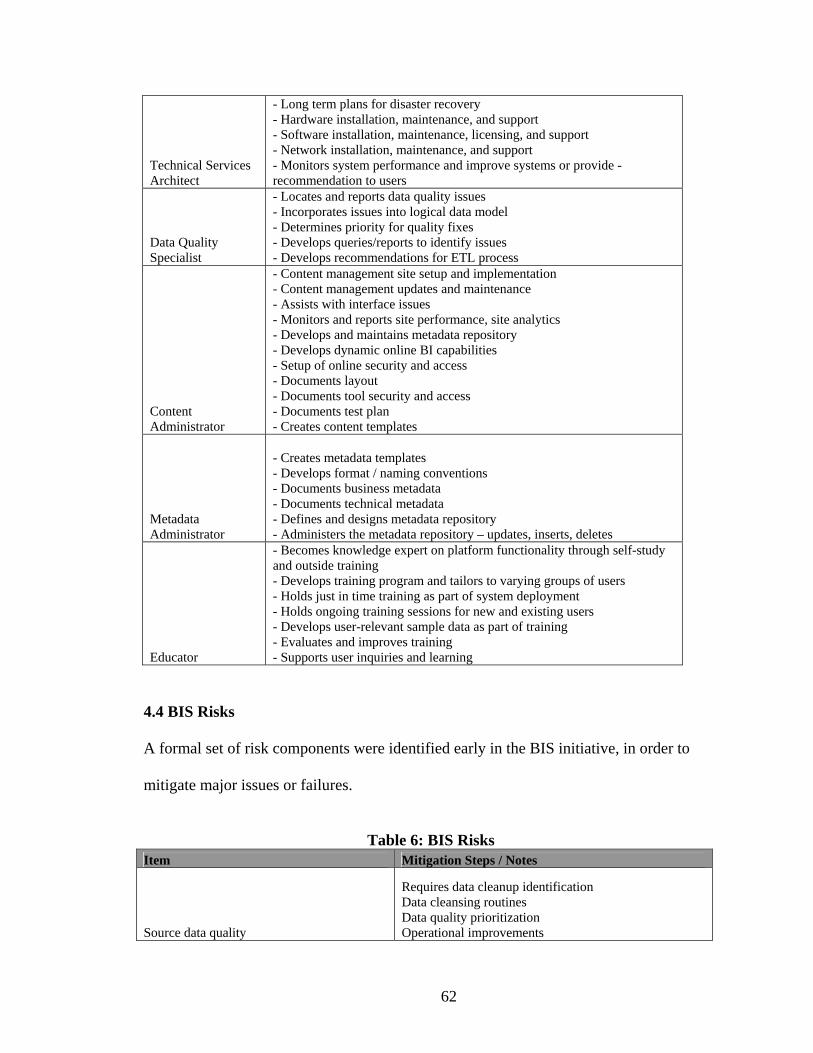
62
Technical Services Architect
- Long term plans for disaster recovery - Hardware installation, maintenance, and support - Software installation, maintenance, licensing, and support - Network installation, maintenance, and support - Monitors system performance and improve systems or provide - recommendation to users
Data Quality Specialist
- Locates and reports data quality issues - Incorporates issues into logical data model - Determines priority for quality fixes - Develops queries/reports to identify issues - Develops recommendations for ETL process
Content Administrator
- Content management site setup and implementation - Content management updates and maintenance - Assists with interface issues - Monitors and reports site performance, site analytics - Develops and maintains metadata repository - Develops dynamic online BI capabilities - Setup of online security and access - Documents layout - Documents tool security and access - Documents test plan - Creates content templates
Metadata Administrator
- Creates metadata templates - Develops format / naming conventions - Documents business metadata - Documents technical metadata - Defines and designs metadata repository - Administers the metadata repository – updates, inserts, deletes
Educator
- Becomes knowledge expert on platform functionality through self-study and outside training - Develops training program and tailors to varying groups of users - Holds just in time training as part of system deployment - Holds ongoing training sessions for new and existing users - Develops user-relevant sample data as part of training - Evaluates and improves training - Supports user inquiries and learning
4.4 BIS Risks A formal set of risk components were identified early in the BIS initiative, in order to
mitigate major issues or failures.
Table 6: BIS Risks
Item Mitigation Steps / Notes
Source data quality
Requires data cleanup identification Data cleansing routines Data quality prioritization Operational improvements

63
Requisite skill set / Number of new technologies
Identify training needs Provide initial training Provide ongoing training and support Build on existing skill set Phase where possible Enable additional training time
Resource availability
Fill open staff positions Fill resource gaps Ensure dedicated resources
User acceptance / expectations
Enable additional training time Include end users in each Initiative aspect Enable prototyping Support workflow redesign
Initiative plan
Develop detailed Initiative plan Revise and update detailed Initiative plan on periodic basis Limit scope creep Define change management process
Performance Very Large Database (VLDB) > 500GB Performance test functions
Vendor support
Ensure external vendor support agreement Internal training and support Establish service level agreements (SLAs)
Geographic environment Ensure periodic communication between areas Centralize administration and design
Financial
Establish ROI metrics Establish methods for cost-benefit analysis Utilize proven technologies
Software upgrade paths
Vendor BI software upgrade timelines / functionality Organizational software upgrade timelines / functionality Review, revise and update periodically to assess impacts
4.5 BIS Communication Standards The following identifies the forums for communicating Initiative status:
Table 7: BIS Communication Standards Title Frequency Description Participants Working Sessions Daily Individual task assignments and meeting discussions. All (as needed)
Status Sessions Weekly
Discuss individual status of activities, deliverables, problems, and solutions. Review Initiative status. Weekly time box activity review. All
ELT Update Weekly Review Initiative status. Initiative Sponsors
ITPC Review Monthly Review Initiative status. ITPC committee
Users Group Monthly Discuss issue logs, change control, questions & answers, knowledge base. All

64
Newsletter Quarterly Share experiences, success stories, tips and tricks, organizational content. All
4.6 BIS Problem Statement
The existing systems and data repository environments were at times unable to
provide complete, accurate, integrated, and timely information. Critical information was
often contained in disparate locations, with numerous tools and techniques required for
transforming the data. Conflicting results, time to obtain results, accuracy, and
consistency were some of the challenges experienced by those involved in the data and
information delivery process.
4.7 BIS Purpose
Internal and external data requirements necessitated a capable BIS; and were
identified as factors in securing current contracts and future business opportunities. In
the context of a highly competitive business landscape, it is imperative that the BIS easily
provide information and data deliverables, and support value added services. Key
performance management capabilities included in a BIS were reporting, analysis, data
mining, informatics, KPI/scorecards, modeling, knowledge management, content
management, and data warehousing.
4.8 BIS Features and Architecture
The BIS was rolled-out in releases, with each release comprising a series of
iterations. This was intended to speed deployment of the system and feature set available
to the end users and allow for parallel development of releases by varying resources. The
set of BIS features contained a comprehensive set of capabilities which enabled advanced
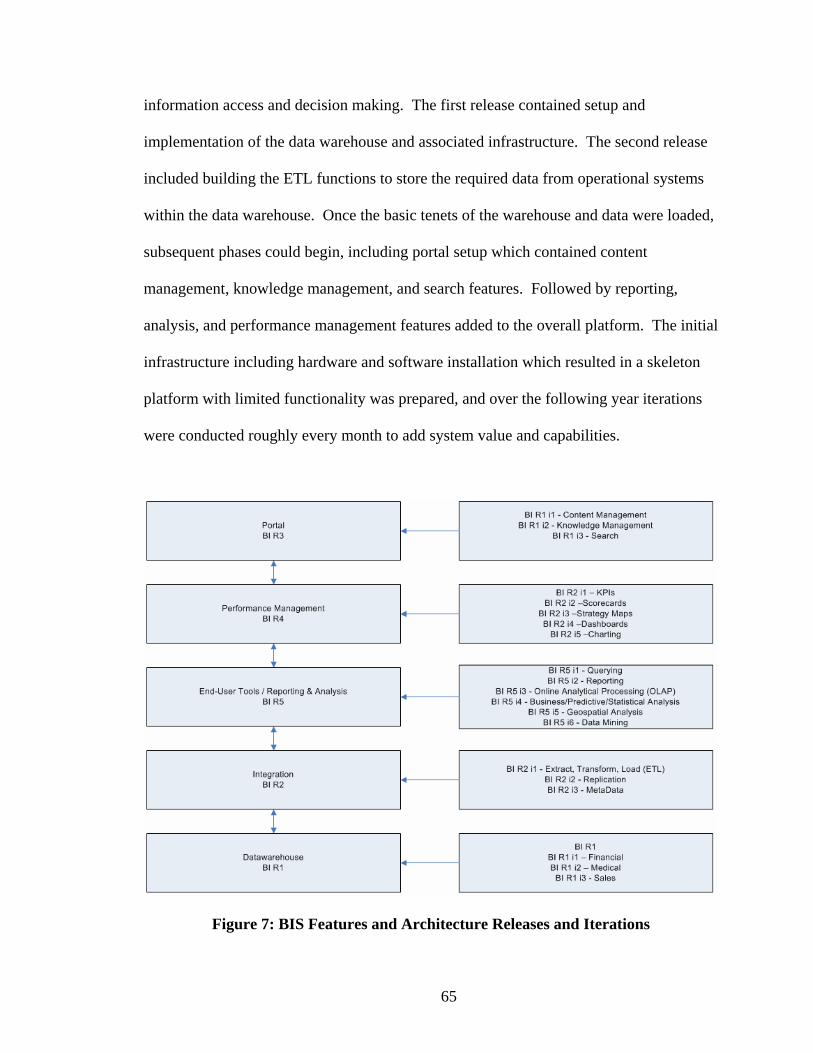
65
information access and decision making. The first release contained setup and
implementation of the data warehouse and associated infrastructure. The second release
included building the ETL functions to store the required data from operational systems
within the data warehouse. Once the basic tenets of the warehouse and data were loaded,
subsequent phases could begin, including portal setup which contained content
management, knowledge management, and search features. Followed by reporting,
analysis, and performance management features added to the overall platform. The initial
infrastructure including hardware and software installation which resulted in a skeleton
platform with limited functionality was prepared, and over the following year iterations
were conducted roughly every month to add system value and capabilities.
Figure 7: BIS Features and Architecture Releases and Iterations

66
4.9 BIS System Quality
Prior to the BIS, most data was manually tracked via spreadsheets and stored in
multiple database locations, making accessibility and easy use of multiple sources more
difficult, in addition no systematic capabilities existed to automatically aggregate and
perform analysis. As a result of BIS, system quality improvements were evident along
with improved accessibility and ease of use, as one quality manager commented on KPI
entry and scorecards accessibility:
I have received excellent feedback regarding the ease of the data entry and access.
Prior to the BIS, some system reliability issues and downtime existed, in addition
performance was degraded at times of high usage. The BIS resulted in improved
reliability, experiencing no unplanned outages during its term in operation, in addition,
average system response time, a key measure of system performance, was substantially
below the established threshold, and has remained low despite increased usage. It is
expected that improved capabilities and performance allow the user to more quickly
access information to make decisions which aid learning. A medical professional
described the improved accessibility and technical capabilities of the BIS:
There is quicker and easier access to databases, time collection, employees, and benefits;
it’s like a one stop resource library.
4.10 BIS Information Quality

67
Information quality was seen as a key contributor to learning and associated
quality and performance. The BIS improved information quality through a standardized
set of data, housed in a centralized data warehouse, allowing for a single-source of truth.
Approximately 1000 Key Performance Indicators were also tracked within the centralized
data warehouse, allowing information monitoring of critical items across financial,
operational, and employee areas. All information was presented through a centralized
web site, in a common format with a similar look and feel across data sources and sub-
sites. The centralization of information was a key component based on feedback of one
sales professional:
I like that all of the company's information is housed in a central location. It saves time
from having to email a lot of documents multiple times. I also like that everyone has a
general idea of where to find things that they need.
User requirements were solicited to gauge outputs, and several user-groups were setup to
capture feedback on information outputs to allow improvements. Where possible,
information was made real-time, with at most 24 hour load periods. As one sales
manager commented on the departmental dashboard and information presentation:
This is one of the cleanest dashboards that I have seen. It tells us what we need to
know... Nice. Simple.

68
Information quality was also identified for enlisting additional capabilities, and further
extending information sharing and information content across the organization. As a set
of managers commented:
I would like to see more information sharing.
As a frequent user I value the ease of finding and sharing information. However, I have
found that many are currently not utilizing the BIS to its fullest potential.
Information quality is expected to improve decision making and learning, as users are
able to identify required information more quickly and easily than before. Information
has been codified through knowledge base capabilities, such as document folders, wikis,
discussion boards, and self-service reporting capabilities. When the vision of information
quality was discussed early on prior to BIS, one executive described capabilities now
available under the BIS:
Going to one site, with roll-up of data in various areas, then drilling down to various
sites, with reports, and key measures on a dashboard.
4.11 BIS Service Quality
As new information systems typically require large dedicated staff and user
support, service quality was also seen to lead to organizational learning through improved
IS support of end-users and responsiveness to needs. As one medical director mentioned:

69
The staff is available polite and extremely helpful. The BIS support areas demonstrate an
unique ability to transform information into a useful format that can be easily understood
It is also suggested that through the knowledge and support of end-users, contribution to
their learning would occur through improved understanding and knowledge of the overall
BIS system. As one operations manager stated:
I have always received courteous and complete responses to any BIS questions I have
posed. The staff is knowledgeable and efficient.
4.12 Individual Learning
As with previous information system studies and implementations, user learning
were suspected to influence organizational learning with regard to BIS. When asked
which characteristics were seen to influence individual learning, users commented to to
the process or task characteristics. As one information technology manger described:
Our department required that all information must be published to the BIS and we
changed our habits accordingly.
4.13 Organizational Learning
Prior to the BIS, several users commented on the ability to move from a static
reporting system to a more dynamic system which allowed for improved decision making
support, as one executive stated:

70
I need more analysis and less reports. I wish they would provide me with some
recommendations with more data mining, trending of information and proactive analysis
would be helpful.
It was anticipated that users would require time to adjust to the BIS, and incorporate the
capabilities into their daily routines, but over time individual and organizational learning
would occur, as one Medical Director commented during early implementation of BIS:
Right now I am on a learning curve, with time, as I get used to using the system, I expect
I will value it more.
Users also supported the notion of democratization, where information is accessible to all
levels of the organization, as one Sales Manager recommended:
Continue pushing decision making and authority down into the organization so that
knowledge and available resources is not limited to one or two people.
As a component of the BIS, dashboards were setup to aid in the monitoring of various
key indicators, one of the dashboards contained metrics relating to service desk activity,
these were seen as a capability to improve insights and develop support of mental model
building, as one IT executive described:

71
Based on the primer you provided me today, I now have full appreciation for the
monitoring capabilities provided through the BIS for Service Management. These stats
will provide me with invaluable insight into the operation of our Service Desk call center.
The BIS was also seen to improve organizational understanding to aid learning, and
mental model maintenance, as one operations professional responded:
The BIS has helped us to better understand the organization overall, and the various
aspects of the business that we may not have had a clear picture of previously.
4.14 Quality Organization
When users were asked to explain a quality organization, they identified improved
customer satisfaction, healthcare quality, and stakeholder needs, this was also referred to
in the developed mission statement of the organization:
To advance the quality and efficiency of healthcare through integrated care
management solutions tailored to the needs of our customers and stakeholders.
To build quality programs and ensure exceptional customer service to their
clients, service and process performance measures were developed and implemented
throughout all aspects and levels of the organization. These performance measures are
tracked and improved utilizing the BIS capabilities. The Quality Measures addressed the
72
following core areas of Shareholder, Customer, and Employee satisfaction. As one
executive described each core area:
Shareholder Satisfaction: Our ability to deliver on the shareholders’ expectation of both
growth and profit with corresponding measures which reflect the shareholder’s
requirements.
Customer Satisfaction: Our ability to deliver a quality product to the client is essential to
sustaining the organization. We will expand our definition of quality to include clinical,
financial, and satisfaction outcomes for our clients.
Employee Satisfaction: Employees are the cornerstone to the organization. Our ability to
create and sustain a high performing organization of responsibility, accountability, and
recognition is paramount to our success.
In addition to quality review measurements, other quality improvement projects
were initiated to improve quality throughout the organization. During periodic
measurement and feedback, one operations manager commented:
The quality of the support departments have continually improved, even though the
resources are limited.
4.15 Competitive Performance

73
Performance was seen to increase as a result of organizational learning through
use of BIS, and this was evidenced from user comments. As one medical professional
stated:
Being a fairly new employee I am still learning about the BIS however, I am convinced
that the more I learn about the BIS it will enhance my performance.
The productivity impact of BIS outputs were also seen, which were identified as a
key component of competitive performance, as operations manager stated:
The tools and reports the BIS ITS staff develop are very helpful to me in doing my job.
When asked what value might BIS and learning deliver, one executive identified
the capability to more quickly react to changing business conditions, which would lead to
improved performance. Users also identified new requirements for increasing
information and capabilities of the BIS, including more dynamic capabilities for utilizing
information to aid learning, quality improvements, and performance.
4.16 CASE STUDY – Quality Organization
The organization designated a HIT Quality Project to enable business intelligence
and performance management capabilities to meet and exceed stakeholder requirements
and improve organizational quality. The project solutions required a focus on improving
health outcomes while reducing health care administrative costs for clients, requiring the
need for advanced BIS capabilities to analyze the various stakeholder requirements and
74
relationships. These Quality Measures addressed the core areas of customer, employee,
and shareholder satisfaction, and were developed, tracked, and improved utilizing HIT
capabilities. The BIS quality improvement outputs include a Quality Quadrant, Quality
Matrix, and Quality Model, and are described in further detail below.
IT projects have historically been measured solely on timeline and budget targets.
Within Healthcare, IT projects are increasingly requiring quality impacts as the basis for
measurement and value. The BIS capabilities and processes allow for individual
organizations to focus specifically on those areas which have the greatest impact on
organizational quality. Improved quality results are demonstrated following the proposed
process framework, leading to organizational quality as measured through varying
stakeholders. As healthcare organizations seek to continually improve overall quality and
adopt new capabilities, quality project management plays a critical role in providing the
capabilities and streamlined access to summarized information utilized for decision
making.
4.16.1 Quality Quadrant
Within a given organization, there is often significant variability at a business unit
level. In past studies, units that score above the median on employee and customer
satisfaction measures were found to be 3.4 times more effective financially as measured
by total revenue, performance targets, and year over year gain in sales and revenue. If
the focus is on employees only, the business unit may be too inwardly focuses. If the
focus is on customers only, employee satisfaction will erode over time. Unchecked
quality of the customer and employee experience can create issues. Often this variability
75
goes unnoticed or unmanaged, and revenues and profits are bled off and growth is
stagnant. In many organizations, the objective of achieving a unified corporate culture
and brand goes unrealized. Performance must be continuously improved, and feedback
given at the lowest level of variability and specificity [91].
Employees are able to affect profitability two ways. The first is direct cost, where
committed employees are more productive and produce better quality levels leading to
profitability. The second is indirect customer results, where strong employees generate
strong customer connections, leading to customer retention, profit, and growth. Despite
this, one study identified that only 29% of employees were energized and committed to
their work, with 54% doing only the required tasks, and the rest disengaged. Within IT,
the situation may be even worse, as another recent study suggested that in 2009 only 4%
of IT employees were highly engaged. Those organizations with high employee
satisfaction are more productive, profitable, and have lower turnover. These employees
also better serve their customers. Performance indicators which utilize both customer
and employee areas provide stronger links to financial and operational results [91, 92].
To address the variability between organizational sub-units, responsibility must be
centralized, and managed at a total organization level. However data is often contained
in multiple disparate locations. For example customer data may be held within the
marketing or quality department, employee data held within human resources, and
financial data within finance. These sources must all be combined on a single platform to
understand the health of employee/customer relationship [91]. This information
integration can be achieved utilizing HIT, and presented in a consolidated view to the
76
appropriate stakeholder and at the appropriate level of specificity for decision making
purposes.
To determine the existing business unit’s variability and combine comparative
sub-unit data across the organization, a Quality Quadrant shown in Figure 8 was
developed to identify the key areas of focus and improvement for each individual
business unit and from an organizational perspective. This concept is similar to various
industry quadrants ranking software providers, services, etc. The quality quadrant
displays the relative quartile for customer and employee satisfaction, within either the
higher or lower quadrant combinations. The employee and customer satisfaction data
was collected throughout the year at various points in time and plotted along the
respective axis, and within the relative quadrant. The objective for each sub-unit was to
increase the appropriate area of improvement employee or customer improvement
accordingly. The objective for the overall organization, was to simultaneously increase
both customer and employee satisfaction, while reducing variability between contracts to
form an improved and unified quality organization over time.

77
Figure 8: Quality Quadrant 4.16.2 Quality Correlation Matrix
Correlation analysis, a Six Sigma technique is utilized to identify relationship
between measures. The process links the individual measures to the appropriate
category. This method allows the reduction of potentially hundreds or thousands of
measures into a meaningful and manageable subset. The correlation also identifies the
directional relationship, with the direction indicating a positive or negative relationship.
This correlation analysis can be performed using commonly available statistical software
packages [93].
The Quality Correlation Matrix shown in Figure 9, describes the relationship
between Customer, Employee, and Shareholder metrics. For emphasis, metrics with
significant positive relationships can be displayed in green, significant negative
relationships can be displayed in red, all others left blank. The objective is active

78
improvement of identified measures which have the greatest impact to the resulting
stakeholder. For example, if an organizational sub-unit found that that employee
satisfaction was listed within a low quadrant, they would utilize the correlation matrix to
identify that involuntary turnover rate has a negative relationship to employee
satisfaction, and seek ways to either reduce involuntary turnover, or formulated methods
to minimize the impacts. The HIT output gives improved insight and perspective when
developing quality management initiatives.
Figure 9: Quality Correlation Matrix 4.16.3 Quality Model
Within service industries, significant focus has been placed on employee
satisfaction and the link to customer satisfaction. Satisfied employees leads to satisfied
customers through improved service experiences and the value and outstanding service
offered to them by employees. In time, this is expected to lead to increased market share
and profitability for the firm. Based on the promise of increased sales and financial
returns, service companies often invest heavily in employee and customer satisfaction.
However many studies find various relationships, with satisfied customers not always
guaranteeing success [94].

79
As a company's intangible assets reside in employee’s knowledge, employee
retention has been another key focus. Reducing turnover is expected to be linked with
satisfaction, and reduced costs of replacing employees, and improved customer service.
Findings between employees, customers and financial performance have received mixed
findings. Some studies have suggested positive relationships, while other studies
suggested that sometimes customer satisfaction is reflected in profits. Others suggest that
in the short-term financial results may be influenced by many factors, but in the long run
will be positive as a result of customer satisfaction. Employee satisfaction may occur
through pay, ongoing training, and employee security. Some studies haven't yielded a
significant relationship between employee satisfaction, while other reported a negative
relationship. Most studies find that employee and customer satisfaction have a positive
relationship [94].
The Quality Model, shown in Figure 10, displays directional relationships
between employee, shareholder, and customer satisfaction. These relationships often
vary by firm, and may contain significant positive relationships, significant negative
relationships, or no significant relationship at all. These relationships may also change
over time, and throughout the course of a firm’s progression. The objective is to develop
strategic plans which balance all stakeholder requirements, and set goals which align with
identified impact factors.

80
Figure 10: Quality Model
Table 8: Quality Model Hypotheses / Constructs Item Supporting Works Employee -> Shareholder Bernhardt (2000); Chi, Gursoy (2009) Employee -> Customer Bernhardt (2000); Yee (2008); Chi, Gursoy (2009) Customer -> Shareholder Bernhardt (2000); Yee (2008); Chi, Gursoy (2009) Shareholder: Profit Yee (2008); Chi, Gursoy (2009) Shareholder: Revenue Yee (2008); Chi, Gursoy (2009) Customer: ROI Yee (2008); Chi, Gursoy (2009) Customer: Survey Yee (2008); Chi, Gursoy (2009)
Employee: Voluntary Turnover Hurley (2007); Chi, Gursoy (2009)
Employee: Involuntary Turnover Hurley (2007); Chi, Gursoy (2009) 4.16.4 Quality Results
The results are presented in the form of relative improvement, or the absolute
improvement divided by the difference in baseline performance and ideal performance
[95]. The results model displayed in Figure 11, displays the top two measures which
have the greatest impact to resulting customer, employee, and shareholder satisfaction as
measured by a correlation coefficient. Statistical analysis is able to be conducted, with
analyzed paths between employee and customer, employee and shareholder, and

81
customer and shareholder to determine statistical significance. All measures were
conducted throughout 2009 to develop baseline measurements, improvement targets, and
final year end actual values. Return on Investment (ROI) and customer survey results
were identified as primary indicators and improvement of customer satisfaction.
Customer ROI showed a relative improvement of 25% and the customer survey which
measures overall satisfaction showed relative improvement of 15%. Involuntary and
voluntary turnover were utilized as indicators of employee satisfaction. Involuntary
turnover showed a relative improvement of 13%. Voluntary turnover showed a relative
improvement of 8%. Revenue and profit were utilized as indicators for shareholder
satisfaction. Revenue showed a relative improvement of 2%. Profit showed a relative
improvement of 4%. The results demonstrate that through a formalized HIT process
framework, significant improvement of organizational quality is able to be realized.
Figure 11: Quality Organization Relative Improvements 4.17 CASE STUDY – Physician Healthcare Services Review
82
4.17.1 Overview
The Chief Medical Officer commissioned a project to explore the physician
components of healthcare services review. Among the current management issues and
challenges were monitoring of physician activity, productivity metrics, and additional
insights. Overall project objectives included reduce overall physician costs and having
consistent comparison benchmarks.
4.17.2 Physician Activity Monitoring
Monitoring reports and dashboards were developed to improve information and
system quality of physician data. Reports and dashboards were available via a self-
service system, and reviewed by the medical directors and physicians. Full copies were
reviewed by the area medical directors, while de-identified copies were made available to
the individual physicians for comparison. This allowed comparative assessment of
performance across the staff continuum. A second component also allowed the users to
view case mix by type, and drill down to view the exact cases that were reviewed during
the specified time frame. Reviews were also audited by a quality control team in an
effort to improve overall quality of the reviews and provide improvement feedback over
time.

83
Figure 12: Relative Physician Productivity – Cases Per Hour
Figure 13: Physician Activity – Activity Types 4.17.3 Physician Review Results
Results for improvement were substantial, in one contract area during a year over
year comparative, productivity, as measured in cases per hour increased 32.6%, and cost
per case decreased by 12.4% year over year. The difference in percentages between

84
productivity and costs, has to do in part with a set of fixed costs for permanent physician
positions vs. temporary physician positions, as more cases were able to be completed by
the fixed cost positions. In another contract area, relative productivity improvements
resulted in over $250,000 in savings over baseline period, and increasing productivity
quarter over quarter, while maintaining overall quality levels.
Figure 14: Physician Productivity Improvements – Cases Per Hour 4.18 CASE STUDY – ITS Service Management
4.18.1 Service Management
The Vice President and Manager of Service Management and IT requested a
capability for improved service management capabilities as part of the BIS. This
included the ability to monitor service desk incidents against key metrics, along with
monitoring systems performance. Additionally another key area was in automation of
end-user reporting either through automation or self-service capabilities. The items

85
operationlized included a scorecard component, a set of dashboards, and online reporting
suite.
4.18.2
Service Management Monitoring
The ITS scorecard included the following components: call center metrics
including call volume, time to answer, and abandonment rates, incidents submitted by
site, incidents submitted by source, total incidents, completed incidents by priority,
completed incidents by type, and turnaround time by priority. These items were tracked
as actual values, and against established targets. The scorecard was drillable, to allow
viewing more granular detail under each KPI category. A set of system dashboards
allowed real-time monitoring of CPU usage, logical I/O usage, along with activity details
such as login attempts, query generation, and system logging.
Figure 15: ITS Scorecard

86
Figure 16: Server Dashboard
4.18.3 ITS Results
ITS improvements as a result of the automated / self-service BI components was
significant. The figure below shows the improvement in self-service BI components
since the initiative began. The total productivity impact as measured between 2007 and
2010, and which accounts for ITS resources required to produce an equivalent amount of
output vs. self-service BI capabilities is estimated at $750,042.86, and increased by 800%
throughout the period.

87
Figure 17: Self-Service BIS Runs
4.19 CASE STUDY – Information Quality Monitoring
4.19.1 Overview
The Information Quality Monitoring initiative was a subset of the Business Intelligence
(BI) initiative. This project was intended to improve the data and information quality of
identified system components, to help improve overall reporting quality. Additional
benefits included improved accuracy, single version of truth, improved end-user
satisfaction, reduced cost of fixing quality errors, data transparency, and consistency
between source and reference systems.
4.19.2 Information Quality (IQ) Score
An IQ score was calculated using Six Sigma methods for determining defective parts per
million (DPMO), and associated sigma level. Layers or levels of information quality
were also developed for example:
Level 1 – required field missing / entry error
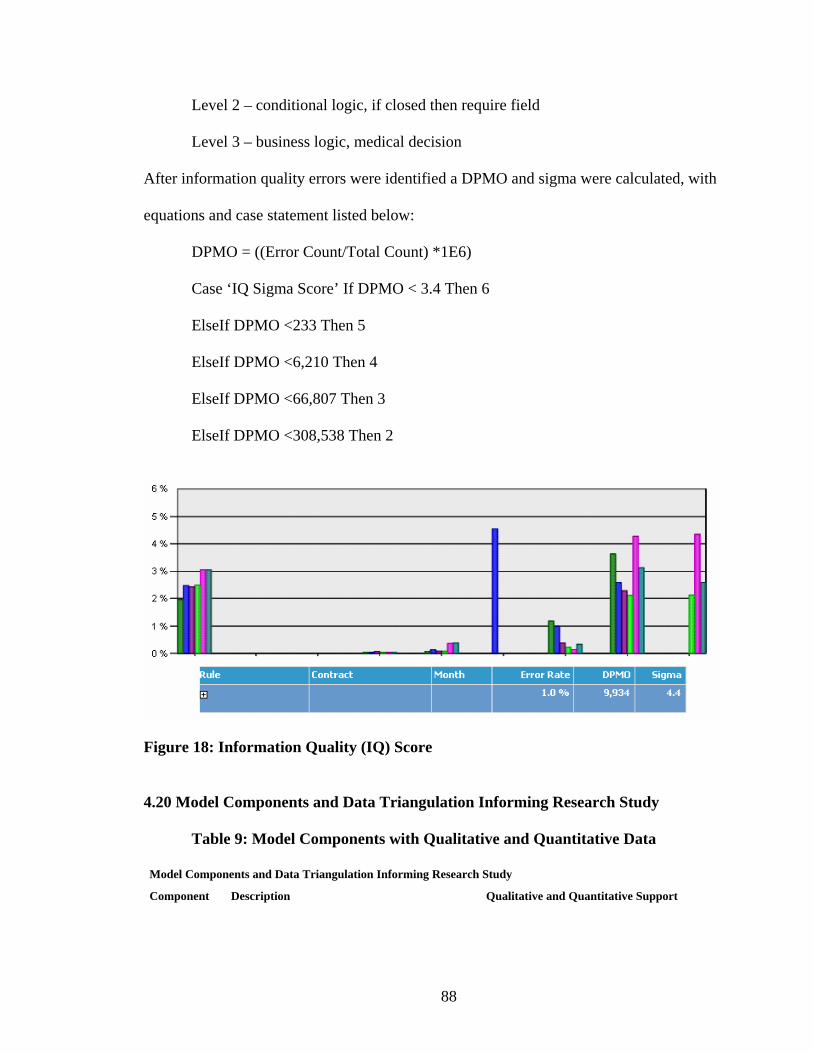
88
Level 2 – conditional logic, if closed then require field
Level 3 – business logic, medical decision
After information quality errors were identified a DPMO and sigma were calculated, with
equations and case statement listed below:
DPMO = ((Error Count/Total Count) *1E6)
Case ‘IQ Sigma Score’ If DPMO < 3.4 Then 6
ElseIf DPMO <233 Then 5
ElseIf DPMO <6,210 Then 4
ElseIf DPMO <66,807 Then 3
ElseIf DPMO <308,538 Then 2
Figure 18: Information Quality (IQ) Score
4.20 Model Components and Data Triangulation Informing Research Study
Table 9: Model Components with Qualitative and Quantitative Data
Model Components and Data Triangulation Informing Research Study
Component Description Qualitative and Quantitative Support
89
Information quality Refers to information that is accurate, complete, timely, relevant and meaningful in format.
Information quality was seen as a key contributor to learning and associated quality and performance. The BIS improved information quality through a standardized set of data, housed in a centralized data warehouse, allowing for a single-source of truth. Approximately 1000 Key Performance Indicators were also tracked within the centralized data warehouse, allowing information monitoring of critical items across financial, operational, and employee areas. All information was presented through a centralized web site, in a common format with a similar look and feel across data sources and sub-sites. The centralization of information was a key component based on feedback of one sales professional: User requirements were solicited to gauge outputs, and several user-groups were setup to capture feedback on information outputs to allow improvements. Where possible, information was made real-time, with at most 24 hour load periods. Information quality was identified for enlisting additional capabilities, and further extending information sharing and information content across the organization. Information quality is expected to improve decision making and learning, as users are able to identify required information more quickly and easily than before. Information has been codified through knowledge base capabilities, such as document folders, wikis, discussion boards, and self-service reporting capabilities.
I like that all of the company's information is housed in a central location. It saves time from having to email a lot of documents multiple times. I also like that everyone has a general idea of where to find things that they need. This is one of the cleanest dashboards that I have seen. It tells us what we need to know... Nice. Simple. As a frequent user I value the ease of finding and sharing information. However, I have found that many are currently not utilizing the BIS to its fullest potential, and would like to see more information sharing. Going to one site, with roll-up of data in various areas, then drilling down to various sites, with reports, and key measures on a dashboard. 1014 Key Performance Indicators Content currency 135.74 days Versioning 2.88 versions 4.4 Sigma IQ Score
System Quality Rrefers to response time, ease of use, reliability, accessibility, integration, and flexibility.
Prior to the BIS, most data was manually tracked via spreadsheets and stored in multiple database locations, making accessibility and easy use of multiple sources more difficult, in addition no systematic capabilities existed to automatically aggregate and perform analysis. As a result of BIS, system quality improvements were evident along with improved accessibility and ease of use. Prior to the BIS, some system reliability issues and downtime existed, in addition performance was degraded at times of high usage. The BIS resulted in improved reliability, experiencing no unplanned outages during its term in operation, in addition, average system response time, a key measure of system performance, was substantially below the established threshold, and has remained low despite increased usage. It is expected that improved capabilities and performance allow the user to more quickly access information to make decisions which aid learning.
I have received excellent feedback regarding the ease of the data entry and access. There is quicker and easier access to databases, time collection, employees, and benefits; it’s like a one stop resource library. Response Time (107 ms vs 4000 ms goal) Unique Visitors Supported: 617 vs. 250 target Bandwidth: 660,158 MB vs. 100,000 MB target Hits: 25,276,079 vs. 3,000,000 target Page Views: 1,474,442 vs. 100,000 target
Service Quality Refers to IS employees which are knowledgeable, support user interests, provide prompt service, and are dependable.
As new information systems typically require large dedicated staff and user support, service quality was also seen to lead to organizational learning through improved IS support of end-users and responsiveness to needs. It is also suggested that through the knowledge and support of end-users, contribution to their learning would occur through improved understanding and knowledge of the overall BIS system.
The staff is available polite and extremely helpful. The BIS support areas demonstrate an unique ability to transform information into a useful format that can be easily understood. I have always received courteous and complete responses to any BIS questions I have posed. The staff is knowledgeable and efficient. Internal Annual Surveys 98% overall satisfied or above with service.

90
Learning Includes the two referenced mental models; mental-model maintenance, and mental-model building, along with commitment to learning, shared visions, and open mindedness. Organizational Mental Model Maintenance New information is incorporated into existing shared mental models
"Learning in organizations is defined as the process that increases the actionable knowledge of the organization and its members through interpretation, comprehension and assimilation of tacit and explicit information. The processes where knowledge is generated by socialization, externalization and combination are considered organizational learning’’. "We conceptualize organizational learning as a continuous improvement process of organizational ideas or behaviors based on the individual employees’ interactions with other knowledge agents both inside and outside an organization." The BIS streamlined access and analysis of information for decisions, was seen as a key capability for improvement in learning and resulting organizational quality and competitive performance. Organizational learning has become a critical component of enhancing the competitiveness of a firm. Organizational learning is a key strategy in enhancing competitive advantages, achieving superior performance, and sustainability.
Our department required that all information must be published to the BIS and we changed our habits accordingly. Right now I am on a learning curve, with time, as I get used to using the system, I expect I will value it more Based on the primer you provided me today, I now have full appreciation for the monitoring capabilities provided through the BIS for Service Management. These stats will provide me with invaluable insight into the operation of our Service Desk call center. The BIS has helped us to better understand the organization overall, and the various aspects of the business that we may not have had a clear picture of previously. Internal Survey Perception Support Physician productivity, as measured in cases per hour increased 32.6%, and cost per case decreased by 12.4% year over year. Self-Service BIS runs increased by 800%. Self-Service Report runs: 25,901 vs. 5,000 target.
Quality Organization The quality organization has implemented a set of interdependent behaviors aimed at satisfying its stakeholders.
Organizational quality is seen to contribute to competitive performance by providing support for varying stakeholders. Quality of services as a critical tool for achieving competitive performance, and a mediating variable between learning and performance.
Shareholder Satisfaction: Our ability to deliver on the shareholders’ expectation of both growth and profit with corresponding measures which reflect the shareholder’s requirements. Customer Satisfaction: Our ability to deliver a quality product to the client is essential to sustaining the organization. We will expand our definition of quality to include clinical, financial, and satisfaction outcomes for our clients. Employee Satisfaction: Employees are the cornerstone to the organization. Our ability to create and sustain a high performing organization of responsibility, accountability, and recognition is paramount to our success. The quality of the support departments have continually improved, even though the resources are limited. Customer Satisfaction: Customer ROI: 25% RI Customer Satisfaction: 15% RI Employee Satisfaction: Involuntary Turnover: 13% Voluntary Turnover 8% RI Financial Satisfaction: Revenue: 2% RI Profit: 4% RI

91
Competitive Performance Ability to satisfy stakeholder requirements and achieve customer acquisition and positioning within an identified segment.
Competitive performance is the ability to satisfy all stakeholders and hold a favorable position within a competitive segment. Measures include perceived parity with competitors, perceived advantage over competitors, profit or sales less costs, sales or revenue, and overall stakeholder satisfaction. Due to competitive markets and globalization, organizations must continually seek to add value to their services, deliver additional profits, and exceed customer expectations. Information systems can develop a competitive edge through lower costs, or enhanced differentiation.
Being a fairly new employee I am still learning about the BIS however, I am convinced that the more I learn about the BIS it will enhance my performance. The tools and reports the BIS ITS staff develop are very helpful to me in doing my job. Internal perception improvements and support $250,000 in savings over baseline period for physician activity Self-service BI capabilities is estimated at $750,042.86 Year one ROBII is 1419%, with years two through six between 815% and 928%.
4.21 Respondent Characteristics
The table below shows a summary of respondent characteristics. Overall 148
responses were received, with 7 responses removed that were incomplete past general
user information, for a total of 141 usable responses. 109 responses were received from
the primary study group, with the remaining 32 responses from the control group. 106
respondents were non-managerial users, with the remaining 35 respondents holding a
supervisory position through executive position. Users from multiple geographic office
locations and functional areas were represented within the study group, as well as users
with short and long-term tenure at the firm.
Table 10: Survey Respondent Characteristics
Study Group Control Group Position Management 30 5Professional 79 27 Functional Area Sales and Marketing 10 2Operations 37 8Medical 19 6Support Areas 43 16

92
Tenure <2yrs 43 14>2yrs 66 18 Office Location Florida 26 0Maryland 9 0Ohio 10 32Pennsylvania 27 0Virginia 27 0Tennessee 10 0

93
V. ANALYSIS METHODS 5.1 Partial Least Squares
Partial least squares analysis (PLS) is a theory-based approach which combines
theory and data, to produce a better result that multivariate techniques. Reliability and
validity of the constructs can be assessed between the theory and data. Without causal
modeling, only correlations can be calculated, whereas with causal modeling causation
can be inferred. PLS is a flexible technique with low requisite assumptions, for example
specific distributions and independence of observations are not required. While the
measurement and structural parameters are estimated together, the model is developed in
two parts, the reliability and validity of the measurement model or quality of the model,
and structural model or relationships in the model. The SmartPLS method utilizes a
confirmatory rather than exploratory approach, in which the latent constructs are
explicitly specified and manifest variables associated are defined a priori, based on
theoretical models [18]. Since PLS is partial, normal fit indexes such as chi-squared used

94
in covariance based methods are not used. Instead internal consistency is commonly
tested through Cronbach’s alpha [96].
For path analysis with latent variables, a two-step approach outlined by Anderson
and Gerbing (1988) is followed. The first step utilized confirmatory factor analysis for
the measurement model to identify the latent constructs and manifest variables. Path
analysis allows testing for discriminant and convergent validity, and excludes error
variances of manifest variables from the latent factors and models error separately [97].
The model displays three endogenous variables: organizational learning, competitive
performance, and quality organization. The model displays three exogenous variables:
individual learning, information quality, system quality, and service quality. In the model
organizational learning, competitive performance, and quality organization are also
affected by a disturbance term or error term and represents causal effects on the
endogenous variables due to various factors such as missing variables or
misspecifications.
Following recommended practices, the manifest variables measuring each latent
variable are taken from prior research. Manifest variables are directly observed or
measured variables. The group of indicators must measure the same latent construct to
show high convergent validity and measurement for discriminant validity. This model is
a standard model as all latent constructs are measured by more than a single indicator.
The model described within is a recursive model, none of the variables are involved in
reciprocal causation, and demonstrate only unidirectional causal flow [97].
Power (1-beta) of a statistical test is the complement of beta which describes the
type II error of an incorrect null hypothesis. Power relies on significance level or type I

95
error, sample size, and effect size. Post-hoc power analysis utilizes power as a function
of alpha, sample size, and effect to determine if a test rejected an incorrect null
hypothesis. Cohen’s definition of small, medium, and large effect sizes are utilized to
determine the degree of null hypothesis violation, with a probability no less than the
power [98]. A post hoc power analysis was conducted to determine sample size, and
whether a null hypothesis is able to be rejected. Power is computed as a function of
alpha, effect size, and sample size. Power analysis is conducted utilizing the G*Power 3
software [98]. The population effect sizes are calculated to determine the sensitivity of
the test. Cohen's (1988) small, medium, and large effect sizes were employed, at 0.3, 0.5,
and 0.8 respectively [99]. For the study group, a 0.80 power value is achieved with an
alpha of 0.05, and effect size of 0.2613688. For the control group, a 0.80 power value is
achieved with an alpha of 0.05, and effect size of 0.4556197.
A path analysis is employed using SmartPLS 2.0 software to analyze the results
and determine model fit [100]. The rival model with significant loadings is developed.
Significance of relationships was determined between individual learning, system quality,
information quality, service quality, learning, quality, and competitive performance. The
SmartPLS HTML output report as shown below generates as a result of the PLS
generation.
The first section of the SmartPLS output displays the quality of the model. The
average variance extracted is indicated by the column AVE, and is the average
communality for the latent factors in the model. AVE is utilized for convergent validity,
and should be greater than or equal to 0.5. AVE exceeded 0.5 in this study [96, 100].

96
Composite reliability is also utilized as Cronbach’s alpha commonly
underestimates or overestimates reliability. Composite reliability follow’s similarly to
Cronbach’s alpha, with 0.80 to be considered good, 0.70 to be considered acceptable, and
0.60 to be considered for exploratory requirements. All composite reliabilities exceeded
0.80 [96, 97, 100].
R-Square displays the effect size measure, and is not shown for exogenous
constructs. An R-Square of 0.67 is considered substantial, 0.33 considered moderate, and
0.19 considered weak. All R-square values exceeded moderate, and some substantial .
Reliability among factors within the same subset was tested using Cronbach’s
alpha as the reliability coefficient for internal consistency. Cronbach’s alpha should be
equal to at least 0.80 to be considered good, 0.70 to be considered acceptable, and 0.60 to
be considered for exploratory requirements. With an Alpha equal to 1 representing
perfect correlation. A typical rule of thumb for acceptance is a loading of 0.7 or above.
All latent constructs exceeded the 0.7 loading. For short scales, Cronbach’s alpha may be
biased, this study utilized 7 point scales for all questions measured [96, 97, 100].
Communality explains the reliability of a row factor, and is the squared multiple
correlation for the variable as a dependent and factors as independent. The communality
value should be evaluated within the model, and the value itself should not be considered,
but the interpretation of the value. In cases where communality is grater than 1, a
spurious solution may exist in which a sample size is not large enough or the number of
factors is too large or small [96, 100].
Redundancy is the percent of variance in the independent factors for the
dependent. The redundancy test can be utilized to compare a one-factor and multi-factor

97
model, and if models perform equally, can choose the one-factor model based on
parsimony [96, 100].
Table 11: Measurement Model Quality
The latent variable correlations table displays factor correlation coefficients [96, 100].
Table 12: Latent Variable Correlations
The latent variable cross loadings displays the loadings on the expected factors and the
loadings on the remaining factors. The model should have high loadings on the expected
factors, and low loadings on the remaining factors. The cross-loadings may be higher in
more complex factor structures, and are more meaningful in simple factor structures [96,
100].
Table 13: Latent Variable Cross-Loadings
F1_CompPerf F2_OrgQual F3_OrgLearn F4_ServQual F5_SysQual F6_InfoQual F7_Ind_Learn
V10_Learn_OrgLearnComm 0.610410 0.584146 0.768253 0.569676 0.677878 0.719065 0.636483
V11_Learn_OrgSharedVisions 0.511258 0.512837 0.689541 0.397687 0.535412 0.526253 0.551803
V12_Learn_OrgCommit 0.533515 0.530922 0.754566 0.533140 0.619469 0.569455 0.572750
V13_Learn_OrgLearn 0.563450 0.549023 0.720046 0.521464 0.580827 0.610878 0.552312
V14_Learn_OrgOpenMind 0.407286 0.315893 0.613378 0.398522 0.484043 0.505497 0.323633

98
V15_Learn_MMMOrg 0.733343 0.634276 0.853363 0.657444 0.755588 0.713455 0.746517
V16_Learn_MMBOrg 0.704909 0.601795 0.699639 0.603939 0.680605 0.604770 0.603189
V1_CP_Competitiveparity 0.867567 0.615830 0.730177 0.650182 0.697232 0.620040 0.599148
V21_Learn_MMBIndividual 0.659480 0.592919 0.731764 0.545729 0.683910 0.642293 0.915016
V22_Learn_MMMIndividual 0.645378 0.648385 0.684310 0.489026 0.655659 0.680734 0.902163
V23_SrvQ_Assurance 0.645566 0.547906 0.638591 0.864248 0.649697 0.603080 0.493014
V24_SrvQ_Empathy 0.621178 0.513835 0.657242 0.856395 0.683842 0.618615 0.433973
V25_SrvQ_Reliability 0.596316 0.425666 0.633817 0.853945 0.658852 0.605790 0.528775
V26_SrvQ_Softwareuptodate 0.624991 0.524716 0.582107 0.805512 0.682431 0.640376 0.527037
V27_SrvQ_Responsiveness 0.577714 0.447792 0.577095 0.871650 0.647704 0.620033 0.445011
V28_SQ_Flexibility 0.704171 0.619422 0.690145 0.729870 0.850886 0.683253 0.564588
V29_SQ_Integration 0.655310 0.619595 0.840168 0.681155 0.857285 0.782696 0.656733
V2_CP_Competitiveadvantage 0.879469 0.738561 0.680981 0.560237 0.658031 0.583347 0.662625
V30_SQ_easeofuse 0.542269 0.638232 0.595227 0.495212 0.716222 0.737998 0.609485
V31_SQ_AnalysisCapability 0.573160 0.515110 0.672870 0.578880 0.623495 0.712435 0.564657
V32_SQ_Reliability 0.568402 0.530674 0.625385 0.582542 0.777372 0.731870 0.576847
V33_SQ_Verticalintegration 0.481996 0.382209 0.551151 0.498521 0.640018 0.403888 0.421794
V34_IQ_Currency 0.491658 0.490276 0.562972 0.433917 0.606372 0.735250 0.487185
V35_IQ_Accessibility 0.653969 0.617931 0.708252 0.674309 0.750762 0.817574 0.616918
V36_IQ_Completeness 0.588733 0.629543 0.726009 0.578496 0.794825 0.858331 0.621977
V37_IQ_Accuracy 0.550184 0.484316 0.649279 0.572600 0.671696 0.821031 0.563305
V38_IQ_Format 0.476595 0.496637 0.645251 0.589546 0.690917 0.805088 0.590124
V3_CP_Profit 0.810211 0.634967 0.644952 0.628755 0.644942 0.637784 0.607378
V4_CP_Sales 0.749054 0.529134 0.580582 0.554587 0.540726 0.486059 0.497806
V5_QO_CustomerSatisfaction 0.663207 0.866160 0.616464 0.407358 0.613180 0.542677 0.605721
V6_QO_EmployeeSatisfaction 0.500202 0.766043 0.580522 0.450711 0.588575 0.589990 0.604542
V7_QO_ShareholderSatisfaction 0.610885 0.703559 0.454994 0.472845 0.499247 0.449257 0.411480
V8_QO_Quality 0.625207 0.802276 0.615355 0.498770 0.583358 0.569077 0.518610
V9_Learn_OrgLearnShare 0.578146 0.482564 0.788311 0.558868 0.734991 0.661370 0.534764
The outer model coefficients displays the manifest variables and the path to the latent
constructs. This output simplifies the cross loadings output [96, 100].
Table 14: Latent Variable Cross-Loadings Outer Model

99
F1_CompPerf F2_OrgQual F3_OrgLearn F4_ServQual F5_SysQual F6_InfoQual F7_Ind_Learn
V10_Learn_OrgLearnComm 0.768253
V11_Learn_OrgSharedVisions 0.689541
V12_Learn_OrgCommit 0.754566
V13_Learn_OrgLearn 0.720046
V14_Learn_OrgOpenMind 0.613378
V15_Learn_MMMOrg 0.853363
V16_Learn_MMBOrg 0.699639
V1_CP_Competitiveparity 0.867567
V21_Learn_MMBIndividual 0.915016
V22_Learn_MMMIndividual 0.902163
V23_SrvQ_Assurance 0.864248
V24_SrvQ_Empathy 0.856395
V25_SrvQ_Reliability 0.853945
V26_SrvQ_Softwareuptodate 0.805512
V27_SrvQ_Responsiveness 0.871650
V28_SQ_Flexibility 0.850886
V29_SQ_Integration 0.857285
V2_CP_Competitiveadvantage 0.879469
V30_SQ_easeofuse 0.716222
V31_SQ_AnalysisCapability 0.712435
V32_SQ_Reliability 0.777372
V33_SQ_Verticalintegration 0.640018
V34_IQ_Currency 0.735250
V35_IQ_Accessibility 0.817574
V36_IQ_Completeness 0.858331
V37_IQ_Accuracy 0.821031
V38_IQ_Format 0.805088
V3_CP_Profit 0.810211
V4_CP_Sales 0.749054
V5_QO_CustomerSatisfaction 0.866160
V6_QO_EmployeeSatisfaction 0.766043
V7_QO_ShareholderSatisfaction 0.703559
V8_QO_Quality 0.802276
V9_Learn_OrgLearnShare 0.788311

100
The total effects or structural model path coefficients is displayed below between the
latent constructs [96, 100].
Table 15: Model Total Effects
F1_CompPerf F2_OrgQual F3_OrgLearn F4_ServQual F5_SysQual F6_InfoQual F7_Ind_Learn
F1_CompPerf
F2_OrgQual 0.393340
F3_OrgLearn 0.798068 0.723791
F4_ServQual 0.087310 0.079184 0.109402
F5_SysQual 0.310578 0.281672 0.389162
F6_InfoQual 0.177562 0.161036 0.222490
F7_Ind_Learn 0.214489 0.194526 0.268760
The standardized latent variable scores are displayed below. These scores can be utilized
for outlier identification. If an absolute value is greater than 1.96 at the 0.05 level or 2.58
at the 0.01 level [96, 100].
Table 16: Standardized Latent Variable Scores
F1_CompPerf F2_OrgQual F3_OrgLearn F4_ServQual F5_SysQual F6_InfoQual F7_Ind_Learn
-0.431736 0.552932 0.475244 -0.182099 -0.244673 0.943097 -0.811583
2.083957 2.224317 1.847436 1.540585 1.859277 1.548408 1.512949
0.858442 1.137376 0.636886 1.342032 0.682249 0.958284 0.586437
-0.922135 -0.905382 -0.790789 -1.661791 -0.941511 -0.423435 -0.356579
-0.661648 -0.277779 0.368103 0.259801 0.169065 0.582584 0.131433
-1.412534 -1.972244 -1.978801 -1.661791 -2.380036 -2.950688 -2.193099
1.168304 1.127336 1.371169 1.107781 0.971766 1.566728 1.041441
0.634957 -0.025845 0.251945 0.053623 0.106422 -0.024738 0.131433
-2.212313 -0.644779 -1.235917 -0.959038 -0.852452 -1.570690 -3.119611
0.101610 -1.165985 -0.994915 0.252177 -0.794057 -0.212846 -0.340075
1.081927 1.364859 0.934577 0.074195 0.771933 1.344412 1.512949
0.073951 -0.880931 -1.150570 -1.032460 -1.507613 -1.412114 -0.795079

101
-0.158877 -0.364021 -0.166717 0.017925 -0.145264 0.345502 0.114929
0.880157 0.239130 0.692226 1.540585 1.859277 1.347966 1.057945
1.327126 0.259209 0.815449 1.540585 0.741622 0.958985 1.041441
0.634957 1.668621 1.288579 1.540585 1.286721 0.758543 1.057945
1.305411 1.678660 1.664225 1.319635 1.604320 1.551541 1.041441
-0.404077 -0.591581 -0.447601 -1.440841 -0.866964 -1.012436 -0.340075
1.305411 0.833614 0.963346 1.085384 0.852934 0.949690 1.057945
-2.926197 -0.895343 -3.763748 -1.661791 -2.229312 -3.018149 -3.119611
-0.922135 -1.165985 -1.713195 -1.661791 -1.924621 -1.792584 -1.266587
1.081927 1.094216 0.746732 0.473127 0.597978 0.564264 0.586437
-0.431736 -0.634740 0.144118 1.342032 -0.549364 0.169542 -1.250083
-0.401160 -0.880931 -0.152881 0.059422 -0.208532 0.178837 -0.323571
-0.465822 -0.605992 0.629534 0.710674 0.535335 0.377455 -1.233579
-0.404077 -0.591581 -1.277430 -1.440841 -1.433066 -1.203583 -0.811583
-0.922135 -1.165985 -1.055815 -1.661791 -1.613476 -1.792584 -1.266587
0.064607 -0.634740 -0.801590 -0.826758 -0.549364 -0.387927 -0.811583
-1.467853 -1.112786 -2.736045 -1.661791 -2.446488 -1.792584 -1.266587
-1.369105 -0.591581 -1.798155 -1.669415 -1.034465 -1.598305 -1.266587
-0.676936 -0.644779 -0.350896 -1.264684 -0.941511 -0.041047 -0.795079
-0.922135 -0.644779 -0.176894 -0.158232 -0.403491 -0.645330 -0.795079
-0.431736 0.239130 -0.469442 -0.390456 -0.034577 -0.809563 0.114929
0.089239 0.552932 0.549662 -0.365881 0.190694 0.564264 0.586437
0.607298 1.098589 0.894357 0.487899 1.430365 1.134244 0.586437
-0.401160 -1.165985 0.435169 0.710674 -0.238219 0.373117 -0.340075
2.083957 1.369155 0.847740 1.540585 1.859277 1.742688 -0.356579
-0.922135 -0.581541 -0.240823 -0.365881 -0.774635 -0.235327 -0.340075
-0.404077 0.809162 -0.886871 0.473127 -0.941511 -0.221263 0.586437
-2.522175 -1.456706 -0.955279 -0.422027 -0.630365 -0.432730 -0.340075
-0.186537 0.524108 -1.182868 1.540585 0.445650 -0.215101 -0.356579
0.836727 1.094216 0.969739 0.707378 1.023081 0.934503 1.041441
-0.922135 -1.165985 0.123947 -0.751389 -0.085892 0.373117 -0.356579
-0.900421 -1.736093 -2.227634 -1.661791 -1.774523 -1.981299 -0.795079
0.634957 1.094216 0.323659 0.473127 0.597978 0.564264 0.586437
0.585583 1.094216 0.381962 0.473127 0.424022 0.564264 0.586437
-0.177675 -0.277779 -0.153586 -0.437276 -0.294407 0.354797 0.586437
1.550611 -0.017176 1.166747 1.540585 1.859277 1.321052 1.512949
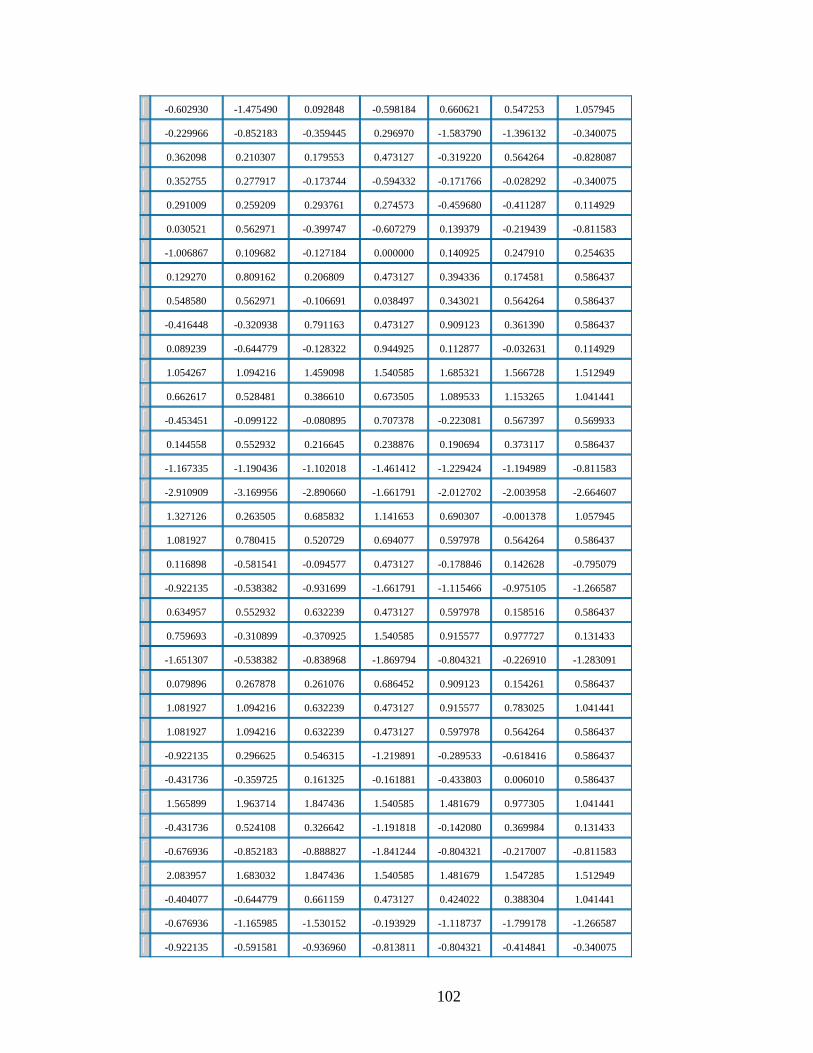
102
-0.602930 -1.475490 0.092848 -0.598184 0.660621 0.547253 1.057945
-0.229966 -0.852183 -0.359445 0.296970 -1.583790 -1.396132 -0.340075
0.362098 0.210307 0.179553 0.473127 -0.319220 0.564264 -0.828087
0.352755 0.277917 -0.173744 -0.594332 -0.171766 -0.028292 -0.340075
0.291009 0.259209 0.293761 0.274573 -0.459680 -0.411287 0.114929
0.030521 0.562971 -0.399747 -0.607279 0.139379 -0.219439 -0.811583
-1.006867 0.109682 -0.127184 0.000000 0.140925 0.247910 0.254635
0.129270 0.809162 0.206809 0.473127 0.394336 0.174581 0.586437
0.548580 0.562971 -0.106691 0.038497 0.343021 0.564264 0.586437
-0.416448 -0.320938 0.791163 0.473127 0.909123 0.361390 0.586437
0.089239 -0.644779 -0.128322 0.944925 0.112877 -0.032631 0.114929
1.054267 1.094216 1.459098 1.540585 1.685321 1.566728 1.512949
0.662617 0.528481 0.386610 0.673505 1.089533 1.153265 1.041441
-0.453451 -0.099122 -0.080895 0.707378 -0.223081 0.567397 0.569933
0.144558 0.552932 0.216645 0.238876 0.190694 0.373117 0.586437
-1.167335 -1.190436 -1.102018 -1.461412 -1.229424 -1.194989 -0.811583
-2.910909 -3.169956 -2.890660 -1.661791 -2.012702 -2.003958 -2.664607
1.327126 0.263505 0.685832 1.141653 0.690307 -0.001378 1.057945
1.081927 0.780415 0.520729 0.694077 0.597978 0.564264 0.586437
0.116898 -0.581541 -0.094577 0.473127 -0.178846 0.142628 -0.795079
-0.922135 -0.538382 -0.931699 -1.661791 -1.115466 -0.975105 -1.266587
0.634957 0.552932 0.632239 0.473127 0.597978 0.158516 0.586437
0.759693 -0.310899 -0.370925 1.540585 0.915577 0.977727 0.131433
-1.651307 -0.538382 -0.838968 -1.869794 -0.804321 -0.226910 -1.283091
0.079896 0.267878 0.261076 0.686452 0.909123 0.154261 0.586437
1.081927 1.094216 0.632239 0.473127 0.915577 0.783025 1.041441
1.081927 1.094216 0.632239 0.473127 0.597978 0.564264 0.586437
-0.922135 0.296625 0.546315 -1.219891 -0.289533 -0.618416 0.586437
-0.431736 -0.359725 0.161325 -0.161881 -0.433803 0.006010 0.586437
1.565899 1.963714 1.847436 1.540585 1.481679 0.977305 1.041441
-0.431736 0.524108 0.326642 -1.191818 -0.142080 0.369984 0.131433
-0.676936 -0.852183 -0.888827 -1.841244 -0.804321 -0.217007 -0.811583
2.083957 1.683032 1.847436 1.540585 1.481679 1.547285 1.512949
-0.404077 -0.644779 0.661159 0.473127 0.424022 0.388304 1.041441
-0.676936 -1.165985 -1.530152 -0.193929 -1.118737 -1.799178 -1.266587
-0.922135 -0.591581 -0.936960 -0.813811 -0.804321 -0.414841 -0.340075

103
-0.155961 -0.538382 0.498812 -0.195400 -0.178846 -1.001925 1.041441
-0.401160 -0.306526 0.016933 0.473127 0.343021 -0.036886 -0.811583
-0.698651 -1.165985 -1.324670 -1.240109 -0.918904 -1.443798 -1.266587
-0.404077 -0.905382 0.395435 -0.347134 -0.714637 -0.416326 1.057945
-0.922135 -1.165985 -0.579988 0.246854 0.190694 0.349663 0.131433
1.587614 0.833614 1.397447 0.920703 1.655635 0.949690 -0.323571
0.129270 0.823574 0.091275 -1.427540 0.364649 0.158516 0.586437
0.858442 0.562971 0.198752 0.238876 -0.352176 0.345502 0.114929
1.081927 -0.017176 0.470610 0.473127 0.741622 -0.251392 0.586437
0.809068 0.292329 0.477949 0.473127 0.190694 0.564264 0.131433
0.150985 1.668621 -0.210836 0.004624 -0.426723 0.361390 0.114929
1.081927 1.094216 0.492767 0.473127 0.801620 0.564264 0.586437
0.101610 0.833614 0.360045 -0.350632 0.597978 0.345502 0.586437
1.587614 0.538520 1.493434 1.540585 0.819439 0.949690 0.586437
-0.986798 -1.233595 -0.582958 -0.792886 -1.376877 -0.825628 -0.340075
0.113982 0.552932 0.354706 0.076019 0.597978 0.212344 0.586437
0.836727 -0.277779 -0.265096 -1.000889 -1.069002 -2.044853 -0.340075
0.052236 -0.267740 0.844065 -0.822784 1.119219 0.794752 1.512949
-1.157991 -2.831626 -0.380975 0.473127 -0.408990 -0.614160 -3.136115
0.895445 -0.017176 0.049109 -0.326209 -0.489991 -0.835354 0.114929
-0.416448 0.239130 0.155972 0.076019 -1.071231 -0.848810 -0.340075
-0.431736 0.267878 -0.102057 -0.365881 0.139379 0.564264 0.114929
1.413503 2.224317 1.847436 1.540585 1.859277 1.566728 1.512949
0.368043 0.833614 0.743749 0.473127 0.801620 -1.292547 0.131433
-0.155961 0.552932 0.323659 -1.248087 0.169065 0.373117 0.114929
The bootstrapping results for the path coefficients are displayed below. The T-statistic is
utilized to calculate significance within the model [96, 100].
Table 17: Bootstrapping Results
Original
Sample (O) Sample Mean
(M) Standard Deviation
(STDEV) Standard Error
(STERR) T Statistics
(|O/STERR|)
F2_OrgQual -> F1_CompPerf 0.393340 0.401246 0.066762 0.066762 5.891703
F3_OrgLearn -> 0.513372 0.507245 0.071811 0.071811 7.148946

104
F1_CompPerf
F3_OrgLearn -> F2_OrgQual 0.723791 0.725832 0.049910 0.049910 14.502041
F4_ServQual -> F3_OrgLearn 0.109402 0.115585 0.066670 0.066670 1.640949
F5_SysQual -> F3_OrgLearn 0.389162 0.385267 0.117984 0.117984 3.298426
F6_InfoQual -> F3_OrgLearn 0.222490 0.230269 0.099379 0.099379 2.238800
F7_Individual_Learn -> F3_OrgLearn
0.268760 0.266647 0.077267 0.077267 3.478314
5.2 Assumptions
PLS carries a set of assumptions, though generally PLS does well to accommodate missing values, model misspecification, and violation of common latent variable assumptions [96, 97].
Table 18: Model Assumptions
Assumption Study Description
Multicollinearity PLS utilizes orthogonal factors, in which multicollinearity issues are limited, with PLS preferable to structural equation modeling.
Standardization All variables are centered and standardized in the measurement tool.
Interval data Interval or ratio measurement for manifest variables. This is assumed based on the likert scale measurement used in the survey.
Sample size
PLS has been successfully used for very small samples of less than 20, however larger samples may yield more reliable results. Using power equal to 0.80, factor loadings of 0.70, and correlations greater than 0.60, are utilized to determine sufficient sample sizes.
Distribution PLS utilizes a distribution-free approach, in contrast SEM requires multivariate normality
Significance Bootstrapping is utilized to test significance as traditional significance testing is not available.
Parsimony
PLS is principal component based, whereas SEM is covariance based. PLS has also been found to be more parsiminous than principal component regression. The inclusion/exclusion of variables will affect the results. Selecting the model structure in advance produces the best analysis. Also if variables are excluded to produce ‘cleaner’ solutions, results and conclusions may be in error.
Errors PLS models without error and endogenous latent factors without disturbance, whereas SEM models the errors.
Variables T-statistic for each variable is 1.96 or greater. Reliability Composite reliabilities for latent factors are 0.70 or greater. Variance Variance for latent factors are 0.50 or greater.

105
VI. RESULTS
Results show that 81% of the variability in Organizational Learning, 52% of the
variability in Quality Organization, and 71% of the variability in Competitive
Performance is explained from the model. The path analysis model describes the
relationships between the latent variables and manifest variables which measure the latent
variables. The original research model includes seven latent variables of Individual
learning, information quality, system quality, service quality, organizational learning,
quality organization, and competitive performance. All latent constructs exceeded a 0.70
composite reliability benchmark, which is a measure of the internal consistency of the
manifest variables on the latent factor. The hypotheses were found to be significant at
varying levels. Figure 19 displays the study group model significance, individual
learning are found to not be significant. Information quality and system quality are found
to form a significant relationship with organizational learning. Service quality exhibited

106
a weak significance with organizational learning. Learning on quality and competitive
performance, and quality on competitive performance formed a significant relationship.
Figure 19: Study Group Model Significance Prior IS literature has found links with individual characteristics, information,
service and system characteristics on use and acceptance. Prior literature with regard to
ESS, found no significant link between individual characteristics and model-building and
model-maintenance. Prior literature did find a link between system characteristics and
mental-model building.
The control group model significance is shown in Figure 20, information quality
and service quality displayed no significance, though system quality remained significant.
Individual learning were found to show weak significance. Learning showed significance
on quality, but weak support for competitive performance.
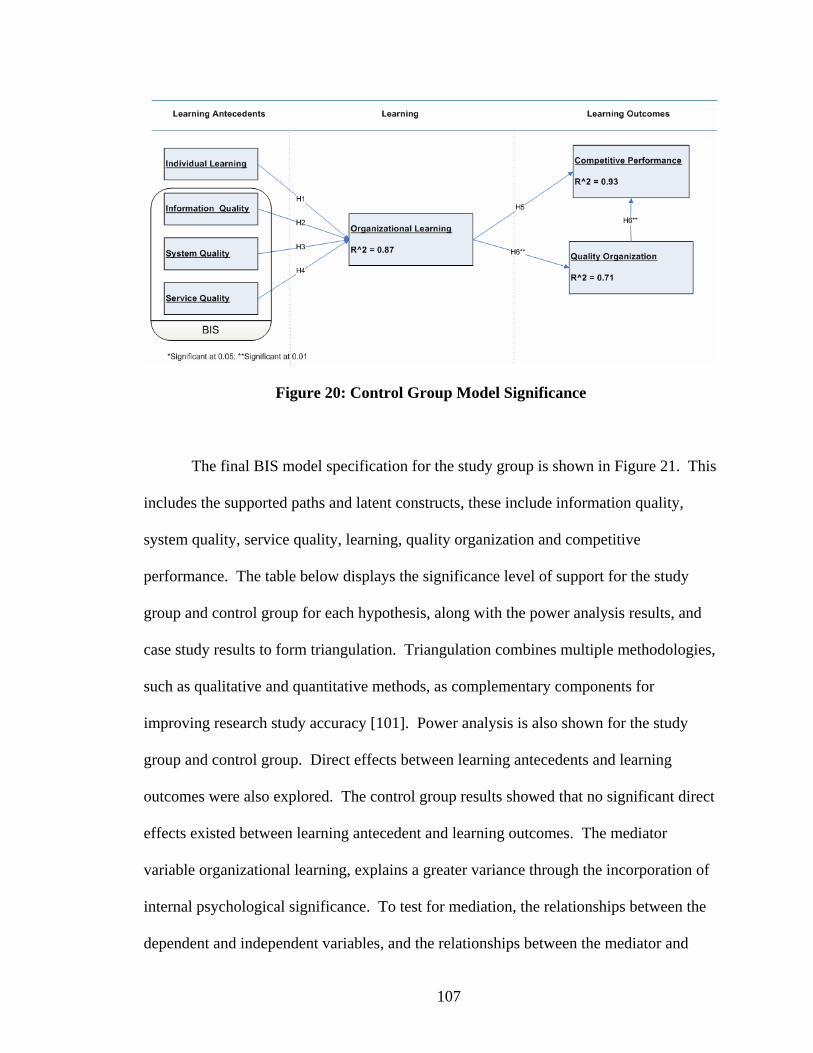
107
Figure 20: Control Group Model Significance
The final BIS model specification for the study group is shown in Figure 21. This
includes the supported paths and latent constructs, these include information quality,
system quality, service quality, learning, quality organization and competitive
performance. The table below displays the significance level of support for the study
group and control group for each hypothesis, along with the power analysis results, and
case study results to form triangulation. Triangulation combines multiple methodologies,
such as qualitative and quantitative methods, as complementary components for
improving research study accuracy [101]. Power analysis is also shown for the study
group and control group. Direct effects between learning antecedents and learning
outcomes were also explored. The control group results showed that no significant direct
effects existed between learning antecedent and learning outcomes. The mediator
variable organizational learning, explains a greater variance through the incorporation of
internal psychological significance. To test for mediation, the relationships between the
dependent and independent variables, and the relationships between the mediator and

108
dependent variables are explored. All relationships are significant, except for service
quality which is removed from the final model specification.
Figure 21: Final BIS Model Specification
Table 19: Model Significance
Significance Level Hypothesis Study Group Control Group H1: Individual Learning -> Learning 0.01 Not Supported H2: Information Quality -> Learning 0.05 Not Supported H3: System Quality -> Learning 0.01 Not Supported H4: Service Quality -> Learning Not Supported Not Supported H4: Learning -> Competitive Performance 0.01 Not Supported H5: Learning -> Quality 0.01 0.01 H6: Quality -> Competitive Performance 0.01 0.01 Power Analysis Study Group Control Group Power 0.80 0.80 Alpha 0.05 0.05 Effect Size 0.26 0.46
109
VII. DISCUSSION
7.1 Overview
In a typical system implementation, after the first version is released to users, the
sustaining phase is reached. The system may add additional applications, users, or
features, such as more timely updates. In past studies, professional users were more
interested in managing ongoing changes, and evolutionary development approaches then
compared with executives [35]. This study reviews the use of BIS, and the ability for
improving management of ongoing changes, and contribution to learning, quality, and
performance.
Individual learning was anticipated to form a relationship with organizational
learning, and in the study group individual learning was found to be significant. This is
an important distinction within BIS vs. prior decision support systems, as the systems are
accessed by and provide capabilities for virtually all stakeholders instead of executives or
a select group only. While executives may have the greatest influence in decision

110
making, it is also the day-to-day operational level employees and various stakeholders
who also make decisions that can influence the organization and other stakeholders. It is
this access to information that allows learning through mental-model building and
mental-model maintenance to occur. The control group found no significance with
regard to individual learning and organizational learning. Through lack of BIS
capabilities and information, it is considered that individual learning plays a greater role
in learning within the control group vs. the study group where individual learning plays a
significant role in the face of readily available information and BIS capabilities.
System quality is another factor anticipated to form a relationship with learning,
and was found to be significant for the study group. The feature set within the system is
an important contributor for the stakeholder to produce the required information. In other
words, allowing the user to answer the question, or answer new questions previously not
thought of. Key within the set of variables is the analysis capability. These analysis
capabilities may include advanced data mining features or simple intuitive reporting
capabilities. BIS incorporates a larger expanse of functions and applications, whereas
prior ESS systems were limited in their scope and feature set due to cost or knowledge
considerations. The control group also found significance in the relationship with
learning. The control group had exposure to the system training and review, and in
discussions heard from active users to the capabilities and reliability of the system, which
contributed to the significance.
Information quality was found to form a significant relationship with learning in
the study group. This is not found to be different than in ESS systems, as information
quality is a pervasive trait. It is important for users to be confident in the information and

111
the resulting decisions and mental models that are generated in response to the
information. Trust is a major factor in the routine use of a system, and information
quality plays an important role. The control group did not form a significance
relationship with learning as a result of the limited information accessibility, and
associated limited frequency of decision making.
Learning at individual, team, and organizational levels was found to form
significant relationships with competitive performance and being a quality organization.
While mental-model building was previously found to impact competitive performance,
mental-model maintenance through use of BIS is also found to impact competitive
performance, with mental models included as variables within organizational learning.
While executives may be interested in long-term competitive performance and quality
achieved through mental-model building, management staff and professional employees
are interested in short-term performance goals and quality improvements achieved
through mental-model maintenance. This may include new processes or procedures or
new tools to enhance ongoing performance. This could be as simple as adapting the
schedule to optimize production, better response to an influx of orders, or quality
identification areas. Combined these are seen to positively improve the short and long-
term sustainability quality and performance of the organization, with BIS providing the
information and performance management capabilities to drive the organization forward.
Quality organization was found to have a significant relationship with competitive
performance. Within healthcare, quality is an important aspect from improving delivery
of services, to patient care, and quality of life. The combination of employee, customer,
and shareholder satisfaction along with quality healthcare services, contributes to overall
112
competitive performance of an organization. BIS contributes to learning and resulting
quality of the healthcare organization through quality monitoring and predictive
capabilities delivered through dashboards, scorecards, and reporting functions.
To achieve competitive performance, organizations must support quality
programs and organizational learning vis-à-vis BIS. Learning and quality were found to
form a significant relationship with competitive performance. In the control group, weak
significance was found with regard to learning and competitive performance. This
suggests that BIS capabilities increase the significance in relationship between learning
and competitive performance. Individual learning at a position/level were not found to
significantly contribute to learning and subsequent performance. This is important as
earlier notions of the resource-based-view of the firm held that only managerial talent led
to competitive advantages. It is important to note that through BIS, individual users can
contribute to a firm’s competitive advantage. This necessitates the need to retain key
staff both at professional contributor and managerial levels. The knowledge based theory
of the firm also identifies that the knowledge developed and captured through a BIS and
learning, can create a significant resource leading to sustained competitive advantages.
7.2 BIS Implications
Organizational knowledge creation and learning is a required component for
today's healthcare organizations to improve quality and performance. The increasing
amounts of information require BIS capabilities to assist with learning via mental models.
Increasing stakeholder demands for information also necessitate BIS implementation
across all user entities and areas of the organization. This study found a significant

113
relationship between information quality and organizational learning. This finding
demonstrates that information quality is a requirement to learning and subsequent
competitive performance of an organization, and suggests that information quality is a
key priority in the development of a firm’s competitive position.
In user feedback, information and system quality and the BIS to deliver quality
information had the greatest impact for improvement and continued contributions to
organizational learning, healthcare quality, and competitive performance. This is
important as new users enter the organization, and as existing users change roles and
responsibilities over time. Key recommendations include making BIS information
immediately accessible to all stakeholders, and continuing to expand information quality
and knowledge through increasing analysis, trending, and predictive information
capabilities.
Some of the key findings and recommendations with regard to systems quality
include site to site and enterprise application and information integration, enterprise
systems consolidation, exclusion of non-supported vendor legacy applications from any
work scope due to integration issues and limited support, adding cost assumptions for
contract specific restrictions and added integration costs, limiting customizations to avoid
upgrade issues and legacy lock-in, and maintaining current or n-1 major version for all
software components across all instances. Maintaining current versioning is key in order
to take advantage of new features and performance improvements, in order to resolves
common bug fixes, ensure software support by the vendor when issues arise, and ability
to find resources within established parameters greatly improves. Often after
implementation, little attention is paid to continuing upgrades and enhancements, often

114
re-creating the original issues of legacy systems and capabilities, as well as continuing
bug issues and lack of vendor support, leading to costly internal resourcing or external
consulting arrangements.
From a systems hardware/software platform perspective it is important to align
software and hardware purchases with BIS vertical platform architecture to avoid
integration issues, as in historical case studies up to 40% implementation costs are
typically spent on integration, due to the complexities of integrating multiple vendor
components and hardware support. Along these same lines utilizing a single vendor vs.
best of breed for small-medium business scenario significantly reduces costs and eases
time to implementation. It is also critical to assign short-term dedicated consultant
resources to improve timeline and knowledge transfer for existing staff, particularly in
cases where the software application has limited internal expertise. Using a common
vendor with wide knowledge bases for faster resolution of issues assists greatly, and a
large community offers opportunities for identifying and resolving common items.
Staging and test environments can be omitted to reduce costs and speed deployment.
Often the cost of maintaining staging and test environments are not adequately
considered and often become out of date and no longer match the production
environment. It is important to consider whether a structured process and resource
allocation is in place to support necessary environments and plan accordingly. In some
cases only critical components can be tested in development to reduce costs and speed
deployment. A sample vertical architecture is shown below, based on a Microsoft BIS
stack with Windows operating system, SQL Server as database management system,

115
.NET as the development framework, IIS as the web server, Office and CRM as the end-
user tools, and SharePoint as the content and knowledge management system.
Service quality was found to not form a significant relationship with
organizational learning. It is suggested that service quality may vary widely based on the
particular support area or individual representative, and the limited interaction with that
individual in a learning capacity. Instead the information and system quality capabilities,
coupled with one’s own ability to learn and form individual learning, leads to
organizational learning, where daily variances in service quality are not large enough to
display a significant affect on the overall population.

116
Figure 22: Sample BI Vertical Architecture Table 21 displays BIS themes as developed within BIS. Information is now
accessible to a global set of stakeholders due to reduced cost and technology, as well as
increasing resource capabilities across the entire organization to achieve competitive
advantages. The decision focus based on the information now occurs at an operational or
line-level, as well as a strategic level, for both short and long-term decision making. This

117
is an important distinction within BIS vs. prior decision support systems, as the systems
are accessed by and provide capabilities for virtually all stakeholders instead of
executives or a select group only. While executives may have the greatest influence in
decision making, it is also the day-to-day operational level employees and various
stakeholders who also make decisions that can influence the organization and other
stakeholders. It is this access to information that allows learning to occur.
BIS Democratization is a key component to the impact of BIS over prior support
systems. The keys to democratization include low cost, web accessible, culture,
scalability, and customizability. BIS system cost has been lowered significantly,
allowing mass adoption of systems. Costs now range from no cost, to several hundred
dollars per user, in line with licensing costs for other organizational applications, and a
small portion of total employee costs. The second factor is web accessibility, this puts
BIS within reach of most users given the familiarity with web pages and overall
interactivity, vs. a custom desktop application with non-intuitive interface. The third is
culture, company cultures are increasingly computerized and utilize information systems
throughout the workforce. Fourth is scalability, the ability to easily add new users and
areas, allows easy roll-out to increasing larger sets of employees. Last is customizability,
or the ability to tailor the BIS software to the entire set of employees without incurring
significant additional costs, which allows continued use of investment, and avoids several
packaged application supporting each area. The table below shows the key components
of BIS systems, and displays the percentage of active users accessing each component.
While the vision of BIS is 100% user adoption, there are still specialized aspects of BIS
such as database management where users may not need to use or tools have not yet been

118
tailored appropriate for use or made relevant for all end-users. The BIS was developed
with the application layer accessible and presented to all users, through which various
BIS components were made available. Greatest percentage access took place through
content and knowledge management components such as RSS feeds, announcements,
libraries, wikis, contacts, help files, and localized site information. As the tools become
more specialized, the percentages decrease, for example 38% of users accessed
performance management components such as scorecards and dashboards, and 25%
generating self-service ad-hoc reports. The smallest percentages were analysis and
DBMS components with 4% and 1% respectively. As these components were available
to only a few users for security and skill set reasons. However these uses were made
available through the front-end UI. For example, database performance tuning and
logical setup was only accessed by a few users, though all users benefited from those
components. Likewise, analyses were conducted by a few dedicated users and posted to
a knowledge base for access by all users.
Table 20: BIS Components Access
BIS Component % Users Knowledge Management 100% Content Management 100% End-User Tools 100% Performance Management 38% Querying / Reporting 25% Analysis 4% Database Management System 1%
It is important for users to be confident in the information and the resulting
decisions and mental models that are generated in response to the information. Trust is a
major factor in the routine use of a system, and information quality plays an important
role. The information scope can be broad, encompassing all aspects of the organization

119
at once, or drilling down to a specific function or area, this information drill-through is
also described in the level of aggregation, which begins at the lowest level of grain,
which allows end users to drill-up or drill-down on required information. The
information is also accessible throughout all points in time, including historical data,
present data, and future data by means of predictive modeling. Information currency is
improved due to operational requirements of real-time monitoring of activities.
Persistence is the ability to retain relevant information over the required timeframe, and is
achieved through updates and system archiving capabilities. Information is utilized to
generate more frequent decisions, which allow the firm to more dynamically adapt to the
changing environment, with many decisions occurring in the process of daily activities
with little formality. In addition it allows information to be used to supplement
individual experience to empirically demonstrate the decision outcome or expected path.
The feature set within the BIS is an important contributor for the set of stakeholders to
produce the required information. In other words, allowing the user to answer the
question, or answer new questions previously not thought of. Key within the set of
variables is the analysis capability. These analysis capabilities may include advanced
data mining features or simple intuitive reporting capabilities.
Learning capabilities are expanded throughout the entire organization, which
allows all users to contribute to competitive performance and quality instead of only
select users previously. Learning at individual, team, and organizational levels was
found to form significant relationships with competitive performance and being a quality
healthcare organization. While mental-model building was previously found to impact
competitive performance, mental-model maintenance through use of BIS is also found to

120
impact competitive performance, with mental models included as variables within
organizational learning. While executives may be interested in long-term competitive
performance and quality achieved through mental-model building, management staff and
professional employees are interested in short-term performance goals and quality
improvements achieved through mental-model maintenance. Combined these are seen to
positively improve the short and long-term sustainability quality and performance of the
organization, with BIS providing the information quality and performance management
capabilities to drive the organization forward.
Table 21: Business Intelligence System Themes
Theme DSS ESS BIS User Base Select Executive Global Decision Focus Strategic Strategic Hybrid Scope Focus Narrow Narrow Broad Aggregation Detailed Summarized Drill Through Time Historical-Future Historical-Present All Time Currency Archived Near Time Real Time Learning Individual Team Organization Persistence Short Term Mid Term Long Term Decision Frequency Infrequent Occasional Frequent
7.3 Learning Implications
The majority of learning is categorized under maintenance learning, and involves
daily and short-term tasks or objectives, and occurs as single-loop learning, with
effectiveness at incremental improvements. Single-loop learning is separated from
organizational learning which involves double-loop learning. Anticipatory learning deals
with proactive and strategic learning to target future issues or opportunities. Crossover
and utility tools are likened with best practice approaches to allow both anticipatory and

121
maintenance learning through active participation [102]. BIS incorporates the varying
categories of tools, to allow multiple forms of learning to occur in parallel. To achieve
maximum effectiveness BIS strategies and roll-out solutions should incorporate a
comprehensive toolset aimed at supporting and facilitating learning across multiple
levels. The importance of learning is critical for a firm to achieve sustained success, even
seemingly trivial tasks should be learned by employees, reinforced, and improved.
Learning should be tied to an individual’s goals or objectives and evaluated as part of the
formal review process and continually reinforced at an organizational level. The figure
below lists the BIS components associated with each learning tool.
Figure 23: BIS Learning Tools
Individual learning or personal mastery is one's intrinsic motivation for learning
and development. Individual theories and models of the world are part of an individual's

122
work and mental models. This form of internal motivation is more effective than other
types of external motivation in learning. An individual vision can also lead to a shared
organizational vision by working with and motivating others. Individuals utilize mental
maps to work through complex environments and situations, but these mental maps are
defective in part, and must be developed through learning. Organizations are only able to
learn through individuals, which must continually challenge themselves and one another
to learn. An organization can build a culture which promotes individual learning,
through training and value creating environment [103]. CFT describes the individual
learning which occurs in complex domains such as healthcare. Maintenance and
anticipatory BIS tools provide the framework for mental model building and mental
model maintenance which form individual learning. As a specific example, an end user
may review a daily scorecard which monitors and reinforces activity conduct during that
particular day. The user may also employ predictive analysis capabilities, in the form of
an anticipatory tool, to determine which patient’s may require additional preventative
services than were provided. The user is then able to identify various root cause
components to improve routine completion within the process, and build existing mental
models for affected stakeholders.
Shared visions by an organization are a form of organizational community and
goals. These shared visions are critical to achieve organizational learning. A majority of
visions are created by an individual or small group of individuals and mandated to the
organization, rather than being reflections of each individual's vision. A shared vision
can be incorporated into the organization's products and services which are improved
through BIS capabilities and learning [103]. The key learning theory around shared

123
vision is situative learning theory, in which communities of practice are formed to foster
learning and development. Crossover and utility tools assist with forming theses
communities of practice through social exchange and knowledge transfer capabilities
provided through the BIS. As a specific example, users are able to search and identify
knowledge expertise in a particular subject area, that user is able to contact the user via
phone, instant messaging, or email, or through discussion board dialogue where other
users are able to utilize historical knowledge for their own learning and development.
Table 22: Learning Themes
Learning / BIS Tools Maintenance Anticipatory Crossover Utility Individual Learning Mental Model Maintenance X X X Individual Learning Mental Model Building X X X Organizational Learning Shared Visions X X
7.4 Healthcare Implications
Within healthcare, quality is an important aspect from improving delivery of
services, to patient care, and quality of life. In this study, healthcare quality was found to
have a significant relationship with competitive performance. The combination of
employee, customer, and shareholder satisfaction along with quality healthcare services,
contributes to overall competitive performance of an organization. BIS information
quality contributes to learning and resulting quality of the healthcare organization
through quality monitoring and predictive capabilities delivered through dashboards,
scorecards, and reporting functions.
124
To achieve competitive performance, healthcare organizations must support
quality programs and organizational learning vis-à-vis BIS. It is important to note that
through BIS information quality, individual users can contribute to a firm’s competitive
advantage. This is important as earlier notions of the resource-based-view of the firm
held that only managerial talent led to competitive advantages. This necessitates the need
to retain key healthcare staff both at professional contributor and managerial levels. The
knowledge based theory of the firm also identifies that the knowledge developed and
captured through BIS and learning, can create a significant resource leading to sustained
competitive advantages.
The healthcare industry must resolve conflicting objectives between competitive
performance and quality. For example the desire to return shareholder investment
through profit and revenue increases, must be balanced with the desire to improve quality
of care and outcomes for patients. BIS permits the realization of both objectives through
improved tracking of information and decision making capabilities. Recently significant
investment in healthcare information technology, a sub-component of BIS has allowed
patient centered tracking with access by patients and providers to improve information
flows. Technology has also allowed pay for performance programs, in which providers
are given incentive pay to promote best practices of improved quality and cost of care.
The conflicting objectives are brought to some resolution through use of BIS, in which
accountants and clinicians can both reach consensus on appropriate results. The growing
amounts of information and use of healthcare information technology, requires BIS
capabilities and improved information quality in order to ensure both quality and

125
performance objectives are met or exceeded, and for the healthcare organization to
remain or move into an industry leadership position.
Healthcare information security and privacy is also another key area which has
implications for the electronic storage, usage, and transmission under BIS. As electronic
information becomes more prevalent, threats to individual rights are privacy present
themselves, as traditional safeguards are no longer applicable. The Health Insurance
Portability and Accountability Act (HIPAA) of 1996, introduced security and privacy
rules to safeguard privacy and ensure security of information. The privacy rule
encompasses oral, written, and electronic forms of information, and creates penalties for
inappropriate usage based on established guidelines. The security rule encompasses
electronic forms, and protection against unauthorized access. The compliance categories
of protection include administrative, physical, technical, organizational, and policy
safeguards [104].
7.5 Practical Implications
Stakeholder demands have required organizations to implement quality services,
products, and programs. For organization wide total quality, cross-functional
management and communication structures are required, in order to bring together
competing priorities, and range of individual abilities to achieve set objectives. When
total quality management fails, it is typically due to the missing complementary resources
that are required. In order to succeed and achieve organizational quality strategies, strong
backing by top management, information systems, and a stakeholder focused culture are
required. Additional requirements include application of quality assurance and
126
improvement to all organizational subsystems, such as individual department or business
process areas. Organizations must link strategies, actions, and measures in order to
achieve quality benefits. Performance management components should be based on the
organizational success factors, and tracked systematically [22].
HIT allows business intelligence and performance management capabilities to
determine the best course of action to address stakeholder requirements. Literature has
shown the right information in the hands of patients, providers, case managers, and others
leads to improved quality. Recent driving forces by technology-enabled stakeholders,
have created the demand for up to date information, and self-management, ultimately
leading to active management of improved quality [57]. Future directions include
developing a HIT process framework from an inter-organizational standpoint, and longer-
term annual comparison periods for measuring and ensuring sustained improvements.
Other steps involve descriptive analysis and modification of requirements based on the
specific vantage points such as a payer, provider, and patient.
The need to set HIT as a designated quality project, along with management
support is critical to overall success. Healthcare organizations must continually adapt
and improve in order to be successful. HIT can be utilized to aggregate and analyze
information to improve decision making and support. A process framework which
includes the aforementioned HIT techniques is described below for establishing
organizational quality management improvements.
The first step in the overall HIT quality improvement plan is to gather data for
baseline measurement. This data may be collected through a variety of sources, such as
financial, clinical, or operational, depending on the measure. Most measures are typically

127
collected monthly such as financial measures, although frequencies also can include
daily, weekly, bi-weekly, quarterly, annual, and other special cases. Quality measure
baselines can be established from initial period data, while other measure baselines may
be established from common industry knowledge/standards.
Quality measure data is able to be collected in a data warehouse for historical and
future extraction, trending, and data mining. Information can be displayed through a
web-based user interface, with the ability to filter for varying time periods, drill-down to
varying levels of detail, and for viewing historical comparisons. Improvement targets
and overall goals are established for tracking progress against measures, with visual cues
provided.
Quality goals should be set at an organizational, state, business unit, or other
lowest level of the organization, and include Shareholder, Customer, and Employee
satisfaction targets relevant to the organization. Quality goals should generally have a
fixed target, percent, or relative improvement over baseline to measure progress towards
goal. Items and progress towards goals can then reviewed on a monthly, quarterly, and
annual basis to identify key improvement areas.
Most goals are set for an annual basis, with periodic target markers to track
interim progress throughout the year. Audit and progress reports are delivered monthly
to identify measures not meeting targets and additional quality issues. Other on-demand
reports are made available for tracking history and overall value presentation. A sample
project plan is presented below in Figure 24. This plan follows an iterative methodology,
in which incremental value is delivered, with multiple iterations able to occur
simultaneously, and in cyclical order.

128
Figure 24: HIT Quality Project Plan 7.6 Lessons Learned and Identified Best Practices
7.6.1 Collaborative Culture
Team work is an important aspect throughout any implementation project. This
requires close cooperation between all department areas and business and technical
teams, including top management, consultants, end-users, and vendors [105]. Aligning
resources with business strategies is also important, as typically there is limited alignment
between BI strategy and business strategy [36]. Organizational learning through shared
visions and commitment to learning is an important aspect to collaborative culture and
can be achieved through team work and alignment between units in support of a common
objective and set of goals.
H1: There is a positive relationship between collaborative culture and implementation
success
7.6.2 Communication

129
Wide information sharing and understanding must occur by all stakeholders
throughout the implementation stages and beyond. Communication should start as early
as possible to gain organizational understanding and acceptance [105]. Beyond
development of BI and user training, the vision must be marketed and communicated.
The BI applications must be viewed as mission critical and all users share that vision
[36]. Communication should be started early in the form of several announcements and
organizational newsletters, including email, meeting, and Intranet announcements. Kick-
off meetings with key personnel and staff resources should also take place, along with
regularly recurring meetings.
H2: There is a positive relationship between communication and implementation success
7.6.3 Customization
BPR involves rethinking and redesigning business processes to improve key
performance measures such as cost and quality of service. Most organizations are
required to modify their existing business processes to fit the application software as a
way to limit customizations [105]. Arnott describes this similarly as the degree of fit
between the organization and the software and hardware [106]. Many times an
implementation may not meet expectations, due to an underestimation of change
management complexities and encountering resistance to change [105]. In many cases,
end users must be trained in the new paradigm after and during BI implementation.
Users must also be trained in understanding and adjusting to changes in business
processes [36]. BI platforms should be selected which allow for customizations to occur
dynamically through the user interface, this resolves prior system issues which occurred
at time of upgrade of customized applications or modules. The flexibility of most BI
130
platforms allow for customizations which previously were unavailable in the scope of a
enterprise application.
H3: There is a positive relationship between customization and implementation success
7.6.4 Project Management
Organizations should use s structured and formal approach for BI projects. Many
projects fail to adequately account for organizational requirements, resources, and
funding necessary to support a successful BI implementation [36]. PM includes
coordinating, scheduling, scope, and monitoring activities and resources in line with the
project objectives. PM is also responsible for the overall implementation process and
developing organizational support. The DW/BI systems should be developed iteratively
building to a complete application set. [105, 106]. Agile methodology was adopted,
having a formal project methodology and a formal project management office for
oversight and project tracking is critical to the project’s success. It is important to
establish critical success indicators and metrics from project inception, to ensure
expectations are met and exceeded. To allow improved deployment speed, an iterative
methodology with rapid prototyping should be employed. Parallel user sub-groups
should be established to allow continuous feedback from rapid prototyping and to reduce
periods of inactivity.
H4: There is a positive relationship between project management and implementation
success
7.6.5 Resources
Resources can include financial, people, hardware, software and time for project
completion. It is also important to fund new activities required as a result of BI
131
implementation such as meta data management. Resource issues often have a negative
impact on implementation success [5, 36, 106]. Consultants are often required due to a
knowledge gap and complexity of new systems. User involvement can occur through
requirements gathering, implementation participation, and use after go-live [105].
Dedicated resources should be assigned to avoid inevitable competing projects and
priorities. Dedicated consultant resources should be allocated to improve timeline and
knowledge transfer for new technology areas. Though consultants should only be
utilized as a temporary solution, as knowledge-loss occurs with continued usage.
Dedicated department or area based resources should be assigned for local subject matter
experts and knowledge diffusion.
H5: There is a positive relationship between resources and implementation success
7.6.6 Top Management Support
Top management provides the required resources in a direct or indirect manner
through financing, as well as the power and support. Top management is also responsible
for setting a clear direction, overall project objectives, project guidance, representation,
and establishing these throughout the organization [105, 106]. Sponsorship across the
entire management team, allows others in the organization to support the project through
reducing political resistance, and facilitate participation. Top management support must
include top management champions and are viewed similarly [5]. All top management
should be advised of the project by the sponsors, and any issues or concerns addressed
initially. It is vital for the sponsors to continually update top management early in the
project, and as components are released to end-users.

132
H6: There is a positive relationship between top management support and
implementation success
7.6.7 Training
Training end-users is important to improve knowledge and appropriate use of the
system. General BI concepts, components, demonstration, and use are key training areas.
Training should also include process changes and overall flow of information and
integration [105]. Training also includes the standards and policies that must be followed
for the new BI applications, to optimize use of BI by end-users [36]. Training modules
and materials should be developed prior to the initial go-live, along governance plans,
such as best practices, content and technical standards, and policies and procedures
should be developed for training purposes. In addition, proactive monitoring of training
issues should be immediately addressed to avoid long-term paradigm creation in early
stages. New users should be required to take established training and existing users on
an annual basis and directed to the training materials as questions arise.
H7: There is a positive relationship between training and implementation success
7.6.8 Vertical Architecture
In prior BI implementations multiple vendor solutions required purchase, as one
vendor did not provide a fully integrated solution, also other companies chose a best of
breed approach based on vendor offerings. Today, several vendors offer completely
integrated solutions with equitable offerings across services. In one survey organizations
utilized an average of 3.2 vendors with 8-13 tools. For the small-medium business
scenario, utilizing a vertical architecture with a single vendor was identified as a critical
success factor. Due to resource and funding requirements, the ability to match expert

133
skillsets with a best of breed approach is not possible. The use of a single vendor also
improves delivery time through ease of installation and avoids integration issues that
commonly arise when utilizing multiple vendor solutions vendors. Here, a vertical
architecture is defined as having a single vendor designed and developed BI platform,
which includes Knowledge Management, Content Management, Performance
Management, End-User Tools, Querying / Reporting, Analysis, and Database
Management System.
H8: There is a positive relationship between vertical architecture and implementation
success
7.6.9 Perception-Based Success Factors
BI project implementation success is measured through whether the project
completed timely, completed on budget, and overall satisfaction with the BI [5, 6]. These
measures are survey-based perception measures, a separate set of data-based success
measurements are also included as a component of the case study. The table below
displays the summary of supporting works for construct and hypothesis development.
Table 23: Summary of Supporting CSF Works
Wixom and
Watson (2005)
Bhatti (2005)
Williams and
Williams (2007)
Howson (2008)
Arnott (2008)
Case Study
Implementation Factors
Collaborative Culture X X X Customization X X X X Communication X X X Project Management X X X X X Resources X X X X X Top Management Support X X X
X
Training X X X

134
Vertical Integration X X Success Factors Perceived Success X X X Timely Implementation X X
X
Satisfaction X X X
Figure 25: BI Implementation Success Model
A path analysis is employed using SmartPLS 2.0 software to analyze the results and
determine model fit [100]. A model with significant loadings is developed. Significance
of relationships was determined between implementation factors and success factors.
The final model specification includes the supported paths, all paths were supported for
significance at p = 0.01. Results showed that 73.8% of the variability in implementation
success is explained from the model.

135
Table 24. CSF Measurement Model Quality AVE Composite Reliability R Square Cronbachs Alpha
Implementation Factors 0.57986 0.90581 0.878317 Success Factors 0.66762 0.922954 0.738381 0.899059
The table above displays the quality of the model. The average variance extracted is
indicated by the column AVE, and is the average communality for the latent factors in the
model. AVE is utilized for convergent validity, and should be greater than or equal to
0.5, which the latent factors exceed. Composite reliability is also utilized as Cronbach’s
alpha commonly underestimates or overestimates reliability. Composite reliability
follows similarly to Cronbach’s alpha, with 0.80 to be considered good, 0.70 to be
considered acceptable, and 0.60 to be considered for exploratory requirements.
Composite reliability exceed 0.90 for this model. R-Square displays the effect size
measure, and is not shown for exogenous constructs. An R-Square of 0.67 is considered
substantial, 0.33 considered moderate, and 0.19 considered weak. The R-Square for this
model is 0.73. Cronbach’s alpha should be equal to at least 0.80 to be considered good,
0.70 to be considered acceptable, and 0.60 to be considered for exploratory requirements.
For short scales, Cronbach’s alpha may be biased, this study utilized 7 point scales for all
questions measured, and Cronbach's alpha exceed 0.80 [96, 100].
7.7 Success Components
Given the complexity of most system implementations, no single measure exists
for Business Intelligence success. As a result, various measures including tangible and
intangible measures are utilized to determine success, including perception-based
measures, return on investment, system response time, report generation, among others
[6]. Beginning with the initial go-live, identified key metrics were tracked to gauge BI

136
initiative success. Based on industry literature and baselines, many of the metric targets
were set higher in an effort to make the most of the information systems investments.
The specific measures for tracking are presented below, and were populated in scorecard
format for improved tracking and support of BI implementation success as shown below.
7.7.1 BI Platform Metrics (KPI’s)
In order to improve business performance, make data more accessible, support
key areas, improve our mission as a quality organization, and present data in various
visual ways, a comprehensive performance management component of the BI initiative
was started, and resulted in definition, development, and presentation of over 1,000 Key
Performance Indicators in Scorecard, Dashboard, and Report formats. Once a full year of
data was captured, these KPI’s were later reduced to focus specifically on those which
accounted for the greatest contribution to key goals.
Figure 26: Business Intelligence Project Scorecard
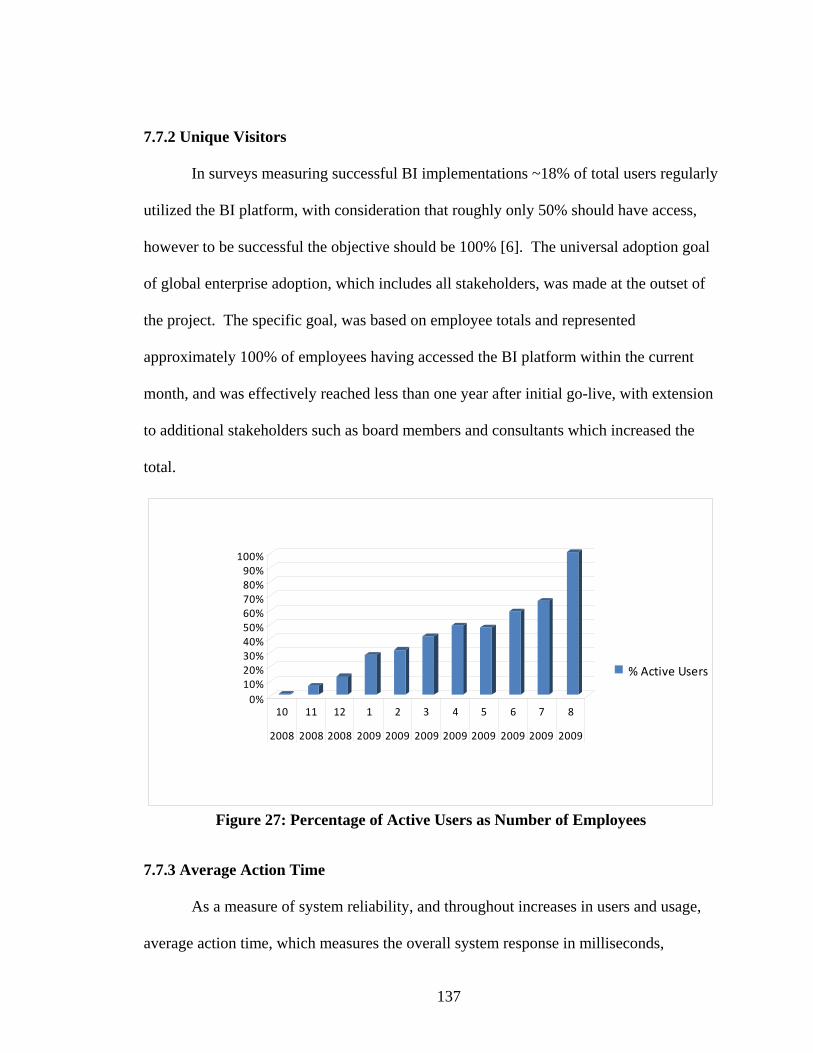
137
7.7.2 Unique Visitors
In surveys measuring successful BI implementations ~18% of total users regularly
utilized the BI platform, with consideration that roughly only 50% should have access,
however to be successful the objective should be 100% [6]. The universal adoption goal
of global enterprise adoption, which includes all stakeholders, was made at the outset of
the project. The specific goal, was based on employee totals and represented
approximately 100% of employees having accessed the BI platform within the current
month, and was effectively reached less than one year after initial go-live, with extension
to additional stakeholders such as board members and consultants which increased the
total.
0%10%20%30%40%50%60%70%80%90%
100%
10 11 12 1 2 3 4 5 6 7 8
2008 2008 2008 2009 2009 2009 2009 2009 2009 2009 2009
% Active Users
Figure 27: Percentage of Active Users as Number of Employees
7.7.3 Average Action Time
As a measure of system reliability, and throughout increases in users and usage,
average action time, which measures the overall system response in milliseconds,

138
remained ahead of acceptable response times and user performance requirements and
expectations, with a target of 4000 milliseconds as measured through system logging.
Sufficient capacity was added during the planning stages, in order to allow long-term
growth projections to occur without impacting system performance or requiring re-
architecture or upgrades to accommodate increased usage.
7.7.4 Usage
As a proxy for usage, and to compare relative usage between individuals and
departments, a combination of visitors, bandwidth, hits, page views, and self-service
report runs was developed, and presented in summary scorecard form. In addition
detailed usage reports were supplied to individual departments on a monthly basis, along
with individual user detail reports on demand such as a My BI Usage report. Visitors
included unique visitors based on named logon, and visits included unique daily visits
with a maximum of 1 per day. Hits included the total number of web part/content
components loaded. Page Views included the total number of individual page views.
Bandwidth included total server sent and received megabytes utilized. Self-Service
report runs, included those reports scheduled for automated delivery or those which were
invoked by the individual user, entering various parameters for selection and on-demand
generation.
7.7.5 Release Management
Following an iterative methodology was identified as a critical success factor,
which allowed for continuous release of key features to additional areas approximately
every month. Release management for each of the 24 project iterations were also tracked
through the scorecard for current status. These iterations included department releases, as

139
well as key functionality such as performance management, content management, KPI
sets, data warehouse features, along with other capabilities.
7.7.6 Departmental Survey
In addition to key success metrics above, a business-based survey was conducted
to gauge overall improvements as a result of BI investment as part of a semi-annual
department survey. The survey graph below displays overall improvement relative to BI
contribution prior to standardized BI platform implementation and after implementation.
These areas included perceived BI contribution to performance, sales, ease of use,
information accuracy, information currency, information accuracy, information
presentation, and overall stakeholder satisfaction. The results were scored as a
percentage scale score, with 100% being the highest possible score. Significant
improvement is shown within all established critical success factors between February
2008 and December 2009 comparison period, or pre and post-implementation.
Figure 28: BIS Contribution Pre-Post Implementation for Select Measures

140
7.8 Return on Business Intelligence Investment (ROBII)
Business Intelligence is a critical component for organizations that want to
compete in today’s economic climate. As an organization progresses in Business
Intelligence maturity, the value of its BI activities expands. Successful organizations
increasingly utilize analytical approaches to identify and enact modest improvements that
increase profitability and return on business intelligence investments (ROBII). Most
organizations do not complete a formal ROI due to difficulty in calculating savings and
avoidance figures, or failing to capture throughout and beyond projection completion.
For those with calculated return on investment, these have ranged between 300% and
2000%, with typically less than one year payback [5, 6, 36, 107]. Cost-savings are
presented here in areas including implementation, support, licensing, storage, ITS,
productivity, training, and end users are outlined and summarized in terms of overall
return on investment for years one following a full year including implementation, and
projected out in years two through six. Year one ROBII is 1419%, with years two
through six between 815% and 928%. Year one has a greater savings percentage due to
implementation cost savings, with future years at a standard growth rate. Cost savings
can be greater enhanced through improved levels of growth and capabilities.
Table 25: Return on Business Intelligence Investment Components ROBII Category ROBII Component
Implementation costs Support and maintenance costs Licensing costs System training costs Storage costs
Technical Savings
Lower service desk support costs

141
Lower ITS support costs Increased end-user adoption through system utilization Greater productivity among end users Faster and more effective responses to organizational changes Faster employee transitions to new jobs, roles, and responsibilities User training costs
End-User Savings
Performance Management 7.9 CSF Key Findings
The first key finding is the identified implementation construct addition of a
vertical architecture, particularly for the small-medium business (SMB) scenario. A
vertically-integrated architecture improves the implementation timeline and required
resource base for implementation success. The second key finding is around
establishing a collaborative culture to promote organizational learning capabilities. This
extends previous notions of team work and business-IT alignment, and is necessary to
support adoption and use of BIS. Third involves implementation success outcomes when
democratization or universal user adoption of BIS has been achieved. In past studies
measuring BIS success, only a small portion of users had access to BIS capabilities, it is
through the extension of BIS to all users that successful outcomes can be realized. The
fourth component includes systematic capture of key BIS metrics to ensure usage
standards are met, and tracking these project success factors by utilizing the inherent BIS
capabilities. This permits organization-wide tracking and transparent viewing of BIS
implementation project status, along with key system indicators. The last component
utilizes case study evaluation of identified success factors and develops calculations to
demonstrate business value of BIS, through both empirical methods and evaluation of
existing success components comparatively, triangulating results to form success
conclusions.

142
There is an importance to identifying universally applying critical success factors,
and the ability for tailoring those factors to an individual organization or implementation.
However it is the adaptability of the BIS capabilities and the overall project that will
ensure successful completion. Other identified areas of study and importance beyond
implementation include establishing a competency center to ensure continue usage of
business intelligence, stakeholder satisfaction, and decreased costs. Another area is
establishing an architecture roadmap for future iterations and system updates, these
include enhancements to key capabilities and features, bug fixes, security improvements,
and ensured vendor support. A governance plan is also important to establish technical
roles, support service level agreements, back and recovery, database and data standards,
metadata standards, content branding, life cycle policies, and training.
7.10 Business Intelligence Research and Competency Center (BIRCC)
The BIRCC consists of two main components, the research center and
competency center. The research center seeks to develop publication quality research
and development. This includes establishing an organization as a leader in research and
development, gaining industry exposure through peer review outlets, incorporating
empirical methodology for evaluation and improvement, improving understanding of
theoretical backgrounds and implications, and citing for proposal expertise and marketing
materials. The second component, the competency center consists of operational aspects
such as BI program and project management, technical support, training, data
stewardship, analytics, performance management, contracts administration, data
acquisition, and delivery. The research and competency center components work closely

143
together to provide feedback on current practices, identify future trends and
opportunities, and improve overall organizational BI value. Benefits for a BIRCC
include increased usage of BI, increased user satisfaction, better understanding of BI
value, increased decision making speed, decreased staff costs, decreased software costs.
The figure below describes a sample BIRCC structure with the two main components of
research and competency center along with key responsibilities and functions, along with
overall oversight and core resources team to support the BIRCC [108, 109].
The BIRCC supports itself through cost savings realized by eliminating redundant
tools or reducing the overhead of expensive support and maintenance contracts. As the
BIRCC becomes more strategic, it becomes more difficult to quantify its intrinsic value,
such as measuring improved decision makers. Many Centers demonstrate tangible and
intangible benefits and continue to deliver greater value from BI investments. Funding
recommendations include listing costs as overhead, then all departments can use the
BIRCC services [108, 109].

144
Figure 29: BIRCC Structure
7.11 BIS Governance Plan
A typical governance plan contains both technical and content/knowledge
management components. The first step is drafting a governance plan, or utilizing
existing plans and adapting accordingly. The governance plan is a guideline outlining the

145
administration, maintenance, and support of BIS deployment. It identifies ownership for
business and technical teams and identifies responsibility for various BIS areas. The plan
also establishes a set of appropriate use guidelines and mechanisms for maintaining the
systems. The governance plan seeks to ensure adequate system management occurs, and
minimize risk components such as scope creep or out of control structures. The
governance plan requires business and technical skill sets to develop policies and
procedures for the BIS in a way that benefits both short-term and long-term objectives.
This includes routine day-to-day tasks, as well as strategic initiatives, and involving
various stakeholders in the processes. The goals of the governance plan include:
establishing the services definition and governing technical and business policies by
which the BIS will be run based on the defined requirements, creating a team to govern
and support the BIS based on the current services offered, and communicating the initial
high-level ITS and business requirements as they relate to the services offered. Key
components of a typical BIS governance plan are included below [110].
Table 26: BIS Governance Plan Components
Category BIS Governance Plan Components Executive Overview Sponsors Sponsor Signoff and Commitment Project and Operational Management Initiative Critical Success Factors Service Delivery Goals Delivery Requirements Content Service Definition Team Roles Communication Plan Business Review Meetings
Project Management
Content Support Services Technical Physical Topologies

146
Development and Configuration Application Policies IT Governance Definitions Security Appendix Key Terms and Definitions
Administrator, Developer and End User Training 7.12 Combined BIS Model Specification
A combined BIS model specification from research manuscript sections is shown
below. This includes the various components of the research manuscript, starting with
key implementation success factors for BIS, followed by learning antecedents, learning,
learning outcomes, and expanded organizational quality discussion on learning outcomes.
Figure 30: Combined BIS Model Specification 7.13 Limitations
A limitation may be external validity or ability to generalize across time, location,
or person. Generalization uses an inductive process to extrapolate beyond the data,
where trivial and interaction factors are identified, and attempts are made to close the
experiment gap between time, location or person. To improve external validity, this
study seeks to model the healthcare industry only, as well as select users who are
represented across multiple geographic locations, affiliated entities, healthcare service
types, healthcare sectors, and contract types. As several of the measurement items are

147
not readily available externally, and require dedicated healthcare professionals to
conduct, a case study is utilized to capture and analyze the required components [111].
Limitations also include a single sample study, to which data driven modifications are
made to improve fit. The triangulation methods employed also create some replication
difficulty, particularly within qualitative methods, though components and results are
contained within the study to outline the mixed-methods portfolio and approach. This
model should be completed with additional samples to generalize the approach. This
model may also be extended outside the healthcare industry to incorporate other quality
concepts in the model.
7.14 Contributions
This research study identifies relationships of BIS on learning, quality, and
performance within a healthcare setting. Previous information systems have not
demonstrated a link between mental-model maintenance and competitive performance.
In addition previous research does not directly address how BIS and learning impact
organizational quality or discuss BIS specific relationships specifically within a
healthcare setting. This study develops a BIS model for quality and performance when
viewed through a learning perspective. The improved model adds explanatory power
over prior models, and theoretical contributions to BIS use. The model also includes an
important quality component, when used in conjunction BIS, is improved as a result of
learning, and quality also adds to the performance of the organization. Practitioner
knowledge is improved through use of a case study, and identifies key priorities,
IT/business budgeting requirements, success estimation, quality, and performance

148
improvements that are able to be achieved through BIS. Policy knowledge can be gained
through healthcare information systems funding, focus of government programs, and
overall quality focus of healthcare. Key contributions include:
• Improved explanatory power over prior models
• Significant link between multiple forms of learning
• Quality Organization component added to model
• Significant link between organizational quality and competitive performance
• Quality considerations of varying stakeholders and quality management
• Healthcare implications
• BIS implications
• Learning implications
• Critical success factors of BIS
• Lessons learned for BIS
• Evaluation of ROBII and return on investment calculation methods
• Business Intelligence Research and Competency Center (BIRCC) instantiation
• Governance plan sample components
• Future directions of healthcare BIS services and application portfolio
• BI 2.0 and cloud computing architecture developed

149
VIII. CONCLUSION
In the competitive marketplace of today, it is vital for healthcare organizations to
adopt strategies and information systems which lead to sustainability, improved quality
and competitive position. Information quality is found to be a key differentiator in the
ability for learning to influence competitive performance. The unique context of
healthcare requires an extension over prior information system studies to incorporate
additional quality and information objectives. Whereas prior literature failed to find
significant links between ESS and mental-model maintenance, when utilizing the same
study for BIS we are able to identify significant relationships as a component of
organizational learning. This demonstrates the capability of BIS to improve
organizational sustainability and lead to quality and competitive performance. The set of
BIS components allows organizations to continually improve, and allows information
access by all levels of the organization. Possible limitations include sample size or
respondents. Future directions include determining fit by industry as well as longitudinal

150
studies to determine if learning of relationships of quality and performance changes over
time with continual use of BIS. Additional areas include exploring capabilities by
vendors, or comparing systems with enhanced features, such as those found within the
next generation of BIS tools, or BI 2.0.

151
IX. FUTURE DIRECTIONS
As organizations seek to take part in the growing IT services sector, they must
develop the appropriate architecture and business solutions which provide meaningful
information in real-time. Services definition and improvements to existing systems is an
important and growing area of research. An overall BI 2.0 application architecture for
healthcare services in the cloud is presented for enterprise integration of information and
BIS components, and outlines a portfolio of healthcare applications that can be
configured for and consumed by healthcare service users. A sample healthcare data
mining service application example is presented for real-time information exchange and
support in clinical decision making.
The economy is being transformed into a service industry, with services
accounting for 75% of the US GDP, and 80% of private employment. Overall IT
services are projected to increase at a 6.4% annual growth rate and value of $855.6
billion through 2010. Organizations that introduce a service-oriented architecture reduce
integration and maintenance costs by up to 30%, and it is expected that 33% of business

152
application spending will be on SaaS by 2012 and 40% of capital spending on IaaS by
2011, with spending to exceed $33.8 billion in 2010. A similar report found BI specific
SaaS will grow at 22.4% annual rate through 2013. SaaS BI is being utilized during peak
demand periods, and for those organizations seeking to reduce on premise costs or who
typically do not have dedicated technology staff. IBM, a key player in the services sector
continues to grow is service offerings, and is seeking to transform itself into an on-
demand service organization, and has extensively studied how those service innovations
can lead to sustainability and long-term growth. For business decision makers, the issue
remains as to what level of commitment and investment should be made to these new
services. SOA have been studied in research, some gaps include how these service
capabilities will be used within the business to create value, and how can these structures
be created [112, 113].
In 2010, The Department of Health and Human Services’ (HHS) National
Coordinator for Health Information Technology announced $60 million of funding for
Strategic Health IT Advanced Research Projects (SHARP). These special research
projects are intended to develop solutions to existing barriers in adoption and use of
healthcare information technology (HIT). As a component of the American Recovery
and Reinvestment Act (ARRA) the grants are intended to promote the use of HIT to
improve the quality and efficiency of health care and create collaboration between
researchers, health care providers, and healthcare stakeholders. The key areas of study
include patient focused HIT which supports patient care in day to day practice,
application architectures to improve health exchange, and secondary use of EHR data to
improve quality through HIT [114]. The outlined healthcare data mining services support

153
these key areas, through improved patient care and processing times, enhanced enterprise
architectures for information transparency, and second use of data to improve quality of
care and operational performance.
9.1 Business Intelligence 2.0
BI 2.0 describes the ways business information can be utilized in real-time, and
how BI can be applied to the business events. BI 2.0 speaks to the ability to delivery self-
service tools and mash up capabilities to end-users in real-time. In addition increasing
generations of technology users are demanding these capabilities. Real-time data from
widening sources is also generating demand, and is often displaces the centralized data
warehouse concept, giving way to context and real-time information from all operation
systems, logs, databases, and a wide variety of other sources [115, 116].
Organizations have initiated data warehousing web services, however this data is
often not in a real-time state for in process decision support. BI 2.0 processes events in
memory in line with the business event. The main events are comprised of XML
messages, which embed within business processes for real-time analytics vs. batch for
business events can start immediately. Most of these events are automated, or alert the
user for a specific action. BI 2.0 utilizes middleware for in process analysis compared
with historical data. Real-time demands require software applications that are event-
driven, and with real-time data that uses service oriented architectures (SOA), which are
loosely coupled and interoperable, enforcing a standardized application integration [115].
Cloud computing provides scalable and virtualized services to the end-user via a
simple web browser. A third-party manages the computing infrastructure, and provides

154
the software as a service (SaaS). Salesforce.com, Google Apps, Amazon, and Facebook
provide have cloud computing offerings. Cloud computing allows organizational to
reduce IT capital costs, and buy computing on an as needed basis. There are economies
of scale through shared use of systems and resources by multiple customers. Cloud
computing reduces the entry barriers by eliminating software distribution and site
installation requirements. This also permits organizations to develop new business
models and sources of revenue through on demand services [117].
9.2 Enterprise Integration
Enterprise Information Integration (EII) describes the integration of various data
sources into a unified form without requiring all sources be contained within a data
warehouse and also integration complexity reductions [118-120]. The enterprise unified
view must consume data that is available real-time via direct system access, and semantic
resolution must occur across systems. Semantic integration, also known as ontology, is a
higher level natural language approach to combine differing pieces of information
together, and in support of real-time events. A semantic information model can be
constructed using Web Ontology Language (OWL) developed by W3C. The
relationships and rules of the data are contained with the model, which the OWL
inference engine can read and intelligently integrate the information [119, 121].
Real-time EII begins with SOA, as the access point for all systems through web
services, and XML as the data representation [115, 121]. SOA promises improved agility
and flexibility for organizations to deliver value-based services to their customers. A
service is the application of knowledge for co-creation of value between interacting
155
entities. Service systems involve people, technology, and information. Service science is
concerned with understanding service systems, and improve and design services for
practical purposes. SOA includes Web service, technology, and infrastructures, and is a
process that add value, reuse, information, and overall value to the business. SOA
provides a commodization of hardware and software providing organizations with
improved architectures and which support IT service flexibility. The SOA approaches are
utilized to develop SaaS from IaaS [112].
Most real-time architectures consist of the required data sources and a virtual or
mediated data schema which is then queried by the end user or application. The systems
are typically build on a XML data model and query language. EII reduces data access
time, while Enterprise Application Integration (EAI) allows system updates as part of the
business process to occur. Both these technologies are utilized as a best practice and
combined into the concept of Enterprise Integration (EI). The EI architecture supports
heterogeneous data sources such as relational and non-relational databases, flat files,
XML, transactional systems, and content management systems. Information transparency
is provided through the virtual data access services layer which permits real-time
programming services. This architecture adheres to SOA, where business processes exist
as distinct services which communicate through known interfaces. This also helps
promote code re-use and more flexible IT infrastructure by allowing focus on business
logic, and leaving the data tasks to the EII layer [118-120].
9.3 Healthcare Applications

156
Healthcare organizations are increasingly investing in data mining services to
improve quality, service, and cost [122]. Several healthcare data mining applications are
available for building a comprehensive BI 2.0 application portfolio, allowing end-use
access without dedicated systems and at a reduced cost to improve value to stakeholders.
Many of the healthcare service components currently suffer from lengthy delays and
additional stakeholder requirements, which limits real-time information accessibility for
decision making and improvements. The table below describes the set of healthcare
service components, each with the specified healthcare requirements and improvements
objectives, along with current information and decision lag time, common data mining
methods utilized, and supporting works.
Table 27: Healthcare Data Mining Applications
Healthcare Services Component
Healthcare Requirements Need
Lag Time
Data Mining Methods Supporting Works
Risk Assessment Consumer driven plan selection complexity Monthly
Clustering, Regression
Cumming et al. (2002), Rector et al. (2004)
Prior Authorization Cost, Paper/Fax processes
3-4 Days Decision Tree Moeller (2009)
Fraud Detection
Fraud prevention, detection and diagnosis Annual
Neural Network, Classification Tree, Regression
Viaenea et al. (2005); Liou et al. (2008)
Quality Indicators
Quality of care improvements Monthly Decision Tree Chae et al. (2003)
Quality improvement approaches have been adopted within the health care
industry in attempt to improve quality of care. Most of the activities to date have focused
on manual activities without a direct link to the data within the healthcare information
system. Support systems can provide patient outcome information and clinical pathways
to support patient care and factors influence quality and treatment. Data mining which
allows for knowledge discovery from large sets of data can be used to identify patterns or

157
rules to improve healthcare quality. Patient characteristics including age, gender,
department, disease class, and quality indicators were utilized as part of decision tree
analysis to determine inpatient mortality factors. An index score was developed to
identify how inpatient mortality rates compare to overall proportions, and which
segments to focus on [123].
Risk assessment utilizes methods to assess relative risk of individuals within the
population, with the relative risk predicting costs. The assessment may be carried out
utilizing various forms of data and typically includes claims, pharmacy, and self-reported
survey information. This information has been utilized by the federal government to
adjust payments to health plans, by employers in determining employee contributions to
health coverage, by researchers in measuring outcomes of treatment methods, policy
makers for tracking access to care and quality of care, and health plans for case
management, disease management, quality improvement, payments to providers, and
underwriting activities [124, 125]. Growth in consumer driven health plans is driving the
need for improved risk assessment accuracy, as the employee has more options in
selecting benefits plans, and increases variability among the plan populations. Risk
adjustment then allows the health plan to determine project outcomes appropriately or
make equal payments to promote quality improvements rather than population selection,
and ensure comparative price and consumer choice [124].
Healthcare fraud and abuse cost public and private sectors billions of dollars, and
in the US these costs are estimated as high as 10% of annual spending or $100 billion per
year. Many health systems rely on human experts for manual review. Manual monitoring
is often expensive and ineffective. Data mining can reduce costs and identify previously
158
unknown patterns and trends [126, 127]. Increasingly healthcare entities are using data
mining tools to identify fraudulent behaviors. Data mining methods including
classification tree, neural network, regression have been applied to healthcare . The
Utah Bureau of Medicaid Fraud, Australian Health Insurance Commission, and Texas
Medicaid Fraud and Abuse Detection, mined data to identify fraud and abuse, saving and
recovering millions of dollars. Most fraud and abuse cases are associated with diagnosis
and services, some studies utilized provider name, id, demographics, claim patient,
procedure, charge, bill date, and payment deductible, copayments, insurance, and
payment dates to detect fraud [126, 128].
Health plans are increasingly requiring prior authorizations for services, and 90%
require fax or phone. Most medical policies and technology assessments are not
standardized and often out of date. These can be standardized for systematic
communication, and centralized for more timely updates. Current turnaround times are
3-4 days, which is long after the patient has sought services. Web-services offer the
ability to check eligibility, care guidelines, and routine approvals. There may occur
through a short series of questions utilizing decision trees to determine an answer in real-
time. Medical policies and guidelines are also updated dynamically, and can be linked to
electronic health records to improve information transparency among stakeholders [129].
9.4 Model
Following the approaches of Zhang and Demirkan, a BI 2.0 data mining services
architecture is developed and shown in Figure 31. The data layer contains the raw data
from local or remote sources, along with the meta-data. The data layer provides data

159
transparency to the underlying source, and is cached to improve performance being
accessed most frequently. The information layer has domain specific components and
connectors, and aggregates the raw data. Domain specific tools are utilized such as
simulation, geospatial or optimization models. The knowledge layer applies data mining,
knowledge discovery and simulation for decision making. The knowledge layer is
responsible for generating domain specific knowledge, for use in decision making
processes. The presentation layer is the web-based interface with user friendly interfaces.
The presentation layer manages lower layers, and provides data, information, and
services to end-users via the web. The horizontal layers are able to be vertically
integrated, which allows re-use of services and resources. This provides a flexible firm
architecture able to rapidly adapt to changing business conditions. [112, 130].

160
Ser
vice
s P
rovi
der
Serv
ices
Con
sum
er
Com
mun
icat
ion
Mon
itorin
g
Secu
rity
Figure 31: Healthcare Data Mining Services Architecture
Consider the following example of a healthcare services review request and
response delivered real-time via SaaS on a per transaction cost basis. A 278 HIPAA EDI
transaction [131] is sent in X12 format via a standard service entered via a web browser
through the application layer. For illustration purposes, a single use service with input /
output within a standard web browser is shown. The services may be performed and
utilized by various individuals such as a patient, provider, and payer, or invoked
programmatically for high volume and report services. The 278 follows a per patient
event relationship which is fitting for a SaaS model, and where utilization management,
payer and provider entities are not required to maintain local system software and

161
hardware, instead all layers are able to be managed remotely and accessed through a web-
based application layer.
Figure 32: Healthcare Data Mining Services Example
The EDI transaction which is sent in X12 format is then converted to a standard
xml message for usage within the integration and data layer. The specified prior
authorization service is selected, along with corresponding transactional cost, an service
selection credentials. The XML and service information is utilized within the integration
layer. The integration layer auto-maps the ontology for standard HIPAA and HL7
messages, or allows users to custom map elements through the application layer for
single use ability. Several services occur within the integration layer; the first selects and
aggregates historical data, second rule information is gathered for feeds into the data

162
mining algorithm and decision tree. The decision tree data mining algorithm is utilized to
determine the certification outcome from the historical knowledge based and input data.
Within the data layer certification information is inserted into the patient record via an
XQuery command, third claim information is updated to certify services for payment, and
fourth financial liability is recorded within a financial system. This information is
utilized within layers to present a final authorization through the application layer in real-
time. Future services can be utilized by other stakeholders relative to this transaction, for
example patients can view healthcare information on medical decisions.
9.5 Future Directions Conclusion
Healthcare entities are increasingly investing in information services, however
most on premise solutions require staff experts to implement, maintain, and extract
information for end-users. This absorbs resources which may be otherwise used for
patient care and quality. BI 2.0 healthcare services can be implemented utilizing an
enterprise integration framework to allow stakeholders access to information and
capabilities on demand, without dedicated IT staff. This also provides a unified data and
information set across all services, allowing any stakeholder to transparently utilize
services on a per transaction basis or subscription basis on demand. The service set can
be extended and categorized as patient services, provider services, payer services, and
employer services. Future directions include establishing standards around healthcare
data mining services and development of value added services and applications to support
healthcare quality and cost improvements.

163
REFERENCES [1] Oracle, "Sustainability Matters: Why-and how-business is widening its focus to
consider the needs of all stakeholders," 2008. [2] F. J. Mata, "Information Technology and Sustained Competitive Advantage: A
Resource-Based Analysis," MIS Quarterly, 1995. [3] A. Bernard, "Four Technology Best (and not so best) Bets for 2009," in CIO
Update, 2009. [4] L. T. Moss, Atre, Shaku, Business Intelligence Roadmap. Boston, 2007. [5] B. H. Wixom, Watson, Hugh J., "An Empirical Investigation of the Factors
Affecting Data Warehouseing Success," MIS Quarterly, vol. 25, pp. 17-41, 2001. [6] C. Howson, Successful Business Intelligence: Secrets to Making BI a Killer App,
2008. [7] V. H. Y. Lo, Yeung, A. H. W., Yeung, A. C. L., "How supply quality
management improves an organization’s quality performance: a study of Chinese manufacturing firms," International Journal of Production Research, vol. 45, 2007.
[8] J. Ranjan, "Business Justification with Business Intelligence," The Journal of Information and Knowledge Management Systems, vol. 38, pp. 461-475, 2008.
[9] B. Obama, "The President's Plan," 2009. [10] E. Brynjolfsson, Hitt, Lorin M., "Beyond the Productivity Paradox,"
Communications of the ACM, vol. 41, pp. 49-55, 1998. [11] P. Enrado, "Quality care, rather than federal funds, drives IT adoption, healthcare
execs say," Healthcare IT News, 2009. [12] B. Evelson, "Healthcare Tech: Can BI Help Save The System?," in
InformationWeek, 2009. [13] V. L. Patel, Yoskowitz, Nicole A., Arocha, Jose F., Shortliffe, Edward H.,
"Cognitive and learning sciences in biomedical and health instructional design: A review with lessons for biomedical informatics education," Journal of Biomedical Informatics, vol. 42, pp. 176–197, 2009.

164
[14] G. A. Miller, "The Magical Number Seven, Plus or Minus Two: Some Limits on Our Capacity for Processing Information," The Physcological Review, vol. 63, pp. 81-97, 1956.
[15] J. R. Galbraith, Designing Complex Organizations. Reading, MA: Addison-Wesley, 1973.
[16] D. L. Goodhue, Wybo, Michael D., Kirsch, Laurie J., "The Impact of Data Integration on the Costs and Benefits of Information Systems," MIS Ouarterly, pp. 293-311, 1992.
[17] K. Schlegel, Beyer, Mark A., Hostmann, Bill, et.al., "Predicts 2009: Business Intelligence and Performance Management Will Deliver Greater Business Value," 2008.
[18] B. Vandenbosch, Higgins, Christopher A., "Executive Support Systems and Learning: A Model and Empirical Test," Journal of Management Information systems, vol. 12, pp. 99-113, 1995.
[19] H. R. Nemati, Steiger, David M. , Iyer, Lakshmi S., Herschel, Richard T., "Knowledge Warehouse: An Architectural Integration of Knowledge Management, Decision Support, Artificial Intelligence and Data Warehousing," Decision Support Systems, vol. 33, pp. 143-161, 2002.
[20] I. Nonaka, "A Dynamic Theory of Organizational Knowledge Creation," Organization Science, vol. 5, pp. 14-37, 1994.
[21] H. H. Chang, "The Influence of Continuous Improvement and Performance Factors in Total Quality Organization," Total Quality Management, vol. 16, pp. 413–437, 2005.
[22] H. Chang, "The Influence of Continuous Improvement and Performance Factors in Total Quality Organization," Total Quality Management, vol. 16, pp. 413-437, 2005.
[23] F. W. Kellermans, Floyd, Steven W., Pearson, Allison W., Specener, Barbara, "The Contingent Effect of Constructive Confrontation on the Relationship Between Shared Mental Models and Decision Quality," Journal of Organizational Behavior, vol. 29, pp. 119–137, 2008.
[24] S. J. Hysong, Best, Richard G., Pugh, Jacqueline A., Moore, Frank I., "Using Guidelines and Reminders Not of One Mind: Mental Models of Clinical Practice Guidelines in the Veterans Health Administration," Health Services Research, vol. 40, pp. 829-848, 2005.
[25] M. Z. Elbashir, Collier, Philip A. , Davern, Michael J., "Measuring the Effects of Business Intelligence Systems: The Relationship Between Business Process and Organizational Performance," International Journal of Accounting Information Systems, vol. 9, pp. 135-153, 2008.
[26] N. McBride, "The rise and fall of an executive information system: a case study," Information Systems Journal, vol. 7, pp. 277-287, 1997.
[27] P. E. Connor, "Total Quality Management: A Selective Commentary on with Special Reference to its Downside," Public Administration Review, vol. 57, pp. 501-509, 1997.
[28] J. Perry, "CMA Management," Excellence throught Quality, pp. 26-29, 2005.

165
[29] A. Naidu, "Factors affecting patient satisfaction and healthcare quality," International Journal of Health Care Quality Assurance, vol. 22, pp. 266-381, 2009.
[30] M. W. Chiasson, Davidson, Elizabeth, "Pushing the contextual envelope: developing and diffusing IS theory for health information systems research," Information and Organization, vol. 14, pp. 155–188, 2004.
[31] R. Marshall, "SAP Business Intelligence Becomes More “Google-like”," in Incisive Media Limited. Haymarket, London, 2009.
[32] M. Wade, Hulland, John, "The Resource-Based View and Information Systems Research: Review, Extension, and Suggestions for Future Research," MIS Quarterly, vol. 28, pp. 107-142, 2004.
[33] T. H. Davenport, Harris, Jeanne G., Competing on Analytics. Boston: Harvard Business School Publishing Corporation, 2007.
[34] D. Leidner, Elam, Joyce, "Executive Information Systems: Their Impact on Executive Decision Making," Journal of Management Information Systems, vol. 101, pp. 139-155, 1993.
[35] R. K. Rainer, Watson, Hugh, "The Keys to Executive Information System Success," Journal of Management Information Systems, vol. 12, pp. 83-98, 1995.
[36] S. Williams, Williams, Nancy, The Profit Impact of Business Intelligence, 2007. [37] J. Mundy, Thornthwaite, Warren, Kimball, Ralph, The Microsoft Data Warehouse
Toolkit, 2005. [38] G. K. Saha, "Business Intelligence Computing Issues," ACM Ubiquity, vol. 8,
2007. [39] L. T. Moss, Atre, Shaku, Business Intelligence Roadmap: Pearson Education,
2003. [40] R. T. Herschel, Jones, Nory E., "Knowledge Management and Business
Intelligence: the Importance of Integration," Journal of Knowledge Management, vol. 9, pp. 45-55, 2005.
[41] SYBASE, "Specialty analytics servers:Enabling decision-making @ the speed of business," in p e e r 2 p e e r, 2010.
[42] P. Ussahawanitchakit, "Effects of Organizational Learning Culture on Service Quality and Performance of Thai Accounting Firms," International Journal of Business Research, vol. 8, pp. 202-211, 2008.
[43] J. M. Spector, Davidsen, Pal I., "How can organizational learning be modeled and measured?," Evaluation and Program Planning, pp. 63–69, 2009.
[44] R. E. Daft, Weick, Karl E., "Toward a Model of Organizations as Interpretation Systems," Academy of Management Review, vol. 9, pp. 284-295, 1984.
[45] C. Chan, Lim, Lynn, Keasberry, Siew Kuan, "Examining the linkages between team learning behaviors and team performance," The Learning Organization, vol. 10, pp. 228-236, 2003.
[46] H. H. Chang, "Critical Factors and Benefits in the Implementation of Customer Relationship Management," Total Quality Management, vol. 18, pp. 483-508, 2007.
[47] B. E. Barnes, "Evaluation of Learning in Health Care Organizations," The Journal of Continuing Education in the Health Professions, vol. 19, pp. 227-233, 1999.

166
[48] D. A. Garvin, "Building a Learning Organization," Harvard Business Review, pp. 78-91, 1993.
[49] W. H. DeLone, McLean, Ephraim R., "The DeLone and McLean Model of Information Systems Success: A Ten-Year Update," Journal of Management Information Systems, vol. 19, pp. 9-30, 2003.
[50] J. M. Woodside, "EDI and ERP: A Real-Time Framework for HealthCare Data Exchange," Journal of Medical Systems, vol. 31, pp. 178-184, 2007.
[51] WPC, "Health Care Services Review - Request for Review and Response," 2000. [52] D. W. Bates, "The quality case for information technology in healthcare," BMC
Medical Informatics and Decision Making, vol. 2, 2002. [53] J. M. Woodside, "Economic Externalities of Health Information Technology,"
Journal of Healthcare Information Management, vol. 21, pp. 25-31, 2007. [54] L. M. Prevedello, Andriole, Katherine P. , Khorasani, Ramin, "Business
Intelligence Tools and Performance Improvement in Your Practice," Bits and Bytes, pp. 1210-1211, 2008.
[55] C. Pyper, Amery, Justin, Watson, Marion, Crook, Claire, Thomas, Ben, "Patient's access to their online electronic health records," Journal of Telemedicine and Telecare, vol. 8, pp. 103-105, 2002.
[56] G. Galdabini, "UnitedHealthcare abolishes prior authorization, relies on data analysis," in Managed Care Outlook, vol. 12, 1999.
[57] G. Carneal, Gervais, Mary E., "Linking the Power of Information Technology and Case Management Interventions: An Assessment of Recent Medical-Management Trends," Case Manager, pp. 38-44, 2006.
[58] T. Conti, "A road map through the fog of quality and organizational assessments," Total Quality Management, vol. 13, pp. 1057-1068, 2002.
[59] V. K. Gupta, Sagar, R., "Total quality control using PCs in an engineering company," International Journal of Production Research, vol. 31, pp. 161-172, 1993.
[60] S. M. Lee, Rho, B.H., Lee, S.G., "Impact of Malcolm Batdrige National Quality Award Criteria on organizational quality performance," International Journal of Production Research, vol. 41, pp. 2003-2020, 2003.
[61] C. A. Rodrigues, "The Quality Organization: A Conceptual Framework," Total Quality Management, vol. 18, pp. 697–713, 2007.
[62] M. Van Marrewijk, Wuisman, Iris, De Cleyn, Timmers, Joanne, Panapanaan, Virgilio, Linnanen, Lassi, "A Phase-wise Development Approach to Business Excellence: Towards an Innovative, Stakeholder-oriented Assessment Tool for Organizational Excellence and CSR," Journal of Business Ethics, vol. 55, pp. 83-98, 2004.
[63] J. Brady, Ho, Karen, Kelley, Edward, Clancy, Carolyn M, "AHRQs National Healthcare Quality and Disparities Reports: An Ever-Expanding Road Map for Improvement," Health Services Research, vol. 42, pp. 11-21, 2007.
[64] J. C. Niland, Rouse, Layla, Stahl, Douglas C., "An Informatics Blueprint for Healthcare Quality Information Systems," Journal of the American Medical Informatics Association, vol. 13, pp. 402– 417, 2006.
167
[65] M. A. Badri, Taher Attia, Samaai, Ustadi, Abdulla M., "Testing not-so-obvious models of healthcare quality," International Journal of Health Care Quality Assurance, vol. 21, pp. 159-174, 2008.
[66] E. Dash, "Ailing Banks Favor Salaries Over Shareholders," in New York Times, 2010.
[67] R. W. Y. Yee, Yeung, Andy C.L., Cheng, T.C. Edwin, "The impact of employee satisfaction on quality and profitability in high-contact service industries," Journal of Operations Management, vol. 26, pp. 651–668, 2008.
[68] T. F. Gattiker, Goodhue, Dale L., "Understanding the local-level costs and benefits of ERP through organizational information processing theory," Information & Management, vol. 41, pp. 431–443, 2004.
[69] G. Premkumar, Ramamurthy, K., Saunders, Carol S., "Information Processing View of Organizations: An Exploratory Examination of Fit in the Context of Interorganizational Relationships," Journal of Management Information Systems, vol. 22, pp. 257-294, 2005.
[70] M. Alavi, Leidner, Dorothy E., "Knowledge Management," MIS Quarterly, vol. 25, pp. 107-136, 2001.
[71] K. Linderman, Schroeder, Roger G., Zaheer, Srilata, Liedtke, Charles, Choo, Adrian S., "Integrating quality management practices with knowledge creation processes," Journal of Operations Management, vol. 22, pp. 589–607, 2004.
[72] P. A. Pavlou, Housel, Thomas J., Rodgers, Waymond, Jansen, Erik, "Measuring the Return on Information Technology: A Knowledge-Based Approach for Revenue Allocation at the Process and Firm Level," Journal of the Association for Information Systems, vol. 6, pp. 199-226, 2005.
[73] URAC, "Trends and Practices in Medical Management: 2005 Industry Profile," Vienna 2005.
[74] W. H. DeLone, McLean, Ephraim R., "Information Systems Success: The Quest for the Dependent Variable," Information Systems Research 3 : I, vol. 3, pp. 60-93, 1992.
[75] J. Ruiz-Mercader, Merono-Cerdan, Angel Luis, Sabater-Sanchez, Ramon, "Information technology and learning: Their relationship and impact on organisational performance in small businesses," International Journal of Information Management, vol. 26, pp. 16–29, 2006.
[76] H. Yu, Fang, Liluo, Ling, Wenquan, "An empirical study on the construct and effective mechanism of organizational learning," Front. Bus. Res. China, vol. 3, pp. 242–270, 2009.
[77] D. H. Kim, "The Link Between Individual and Organizational Learning," Sloan Management Review, pp. 37-50, 1993.
[78] J. E. Bailey, Pearson, Sammy W., "Development of a Tool for Measuring and Analyzing Computer User Satisfaction," Management Science, vol. 29, pp. 530-545, 1983.
[79] W. R. King, "Strategies for Creating a Learning Organization," Information Systems Management, pp. 12-20, 2001.
[80] H. C. Lucas, Nielson, Norman R., "The Impact of the Mode of Information Presentation on Learning and Performance," Management Science, vol. 26, pp. 982-993, 1980.

168
[81] J. Q. Chen, Lee, Ted E., Zhang, Ruidong, Zhang, Yue J., "System Requirements for Organizational Learning," Communications of the ACM, vol. 46, pp. 73-78, 2003.
[82] R. L. F. Ackoff, "Towards a Behavioral Theory of Communication," Management Science, vol. 4, pp. 218-234, 1957.
[83] T. J. Mock, "Concepts of Information Value and Accounting," The Accounting Review, pp. 218-234, 1971.
[84] G. Lamberta, Ouedraogo, Noufou, "Empirical investigation of ISO 9001 quality management systems’ impact on organisational learning and process performances," Total Quality Management, vol. 19, pp. 1071–1085, 2008.
[85] B. D. Janz, Prasarnphanich, Pattarawan, "Understanding the Antecedents of Effective Knowledge Management: The Importance of a Knowledge-Centered Culture," Decision Sciences, vol. 34, pp. 351-384, 2003.
[86] M. E. Porter, Millar, Victor E., "How Information Gives You a Competitive Advantage," Harvard Business Review, pp. 149-160, 1985.
[87] L. Ling-yee, "The Effects of Relationship Governance Mechanisms on Relationship Performance: How Do Relationship Learning Processes Matter?," Journal of Marketing Channels, vol. 14, pp. 5-30, 2007.
[88] L. Dube, Pare, Guy, "Rigor In Information Systems Positivist Case Research: Current Practices, Trends, and Recommendations," MIS Quarterly, vol. 27, pp. 597-635, 2003.
[89] G. C. Moore, Benbasat, Izak, "Development of an Instrument to Measure the Perceptions of Adopting an Information Technology Innovation," Information Systems Research, vol. 2, pp. 192-222, 1991.
[90] K. M. Eisenhardt, "Building Theories from Case Study Research," Academy of Management Review, vol. 14, pp. 532-550, 1989.
[91] J. H. Fleming, Coffman, Curt, Harter James K., "Manage Your Human Sigma," Harvard Business Review, pp. 107-114, 2005.
[92] T. A. May, "Where has IT's Passion Gone?," in CIO, 2010. [93] K. Bauer, "The Power of Metrics," DM Review, pp. 64, 2005. [94] C. G. Chi, Gursoy, Dogan, "Employee satisfaction, customer satisfaction, and
financial performance: An empirical examination," International Journal of Hospitality Management, vol. 28, pp. 245–253, 2009.
[95] S. F. Jencks, Huff, Edwin D., Cuerdon, Timothy, "Change in the Quality of Care Delivered to Medicare Beneficiaries, 1998-1999 to 2000-2001," American Health Quality Association, 2003.
[96] G. D. Garson, "Partial Least Squares Regression (PLS)," N. C. S. University, Ed., 2010.
[97] L. Hatcher, A Step-by-Step Approach to Using SAS for Factor Analysis and Structural Equation Modeling. Cary, 1994.
[98] F. Faul, Erdfelder, Edgar, Lang, Albert-Georg, Buchner, Axel, "G*Power 3: A flexible statistical power analysis program for the social, behavioral, and biomedical sciences," Behavior Research Methods, vol. 39, pp. 175-191, 2007.
[99] J. Cohen, Statistical power analysis for the behavioral sciences. Hillsdale, NJ: Erlbaum, 1998.
[100] C. M. Ringle, Wende, S., Will, S., "SmartPLS 2.0 (M3) Beta." Hamburg, 2005.
169
[101] T. D. Jick, "Mixing Qualitative and Quantitative Methods: Triangulation in Action," Administrative Science Quarterly, vol. 24, pp. 602-611, 1979.
[102] R. M. Fulmer, Gibbs, Philip, Keys, J. Bernard, "The Second Generation Learning Organiziations," Organizational Dynamics, pp. 7-20, 1998.
[103] P. M. Senge, The Fifth Discipline: Doubleday, 2006. [104] Y. B. Choi, Capitan, Kathleen E., Krause, Joshua S., Streeper, Meredith M.,
"Challenges Associated with Privacy in Health Care Industry: Implementation of HIPAA and the Security Rules," Journal of Medical Systems, vol. 30, pp. 57-64, 2006.
[105] T. R. Bhatti, "Critical Success Factors for the Implementation of Enterprise Resource Planning (ERP): Empirical Validation," The Second International Conference on Innovation in Information Technology, 2005.
[106] D. Arnott, "Success Factors for Data Warehouse and Business Intelligence Systems," Australasian Conference on Information Systems, pp. 55-65, 2008.
[107] Acxiom, "Measuring Return on Business Intelligence Investment," 2008. [108] SAS, "Business Intelligence Competency Center," 2010. [109] Cognos, "Building a Business Intelligence Competency Center," 2008. [110] J. Oleson, "Microsoft Governance Plan," 2008. [111] D. R. Cooper, Schindler, Pamela S., Business Research Methods. New York,
2006. [112] H. Demirkan, Kauffman, Robert J., Vayghan, Jamshid A., Fill, Hans-Georg,
Karagiannis, Dimitris, Maglio, Paul P., "Service-oriented technology and management: Perspectives on research and practice for the coming decade," Electronic Commerce Research and Applications, vol. 7, pp. 356–376, 2008.
[113] C. Kanaracus, "SaaS BI Will Be Big in 2010," in CIO, 2010. [114] N. Szemraj, "HHS announces $60M Program to Fund Strategic Health IT
Advanced Research Projects," 2009. [115] C. Nicholls, "BI 2.0: The Next Generation," in Information Management
Magazine, 2006. [116] N. Raden, "Business Intelligence 2.0: Simpler, More Accessible, Inevitable," in
Intelligent Enterprise, 2007. [117] A. Kambil, "A head in the clouds," Journal of Business Strategy, vol. 30, pp. 58-
59, 2009. [118] C. M. Saracco, Labrie, Jacques, Brodsky, Stephen, "Using Service Data Objects
with Enterprise Information Integration technology," 2004. [119] J. Taylor, "Enterprise Information Integration: A New Definition Thoughts from
the Integration Consortium," in Information Management Online, 2004. [120] A. Y. Halevy, Ashishy, Naveen, Bittonz, Dina, Carey, Michael, Draper, Denise,
Pollock, Jeff, Rosenthal, Arnon, Sikkay, Vishal, "Enterprise Information Integration: Successes, Challenges and Controversies," presented at SIGACMSIGMOD, Baltimore, Maryland, 2005.
[121] N. Raden, "Start Making Sense: Get From Data To Semantic Integration," in Intelligent Enterprise, 2005.
[122] K. M. Fickenscher, "The New Frontier of Data Mining," Heatlh Management Technology, 2005.

170
[123] Y. M. Chae, Kim, Hye S., Tark, Kwan C., Park, Hyun J., Ho, Seung H., "Analysis of healthcare quality indicator using data mining and decision support system," Expert Systems with Applications, vol. 24, pp. 167–172, 2003.
[124] R. B. Cumming, Knutson, David, Cameron, Brian A., Derrick, Brian, "A Comparative Analysis of Claims-based Methods of Health Risk Assessment for Commercial Populations," Society of Actuaries, Minneapolis 2002.
[125] T. S. Rector, Wickstrom, Steven L., Shah, Mona , Thomas Greeenlee, N., Rheault, Paula, Rogowski, Jeannette, Freedman, Vicki, Adams, John, Escarce, Jose J., "Specificity and Sensitivity of Claims-Based Algorithms for Identifying Members of Medicare Choice Health Plans That Have Chronic Medical Conditions," Health Services Research, vol. 39, pp. 1839 - 1861, 2004.
[126] F.-M. Liou, Tang, Ying-Chan, Chen, Jean-Yi, "Detecting hospital fraud and claim abuse through diabetic outpatient services," Health Care Manage Sci, vol. 11, pp. 353–358, 2008.
[127] W.-S. Yang, Hwang, San-Yih, "A process-mining framework for the detection of healthcare fraud and abuse," Expert Systems with Applications, vol. 31, pp. 56-68, 2006.
[128] S. Viaenea, Dedene, G., Derrig, R.A., "Auto claim fraud detection using Bayesian learning neural networks," Expert Systems with Applications, vol. 29, pp. 653–666, 2005.
[129] D. Moeller, "Manage medical advances with automated prior authorization," MANACED HEALTHCARE EXECUTIVE, pp. 26-27, 2009.
[130] S. Zhang, Goddard, Steve, "A software architecture and framework for Web-based distributed Decision Support Systems," Decision Support Systems, vol. 43, pp. 1133– 1150, 2007.
[131] Workgroup for Electronic Data Interchange, "National Electronic Data Interchange Transaction Set Implementation Gide," 2007.

171
APPENDIX Measurement Tool The following survey is part of our ongoing effort to evaluate and improve the effectiveness of Business Intelligence Systems (BIS) across the organization. All responses will be aggregated and anonymous.
Individual:
Position/Level Executive Vice President Director Manager Supervisor Professional Company tenure < 2 years 2-3 years 4-5 years 6-7 years 7-8 years 8-9 years > 10 years Functional Area Sales Marketing

172
Facilities Finance Human Resources Information Technology Clinical Business Operations Other Age* <25 25 - 34 35 - 44 45 - 54 55 - 64 > 64 Gender* Male Female
Stro
ngly
Dis
agre
e
Dis
agre
e
Som
ewha
t Dis
agre
e
Nei
ther
agr
ee n
or d
isag
ree
Som
ewha
t agr
ee
Agr
ee
Stro
ngly
Agr
ee
#
Please select your level of agreement for each of the following statements below in terms of the Business Intelligence System (BIS), with 1 being least favorable agreement, and 7 the most favorable agreement. 1 2 3 4 5 6 7
Supporting Works
1 I have knowledge of technical systems
Vandenbosch and Higgens (1995); Pijpers (2001)
2* I am technically competent
Vandenbosch and Higgens (1995); Pijpers (2001)
3* I have computer use knowledge
Vandenbosch and Higgens (1995); Pijpers (2001)
4 I learn new applications quickly
Vandenbosch and Higgens (1995); Pijpers (2001)
5 The BIS is easy to use Vandenbosch and Higgens (1995)
6* The BIS can be adapted to meet a variety of uses Wixom (2005)
7** The BIS is versatile in addressing needs as Wixom (2005)
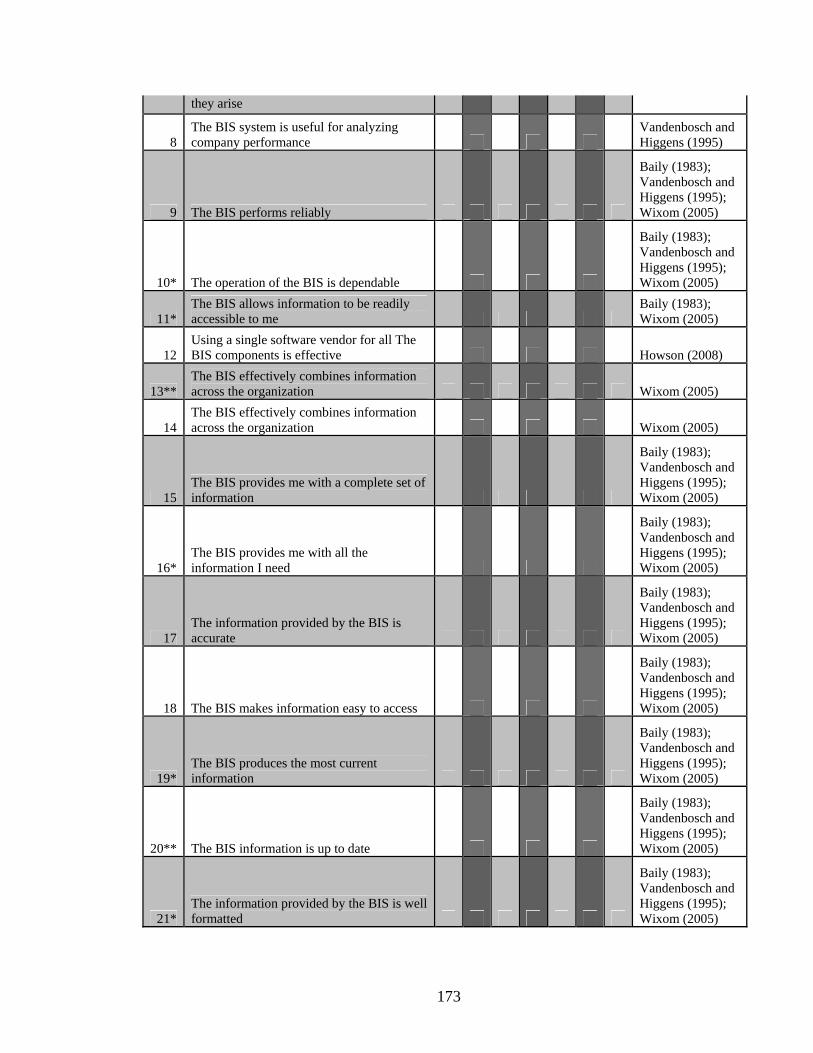
173
they arise
8 The BIS system is useful for analyzing company performance
Vandenbosch and Higgens (1995)
9 The BIS performs reliably
Baily (1983); Vandenbosch and Higgens (1995); Wixom (2005)
10* The operation of the BIS is dependable
Baily (1983); Vandenbosch and Higgens (1995); Wixom (2005)
11* The BIS allows information to be readily accessible to me
Baily (1983); Wixom (2005)
12 Using a single software vendor for all The BIS components is effective Howson (2008)
13** The BIS effectively combines information across the organization Wixom (2005)
14 The BIS effectively combines information across the organization Wixom (2005)
15 The BIS provides me with a complete set of information
Baily (1983); Vandenbosch and Higgens (1995); Wixom (2005)
16* The BIS provides me with all the information I need
Baily (1983); Vandenbosch and Higgens (1995); Wixom (2005)
17 The information provided by the BIS is accurate
Baily (1983); Vandenbosch and Higgens (1995); Wixom (2005)
18 The BIS makes information easy to access
Baily (1983); Vandenbosch and Higgens (1995); Wixom (2005)
19* The BIS produces the most current information
Baily (1983); Vandenbosch and Higgens (1995); Wixom (2005)
20** The BIS information is up to date
Baily (1983); Vandenbosch and Higgens (1995); Wixom (2005)
21* The information provided by the BIS is well formatted
Baily (1983); Vandenbosch and Higgens (1995); Wixom (2005)

174
22 The information provided by the BIS is clearly presented on the screen
Baily (1983); Vandenbosch and Higgens (1995); Wixom (2005)
23 The BIS supports organizational communication
Kim (1993); Spector (2006); Chang (2007)
24 The BIS supports knowledge sharing across teams
Kim (1993); Spector (2006); Chang (2007)
25 The BIS improves my insights Vandenbosch (1995)
26 The BIS improves department creativity Vandenbosch (1995)
27 The BIS is useful for testing business assumptions
Vandenbosch (1995)
28 The BIS improves my understanding of the business
Vandenbosch (1995)
29 The BIS is useful for staying close to the business
Vandenbosch (1995)
30 The BIS increases department business focus
Vandenbosch (1995)
31 The BIS allows the organization to keep up with the competition
Vandenbosch (1995)
32 The BIS allows the organization to surpass the competition
Vandenbosch (1995)
33* The BIS improves the ability to retain customers
Bernhardt (2000); Chang (2007); Chi (2009)
34* The BIS improves the ability to attract new customers
Bernhardt (2000); Chang (2007); Chi (2009)
35* The BIS contributes to improved stakeholder satisfaction
Bernhardt (2000); Chang (2007); Chi (2009)
36** The BIS supports increases in productivity Lopez (2004)
37** The BIS contributes to increases in sales Lopez (2004)
38 The BIS IS employees give prompt service Delone and Mclean (2002)
39 The BIS IS employees have the knowledge to do their job well
Delone and Mclean (2002)
40 The BIS IS employees have the users' best interests at heart
Delone and Mclean (2002)
41 The BIS software is up to date Delone and Mclean (2002)
42 The BIS IS support is dependable Delone and Mclean (2002)
43 The organization is committed to learning Chan (2003), Chang (2007)

175
44 The organization shares a common vision
Kim (1993); Spector (2006); Chang (2007)
45 Innovation is an important aspect of the corporate culture
Chan (2003), Chang (2007)
46 The BIS contributes to knowledge sharing across the organization
Kim (1993); Spector (2006); Chang (2007)
47 Historical information is readily accessibly through the BIS
Chan (2003), Chang (2007)
48 The BIS enables team collaboration Chan (2003), Chang (2007)
49 The BIS supports improved shareholder satisfaction
Bernhardt (2000); Chi (2009)
50 The BIS supports to improved employee satisfaction
Davis and Davis (1990); Janz (2003); Yu (2009); Bernhardt (2000); Chi (2009)
51 The BIS supports to improved customer satisfaction
Bernhardt (2000); Chang (2007); Chi (2009)
52 The BIS supports quality of reviews
Bernhardt (2000); Chang (2007); Chi (2009)
Survey Instrument Key: *Item was removed after pre-tests **Item was updated after pre-tests User Characteristics -Individual introduction questions 1-3 -Survey questions 1-4 System Quality -Survey questions 5-14 Information Quality -Survey questions 15-22 Learning -Survey questions 23-30, 43-48 Mental Model Building -Survey questions 25-27

176
Mental Model Maintenance -Survey questions 28-30 Organizational Learning -Survey questions 23-24, 43-48 Competitive Performance -Survey questions 31-37 Service Quality -Survey questions 38-42 Quality Organization -Survey questions 49-52

177
Interview Questions
• Information Quality o What information is most commonly used to make decisions? o What is the major source of pain / limitation? o What are the sources / systems of information? o What information needs to be integrated for reporting? o What information can be on it’s own? o How often does data needed to be updated (real-time, daily)? o What system data is needed? o How long does data need to be retained? Can it be archived? o Are legacy data systems still accessed and needed? o From what locations does data need to be accessed? o What security should be in place? Who needs access? o How large is the data (columns/records)? o What are the expected data growth rates? o Is there business/technical metadata available? o Are business rules available? o Who is the owner of the data? o Are there multiple potential sources for the same data? o What metadata information is needed? o What metadata security/access is needed? o What is the cause of data inconsistencies? How can we correct? o What is the result of data inconsistencies? o What other data quality issues exist? Are these documented? o What is the measure for clean data? What is the acceptable margin? o How do you measure information quality?
• System Quality o What tools are used to access that data? o What reports are currently used? Examples of each? Priority of each? o What new reports are needed? Priority? o What questions are unable to be answered today? o What routine analyses are performed? o Who are the reports delivered to? Most frequent? o How the reports delivered (method/format)? o What are the most common fields used? o How many different fields/dimensions are needed? o How often are field/dimensions added/updated? o What rules are applied to the data? o What formatting is applied to the data? o Are the reports easy to reconcile? o What decisions are made from the reports? o Who are the reports delivered to? o How are reports distributed? o What is the level of detail required? Summary / Detail?

178
o What are the common dimensions that are summarized? o Will detail level drill-downs be needed? o What types of summary/aggregation is needed? o Are reports standard or ad-hoc in nature? o How should the reports be accessed (web, desktop)? o What are the area success metrics? How should these be reported? o Describe the ad-hoc request process. What is the typical timeline? o Required performance (seconds, minutes, hours)? o Required availability of system (M-F, M-S, 8am-8pm, etc.)? o Required recoverability? o Required audit trail? o Required security? o Required currency? o How do you measure system quality?
• Service Quality o What is the technical knowledge of the support representatives? o How long does it usually take to resolve incidents? o Do the support representatives handle themselves professionally? o How are status updates sent/received? o Do the solutions implemented provide an effective result?
• User Characteristics o Who are the users (running reports, viewing reports)? o How many users (running reports, viewing reports)? o What is the level of technical literacy? o What is the position of the users? o Training needed?
• Use o How often will they access the system? o How often are reports needed (daily, weekly, monthly, etc.)? o How often would databases be accessed?
• Learning o How does the organization share a common vision? o What is the organizational commitment to learning? o How open minded is the organization? o Does everyone in the organization participate in the learning processes?
• Mental-model building o Requirements for testing new business models? o How often would system be used for developing new products? o Requirements for generating new information/trends? o Requirements for data mining or uncovering new relationships? o What opportunities exist to dramatically impact your business based on
improved access to information? o How do you tell when your organization might be headed for trouble?
• Mental-model maintenance o Capability to track ongoing metrics? o Requirements for performance management?

179
o What should happen when metrics do not meet targets? o How can users stay close to operational results? o How often do you measure success? How often would you like to
measure? o How do you spot exceptions in your business? o How would you like to find exceptions?
• Quality Organization o Describe the mission statement? o What does quality mean in the organization? o How do you measure quality? o How do you measure stakeholder satisfaction? o How do you achieve quality?
• Competitive Performance o Describe the vision statement? o What would you pay for receiving cleaner data? o Getting reports earlier? o Access to information as needed? o What competitive advantages would be gained? o Would revenue or profit increases be expected?
Construct Development & Definitions Item Dimensions Definition Supporting Works
Self-Efficacy Belief in one's technical ability Vandenbosch and Higgens (1995); Pijpers (2001)
Mental Model Maintenance
New information is incorporated into existing shared mental models
Vandenbosch and Higgens (1995); Fulmer (1998); Chang (2007)
Indi
vidu
al L
earn
ing
Mental Model Maintenance
Shared mental models are modified based on new information
Vandenbosch and Higgens (1995); Fulmer (1998); Chang (2007)
Response Time Elapsed time for completion of user request
Baily (1983);Vandenbosch and Higgens (1995)
Ease of Use Ease of system interaction Vandenbosch and Higgens (1995)
Reliability Consistency, uptime
Baily (1983); Vandenbosch and Higgens (1995); Wixom (2005)
Accessibility Ability to utilize the system capabilities from various locations
Baily (1983); Wixom (2005)
Integration Ability to integrate with other systems Wixom (2005)
Syst
ems Q
ualit
y
Flexibility Ability to accommodate changes and new requirements Wixom (2005)
mat
ion
Qua
lity
Analysis Capability Ability to analyze information Vandenbosch and Higgens (1995)

180
Completeness/Specificity Comprehensiveness of the output
Baily (1983); Vandenbosch and Higgens (1995); Wixom (2005)
Accuracy Sufficiently correct for intended use
Baily (1983); Vandenbosch and Higgens (1995); Wixom (2005)
Currency/Timeliness Availability at time of need
Baily (1983); Vandenbosch and Higgens (1995); Wixom (2005)
Format/Interpretability Intuitive environment
Baily (1983); Vandenbosch and Higgens (1995); Wixom (2005)
Relevance Applicability to decision task Vandenbosch and Higgens (1995)
Assurance Knowledgeable IS employees Delone and Mclean (2002)
Empathy IS employees support end user interests Delone and Mclean (2002)
Responsiveness IS employees prompt service Delone and Mclean (2002) Serv
ice
Qua
lity
Reliability IS employees dependability Delone and Mclean (2002)
Organizational Mental Model Maintenance
New information is incorporated into existing shared mental models
Vandenbosch and Higgens (1995); Fulmer (1998); Chang (2007)
Organizational Mental Model Maintenance
Shared mental models are modified based on new information
Vandenbosch and Higgens (1995); Fulmer (1998); Chang (2007)
Commitment to learning Organizational learning is viewed as a core value
Chan (2003), Chang (2007)
Shared Visions Top management shares the organizational vision with employees.
Kim (1993); Spector (2006); Chang (2007) O
rgan
izat
iona
l Lea
rnin
g
Open-mindedness The organization goes beyond regular thinking
Chan (2003); Spector (2006); Chang (2007)
Employee Satisfaction Ability to meet employee expectations
Davis and Davis (1990); Janz (2003); Yu (2009); Bernhardt (2000); Chi (2009)
Customer Satisfaction Ability to meet customer expectations Bernhardt (2000); Chang (2007); Chi (2009)
Qua
lity
Org
aniz
atio
n
Shareholder Satisfaction Ability to meet shareholder expectations
Bernhardt (2000); Chi (2009)
Profit Sales less costs Lopez (2004)
Revenue Sales Lopez (2004)
Com
petit
ive
Perf
orm
ance
Competitive Perception Ability to retain customers, ability to capture additional customers
Vandenbosch and Higgens (1995)
Definition Authors

181
"BI is not a single product, nor a single technology, nor a single methodology. BI combines products, technologies, and methods to organize key information that management needs to improve profit and performance. Think of BI as business information and business analyses within the context of key business processes that lead to decision and actions that result in improved business performance."
Williams and Williams
"BI is a set of technologies and processes that allow people at all levels of an organization to access and analyze data." Howsen
"BI is fundamentally about providing business people with the information and tools they need to make both operational and strategic business decision." "BI system is the whole thing: source system extracts, ETL, dimensional database in both relational and OLAP, BI applications and an ad-hoc query tool, management tools, documentation, training, security, etc."
Mundy, Thornthwaite, and Kimball.
"BI is the conscious, methodical transformation of data from any and all data sources into new forms to provide information that is business-driven and results-oriented. It will often encompass a mixture of tools, databases, and vendors in order to deliver an infrastructure that not only will deliver the initial solution, but also will incorporate the ability to change with the business and current marketplace." Ranjan "Business Intelligence (BI) is a business management term that refers to applications and technologies used to gather, provide access to, and analyze data and information about their company operations.” Shah
BI is not a single product, application, program, user, area, or system, rather an all encompassing architecture of integrated systems and methods that provide all stakeholders with information for decision making and learning. Woodside BIS refers to applications and technologies used to gather, capture, access, consolidate, and analyze information to improve decision making. These systems capture important metrics on business operations, as well as providing a mechanism for improved decision making. At the various levels these information items may include documents, calendars, wikis, links, reports, dashboards, scorecards, search, databases, lists, user knowledge, and much more. For example, these technologies can help coordinate projects, calendars, schedules, discuss ideas, review documents, share information, keep in touch with others, utilize Key Performance Indicators (KPI) to gauge operational status, and generate reporting information on-demand. The BIS process is one that allows large amounts of disparate data to come together into a single repository and turn that data into meaningful information for decision support processes. BIS can include various forms of analysis, data mining, scorecards, dashboards, metrics, reporting, portals, data warehouse, OLAP, decision support, knowledge management, etc. This information is available to all levels of the organization and associated stakeholders, on-demand, and in an easy-to-use fashion.
Woodside
"The quality organization has implemented a set of interdependent behaviors aimed at satisfying its stakeholders." Rodrigues "A quality organization is one that approaches management based on value adding principles, like the principles of cooperation, teamwork, a focus on customers and employees, a focus on wellness in the workplace, and a focus on continuous learning and continuous improvement." Perry A quality organization is one which balances and maximizes the relationships between employee, customer, and shareholder expectations. A quality organization can be improved through organizational learning vis a vis BIS capabilities. Woodside

182
Analysis Methods
Analysis Methods Flowchart
Instrument Development
Model Analysis & Measurement Model Quality Model ResultsResearch Design
Data collection methods
Crafting Instruments and
Protocols
Research questions
Shaping Hypotheses
A priori specification of
constructs
pretest questions
Conduct survey
Scale type selection
Pretest survey
Measurement questions from prior literature
Instrument development
Measurement Model
Select multivariate analysis technique
Data triangulation
Manifest variables from prior literature
Field notes
Quotes
Select multivariate analysis technique
Interval Data
Composite Reliabilities
Standardization
Factor Variances
Minimum Values
Power Test
Variable Sig.
Reliability and Validity Tests and
Assumptions
StructuralModel
Comparison with literature
Reaching Closure
Path Significance
Relationships