business development ompanies presented by covestor · 2016-08-26 · the of bdcs (business...
TRANSCRIPT

THE OF BDCS(BUSINESS DEVELOPMENT COMPANIES)
PRESENTED BY COVESTOR
John Cole Scott, CFSChief Investment Officer
Closed-End Fund Advisors, Inc.Covestor Portfolio Manager
Closed-End Fund Advisors is a Registered Investment Advisory Firm Specializing in Closed-End Fund & BDC Research, Trading and Management Founded in 1989

Important: The information should not be considered an offer, or solicitation, to deal in any of thementioned funds or sectors. The information is provided on a general basis for information purposes only,and is not to be relied on as advice, as it does not take into account the investment objectives, financialsituation or particular needs of any specific investor.
Any research or analysis used to derive, or in relation to, the information herein has been procured byClosed-End Fund Advisors (“CEFA”) for its own use, and may have been acted on for its own purpose. Theinformation herein, including any opinions or forecasts has been obtained from or is based on sourcesbelieved by CEFA to be reliable, but CEFA does not warrant the accuracy, adequacy or completeness of thesame, and expressly disclaims liability for any errors or omissions. As such, any person acting upon or inreliance of these materials does so entirely at his or her own risk. Any projections or other forward-lookingstatements regarding future events or performance of countries, sectors, markets or companies are notnecessarily indicative of, and may differ from, actual events or results. No warranty whatsoever is givenand no liability whatsoever is accepted by CEFA or its affiliates, for any loss, arising directly or indirectly, asa result of any action or omission made in reliance of any information, opinion or projection made in thispresentation.
The information herein shall not be disclosed, used or disseminated, in whole or part, and shall not bereproduced, copied or made available to others without CEFA expressed written permission. CEFA reservesthe right to make changes and corrections to the information, including any opinions or forecastsexpressed herein at any time, without notice. Data comes from our CEFData.com (formerly CEF Universe)service dated June 17, 2016 unless otherwise noted.
2www.CEFadvisors.com
Disclosures

What is a Business Development Company (BDC) ?
o Tax-advantaged and earnings are passed through to investors in the form of dividends and distributions similar to REITs and MLPs)
o Limited to 200% asset coverage (total assets / total debt) or “one turn” of leverage, excluding SBIC facilities.
o BDCs have gained interest (since the Financial Crisis because traditional banks have generally reduced their focus on small business lending.
Source: Sutherland Asbill & Brennan, Triangle CapitalData from CEFdata.com June 24, 2016
www.CEFadvisors.com 3
o Created by Congress in 1980 to provide an opportunity for individual non-accredited investors to participate in private investments
o Publicly traded closed-end funds that provide small, growing companies access to capital
o Domestically focused and required to offer portfolio companies ‘managerial assistance’.

www.CEFadvisors.com 4
Retail and
Institutional
Investors
Investment
Dollars
Dividends to
Investors
Debt
Investments(Primarily)
Interest and
Dividends
BDCs
Small and
Middle-Market
Businesses
Shareholders
taxed on
dividends
No tax paid at
this entity
$ $
$ $
BDCs Provide Access to Private Debt Investments
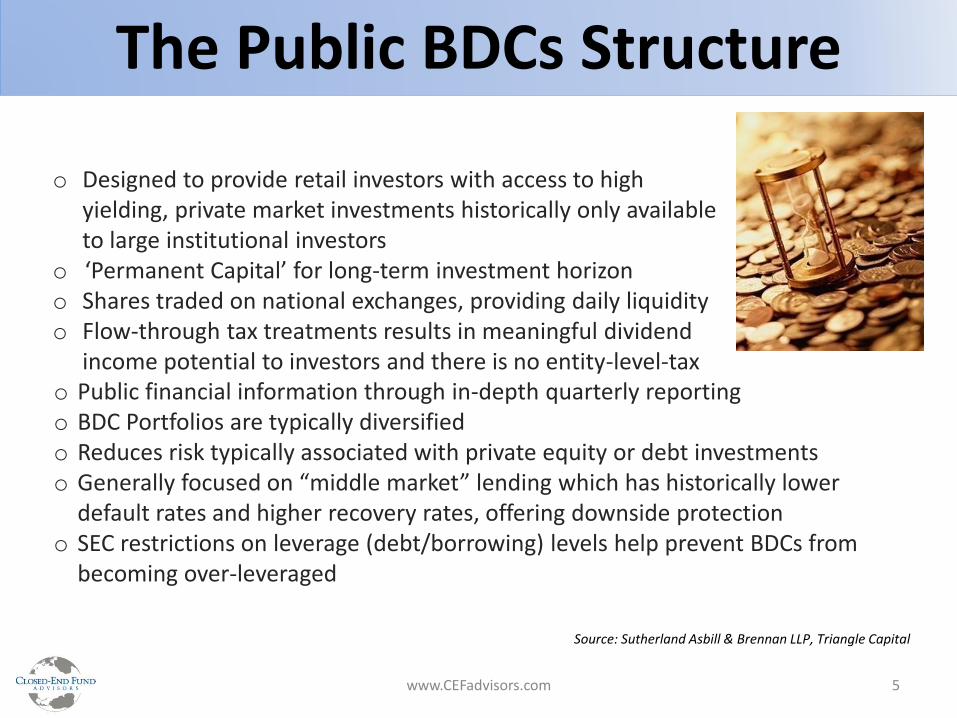
o Public financial information through in-depth quarterly reportingo BDC Portfolios are typically diversifiedo Reduces risk typically associated with private equity or debt investmentso Generally focused on “middle market” lending which has historically lower
default rates and higher recovery rates, offering downside protectiono SEC restrictions on leverage (debt/borrowing) levels help prevent BDCs from
becoming over-leveraged
www.CEFadvisors.com 5
o Designed to provide retail investors with access to high yielding, private market investments historically only available to large institutional investors
o ‘Permanent Capital’ for long-term investment horizono Shares traded on national exchanges, providing daily liquidityo Flow-through tax treatments results in meaningful dividend
income potential to investors and there is no entity-level-tax
The Public BDCs Structure
Source: Sutherland Asbill & Brennan LLP, Triangle Capital

www.CEFadvisors.com 6

7

8
9www.CEFadvisors.com
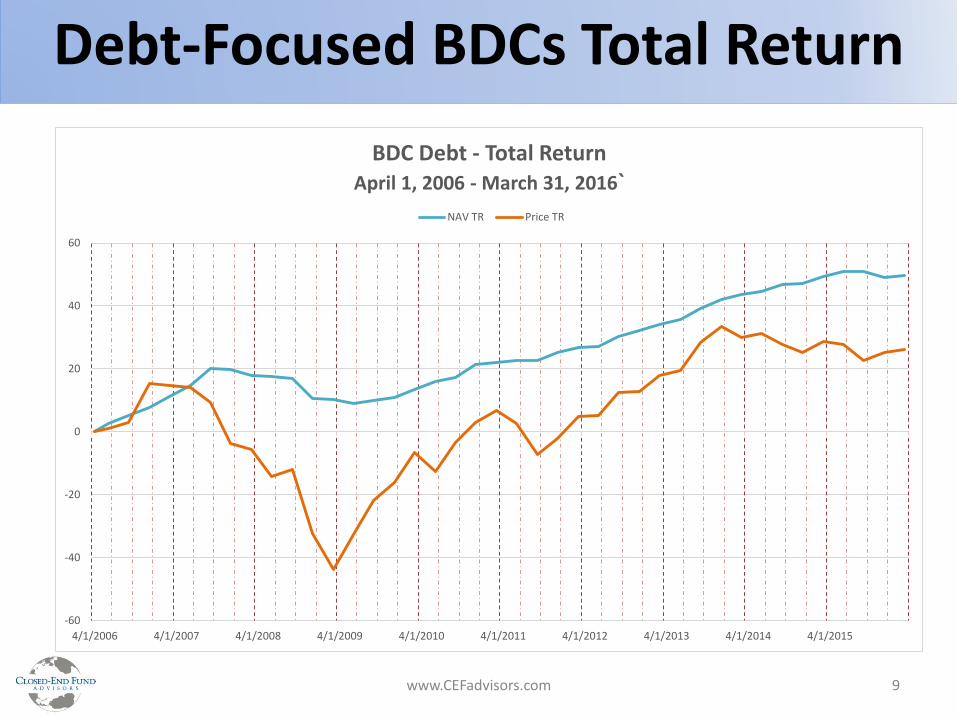
Debt-Focused BDCs Total Return
-60
-40
-20
0
20
40
60
4/1/2006 4/1/2007 4/1/2008 4/1/2009 4/1/2010 4/1/2011 4/1/2012 4/1/2013 4/1/2014 4/1/2015
BDC Debt - Total ReturnApril 1, 2006 - March 31, 2016`
NAV TR Price TR

10www.CEFadvisors.com
Debt-Focused BDCs Discount
-60
-50
-40
-30
-20
-10
0
10
20
30
40
3/1/2006 3/1/2007 3/1/2008 3/1/2009 3/1/2010 3/1/2011 3/1/2012 3/1/2013 3/1/2014 3/1/2015 3/1/2016
BDC Debt - Average Discount / PremiumApril 1, 2006 - March 31, 2016

11www.CEFadvisors.com
BDC Yield Comparison
BDC Data as of 6/24/2016, Index Data as of 3/31/2016MLP Index: Alerian MLP Index; REIT Index: Wilshire US REIT Index; Corporate Debt Index: S&P 500 Bond IndexUS High Yield Indices : BofA Merrill Lynch US High Yield (BB Rated, B Rated, CCC and Lower Rated )

12
1. Discount Direction: BDCs generally trade at prices in relationto the quarterly net asset value (NAV). NAVs are the ‘anchorpoint’ for BDC pricing. We seek BDCs where discounts canrecover or are sustainable vs. potential to widendramatically. Small premiums can be healthy for a BDC.
www.CEFadvisors.com
2. Dividend Sustainability: Research the reoccurring income produced by a BDC (Adj CoreNII coverage avg 105%*) as well as trends in the sector and the past policies of the BDC.Dividends are policies from the BoD are not promises like coupon payments on bonds orthe BDC loans themselves. Review Libor floors, and use of fixed vs. variable leverage.
3. NAV Total Return: Manager performance after costs is important as poor results oftenimpact the price investors use as the ‘anchor point’ for BDCs. This also helps confirmthat management can produce investment returns after their cost. BDC loan creation isnot typically a cheap and easy task, but shareholders need to know that managementcosts are in check with their results. Avg BDC NonLev Expense Ratio: 5.2%*
CEFA’s BDC ‘Trifecta’ AnalysisSuggested BDC Research Process
CEFA feels that getting any of these items wrong can negate good investment research
*Data as of 6/24/16 CEFdata.com

13
1. Traditional Leverage is capped at a 1:1 ratio2. SBIC Debentures (19 BDCs have them) through the
SBA offer cheap fixed cost leverage for additional investments
3. Fixed Leverage vs. Variable Leverage 4. Baby Bonds, Convertible Bonds, Institutional
Bonds, Credit Facilities, and Private Notes
www.CEFadvisors.com
Leverage Used by BDCs
• Average BDC leverage amount: 43.5% ($1.435 in Gross Exposure per NAV for each BDC)
• Average relative cost for all leverage: 3.78%• Average debt-to-equity ratio: 0.82 (regulatory
maximum is 1 not including a SBIC)
*Data as of 6/24/16 CEFdata.com

14
1. First Lien Loans: 54.8%2. Second Lien Loans: 19.5%3. Unsecured Loans: 11.7%4. Equity/Other: 14.0%
www.CEFadvisors.com
Types of Loans Held By BDCs
Avg. Portfolio Turnover: 23.4% Avg. Variable Loans: 76% / Fixed: 24% Libor Floors: 42% at 1.07% Avg. Level Avg. Loan Size: $10.7M 74% of Loans Under $25MM Average Maturity 4.1 with a range of 2 Years to 6 years Avg. No. of Loans: 108 from 94 Companies
15www.CEFadvisors.com
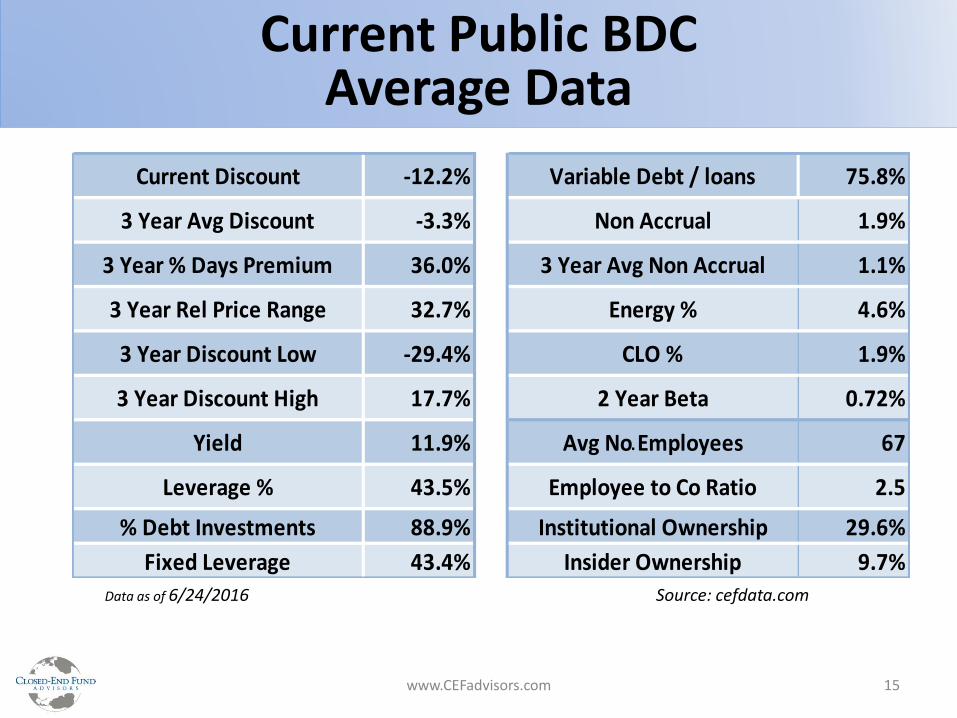
Current Public BDC Average Data
Data as of 6/24/2016 Source: cefdata.com
Current Discount -12.2% Variable Debt / loans 75.8%
3 Year Avg Discount -3.3% Non Accrual 1.9%
3 Year % Days Premium 36.0% 3 Year Avg Non Accrual 1.1%
3 Year Rel Price Range 32.7% Energy % 4.6%
3 Year Discount Low -29.4% CLO % 1.9%
3 Year Discount High 17.7% 2 Year Beta 0.72%
Yield 11.9% Avg No Employees 67
Leverage % 43.5% Employee to Co Ratio 2.5
% Debt Investments 88.9% Institutional Ownership 29.6%
Fixed Leverage 43.4% Insider Ownership 9.7%
.

How Have BDCs Faired in a Rising Rate Environment?
16

17
1. Poor Management and Credit Risk2. Discount Risk and Dividend Risk3. Poor Fee / Shareholder Alignment4. Uncertainty regarding the time period BDCs will hold
funds before they are invested5. Quarterly NAV, subjective fair value estimates
could take sudden and quick losses6. Potential illiquidity, wide bid/ask spread7. Market Prices can be volatile, especially during earnings season or on
headline risk and risk off trading8. Libor floors, variable leverage, spread widening9. Irrational trading behavior of retail shareholders
Given the complexity and high-risk nature of this product, it is important that clients fully understand the risks and the potential impact of
these products on their portfolios before investing.
www.CEFadvisors.com
Risks of Public BDC Investing

BDC Historical IPOs
18www.CEFadvisors.com
Source: SEC Filings, Press Releases
2015 2014 2013 2012 2011 2010 2009 2008 2007 2006
Number of IPOs
1 6 4 5 7 5 1 1 5 1
Average Assets
In $ millions$120 $575 $78 $96 $101 $98 $87 $141 $138 $203
Total New CEFIPO Assets in $
Billions$0.1 $3.5 $0.3 $0.5 $0.7 $0.5 $0.1 $0.1 $0.7 $0.2
10 Year Average: 3.6 Funds per year, $164M Ave Fund, $0.7 Billion Per Year

www.CEFadvisors.com 19
• BDC loans are typically variable in nature, offering a good chance to increase income when interest rates eventually rise
• BDCs are generally diversified by sectors, geography and most contain 50-150 separate loans in the portfolio
• Some BDCs may trade above NAV, providing extra potential up-side performance from current levels
Given the complexity and high-risk nature of this product, it is important that clients fully understand the risks and the potential impact of these
products on their portfolios before investing.
Full list of Public BDCs at www.BDCUniverse.net
• You can be selective with 40+ choices• Lack of recent IPOs can help improve
demand for shares of current BDCs• BDCs loans are typically secured which can
offer better downside protection when there is economic, sector or company level of risk
Opportunity for BDC Investing Today

20
John Cole Scott, CFS
EXPERIENCE
CIO of Registered Investment
Advisor Focused Exclusively on CEFs
and BDCs since 2001
EDUCATION
College of William & Mary
Bachelor of Science in Psychology
2000
John Cole Scott, CFS
Chief Investment Officer of Closed-End Fund Advisors
Mr. Scott has worked at Closed-End Fund Advisors since 2001. He sits onthe firm’s investment committee and holds the FINRA 66 License and theCertified Fund Specialist designation (CFS). He is a graduate of The Collegeof William and Mary and has been quoted and interviewed widely in thefinancial press and presented at conferences and for investment groups onmore than 40 occasions.
In 2008 John founded CEFA's Closed-End Fund Universe, a comprehensiveweekly data service covering 240+ data points for all US listed closed-endfunds and 210+ for BDCs. He also founded and manages The CEF Networkgroup on LinkedIn and is editor of the firm’s blog. John is a past boardmember of The Richmond Association for Business Economics (RABE), andserves on the Investment Committee for The New York State Society of TheCincinnati.
www.CEFadvisors.com
Speaker’s Biography
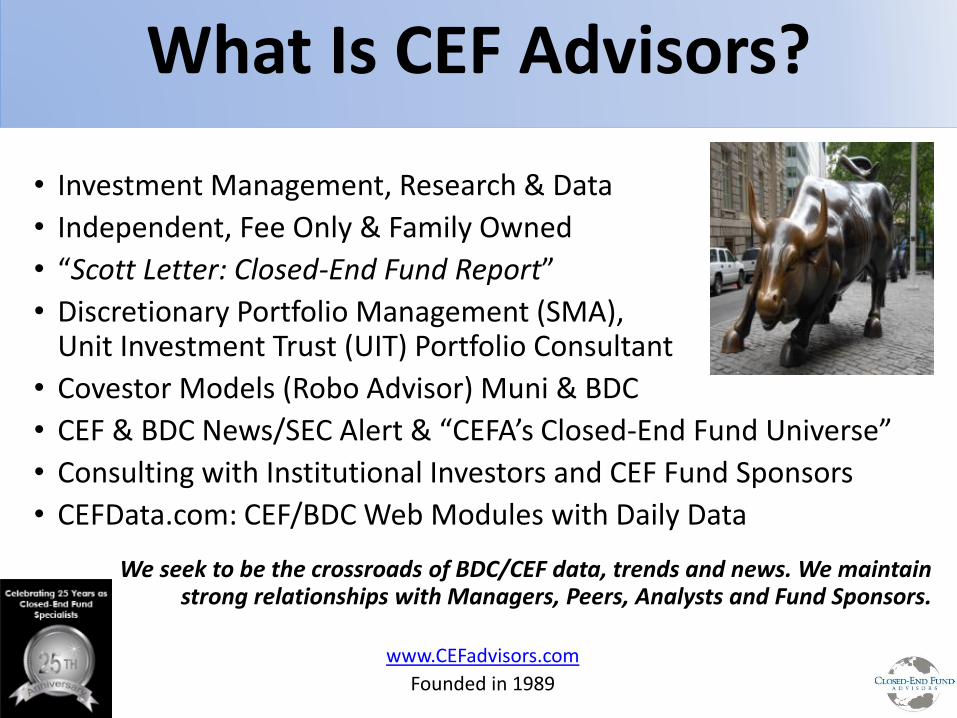
What Is CEF Advisors?
• Investment Management, Research & Data
• Independent, Fee Only & Family Owned
• “Scott Letter: Closed-End Fund Report”
• Discretionary Portfolio Management (SMA), Unit Investment Trust (UIT) Portfolio Consultant
• Covestor Models (Robo Advisor) Muni & BDC
• CEF & BDC News/SEC Alert & “CEFA’s Closed-End Fund Universe”
• Consulting with Institutional Investors and CEF Fund Sponsors
• CEFData.com: CEF/BDC Web Modules with Daily Data
We seek to be the crossroads of BDC/CEF data, trends and news. We maintain strong relationships with Managers, Peers, Analysts and Fund Sponsors.
www.CEFadvisors.com
Founded in 1989

Closed-End Fund Advisors, Inc7204 Glen Forest Drive, Suite #105
Richmond, Virginia 23226 U.S.A
(800) 356-3508 / (804) 288-2482www.CEFadvisors.com
Thank You For Attending
Questions?