business case of desktop virtualization
TRANSCRIPT

ABC Inc.
Desktop Virtualization
Md Yousup Faruqu
IT, Infrastructure and Operations
January, 2013

Background
A technology leader with 10+ years of hands-on
experience & commendable strengths in Microsoft,
VMware, Citrix platforms including Windows, Active
directory, Private Cloud, Server & Desktop
Virtualization, High availability, BYOD and
others. Faruqu holds several patents and industry
certifications, including MCSE Private Cloud, and
VMware Certified Professional (VCP) –Datacenter
Virtualization & Cloud, Citrix XenDesktop and XenApp,
Rackspace CloudU Certified Professional, ITIL, etc.
Contact
@yfaruqu
Md Yousup Faruqu
Meet the Presenters

AGENDA
Background & Virtual Desktop Infrastructure Overview
TCO Business Case for ABC Inc
Costing and Budget for Virtual Desktop Infrastructure
Recommendations
Executive Summary
Objectives
Implementation Roadmap

Executive Summary
Over the past years many organization have realized the benefits of server
virtualization. A favorite technology to dramatically compress server footprint
and lowering both capital and operational expenditures.
IT organizations today are looking for new ways to address their desktop
challenges (Quick provisioning, Windows 7 migration, Patching, Security).
More recently, desktop virtualization has emerged as a serious topic of
discussion. The concept of consolidating hundreds, or even thousands, of desktop
images onto a single server platform has great appeal to many organizations.
Gartner recently estimated that the number of virtualized desktops could grow
to 660 million by 2012. Some reasons for the mass appeal are the promise of:
simplified provisioning of desktops
centralized desktop management and support
streamlined new desktop OS upgrades
secure remote access and Disaster recovery
4
Background & Virtual Desktop
Infrastructure Overview

Desktop Infrastructure Challenges
Limited control of PCs
• Patch compliance
• Security
• Regulatory compliance
Management complexity
• Deployment
• Support
• Security
• Multiple OS images to manage
Focus on PC hardware
• Many makes & models
• Refresh cycles
• Solutions for aging hardware
Reducing Cost
•Operating and desktop maintenance/support costs
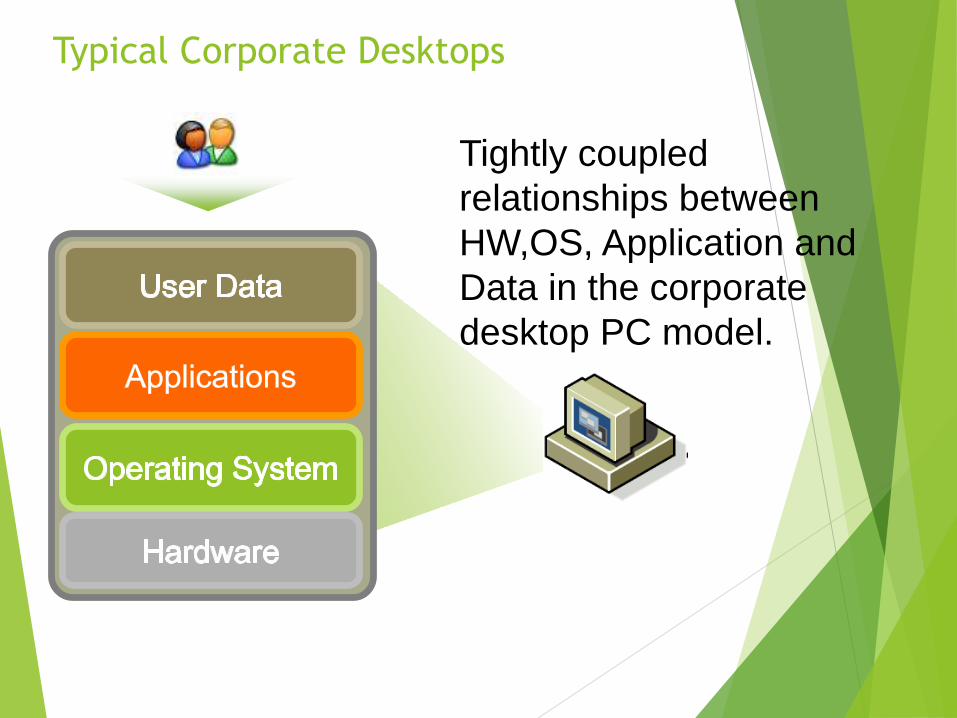
Typical Corporate Desktops
Tightly coupled
relationships between
HW,OS, Application and
Data in the corporate
desktop PC model.

Typical Corporate Desktops
In most environments,
the components are
linked together in
ways that are difficult
to support and
maintain.

Problems Can Start At Any Layer
A problem at one layer
often causes a chain
reaction that can
destroy the whole
stack.

Local Failures Can Mean Data Loss
This makes recovery
difficult and threatens
any locally stored user
data and settings.
Most organizations
just replace or re-
image the whole PC.

What is Virtual Desktop Infrastructure?
11
Virtual Desktop Infrastructure –it is a concept not a product, an architecture for running virtual desktops on an ESX server.
Leverage the advantages of the data center for the desktop
Virtual desktop as a concept, separates a PC desktop environment from aphysical machine.
The model stores a “virtualized” desktop on a remote central serverinstead of on the local storage of a PC client.
In a virtual desktop model the programs, applications, processes, and dataare stored and run in a centralized server environment.
End users connect to a remote desktop, but have a local experience
Enables a scalable highly available, highly accessible user environment
This allows users to access their desktops on any capable device, such asa traditional personal computer, notebook computer, smartphone, iPad, orthin client.
Dominant Products to build VDI: Citrix [XenDesktopXenApp,] VMware [View, ThinApp]

Key Points about Virtual Desktop Infrastructure
12
Tasks like procurement of desktop computer hardware, deploying orpatching desktop operating systems, updating antivirus signature,securing data, and desktop support become more and more challenging asthe size of an organization grows, and the disbursement of employeesacross multiple locations increases
Replacing all or a bulk of an organization’s computer workstations withthin client terminals and managing the client OS and applications in acentralized location is something most organization would love to be ableto do.
As smartphones, tablets, and other mobile devices become the dataaccess and communication tools of choice in the work place, the systemsneeded to support this new generation of mobility are changing.
Companies supporting bring your own device programs need to delivercorporate desktops and applications to various mobile devices in a secureway, and VDI does just that.

Advantages of Virtual Desktop Infrastructure
13
Reduced cost in purchasing desktop computers, as thin clients often lasttwo to three times longer than a desktop computer
Centralized Client OS Management
Rapid Client Deployment
Reduction in desktop support costs
Reduction in electricity costs, as thin client computers use only afraction of amount of energy that is used by a desktop computer.
Improved Data Security and centralized data storage
Improved worker productivity because of reduced PC downtime and theability to access desktops from multiple locations;
Fewer Application Compatibility Problems than with Terminal Server andCitrix, as users have their own, single user OS.
Better business continuity and disaster recovery capabilities.
Secured access to corporate data across a wide range of corporate andemployee owned devices including Mac, Windows and Linux devices aswell as iPad and Android tablets.

Objective of the Desktop Virtualization
The purpose of this desktop virtualization and application is to provide
decision makers a framework to evaluate the potential financial and
operational impacts of desktop virtualization solutions on the
organization.
The aim is to show the benefits and savings, through calculations and
assumptions used in the analysis.
Note: All simulations and calculations in the slides ahead are based on renown
virtualization software, which is considered as one of the most renowned virtualization
suites available in the market.

Virtual desktops are not for everyone. For example, employees who works inmarketing, and Technical team; These type of employees use laptops and mostlyspend much of their time using graphics and video editing software, or usespecialized I/O devices, are usually not good candidates for virtualization. They alsoneed to install applications themselves for their activities and need administrativeprivileges and high-performance desktop, may not be a good fit for VDI.
But many workers are well served by virtual desktops, including “day extenders” thatuse laptops only between working hours. The following examples describe standardvirtual desktop usage scenarios:
Ideal Users For Desktop Virtualization
Organization Descriptions
Call center Employee class who relies on only office and web applications seems to be the right candidates (Microsoft’sVirtual Desktop Infrastructure ).Employees get a session when they arrive that can be permanently or temporarily
assigned. Temporary desktop assignments are ideal for application access, reducing the overhead of provisioning
More desktops. The system ensures there are sufficient desktops available for employee access.
Outsourced staff Outsourced staff performs tasks while sensitive applications and data remain within control of the organization.
Organizations can control when users can access the system and where information can go.
Development & test Instead of providing multiple PCs to employees for development and test activities, provide multiple virtual
desktops, each provisioned with a temporary lease or permanently. Users can access multiple PCs through
thin client.

TCO Business Case for Banglalink

Analysis Summary
This 5-year analysis for ABC Inc calculates the estimated total cost of
ownership (TCO) comparison between current (As Is) environment and
implementing the proposed virtualization solution.
Based upon the information provided, the desktop virtualization
products does not seems to provide any potential IT capital savings
and operating savings over 5 years.
Financial Projections:-
From TCO analysis overall savings : US$ 66,000 in 5 years!!
Representing a 1.8% improvement in TCO!!
However from NPV analysis: BAU's NPV is US$216k lower than
VDI’s NPV!!
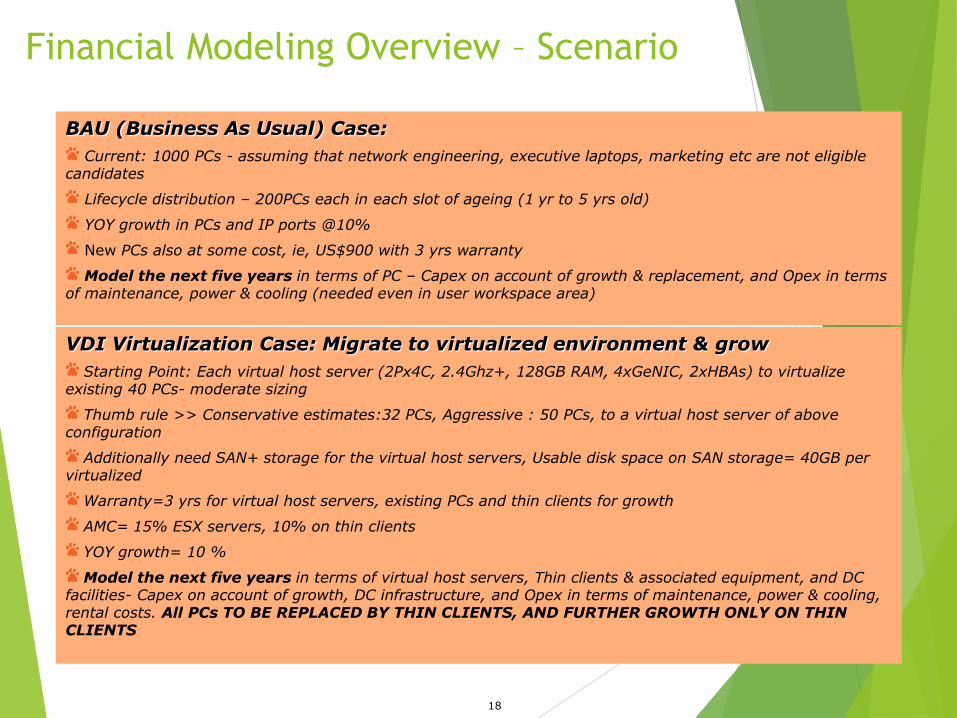
Financial Modeling Overview – Scenario
18
BAU (Business As Usual) Case:
Current: 1000 PCs - assuming that network engineering, executive laptops, marketing etc are not eligible candidates
Lifecycle distribution – 200PCs each in each slot of ageing (1 yr to 5 yrs old)
YOY growth in PCs and IP ports @10%
New PCs also at some cost, ie, US$900 with 3 yrs warranty
Model the next five years in terms of PC – Capex on account of growth & replacement, and Opex in terms of maintenance, power & cooling (needed even in user workspace area)
VDI Virtualization Case: Migrate to virtualized environment & grow
Starting Point: Each virtual host server (2Px4C, 2.4Ghz+, 128GB RAM, 4xGeNIC, 2xHBAs) to virtualize existing 40 PCs- moderate sizing
Thumb rule >> Conservative estimates:32 PCs, Aggressive : 50 PCs, to a virtual host server of above configuration
Additionally need SAN+ storage for the virtual host servers, Usable disk space on SAN storage= 40GB per virtualized
Warranty=3 yrs for virtual host servers, existing PCs and thin clients for growth
AMC= 15% ESX servers, 10% on thin clients
YOY growth= 10 %
Model the next five years in terms of virtual host servers, Thin clients & associated equipment, and DC facilities- Capex on account of growth, DC infrastructure, and Opex in terms of maintenance, power & cooling, rental costs. All PCs TO BE REPLACED BY THIN CLIENTS, AND FURTHER GROWTH ONLY ON THIN CLIENTS

Analysis Methodology
19
ESX server + PC/ Thin Client Count in 5 yrs – BAU & VDI Case
Current Scenario Assumed - PCs age analysis
Server Age in Years
Type Label 4-5 Yr 3-4 Yr 2-3 Yr 1-2 Yr 0-1 Yr Total
PC PC 200 200 200 200 200 1000
Total Total 200 200 200 200 200 1000
Servers BAU Vmware
Label Total Total
PC 2013
PC (thin client) 2013
2P 4 C ESX 45
Storage TB 60.75
Total 2013 2056
Current PCs & BAU Case Vs Virtualization@ 10% YOY growth, 5 yrs replacement (depreciation)
Sprawl in 5 yrs……
BAU Case: - 2013 PCs and IP switches , from initial 1000!!
Virtualization – 2013 thin clients, 45 ESX servers +GE IP ports, SAN switches + 76.5 TB usable Storage!!

Cumulative 5 Year TCO Comparison (Before – After)
Projected Cumulative 5 Year TCO of the proposed VDI project
5 YR CUMULATIVE DIFFERENCE
Cumulative 5 Year
TCO
B.A.U
$'000
VMware
$'000$'000
VMware
SAVING
Total CAPEX 1682 2331 -648 -38.5%
Total OPEX 2037 1323 714 35.1%
Overall 3719 3653 66 1.8%
Budgetary Heads BAU (Before) $’000 VMware (After) $’000
Y - 1 Y - 2 Y - 3 Y - 4 Y - 5 5-YR Y - 1 Y - 2 Y - 3 Y - 4 Y - 5 5-YR
Total CAPEX 314 324 335 348 362 1682 1470 168 223 231 239 2331
Total OPEX 333 365 400 446 493 2037 268 177 197 323 353 1323
0
1000
2000
3000
4000
B.A.U $'000 Vmware $'000
16822331
20371323
Total OPEX Total CAPEX
0
200
400
600
800
1000
1200
1400
1600
1800
Y - 1 Y - 2 Y - 3 Y - 4 Y - 5 Y - 1 Y - 2 Y - 3 Y - 4 Y - 5
BAU (Before) Vmware (After)
314 324 335 348 362
1,470
168 223 231 239
333 365 400446 493
268
177197 323 353
Total OPEX
Total CAPEX

Budgetary Heads BAU (Before) Vmware (After) * Savings 5 YR CUMULATIVE DIFFERENCE
CAPEXY - 1 Y - 2 Y - 3 Y - 4 Y - 5 5-YR Y - 1 Y - 2 Y - 3 Y - 4 Y - 5 5-YR Over 5 Yrs
CAPEXB.A.U -
OVERALL
Vmware -
OVERALL$ SAVING
Servers (incl NICs & HBAs) 270 279 289 300 311 1449 683 62 81 84 88 998 452 31.2% Servers 1449 998 452 31.2%
IP Switch Ports 44 45 47 48 50 233 78 47 53 58 63 300 -67 -28.5% IP Switch Ports 233 300 -67 -28.5%
DC Infra (10 Yrs amortized) DC Infra
SAN - Storage 492 41 62 62 62 718 -718 SAN - Storage 718 -718
Software Licenses 216 18 27 27 27 315 -315 Software Licenses 315 -315
Total CAPEX 314 324 335 348 362 1682 1470 168 223 231 239 2331 -648 -38.5% Total CAPEX 2413 3065 -652 -27.0%
OPEX Y - 1 Y - 2 Y - 3 Y - 4 Y - 5 5-YR Y - 1 Y - 2 Y - 3 Y - 4 Y - 5 5-YR Over 5 YrsOPEX B.A.U -
OPEX
Vmware -
OPEX$
Vmware
savings
Server Annual
Maintenance 10 10 10 10 10 50 5 10 15 35 70% Server MA 50 15 35 70.0%
Server Power & Cooling 305 336 369 406 447 1864 202 139 153 168 185 847 1017 54.5% Server Power & Cooling 1864 847 1017 54.5%
IP Switch Maintenance 5 5 5 13 18 45 5 8 10 15 16 54 -9 -19.1% IP Switch MA 45 54 -9 -19.1%
IP Switch Power & Cooling 13 14 15 17 19 77 14 15 17 18 20 84 -7 -8.7% IP Switch MA 77 84 -7 -8.7%
DC premises Rental DC premises Rental
SAN - Storage
Maint+Energy 7 15 17 73 79 192 -192
SAN - Storage
MA+Energy 192 -192
Software License
Maintenance 37 43 79 -79
Software License
maintenance 90 -90
VDI Training + Services 40 40 -40 VDI Training+Services 40 -40
Total OPEX 333 365 400 446 493 2037 268 177 197 323 353 1323 714 35.1% Total OPEX 2037 1323 714 35.1%
5 YR CUMULATIVE 5 YR CUMULATIVE Cumulative 5 YR CUMULATIVE DIFFERENCE
GRAND TOTALS 647 689 735 794 855 3719 1738 345 420 554 592 3653 66 1.8% Cumulative 5 Year TCO B.A.U
$'000
Vmware
$'000$'000
Vmware
SAVING
Total CAPEX 1682 2331 -648 -38.5%
Total OPEX 2037 1323 714 35.1%
Overall 3719 3653 66 1.8%
Virtualization Solutions: Cumulative 5 Year TCO
Comparison 5 year TCO detailed Breakdown for the proposed VDI project
Note: All figures reported in terms of cash flows. All figures in
US$x1000
* Cost includes thin client devices and servers that would be
required for VDI

Virtualization Solutions
ProjectedOutcome over 5 years from the proposed VDI project
0200400600800
1000120014001600
Y - 1 Y - 2 Y - 3 Y - 4 Y - 5 Y - 1 Y - 2 Y - 3 Y - 4 Y - 5
BAU (Before) Vmware (After)
Vmware Licenses SAN - Storage IP Switch Ports Servers (incl NICs & HBAs)
Capex

Virtualization Solutions
Comparing BAU Vs VDI investments with NPV
Timing
BAU VDI
Net Cash Flow Present Value Net Cash Flow Present Value
Y1 647 562 1738 1511
Y2 689 521 345 260
Y3 735 483 420 276
Y4 794 453 554 316
Y5 855 424 597 296
TotalNet CF(BAU)
3719
NPV(BAU)
2445
Net CF(VDI)
3653
NPV(VDI)
2661
Note: All figures in US$x1000
* 15% discount rate is considered to calculate the
present value against each year’s cash flow.
VDI investment has a net present value (NPV) of 2661K, while BAU's NPV is 2445k.
BAU's NPV is US$216k lower than VDI’s NPV!!

Key Drivers for Virtualization
VDI is unlikely to result in any significant $ savings. However, its usefulness
is in the "soft" benefits
Higher availability
Improves Manageability
Operations Automation & Effectiveness
Shortens provisioning time.
Environmentally friendly
Data centralization on SAN results in better data protection & backup
Enhanced Compliance and Data Security
Enables “Thin Client” compute capability – Workplace independence from the Data Center in
terms of distance and connectivity B/W constraints
Enables ‘Bring Your Own Device’ policy to deliver corporate desktops and applications to
various mobile devices (i.e. Mac, Windows, iPad and Android tablets) in a secure way.

Recommendation
All tests done in POC with CITRIX and VMware were successful. One limitation that was found with audio in both the solutions (delay in propagating sound) remains unresolved but according to vendor this can be circumvented with next software release around min 2013. Windows 7 didn’t encounter any significant issue.
Given that the architecture is very complex than server virtualization, we recommend to start VDI implementation with phased approach and build the environment incrementally.
The phase 1 implementation is planned to be done in 2013. First phase’s cost is already proposed in 0+12, 2013 budget.
Based on the pricing [Software and License] will move forward to implement the solution.

Budget HeadCost ($k)
Phase 1 Phase 2 Phase 3
Hardware
Server 60 400 340
Storage 60
Software
VMware ESX license 30 180 140
VDI License 20
MS VDA License 10
Professional Services
Implémentation service, training 20 20 20
Total 200 600 500
Costing & Budget

Desktop Virtualization Implementation - (Phased
Approach)
27
Total 1000PCs were identified as “candidates for Desktop virtualization”.
We proposed to migrate these 1000 PCs into virtual desktop in 3 phases
Proposed Project Phases are:
– Phase 1 : Phase 1 covers replacing 100 PCs into VMs. This phase is
expected to be started in H1 2013 and will require 6 months to complete.
This phase will consider Call Center, Sales and HR & Admin users
– Phase 2 : Phase 2 covers replacing 500 PCs with VMs. This phase is
expected to be started in H1 2014 and will require 6 months to complete.
This phase will consider Call Center and O&M users
– Phase 3 : Phase 3 covers replacing 400 PCs with VMs. This phase is
expected to be started in H1 2015 and will require 6 months to complete.
This phase will consider finance and Technical users who’s profile is fixed,
does not need to install applications themselves for their activities and won’t
require administrative privileges or high-performance desktop.

Thank you!