business alliances and networks gerrit rooks 21 october
Post on 18-Dec-2015
214 views
TRANSCRIPT
Business Alliances and networks
Gerrit Rooks
21 October
Today's lecture
• Some leftovers• Toyota's supplier network• Ajuha networks and innovation performance• Powell et al "learning in networks"• The assignment
– network characteristics– what you have to do– Ucinet and netdraw
• What is not a strategic alliance?a) A buyer and supplier who integrate their logistics
b) Three universities co-developing one educational program
c) Two firms that create one new firm to develop new products
d) A firm that buys another firm
• What is not a strategic alliance?a) A buyer and supplier who integrate their logistics
b) Three universities co-developing one educational program
c) Two firms that create one new firm to develop new products
d) A firm that buys another firm
• According to resources dependence theory, firms enter alliances because
a) they lack internal resources
b) alliances are a strategy to ensure predictability of access to resources
c) mergers are often too costly
d) this is a strategy to reduce competitive interdependence
• According to resources dependence theory, firms enter alliances because
a) they lack internal resources
b) alliances are a strategy to ensure predictability of access to resources
c) mergers are often too costly
d) this is a strategy to reduce competitive interdependence
• Transaction costs are:a) the cost of the product
b) the costs of contracting
c) the costs of production
d) tranportation costs
• Transaction costs are:a) the cost of the product
b) the costs of contracting
c) the costs of production
d) tranportation costs
• according to transaction costs theory, firms enter alliances because
a) the risks of market transactions are too high
b) the governance costs of alternatives are too high
c) the transaction costs of vertical integration are too high
d) the uncertainty in the environment is too high
• according to transaction costs theory, firms enter alliances because
a) the risks of market transactions are too high
b) the governance costs of alternatives are too high
c) the transaction costs of vertical integration are too high
d) the uncertainty in the environment is too high
• What are the two basic assumptions about human behavior of transaction cost theory?
a) uncertainty and risk
b) opportunism and bounded rationality
c) uncertainty and bounded rationality
d) bounded rationality and risk
• What are the two basic assumptions about human behavior of transaction cost theory?
a) uncertainty and risk
b) opportunism and bounded rationality
c) uncertainty and bounded rationality
d) bounded rationality and risk
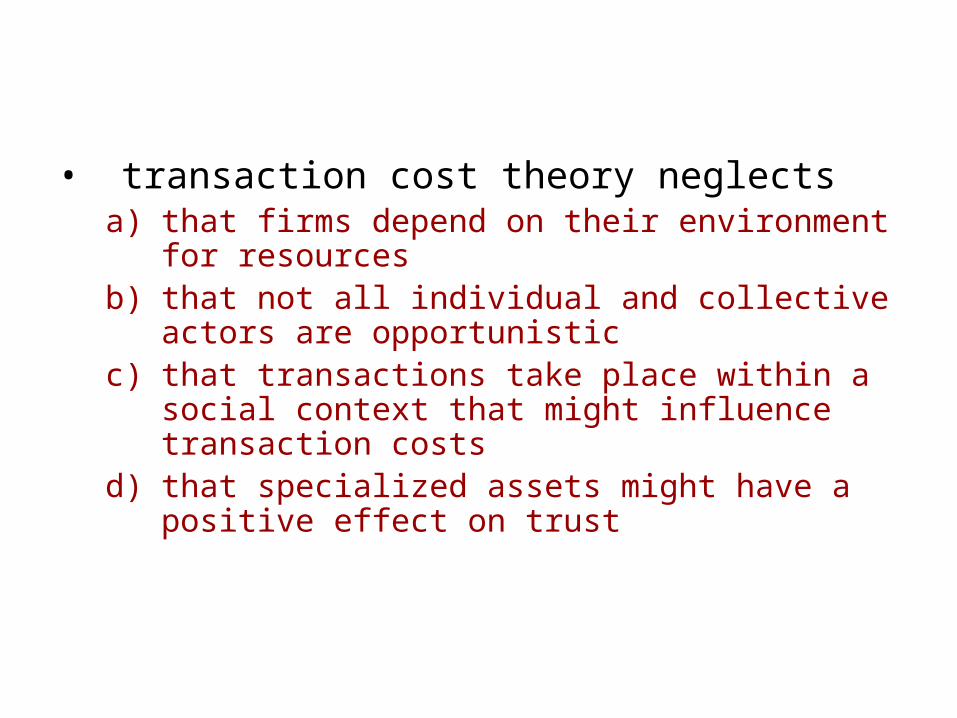
• transaction cost theory neglectsa) that firms depend on their environment for
resourcesb) that not all individual and collective actors are
opportunisticc) that transactions take place within a social context
that might influence transaction costsd) that specialized assets might have a positive effect
on trust
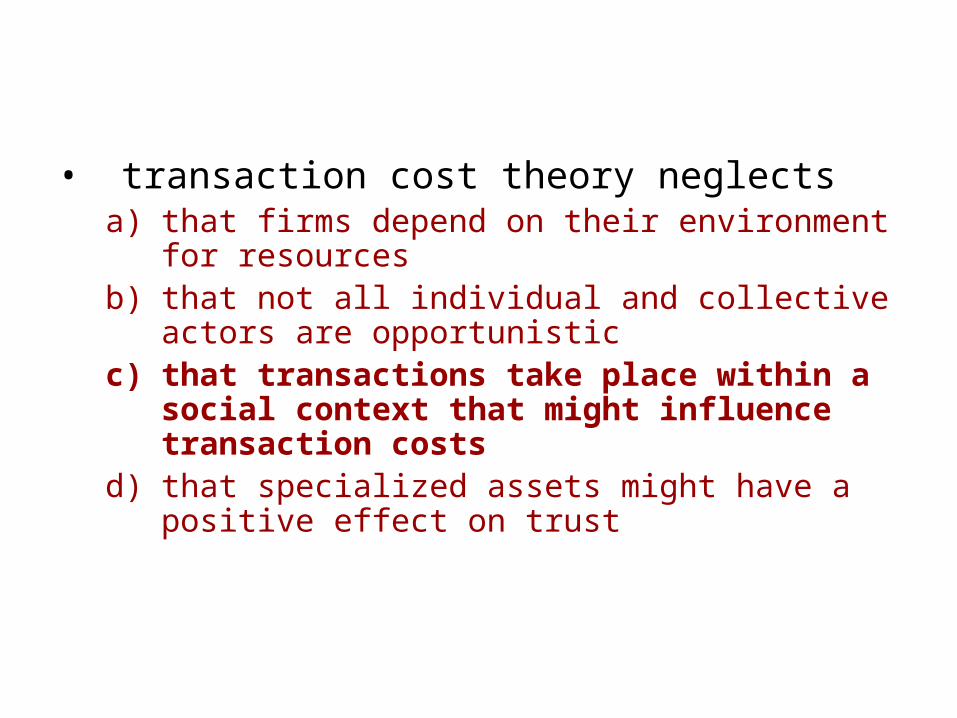
• transaction cost theory neglectsa) that firms depend on their environment for
resourcesb) that not all individual and collective actors are
opportunisticc) that transactions take place within a social
context that might influence transaction costsd) that specialized assets might have a positive effect
on trust
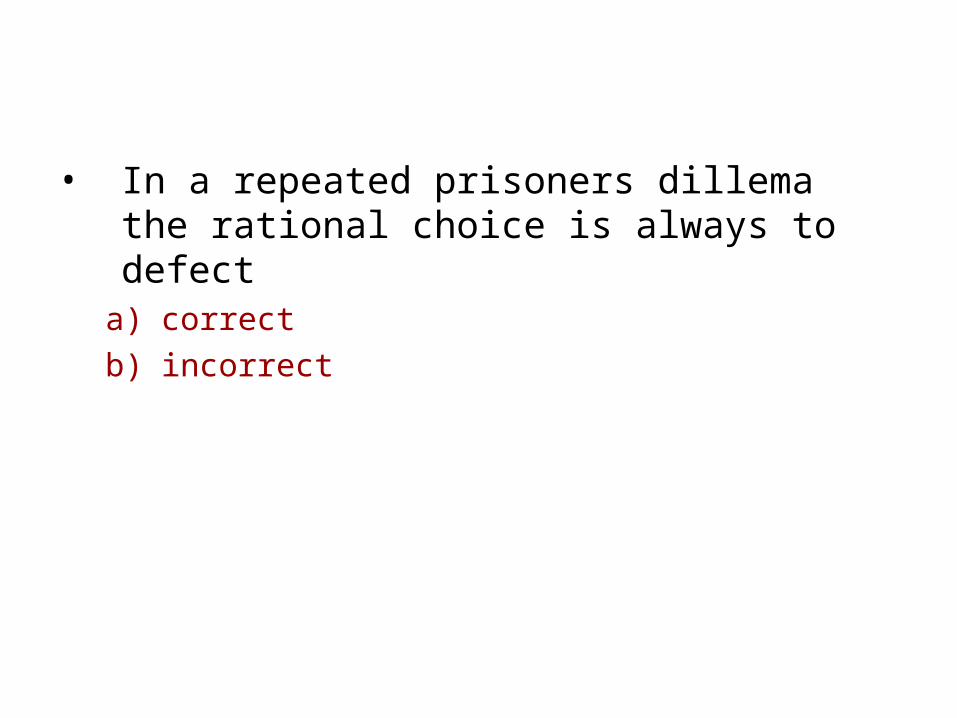
• In a repeated prisoners dillema the rational choice is always to defect
a) correct
b) incorrect
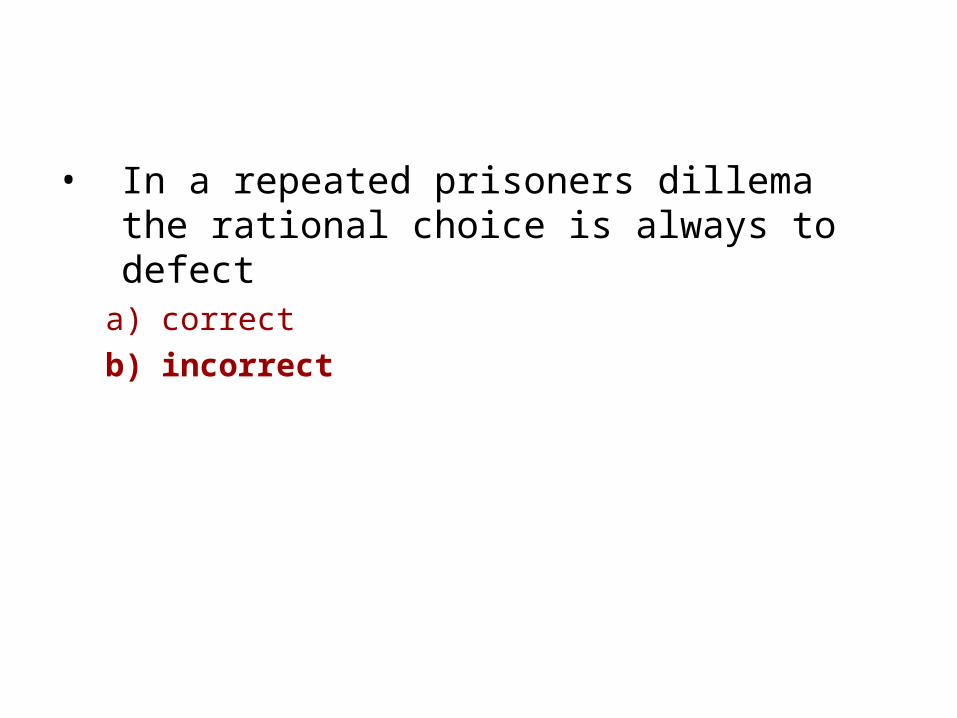
• In a repeated prisoners dillema the rational choice is always to defect
a) correct
b) incorrect
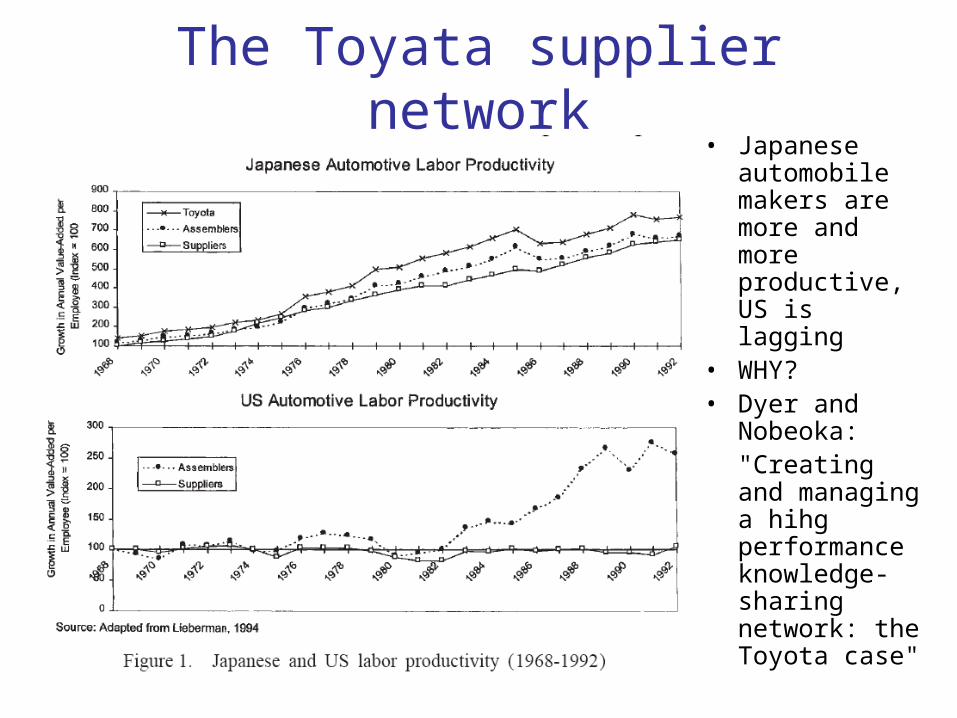
The Toyata supplier network• Japanese
automobile makers are more and more productive, US is lagging
• WHY?• Dyer and
Nobeoka:"Creating and managing a hihg performance knowledge-sharing network: the Toyota case"
Knowledge sharing routines
• What is knowledge?– Explicit knowledge or information– Tacit knowledge or know-how
• Dilemmas associated with knowledge sharing– how can self-interested network members openly
share valuable knowledge?– how to prevent free-rider problems?– how to maximize the efficiency of knowledge
transfers?
Overcoming knowledge sharing dilemmas
• Creating a network 'identity' through network-level knowledge-sharing routines
• Network `rules' for knowledge protection and value appopriation
• Creating multiple knowledge-sharing processes and sub-networks in the larger network
Why create an 'identity'?
• Social identity theory (Tajfel and Turner, 1986)– Categorization: We put others (and ourselves) into
categories. – Identification: We associate with certain group (our
ingroups), which serves to bolster our self-esteem. – Comparison: We compare our groups with other
groups, seeing a favorable bias toward the group to which we belong.
Social identity theory
• Experiment: – Rabbie and Horwitz (1969) “The arousal of ingroup-outgroup
bias by a chance win or loss.” Journal of Personality and Social Psychology, 13: 269-277.
• Randomly assign individuals to a blue and a green group• Individuals were unknown to each other and were told
that they would not meet again• Based on the toss of a coin a price was given to one
group • Group members evaluated each other more positively
and were more willing to cooperate with each other than non group members
How did Toyata create a network 'identity'?
• Toyota's network is known (labeled) as the `Toyota group'.
• Toyota creates a shared network identity by developing multiple groups– The supplier association– Toyota's operations management consulting division– Voluntary small group learning teams (jishuken)– (Interfirm employee transfers)
Supplier association
• Kyohokai: Toyota's supplier association was established in 1943
• Suppliers must be close to each other– Tokai (150 members)– Kanto (65 members)– Kansai (29 members)
Supplier association
• Suppliers association has general (high level) meetings every other month– Quality committees.
– Excellent plant tours allow network members to visit `best practice' plants
– Quality management conference held once a year
– lectures from directors, senior managers + six success ful supplier cases of quality improvement
Consulting teams
• Toyota's Operations Management Consulting Division (OMCD) – 6 senior executives, 50 consultants
• Direct free `on-site' assistance for suppliers– periods ranging from one day to many months – on average suppliers are visited about 4 times a year
with an average visit lasting 3 days– emergent problem solving: cross divisional problems
solving teams helping a supplier
• What kind of social capital is this according to Coleman?
Voluntary learning teams
• Jishuken: 60 of the key suppliers `voluntary study groups'
• Each group consists of roughly 5-8 suppliers– geographic proximity– no direct competitors in the same group– level of experience with Toyota
• Groups are reorganized every 3 years (Why?)
• After determining theme, the group visits each member to develop suggestions
• Member of OMCD monitors (to assist and to learn)
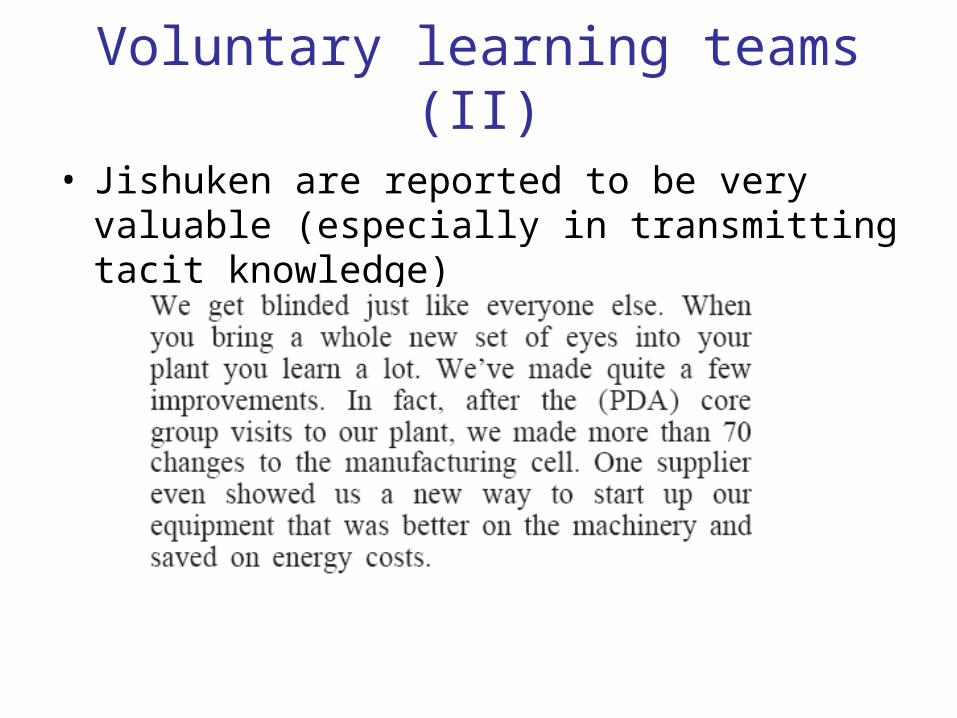
Voluntary learning teams (II)
• Jishuken are reported to be very valuable (especially in transmitting tacit knowledge)
Network rules for knowledge protection
• Creating an identity isn't enough to solve sharing and free riding problems
• Toyota sets a norm/rule by sharing its own knowledge– eliminating the notion that there is `propriety knowledge'
• Suppliers must be willing to open their plants to other network members to other network members – reciprocal obligations: We will help you, but in return, you must
agree to help the network.– reciprocity norm is enforced by implicit threat of withdrawal of
business
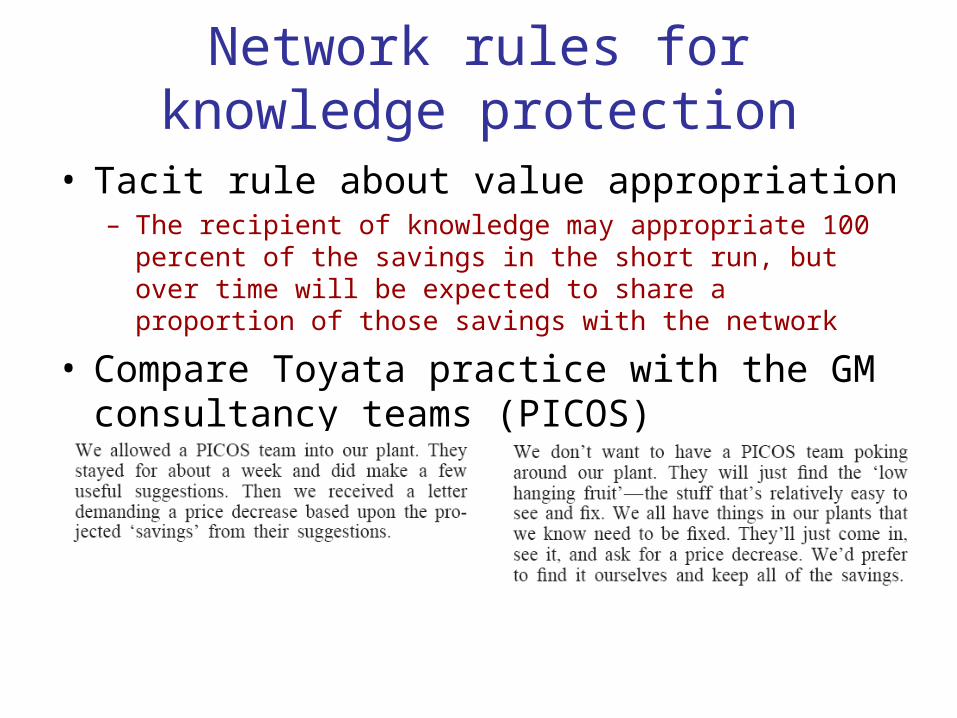
Network rules for knowledge protection
• Tacit rule about value appropriation– The recipient of knowledge may appropriate 100 percent of the
savings in the short run, but over time will be expected to share a proportion of those savings with the network
• Compare Toyata practice with the GM consultancy teams (PICOS)
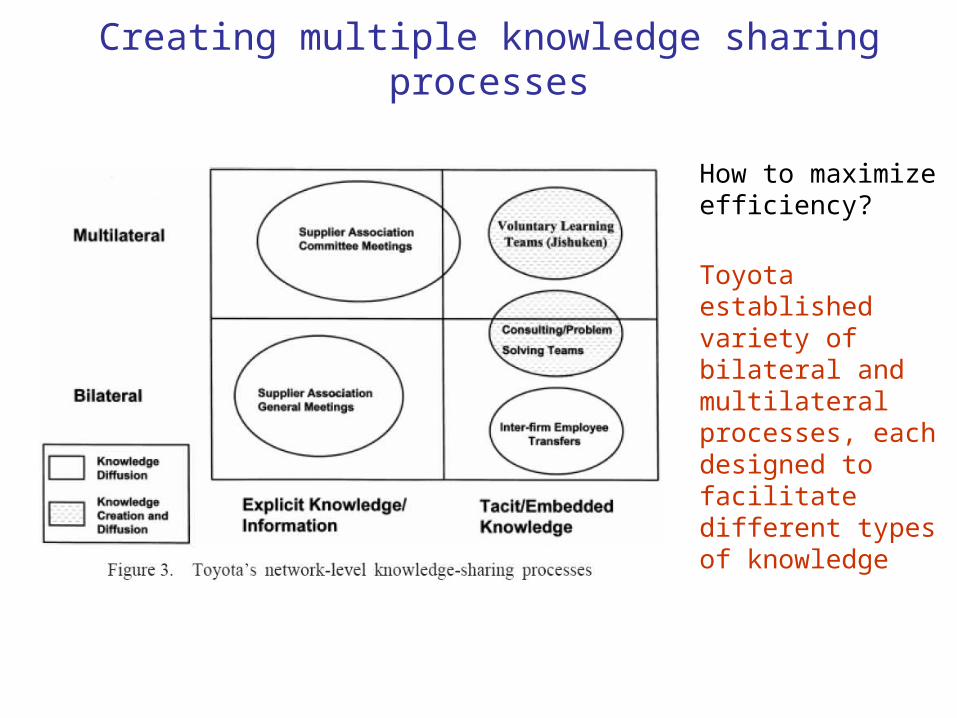
Creating multiple knowledge sharing processes
How to maximize efficiency?
Toyota established variety of bilateral and multilateral processes, each designed to facilitate different types of knowledge
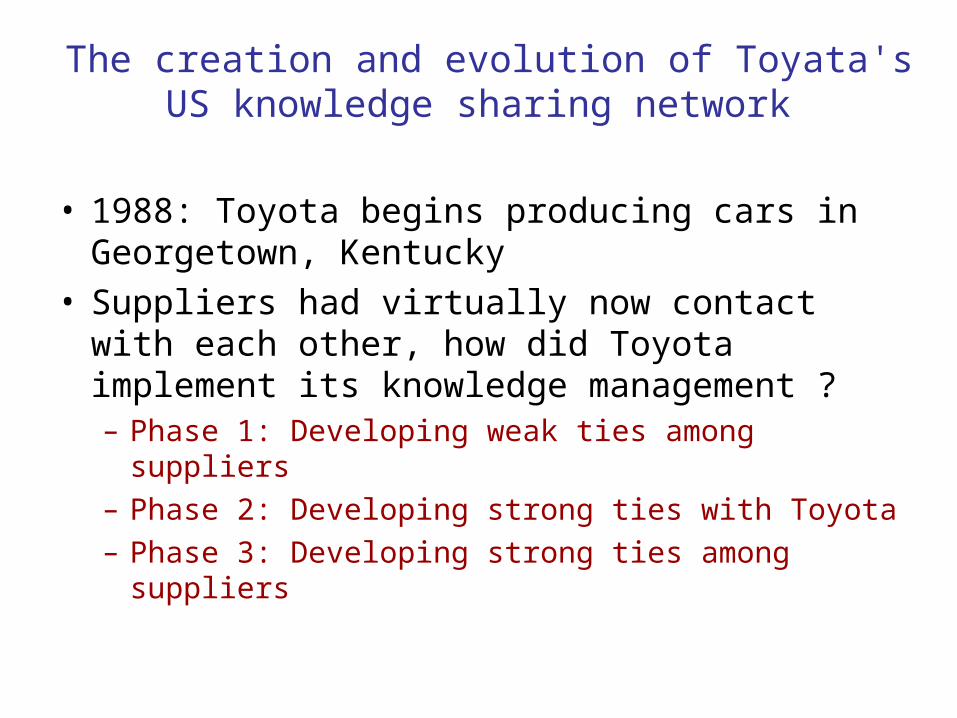
The creation and evolution of Toyata's US knowledge sharing network
• 1988: Toyota begins producing cars in Georgetown, Kentucky
• Suppliers had virtually now contact with each other, how did Toyota implement its knowledge management ?– Phase 1: Developing weak ties among suppliers– Phase 2: Developing strong ties with Toyota– Phase 3: Developing strong ties among suppliers
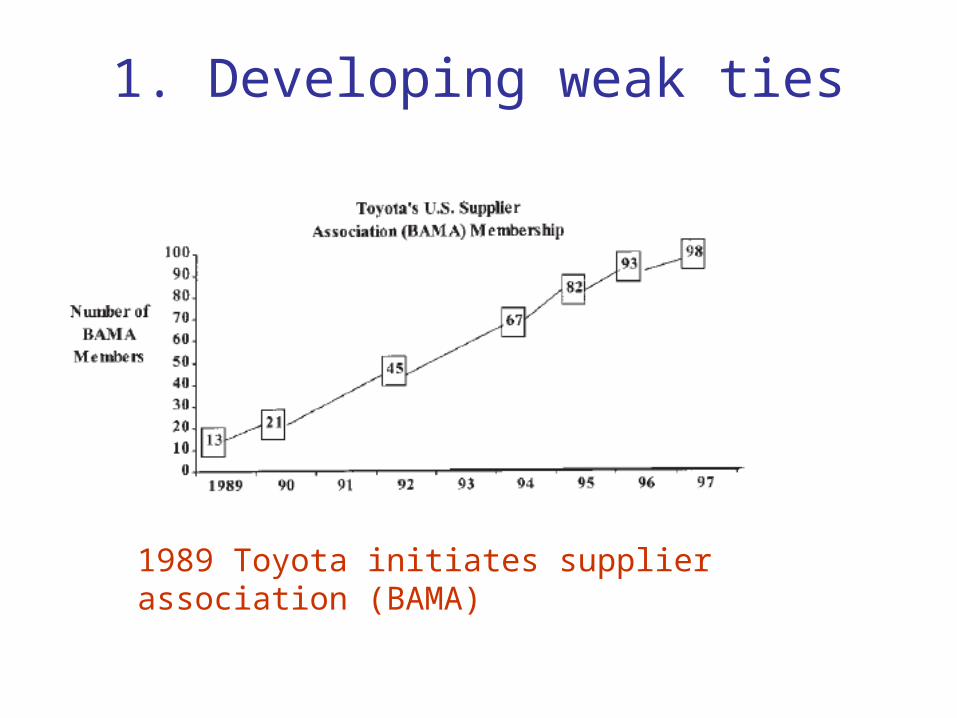
1. Developing weak ties
1989 Toyota initiates supplier association (BAMA)
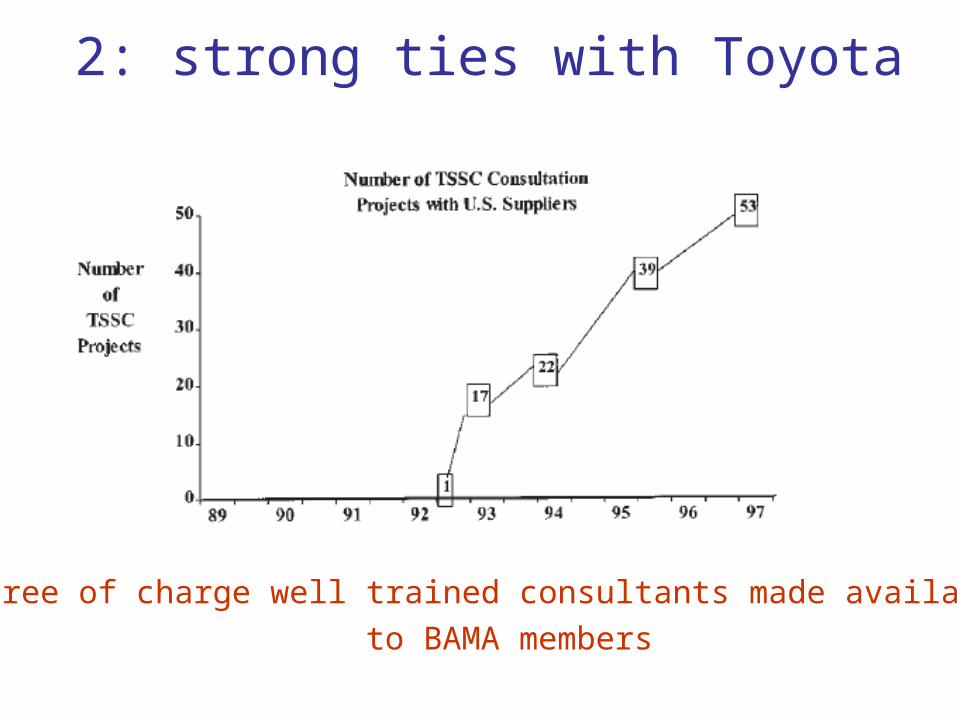
2: strong ties with Toyota
Free of charge well trained consultants made available
to BAMA members
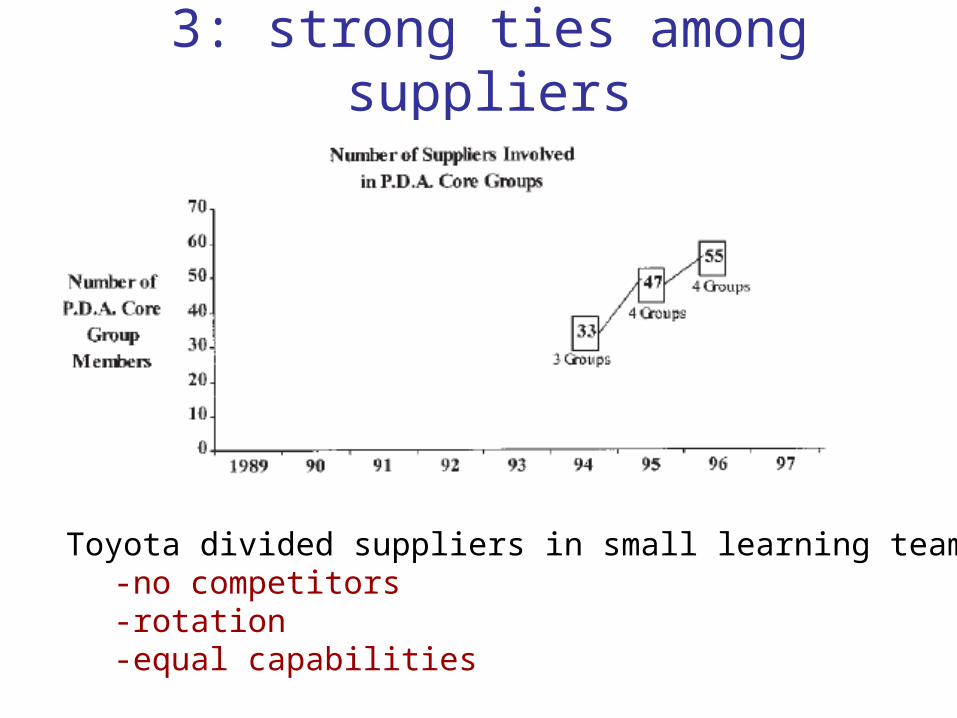
3: strong ties among suppliers
Toyota divided suppliers in small learning teams-no competitors-rotation-equal capabilities
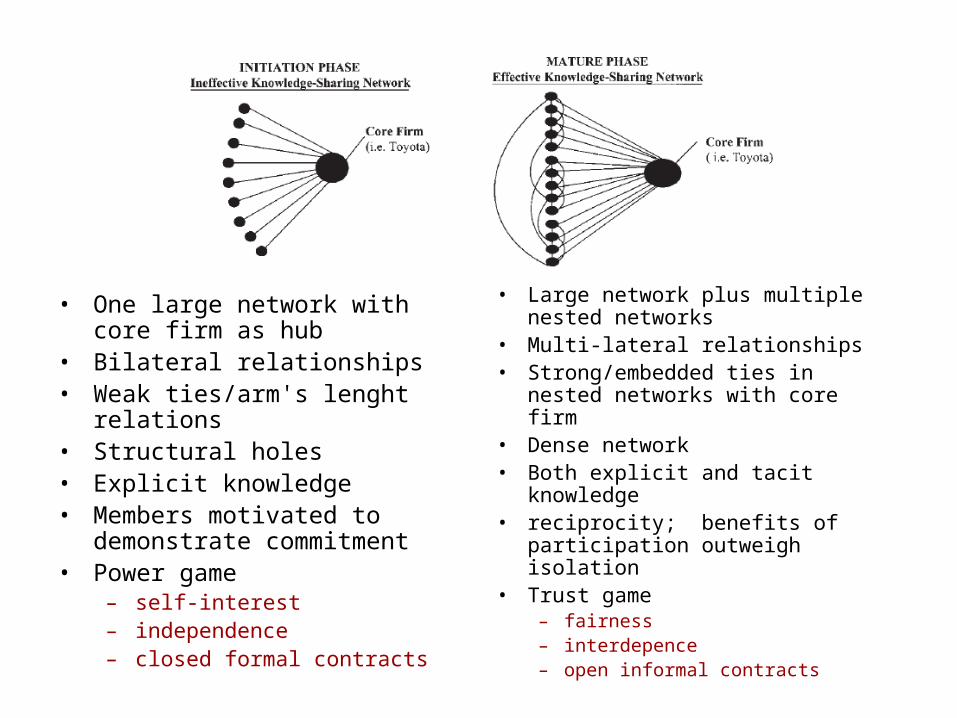
• One large network with core firm as hub
• Bilateral relationships• Weak ties/arm's lenght relations• Structural holes• Explicit knowledge• Members motivated to
demonstrate commitment• Power game
– self-interest– independence– closed formal contracts
• Large network plus multiple nested networks
• Multi-lateral relationships• Strong/embedded ties in nested
networks with core firm• Dense network• Both explicit and tacit knowledge• reciprocity; benefits of
participation outweigh isolation• Trust game
– fairness– interdepence– open informal contracts
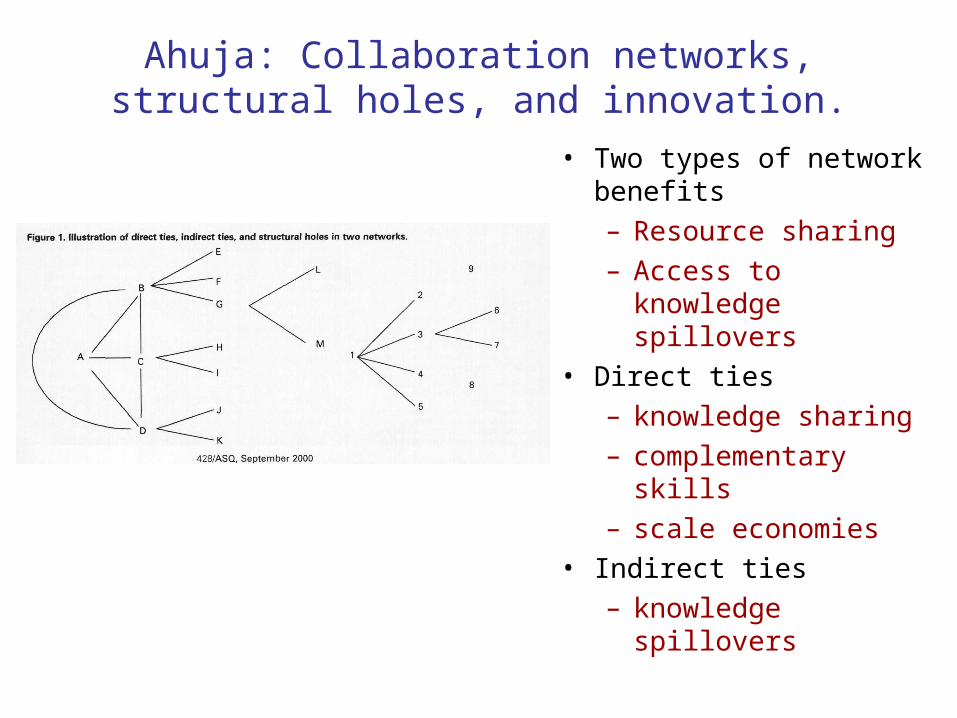
Ahuja: Collaboration networks, structural holes, and innovation.
• Two types of network benefits
– Resource sharing
– Access to knowledge spillovers
• Direct ties
– knowledge sharing
– complementary skills
– scale economies
• Indirect ties
– knowledge spillovers
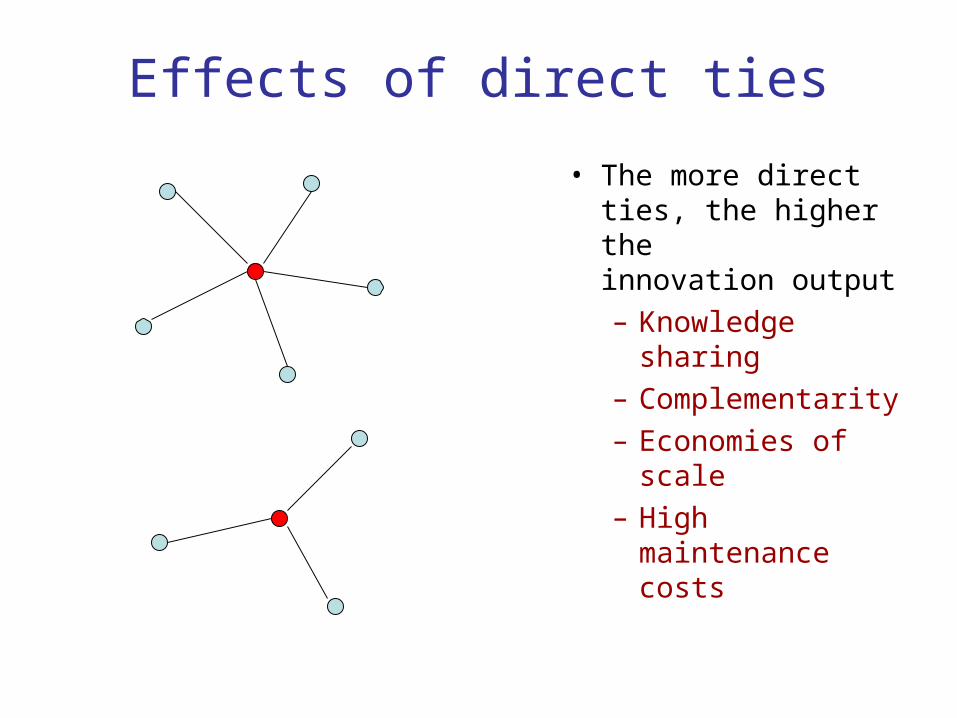
Effects of direct ties
• The more direct ties, the higher the innovation output– Knowledge
sharing– Complementarity– Economies of
scale– High
maintenance costs
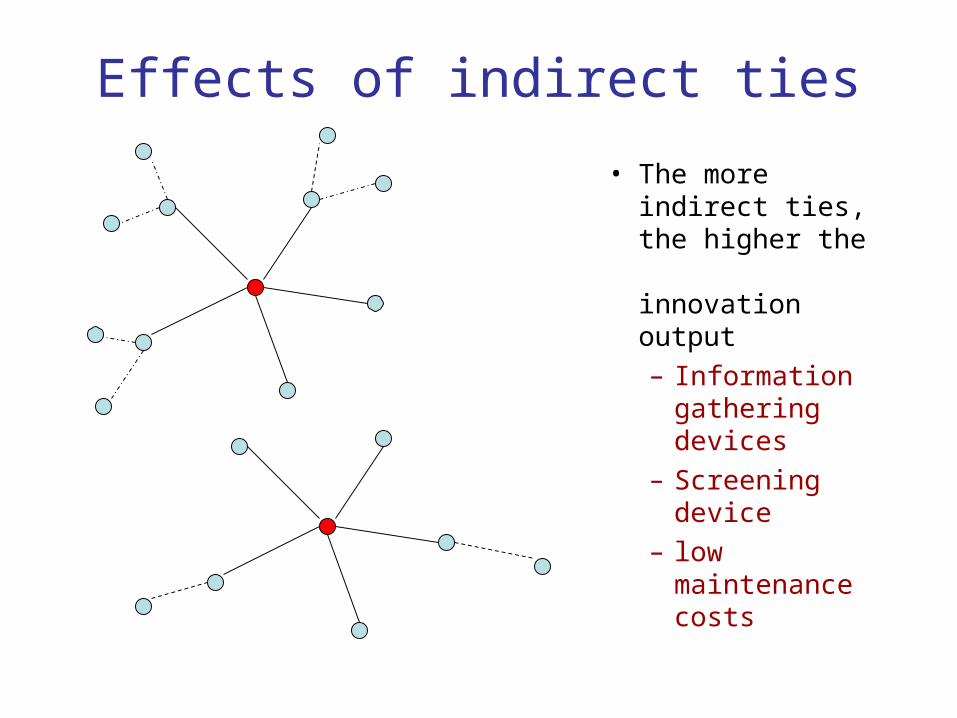
Effects of indirect ties
• The more indirect ties, the higher the innovation output– Information
gathering devices
– Screening device
– low maintenance costs
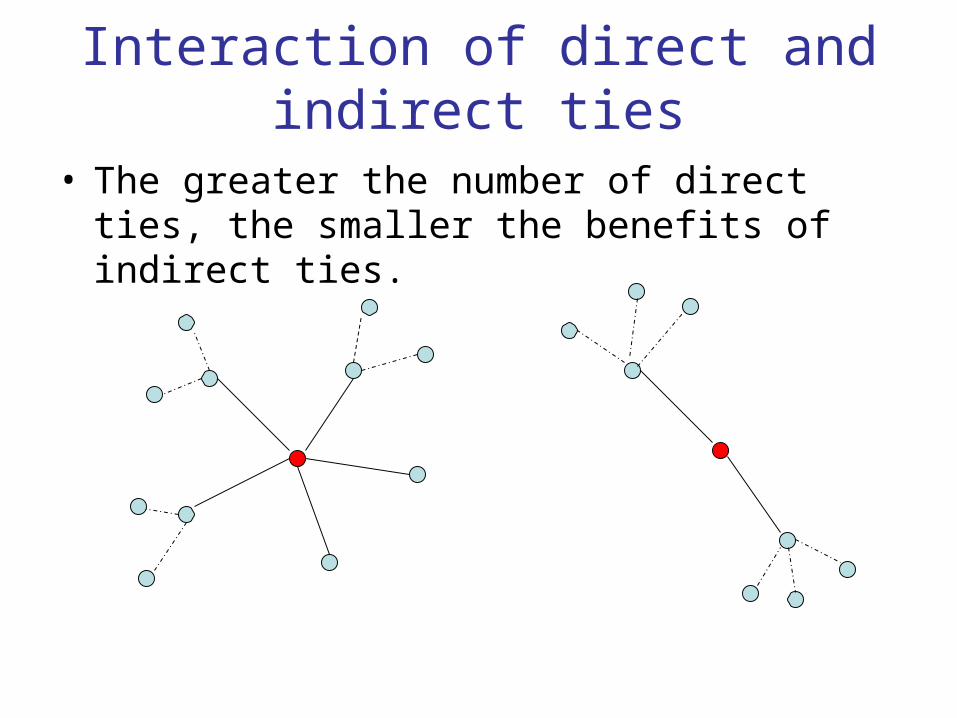
Interaction of direct and indirect ties
• The greater the number of direct ties, the smaller the benefits of indirect ties.
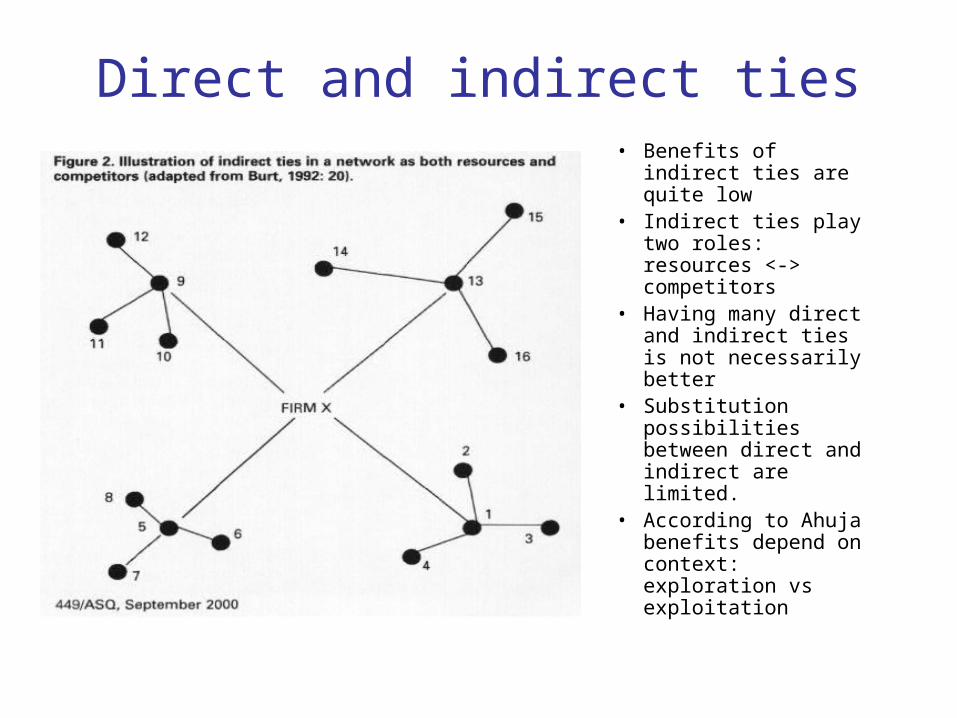
Direct and indirect ties• Benefits of indirect
ties are quite low • Indirect ties play two
roles: resources <-> competitors
• Having many direct and indirect ties is not necessarily better
• Substitution possibilities between direct and indirect are limited.
• According to Ahuja benefits depend on context: exploration vs exploitation
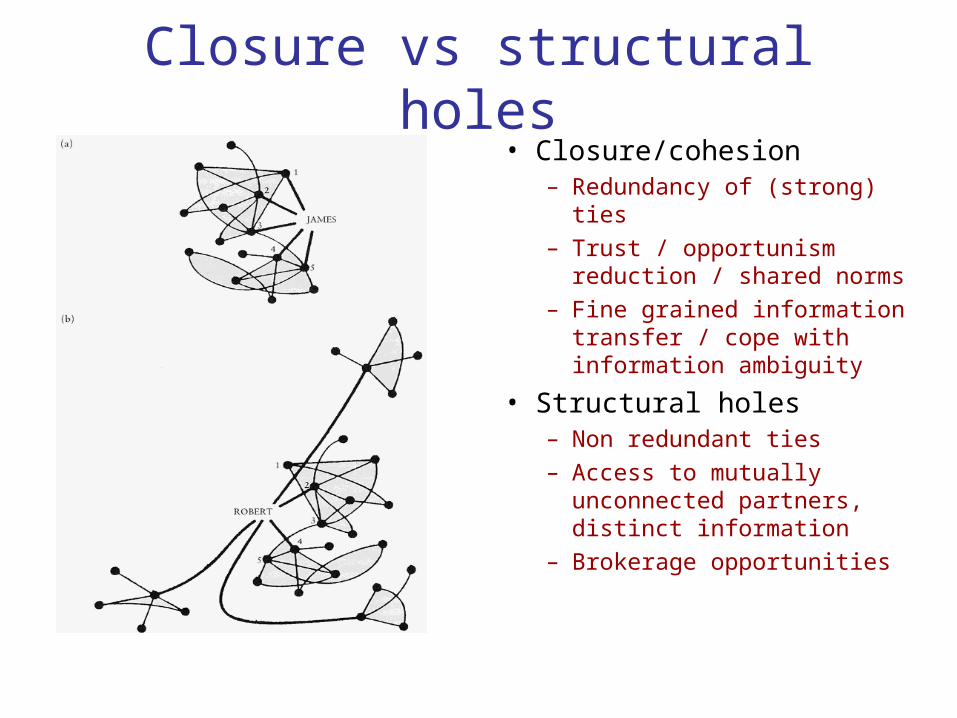
Closure vs structural holes• Closure/cohesion
– Redundancy of (strong) ties
– Trust / opportunism reduction / shared norms
– Fine grained information transfer / cope with information ambiguity
• Structural holes– Non redundant ties– Access to mutually
unconnected partners, distinct information
– Brokerage opportunities
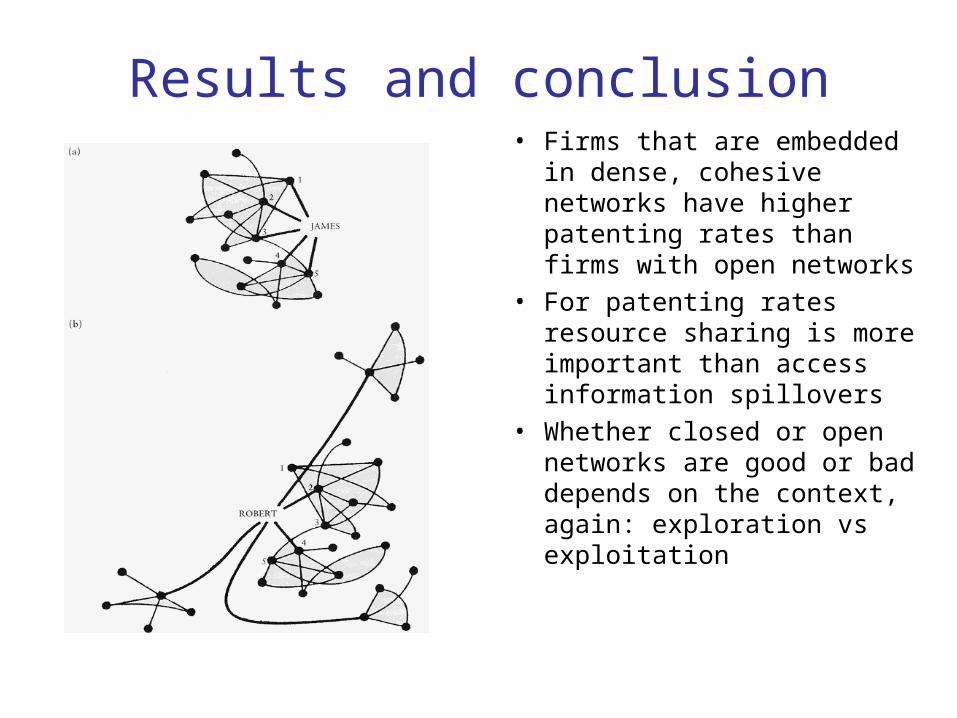
Results and conclusion• Firms that are embedded in
dense, cohesive networks have higher patenting rates than firms with open networks
• For patenting rates resource sharing is more important than access information spillovers
• Whether closed or open networks are good or bad depends on the context, again: exploration vs exploitation
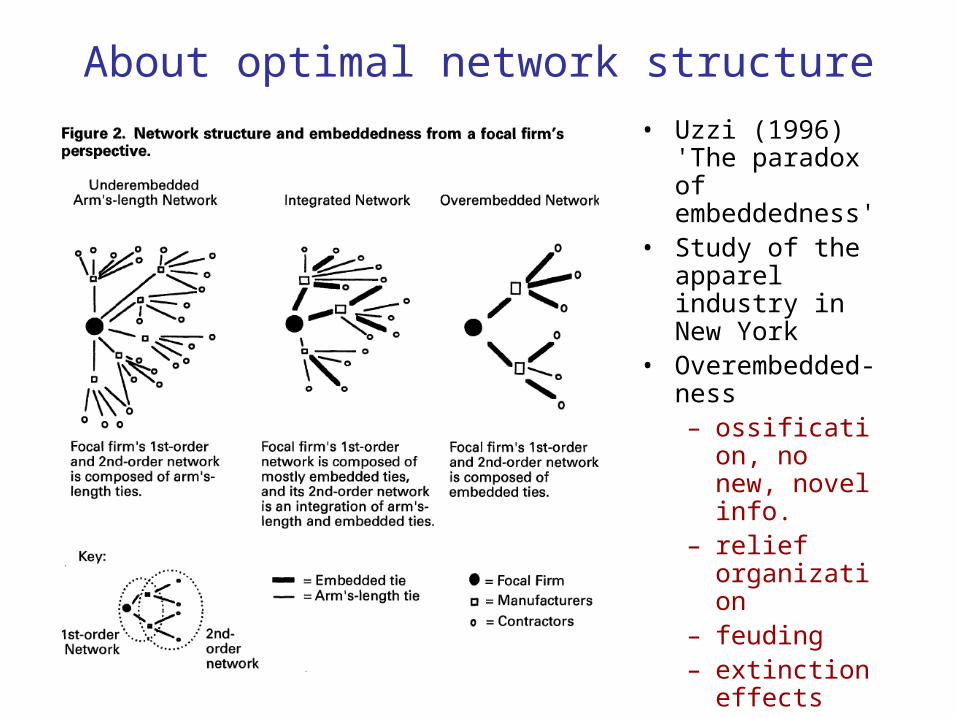
About optimal network structure
• Uzzi (1996) 'The paradox of embeddedness'
• Study of the apparel industry in New York
• Overembedded-ness– ossification,
no new, novel info.
– relief organization
– feuding– extinction
effects
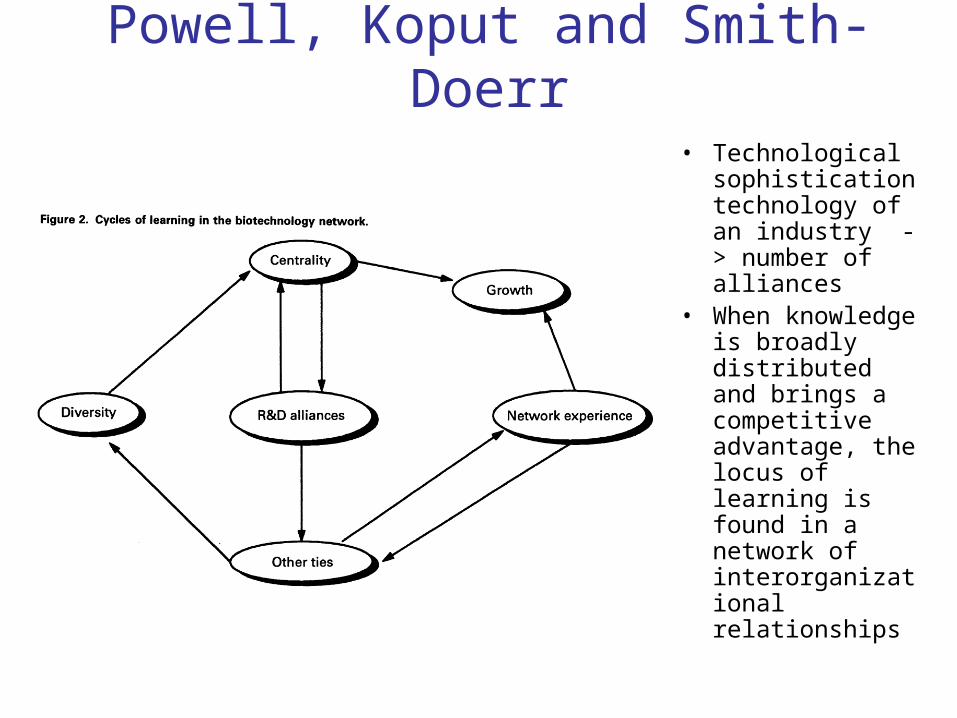
Powell, Koput and Smith-Doerr
• Technological sophistication technology of an industry -> number of alliances
• When knowledge is broadly distributed and brings a competitive advantage, the locus of learning is found in a network of interorganizational relationships
The assignment
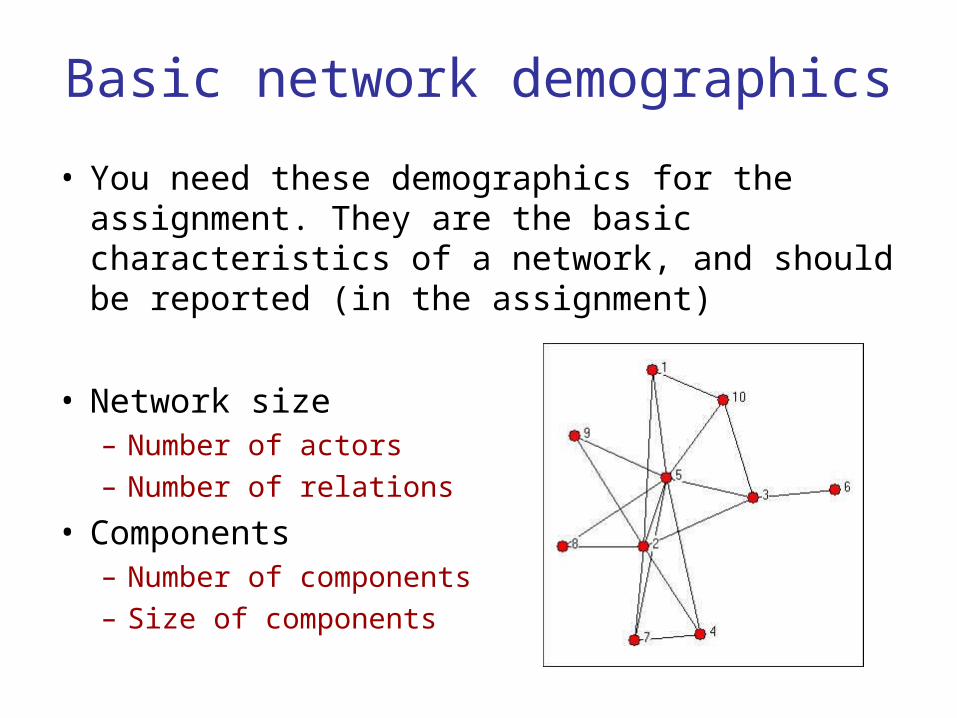
Basic network demographics
• You need these demographics for the assignment. They are the basic characteristics of a network, and should be reported (in the assignment)
• Network size– Number of actors
– Number of relations
• Components– Number of components
– Size of components
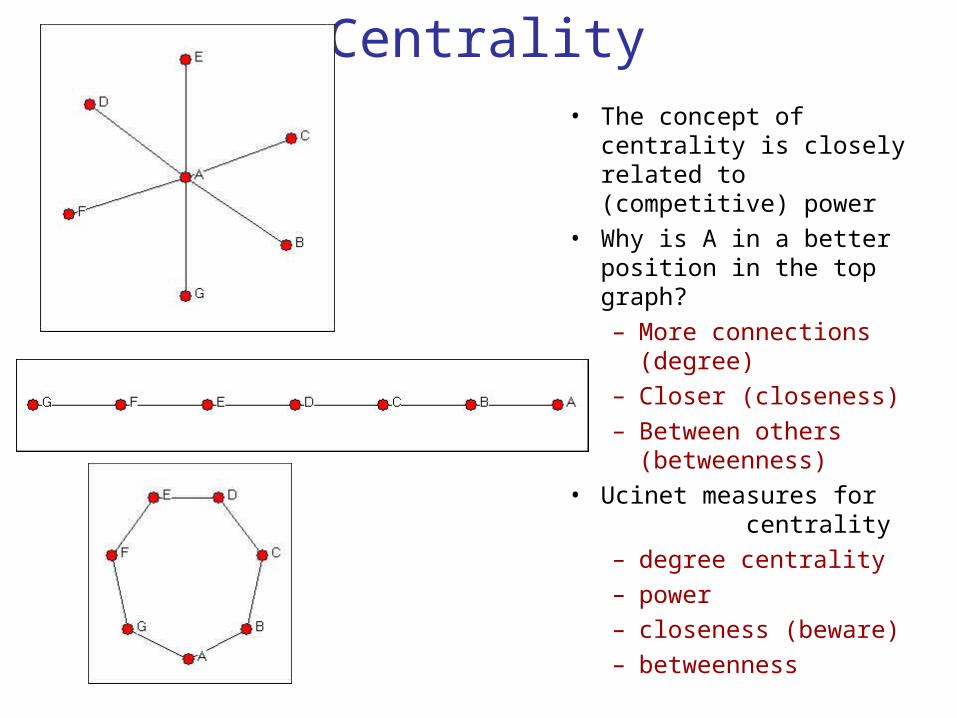
Centrality• The concept of centrality is
closely related to (competitive) power
• Why is A in a better position in the top graph?– More connections
(degree)– Closer (closeness)– Between others
(betweenness)• Ucinet measures for
centrality– degree centrality– power– closeness (beware)– betweenness
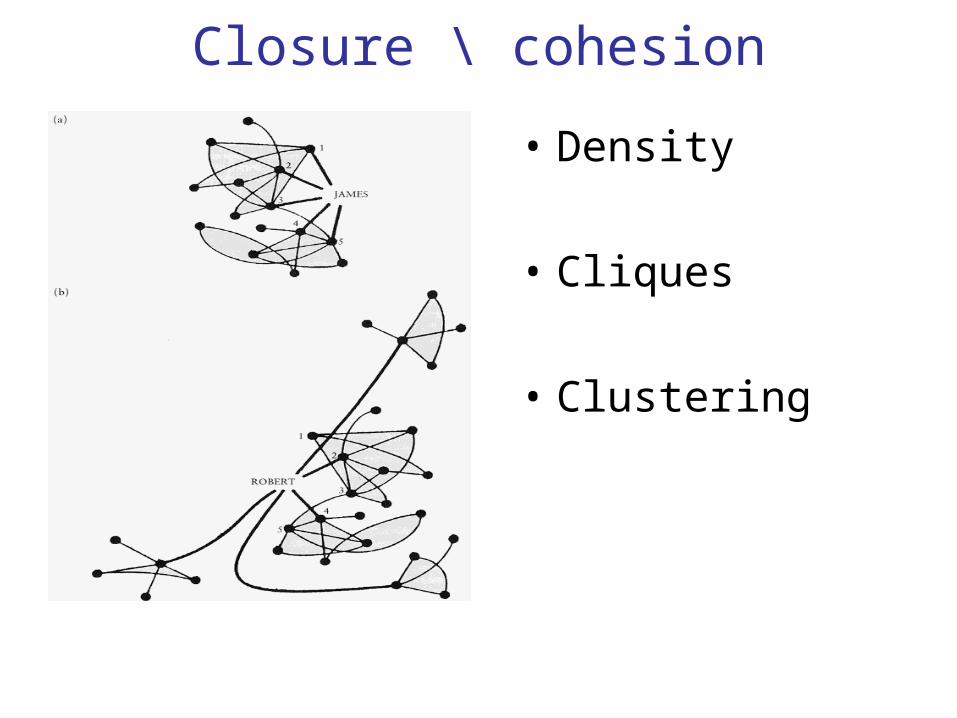
Closure \ cohesion
• Density
• Cliques
• Clustering
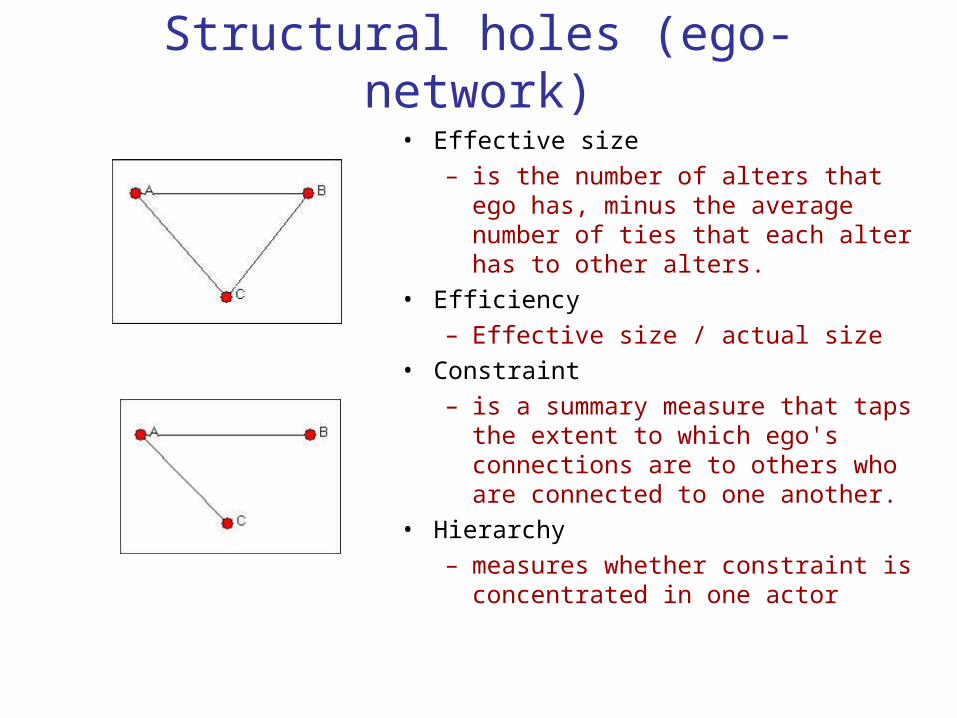
Structural holes (ego-network)
• Effective size– is the number of alters that ego has,
minus the average number of ties that each alter has to other alters.
• Efficiency– Effective size / actual size
• Constraint– is a summary measure that taps the
extent to which ego's connections are to others who are connected to one another.
• Hierarchy – measures whether constraint is
concentrated in one actor
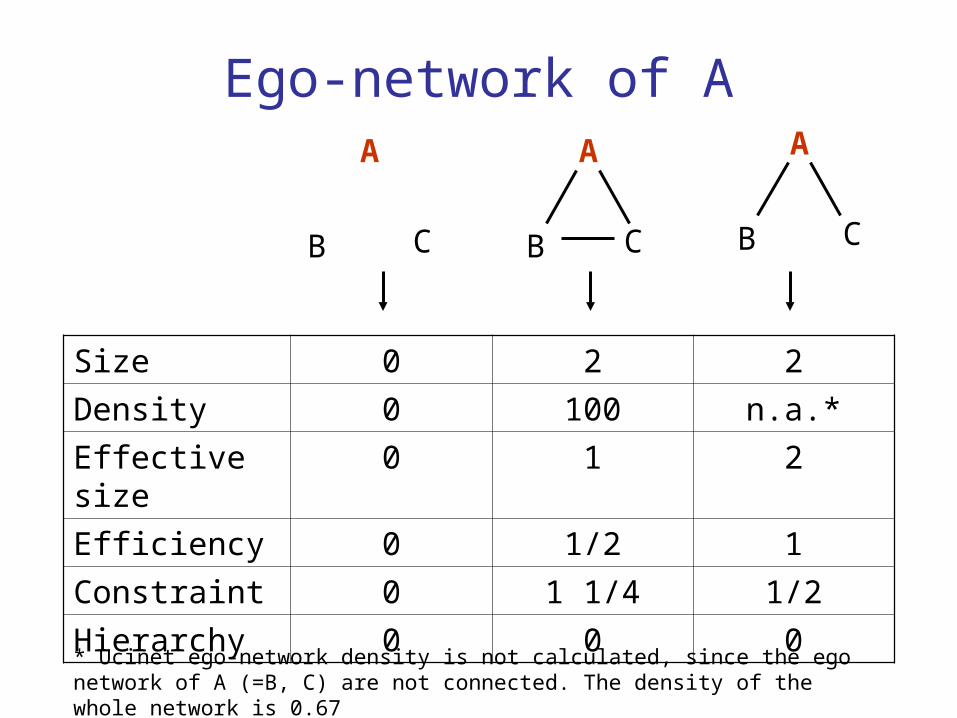
Ego-network of AA
B C
A
B C
A
B C
Size 0 2 2
Density 0 100 n.a.*
Effective size 0 1 2
Efficiency 0 1/2 1
Constraint 0 1 1/4 1/2
Hierarchy 0 0 0
* Ucinet ego-network density is not calculated, since the ego network of A (=B, C) are not connected. The density of the whole network is 0.67
The assignment: Logistics
• Groups of at the most three students. • The papers should be handed in before 16 November in two ways:
– in hard copy format to (Gerrit Rooks) my snail-mail box in the room PAV Q 1.05 (next to the secretariat).
– as an email (pdf or Word) to [email protected] .
• Obviously, papers handed in should be wholly original.
• Deliver on time. If you foresee that you will miss the deadline for a reason, let me know (long) before it expires.
The assignment (I)
• Analyze and compare (parts of) three networks. • The networks are composed of Research and Development
alliances in two different industries in the end of the seventies (the beginning of the ‘alliance explosion’). – defense industry 1978 + 1982– food and beverages industry 1978.
• The assignment is divided into four parts, you can earn 100 points in total. – In the first three parts you will have to compare networks.– Use arguments, concepts and ways to measure those concepts
that were provided to you in the course
The assignment (II)
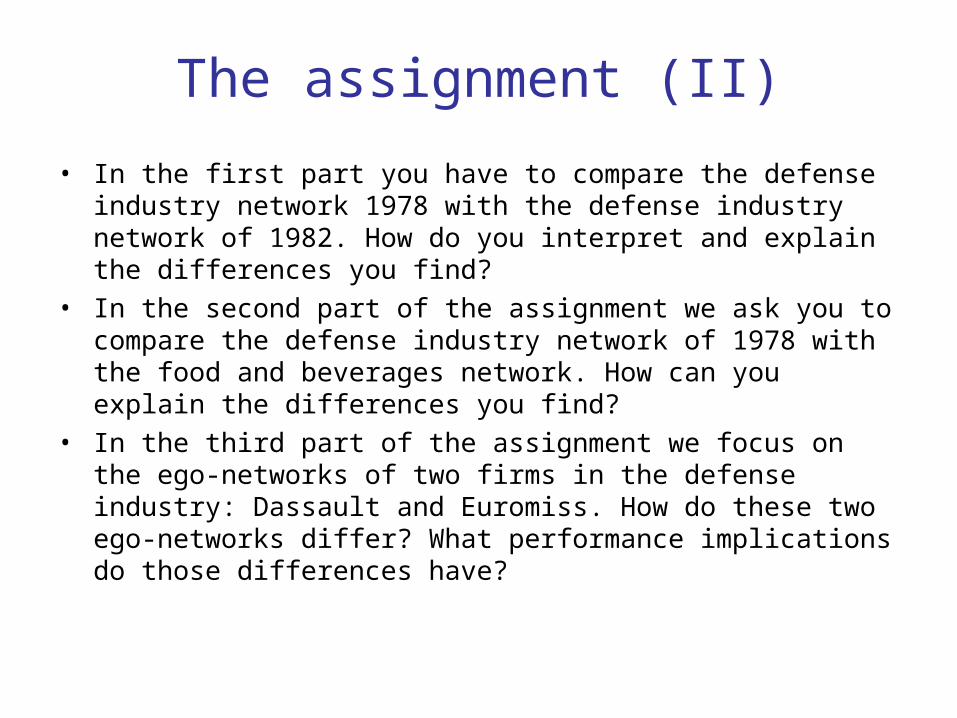
• In the first part you have to compare the defense industry network 1978 with the defense industry network of 1982. How do you interpret and explain the differences you find?
• In the second part of the assignment we ask you to compare the defense industry network of 1978 with the food and beverages network. How can you explain the differences you find?
• In the third part of the assignment we focus on the ego-networks of two firms in the defense industry: Dassault and Euromiss. How do these two ego-networks differ? What performance implications do those differences have?
The assignment (II)
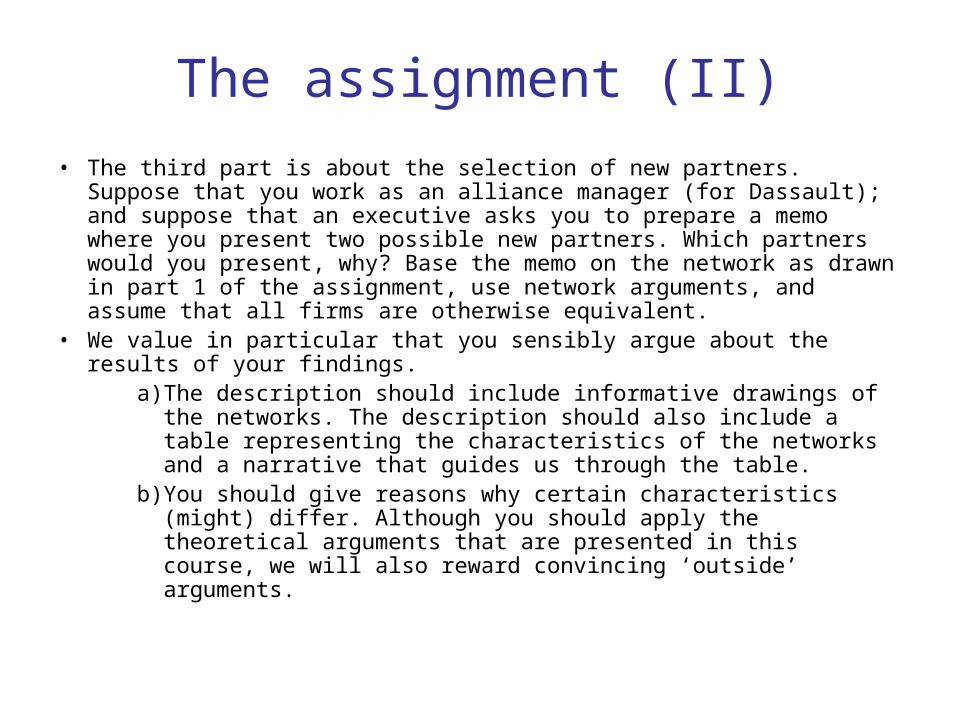
• The third part is about the selection of new partners. Suppose that you work as an alliance manager (for Dassault); and suppose that an executive asks you to prepare a memo where you present two possible new partners. Which partners would you present, why? Base the memo on the network as drawn in part 1 of the assignment, use network arguments, and assume that all firms are otherwise equivalent.
• We value in particular that you sensibly argue about the results of your findings.
a) The description should include informative drawings of the networks. The description should also include a table representing the characteristics of the networks and a narrative that guides us through the table.
b) You should give reasons why certain characteristics (might) differ. Although you should apply the theoretical arguments that are presented in this course, we will also reward convincing ‘outside’ arguments.
The assignment (III)
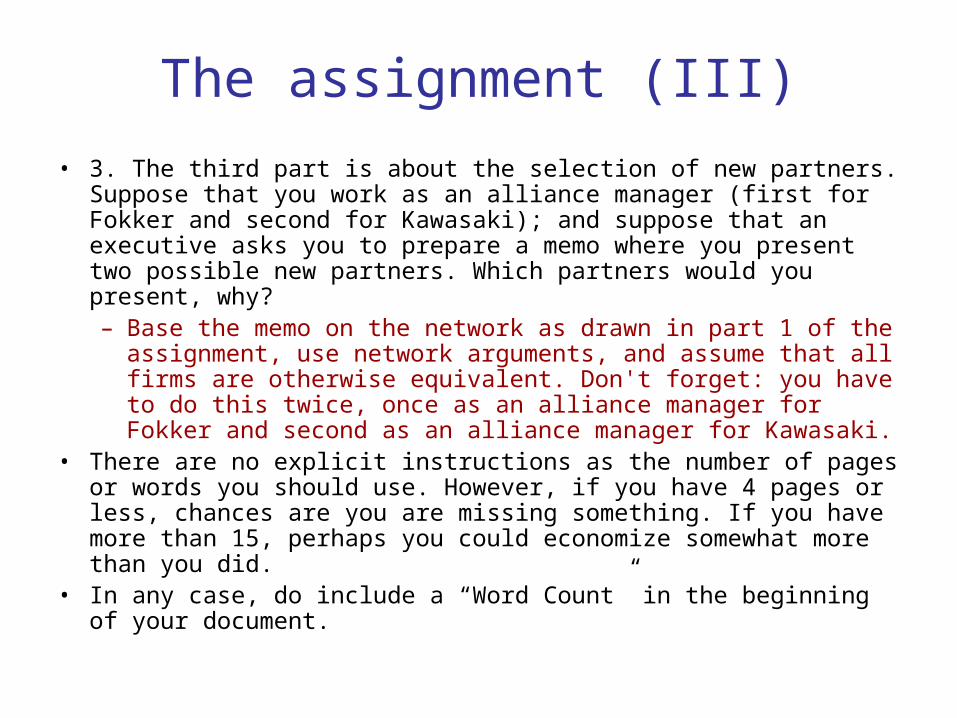
• 3. The third part is about the selection of new partners. Suppose that you work as an alliance manager (first for Fokker and second for Kawasaki); and suppose that an executive asks you to prepare a memo where you present two possible new partners. Which partners would you present, why? – Base the memo on the network as drawn in part 1 of the
assignment, use network arguments, and assume that all firms are otherwise equivalent. Don't forget: you have to do this twice, once as an alliance manager for Fokker and second as an alliance manager for Kawasaki.
• There are no explicit instructions as the number of pages or words you should use. However, if you have 4 pages or less, chances are you are missing something. If you have more than 15, perhaps you could economize somewhat more than you did.
• In any case, do include a “Word Count” in the beginning of your document.
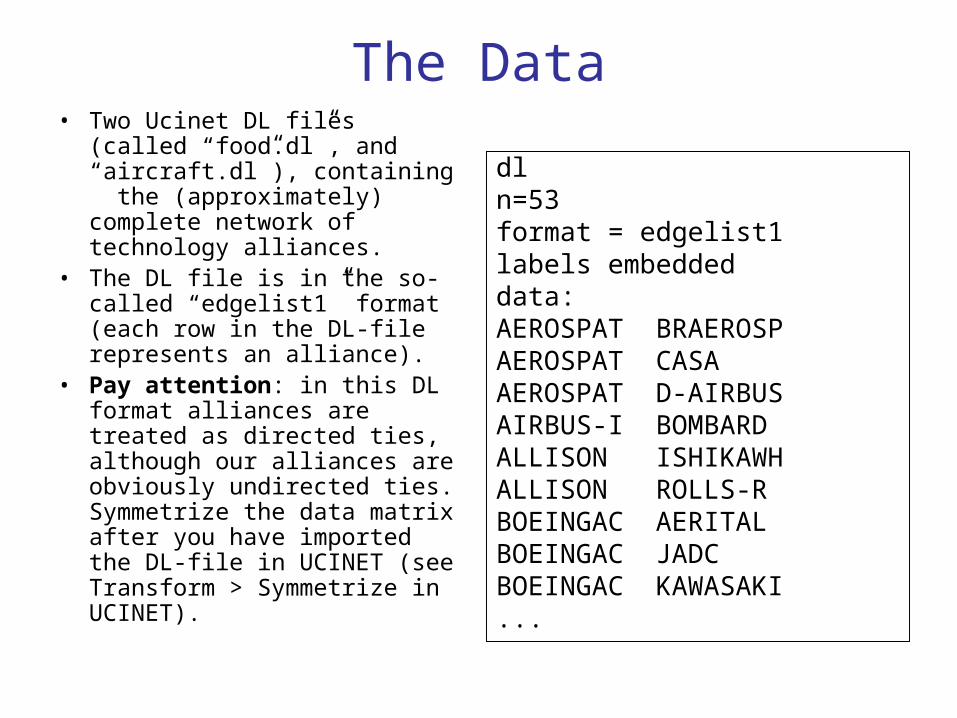
The Data• Two Ucinet DL files (called
“food.dl”, and “aircraft.dl”), containing the (approximately) complete network of technology alliances.
• The DL file is in the so-called “edgelist1” format (each row in the DL-file represents an alliance).
• Pay attention: in this DL format alliances are treated as directed ties, although our alliances are obviously undirected ties. Symmetrize the data matrix after you have imported the DL-file in UCINET (see Transform > Symmetrize in UCINET).
dln=53format = edgelist1labels embeddeddata:AEROSPAT BRAEROSPAEROSPAT CASAAEROSPAT D-AIRBUSAIRBUS-I BOMBARDALLISON ISHIKAWHALLISON ROLLS-RBOEINGAC AERITALBOEINGAC JADCBOEINGAC KAWASAKI...
Some hints
• Try to make drawings as informative as possible.
• Try not to include all possible network measures, but select a number of theoretically relevant network characteristics.
• The assignment is defined in a relatively “open” format (“Compare the two networks” and “Compare Fokker and Kawasaki”), without actually digging down to all the details. This was done on purpose. The idea is that you are able to figure out what is relevant based on the course material. Moreover, there may very well be interesting ways to involve material from the course: surprise us!
Netdraw
• First you have to create a UCINET data file
• Second, start Netdraw and import the data file
• See Chapter 4 Hanneman, or find out yourself