business activity and results
TRANSCRIPT

Business activity
and results
2021January-June

Business activity and results: January – June 2021| 1
Contents
04 Key Group figures
05 Key information
10 Macroeconomic trends and state of the financial markets
12 Income statement and comparative proforma income statement
25 Business Activity
29 Risk management
36 Liquidity and financing structure
38 Capital management
41 Segment reporting
54 The CaixaBank share
56 Investment portfolio
56 Ratings
57 Appendices
58 Alternative performance measures
67 Reconciliation between the accounting and management information
70 Breakdown of the performance of the accounting income statement by item
74 Adapting Bankia's financial information using CaixaBank management criteria
75 Historical income statement figures for the CABK and BPI perimeters
78 Activity indicators by region
Business activity and results: January – June 2021| 2
Note: The financial information contained in this document is unaudited and, accordingly, is subject to change. The consolidated income
statement and the consolidated balance sheet and the corresponding breakdowns of those statements provided in this report, are presented
under management criteria, but have still been prepared in accordance with International Financial Reporting Standards (IFRS-EU) as adopted by
the European Union under the terms of Regulation (EC) No 1606/2002 of the European Parliament and of the Council of 19 July 2002, as
subsequently modified. In preparing these statements, Circular 4/2017 of the Bank of Spain of 6 December, as subsequently modified, has also
been taken into due account in that it adapts IFRS-EU to Spanish credit institutions.
This report has been prepared from the accounting records of CaixaBank, S.A. and the other Group companies, and includes certain adjustments
and reclassifications required to apply the policies and criteria used by the Group companies on a consistent basis with those of CaixaBank. For
this reason, and specifically in the case of BPI, the information contained in this document does not coincide with certain aspects presented in
BPI's publication of financial information. Likewise, the financial information regarding investees has been prepared primarily on the basis of
estimates made by CaixaBank, hereinafter the "Company".
Figures are presented in millions of euros unless the use of another monetary unit is stated explicitly, and may be expressed as either million
euros or € million. Certain financial information in this report was rounded off and, specifically, the figures shown herein as totals may differ
slightly from the arithmetic sum of the individual figures given before them.
In accordance with the Guidelines on Alternative Performance Measures (APMs) published by the European Securities and Markets Authority
on 30 June 2015 (ESMA/2015/1057), the appendices hereto provide the definition of certain alternative financial measures and, where
appropriate, the reconciliation with the items contained on the financial statements for the period in question.
In accordance with the Amendments to IFRS 4 and subsequent reviews, the Group has decided to apply temporary exemption from applying IFRS
9 to the financial investments of the Group’s insurance firms for all periods that come before 1 January 2023, aligning its first application with
the entry into force of the new IFRS 17: Insurance Contracts (expected on 1 January 2023), which will govern the presentation and measurement
of insurance contracts (including technical provisions). Accordingly, these investments are measured in accordance with IAS 39 and grouped
under the heading “Assets under the insurance business” on the balance sheet. To make the information more readily comparable, the Group
has also grouped together the technical provisions corresponding to Unit Link and Flexible Investment Life Annuity (the part managed), which
are now reported jointly under ‘Liabilities under the insurance business’.
Business activity and results: January – June 2021| 3
Commercial positioning
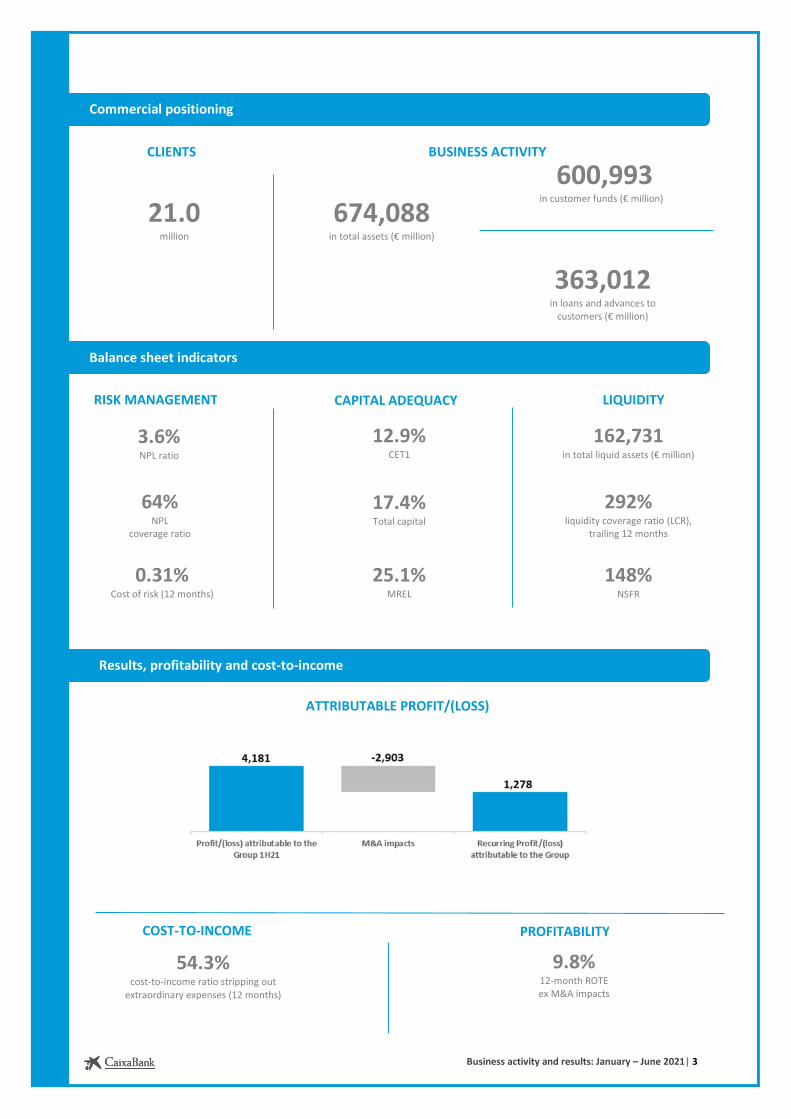
674,088in total assets (€ million)
600,993 in customer funds (€ million)
363,012 in loans and advances to
customers (€ million)
21.0 million
Balance sheet indicators
12.9%CET1
17.4%Total capital
3.6%NPL ratio
64%NPL
coverage ratio
9.8%12-month ROTE ex M&A impacts
54.3%cost-to-income ratio stripping out
extraordinary expenses (12 months)
Results, profitability and cost-to-income
292% liquidity coverage ratio (LCR),
trailing 12 months
162,731in total liquid assets (€ million)
RISK MANAGEMENT CAPITAL ADEQUACY
25.1% MREL
148% NSFR
LIQUIDITY
0.31%Cost of risk (12 months)
BUSINESS ACTIVITYCLIENTS
ATTRIBUTABLE PROFIT/(LOSS)
PROFITABILITYCOST-TO-INCOME

Business activity and results: January – June 2021| 4
€ million / % January – JuneChange 2Q21
Quarter-on-quarter 2021 2020
PROFIT/(LOSS)
Net interest income 2,827 2,425 16.6% 1,636 37.4%
Net fee and commission income 1,640 1,266 29.5% 981 48.9%
Core income 4,899 4,064 20.6% 2,833 37.1%
Gross income 4,883 4,117 18.6% 2,820 36.7%
Recurring administrative expenses, depreciation and amortisation (2,747) (2,345) 17.1% (1,598) 39.1%
Pre-impairment income 166 1,772 (90.7%) (708) -
Pre-impairment income stripping out extraordinary expenses 2,136 1,772 20.5% 1,222 33.7%
Profit/(loss) attributable to the Group 4,181 205 - (605) -
Profit/(loss) attributable to the Group ex M&A impacts 1,278 205 - 764 48.6%
MAIN RATIOS (last 12 months)
Cost-to-income ratio 75.8% 56.9% 18.9 75.8% 21.8
Cost-to-income ratio stripping out extraordinary expenses 54.3% 56.9% (2.6) 54.3% 0.8
Cost of risk1 (last 12 months) 0.31% 0.61% (0.30) 0.31% (0.30)
ROE 1 8.2% 4.7% 3.5 8.2% 1.6
ROTE1 9.8% 5.6% 4.2 9.8% 1.8
ROA1 0.5% 0.3% 0.2 0.5% 0.1
RORWA1 1.4% 0.8% 0.7 1.4% 0.3
June DecemberChange
March Quarter-on-quarter 2021 2020 2021
BALANCE SHEET
Total assets 674,088 451,520 49.3% 663,569 1.6%
Equity 34,571 25,278 36.8% 35,552 (2.8%)
BUSINESS ACTIVITY
Customer funds 600,993 415,408 44.7% 579,934 3.6%
Customer funds, excluding the Bankia integration 440,394 415,408 6.0% 419,335 -
Loans and advances to customers, gross 363,012 243,924 48.8% 363,821 (0.2%)
Loans and advances to customers, gross, excluding the Bankia integration 241,996 243,924 (0.8%) 242,805 -
RISK MANAGEMENT
Non-performing loans (NPL) 14,005 8,601 5,404 14,077 (72)
Non-performing loans (NPL), excluding the Bankia integration 8,578 8,601 (23) 8,650 -
Non-performing loan ratio 3.6% 3.3% 0.3 3.6% 0.0
Provisions for insolvency risk 9,001 5,755 3,246 9,415 (414)
Provisions for insolvency risk, excluding the Bankia integration 5,383 5,755 (372) 5,797 -
NPL coverage ratio 64% 67% (3) 67% (3)
Net foreclosed available for sale real estate assets 2,297 930 1,367 2,267 30
Foreclosed available for sale real estate assets, ex.Bankia integration 1,114 930 184 1,084 -
LIQUIDITY
Total Liquid Assets 162,731 114,451 48,280 147,146 15,585
Liquidity Coverage Ratio (last 12 months) 292% 248% 44 273% 19
Net Stable Funding Ratio (NSFR) 148% 145% 3 146% 2
Loan to deposits 94% 97% (3) 97% (3)
CAPITAL ADEQUACY
Common Equity Tier 1 (CET1) 12.9% 13.6% (0.7) 14.1% (1.2)
Tier 1 14.8% 15.7% (0.9) 16.2% (1.4)
Total capital 17.4% 18.1% (0.7) 19.0% (1.6)
MREL 25.1% 26.3% (1.2) 26.3% (1.2)
Risk-Weighted Assets (RWAs)2 220,660 144,073 76,587 208,585 12,075
Leverage ratio 5.1% 5.6% (0.5) 5.4% (0.3)
SHARE INFORMATION3
Share price (€/share) 2.594 2.101 0.493 2.639 (0.045)
Market capitalisation 20,890 12,558 8,332 21,259 (369)
Book value per share (€/share) 4.29 4.22 0.06 4.41 (0.12)
Tangible book value per share (€/share) 3.66 3.49 0.16 3.78 (0.12)
Net income (ex M&A impacts) attributable per share (€/share) (12 months) 0.34 0.21 0.13 0.28 0.06
PER (Price/Profit, ex M&A impacts; times) 7.63 10.14 (2.52) 9.43 (1.80)
Tangible PBV (Market value/ book value of tangible assets) 0.71 0.60 0.11 0.70 0.01
OTHER DATA (units)
Employees4 51,071 35,434 15,637 51,227 (156)
Branches4 6,160 4,208 1,952 6,298 (138)
Of which: retail branches in Spain 5,433 3,571 1,862 5,552 (119)
ATMs4 15,285 10,283 5,002 15,372 (87)
(1) These ratios do not include in the numerator the results generated by Bankia before 31 March 2021, which is the recognition date of the
merger for accounting purposes or, for consistency purposes, the contribution of the incorporated RWAs or balance items in the
denominator. They neither consider the extraordinary impacts associated with the merger.
(2) At 31 March 2021, € 66,165 million have been integrated from Bankia.
(3) See the methodology used in the calculation and breakdown in ‘The CaixaBank share’ and ‘Appendices’.
(4) At 31 March 2021, 15,911 employees, 2,101 branches (of which 2,013 retail) and 5,156 ATMs have been integrated from Bankia. Does
not include branches outside Spain and Portugal or representative offices.
Key Group figures

Business activity and results: January – June 2021| 5
Key information
The merger between CaixaBank and Bankia was materialised in the first quarter of 2021, consolidating
CaixaBank's leadership in the Spanish financial system.
Following this operation, the CaixaBank Group exceeds €670,000 million in assets and serves over 21 million
customers through a network of more than 6,000 branches in Spain and Portugal.
CaixaBank's vision is to be a leading and innovative financial group with the best customer service, while
making it a benchmark for socially responsible banking.
Euromoney has acknowledged CaixaBank as the “Best Bank in Spain 2021”. Furthermore, CaixaBank has
been named “Best Bank in Spain” for the seventh consecutive year and “Best Bank in Western Europe” for
the third time, at the Best Bank Awards handed out each year by the magazine Global Finance, for its social
responsibility, financial robustness and leadership position following the merger with Bankia.
Customer experience
With a customer base of 19.1 million in Spain, CaixaBank provides a unique omnichannel distribution
platform with multi-product capabilities that continuously evolves to anticipate customer needs and
preferences.
Our service vocation helps us establish solid market shares1, which have been reinforced with the
integration of Bankia:
Loans to individuals and
business Consumer lending
Deposits by individuals and
business Investment funds Pension plans Long-term saving Card turnover
24.9% 22.5% 25.1% 24.9% 33.7% 29.3% 33.4%
BPI boasts a customer base of over 1.9 million clients in Portugal, with a market share2 of 10.8% in lending
activity and 11.3% in customer funds.
In 2021, BPI was acknowledged with the “Five Stars Award” in the category of Major Banks and in the
category of Conta Ordenado for its customer satisfaction and acknowledgement and the simplicity of
Cuenta Valor, which is exempt from fees and offers free cards and transfers in digital channels. In addition,
it has been selected “Brand of Confidence” in the banking sector for the eighth consecutive year by the
magazine Selecções do Reader's Digest, improving its performance in all evaluated attributes: service
quality, cost-benefit ratio and customer service.
Digital transformation
CaixaBank continues to strengthen its leadership of the digital banking market, with a proportion of digital
customers3 of 70.6%, maintaining a firm commitment towards digital transformation and supporting
innovative companies with a potential for growth.
CaixaBank was named “Most innovative bank in Western Europe 2021” by the magazine Global Finance.
The magazine PWM (Financial Times Group) has acknowledged CaixaBank as “Best Private Bank in Europe
in Big Data Analysis and Artificial Intelligence 2021” for its digital transformation strategy and continuous
innovation.
Our Bank
(1) Latest available information. Market shares in Spain. Proforma calculated internally by aggregating CaixaBank and Bankia market shares. Source: Bank of Spain, Social Security, INVERCO, ICEA and Sistemas de tarjeta y medios de pago. Lending and deposits market share corresponding to the resident private sector.
(2) Latest available information. Data prepared in-house (includes deposits, investment funds, capitalisation insurance, PPRs and OTRVs). Source: Banco de Portugal, APS,
APFIPP.
(3) Private individual customers between 20-74, with at least one access to CaixaBank and/or Bankia digital banking in the last 12 months.

Business activity and results: January – June 2021| 6
People-centric culture
CaixaBank is included in the Bloomberg Gender-Equality Index, which acknowledges the companies that
are most committed to gender equality, through their policies, and transparency in disseminating their
gender-related programmes and data.
In 2021, Bloomberg position CaixaBank as the world's leading company in gender equality.
Responsible management and social commitment
The CaixaBank Group is firmly committed to being a key figure in helping alleviate the effects caused by
the Covid-19 health crisis by providing all its human, technological and financial resources in granting loans,
as well as other actions to help families, companies and society as a whole. This led the magazine Global
Finance to highlight in 2021 its “Successful strategy as a liquidity provider during the pandemic in Western
Europe 2021”.
CaixaBank, through its subsidiaries VidaCaixa and CaixaBank Asset Management, has become the first bank
in Spain to receive AENOR's Sustainable Finances certification under ESG criteria (Environmental, Social
and Governance) for financial asset managers.
CaixaBank issued in the second quarter of 2021 a new social bond for €1,000 million linked to the SDGs
aimed at financing education and anti-poverty projects. In addition, its inaugural green bond was named
“Green Bond of the Year 2021” by the magazine Environmental Finance.
Within the environmental scope, the Carbon Disclosure Project includes CaixaBank on its A- list of leading
companies fighting climate change. CaixaBank is carbon neutral since 2018.
CaixaBank is included in the UN Collective Commitment for Climate Action.
In 2021 CaixaBank joined, as a founding member, the Net Zero Banking Alliance, an initiative that promotes
zero net emission by 2050. Joining this initiative strengthens the Bank's commitment to sustainability,
positioning CaixaBank as one of the most renowned in the sector, in line with our stakeholder’s
expectations.
Additionally, BPI was rewarded Jornal de Negócios' “National Sustainability Award 2021” in the Equality
and Diversity category.
CaixaBank and Bankia merger
On 17 September 2020, the Board of Directors of CaixaBank and Bankia entered a Shared Merger Project
involving the takeover merger of Bankia (absorbed company) by CaixaBank (absorbent company).
This Shared Merger Project was approved by the General Shareholders' Meetings of CaixaBank and Bankia,
which were held at the beginning of December 2020, agreeing the following:
- The takeover merger of Bankia (absorbed company) by CaixaBank (absorbent company), entailing the
extinction of the former, via dissolution without liquidation, and the transfer of the entirety of its assets
to CaixaBank, which acquires the rights and obligations of Bankia through universal succession.
- The Merger exchange ratio is set at 0.6845 shares of CaixaBank, with a nominal value of one euro each,
for each share of Bankia, with a nominal value of one euro each (hereinafter, the "Exchange Ratio").
- CaixaBank will cover the Exchange Ratio by means of newly issued shares.
Effective control was set for 23 March 2021, once all conditions precedent were met.
Considering Bankia's share capital at this date, the Exchange Ratio and the closing price of the CaixaBank share
at such date, the total value of the capital increase and, accordingly, the cost of acquisition of the business
Relevant issues

Business activity and results: January – June 2021| 7
combination amounted to €5,314 million (the par value of the newly issued shares was €2,079 million and
the increase of issue premium was €3,235 million).
The assets, liabilities and contingent liabilities of the acquiree were measured in the Purchase Price Allocation
(PPA) process, establishing their fair value, and the corresponding deferred tax asset or liability was
recognised, where applicable. The adjustments totalled a net amount of €-3,474 million (€-4,029 million,
gross).
The Group recognised a positive amount equivalent to the negative difference arising on consolidation of
€4,300 million under Gains/(losses) on disposal of assets and others of the consolidated income statement
(before and after tax), the calculation of which is detailed below:
Bankia Group equity at 31 Mar. 2021 (a) 13,088
Fair value adjustments and other1, net (b) (3,474)
Acquisition price (c) 5,314
Negative consolidation difference (a+b-c) 4,300
The recognition date for accounting purposes is 31 March 2021. Therefore, the financial statements included
Bankia's assets and liabilities on that date at fair value. As of the second quarter, the results generated by
Bankia are included in the various lines of CaixaBank's income statement.
Labour agreement
On 1 July 2021, CaixaBank reached an agreement with union representatives representing a broad majority
of employees to execute a restructuring process affecting 6,452 employees.
The income statement for the first half of 2021 includes the recognition of €1,884 million (€1,319 million, net)
associated with the estimate of this agreement's cost, representing an impact on capital of -83 basis points
on the CET1 ratio at 30 June 2021.
Agreement to sell Bankia business lines
CaixaBank has agreed to sell certain lines of business directly pursued by Bankia to the following investees:
• Sale of the acquiring business (POS) to Comercia Global Payments EP, SL (“CGP”) for €260 million. Global
Payments Inc and CABK hold an 80% and 20% stake, respectively, in CGP.
• Sale of the prepaid card business to Global Payments MoneytoPay, EDE, SL (“MTP”) for €17 million. Global
Payments Inc and CABK hold a 51% and 49% stake, respectively, in MTP.
The execution of the aforementioned operations, which are independent of each other, is subject to the
relevant authorisations. These include CaixaBank's authorisation from the Ministry of Economic Affairs and
Digital Transformation for each of the operations and the authorisation from the Securities and Exchange
Commission for the purchase of the acquiring business by CGP.
The above-mentioned operations will generate a consolidated net gain of €187 million, with an impact on
CET1 of +11 basis points, based on the ratio at 30 June 2021.
The operations are expected to be completed in the fourth quarter of 2021.
(1) See details of the adjustments in ‘Appendices’.

Business activity and results: January – June 2021| 8
Attractive return and solid financials
Results and business activity
Attributable profit in the first half of 2021 reached €4,181 million, after including the one-off impacts
related to the merger with Bankia.
The result in the first half of the year stands at €1,278 million without considering the extraordinary
aspects related to the merger (negative consolidation difference for €4,300 million and extraordinary
expenses and charges to provisions for €-1,397 million, both net of tax). The result in the same period of
2020 was €205 million, impacted by the provisions made to anticipate future impacts associated with Covid-
19.
The comparative proforma result in the first half of 2021 amounted to €1,343 million versus €347 million
in the same period of 2020, impacted by the provisions associated with Covid-19 (Bankia's result before
the merger is included in both years . Extraordinary aspects related to the merger have been stripped out).
Total loans and advances to customers, gross stands at €363,012 million, up 48.8% in the first half of 2021
(-0.8% ex Bankia).
Customer funds increased by 44.7% in the first half of the year (+6.0% ex Bankia).
Risk management
The NPL ratio stands at 3.6% and the coverage ratio at 64% (3.3% and 67%, respectively at 2020 year-end).
The cost of risk (last 12 months) came to 0.31%.
Liquidity management
Total liquid assets amounted to €162,731 million, up €48,280 million in the half, mainly due to the
integration of Bankia.
The Group's Liquidity Coverage Ratio (LCR) was 333% at 30 June 2021, showing an ample liquidity position
(292% LCR average last 12 months) well clear of the minimum requirement of 100%.
Capital management
The Common Equity Tier 1 (CET1) ratio stands at 12.9%.
The first quarter includes the one-off impact of Bankia's integration for +77 basis points and -89 basis points
from the effect of the Purchase Price Allocation (PPA), and the second quarter is affected by -87 basis points
from restructuring costs (of which -83 correspond to the labour integration agreement) and -71 points from
regulatory impacts.
The organic change in the first half of 2021 was of +64 basis points and +45 basis points caused by the
performance of the markets and other. The impact of IFRS 9 phase in was of -16 basis points.
The CET1 ratio without applying the IFRS 9 transitional period stands at 12.5%.
The Tier 1 ratio reaches 14.8%, the Total Capital ratio 17.4% and the leverage ratio 5.1%.
The MREL ratio stood at 25.1% on RWAs, meeting the level required for 2024.
Business activity and results: January – June 2021| 9
Dividend policy
As regards the dividend policy, and following the European Central Bank's announcement on 23 July 2021 of
not extending its recommendation on dividend distributions beyond September 2021, the Board of Directors
approved on 29 July 2021 the Dividend Policy for 2021, establishing the distribution of a cash dividend of 50%
of the consolidated net profit adjusted by the extraordinary impacts from the merger with Bankia in a single
payout in 2022.

Business activity and results: January – June 2021| 10
Macroeconomic trends
and state of the financial markets
During the first quarter of 2021, the growth data revealed that the global economy is entering an unequal
expansion phase as a consequence of the countries implementing different measures to control the pandemic
and showing an uneven vaccination rate among them, as well as due to the existing gap between the
economic structure and the implemented stimulus
measures. Thus, whereas China has already surpassed its
pre-pandemic level by 7% and continues to grow (+0.6%
quarter on quarter in the first quarter of 2021) and the
United States is following an upward trend that will lead it
to exceed its pre-pandemic levels in the coming months,
with an accelerating growth reaching a solid 1.6% quarter
on quarter (slightly below 1% in the fourth quarter 2019),
the eurozone's economy declined 0.3% quarter on quarter.
However, the most recent indicators obtained in the
second quarter suggest that those countries that are most
advanced in the post-Covid expansion phase will maintain
their positive momentum and those lagging, specifically
the advanced European economies, will return to
economic growth. A significant acceleration in the pace of
activity is expected in the second half of 2021 aided by a
further fiscal stimulus, maintaining highly accommodative financial conditions and a progress in vaccination
campaigns. As a whole, worldwide growth is estimated approximately at 6% for 2021, following the sharp fall
of 3.3% in 2020.
In this context, the risk balance is less unfavourable than in the past and is changing rapidly. The main
downside risks to economic growth in 2021 will continue stemming from the development of the health
situation. Specifically, concerns arise on the possible emergence of new mutations against which current
vaccines would be less effective. A more novel concern is the risk that the economy might overheat, especially
in the United States. This risk is there, and its likelihood of occurrence has increased. Therefore, in spite of
the rise of US inflation having a significant transitional component and the labour market still taking time to
recover completely, the Federal Reserve toughened its tone in the meeting it held in June and stated that it
will raise rates in 2023 (previously not planned until 2024). With regard to the upside risks, a greater impact
than expected from the fiscal stimulus packages (e.g. thanks to a higher degree of international coordination
than in the past) or a further mobilisation of accumulated savings are most likely to take place.
In the eurozone, following a decline in activity in the first quarter of 2021, 0.3% quarter on quarter, the latest
data suggest that the growth in the second quarter will be higher than 1% quarter on quarter. The fall in the
first quarter was mainly due to the extension of the restrictions to address the pandemic's winter wave.
However, herd immunity in risk groups significantly advanced in the second quarter, as it also generally has
in the rest of the European population in recent months. This positive evolution was reflected in the ease of
the pressure on the health system, and it has led to a significant loosening of the social lockdown measures.
Global economic outlook
GDP1 , main economiesAnnual change (%)
(15.0)
(10.0)
(5.0)
-
5.0
10.0
World
economy
United
States
Eurozone Spain Portugal China
2020 2021
Economic scenario - Europe, Spain and Portugal
(1) CaixaBank Research forecasts for 2021.

Business activity and results: January – June 2021| 11
Inflation has also risen significantly in this scenario of economic recovery, albeit in Europe this spike is mainly
due to idiosyncratic factors (calendar effects, new weightings in the basket of prices, readjustments in the
German VAT, rebound in oil prices), which will continue causing volatility throughout 2021 and will probably
take inflation temporarily above 2.5%. This volatility will wane gradually and should not condition the ECB's
actions, which will continue maintaining the accommodative financial conditions without requiring any
additional measures thanks to the higher rate of asset purchases in March.
We expect the recovery to pick up in the second half of the year and to bring overall net growth for 2021
above 4%. The following are the main factors behind this recovery: i) the progress made in the vaccination
campaigns; ii) maintaining the aforementioned accommodating financial environment; iii) the mobilisation of
the savings accumulated during the months of lockdown; and iv) the first disbursements made within the
framework of Next Generation EU (NGEU) programme.
The indicators available to date suggest that the Spanish economy could follow a momentum similar to that
of Europe, but with further intensity. Thus, following the fall in GDP of 0.4% quarter on quarter in the first
quarter of 2021, the indicators available to date reveal that the Spanish economy experienced a significant
expansion of economic activity in the second quarter. In this context, the good performance of the job and
consumer markets stands out, suggesting that the quarter-on-quarter rise of GDP might exceed 2.0% in this
quarter.
This scenario remains closely linked to the aforementioned shared European drivers of growth. Spain will
additionally experience a positive impact from the partial recovery of the expected tourist flows. In spite of
the rise in Covid infections during the months of June and July possibly posing a threat to the recovery of
tourism in the third quarter of 2021, the positive performance of consumption and the swift implementation
of the NGEU programme will help the GDP growth rate remain at relatively high levels in the coming quarters.
Therefore, we expect the GDP to grow around 6.0% in 2021, and somewhat higher and slightly above 6.0% in
2022.
In Portugal, the acerbity of the third wave of infections forced the implementation of much more severe
containment measures than those implemented in Spain, which resulted in a sharp fall in growth in the first
quarter of 2021, 3.3% quarter on quarter. All in all, data in the second quarter show a dynamic recovery of
activity, and the growth rate in 2021 is likely to be around 4%. The factors involved in the Portuguese recovery
are similar to those in the Spanish economy, that is, the vaccination, the release of stagnant demand, the
continuation of accommodative financial conditions, the recovery of tourism and the initial disbursement of
the NGEU fund.
In the year to date, financial asset prices have been adjusting to what has been called a reflation scenario,
that is, the expectation that global economic activity will enjoy a sustained revival and that inflation will leave
its weakness behind and become more buoyant, both backed by the recent fiscal and monetary stimuli. Thus,
on the one hand, optimism about economic growth has driven up stocks and other risk assets, such as raw
materials, whereas on the other hand, expectations of higher inflation have led to a rise in market interest
rates in the long tranches of the curves. In the stock markets this readjustment favoured the sectors most
sensitive to the economic cycle, which pushed up the major stock market indices.
Initially, the major central banks did not appear to be concerned about the rise in market interest rates, noting
that the movement reflects an improvement in the economic outlook. However, when rates also began to be
stressed in real terms and doubts on the more or less temporary nature of the current inflationary episode
slightly increased, the central banks reaffirmed their commitment towards maintaining an accommodating
financial environment. The main central banks, particularly the ECB for the eurozone, forecast that the
tightening of prices will be temporary. All in all, as previously mentioned, the Federal Reserve has toughened
its tone, and normalisation is expected earlier than initially anticipated.
State of the financial markets

Business activity and results: January – June 2021| 12
Income statement
For accounting purposes, the reference date taken for the merger is 31 March 2021, after which the results
generated by Bankia are included in the various items in CaixaBank's income statement, affecting the
comparability of its performance. In addition, the results generated in the first half of 2021 include
extraordinary income related to the merger.
Year-on-year performance
Attributable profit for the first half of 2021 amounts to €4,181 million.
The result in the first half stands at €1,278 million, stripping out the extraordinary expenses related to the
merger (negative consolidation difference for €4,300 million and extraordinary expenses and charges to
provisions for €-1,397 million, both net of taxes). In the same half of 2020 the result was €205 million,
impacted by the provisions made to anticipate future impacts associated with Covid-19.
1H21 M&A
one offs (1)
1H21 ex M&A
1H20 Change Change % € million
Net interest income 2,827 2,827 2,425 402 16.6
Dividend income 152 152 94 58 61.3 Share of profit/(loss) of entities accounted for using the equity method 205 205 97 109 112.2
Net fee and commission income 1,640 1,640 1,266 374 29.5
Trading income 80 80 142 (62) (43.8)
Income and expense under insurance or reinsurance contracts 318 318 292 26 9.0
Other operating income and expense (339) (339) (199) (140) 70.5
Gross income 4,883 4,883 4,117 766 18.6
Recurring administrative expenses, depreciation and amortisation (2,747) (2,747) (2,345) (402) 17.1
Extraordinary expenses (1,970) (1,969) (1) (1)
Pre-impairment income 166 (1,969) 2,135 1,772 363 20.5
Pre-impairment income stripping out extraordinary expenses 2,136 2,136 1,772 364 20.5
Allowances for insolvency risk (328) (328) (1,334) 1,006 (75.4)
Other charges to provisions (155) (26) (129) (184) 55 (30.0)
Gains/(losses) on disposal of assets and others 4,284 4,300 (16) (49) 34 (68.2)
Profit/(loss) before tax 3,966 2,304 1,662 204 1,458
Income tax expense 214 599 (384) (1) (384)
Profit/(loss) after tax 4,180 2,903 1,277 203 1,074
Profit/(loss) attributable to minority interest and others (0) (0) (1) 1 (79.7)
Profit/(loss) attributable to the Group 4,181 2,903 1,278 205 1,073
(1) Breakdown of extraordinary impacts associated with the merger:
• Extraordinary expenses €-1,969 million: estimated cost of the labour agreement (€-1.884 million) and other integration expenses (€-85
million).
• Other charges to provisions €-26 million: restructuring costs associated with commitments already assumed with providers.
• Gains/(losses) on disposal of assets €+4,300 million: negative consolidation difference.
Core income 1H21 1H20 Change Change %
Net interest income 2,827 2,425 402 16.6
Income from Bancassurance equity investments 115 82 33 40.5
Net fee and commission income 1,640 1,266 374 29.5
Income and expenses under insurance or reinsurance contracts 318 292 26 9.0
Total core income 4,899 4,064 835 20.6

Business activity and results: January – June 2021| 13
Core income stands at €4,899 million (+20.6%), after the integration of Bankia, which mainly impacts the Net
interest income and Fee and commission income as of the second quarter of 2021:
- Net interest income came to €2,827 million, up 16.6% with respect to the same period of the previous
year. The customer spread reached 1.74% and the balance spread sheet 1.01% in the half year.
- Fee and commission income grew 29.5% to €1,640 million.
- Income from Bancassurance equity investments amounted to €115 million, up 40.5%, and includes the
improved performance in 2021 and the incorporation of insurance investees of Bankia.
- Income and expenses under insurance or reinsurance contracts reached €318 million in the half year, up
9.0% on the previous year as a result of the increase of commercial activity.
Dividend income, which mainly included dividends from Telefónica and BFA, totalled €152 million in the first
half of 2021. The 61.3% increase with respect to the same period of 2020 is mainly due to income associated
with an extraordinary dividend from BFA for €54.5 million.
Share of profit/(loss) of entities accounted for using the equity method amounted to €205 million, up 112.2%
with respect to the same period of the previous year as a result of the higher results attributed in a context
of improvement in the economic outlook.
Trading income stands at €80 million. In 2020 it included, among others, the materialisation of unrealised
gains from fixed-income assets.
Other operating income and expense includes, among other items, income and expenses of non-real estate
subsidiaries, income from rentals and expenses incurred in managing foreclosed properties and contributions,
levies and taxes. In its performance stands out, among others, the higher contribution to the Single Resolution
Fund1 for €181 million in the second quarter of 2021 versus the €111 million made in the previous year,
reflecting the further contribution made by the company arising from the merger.
Gross income €4,883 million, up 18.6%, whereas Recurring administrative expenses, depreciation and
amortisation increased by 17.1% (€-2,747 million), resulting in a recurring cost-to-income ratio of 54.3%
versus 56.9% in the same period of the previous year.
Extraordinary expenses (€-1,970 million) include €-1,884 million, gross, associated with the cost of the labour
agreement and €-85 million with other expenses incurred in the integration process.
Allowances for insolvency risk reached €-328 million, down 75.4% with respect to the first half of 2020, which
includes the increased provisions for credit risk made to anticipate future impacts associated with Covid-19
(€-1,155 million).
The cost of risk (last 12 months) came to 0.31%.
Other charges to provisions include in 2020 the recognition of €-109 million in connection with early
retirements. In 2021 it includes €-26 million from a provision linked to the estimated restructuring costs
associated with the commitments already assumed with providers within the framework of the integration.
Gains/losses on disposal of assets and others is impacted mainly by the recognition in the first quarter of
2021 of the negative consolidation difference for an amount of €4,300 million.
In addition, see "Appendices - Breakdown of the performance of the income statement by item".
(1) Including BPI's contribution to the Portuguese Resolution Fund of €8.5 million.

Business activity and results: January – June 2021| 14
Quarterly performance
2Q21 1Q21 2Q20
2Q21 M&A
one offs 2Q21
ex M&A 1Q21
M&A one offs
1Q21 ex M&A
Change % 2Q20 Change %€ million
Net interest income 1,636 1,636 1,191 1,191 37.4 1,225 33.6
Dividend income 151 151 93 62.9
Share of profit/(loss) of entities accounted for using the equity method
129 129 77 77 67.4 41
Net fee and commission income 981 981 659 659 48.9 608 61.3
Trading income 38 38 42 42 (9.6) 162 (76.5)
Income and expense under insurance or reinsurance contracts
154 154 164 164 (6.4) 141 8.6
Other operating income and expense (268) (268) (70) (70) (136) 96.8
Gross income 2,820 2,820 2,063 2,063 36.7 2,134 32.2
Recurring administrative expenses, depreciation and amortisation
(1,598) (1,598) (1,149) (1,149) 39.1 (1,157) 38.1
Extraordinary expenses (1,930) (1,929) (1) (40) (40)
Pre-impairment income (708) (1,929) 1,221 874 (40) 914 (18133.6 976 (18125.1
Pre-impairment income stripping out extraordinary expenses
1,222 1,222 914 914 33.7 976 25.2
Allowances for insolvency risk (155) (155) (174) (174) (11.0) (819) (81.1)
Other charges to provisions (106) (26) (80) (49) (49) 63.4 (41) 1696.3
Gains/(losses) on disposal of assets and others (18) (18) 4,303 4,300 3 (1 (19) (1.2)
Profit/(loss) before tax (987) (1,955) 968 4,954 4,260 694 39.5 98
Income tax expense 382 587 (204) (168) 12 (180) 13.4 15
Profit/(loss) after tax (605) (1,369) 763 4,785 4,272 513 (1148.9 113
Profit/(loss) attributable to minority interest and others
(0) (0) (26.9) (2) (93.4)
Profit/(loss) attributable to the Group (605) (1,369) 764 4,786 4,272 514 (448.6 115
Core income 2Q21 1Q21 Change % 2Q20 Change %
Net interest income 1,636 1,191 37.4 1,225 33.6
Income from Bancassurance equity investments 63 52 20.4 44 41.7
Net fee and commission income 981 659 48.9 608 61.3
Income and expense under insurance or reinsurance contracts 154 164 (6.4) 141 8.6
Total core income 2,833 2,066 37.1 2,019 40.3

Business activity and results: January – June 2021| 15
Comparative proforma income statement
Below is the comparative proforma income statement, which is presented with the aim of providing
information on the performance of the merged entity's results. It has been drawn up by adding, in both years,
the result generated by Bankia before the merger to the result obtained by CaixaBank, without considering
the extraordinary aspects related thereto.
Year-on-year performance
The Comparative proforma Profit/(loss) in the first half stands at €1,343 million. In the same period of 2020
it reached €347 million, impacted by the provisions made to anticipate future impacts associated with Covid-
19.
1H21 1H20 Change Change % € million
Net interest income 3,275 3,352 (78) (2.3)
Dividend income 152 95 57 60.7
Share of profit/(loss) of entities accounted for using the equity method 217 121 96 79.0
Net fee and commission income 1,922 1,822 100 5.5
Trading income 90 285 (195) (68.4)
Income and expense under insurance or reinsurance contracts 318 292 26 9.0
Other operating income and expense (380) (339) (41) 12.2
Gross income 5,593 5,628 (35) (0.6)
Recurring administrative expenses, depreciation and amortisation (3,191) (3,208) 18 (0.6)
Extraordinary expenses (1) (1)
Pre-impairment income 2,402 2,420 (18) (0.8)
Pre-impairment income stripping out extraordinary expenses 2,403 2,420 (17) (0.7)
Allowances for insolvency risk (451) (1,814) 1,363 (75.1)
Other charges to provisions (152) (209) 57 (27.1)
Gains/(losses) on disposal of assets and others (38) (66) 28 (42.1)
Profit/(loss) before tax 1,760 331 1,429
Income tax expense (417) 15 (432)
Profit/(loss) after tax 1,343 346 997
Profit/(loss) attributable to minority interest and others (0) (1) 1 (79.7)
Comparative proforma Profit/(loss)1 1,343 347 996
- Profit/(loss) Bankia stripping out extraordinary expenses, net2 (65) (142) 77
+ M&A impacts, net3 2,903 2,903
Profit/(loss) attributable to the Group (accounting profit/(loss)) 4,181 205 3,976
(1) Bankia's results are added to the proforma income statement using CaixaBank criteria. See additional information in ‘Appendices - Adapting Bankia's financial information using CaixaBank management criteria’.
(2) €65 million, corresponding to the first quarter of 2021 (before materialising the merger), and €142 million corresponding to the first half of 2020, are deducted as Bankia Profit/(loss) stripping out extraordinary expenses, net.
(3) €2,903 million, net are added to the first half of 2021, which results from the negative consolidation difference for €+4,300 million and extraordinary expenses and charges to provisions, net of taxes, for €-1,397 million.
Core income 1H21 1H20 Change Change %
Net interest income 3,275 3,352 (78) (2.3)
Income from Bancassurance equity investments 127 109 17 16.0
Net fee and commission income 1,922 1,822 100 5.5
Income and expense under insurance or reinsurance contracts 318 292 26 9.0
Total core income 5,641 5,575 66 1.2

Business activity and results: January – June 2021| 16
Core income grows 1.2% to reach €5,641 million. Its performance is impacted by the lower Net interest
income (-2.3%), which is compensated by the growth of Fee and commission income (+5.5%), the recovery
of Income from Bancassurance equity investments (+16.0%) and Income and expenses under insurance or
reinsurance contracts (+9.0%).
Despite the increase of core income, dividend income (+60.7%) and income from equity investments (+79.0%),
Gross income dropped 0.6% mainly due to lower Trading income (-68.4%) and higher costs recognised in
Other operating income and expense (+12.2%).
Recurring administrative expenses, depreciation and amortisation slightly drop 0.6%, showing the
management of the cost base and savings associated with the early retirements of 2020. The core cost-to-
income ratio (54.6%) improved by 2.1 percentage points.
The performance of Allowances for insolvency risk (-75.1%) is impacted, among others, by the increased
provisions for credit risk established in the first half of 2020, aimed to anticipate future impacts associated
with Covid-19 (€-1,450 million).
Other charges to provisions included in 2020 the recognition of €-109 million in connection with early
retirements.
Gains/(losses) on disposal of assets and others included, among other items, increased real estate provisions
in 2020.
Quarterly performance
2Q21 1Q21 Change % 2Q20 Change % € million
Net interest income 1,636 1,639 (0.2) 1,691 (3.3)
Dividend income 151 0 93 62.7
Share of profit/(loss) of entities accounted for using the equity method 129 89 45.1 53 143.9
Net fee and commission income 981 941 4.3 896 9.5
Trading income 38 52 (27.2) 233 (83.7)
Income and expense under insurance or reinsurance contracts 154 164 (6.4) 141 8.6
Other operating income and expense (268) (111) 141.5 (237) 13.1
Gross income 2,820 2,774 1.7 2,869 (1.7)
Recurring administrative expenses, depreciation and amortisation (1,598) (1,593) 0.3 (1,574) 1.6
Extraordinary expenses (1)
Pre-impairment income 1,221 1,181 3.4 1,296 (5.8)
Pre-impairment income stripping out extraordinary expenses 1,222 1,181 3.5 1,296 (5.7)
Allowances for insolvency risk (155) (297) (47.9) (1,104) (86.0)
Other charges to provisions (80) (72) 10.6 (51) 56.0
Gains/(losses) on disposal of assets and others (18) (20) (5.3) (16)
Profit/(loss) before tax 968 792 22.2 125
Income tax expense (204) (212) (3.8) 37
Profit/(loss) after tax 763 579 31.9 162
Profit/(loss) attributable to minority interest and others (0) 0 (2)
Comparative proforma Profit/(loss) 764 580 31.7 163
- Profit/(loss) Bankia stripping out extraordinary expenses, net (65) (48)
+ M&A impacts, net (1,369) 4,272
Profit/(loss) attributable to the Group (accounting profit/(loss)) (605) 4,786 115

Business activity and results: January – June 2021| 17
Core income 2Q21 1Q21 Change % 2Q20 Change %
Net interest income 1,636 1,639 (0.2) 1,691 (3.3)
Income from Bancassurance equity investments 63 64 (2.3) 58 7.1
Net fee and commission income 981 941 4.3 896 9.5
Income and expense under insurance or reinsurance contracts 154 164 (6.4) 141 8.6
Total core income 2,833 2,808 0.9 2,787 1.7
Comparative proforma Profit/(loss) in the second quarter of 2021 stands at €764 million versus €580 million
in the previous quarter:
Gross income in the quarter amounted to €2,820 million, up 1.7%:
Core income grew 0.9% thanks to the good performance of Fee and commission income (+4.3%),
compensating the drop in Income from Bancassurance equity investments (-2.3%) and Income and
expenses under insurance or reinsurance contracts (-6.4%). Net interest income remains fairly
stable (-0.2%).
The second quarter includes Dividend income for €151 million from BFA and Telefónica and higher
Share of profit/(loss) of entities accounted for using the equity method, up 45.1%.
Lower Trading income (-27.2%).
The first quarter includes the recognition of the Spanish property tax for €-19 million, and the
second quarter the contribution of €-181 million paid to the Single Resolution Fund (SRF).
Recurring administrative expenses, depreciation and amortisation remained stable (+0.3%).
Lower Allowances for insolvency risk (-47.9%) and a slight increase of Other charges to provisions
(+10.6%).
The change in attributable profit in the second quarter of 2021 (€764 million), when compared to the same
quarter of the previous year (€163 million), was mainly due to the following:
Gross income dropped 1.7% with respect to the same period of the previous year.
Good performance of core income, up 1.7%, and increase in dividend income and income from
equity investments.
Lower contribution of Trading income, which in 2020 included the materialisation of unrealised
gains from fixed-income assets.
Higher Recurring administrative expenses, depreciation and amortisation (+1.6%).
The performance of Allowances for insolvency risk is impacted in the second quarter of 2020 by the
increased provisions associated with Covid-19 (€-940 million).

Business activity and results: January – June 2021| 18
Proforma returns on average total assets1
2Q21 1Q21 4Q20 3Q20 2Q20 %
Interest income 1.25 1.34 1.39 1.38 1.40
Interest expense (0.27) (0.33) (0.34) (0.34) (0.33)
Net interest income 0.98 1.01 1.05 1.04 1.07
Dividend income 0.09 0.00 0.03 0.00 0.06
Share of profit/(loss) of entities accounted for using the equity method 0.07 0.05 0.08 0.08 0.03
Net fee and commission income 0.59 0.58 0.60 0.56 0.57
Trading income 0.02 0.03 0.04 0.02 0.15
Income and expense under insurance or reinsurance contracts 0.09 0.10 0.09 0.09 0.09
Other operating income and expense (0.16) (0.07) (0.21) (0.04) (0.15)
Gross income 1.68 1.70 1.68 1.75 1.82
Recurring administrative expenses, depreciation and amortisation (0.95) (0.97) (0.92) (0.95) (1.00)
Pre-impairment income 0.73 0.73 0.76 0.80 0.82
Allowances for insolvency risk (0.09) (0.18) (0.33) (0.36) (0.70)
Other charges to provisions (0.05) (0.04) (0.04) 0.04 (0.03)
Gains/(losses) on disposal of assets and others (0.01) (0.02) 0.09 (0.05) (0.01)
Profit/(loss) before tax 0.58 0.49 0.48 0.43 0.08
Income tax expense (0.12) (0.13) (0.06) (0.09) 0.02
Profit/(loss) after tax 0.46 0.36 0.42 0.34 0.10
Profit/(loss) attributable to minority interest and others 0.00 0.00 0.00 0.00 0.00
Profit/(loss) attributable to the Group 0.46 0.36 0.42 0.34 0.10
Average total net assets (€ million) 671,368 660,552 668,680 661,993 635,202
(1) Annualised quarterly proforma income/cost to average total assets in the quarter.

Business activity and results: January – June 2021| 19
Net interest income
Net interest income totalled €3,275 million (down 2.3% with
respect to the same period in 2020). In an environment of negative
interest rates, this decrease is due to:
- Lower income from loans due to the interest rate decline,
impacted by the drop of the rate curve, change of structure of
the lending portfolio resulting from the increase of ICO loans and
loans to the public sector, and the lower income from consumer
lending. This rate reduction has been partially compensated by a
higher average volume.
- Lower contribution of the fixed-income portfolio due to lower
volumes and the reduction of the average rate, mainly as a result
of the remeasurement of assets at market value within the framework of the CaixaBank and Bankia
integration.
These effects have been partially compensated by:
- Reduction of costs for financial institutions, aided by the increase
of financing taken from the ECB at better conditions.
- Savings in the costs of institutional financing due to a lower price,
mainly as a result of the revaluation of liabilities at market value
within the framework of the CaixaBank and Bankia integration and
a drop in the curve. The net interest income is also positively
impacted by a lower average volume.
- Lower retail funding costs due to the drop in the rate, which
compensate the higher volumes (increase in demand deposits and
decrease of time deposits).
Net interest income in the quarter declines 0.2% with respect to the previous quarter due to:
- Decline in the income of loans and advances due to a lower
portfolio interest rate, resulting from the negative repricing effect
as a consequence of a drop of the rate curve. A lower average
volume is added to this rate reduction.
- Lower contribution of the fixed-income portfolio due to lower
volumes and the reduction of the average rate, mainly as a result of
the revaluation of assets at market value within the framework of
the CaixaBank and Bankia integration.
These effects have been partially compensated by:
- Savings in the costs of institutional financing due to a lower price,
mainly as a result of the remeasurement of liabilities at market
value within the framework of the CaixaBank and Bankia
integration.
- Lower costs of retail funds associated with a drop in the rate on maturity deposits.
The customer spread fell by 3 basis points in the quarter to 1.67%, in spite of the better performance of the
cost of deposits, due to a reduction in the return on lending activity.
The balance sheet spread is 3 basis points below the previous quarter, reaching 0.98%.
Interest rates(%)
0.050.00
-0.13
-0.23-0.27
-0.30-0.32
-0.33-0.33-0.33 -0.33 -0.32-0.32-0.31
-0.33 -0.42-0.40
-0.37
-0.49-0.54-0.55 -0.54
0.06-0.01
-0.03-0.06
-0.08-0.11
-0.15-0.17-0.19 -0.18-0.17
-0.13 -0.11
-0.19
-0.34
-0.26-0.27
-0.14
-0.41
-0.50 -0.49-0.48
ECB Euribor 3M Euribor 12M
1.82 1.78 1.78 1.70 1.67 1.89 1.69
1.84 1.79 1.79 1.71 1.67 1.91 1.69
0.02 0.01 0.01 0.010.00
0.02 0.00
-6
-4
-2
0
2
4
1 .5 0
2 .5 0
2Q20 3Q20 4Q20 1Q21 2Q21 1H20 1H21
Customer spread Net lending Funding
Customer spread, Group(%)
1.84 1.79 1.79 1.71 1.67 1.91 1.69
-6 0
-5 9
-5 8
-5 7
-5 6
-5 5
-5 4
-5 3
-5 2
-5 1
-5 0
-4 9
-4 8
-4 7
-4 6
-4 5
-4 4
-4 3
-4 2
-4 1
-4 0
-3 9
-3 8
-3 7
-3 6
-3 5
-3 4
-3 3
-3 2
-3 1
-3 0
-2 9
-2 8
-2 7
-2 6
-2 5
-2 4
-2 3
-2 2
-2 1
-2 0
-1 9
-1 8
-1 7
-1 6
-1 5
-1 4
-1 3
-1 2
-1 1
-1 0
-9
-8
-7
-6
-5
-4
-3
-2
-1
0
1
2
3
4
5
6
1.82 1.78 1.78 1.70 1.67 1.89 1.69
-2 .0 0
-1 .0 0
0 .0 0
1 .0 0
2 .0 0
3 .0 0
4 .0 0
5 .0 0
2Q20 3Q20 4Q20 1Q21 2Q21 1H20 1H21
0.02 0.01 0.01 0.01 0.00 0.02 0.00
-5 0
-4 9
-4 8
-4 7
-4 6
-4 5
-4 4
-4 3
-4 2
-4 1
-4 0
-3 9
-3 8
-3 7
-3 6
-3 5
-3 4
-3 3
-3 2
-3 1
-3 0
-2 9
-2 8
-2 7
-2 6
-2 5
-2 4
-2 3
-2 2
-2 1
-2 0
-1 9
-1 8
-1 7
-1 6
-1 5
-1 4
-1 3
-1 2
-1 1
-1 0
-9
-8
-7
-6
-5
-4
-3
-2
-1
0
1
1.07 1.03 1.04 1.01 0.98 1.09 0.99
1.40 1.37 1.37 1.34 1.25 1.44 1.29
0.33 0.34 0.33 0.33 0.27 0.35 0.30
-2 .5 0
-0 .5 0
1 .5 0
0 .0 0
1 .0 0
2 .0 0
2Q20 3Q20 4Q20 1Q21 2Q21 1H20 1H21
Balance sheet spread Total net assets Total funds
1.07 1.03 1.04 1.01 0.98 1.09 0.99
0 .0 0
1 .0 0
2 .0 0
2Q20 3Q20 4Q20 1Q21 2Q21 1H20 1H21
0.33 0.34 0.33 0.33 0.27 0.35 0.30
-5 0 .0 0
-4 9 .0 0
-4 8 .0 0
-4 7 .0 0
-4 6 .0 0
-4 5 .0 0
-4 4 .0 0
-4 3 .0 0
-4 2 .0 0
-4 1 .0 0
-4 0 .0 0
-3 9 .0 0
-3 8 .0 0
-3 7 .0 0
-3 6 .0 0
-3 5 .0 0
-3 4 .0 0
-3 3 .0 0
-3 2 .0 0
-3 1 .0 0
-3 0 .0 0
-2 9 .0 0
-2 8 .0 0
-2 7 .0 0
-2 6 .0 0
-2 5 .0 0
-2 4 .0 0
-2 3 .0 0
-2 2 .0 0
-2 1 .0 0
-2 0 .0 0
-1 9 .0 0
-1 8 .0 0
-1 7 .0 0
-1 6 .0 0
-1 5 .0 0
-1 4 .0 0
-1 3 .0 0
-1 2 .0 0
-1 1 .0 0
-1 0 .0 0
-9 .0 0
-8 .0 0
-7 .0 0
-6 .0 0
-5 .0 0
-4 .0 0
-3 .0 0
-2 .0 0
-1 .0 0
0 .0 0
1 .0 0
2 .0 0
Balance sheet spread on average total assets, Group(%)
1.40 1.37 1.37 1.34 1.25 1.44 1.29
-8 0 .0 0
-7 9 .0 0
-7 8 .0 0
-7 7 .0 0
-7 6 .0 0
-7 5 .0 0
-7 4 .0 0
-7 3 .0 0
-7 2 .0 0
-7 1 .0 0
-7 0 .0 0
-6 9 .0 0
-6 8 .0 0
-6 7 .0 0
-6 6 .0 0
-6 5 .0 0
-6 4 .0 0
-6 3 .0 0
-6 2 .0 0
-6 1 .0 0
-6 0 .0 0
-5 9 .0 0
-5 8 .0 0
-5 7 .0 0
-5 6 .0 0
-5 5 .0 0
-5 4 .0 0
-5 3 .0 0
-5 2 .0 0
-5 1 .0 0
-5 0 .0 0
-4 9 .0 0
-4 8 .0 0
-4 7 .0 0
-4 6 .0 0
-4 5 .0 0
-4 4 .0 0
-4 3 .0 0
-4 2 .0 0
-4 1 .0 0
-4 0 .0 0
-3 9 .0 0
-3 8 .0 0
-3 7 .0 0
-3 6 .0 0
-3 5 .0 0
-3 4 .0 0
-3 3 .0 0
-3 2 .0 0
-3 1 .0 0
-3 0 .0 0
-2 9 .0 0
-2 8 .0 0
-2 7 .0 0
-2 6 .0 0
-2 5 .0 0
-2 4 .0 0
-2 3 .0 0
-2 2 .0 0
-2 1 .0 0
-2 0 .0 0
-1 9 .0 0
-1 8 .0 0
-1 7 .0 0
-1 6 .0 0
-1 5 .0 0
-1 4 .0 0
-1 3 .0 0
-1 2 .0 0
-1 1 .0 0
-1 0 .0 0
-9 .0 0
-8 .0 0
-7 .0 0
-6 .0 0
-5 .0 0
-4 .0 0
-3 .0 0
-2 .0 0
-1 .0 0
0 .0 0
1 .0 0
2 .0 0
3 .0 0
4 .0 0

Business activity and results: January – June 2021| 20
Quarterly cost and income
2Q21 1Q21 4Q20
€ million Average balance
Income or expense Rate %
Average balance
Income or expense Rate %
Average balance
Income or expense Rate %
Financial Institutions 90,624 237 1.05 74,982 213 1.15 78,399 223 1.13
Loans and advances (a) 339,866 1,418 1.67 343,818 1,448 1.71 345,967 1,557 1.79
Debt securities 81,848 49 0.24 86,985 106 0.49 88,763 111 0.50
Other assets with returns 63,497 379 2.40 66,739 413 2.51 67,415 413 2.44
Other assets 95,533 4 - 88,028 2 - 88,136 5 -
Total average assets (b) 671,368 2,087 1.25 660,552 2,182 1.34 668,680 2,309 1.37
Financial Institutions 109,060 (96) 0.35 103,939 (76) 0.30 107,934 (84) 0.31
Retail customer funds (c) 362,009 (2) - 354,718 (6) 0.01 357,931 (5) 0.01
Wholesale marketable debt securities & other 47,690 (35) 0.29 47,226 (87) 0.75 49,332 (95) 0.77
Subordinated liabilities 9,727 (7) 0.30 9,179 (32) 1.41 8,939 (34) 1.49
Other funds with cost 75,907 (297) 1.57 76,773 (328) 1.73 76,547 (323) 1.68
Other funds 66,975 (14) - 68,717 (14) - 67,997 (18) -
Total average funds (d) 671,368 (451) 0.27 660,552 (543) 0.33 668,680 (559) 0.33
Net interest income 1,636 1,639 1,750
Customer spread (%) (a-c) 1.67 1.70 1.78
Balance sheet spread (%) (b-d) 0.98 1.01 1.04
3Q20 2Q20
€ million Average balance
Income or expense Rate %
Average balance
Income or expense Rate %
Financial Institutions 74,146 198 1.06 45,051 118 1.05
Loans and advances (a) 343,973 1,549 1.79 341,282 1,562 1.84
Debt securities 90,447 116 0.51 96,401 131 0.55
Other assets with returns 65,856 410 2.48 64,295 394 2.47
Other assets 87,571 5 - 88,173 6 -
Total average assets (b) 661,993 2,278 1.37 635,202 2,211 1.40
Financial Institutions 108,150 (82) 0.30 92,557 (49) 0.21
Retail customer funds (c) 354,728 (9) 0.01 345,872 (14) 0.02
Wholesale marketable debt securities & other 49,636 (106) 0.85 49,104 (103) 0.85
Subordinated liabilities 8,356 (34) 1.62 8,356 (34) 1.62
Other funds with cost 74,518 (319) 1.70 72,373 (305) 1.69
Other funds 66,604 (14) - 66,939 (15) -
Total average funds (d) 661,993 (564) 0.34 635,202 (520) 0.33
Net interest income 1,714 1,691
Customer spread (%) (a-c) 1.78 1.82
Balance sheet spread (%) (b-d) 1.03 1.07
To help readers interpret the information contained in this report, the following aspects should be taken into account:
According to applicable accounting standards, income resulting from the application of negative interest rates should be reported in the appropriate
income classification. Financial intermediaries on the assets side includes the negative interest on the balances of financial intermediaries held on
the liabilities side, the most significant being income from ECB funding measures (TLTRO and MRO). Conversely, the heading financial intermediaries
on the liabilities side shows the negative interest on the balances of financial intermediaries on the assets side. Only the net amount between income
and expense for both headings has economic significance.
"Other assets with returns" and "Other funds with cost" relate largely to the Group’s life insurance activity.
The balances of all headings except “Other assets” and “Other funds” correspond to balances with returns/cost. “Other assets” and “Other funds”
incorporate balance items that do not have an impact on the Net interest income and on returns and costs that are not assigned to any other item.

Business activity and results: January – June 2021| 21
Fees and commissions
Fee and commission income stand at €1,922 million, which represents a growth of 5.5% on the same period
of 2020. The quarterly performance (+4.3%), up 9.5% with respect to the same quarter of the previous year,
is impacted by the recovery of the commercial activity and the good performance of the financial markets.
- Banking services, securities and other fees includes income on securities transactions, transactions, risk
activities, deposit management, e-payments and wholesale banking.
The year-on-year change in recurring fees and commissions (+2.5%) is mainly due to the higher transaction
fees and commissions, which compensate the lower e-payment activity. The quarterly change (+3.2%) is
impacted by increased e-payment fees, in a quarter with less mobility restrictions (+8.3% with respect to
the same quarter of the previous year).
Fees and commissions from wholesale banking drop in the half year (-16.0%) and when compared to the
same quarter of the previous year (-14.7%) following the lower activity in investment banking. Good
performance with respect to the previous quarter as a result of higher activity (+55.5%).
- Fees and commissions from the sale of insurance products grew when compared to the same period in
2020 (+9.7%) and the same quarter of the previous year (+4.4%), mainly due to the higher commercial
activity in a context of fewer restrictions. With respect to the previous quarter (-13.7%), their performance
is impacted by one-off income recognised in the first quarter of 2021.
- Fees and commissions from managing long-term savings products (investment funds, pension plans and
Unit Link) stand at €640 million, due to managing higher asset volumes following the good performance
of the markets and sales. Growth of 14.3% with respect to the same half of 2020, +4.7% with respect to
the first quarter of 2021 and +20.1% with respect to the same quarter of the previous year:
- Commissions from mutual funds, managed accounts and SICAVs came to €399 million, with a year-
on-year increase of 14.3% and a growth of 5.0% in the quarter (+20.0% with respect to the same
quarter of the previous year).
- Commissions from managing pension plans stand at €150 million, showing a positive performance of
5.9% year-on-year and of 1.5% in the quarter (+10.6% with respect to the same quarter of 2020).
- Unit Link fees and commissions reached €91 million, +32.1% on the same period of 2020 and +9.0%
on the previous quarter (+39.5% with respect to the same quarter of the previous year).
1H21 1H20 Change % 2Q21 1Q21 4Q20 3Q20 2Q20 € million
Banking services, securities and other fees 1,098 1,095 0.3 569 529 574 550 542
Recurring 990 966 2.5 503 488 519 496 464
Wholesale banking 108 129 (16.0) 66 43 55 54 77
Sale of insurance products 183 167 9.7 85 98 89 79 81
Long-term savings products 640 560 14.3 327 312 329 291 273
Mutual funds, managed accounts and SICAVs 399 349 14.3 204 195 196 182 170
Pension plans 150 142 5.9 76 75 89 74 68
Unit Link and other1 91 69 32.1 47 43 44 36 34
Net fee and commission income 1,922 1,822 5.5 981 941 993 921 896
(1) Includes income corresponding to Unit Link and Flexible Investment Life Annuity (the part managed)
.

Business activity and results: January – June 2021| 22
Income from equity investments
The Dividend income (€152 million) includes, in the second quarter of 2021, the dividends from Telefónica
for €51 million and BFA1 for €98 million (€50 million and €40 million, respectively in 2020). With regard to
BFA, it includes an extraordinary dividend for €54.5 million.
Attributable profit of entities accounted for using the equity method (€217 million) recovered as a result
of an improvement of the pandemic situation, up 79.0% with respect to the same half of the previous year
and +45.1% with respect to the first quarter of 2021.
(1) The total dividend approved by BFA net of the tax effect totalled €119 million, of which €79 million are extraordinary dividends charged
to its reserves. Out of the total dividend, gross, €98 million have been recognised as income in the income statement (€43.4 million as
ordinary income and €54.5 million as one-off income) and the rest have been recognised against the cost of the investment, considering
them as reserves generated prior to classifying the investment as "Financial assets at fair value with changes in other comprehensive
income".
1H21 1H20 Change % 2Q21 1Q21 4Q20 3Q20 2Q20 € million
Dividend income 152 95 60.7 151 0 53 2 93
Share of profit/(loss) of entities accounted for using the equity method
217 121 79.0 129 89 115 130 53
Income from equity investments 369 216 71.0 280 89 167 132 146
Trading income
Trading income stands at €90 million at the end of the first half of 2021. Its year-on-year change (-68.4%) is
due mainly to the materialisation of unrealised gains from fixed-income assets in the second quarter of
2020.
1H21 1H20 Change % 2Q21 1Q21 4Q20 3Q20 2Q20 € million
Trading income 90 285 (68.4) 38 52 71 41 233
Income and expense under insurance or reinsurance contracts
The income and expense under insurance or reinsurance contracts stands at €318 million, showing a solid
year-on-year growth of 9.0% (€154 million in the second quarter) and 8.6% with respect to the same quarter
of 2020.
Its change when compared to the previous quarter (-6.4%) is impacted by one-off income in the first quarter,
as well as by increased provisions for claims and higher expenses in the second quarter. The commercial
activity remains at a similar level as the previous quarter.
1H21 1H20 Change % 2Q21 1Q21 4Q20 3Q20 2Q20 € million
Income and expense under insurance or reinsurance contracts
318 292 9.0 154 164 156 150 141

Business activity and results: January – June 2021| 23
Other operating income and expense
Other operating income and expense includes, among other items, income and expenses of non-real estate
subsidiaries, income from rentals and expenses incurred in managing foreclosed properties and
contributions, levies and taxes. With regard to the contributions and levies, its timing generates a seasonal
impact on the quarterly performance under this heading:
- The contribution to the SRF1 of €181 stands out in the second quarter of 2021, higher than the
contribution recognised in the same quarter of the previous year (€171 million).
- Recognition in the first quarter of the contribution to the Portuguese banking sector for €18.8 million
(€15.5 million in 2020).
- Contribution to the Deposit Guarantee Fund (DGF) of €418 million in the fourth quarter.
Other real estate operating income and expense includes in the first quarter an estimation of Spanish
property tax for €19 million (€20 million in 2020).
The line Other includes €135 million in the fourth quarter of 2020 due to the recognition of income
associated with the final earnout of SegurCaixa Adeslas.
1H21 1H20 Change % 2Q21 1Q21 4Q20 3Q20 2Q20 € million
Contributions and levies (200) (187) 7.3 (181) (19) (418) (171) Other real estate operating income and expense (including Spanish property tax in Q1)
(44) (42) 4.2 (14) (29) (14) (8) (17)
Other (136) (110) 23.5 (73) (63) 91 (64) (49)
Other operating income and expense (380) (339) 12.2 (268) (111) (341) (73) (237)
The year-on-year performance of Recurring administrative expenses, depreciation and amortisation
(-0.6%) is a result of the cost base management. Stable personnel expenses (-0.2%), which includes the
savings associated with the early retirements of 2020. General expenses dropped by 2.4% and depreciation
and amortisation increased by 2.3%.
The effort in reducing costs, with a decrease of 0.6%, together with the performance of core income (+1.2%),
has improved the core cost-to-income ratio by 2.1 percentage points.
With respect to the quarterly performance, Recurring administrative expenses, depreciation and
amortisation grew slightly 0.3%.
1H21 1H20 Change % 2Q21 1Q21 4Q20 3Q20 2Q20 € million
Gross income 5,593 5,628 (0.6) 2,820 2,774 2,798 2,885 2,869
Personnel expenses (1,986) (1,991) (0.2) (997) (989) (959) (957) (969)
General expenses (844) (864) (2.4) (423) (421) (402) (430) (432)
Depreciation and amortisation (361) (353) 2.3 (178) (182) (174) (181) (173)
Recurring administrative expenses, depreciation and amortisation
(3,191) (3,208) (0.6) (1,598) (1,593) (1,535) (1,568) (1,574)
Cost-to-income ratio stripping out extraordinary expenses (%) (12 months)
55.8 57.2 (1.4) 55.8 55.4 55.8 57.2 57.2
Core income 5,641 5,575 1.2 2,833 2,808 3,003 2,878 2,787 Recurring administrative expenses, depreciation and amortisation
(3,191) (3,208) (0.6) (1,598) (1,593) (1,535) (1,568) (1,574)
Core cost-to-income ratio (12 months) 54.6 56.7 (2.1) 54.6 54.6 55.1 56.2 56.7
(1) Including BPI's contribution to the Portuguese Resolution Fund of €8.5 million.
Administration expenses, depreciation and amortisation

Business activity and results: January – June 2021| 24
Allowances for insolvency risk amounted to €-451 million, versus €-1,814 million in the first half of 2020,
which included the recognition of €1,450 million made to anticipate future impacts associated with Covid-
19.
Throughout 2020, within the framework of the pandemic, the Group changed the macroeconomic scenarios
and the weighting established for each scenario employed in the estimate of expected loss due to credit
risk. Given the uncertainty in the macroeconomic forecasts regarding its performance in a context of
potential end of the pandemic, the scenarios and weightings in the first half of 2021 to calculate the
provisions under the forward-looking approach required by IFRS 9 have not been altered with respect to
the end of 2020.
The cost of risk (last 12 months) came to 0.41%.
Other charges to provisions shows mainly the coverage of future contingencies and impairment of other
assets.
The year-on-year performance is mainly affected, among others, by the recognition of €109 million
associated with the early retirements in the first quarter of 2020.
1H21 1H20 Change % 2Q21 1Q21 4Q20 3Q20 2Q20 € million
Allowances for insolvency risk (451) (1,814) (75.1) (155) (297) (553) (592) (1,104)
Other charges to provisions (152) (209) (27.1) (80) (72) (64) 59 (51)
Allowances for insolvency risk and other charges to provisions
(604) (2,024) (70.2) (235) (369) (617) (532) (1,155)
Gains/(losses) on disposal of assets and others includes, essentially, the results of completed one-off
transactions and proceeds on asset sales and write-downs.
The real estate results in the first half of 2020 is impacted by, among others, higher provisions for real estate
assets.
The quarterly change in the item Other is affected by one-off income recognised in the fourth quarter of
2020:
- Gains on the partial sale of Comercia (€+420 million).
- Gains on the sale of the depository business of Bankia to Cecabank (€+155 million).
- A provision, with conservative criteria, associated with the Erste Group Bank as a result of the impact
of Covid-19 on the economic context and the extended scenario of low interest rates (€-311 million).
1H21 1H20 Change % 2Q21 1Q21 4Q20 3Q20 2Q20 € million
Real estate results (3) (46) (93.6) (5) 2 (99) (46) (18)
Other (35) (20) 76.4 (13) (22) 243 (33) 2
Gains/(losses) on disposal of assets and others (38) (66) (42.1) (18) (20) 145 (79) (16)
Allowances for insolvency risk and other charges to provisions
Gains/(losses) on disposal of assets and others

Business activity and results: January – June 2021| 25
Business Activity
The Group's total assets reached €674,088 million on 30 June 2021, up 1.6% in the quarter. Excluding the
balances transferred from Bankia as a result of the business combination, the organic change was +4.1% in
the year.
30 Jun. 2021
31 Mar. 2021 Change %31 Dec.
2020 Change %
Organic change % € million
- Cash and cash balances at central banks and other demand deposits 94,326 81,823 15.3 51,611 82.8 59.3
- Financial assets held for trading 11,813 12,440 (5.0) 6,357 85.8 (8.1)
- Financial assets not designated for trading compulsorily measured at fair value through profit or loss
255 339 (24.9) 317 (19.7) (24.1)
Equity instruments 172 183 (5.9) 180 (4.3) (6.0)
Debt securities 5 59 (91.4) 52 (90.2) (90.2)
Loans and advances 77 97 (20.0) 85 (9.1) (22.0)
- Financial assets at fair value with changes in other comprehensive income 17,520 22,386 (21.7) 19,309 (9.3) (60.0)
- Financial assets at amortised cost 428,151 426,168 0.5 267,509 60.1 0.4
Credit institutions 7,703 9,085 (15.2) 5,851 31.7 (32.3)
Customers 355,132 354,473 0.2 236,988 49.9 (0.2)
Debt securities 65,315 62,610 4.3 24,670 #VALUE! 14.8
- Derivatives - Hedge accounting 1,129 1,214 (7.0) 515 #VALUE! (65.7)
- Investments in joint ventures and associates 4,160 4,104 1.3 3,443 20.8 2.0
- Assets under the insurance business1 75,645 75,534 0.1 77,241 (2.1) (2.1)
- Tangible assets 8,887 8,962 (0.8) 6,957 27.7 (4.4)
- Intangible assets 4,512 4,501 0.2 3,949 14.3 0.2- Non-current assets and disposal groups classified as held for sale 2,880 2,933 (1.8) 1,198 #VALUE! 9.4
- Other assets 24,810 23,164 7.1 13,114 89.2 8.8
Total assets 674,088 663,569 1.6 451,520 49.3 4.1
Liabilities 639,517 628,017 1.8 426,242 50.0 4.5
- Financial liabilities held for trading 5,361 6,432 (16.7) 424 #VALUE! (157.8)
- Financial liabilities at amortised cost 547,604 536,485 2.1 342,403 59.9 5.9
Deposits from central banks and credit institutions 97,466 103,692 (6.0) 55,356 76.1 3.4
Customer deposits 384,605 372,545 3.2 245,167 56.9 5.6
Debt securities issued 53,089 52,792 0.6 35,813 48.2 (2.4)
Other financial liabilities 12,445 7,456 66.9 6,067 #VALUE! 85.4
- Liabilities under the insurance business1 73,965 73,996 (0.0) 75,129 (1.5) (1.5)
- Provisions 6,807 4,806 41.6 3,195 #VALUE! 55.2
- Other liabilities 5,781 6,297 (8.2) 5,091 13.6 (18.5)Equity 34,571 35,552 (2.8) 25,278 36.8 (1.3)
- Shareholders' equity 36,271 37,172 (2.4) 27,118 33.8 (1.7)
- Minority interest 29 29 0.5 25 14.6 14.6
- Accumulated other comprehensive income (1,729) (1,649) 4.9 (1,865) (7.3) (7.3)
Total liabilities and equity 674,088 663,569 1.6 451,520 49.3 4.1
1- In accordance with the Amendments to IFRS 4 and subsequent reviews, the Group has decided to apply temporary exemption from
applying IFRS 9 to the financial investments of the Group’s insurance firms for all periods that come before 1 January 2023, aligning its first
application with the entry into force of the new IFRS 17: Insurance Contracts (expected on 1 January 2023), which will govern the presentation
and measurement of insurance contracts (including technical provisions). Accordingly, these investments are measured in accordance with
IAS 39 and grouped under the heading “Assets under the insurance business” on the balance sheet. To make the information more readily
comparable, the Group has also grouped together the technical provisions corresponding to Unit Link and Flexible Investment Life Annuity
(the part managed), which are now reported jointly under ‘Liabilities under the insurance business’.
Balance sheet

Business activity and results: January – June 2021| 26
Loans and advances to customers, gross stands at €363,012 million, up 48.8% in the year following the
merger with Bankia (-0.8% organic change, that is, excluding the balances transferred from Bankia in the
merger). In the quarter, Loans and advances drops 0.2%.
Changes by segment include:
- Loans for home purchases (-0.9% in the quarter and -2.3% organic change in the year) continues to be
marked by the portfolio's repayments.
- Loans to individuals - Other has grown 5.7% in the quarter with a +5.5% organic change in the year,
impacted by the advance of double payments made to pension holders in June for an amount of €3,000
million.
Consumer lending drops 2.7% in the organic year, affected by the mobility restrictions. Its performance in
the second quarter (-1.0%) is also impacted by the transfer of €140 million to written-off loans, mainly
due to the unification of criteria for the portfolio transferred from Bankia.
- Financing for Corporates and SMEs drops 2.0% in the quarter with a -2.9% organic change in the year,
following the growth registered in the previous year, in a context where companies were managing their
liquidity requirements.
- Loans to the public sector grew by 4.0% in the quarter with a +7.4% organic change in the year.
30 Jun. 2021 31 Mar. 2021 Change % 31 Dec. 2020 Change % Organic change
% € million
Loans to individuals 192,592 191,315 0.7 120,648 59.6 (0.0)
Home purchases 143,564 144,939 (0.9) 85,575 67.8 (2.3)
Other 49,028 46,376 5.7 35,074 39.8 5.5
of which: Consumer lending1 18,913 19,107 (1.0) 14,170 33.5 (2.7)
Loans to business 146,337 149,358 (2.0) 106,425 37.5 (2.9)
Corporates and SMEs 140,102 142,875 (1.9) 100,705 39.1 (2.6)
Real estate developers 6,234 6,484 (3.8) 5,720 9.0 (8.1)
Public sector 24,083 23,148 4.0 16,850 42.9 7.4
Loans and advances to customers, gross2 363,012 363,821 (0.2) 243,924 48.8 (0.8)
Of which:
Performing loans 349,689 350,554 (0.2) 235,655 48.4 (0.9)
Provisions for insolvency risk (8,609) (9,027) (4.6) (5,620) 53.2 (6.6)
Loans and advances to customers, net 354,402 354,794 (0.1) 238,303 48.7 (0.7)
Contingent liabilities 26,377 26,276 0.4 16,871 56.3 2.4
(1) After reviewing the segmentation criteria for the portfolio of consumer loans and in accordance with CaixaBank criteria, €276 million
have been reclassified, with respect to the information published in 1Q21, from Consumer lending to Other.
(2) See 'Reconciliation of activity indicators using management criteria' in the 'Appendices'.
Loans and advances to customers

Business activity and results: January – June 2021| 27
Breakdown of government guaranteed loans
Below is the detail of government guaranteed loans based on the public guarantee schemes implemented
within the framework of Covid-19:
30 Jun. 2021 31 Mar. 2021 31 Dec. 2020
Amounts drawn, in € million Total Spain (ICO) Total Spain (ICO) Total Spain (ICO)
Loans to individuals 1,534 1,505 1,512 1,487 1,216 1,196
Other (self-employed workers) 1,534 1,505 1,512 1,487 1,216 1,196
Loans to business 21,296 20,498 21,151 20,503 11,967 11,437
Corporates and SMEs 21,155 20,414 20,998 20,389 11,925 11,396
Real estate developers 141 84 153 114 42 41
Public sector 11 10 11 11 6 6
Loans and advances to customers, gross1 22,841 22,013 22,674 22,001 13,191 12,640
(1) Refers to the amount of loans and advances disposed by clients.

Business activity and results: January – June 2021| 28
Customer funds reached €600,993 million on 30 June 2021, up 44.7% in the year, after the integration of
Bankia (+6.0% organic change excluding the integration). Growth of 3.6% in the quarter.
On-balance sheet funds stood at €434,672 million (+2.9% in the quarter and +3.3% in the year, organic).
- Demand deposits amounted to €333,438 million. Its evolution (+3.9% in the quarter and +5.4% in the
year, organic) was impacted by the usual seasonal effect in the second quarter of the year.
- Time deposits totalled €37,754 million (-6.0% in the quarter and -17.5% in the year, organic). Their
performance continues to be marked by the reduction of deposits on the renewal of maturities against a
backdrop of historically low interest rates.
- The increase of liabilities under insurance contracts, up 1.5% in the quarter and 3.4% in the year (organic),
includes the positive net subscriptions and the impact of the favourable market effect on Unit Links.
Assets under management stand at €151,456 million. Its quarterly performance (+3.8% in the quarter and
+10.3% in the year, organic) is due to increased sales and the favourable market effect.
- The assets managed in mutual funds, managed accounts and SICAVs stood at €105,040 million, +4.3% in
the quarter and +12.1% in the year (organic).
- Pension plans reached €46,416 million, +2.7% in the quarter and +6.7% in the year (organic).
Other accounts includes the amount of Savings insurance marketed by Bankia (€5,072 million), which
largely corresponds to the joint venture with Mapfre. It also includes temporary funds associated with
transfers and collections, the performance of which in the second quarter is the result, among other factors,
of the collection from filed income tax returns, which coincides with the end of the quarter.
30 Jun. 2021 31 Mar. 2021 Change % 31 Dec. 2020 Change % Organic change
% € million
Customer funds 371,191 361,031 2.8 242,234 53.2 3.3
Demand deposits 333,438 320,882 3.9 220,325 51.3 5.4
Time deposits1 37,754 40,148 (6.0) 21,909 72.3 (17.5)
Insurance contract liabilities2 61,384 60,493 1.5 59,360 3.4 3.4
of which: Unit Link and other3 17,144 15,833 8.3 14,607 17.4 17.4
Reverse repurchase agreements and other 2,096 1,023 2,057 1.9 1.9
On-balance sheet funds 434,672 422,546 2.9 303,650 43.1 3.3
Mutual funds, managed accounts and SICAVs 105,040 100,723 4.3 71,315 47.3 12.1
Pension plans 46,416 45,207 2.7 35,328 31.4 6.7
Assets under management 151,456 145,930 3.8 106,643 42.0 10.3
Other accounts 14,865 11,458 29.7 5,115 ,0 77.0
Total customer funds4 600,993 579,934 3.6 415,408 44.7 6.0
(1) Includes retail debt securities amounting to €1,408 million at 30 June 2021.
(2) Excluding the impact of the change in value of the associated financial assets, with the exception of Unit Link and Flexible Investment
Life Annuity products (the part managed).
(3) Includes technical provisions corresponding to Unit Link and Flexible Investment Life Annuity products (the part managed).
(4) See 'Reconciliation of activity indicators using management criteria' in the 'Appendices'.
Customer funds

Business activity and results: January – June 2021| 29
Risk
management
Non-performing loans amounted to €14,005 million at the end of the second quarter versus €8,601 million
at the end of 2020, with their organic performance down €23 million. €72 million drop in the quarter.
The NPL ratio stood at 3.6% on 30 June versus 3.3% in December, mainly due to the +28 basis points from the
integration of Bankia.
Provisions for insolvency risk on 30 June stood at €9,001 million versus €9,415 million at the end of March
and €5,755 at the end of 2020.
The coverage ratio at 30 June stood at 64% versus 67% at March 2021 and December 2020.
Changes in non-performing loans
2Q20 3Q20 4Q20 1Q21 2Q21 € million
Opening balance 8,957 9,220 9,078 8,601 14,077
Exposures recognized as non-performing (NPL-inflows) 1,022 672 690 610 1,509
Derecognitions from non-performing exposures (760) (814) (1,167) (561) (1,582)
of which: written off (169) (133) (199) (129) (435)
Exposures recognized as non-performing (NPL-inflows), net, Bankia at 31 Mar. 2021
5,427
Closing balance 9,220 9,078 8,601 14,077 14,005
Credit risk quality
5,786 5,883 5,755 5,797 5,7979,415 9,001
3,618
2Q20 3Q20 4Q20 1Q21 BankiaContri.
1Q21 2Q21
Non-performing loans and non-performing loan ratio(€ million and %)
Provisions and Coverage ratio(€ million and %)
1
9,220 9,078 8,601 8,650 8,650
14,077 14,005
5,427
2Q20 3Q20 4Q20 1Q21 BankiaContri.
1Q21 2Q21
3.5% 3.5% 3.3% 3.3% 3.6% 3.6%
63% 65% 67% 67% 67% 64%
1
(1) Calculations include loans and contingent liabilities.
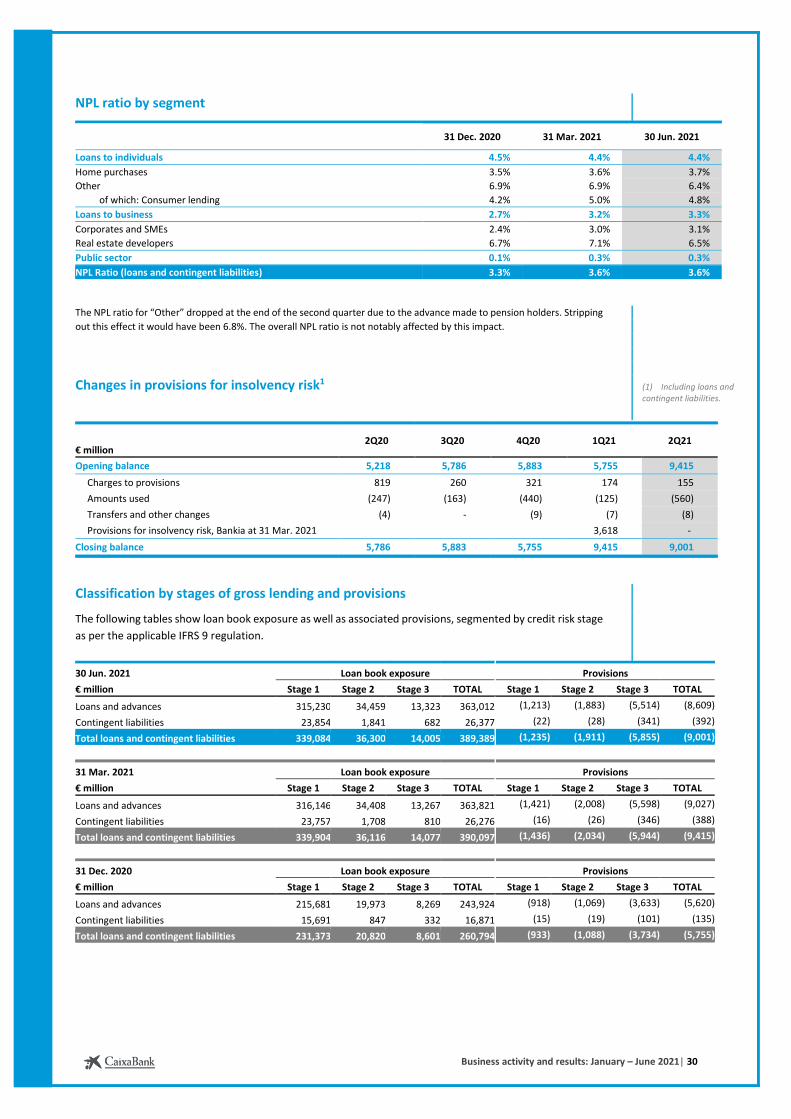
Business activity and results: January – June 2021| 30
NPL ratio by segment
31 Dec. 2020 31 Mar. 2021 30 Jun. 2021
Loans to individuals 4.5% 4.4% 4.4%
Home purchases 3.5% 3.6% 3.7%
Other 6.9% 6.9% 6.4%
of which: Consumer lending 4.2% 5.0% 4.8%
Loans to business 2.7% 3.2% 3.3%
Corporates and SMEs 2.4% 3.0% 3.1%
Real estate developers 6.7% 7.1% 6.5%
Public sector 0.1% 0.3% 0.3%
NPL Ratio (loans and contingent liabilities) 3.3% 3.6% 3.6%
The NPL ratio for “Other” dropped at the end of the second quarter due to the advance made to pension holders. Stripping
out this effect it would have been 6.8%. The overall NPL ratio is not notably affected by this impact.
Changes in provisions for insolvency risk1
2Q20 3Q20 4Q20 1Q21 2Q21 € million
Opening balance 5,218 5,786 5,883 5,755 9,415
Charges to provisions 819 260 321 174 155
Amounts used (247) (163) (440) (125) (560)
Transfers and other changes (4) - (9) (7) (8)
Provisions for insolvency risk, Bankia at 31 Mar. 2021 3,618 -
Closing balance 5,786 5,883 5,755 9,415 9,001
Classification by stages of gross lending and provisions
The following tables show loan book exposure as well as associated provisions, segmented by credit risk stage
as per the applicable IFRS 9 regulation.
30 Jun. 2021 Loan book exposure Provisions
€ million Stage 1 Stage 2 Stage 3 TOTAL Stage 1 Stage 2 Stage 3 TOTAL
Loans and advances 315,230 34,459 13,323 363,012 (1,213) (1,883) (5,514) (8,609)
Contingent liabilities 23,854 1,841 682 26,377 (22) (28) (341) (392)
Total loans and contingent liabilities 339,084 36,300 14,005 389,389 (1,235) (1,911) (5,855) (9,001)
31 Mar. 2021 Loan book exposure Provisions
€ million Stage 1 Stage 2 Stage 3 TOTAL Stage 1 Stage 2 Stage 3 TOTAL
Loans and advances 316,146 34,408 13,267 363,821 (1,421) (2,008) (5,598) (9,027)
Contingent liabilities 23,757 1,708 810 26,276 (16) (26) (346) (388)
Total loans and contingent liabilities 339,904 36,116 14,077 390,097 (1,436) (2,034) (5,944) (9,415)
31 Dec. 2020 Loan book exposure Provisions
€ million Stage 1 Stage 2 Stage 3 TOTAL Stage 1 Stage 2 Stage 3 TOTAL
Loans and advances 215,681 19,973 8,269 243,924 (918) (1,069) (3,633) (5,620)
Contingent liabilities 15,691 847 332 16,871 (15) (19) (101) (135)
Total loans and contingent liabilities 231,373 20,820 8,601 260,794 (933) (1,088) (3,734) (5,755)
(1) Including loans and contingent liabilities.

Business activity and results: January – June 2021| 31
Provisions for insolvency risk Covid-19
In the first half of 2021 the recurrent recalibration of specific provision models were resumed. These
parameters had remained unchanged in the Group since March 2020, albeit they had been complemented by
a collective accounting adjustment (Post Model Adjustment) amounting to €1,252 million at the end of 2020,
which increased to €1,803 million after the integration of Bankia.
The Covid-19 fund stands at €1,395 million on 30 June, following the recurrent recalibration of the provision
models in the second quarter of 2021 where a certain amount was specifically allocated, and it will be
reviewed as new information becomes available.
Below is a breakdown of the fund according to stage:
30 Jun. 2021 Stage 1 Stage 2 Stage 3 TOTAL
€ million
Provisions for insolvency risk Covid-19 345 729 321 1,395
31 Mar. 2021 Stage 1 Stage 2 Stage 3 TOTAL
€ million
Provisions for insolvency risk Covid-19 670 639 494 1,803
31 Dec. 2020 Stage 1 Stage 2 Stage 3 TOTAL
€ million
Provisions for insolvency risk Covid-19 414 477 361 1,252

Business activity and results: January – June 2021| 32
Breakdown of moratoria
Total moratoria1 granted by the Group from the beginning of Covid-19 amounted to €23,896 million
(617,212 operations). In Spain moratoria was granted for an amount of €17,617 million (502,499 operations).
Below is the breakdown of loans in moratoria outstanding as per the specified date:
30 Jun. 2021
Spain Portugal Total
No. of contracts Amount No. of contracts Amount Amount % on portfolio
Moratoria to individuals 37,946 2,026 25,373 1,594 3,621 1.9
Home purchases 16,802 1,635 21,737 1,466 3,101 2.2
Other 21,144 392 3,636 128 520 1.1
of which: consumer lending 15,499 94 1,990 22 116 0.6
Moratoria to business 1,071 897 27,431 2,233 3,131 2.1
Corporates and SMEs 987 852 26,215 1,994 2,847 2.0
Real estate developers 84 45 1,216 239 284 4.6
Moratoria to the public sector 10 38 38 0.2
Total moratoria outstanding 39,017 2,924 52,814 3,866 6,789 1.9
31 Mar. 2021
Spain Portugal Total
No. of contracts Amount No. of contracts Amount Amount % on portfolio
Moratoria to individuals 145,120 11,686 68,852 2,965 14,652 7.7
Home purchases 102,081 9,746 39,565 2,516 12,263 8.5
Other 43,039 1,940 29,287 449 2,389 5.2
of which: consumer lending 9,274 77 27,401 334 412 2.1
Moratoria to business 2,136 1,075 28,226 2,627 3,702 2.5
Corporates and SMEs 1,929 1,016 26,738 2,362 3,378 2.4
Real estate developers 207 59 1,488 264 324 5.0
Moratoria to the public sector - -
4 32 32 0.1
Total moratoria outstanding 147,256 12,762 97,082 5,624 18,385 5.1
Moratoria in analysis 14,586 532 135 10 541-
31 Dec. 2020
Spain Portugal Total
No. of contracts Amount No. of contracts Amount Amount % on portfolio
Moratoria to individuals 122,213 8,204 68,722 2,932 11,136 9.2
Home purchases 71,597 6,473 39,233 2,495 8,968 10.5
Other 50,616 1,732 29,489 437 2,168 6.2
of which: consumer lending 17,743 80 27,675 329 409 2.9
Moratoria to business 1,206 532 28,762 2,656 3,188 3.0
Corporates and SMEs 988 479 27,219 2,393 2,872 2.9
Real estate developers 218 54 1,543 263 316 5.5
Moratoria to the public sector - -
4 32 32 0.2
Total moratoria outstanding 123,419 8,737 97,488 5,620 14,356 5.9
Moratoria in analysis 21 1- -
1-
(1) Mainly moratoria according to Royal Decree-Law 8/2020, 11/2020, 25/2020, 26/2020 (10J/2020 in Portugal), 3/2021 or Sectorial Agreement.

Business activity and results: January – June 2021| 33
Out of a total of €6,789 million in moratoria outstanding at 30 June 2021, 25% expires in the third quarter of
2021, and practically the entire amount before the end of the year.
€ million 3Q21 4Q21 1Q22 Total
Individuals 1,306 2,093 221 3,621
Business 372 2,645 114 3,131
Public sector 38 38
Total moratoria outstanding 1,678 4,776 335 6,789
Below is the outstanding balance (i.e. deducting the principal repaid) of loans that have been in moratoria
and by 30 June 2021 are expired:
30 Jun. 2021 31 Mar. 2021
Spain Portugal Total Spain Portugal Total
Moratoria to individuals 13,276 1,506 14,782 3,571 215 3,786
Home purchases 9,915 1,156 11,071 1,700 173 1,873
Other 3,361 350 3,711 1,871 42 1,913
of which: consumer lending 1,257 336 1,593 1,358 37 1,396
Moratoria to business 144 513 657 88 203 290
Corporates and SMEs 129 491 619 85 199 284
Real estate developers 15 22 38 3 3 6
Moratoria to the public sector - - - - - -
Total moratoria expired 13,420 2,019 15,439 3,659 417 4,076
Breakdown of total moratoria, outstanding and expired (pending amount), according to categories of credit
risk established in IFRS 9:
30 Jun. 2021
€ million Stage 1 Stage 2 Stage 3 TOTAL
Individuals 10,992 5,736 1,674 18,403
Business 2,703 955 130 3,788
Public sector 35 3 - 38
Total moratoria outstanding and expired 13,730 6,694 1,804 22,228
31 Mar. 2021
€ million Stage 1 Stage 2 Stage 3 TOTAL
Individuals 10,368 6,682 1,387 18,437
Business 2,943 931 118 3,992
Public sector 32 - - 32
Total moratoria outstanding and expired 13,343 7,613 1,506 22,461
31 Dec. 2020
€ million Stage 1 Stage 2 Stage 3 TOTAL
Individuals 7,986 4,572 859 13,417
Business 2,677 616 82 3,375
Public sector 34 - - 34
Total moratoria outstanding and expired 10,697 5,188 941 16,826

Business activity and results: January – June 2021| 34
Loan-to-value1 breakdown of the moratoria, outstanding and expired (pending amount), in the home
purchase segment :
30 Jun. 2021
€ million LTV ≤ 40% 40% < LTV ≤ 60% 60% < LTV ≤ 80% LTV > 80% TOTAL
Gross amount 2,695 4,957 4,307 2,214 14,172
31 Mar. 2021
€ million LTV ≤ 40% 40% < LTV ≤ 60% 60% < LTV ≤ 80% LTV > 80% TOTAL
Gross amount 2,741 4,942 4,357 2,094 14,135
31 Dec. 2020
€ million LTV ≤ 40% 40% < LTV ≤ 60% 60% < LTV ≤ 80% LTV > 80% TOTAL
Gross amount 1,954 3,680 3,057 1,124 9,814
Loan-to-value1 breakdown of the Group's home purchases portfolio
Below is the breakdown of the Loan-to-value of the portfolio of home purchases with mortgage guarantee:
30 Jun. 2021
€ million LTV ≤ 40% 40% < LTV ≤ 60% 60% < LTV ≤ 80% LTV > 80% TOTAL
Gross amount 42,046 49,698 35,059 15,371 142,174
of which: Non-performing 654 689 934 3,016 5,293
31 Mar. 2021
€ million LTV ≤ 40% 40% < LTV ≤ 60% 60% < LTV ≤ 80% LTV > 80% TOTAL
Gross amount 42,102 50,598 35,695 15,383 143,779
of which: Non-performing 425 654 927 3,189 5,196
31 Dec. 2020
€ million LTV ≤ 40% 40% < LTV ≤ 60% 60% < LTV ≤ 80% LTV > 80% TOTAL
Gross amount 25,548 31,184 20,692 7,449 84,873
of which: Non-performing 259 445 617 1,627 2,948
(1) Loan-to-value calculated on the basis of latest appraisals according to the criteria set out in Circular 4/2016. When comparing the
information at 31 March 2021 to that published in the 1Q21 Business Activity and Results Report, it differs due to including the
distribution of Bankia's home purchases portfolio by LTV incorporated in the merger and correcting certain incidents detected in the
information unification process carried out between both entities in the tranche distribution of the CaixaBank Group's portfolio.

Business activity and results: January – June 2021| 35
Refinancing
31 Dec. 2020 31 Mar. 2021 30 Jun. 2021
€ million Total
of which: NPL
Total of which:
NPL Total
of which: NPL
Individuals 4,093 3,288 6,776 4,803 6,821 4,804
Corporates and SMEs 2,084 1,261 4,031 2,128 4,934 2,403
Real estate developers 489 243 657 285 586 236
Public sector 209 2 236 17 197 16
Total 6,874 4,796 11,701 7,233 12,537 7,460
Provisions 1,648 1,564 2,715 2,286 2,664 2,464
Foreclosed real estate assets
The portfolio of Net foreclosed available for sale real estate assets1 in Spain amounts to €2,297 million, of
which €1,183 million2 from the integration of Bankia. The organic change in the year is €+184 million
(including €+145 million, net, from foreclosed assets held for rent). €30 million increase in the quarter.
The coverage ratio with accounting provisions3 is 32% and including write-downs, the coverage ratio3,4 is
42%.
Net foreclosed assets held for rent1 in Spain stand at €1,790 million, of which €358 million2 stemming from
the integration of Bankia. The organic change in the year is €-315 million (partially impacted by the
aforementioned portfolio reclassification) and €-117 million in the quarter.
Total properties sold5 in 2021 amounts to €315 million.
(1) Does not include real estate assets in the process of foreclosure for €188 million at 30 June 2021, of which €186 million correspond to
Foreclosed available for sale real estate assets.
(2) The portfolio of Net foreclosed available for sale real estate assets and the portfolio of Net foreclosed assets held for rent included in the merger with Bankia and reported in the 1Q21 Business Activity and Results Report have been adjusted after obtaining further information and unifying the information presentation criteria, as, among others, the figure for real estate assets transferred from Bankia in the first quarter included real estate assets in the process of foreclosure, which CaixaBank reports separately.
(3) See definition in ‘Appendices’.
(4) There is only information to calculate the coverage ratio with accounting provisions for CaixaBank's portfolio. In process of implementation for Bankia's portfolio.
(5) At sale price. It does not include the sales made by Bankia in the first quarter of 2021 due to taking 31 March 2021 as the date of reference for the integration.

Business activity and results: January – June 2021| 36
Liquidity
and financing structure
Total liquid assets amounted to €162,731 million at 30 June 2021, up €48,280 million in the half, mainly
due to the integration of Bankia.
The Group's Liquidity Coverage Ratio (LCR) at 30 June 2021 was 333%, showing an ample liquidity position
(292% LCR average last 12 months) well clear of the minimum requirement of 100%.
The Net Stable Funding Ratio (NSFR)2 stood at 148% at 30 June 2021, above the 100% regulatory minimum
required as of June 2021.
Solid retail financing structure with a loan-to-deposit ratio of 94%.
The balance drawn under the ECB facility at 30 June 2021 amounted to €81,159 million, corresponding to
TLTRO III. In the first half of 2021 a total of €6,223 million related to TLTRO III were drawn, and the total
balance drawn increased by €25,211 million due to the incorporation of Bankia.
Wholesale funding3 amounted to €53,279 million, diversified by investments, instruments and maturities.
Available capacity to issue mortgage and regional public sector covered bonds at CaixaBank, S.A. came to
€22,431 million at 30 June 2021.
(1) Trailing 12 months (includes Bankia's contribution as of March
2021).
(2) As of 30 June 2019 the regulatory criteria established in Regulation (EU) 2019/876 of the European Parliament and of the Council, of 20 May 2019, which came into force in June 2021, is applied.
(3) See 'Reconciliation of activity indicators using management criteria' in the 'Appendices'.
HQLAs
13%
86%
1%
Total Financing429.9
Financing structure(€ thousand million)
Total liquid assets, Liquidity metrics and Balance sheet structure(€ thousand million and %)
>2024
2022
2024
2023
Other ECB discount facility
collateral
Wholesalefunding
Net interbank deposits
Retail funding
Institutional funding Issues by maturity
95.4
146.3161.9
19.1
0.80.8
114.5
147.1162.7
31 Dec. 2020 31 Mar. 2021 30 Jun. 2021
35.0
53.8
31 Dec. 2020 31 Mar. 2021
53.3
30 Jun. 2021
31 Dec. 2020 31 Mar. 2021 30 Jun. 2021
Punctual LCR 276 % 309 % 333 %
Average LCR1 248 % 273 % 292 %
NSFR 145 % 146 % 148 %
LTD 97 % 97 % 94 %

Business activity and results: January – June 2021| 37
Information on issuances in 2021
€ million
Issue Amount Maturity Cost1 Demand Issuer
Senior non-preferred debt2 1,000 8 years 0.571% (mid-swap +0.90%) 3,700 CaixaBank
Senior non-preferred debt3 1,000 7 years 0.867% (mid-swap +1.00%) 2,100 CaixaBank
Senior non-preferred debt GBP 2.4 £500 5 years and 6
months 1.523% (UKT +1.32%) £1,800 CaixaBank
Tier 2 subordinated debt2 1,000 10 years and 3
months 1.335% (mid-swap +1.63%) 2,200 CaixaBank
(1) Meaning the yield on the issuance.
(2) Green bond.
(3) Social bond.
(4) Equivalent amount in euros: €579 million.
The issuances included in the table are callable, meaning that the option to redeem them early can be
executed before the maturity date.
Following the end of June, CaixaBank completed an issuance of CHF 200 million in Senior non-preferred debt
maturing in six years and paying a coupon of 0.477% (equivalent to CHF mid-swap + 87 basis points).
Collateralisation of mortgage covered bonds of CaixaBank, S.A.
30 Jun. 2021 € million
Mortgage covered bonds issued a 66,371
Loans and credits (collateral for mortgage covered bonds) b 144,653
Collateralisation b/a 218%
Overcollateralisation b/a -1 118%
Mortgage covered bond issuance capacity5 17,912
(5) There is also the ability to issue €4,519 million in regional public sector covered bonds.

Business activity and results: January – June 2021| 38
Capital
management
The Common Equity Tier 1 (CET1) ratio stands at 12.9%.
The first quarter includes the extraordinary impact of Bankia's integration for +77 basis points, -89 basis
points from the effect of the Purchase Price Allocation (PPA1), and the second quarter is affected by -87
basis points from restructuring costs (of which -83 correspond to the labour integration agreement2) and
-71 points from regulatory impacts.
The organic change in the half year was of +64 basis points and +45 basis points caused by the performance
of the markets and other factors. The impact of IFRS 9 phasing was of -16 basis points.
The CET1 ratio without applying the IFRS 9 transitional period reaches 12.5%.
The internal aim of the solvency rate CET1 approved by the Board of Directors is set between 11% and 11.5%
(excluding IFRS 9) and a margin of between 250 and 300 basis points in relation to the SREP requirements.
The Tier 1 ratio reached 14.8% and the Total Capital ratio stood at 17.4%.
The leverage ratio stood at 5.1%.
As for the MREL requirement, CaixaBank had a ratio of 25.1% on RWA and 8.7% on LRE, meeting the level
required for 2024 (22.95% of RWAs and 6.09% of LRE). At a subordinated level, excluding the Senior
preferred debt and other pari-passu liabilities, the MREL ratio reached 22.2% of RWAs and 7.7% of LRE,
comfortably above the regulatory requirements of 16.26% of RWAs and 6.09% of LRE. The following issues
of Senior non-preferred debt3 were made in the second quarter, strengthening the MREL ratios: a social
bond of €1,000 million, in addition to an issue of £500 million. Following the end of June, an issue of CHF
200 million, which is also included.
Similarly, CaixaBank is subject to minimum capital requirements on a non-consolidated basis. The CET1
ratio under this perimeter reached 13.8%.
BPI is also compliant with its minimum capital requirements. Capital ratios at a sub-consolidated level are
as follows: CET1 of 14.3%, Tier1 of 15.8% and Total Capital of 17.4%.
Change in CET1
13.64%
14.13%
12.87%-2 bp
+30 bp
+33 bp
+77 bp -89 bp
-14 bp
-87 bp
-71 bp
+34 bp +12 bp
Dec.-20
13.09%ex-IFRS9 TA
IFRS 9transitory
Organic Marketimpacts
and other
Bankia PPA Mar.-21
13.59%ex-IFRS9 TA
IFRS 9transitory
Restruct.costs
Regulatoryimpacts
Organic Marketimpacts
and other
Jun.-21
12.49%ex-IFRS9 TA
(1) See section ‘Key information - CaixaBank and Bankia merger’.
(2) See section ‘Key information - Labour agreement’. Lower impact than anticipated in the Insider Information communication of 1 July of 7 basis points as a result of a better estimate of the fiscal impact of costs.
(3) See section ‘Liquidity’.

Business activity and results: January – June 2021| 39
In terms of capital requirements following the integration of Bankia, the European Central Bank
communicated this month of June a new P2R requirement of 1.65%. As a result, the Group must maintain
capital requirements of 8.19% for CET1, 10.00% for Tier 1 and 12.41% for Total Capital1. At 30 June,
CaixaBank has a margin of 468 basis points, equating to €10,329 million, until the Group’s MDA trigger.
In addition, the information relating to the domestic systemic risk buffer after the integration of Bankia
remain at 0.25% for this year, increasing to 0.375% in 2022 and 0.50% in 2023. As a result, the estimated
new MREL requirements, according to current regulations, is 22.41% for Total MREL and 18.01% for
Subordinated MREL, which will be applicable as of January 2022.
The Group's current level of capital adequacy confirms that the applicable requirements would not lead to
any automatic restrictions according to the capital adequacy regulations, regarding the distribution of
dividends, variable remuneration, and the interests of holders of Additional Tier 1 capital securities.
As regards the dividend policy, and following the European Central Bank's announcement on 23 July 2021
of not extending its recommendation on dividend distributions beyond September 2021, the Board of
Directors approved on 29 July 2021 the Dividend Policy for 2021, establishing the distribution of a cash
dividend of 50% of the consolidated net profit adjusted by the extraordinary impacts from the merger with
Bankia in a single payout in 2022.
(1) See Other relevant information published on 23
June.

Business activity and results: January – June 2021| 40
Performance and key capital adequacy indicators
€ million 30 Jun. 2020 30 Sep. 2020 31 Dec. 2020 31 Mar. 2021 30 Jun. 2021
Quarter-on-quarter
CET1 Instruments 24,621 24,657 25,546 36,017 34,528 (1,489)
Shareholders' equity 25,996 26,475 27,118 37,172 36,271 (901)
Capital 5,981 5,981 5,981 8,061 8,061
Profit/(loss) attributable to the Group 205 726 1,381 4,786 4,181
Reserves and other 19,811 19,768 19,756 24,326 24,029
Other CET1 instruments1 (1,375) (1,818) (1,572) (1,155) (1,743) (588)
Deductions from CET1 (6,538) (6,464) (5,892) (6,547) (6,136) 411
CET1 18,083 18,192 19,654 29,470 28,392 (1,078)
AT1 instruments 2,237 2,237 2,984 4,235 4,237 2
AT1 Deductions
TIER 1 20,320 20,430 22,637 33,705 32,629 (1,076)
T2 instruments 3,208 3,324 3,407 5,837 5,863 26
T2 Deductions
TIER 2 3,208 3,324 3,407 5,837 5,863 26
TOTAL CAPITAL 23,528 23,754 26,045 39,542 38,492 (1,050)
Other computable subordinated instruments MREL
5,667 5,664 6,665 8,842 10,598 1,756
MREL, subordinated 29,195 29,417 32,709 48,384 49,090 706
Other computable instruments. MREL 4,111 5,111 5,111 6,375 6,378 3
MREL 33,306 34,528 37,820 54,759 55,468 709
Risk-weighted assets 147,499 145,731 144,073 208,585 220,660 12,075
CET1 Ratio 12.3% 12.5% 13.6% 14.1% 12.9% (1.2%)
Tier 1 Ratio 13.8% 14.0% 15.7% 16.2% 14.8% (1.4%)
Total Capital Ratio 16.0% 16.3% 18.1% 19.0% 17.4% (1.6%)
MDA Buffer2 5,449 5,891 7,984 12,571 10,329 (2,242)
MREL Ratio, subordinated 19.8% 20.2% 22.7% 23.2% 22.2% (1.0%)
MREL Ratio 22.6% 23.7% 26.3% 26.3% 25.1% (1.2%)
Leverage ratio 5.1% 5.1% 5.6% 5.4% 5.1% (0.3%)
CET1 Ratio - CABK (non-consolidated basis) 14.1% 14.1% 15.1% 15.9% 13.8% (2.1%)
Tier 1 Ratio CABK (non-consolidated basis) 15.7% 15.7% 17.4% 18.1% 16.0% (2.1%)
Total Capital Ratio - CABK (non-consolidated basis)
18.1% 18.2% 19.9% 21.2% 18.9% (2.3%)
Risk-weighted assets (non-consolidated basis) 135,465 134,979 132,806 189,616 197,097 7,481
Profit/loss (non-consolidated basis) (135) 254 688 4,601 3,490
ADIs3 2,565 2,919 3,308 7,655 6,572 (1,083)
MDA Buffer- CABK (non-consolidated basis)2 9,543 9,541 10,778 16,842 13,426 (3,416)
Leverage Ratio - CABK (non-consolidated basis) 5.8% 5.7% 6.2% 5.8% 5.2 % (0.6%)
Data at March 2021 updated using the latest official information.
(1) Mainly includes the forecast for dividends, IFRS 9 transitional adjustment and OCIs.
(2) MDA (Maximum Distributable Amount) Buffer: the capital threshold below which limitations exist on dividend payments, variable
remuneration and interest payments to holders of Additional Tier 1 capital instruments. It is defined as Pillar 1 + Pillar 2 capital
requirements + capital buffers + possible AT1 and T2 deficits. Either the non-consolidated or the consolidated, whichever is lower.
(3) Does not include the issue premium.

Business activity and results: January – June 2021| 41
Segment
reporting
This section shows financial information on the different business segments of the CaixaBank Group, set up
as follows:
Banking and Insurance: shows earnings from the Group's banking, insurance and asset management activity mainly in Spain, as well as the real estate business and ALCO's activity in liquidity management and income from financing the other businesses.
Most of the activity and results generated by Bankia are included in the banking and insurance business.
Given that the recognition date of the merger for accounting purposes is 31 March 2021, the financial
statements included Bankia's assets and liabilities on that date at fair value. As of the second quarter, the
results generated by Bankia are included in the various lines of CaixaBank's income statement on the
Group's business segments.
Likewise, as the banking and insurance business includes the Group-wide corporate centre, the extraordinary income related to the merger has been recognised in this activity, including the negative consolidation difference.
The insurance, asset management and cards business acquired by CaixaBank from BPI during 2018 is also part of this business.
Equity investments: this line of business shows earnings, net of funding expenses, from the stakes held in
Erste Group Bank, Telefónica, BFA, BCI and Coral Homes. Similarly, it includes the significant impacts on
income of other relevant stakes in various sectors integrated in past acquisitions.
As of 31 March, the stake held in Gramina Homes from Bankia is added, the results of which will be included
in the Group as of the second quarter.
BPI: covers the income from BPI's domestic banking business. The income statement shows the reversal of
the fair value adjustments of the assets and liabilities resulting from the business combination and excludes
the results and balance sheet figures associated with the assets of BPI assigned to the equity investments
business (essentially BFA and BCI).
The operating expenses of these business segments include both direct and indirect costs, which are assigned
according to internal distribution methods.
The allocation of capital to the investment business in both exercises take into account the 11.5%
consumption of capital for risk-weighted assets, as well as any applicable deductions.
The allocation of capital to BPI is at sub-consolidated level, i.e. taking into account the subsidiary's own funds.
The capital consumed in BPI by the investees allocated to the investment business is allocated consistently to
this business.
The difference between the Group’s total shareholders' equity and the capital assigned to the other
businesses is attributed to the banking and insurance business, which includes the Group’s corporate centre.

Business activity and results: January – June 2021| 42
Results for the first half of 2021 arranged by business are as follows:
Banking & insurance
€ million Total M&A impacts Income ex M&A
Equity Investments
BPI Group
Net interest income 2,626 2,626 (22) 223 2,827
Dividend income and share of profit/(loss) of entities accounted for using the equity method
113 113 232 12 357
Net fee and commission income 1,510 1,510 130 1,640
Trading income 65 65 2 13 80 Income and expense under insurance or reinsurance contracts 318 318 318
Other operating income and expense (299) (299) (8) (32) (339)
Gross income 4,332 4,332 204 347 4,883
Recurring administrative expenses, depreciation and amortisation (2,522) (2,522) (2) (223) (2,747)
Extraordinary expenses (1,969) (1,969) (1) (1,970)
Pre-impairment income (159) (1,969) 1,810 202 122 166
Pre-impairment income stripping out extraordinary expenses 1,810 1,810 202 123 2,136
Allowances for insolvency risk (337) (337) 8 (328)
Other charges to provisions (149) (26) (123) (6) (155)
Gains/(losses) on disposal of assets and others 4,284 4,300 (16) 0 4,284
Profit/(loss) before tax 3,639 2,304 1,334 202 125 3,966
Income tax expense 237 599 (362) 8 (31) 214
Profit/(loss) after tax 3,876 2,903 973 210 94 4,180
Profit/(loss) attributable to minority interest and others (0) (0) (0)
Profit/(loss) attributable to the Group 3,876 2,903 973 210 94 4,181
The proforma results for the first half of 2021 arranged by business is as follows:
Banking & insurance
Equity Investments
BPI Group
€ million
Net interest income 3,074 (23) 223 3,275
Dividend income and share of profit/(loss) of entities accounted for using the equity method
125 232 12 369
Net fee and commission income 1,792 130 1,922
Trading income 76 2 13 90
Income and expense under insurance or reinsurance contracts 318 318
Other operating income and expense (341) (8) (32) (380)
Gross income 5,043 204 347 5,593
Recurring administrative expenses, depreciation and amortisation (2,965) (2) (223) (3,191)
Extraordinary expenses (1) (1)
Pre-impairment income 2,078 202 122 2,402
Pre-impairment income stripping out extraordinary expenses 2,078 202 123 2,403
Allowances for insolvency risk (460) 8 (451)
Other charges to provisions (146) (6) (152)
Gains/(losses) on disposal of assets and others (39) 0 (38)
Profit/(loss) before tax 1,433 202 125 1,760
Income tax expense (394) 8 (31) (417)
Profit/(loss) after tax 1,039 210 94 1,343
Profit/(loss) attributable to minority interest and others (0) (0)
Comparative proforma income statement 1,039 210 94 1,343
- Profit/(loss) Bankia stripping out extraordinary expenses, net (66) 1 (65)
+ M&A impacts, net 2,903 2,903
Profit/(loss) attributable to the Group (accounting profit/(loss)) 3,876 210 94 4,181

Business activity and results: January – June 2021| 43
Banking and insurance business
The performance in the first half of 2021 stands at €3,876 million, impacted by the extraordinary expenses
associated with the merger. Without considering this impact, the result stands at €973 million. In the same
period of 2020 the result was €105 million, impacted by the provisions made to anticipate future impacts
associated with Covid-19.
The Comparative proforma Profit/(loss) stands at €1,039 million (€248 million, net, in the same period of the
previous year, impacted by the provisions associated with Covid-19)
Proforma
€ million 1H21 1H20 Change % 1H21 1H20 Change %
INCOME STATEMENT Net interest income 2,626 2,254 16.5 3,074 3,182 (3.4)
Dividend income and share of profit/(loss) of entities accounted for using the equity method
113 85 32.5 125 111 12.7
Net fee and commission income 1,510 1,148 31.5 1,792 1,704 5.1Trading income 65 160 (59.1) 76 303 (75.0)Income and expense under insurance or reinsurance contracts 318 292 9.0 318 292 9.0Other operating income and expense (299) (178) 68.0 (341) (318) 7.0
Gross income 4,332 3,760 15.2 5,043 5,273 (4.4)
Recurring administrative expenses, depreciation and amortisation (2,522) (2,118) 19.1 (2,965) (2,981) (0.5)Extraordinary expenses (1,969)
Pre-impairment income (159) 1,643 2,078 2,292 (9.3)
Pre-impairment income stripping out extraordinary expenses 1,810 1,643 10.2 2,078 2,292 (9.3)
Allowances for insolvency risk (337) (1,315) (74.4) (460) (1,796) (74.4)Other charges to provisions (149) (183) (18.6) (146) (208) (29.6)Gains/(losses) on disposal of assets and others 4,284 (50) (39) (67) (42.2)
Profit/(loss) before tax 3,639 94 1,433 222
Income tax expense 237 9 (394) 25
Profit/(loss) after tax 3,876 103 1,039 247
Profit/(loss) attributable to minority interest and others (0) (1) (79.7) (0) (1) (88.3)
Profit/(loss) attributable to the Group 3,876 105 1,039 248
INCOME STATEMENT BREAKDOWN Core income 4,558 3,767 21.0 5,300 5,278 0.4
Banking services, securities and other fees 841 655 28.5 1,021 1,025 (0.3)Recurring 740 555 33.3 914 897 1.9Wholesale banking 101 99 1.4 107 128 (16.0)
Sale of insurance products 116 73 58.7 158 143 10.4Long-term savings products 553 421 31.5 613 536 14.3
Mutual funds, managed accounts and SICAVs 338 252 34.4 382 333 14.7Pension plans 134 107 25.1 149 141 5.9Unit Link and other 81 62 31.2 81 62 31.0
Net fee and commission income 1,510 1,148 31.5 1,792 1,704 5.1
Personnel expenses (1,594) (1,329) 19.9 (1,868) (1,866) 0.1General expenses (648) (546) 18.8 (772) (791) (2.5)Depreciation and amortisation (279) (243) 15.1 (325) (324) 0.6
Recurring administrative expenses, depreciation and amortisation (2,522) (2,118) 19.1 (2,965) (2,981) (0.5)
Extraordinary expenses (1,969)
OTHER INDICATORS ROTE1 8.6% 4.5% 4.1Cost-to-income ratio stripping out ext. exp. (12 months) 55.4% 56.4% (1.0)Cost of risk (12 months) 0.35% 0.74% (0.4)Customers 19.1 13.6 40.4Employees 46,509 30,772 51.1Branches 5,775 4,012 43.9
of which Retail 5,433 3,797 43.1ATMs 13,827 8,982 53.9
(1) The ratio excludes: the net extraordinary income associated with the merger for €2,903 million and the gains on the partial sale of
Comercia in 4Q20 for €420 million. The coupon for the part of the AT1 issue assigned to this business has also been deducted.

Business activity and results: January – June 2021| 44
The following highlights shaped the year-on-year proforma performance of the banking and insurance
business (€1,039 million):
Gross income stands at €5,043 million (-4.4%):
- Core income remained stable at +0.4% with respect to the first half of 2020:
- Net interest income stands at €3,074 million (-3.4%) due to the lower return on loans and on the
fixed-income portfolio and to lower income from financing the Equity investments business. This drop
in income is partially offset by higher income from the measures established by the ECB, a higher
volume of loans and lower wholesale funding expenses.
- Income from Bancassurance equity investments amounted to €117 million, up 14.7%.
- Fee and commission income reached €1,792 million (+5.1%):
Practically stable banking fees and commissions (-0.3%). Increase in recurring fees and
commissions (+1.9%), with higher transaction fees compensating the lower e-payment fees. In
addition, lower non-recurring fees and commissions (-16.0%) due to reduced activity in
investment banking.
Higher fees and commissions from the sale of insurance products (+10.4%) mainly due to the
recovery of commercial activity.
Increase in commissions from long-term savings products of 14.3%, mainly due to managing
more assets. Specifically, rise of Mutual funds, managed accounts and SICAVs of 14.7%, Pension
plans of 5.9% and Unit Link of 31.0%.
- Income and expense under insurance or reinsurance contracts, which reached €318 million, shows
a solid growth with respect to the first half of 2020 (+9.0%).
- Trading income stands at €+76 million, up €303 million in the same period of 2020, which included the
materialisation of unrealised gains from fixed-income assets.
- Other operating income and expense totalled €-341 million (€-318 million in the same period of 2020).
They include the contribution to the Single Resolution Fund (SRF) of €-162 million (€-151 million in the
first half of 2020).
Recurring administrative expenses, depreciation and amortisation drop with respect to the first half of
2020 and amounted to €-2,965 million, down 0.5%, after an active management of the cost base.
Allowances for insolvency risk amounted to €-460 million in the first half of 2021. In the first half of 2020,
€-1,796 million following the establishment of a provision for credit risk of €1,402 million to anticipate
future impacts associated with Covid-19.
The cost of risk (12 months) stands at 0.44%.
Other charges to provisions in the first half of 2020 included, among others, a total of €-109 million
associated with early retirements.
Gains/(losses) on disposal of assets and others stood at €-39 million (€-67 million in the same period of
2020, impacted by provisions for real estate assets).

Business activity and results: January – June 2021| 45
The following table shows the proforma quarterly performance of the banking and insurance business:
€ million 2Q21 1Q21 4Q20 3Q20 2Q20
INCOME STATEMENTNet interest income 1,534 1,540 1,646 1,622 1,605
Dividend income and share of profit/(loss) of entities accounted for using the equity method
63 62 104 99 56
Net fee and commission income 915 877 926 861 838Trading income 34 42 67 40 235Income and expense under insurance or reinsurance contracts 154 164 156 150 141Other operating income and expense (242) (98) (344) (72) (226)
Gross income 2,456 2,587 2,554 2,700 2,649
Recurring administrative expenses, depreciation and amortisation
(1,487) (1,479) (1,435) (1,453) (1,464)
Extraordinary expenses
Pre-impairment income 969 1,109 1,119 1,248 1,185
Pre-impairment income stripping out extraordinary expenses 969 1,109 1,119 1,248 1,185
Allowances for insolvency risk (148) (312) (545) (598) (1,072)Other charges to provisions (75) (71) (45) 59 (51)Gains/(losses) on disposal of assets and others (19) (20) 430 (81) (17)
Profit/(loss) before tax 728 705 960 627 46
Income tax expense (199) (195) (64) (135) 39
Profit/(loss) after tax 529 510 895 493 85
Profit/(loss) attributable to minority interest and others (0) (0) 1 1 (2)
Profit/(loss) attributable to the Group 529 510 894 492 87
INCOME STATEMENT BREAKDOWN
Core income 2,660 2,640 2,827 2,721 2,640
Banking services, securities and other fees 528 493 538 515 508Recurring 463 451 483 462 432Wholesale banking 66 42 55 53 77
Sale of insurance products 73 85 70 66 69Long-term savings products 314 299 317 280 260
Mutual funds, managed accounts and SICAVs 196 186 187 174 162Pension plans 75 74 89 74 68Unit Link and other 42 39 41 32 30
Net fee and commission income 915 877 926 861 838
Personnel expenses (939) (929) (903) (895) (907)General expenses (387) (384) (374) (393) (394)Depreciation and amortisation (160) (165) (158) (166) (162)
Recurring administrative expenses, depreciation and amortisation
(1,487) (1,479) (1,435) (1,453) (1,464)
Extraordinary expenses

Business activity and results: January – June 2021| 46
The following table shows business activity and asset quality indicators at 30 June 2021:
Loans and advances to customers, gross stood at €336,570 million in the year, up 54.2% following the
merger with Bankia. Considering the organic change, the total portfolio dropped 1.2%.
Customer funds stood at €566,621 million (+48.0% in the year, +6.1% organic change). Its organic evolution
is impacted by the increase of on-balance sheet funds (+3.1%) and the growth of assets under management
(+10.3%), marked by the positive net subscriptions and the performance of the markets.
The NPL ratio reached 3.7% (+30 basis points in the year), while the coverage ratio stood at 63%.
30 Jun. 2021 31 Mar. 2021 Change % 31 Dec. 2020 Change % Organic change
% € million
BALANCE SHEET
Assets 631,151 621,259 1.6 410,690 53.7 4.1
Liabilities 600,652 589,692 1.9 389,083 54.4 4.5
Assigned capital 30,470 31,539 (3.4) 21,582 41.2 (3.2)
LOANS AND ADVANCES TO CUSTOMERS
Loans to individuals 178,398 177,417 0.6 106,941 66.8 (0.5)
Home purchases 131,130 132,767 (1.2) 73,586 78.2 (3.3)
Other 47,269 44,649 5.9 33,355 41.7 5.7
of which: Consumer lending 17,488 17,683 (1.1) 12,753 37.1 (3.0)
Loans to business 136,056 139,114 (2.2) 96,331 41.2 (3.4)
Corporates and SMEs 129,985 132,787 (2.1) 90,767 43.2 (3.1)
Real estate developers 6,070 6,327 (4.1) 5,564 9.1 (8.4)
Public sector 22,116 21,303 3.8 15,005 47.4 7.5
Loans and advances to customers, gross 336,570 337,833 (0.4) 218,277 54.2 (1.2)
of which: Performing loans 323,779 325,120 (0.4) 210,584 53.8 (1.4)
of which: Non-performing loans 12,791 12,712 0.6 7,693 66.3 2.0
Provisions for insolvency risk (8,100) (8,521) (4.9) (5,105) 58.7 (7.1)
Loans and advances to customers, net 328,470 329,312 (0.3) 213,172 54.1 (1.1)
Contingent liabilities 24,729 24,665 0.3 15,254 62.1 2.5
CUSTOMER FUNDS
Customer funds 343,869 334,644 2.8 216,432 58.9 3.0
Demand deposits 314,549 302,928 3.8 202,980 55.0 5.1
Time deposits 29,320 31,716 (7.6) 13,451 (28.3)
Insurance contract liabilities 61,384 60,493 1.5 59,360 3.4 3.4
of which: Unit Link and other 17,144 15,833 8.3 14,607 17.4 17.4
Reverse repurchase agreements and other 2,087 1,012 2,044 2.1 2.0
On-balance sheet funds 407,340 396,148 2.8 277,835 46.6 3.1
Mutual funds, managed accounts and SICAVs
99,052 94,976 4.3 65,852 50.4 12.3
Pension plans 46,416 45,207 2.7 35,328 31.4 6.7
Assets under management 145,468 140,183 3.8 101,180 43.8 10.3
Other accounts 13,813 10,177 35.7 3,778
Total customer funds 566,621 546,508 3.7 382,794 48.0 6.1
ASSET QUALITY
Non-performing loan ratio (%) 3.7% 3.7% 3.4% 0.3 0.0
Non-performing loan coverage ratio (%) 63% 66% (3) 65% (2) (5)
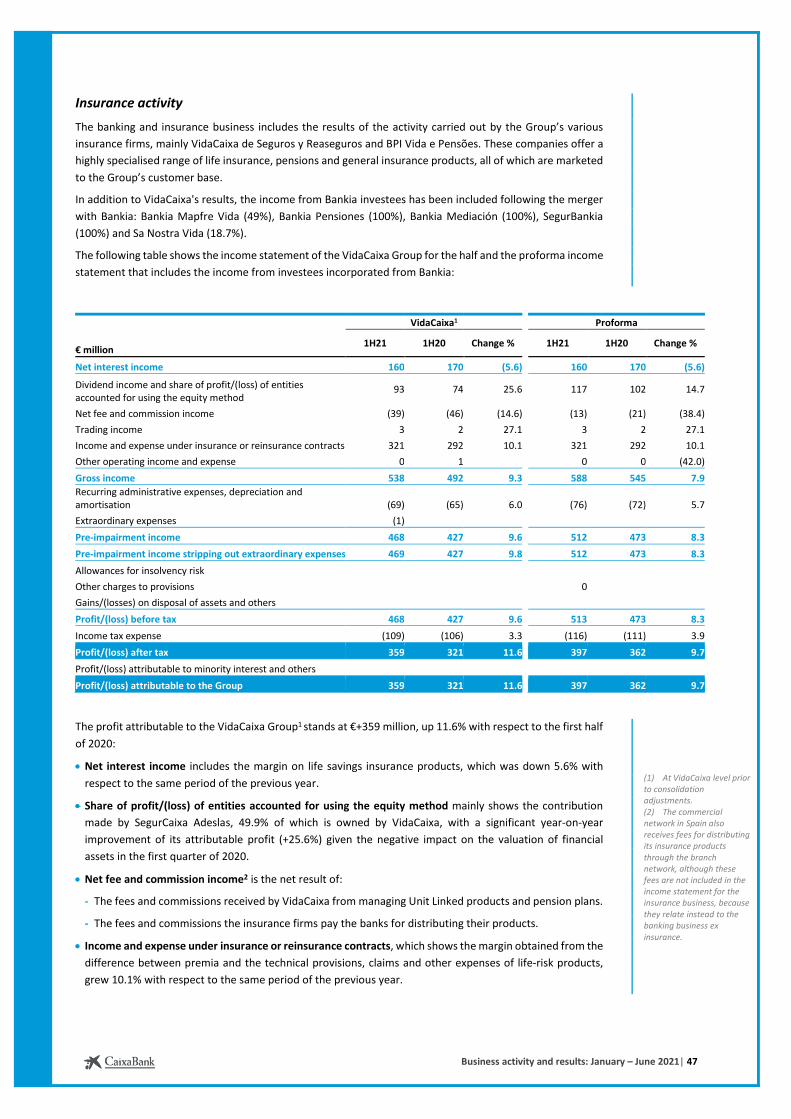
Business activity and results: January – June 2021| 47
Insurance activity
The banking and insurance business includes the results of the activity carried out by the Group’s various
insurance firms, mainly VidaCaixa de Seguros y Reaseguros and BPI Vida e Pensões. These companies offer a
highly specialised range of life insurance, pensions and general insurance products, all of which are marketed
to the Group’s customer base.
In addition to VidaCaixa's results, the income from Bankia investees has been included following the merger
with Bankia: Bankia Mapfre Vida (49%), Bankia Pensiones (100%), Bankia Mediación (100%), SegurBankia
(100%) and Sa Nostra Vida (18.7%).
The following table shows the income statement of the VidaCaixa Group for the half and the proforma income
statement that includes the income from investees incorporated from Bankia:
VidaCaixa1 Proforma
1H21 1H20 Change % 1H21 1H20 Change % € million
Net interest income 160 170 (5.6) 160 170 (5.6)
Dividend income and share of profit/(loss) of entities accounted for using the equity method
93 74 25.6 117 102 14.7
Net fee and commission income (39) (46) (14.6) (13) (21) (38.4)
Trading income 3 2 27.1 3 2 27.1
Income and expense under insurance or reinsurance contracts 321 292 10.1 321 292 10.1
Other operating income and expense 0 1 0 0 (42.0)
Gross income 538 492 9.3 588 545 7.9
Recurring administrative expenses, depreciation and amortisation (69) (65) 6.0 (76) (72) 5.7
Extraordinary expenses (1)
Pre-impairment income 468 427 9.6 512 473 8.3
Pre-impairment income stripping out extraordinary expenses 469 427 9.8 512 473 8.3
Allowances for insolvency risk
Other charges to provisions 0
Gains/(losses) on disposal of assets and others
Profit/(loss) before tax 468 427 9.6 513 473 8.3
Income tax expense (109) (106) 3.3 (116) (111) 3.9
Profit/(loss) after tax 359 321 11.6 397 362 9.7
Profit/(loss) attributable to minority interest and others
Profit/(loss) attributable to the Group 359 321 11.6 397 362 9.7
The profit attributable to the VidaCaixa Group1 stands at €+359 million, up 11.6% with respect to the first half
of 2020:
Net interest income includes the margin on life savings insurance products, which was down 5.6% with
respect to the same period of the previous year.
Share of profit/(loss) of entities accounted for using the equity method mainly shows the contribution
made by SegurCaixa Adeslas, 49.9% of which is owned by VidaCaixa, with a significant year-on-year
improvement of its attributable profit (+25.6%) given the negative impact on the valuation of financial
assets in the first quarter of 2020.
Net fee and commission income2 is the net result of:
- The fees and commissions received by VidaCaixa from managing Unit Linked products and pension plans.
- The fees and commissions the insurance firms pay the banks for distributing their products.
Income and expense under insurance or reinsurance contracts, which shows the margin obtained from the
difference between premia and the technical provisions, claims and other expenses of life-risk products,
grew 10.1% with respect to the same period of the previous year.
(1) At VidaCaixa level prior to consolidation adjustments. (2) The commercial network in Spain also receives fees for distributing its insurance products through the branch network, although these fees are not included in the income statement for the insurance business, because they relate instead to the banking business ex insurance.

Business activity and results: January – June 2021| 48
The following table shows the proforma quarterly performance of the insurance activity:
2Q21 1Q21 4Q20 3Q20 2Q20 € million
Net interest income 79 81 85 87 87
Dividend income and share of profit/(loss) of entities accounted for using the equity method
58 59 99 89 56
Net fee and commission income (4) (9) 21 (12) (9)
Trading income 1 2 2 1 2 Income and expense under insurance or reinsurance contracts
157 164 156 150 141
Other operating income and expense1 0 0 136 (0) 0
Gross income 292 296 499 315 278
Recurring administrative expenses, depreciation and amortisation (37) (38) (33) (35) (35)
Extraordinary expenses
Pre-impairment income 255 258 466 279 243
Pre-impairment income stripping out extraordinary expenses 255 258 466 279 243
Allowances for insolvency risk
Other charges to provisions 0
Gains/(losses) on disposal of assets and others
Profit/(loss) before tax 255 258 466 279 243
Income tax expense (57) (59) (67) (56) (57)
Profit/(loss) after tax 198 199 399 223 186
Profit/(loss) attributable to minority interest and others
Profit/(loss) attributable to the Group 198 199 399 223 186
(1) Other operating income and expense includes, in the fourth quarter of 2020, the one-off income associated with SegurCaixa Adeslas'
final earnout for €135 million.

Business activity and results: January – June 2021| 49
Equity investments business
The result in the first half of 2021 stood at €210 million (€+55 million in the same period of 2020).
Proforma
€ million 1H21 1H20 Change % 1H21 1H20 Change %
Net interest income (22) (47) (52.0) (23) (47) (52.2)
Dividend income 149 90 65.5 149 90 65.5
Share of profit/(loss) of entities accounted for using the equity method
83 7 82 6
Net fee and commission income
Trading income 2 (6) 2 (6)
Income and expense under insurance or reinsurance contracts
Other operating income and expense (8) (8)
Gross income 204 45 204 43
Recurring administrative expenses, depreciation and amortisation (2) (2) (2) (2)
Extraordinary expenses
Pre-impairment income 202 43 202 41
Pre-impairment income stripping out extraordinary expenses 202 43 202 41
Allowances for insolvency risk
Other charges to provisions
Gains/(losses) on disposal of assets and others
Profit/(loss) before tax 202 43 202 41
Income tax expense 8 12 (33.8) 8 12 (34.2)
Profit/(loss) after tax 210 55 210 54
Profit/(loss) attributable to minority interest and others
Profit/(loss) attributable to the Group 210 55 210 54
ROTE stripping out one-off impacts1 37.5% 13.8% 23.7
(1) The ROTE for 1H21 excludes the provision corresponding to Erste Group Bank in the fourth quarter of 2020 (€-311 million, net).
The coupon for the part of the AT1 issue assigned to this business has also been deducted.
The proforma result in the first half of 2021 stood at €210 million:
The Net interest income corresponds to the cost of financing the investee business. The year-on-year fall is
mainly due to the reduction of the average balance financed and lower funding expenses due to adapting
the rate to market conditions.
The Dividend income amounted to €149 million and includes in the second quarter of 2021 the dividends
from Telefónica for €51 million and BFA for €98 million (€50 million and €40 million, respectively in 2020).
With regard to BFA, it includes income associated with an extraordinary dividend for €54 million.
The Share of profit/(loss) of entities accounted for using the equity method stood at €82 million (€6 million
in the first half of 2020 due to the lower results attributed in the context of the start of the pandemic). The
proforma vision considers, in both years, the contribution of Gramina Homes, the impact of which is not
significant.
Trading income in both periods include the income from hedge contracts on investees.

Business activity and results: January – June 2021| 50
The following table shows the proforma quarterly performance of the equity investments business:
€ million 2Q21 1Q21 4Q20 3Q20 2Q20
Net interest income (10) (13) (14) (18) (22)
Dividend income 149 50 90
Share of profit/(loss) of entities accounted for using the equity method
62 21 9 28 (4)
Net fee and commission income
Trading income 1 1 (1) (3) (4) Income and expense under insurance or reinsurance contracts
Other operating income and expense (8) (3)
Gross income 194 9 42 8 60
Recurring administrative expenses, depreciation and amortisation (1) (1) (1) (1) (1)
Extraordinary expenses
Pre-impairment income 193 8 41 7 59
Pre-impairment income stripping out extraordinary expenses 193 8 41 7 59
Allowances for insolvency risk
Other charges to provisions
Gains/(losses) on disposal of assets and others1 (311)
Profit/(loss) before tax 193 8 (270) 7 59
Income tax expense 5 3 7 5 5
Profit/(loss) after tax 198 12 (263) 12 63
Profit/(loss) attributable to minority interest and others
Profit/(loss) attributable to the Group 198 12 (263) 12 63
(1) In the quarterly performance of Gains/(losses) on disposal of assets and others, the recognition in the fourth quarter of 2020, of the
provision, with conservative criteria, associated with the Erste Group Bank as a result of the impact of Covid-19 on the economic context
stands out, as well as the extended scenario of low interest rates.
The following balance sheet shows the investee business indicators:
€ million 30 Jun. 2021 31 Mar. 2021 Change % 31 Dec. 2020 Change %
Organic change %
BALANCE SHEET
Assets
Investments (Financial assets at fair value with changes in OCI and Investments in JVs and associates) and other2
3,463 3,569 (3.0) 3,267 6.0 2.5
Liabilities
Intra-group financing and other liabilities 2,697 2,743 (1.7) 2,565 5.2 2.1
Assigned capital3 766 826 (7.3) 702 9.1 4.0
(2) The figures at the end of 31 December 2020 do not include the investment in Gramina Homes, incorporated in the merger.
(3) The capital assigned to BFA and BCI is the amount required at sub-consolidated level for BPI for those interests.
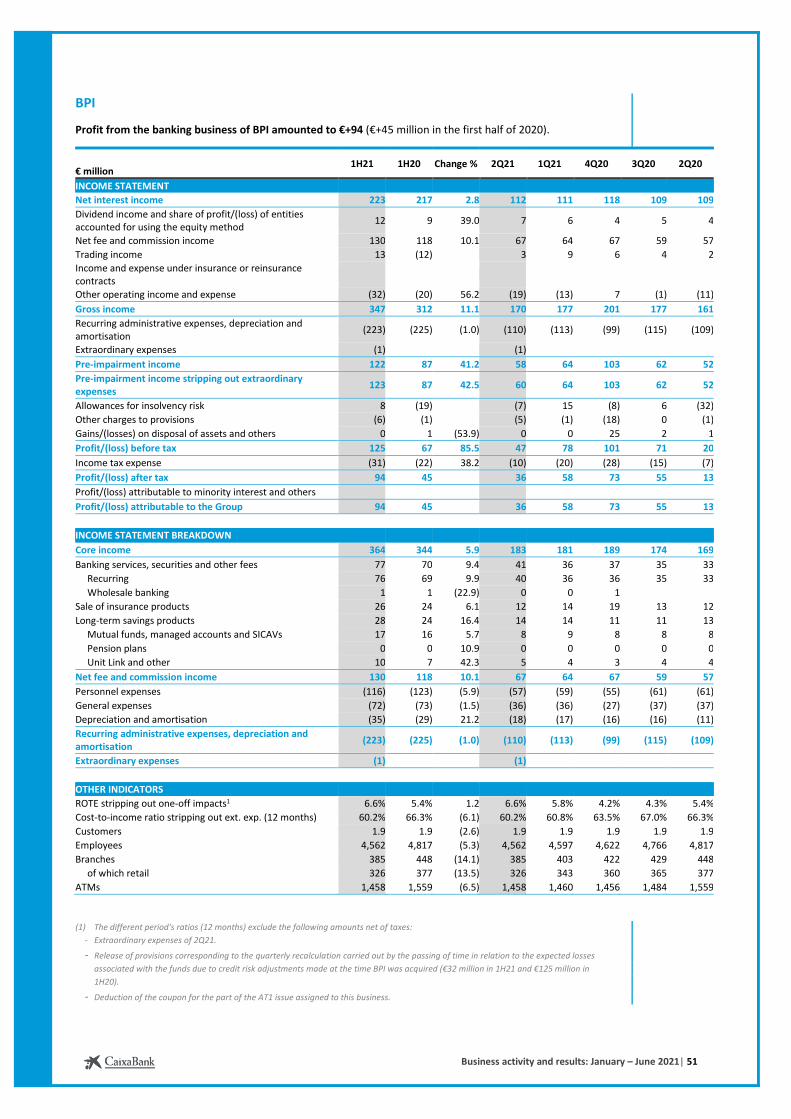
Business activity and results: January – June 2021| 51
BPI
Profit from the banking business of BPI amounted to €+94 (€+45 million in the first half of 2020).
€ million 1H21 1H20 Change % 2Q21 1Q21 4Q20 3Q20 2Q20
INCOME STATEMENT
Net interest income 223 217 2.8 112 111 118 109 109
Dividend income and share of profit/(loss) of entities accounted for using the equity method
12 9 39.0 7 6 4 5 4
Net fee and commission income 130 118 10.1 67 64 67 59 57
Trading income 13 (12) 3 9 6 4 2
Income and expense under insurance or reinsurance contracts
Other operating income and expense (32) (20) 56.2 (19) (13) 7 (1) (11)
Gross income 347 312 11.1 170 177 201 177 161
Recurring administrative expenses, depreciation and amortisation
(223) (225) (1.0) (110) (113) (99) (115) (109)
Extraordinary expenses (1) (1)
Pre-impairment income 122 87 41.2 58 64 103 62 52
Pre-impairment income stripping out extraordinary expenses
123 87 42.5 60 64 103 62 52
Allowances for insolvency risk 8 (19) (7) 15 (8) 6 (32)
Other charges to provisions (6) (1) (5) (1) (18) 0 (1)
Gains/(losses) on disposal of assets and others 0 1 (53.9) 0 0 25 2 1
Profit/(loss) before tax 125 67 85.5 47 78 101 71 20
Income tax expense (31) (22) 38.2 (10) (20) (28) (15) (7)
Profit/(loss) after tax 94 45 36 58 73 55 13
Profit/(loss) attributable to minority interest and others
Profit/(loss) attributable to the Group 94 45 36 58 73 55 13
INCOME STATEMENT BREAKDOWN
Core income 364 344 5.9 183 181 189 174 169
Banking services, securities and other fees 77 70 9.4 41 36 37 35 33
Recurring 76 69 9.9 40 36 36 35 33
Wholesale banking 1 1 (22.9) 0 0 1
Sale of insurance products 26 24 6.1 12 14 19 13 12
Long-term savings products 28 24 16.4 14 14 11 11 13
Mutual funds, managed accounts and SICAVs 17 16 5.7 8 9 8 8 8
Pension plans 0 0 10.9 0 0 0 0 0
Unit Link and other 10 7 42.3 5 4 3 4 4
Net fee and commission income 130 118 10.1 67 64 67 59 57
Personnel expenses (116) (123) (5.9) (57) (59) (55) (61) (61)
General expenses (72) (73) (1.5) (36) (36) (27) (37) (37)
Depreciation and amortisation (35) (29) 21.2 (18) (17) (16) (16) (11)
Recurring administrative expenses, depreciation and amortisation
(223) (225) (1.0) (110) (113) (99) (115) (109)
Extraordinary expenses (1) (1)
OTHER INDICATORS
ROTE stripping out one-off impacts1 6.6% 5.4% 1.2 6.6% 5.8% 4.2% 4.3% 5.4%
Cost-to-income ratio stripping out ext. exp. (12 months) 60.2% 66.3% (6.1) 60.2% 60.8% 63.5% 67.0% 66.3%
Customers 1.9 1.9 (2.6) 1.9 1.9 1.9 1.9 1.9
Employees 4,562 4,817 (5.3) 4,562 4,597 4,622 4,766 4,817
Branches 385 448 (14.1) 385 403 422 429 448
of which retail 326 377 (13.5) 326 343 360 365 377
ATMs 1,458 1,559 (6.5) 1,458 1,460 1,456 1,484 1,559
(1) The different period's ratios (12 months) exclude the following amounts net of taxes:
- Extraordinary expenses of 2Q21.
- Release of provisions corresponding to the quarterly recalculation carried out by the passing of time in relation to the expected losses
associated with the funds due to credit risk adjustments made at the time BPI was acquired (€32 million in 1H21 and €125 million in
1H20).
- Deduction of the coupon for the part of the AT1 issue assigned to this business.

Business activity and results: January – June 2021| 52
Gross income stands at €347 million, up 11.1% with respect to the first half of 2020:
- Core income up 5.9%.
- Net interest income totalled €223 million, with a 2.8% increase compared to the same period in the
previous year and a 0.6% rise with respect to the previous quarter.
- Fee and commission income stand at €130 million, up 10.1% on the same period of the previous year,
improving in all income items. With respect to the first quarter of 2021, they rose by 4.5%, mainly due
to the increase in banking fees and commissions.
- Trading income amounted to €13 million in the first half of 2021. In the first half of 2020, €-12 million,
which mainly included the value update of financial assets.
- Other operating income and expense totalled €-32 million and included the contribution paid to the SRF
and the Portuguese Fundo de Resoluçao (€-19 million and €-21 million in the second quarter of 2021 and
2020, respectively).
The first quarter of 2021 includes the contribution to the banking sector for €-18.8 million (€-15.5 million
in the previous year) and €-3.6 million from the solidarity tax on the banking sector (in 2020 recognised
in the third quarter).
Recurring administrative expenses, depreciation and amortisation slightly dropped 1.0%. Decline in
personnel expenses (-5.9%) as a result of the savings associated with the early retirements in the fourth
quarter of 2020, and increase in depreciation and amortisation (+21.2%), the performance of which is
impacted, among other factors, by more investments.
Allowances for insolvency risk stood at €8 million (€-19 million in the same period of 2020) after including
one-off income associated with the sale of portfolios in the first quarter of 2021.
The first half of 2020 (€-19 million) included the provision recognised anticipating future impacts associated
with Covid-19 for €-48 million.
Other charges to provisions in the second quarter of 2021 and fourth quarter of 2020 included, among
other items, the recognition of the costs associated with the early retirement scheme1.
(1) The cost arising from BPI's voluntary departures and early retirements amounted to €6.6 million in the second quarter of 2021, of which €1.1 million were recognised as extraordinary personnel expenses and €5.5 million as charges to provisions.
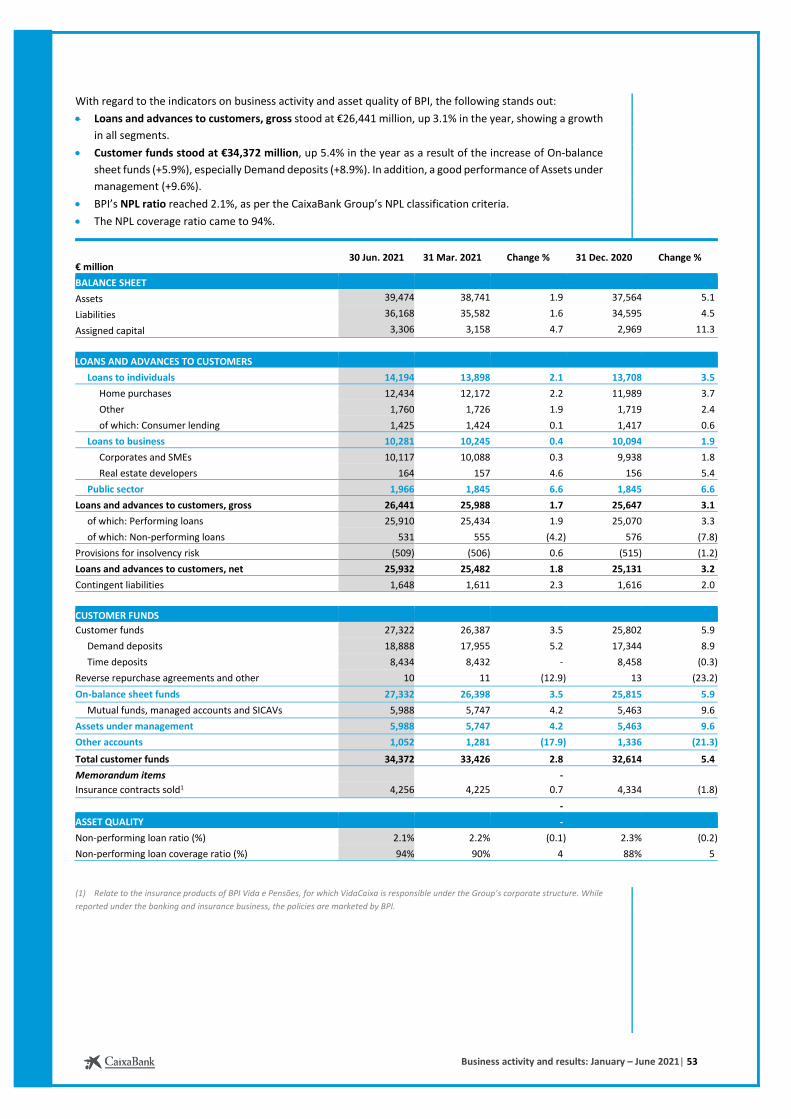
Business activity and results: January – June 2021| 53
With regard to the indicators on business activity and asset quality of BPI, the following stands out:
Loans and advances to customers, gross stood at €26,441 million, up 3.1% in the year, showing a growth
in all segments.
Customer funds stood at €34,372 million, up 5.4% in the year as a result of the increase of On-balance
sheet funds (+5.9%), especially Demand deposits (+8.9%). In addition, a good performance of Assets under
management (+9.6%).
BPI’s NPL ratio reached 2.1%, as per the CaixaBank Group’s NPL classification criteria.
The NPL coverage ratio came to 94%.
€ million 30 Jun. 2021 31 Mar. 2021 Change % 31 Dec. 2020 Change %
BALANCE SHEET
Assets 39,474 38,741 1.9 37,564 5.1
Liabilities 36,168 35,582 1.6 34,595 4.5
Assigned capital 3,306 3,158 4.7 2,969 11.3
LOANS AND ADVANCES TO CUSTOMERS
Loans to individuals 14,194 13,898 2.1 13,708 3.5
Home purchases 12,434 12,172 2.2 11,989 3.7
Other 1,760 1,726 1.9 1,719 2.4
of which: Consumer lending 1,425 1,424 0.1 1,417 0.6
Loans to business 10,281 10,245 0.4 10,094 1.9
Corporates and SMEs 10,117 10,088 0.3 9,938 1.8
Real estate developers 164 157 4.6 156 5.4
Public sector 1,966 1,845 6.6 1,845 6.6
Loans and advances to customers, gross 26,441 25,988 1.7 25,647 3.1
of which: Performing loans 25,910 25,434 1.9 25,070 3.3
of which: Non-performing loans 531 555 (4.2) 576 (7.8)
Provisions for insolvency risk (509) (506) 0.6 (515) (1.2)
Loans and advances to customers, net 25,932 25,482 1.8 25,131 3.2
Contingent liabilities 1,648 1,611 2.3 1,616 2.0
CUSTOMER FUNDS
Customer funds 27,322 26,387 3.5 25,802 5.9
Demand deposits 18,888 17,955 5.2 17,344 8.9
Time deposits 8,434 8,432 - 8,458 (0.3)
Reverse repurchase agreements and other 10 11 (12.9) 13 (23.2)
On-balance sheet funds 27,332 26,398 3.5 25,815 5.9
Mutual funds, managed accounts and SICAVs 5,988 5,747 4.2 5,463 9.6
Assets under management 5,988 5,747 4.2 5,463 9.6
Other accounts 1,052 1,281 (17.9) 1,336 (21.3)
Total customer funds 34,372 33,426 2.8 32,614 5.4
Memorandum items -
Insurance contracts sold1 4,256 4,225 0.7 4,334 (1.8)
-
ASSET QUALITY -
Non-performing loan ratio (%) 2.1% 2.2% (0.1) 2.3% (0.2)
Non-performing loan coverage ratio (%) 94% 90% 4 88% 5
(1) Relate to the insurance products of BPI Vida e Pensões, for which VidaCaixa is responsible under the Group’s corporate structure. While
reported under the banking and insurance business, the policies are marketed by BPI.

Business activity and results: January – June 2021| 54
The CaixaBank share
The CaixaBank share closed trading on 30 June 2021 at €2.594/share, down 1.7% in the quarter and a
cumulative rise of 23.5% in the year. In spite of a certain decline late in the half, the good performance of
the markets in the first half of 2021 has boosted the selective bank benchmarks (+27.0% EURO STOXX Banks
and +28.7% IBEX 35 Banks in the year) and the general indices (+14.4% EURO STOXX 50 and +9.3% IBEX 35).
The widespread reactivation of the economic activity stands out in the second quarter thanks to the lower
impact of the pandemic and the reduced mobility restrictions, mainly due to the progress in the vaccination
process. This favoured the continuity of the stock market's recovery until, in June, the consolidation of the
risk of inflation, the Fed's tougher tone and the threat to the efforts made to contain the advance of new
coronavirus strains revived a certain uncertainty in the trading floors, driving investors away from the more
cyclical stocks or those with higher exposure to the future of the tourist season.
In the second quarter of 2021, the number of shares traded1 dropped 29.1% with respect to the same period
of the previous year and 16.5% on the first quarter of 2021. In addition, the trading volume1 in euros was
9.2% up on the volume of shares traded in the second quarter of 2020 but 5.2% down on the previous
quarter. In the first half of 2021 the trading volume in shares and euros were 30.5% and 15.6% down,
respectively, when compared to the first half of 2020.
(1) Traded in trading platforms, such as: BME, BATS Chi-X, TURQUOISE and BATS Europe, among others, while excluding over-the-counter
transactions. It does not include block transactions or applications.
Dec. 20 Jan. 21 Feb. 21 Mar. 21 Apr. 21 May. 21 Jun. 21
CaixaBank Ibex35 Eurostoxx50 Eurostoxx Eurozone Banks
Performance of the CaixaBank share compared to the main Spanish and European indices.
23.5% 9.3% 14.4% 27.0%

Business activity and results: January – June 2021| 55
Key performance indicators for the CaixaBank share
30 Jun. 2021
Market capitalisation (€ million) 20,890
Number of outstanding shares1 8,053,344
Share price (€/share)
Share price at the beginning of the period (31 Dec. 2020) 2.101
Share price at closing of the period (30 Jun. 2021) 2.594
Maximum price2 2.871
Minimum price2 1.948
Trading volume in 2021 (number of shares, excluding special transactions, in thousands)
Maximum daily trading volume 96,338
Minimum daily trading volume 8,106
Average daily trading volume 18,265
Stock market ratios
Profit attributable to the Group excluding impacts from the merger (€ million) (12 months)3 2,269
Average number of shares (12 months)1 6,669,740
Net income attributable per share ex M&A (EPS) (€/share) 0.34
Net equity excluding minority interests (€ million) 34,542
Number of shares at 30 Jun. 20211 8,053,344
Book value (€/share) 4.29
Net equity excluding minority interests (tangible) (€ million) 29,440
Number of shares at 30 Jun. 20211 8,053,344
Tangible book value (€/share) 3.66
PER (Price / EPS ex M&A3; times) 7.63
P/tangible BV (Market value / tangible book value) 0.71
Dividend yield4 1.03%
(1) Number of shares, in thousands, excluding treasury shares.
(2) Price at close of trading.
(3) It does not include the extraordinary impacts related to the merger with Bankia.
(4) Calculated by dividing the remuneration for the financial year 2020 (0.0268 euros/share) by the closing price at the end of the period
(2.594 euros/share).
Shareholder returns
On 24 May 2021, 0.0268 euros were paid per share. This was the total shareholder remuneration charged
to 2020 profits. The payment of this dividend will entail that shareholder remuneration for the 20205 Fiscal
Year is equivalent to 15% of the proforma adjusted consolidated net profit of Bankia and CaixaBank, in line
with the recommendation issued by the European Central Bank.
As regards the dividend policy, and following the European Central Bank's announcement on 23 July 2021
of not extending its recommendation on dividend distributions beyond September 2021, the Board of
Directors approved on 29 July 2021 the Dividend Policy for 2021, establishing the distribution of a cash
dividend of 50% of the consolidated net profit adjusted by the extraordinary impacts from the merger with
Bankia in a single payout in 2022.
(5) Maximum distributable amount 15% of the profit of the CaixaBank Group and Bankia, adjusted by the payment of coupons of both companies, the reclassifications of OCIs against P&L and the amortisation of intangible assets with a neutral impact on capital adequacy.
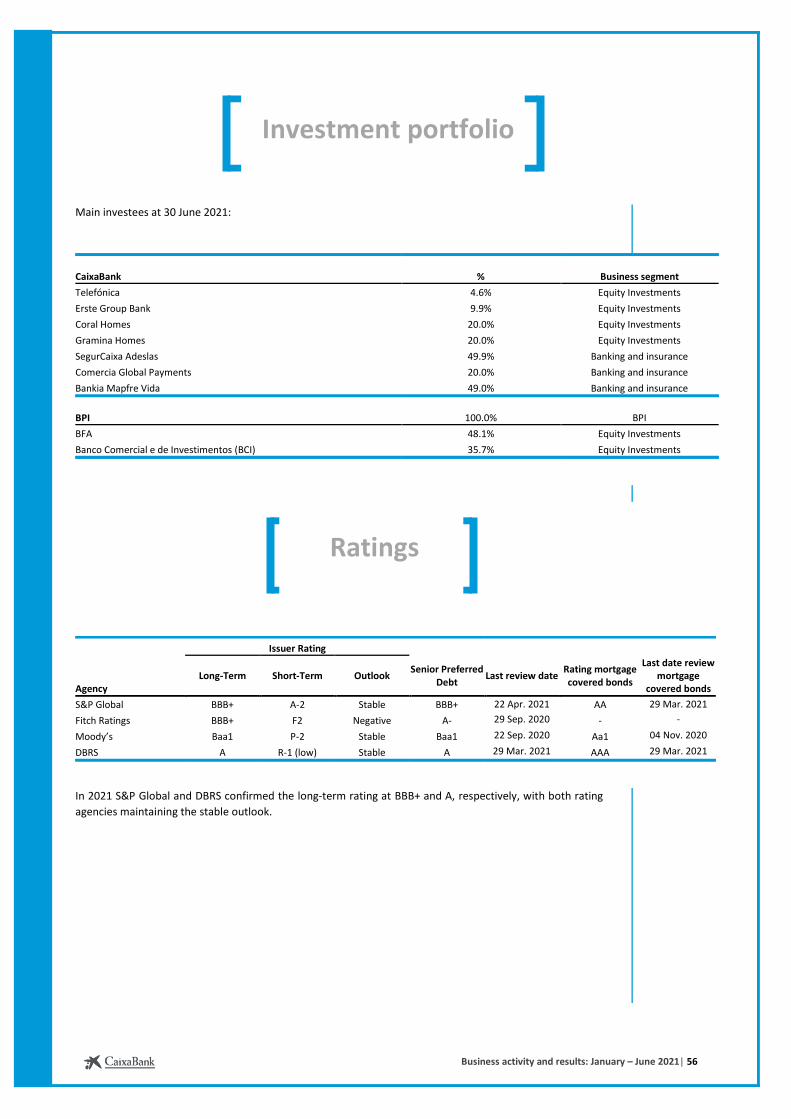
Business activity and results: January – June 2021| 56
Investment portfolio
Main investees at 30 June 2021:
CaixaBank % Business segment
Telefónica 4.6% Equity Investments
Erste Group Bank 9.9% Equity Investments
Coral Homes 20.0% Equity Investments
Gramina Homes 20.0% Equity Investments
SegurCaixa Adeslas 49.9% Banking and insurance
Comercia Global Payments 20.0% Banking and insurance
Bankia Mapfre Vida 49.0% Banking and insurance 49%Banking and insurance
BPI 100.0% BPI
BFA 48.1% Equity Investments
Banco Comercial e de Investimentos (BCI) 35.7% Equity Investments
Ratings
Issuer Rating
Long-Term Short-Term Outlook Senior Preferred
Debt Last review date
Rating mortgage covered bonds
Last date review mortgage
covered bondsAgency
S&P Global BBB+ A-2 Stable BBB+ 22 Apr. 2021 AA 29 Mar. 2021
Fitch Ratings BBB+ F2 Negative A- 29 Sep. 2020 - -
Moody’s Baa1 P-2 Stable Baa1 22 Sep. 2020 Aa1 04 Nov. 2020
DBRS A R-1 (low) Stable A 29 Mar. 2021 AAA 29 Mar. 2021
In 2021 S&P Global and DBRS confirmed the long-term rating at BBB+ and A, respectively, with both rating
agencies maintaining the stable outlook.

Business activity and results: January – June 2021| 57
Appendices
The Group recognised a positive amount equivalent to the negative difference arising on consolidation of
€4,300 million under Gains/(losses) on disposal of assets and others of the consolidated income statement
(before and after tax). Below is a breakdown of the negative consolidation difference and additional
information on the fair value adjustments carried out in the business combination:
Bankia Group equity at 31 Mar. 2021 (a) 13,088
Fair value adjustments and other, net (b) (3,474)
Loans and advances (1) (710)
Real estate tangible assets (2) (140)
Other financial instruments (3) (254)
Tax assets and liabilities (4) (2,241)
Other assets and liabilities (5) (129)
Acquisition price (c) 5,314
Negative consolidation difference (a+b-c) 4,300
1- Including the fair value adjustments on the lending portfolio classified at amortised cost compared with the
provisions constituted by the Bankia Group at 31 March 2021. This adjustment includes the effect of
adjusting the lifetime expected loss.
2- The value of the portfolio of real estate assets has been adjusted considering appraisals available and other
parameters.
3- Mainly includes the adjustments of financial assets and liabilities at amortised cost, as a result of measuring
them at their listed price or using methodologies based on market assumptions.
4- Within the framework of the business combination and merger with Bankia, and considering the alignment
of criteria and judgment of the administrators and the negative impact of the current economic situation,
as well as the ESMA statement of 20191, it has deemed appropriate not to recognise tax loss carryforwards
for an amount of €2,023 million. Thus, on 31 March the CaixaBank Group has unrecognised tax loss
carryforwards for a total amount of €2,909 million. The current recovery period for on-balance sheet tax
assets is under 15 years.
5- Including, among others, the book value adjustment of non-controlling interest in associates based on
generally accepted methodologies; compensations linked to certain commercial arrangements; the
recognition of intangible assets that meet the criteria of separability or contractual legality; the
derecognition of intangible assets that have not been assigned a market value; adjustments linked to the
unification of assumptions on the value of defined benefit pension commitments and other long-term
obligations with employees, as well as the measurement of contingent liabilities of a legal, fiscal or
employment nature from past events in which Bankia is involved.
6-
Additional information on the fair value adjustments
(1) Statement on the recognition of deferred tax assets of July 2019: “Considerations on recognition of deferred tax assets arising from the carry-forward of unused tax losses”.

Business activity and results: January – June 2021| 58
In addition to the financial information prepared in accordance with International Financial Reporting
Standards (IFRSs), this document includes certain Alternative Performance Measures (APMs) as defined in the
guidelines on Alternative Performance Measures issued by the European Securities and Markets Authority on
30 June 2015 (ESMA/2015/1057) (the “ESMA Guidelines”). CaixaBank uses certain APMs, which have not been
audited, for a better understanding of the Group's financial performance. These measures are considered
additional disclosures and in no case replace the financial information prepared under IFRSs. Moreover, the
way the Group defines and calculates these measures may differ to the way similar measures are calculated
by other companies. Accordingly, they may not be comparable.
ESMA guidelines define an APM as a financial measure of historical or future performance, financial position,
or cash flows, other than a financial measure defined or specified in the applicable financial reporting
framework.
In accordance with these guidelines, following is a list of the APMs used, along with a reconciliation between
certain management indicators and the indicators presented in the consolidated financial statements
prepared under IFRS. Figures are presented in millions of euros unless the use of another unit is stated
explicitly.
Alternative Performance Measures used by the Group
1- Profitability and cost-to-income
a) Customer spread:
Explanation: difference between:
o average rate of return on loans (annualised quarterly income from loans and advances to customers
divided by the net average balance of loans and advances to customers for the quarter).
o average rate for retail customer funds (annualised quarterly cost of retail customer funds divided by
the average balance of those same retail customer funds for the quarter, excluding subordinated
liabilities that can be classified as retail).
Note: The average balances of the analysed period are calculated on the basis of the daily closing balances of said period, except in the
case of some subsidiaries, for which the average balances are calculated as the arithmetic average of the closing balances of each month.
In 1Q21 the ratio does not include the results generated by Bankia in the first quarter or, for consistency purposes, the contribution of
the balance items incorporated at 31 March.
Purpose: allows the Group to track the spread between interest income and costs for customers.
2Q20 3Q20 4Q20 1Q21 2Q21
Numerator Annualised quarterly income from loans and advances to customers 4,452 4,364 4,352 4,177 5,688
Denominator Net average balance of loans and advances to customers 224,866 227,006 229,195 227,891 339,866
(a) Average yield rate on loans (%) 1.98 1.92 1.90 1.83 1.67
Numerator Annualised quarterly cost of on-balance sheet retail customer funds 32 36 16 12 8
Denominator Average balance of on-balance sheet retail customers funds 228,742 237,387 240,052 236,670 362,009
(b) Average cost rate of retail customer funds (%) 0.01 0.02 0.01 0.01 0.00
Customer spread (%) (a - b) 1.97 1.90 1.89 1.82 1.67
Alternative performance measures

Business activity and results: January – June 2021| 59
2Q20 3Q20 4Q20 1Q21 2Q21
Numerator Annualised quarterly income from loans and advances to customers 6,282 6,162 6,194 5,872 5,688
Denominator Net average balance of loans and advances to customers 341,282 343,973 345,967 343,818 339,866
(a) Average yield rate on loans (%) 1.84 1.79 1.79 1.71 1.67
Numerator Annualised quarterly cost of on-balance sheet retail customer funds 56 36 20 24 8
Denominator Average balance of on-balance sheet retail customers funds 345,872 354,728 357,931 354,718 362,009
(b) Average cost rate of retail customer funds (%) 0.02 0.01 0.01 0.01 0.00
Proforma customer spread (%) (a - b) 1.82 1.78 1.78 1.70 1.67
b) Balance sheet spread:
Explanation: difference between:
o average rate of return on assets (annualised interest income for the quarter divided by total average
assets for the quarter).
o average cost of funds (annualised interest expenses for the quarter divided by total average funds for
the quarter).
Note: The average balances of the analysed period are calculated on the basis of the daily closing balances of said period, except in the
case of some subsidiaries, for which the average balances are calculated as the arithmetic average of the closing balances of each month.
In 1Q21 the ratio does not include the results generated by Bankia in the first quarter or, for consistency purposes, the contribution of
the balance items incorporated at 31 March.
Purpose: allows the Group to track the spread between interest income and cost for its on-balance sheet
assets and liabilities.
2Q20 3Q20 4Q20 1Q21 2Q21
Numerator Annualised quarterly interest income 6,664 6,767 6,863 6,708 8,371
Denominator Average total assets for the quarter 423,859 450,730 456,953 454,329 671,368
(a) Average return rate on assets (%) 1.57 1.50 1.50 1.48 1.25
Numerator Annualised quarterly interest expenses 1,737 1,906 1,878 1,878 1,809
Denominator Average total funds for the quarter 423,859 450,730 456,953 454,329 671,368
(b) Average cost of fund rate (%) 0.41 0.42 0.41 0.41 0.27
Balance sheet spread (%) (a - b) 1.16 1.08 1.09 1.07 0.98
2Q20 3Q20 4Q20 1Q21 2Q21
Numerator Annualised quarterly interest income 8,893 9,062 9,186 8,849 8,371
Denominator Average total assets for the quarter 635,202 661,993 668,680 660,552 671,368
(a) Average return rate on assets (%) 1.40 1.37 1.37 1.34 1.25
Numerator Annualised quarterly interest expenses 2,091 2,244 2.224 2,202 1,809
Denominator Average total funds for the quarter 635,202 661,993 668,680 660,552 671,368
(b) Average cost of fund rate (%) 0.33 0.34 0.33 0.33 0.27
Proforma balance sheet spread (%) (a - b) 1.07 1.03 1.04 1.01 0.98

Business activity and results: January – June 2021| 60
c) ROE:
Explanation: Profit/(loss) attributable to the Group (adjusted by the amount of the Additional Tier 1
coupon reported in shareholder equity) divided by average shareholder equity plus valuation adjustments
for the last 12 months (calculated as the average value of the monthly average balances).
ROE:
- Numerator: Attributable profit/(loss) for the last 12 months, including impacts from the merger.
- Denominator: Includes as of 31 March 2021 the increase of shareholder equity from the merger with Bankia.
ROE ex M&A impacts:
- The impacts associated with the merger in the numerator are eliminated in 1Q21 and 2Q21.
Purpose: allows the Group to monitor the return on its shareholder equity.
2Q20 3Q20 4Q20 1Q21 2Q21
(a) Profit/(loss) attributable to the Group 12M 1,289 1,166 1,381 6,078 5,357
(b) Additional Tier 1 coupon (133) (133) (143) (155) (185)
Numerator Adjusted profit/(loss) attributable to the Group 12M (a+b) 1,156 1,033 1,238 5,922 5,172
(c) Average shareholder equity 12M 25,947 26,144 26,406 26,687 29,464
(d) Average valuation adjustments 12M (1,187) (1,416) (1,647) (1,805) (1,806)
Denominator Average shareholder equity + valuation adjustments 12M (c+d) 24,760 24,728 24,759 24,882 27,657
ROE (%) 4.7% 4.2% 5.0% 23.8% 18.7%
(e) Extraordinary income from the merger - - - 4,272 2,903
Numerator Adjusted numerator 12M (a+b-e) - - - 1,651 2,269
ROE (%) ex M&A impacts - - - 6.6% 8.2%
d) ROTE:
Explanation: quotient between:
o Profit/(loss) attributed to the Group (adjusted by the amount of the Additional Tier 1 coupon,
registered in shareholder equity).
o 12-month average shareholder equity plus valuation adjustments (calculated as the average value of
the monthly average balances) deducting intangible assets using management criteria (calculated as
the value of intangible assets in the public balance sheet, plus the intangible assets and goodwill
associated with investees, net of provisions, recognised in Investments in joint ventures and
associates in the public balance sheet).
ROTE:
- Numerator: Attributable profit/(loss) for the last 12 months, including impacts from the merger.
- Denominator: Includes as of 31 March 2021 the increase of shareholder equity from the merger with Bankia.
ROTE ex M&A impacts:
- The impacts associated with the merger in the numerator are eliminated in 1Q21 and 2Q21.
Purpose: metric used to measure the return on a company’s tangible equity.
2Q20 3Q20 4Q20 1Q21 2Q21
(a) Profit/(loss) attributable to the Group 12M 1,289 1,166 1,381 6,078 5,357
(b) Additional Tier 1 coupon (133) (133) (143) (155) (185)
Numerator Adjusted profit/(loss) attributable to the Group 12M (a+b) 1,156 1,033 1,238 5,922 5,172
(c) Average shareholder equity 12M 25,947 26,144 26,406 26,687 29,464
(d) Average valuation adjustments 12M (1,187) (1,416) (1,647) (1,805) (1,806)
(e) Average intangible assets 12M (4,247) (4,266) (4,295) (4,353) (4,555)
Denominator Average shareholder equity + valuation adjustments excluding intangible assets 12M (c+d+e)
20,513 20,462 20,463 20,529 23,102
ROTE (%) 5.6% 5.0% 6.1% 28.8% 22.4%
(f) Extraordinary income from the merger - - - 4,272 2,903
Numerator Adjusted numerator 12M (a+b-f) - - - 1,651 2,269
ROTE (%) ex M&A impacts 8.0% 9.8%

Business activity and results: January – June 2021| 61
e) ROA:
Explanation: net profit (adjusted by the amount of the Additional Tier 1 coupon reported in shareholder
equity) divided by average total assets for the last 12 months (calculated as the average value of the daily
balances of the analysed period).
ROA:
- Numerator: Attributable profit/(loss) for the last 12 months, including extraordinary impacts from the merger.
- Denominator: Includes as of 31 March 2021 the increase of average total assets from the merger with Bankia.
ROA ex M&A impacts:
- Numerator: The extraordinary impacts associated with the merger are eliminated in 1Q21 and 2Q21.
Purpose: measures the level of return relative to assets.
2Q20 3Q20 4Q20 1Q21 2Q21
(a) Profit/(loss) after tax and before minority interest 12M 1,287 1,166 1,382 6,078 5,360
(b) Additional Tier 1 coupon (133) (133) (143) (155) (185)
Numerator Adjusted net profit 12M (a+b) 1,154 1,032 1,238 5,922 5,174
Denominator Average total assets 12M 410,410 421,331 433,785 446,487 506,854
ROA (%) 0.3% 0.2% 0.3% 1.3% 1.0%
(c) Extraordinary impact from the merger - - - 4,272 2,903
Numerator Adjusted numerator 12M (a+b-c) - - - 1,651 2,271
ROA (%) ex M&A impacts 0.3% 0.2% 0.3% 0.4% 0.5%
f) RORWA:
Explanation: net profit (adjusted by the amount of the Additional Tier 1 coupon reported in shareholder
equity) divided by average total risk-weighted assets for the last 12 months (calculated as the average
value of the quarterly average balances).
RORWA:
- Numerator: Attributable profit/(loss) for the last 12 months, including extraordinary impacts from the merger.
- Denominator: Includes as of 31 March 2021 the increase of average risk-weighted assets from the merger with Bankia.
RORWA ex Bankia integration:
- Numerator: The extraordinary impacts associated with the merger are eliminated in 1Q21 and 2Q21.
Purpose: measures the return based on risk-weighted assets.
2Q20 3Q20 4Q20 1Q21 2Q21
(a) Profit/(loss) after tax and before minority interest 12M 1,287 1,166 1,382 6,078 5,360
(b) Additional Tier 1 coupon (133) (133) (143) (155) (185)
Numerator Adjusted net profit 12M (a+b) 1,154 1,032 1,238 5,922 5,174
Denominator Risk-weighted assets (regulatory) 12M 148,099 147,667 146,709 145,566 163,801
RORWA (%) 0.8% 0.7% 0.8% 4.1% 3.2%
(c) Extraordinary impact from the merger - - - 4,272 2,903
Numerator Adjusted numerator 12M (a+b-c) - - - 1,651 2,271
RORWA (%) ex M&A impacts 0.8% 0.7% 0.8% 1.1% 1.4%

Business activity and results: January – June 2021| 62
h) Cost-to-income ratio:
Explanation: operating expenses (administrative expenses, depreciation and amortisation) divided by
gross income (or core income for the core efficiency ratio) for the last 12 months.
Purpose: metric widely used in the banking sector to compare the cost to income generated.
2Q20 3Q20 4Q20 1Q21 2Q21
Numerator Administrative expenses, depreciation and amortisation 12M 4,709 4,659 4,579 4,581 6,952
Denominator Gross income 12M 8,277 8,255 8,409 8,489 9,175
Cost-to-income ratio 56.9% 56.4% 54.5% 54.0% 75.8%
2Q20 3Q20 4Q20 1Q21 2Q21
Numerator Administrative expenses, depreciation and amortisation stripping out extraordinary expenses 12M
4,707 4,658 4,579 4,540 4,981
Denominator Gross income 12M 8,277 8,255 8,409 8,489 9,175
Cost-to-income ratio stripping out extraordinary expenses 56.9% 56.4% 54.5% 53.5% 54.3%
2Q20 3Q20 4Q20 1Q21 2Q21
Numerator Administrative expenses, depreciation and amortisation stripping out extraordinary expenses 12M
4,707 4,658 4,579 4,540 4,981
Denominator Core income 12M 8,296 8,272 8,310 8,330 9,145
Core cost-to-income ratio 56.7% 56.3% 55.1% 54.5% 54.5%
2Q20 3Q20 4Q20 1Q21 2Q21
Numerator Administrative expenses, depreciation and amortisation 12M 6,449 6,384 6,311 6,269 6,294
Denominator Gross income 12M 11,267 11,159 11,311 11,325 11,276
Proforma cost-to-income ratio 57.2% 57.2% 55.8% 55.4% 55.8%
2Q20 3Q20 4Q20 1Q21 2Q21
Numerator Administrative expenses, depreciation and amortisation stripping out extraordinary expenses 12M
6,449 6,384 6,311 6,269 6,294
Denominator Core income 12M 11,373 11,367 11,456 11,475 11,521
Proforma core cost-to-income ratio 56.7% 56.2% 55.1% 54.6% 54.6%
2- Risk Management
a) Cost of risk:
Explanation: total allowances for insolvency risk (12 months) divided by average of gross loans to
customers plus contingent liabilities, using management criteria (calculated as the average value of the
monthly closing balances).
Cost of risk:
- Numerator: Allowances for insolvency risk (12 months).
- Denominator: Includes as of 31 March 2021 the increase of loans to customers plus contingent liabilities from the merger with Bankia.
Purpose: indicator used to monitor and track the cost of allowances for insolvency risk on the loan book.

Business activity and results: January – June 2021| 63
2Q20 3Q20 4Q20 1Q21 2Q21
Numerator Allowances for insolvency risk 12M 1,506 1,682 1,915 1,574 910
Denominator Average of gross loans + contingent liabilities 12M 247,898 251,400 255,548 259,335 291,750
Cost of risk (%) 0.61% 0.67% 0.75% 0.61% 0.31%
2Q20 3Q20 4Q20 1Q21 2Q21
Numerator Allowances for insolvency risk 12M - - 2,959 2,545 1,596
Denominator Average of gross loans + contingent liabilities 12M - - 386,425 390,581 390,043
Proforma cost of risk (%) - - 0.77% 0.65% 0.41%
b) Non-performing loan ratio:
Explanation: quotient between:
o non-performing loans and advances to customers and contingent liabilities, using management
criteria.
o total gross loans and advances to customers and contingent liabilities, using management criteria.
Purpose: indicator used to monitor and track the change in the quality of the loan portfolio.
2Q20 3Q20 4Q20 1Q21 2Q21
Numerator Non-performing loans and contingent liabilities 9,220 9,078 8,601 14,077 14,005
Denominator Total gross loans and contingent liabilities 260,261 259,034 260,794 390,097 389,389
Non-performing loan ratio (%) 3.5% 3.5% 3.3% 3.6% 3.6%
c) Coverage ratio:
Explanation: quotient between:
o total credit loss provisions for loans and advances to customers and contingent liabilities, using
management criteria.
o non-performing loans and advances to customers and contingent liabilities, using management
criteria.
Purpose: indicator used to monitor NPL coverage via provisions.
2Q20 3Q20 4Q20 1Q21 2Q21
Numerator Provisions on loans and contingent liabilities 5,786 5,883 5,755 9,415 9,001
Denominator Non-performing loans and contingent liabilities 9,220 9,078 8,601 14,077 14,005
Coverage ratio (%) 63% 65% 67% 67% 64%

Business activity and results: January – June 2021| 64
d) Real estate available for sale coverage ratio:
Explanation: quotient between:
o gross debt cancelled at the foreclosure or surrender of the real estate asset less the present net book
value of the real estate asset.
o gross debt cancelled at the foreclosure or surrender of the real estate asset.
Note: Coverage solely available for real estate exposure from CaixaBank.
Purpose: reflects the coverage level via write-downs and accounting provisions on foreclosed real estate
assets available for sale.
2Q20 3Q20 4Q20 1Q21 2Q21
(a) Gross debt cancelled at the foreclosure 1,626 1,634 1,613 1,887 1,917
(b) Net book value of the foreclosed assets 973 973 930 1,084 1,109
Numerator Total coverage of the foreclosed asset (a - b) 653 661 683 803 808
Denominator Gross debt cancelled at the foreclosure 1,626 1,634 1,613 1,887 1,917
Real estate available for sale coverage ratio (%) 40% 40% 42% 43% 42%
e) Real estate available for sale coverage ratio with accounting provisions:
Explanation: quotient between:
o Accounting coverage: charges to provisions of foreclosed assets.
o Book value of the foreclosed asset: sum of net carrying amount and the accounting provision.
Purpose: indicator of accounting provisions covering foreclosed real estate assets available for sale.
2Q20 3Q20 4Q20 1Q21 2Q21
Numerator Accounting provisions of the foreclosed assets 445 456 488 1,126 1,103
(a) Net book value of the foreclosed assets 973 973 930 2,267 2,297
(b) Accounting provisions of the foreclosed assets 445 456 488 1,126 1,103
Denominator Gross book value of the foreclosed asset (a + b) 1,418 1,429 1,418 3,393 3,400
Real estate available for sale accounting coverage (%) 31% 32% 34% 33% 32%
3- Liquidity
a) Total Liquid Assets
Explanation: Sum of HQLAs (High Quality Liquid Assets within the meaning of Commission Delegated
Regulation of 10 October 2014) plus the available balance under the facility with the European Central
Bank (non-HQLA).
Purpose: shows the Bank's liquidity position.
2Q20 3Q20 4Q20 1Q21 2Q21
(a) High Quality Liquid Assets (HQLAs) 88,655 92,385 95,367 146,339 161,929
(b) Available balance under the ECB facility (non-HQLAs) 17,954 18,344 19,084 807 802
Total liquid assets (a + b) 106,609 110,729 114,451 147,146 162,731

Business activity and results: January – June 2021| 65
b) Loan-to-deposits:
Explanation: quotient between:
o net loans and advances to customers using management criteria excluding brokered loans (funded by
public institutions).
o On-balance sheet customer funds.
Purpose: metric showing the retail funding structure (enables us to measure the proportion of retail
lending being funded by customer funds).
2Q20 3Q20 4Q20 1Q21 2Q21
Numerator Loans and advances to customers, net (a-b-c) 233,664 232,635 234,877 348,498 350,468
(a) Loans and advances to customers, gross 242,956 241,877 243,924 363,821 363,012
(b) Provisions for insolvency risk 5,655 5,756 5,620 9,027 8,609
(c) Brokered loans 3,637 3,485 3,426 6,296 3,935
Denominator On-balance sheet customer funds 234,922 237,860 242,234 361,031 371,191
Loan to Deposits (%) 99% 98% 97% 97% 94%
4- Stock market ratios
a) EPS (Earnings per share): Profit/(loss) attributed to the Group (adjusted by the amount of the Additional
Tier 1 coupon, registered in shareholder equity) divided by the average number of shares outstanding.
Note: The average number of shares outstanding is calculated as average number of shares less the average number of treasury shares.
The average is calculated as the average number of shares at the closing of each month of the analysed period. The impacts associated
with the merger in the numerator are eliminated in 1Q21 and 2Q21.
2Q20 3Q20 4Q20 1Q21 2Q21
(a) Profit/(loss) attributable to the Group 12M 1,289 1,166 1,381 6,078 5,357
(b) Additional Tier 1 coupon (133) (133) (143) (155) (185)
Numerator Adjusted profit attributable to the Group (a+b) 1,156 1,033 1,238 5,922 5,172
Denominator Average number of shares outstanding, net of treasury shares (c) 5,978 5,978 5,978 5,977 6,670
EPS (Earnings per share) 0.19 0.17 0.21 0.99 0.78
(d) Extraordinary impact from the merger - - - 4,272 2,903
Numerator Adjusted numerator (a+b-d) - - - 1,651 2,269
EPS (Earnings per share) ex M&A impacts - - - 0.28 0.34
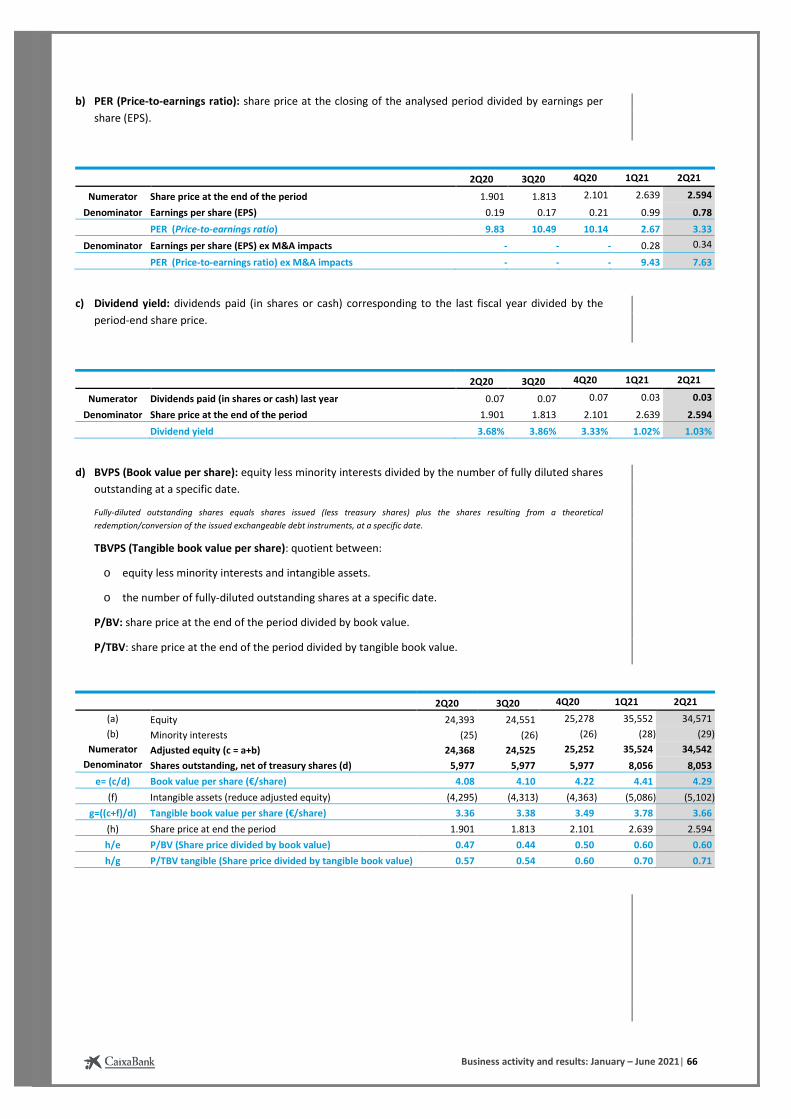
Business activity and results: January – June 2021| 66
b) PER (Price-to-earnings ratio): share price at the closing of the analysed period divided by earnings per
share (EPS).
2Q20 3Q20 4Q20 1Q21 2Q21
Numerator Share price at the end of the period 1.901 1.813 2.101 2.639 2.594
Denominator Earnings per share (EPS) 0.19 0.17 0.21 0.99 0.78
PER (Price-to-earnings ratio) 9.83 10.49 10.14 2.67 3.33
Denominator Earnings per share (EPS) ex M&A impacts - - - 0.28 0.34
PER (Price-to-earnings ratio) ex M&A impacts - - - 9.43 7.63
c) Dividend yield: dividends paid (in shares or cash) corresponding to the last fiscal year divided by the
period-end share price.
2Q20 3Q20 4Q20 1Q21 2Q21
Numerator Dividends paid (in shares or cash) last year 0.07 0.07 0.07 0.03 0.03
Denominator Share price at the end of the period 1.901 1.813 2.101 2.639 2.594
Dividend yield 3.68% 3.86% 3.33% 1.02% 1.03%
d) BVPS (Book value per share): equity less minority interests divided by the number of fully diluted shares
outstanding at a specific date.
Fully-diluted outstanding shares equals shares issued (less treasury shares) plus the shares resulting from a theoretical
redemption/conversion of the issued exchangeable debt instruments, at a specific date.
TBVPS (Tangible book value per share): quotient between:
o equity less minority interests and intangible assets.
o the number of fully-diluted outstanding shares at a specific date.
P/BV: share price at the end of the period divided by book value.
P/TBV: share price at the end of the period divided by tangible book value.
2Q20 3Q20 4Q20 1Q21 2Q21
(a) Equity 24,393 24,551 25,278 35,552 34,571
(b) Minority interests (25) (26) (26) (28) (29)
Numerator Adjusted equity (c = a+b) 24,368 24,525 25,252 35,524 34,542
Denominator Shares outstanding, net of treasury shares (d) 5,977 5,977 5,977 8,056 8,053
e= (c/d) Book value per share (€/share) 4.08 4.10 4.22 4.41 4.29
(f) Intangible assets (reduce adjusted equity) (4,295) (4,313) (4,363) (5,086) (5,102)
g=((c+f)/d) Tangible book value per share (€/share) 3.36 3.38 3.49 3.78 3.66
(h) Share price at end the period 1.901 1.813 2.101 2.639 2.594
h/e P/BV (Share price divided by book value) 0.47 0.44 0.50 0.60 0.60
h/g P/TBV tangible (Share price divided by tangible book value) 0.57 0.54 0.60 0.70 0.71

Business activity and results: January – June 2021| 67
Adapting the public income statement to management format
Net fee and commission income. Includes the following line items:
Fee and commission income.
Fee and commission expenses
Trading income. Includes the following line items:
Gains/(losses) on derecognition of financial assets and liabilities not measured at fair value through
profit or loss (net).
Gains/(losses) on financial assets not designated for trading compulsorily measured fair value through
profit or loss (net).
Gains/(losses) on financial assets and liabilities held for trading, net.
Gains/(losses) from hedge accounting, net.
Exchange differences (net).
Administrative expenses, depreciation and amortisation. Includes the following line items:
• Administrative expenses.
• Depreciation and amortisation.
Pre-impairment income.
• (+) Gross income.
• (-) Operating expenses.
Impairment losses on financial assets and other provisions. Includes the following line items:
• Impairment/(reversal) of impairment losses on financial assets not measured at fair value through
profit or loss or gains/(losses) on adjustments.
• Provisions/(reversal) of provisions.
Of which: Allowances for insolvency risk.
• Impairment/(reversal) of impairment losses on financial assets not measured at fair value through
profit or loss corresponding to Loans and advances to customers, using management criteria.
• Provisions/(reversal) of provisions corresponding to Provisions for contingent liabilities, using
management criteria.
Of which: Other charges to provisions.
• Impairment/(reversal) of impairment losses on financial assets not measured at fair value through
profit or loss, excluding balances corresponding to Loans and advances to customers, using
management criteria.
• Provisions/(reversal) of provisions, excluding provisions corresponding to contingent liabilities using
management criteria.
Gains/(losses) on derecognition of assets and others. Includes the following line items:
• Impairment or reversal of impairment on investments in joint ventures or associates.
• Impairment or reversal of impairment on non-financial assets.
• Gains/(losses) on derecognition of non-financial assets and investments, net.
• Negative goodwill recognised in profit or loss.
• Profit/(loss) from non-current assets and disposal groups classified as held for sale not qualifying as
discontinued operations (net).
Profit/(loss) attributable to minority interests and others. Includes the following line items:
• Profit/(loss) for the period attributable to minority interests (non-controlling interests).
• Profit/(loss) after tax from discontinued operations.
Reconciliation between the accounting and management information

Business activity and results: January – June 2021| 68
Reconciliation of activity indicators using management criteria
Loans and advances to customers, gross
June 2021
€ million
Financial assets at amortised cost - Customers (Public Balance Sheet) 355,132
Reverse repurchase agreements (public and private sector) (1,439)
Clearing houses (1,995)
Other, non-retail, financial assets (360)
Financial assets not designated for trading compulsorily measured at fair value through profit or loss- Loans and advances (Public Balance Sheet)
77
Fixed income bonds considered retail financing (Financial assets at amortised cost - Public debt securities, Balance Sheet) 2,764
Fixed income bonds considered retail financing (Assets under the insurance business - Balance Sheet) 223
Provisions for insolvency risk 8,609
Loans and advances to customers (gross) using management criteria 363,012
Insurance contract liabilities
June 2021
€ million
Liabilities under the insurance business (Public Balance Sheet) 73,965
Capital gains/(losses) under the insurance business (excluding unit link and other) (12,580)
Liabilities under insurance contracts, using management criteria 61,384
Customer funds
June 2021
€ million
Financial liabilities at amortised cost - Customer deposits (Public balance sheet) 384,605
Non-retail financial liabilities (registered under Financial liabilities at amortised cost - Customer deposits) (12,725)
Multi-issuer covered bonds and subordinated deposits (5,671)
Counterparties and other (7,055)
Retail financial liabilities (registered under Financial liabilities at amortised cost - Debt securities) 1,408
Retail issues and other 1,408
Liabilities under insurance contracts, using management criteria 61,384
Total on-balance sheet customer funds 434,672
Assets under management 151,456
Other accounts1 14,865
Total customer funds 600,993
(1) In addition to transitional funds associated with transfers and collection activity, it includes the amount of Savings insurance marketed
by Bankia, which largely corresponds to the joint venture with Mapfre.

Business activity and results: January – June 2021| 69
Institutional issuances for banking liquidity purposes
June 2021
€ million
Financial liabilities at amortised cost - Debt securities issued (Public Balance Sheet) 53,089
Institutional financing not considered for the purpose of managing bank liquidity (5,481)
Securitised bonds (1,948)
Value adjustments (2,369)
Retail (1,408)
Issues acquired by companies within the group and other 245
Customer deposits for the purpose of managing bank liquidity1 5,671
Institutional financing for the purpose of managing bank liquidity 53,279
(1) A total of €5,638 million in multi-issuer covered bonds (net of retained issues) and €33 million in subordinated deposits.
Foreclosed real estate assets (available for sale and held for rent)
June 2021
€ million
Non-current assets and disposal groups classified as held for sale (Public Balance Sheet) 2,880
Other non-foreclosed assets (628)
Inventories under the heading - Other assets (Public Balance Sheet) 45
Foreclosed available for sale real estate assets 2,297
Tangible assets (Public Balance Sheet) 8,887
Tangible assets for own use (6,785)
Other assets (312)
Foreclosed rental real estate assets 1,790

Business activity and results: January – June 2021| 70
Returns on average total assets ex M&A impacts
Below is a breakdown of the annualised quarterly income/cost to average total assets. In 1Q21 the
extraordinary expenses and the negative consolidation difference were excluded from the numerator and
Bankia's balances from the denominator, to ensure consistency.
2Q21 1Q21 4Q20 3Q20 2Q20 %
Interest income 1.25 1.48 1.50 1.50 1.57
Interest expense (0.27) (0.41) (0.41) (0.42) (0.41)
Net interest income 0.98 1.07 1.09 1.08 1.16
Dividend income 0.09 0.00 0.05 0.00 0.09
Share of profit/(loss) of entities accounted for using the equity method 0.07 0.05 0.07 0.11 0.04
Net fee and commission income 0.59 0.59 0.58 0.56 0.58
Trading income 0.02 0.04 0.05 0.04 0.15
Income and expense under insurance or reinsurance contracts 0.09 0.15 0.14 0.13 0.13
Other operating income and expense (0.16) (0.06) (0.11) (0.03) (0.13)
Gross income 1.68 1.84 1.87 1.89 2.02
Recurring administrative expenses, depreciation and amortisation (0.95) (1.02) (0.95) (1.00) (1.09)
Pre-impairment income 0.73 0.82 0.92 0.89 0.93
Allowances for insolvency risk (0.09) (0.16) (0.28) (0.23) (0.78)
Other charges to provisions (0.05) (0.04) (0.03) (0.02) (0.04)
Gains/(losses) on disposal of assets and others (0.01) 0.00 0.02 (0.04) (0.02)
Profit/(loss) before tax 0.58 0.62 0.63 0.60 0.09
Income tax expense (0.12) (0.16) (0.06) (0.14) 0.02
Profit/(loss) after tax 0.46 0.46 0.57 0.46 0.11
Profit/(loss) attributable to minority interest and others 0.00 0.00 0.00 0.00 0.00
Profit/(loss) attributable to the Group 0.46 0.46 0.57 0.46 0.11
Average total net assets (€ million) 671,368 454,329 456,953 450,730 423,859
Breakdown of the performance of the income statement by item

Business activity and results: January – June 2021| 71
Quarterly cost and income
Below is the breakdown of the quarterly cost and income. The information for 1Q21 does not include the
results generated by Bankia in the first quarter or, for consistency purposes, the contribution of the balance
items incorporated at 31 March.
2Q21 1Q21 4Q20
€ million Average balance
Income or expense Rate %
Average balance
Income or expense Rate %
Average balance
Income or expense Rate %
Financial Institutions 90,624 237 1.05 58,905 149 1.03 59,461 154 1.03
Loans and advances (a) 339,866 1,418 1.67 227,891 1,030 1.83 229,195 1,094 1.90
Debt securities 81,848 49 0.24 41,416 61 0.59 42,706 62 0.58
Other assets with returns 63,497 379 2.40 66,103 413 2.53 66,736 412 2.45
Other assets 95,533 4 - 60,014 1 - 58,855 3 -
Total average assets (b) 671,368 2,087 1.25 454,329 1,654 1.48 456,953 1,725 1.50
Financial Institutions 109,060 (96) 0.35 65,016 (62) 0.38 64,159 (66) 0.41
Retail customer funds (c) 362,009 (2) - 236,670 (3) 0.01 240,052 (4) 0.01
Wholesale marketable debt securities & other 47,690 (35) 0.29 29,113 (44) 0.61 30,433 (47) 0.62
Subordinated liabilities 9,727 (7) 0.30 6,218 (16) 1.07 5,983 (18) 1.18
Other funds with cost 75,907 (297) 1.57 76,136 (327) 1.74 75,884 (322) 1.69
Other funds 66,975 (14) - 41,176 (11) - 40,442 (15) -
Total average funds (d) 671,368 (451) 0.27 454,329 (463) 0.41 456,953 (472) 0.41
Net interest income 1,636 1,191 1,253
Customer spread (%) (a-c) 1.67 1.82 1.89
Balance sheet spread (%) (b-d) 0.98 1.07 1.09
3Q20 2Q20
€ million Average balance
Income or expense Rate %
Average balance
Income or expense Rate %
Financial Institutions 56,521 130 0.91 29,532 75 1.02
Loans and advances (a) 227,006 1,097 1.92 224,866 1,110 1.98
Debt securities 43,819 63 0.57 47,870 74 0.62
Other assets with returns 65,052 410 2.51 63,272 395 2.51
Other assets 58,332 1 - 58,319 3 -
Total average assets (b) 450,730 1,701 1.50 423,859 1,657 1.57
Financial Institutions 64,467 (64) 0.39 48,640 (33) 0.28
Retail customer funds (c) 237,387 (9) 0.02 228,742 (8) 0.01
Wholesale marketable debt securities & other 30,621 (59) 0.76 29,965 (56) 0.75
Subordinated liabilities 5,400 (18) 1.36 5,400 (18) 1.37
Other funds with cost 73,730 (318) 1.71 71,373 (304) 1.71
Other funds 39,125 (11) - 39,739 (12) -
Total average funds (d) 450,730 (479) 0.42 423,859 (432) 0.41
Net interest income 1,222 1,225
Customer spread (%) (a-c) 1.90 1.97
Balance sheet spread (%) (b-d) 1.08 1.16

Business activity and results: January – June 2021| 72
Fees and commissions
1H21 1H20 Change % 2Q21 1Q21 4Q20 3Q20 2Q20 € million
Banking services, securities and other fees 918 725 26.6 569 349 358 360 347
Recurring 816 625 30.7 503 314 321 317 288
Wholesale banking 101 100 1.2 66 36 37 43 58
Sale of insurance products 141 97 45.5 85 56 56 49 47
Long-term savings products 581 444 30.7 327 253 256 229 215
Mutual funds, managed accounts and SICAVs 355 268 32.6 204 151 141 138 129
Pension plans 134 107 25.0 76 59 71 56 52
Unit Link and other1 91 69 32.3 47 43 44 36 34
Net fee and commission income 1,640 1,266 29.5 981 659 671 638 608
Income from equity investments
1H21 1H20 Change % 2Q21 1Q21 4Q20 3Q20 2Q20 € million
Dividend income 152 94 61.3 151 52 2 93
Share of profit/(loss) of entities accounted for using the equity method
205 97 112.2 129 77 88 122 41
Income from equity investments 357 191 87.1 280 77 140 123 134
Trading income
1H21 1H20 Change % 2Q21 1Q21 4Q20 3Q20 2Q20 € million
Trading income 80 142 (43.8) 38 42 56 40 162
Income and expense under insurance or reinsurance contracts
1H21 1H20 Change % 2Q21 1Q21 4Q20 3Q20 2Q20 € million
Income and expense under insurance or reinsurance contracts
318 292 9.0 154 164 156 150 141
Other operating income and expense
1H21 1H20 Change % 2Q21 1Q21 4Q20 3Q20 2Q20 € million
Contributions and levies (200) (127) 57.9 (181) (19) (243) (111) Other real estate income and expense (including Spanish property tax in Q1)
(35) (23) 53.6 (14) (20) (1) 1 (6)
Other (104) (49) (73) (31) 117 (31) (19)
Other operating income and expense (339) (199) 70.5 (268) (70) (127) (30) (136)

Business activity and results: January – June 2021| 73
Administration expenses, depreciation and amortisation
1H21 1H20 Change % 2Q21 1Q21 4Q20 3Q20 2Q20 € million
Gross income 4,883 4,117 18.6 2,820 2,063 2,149 2,143 2,134
Personnel expenses (1,712) (1,454) 17.7 (997) (715) (689) (698) (715)
General expenses (720) (619) 16.4 (423) (298) (277) (303) (310)
Depreciation and amortisation (315) (272) 15.8 (178) (136) (129) (139) (132)
Recurring administrative expenses, depreciation and amortisation
(2,747) (2,345) 17.1 (1,598) (1,149) (1,095) (1,140) (1,157)
Extraordinary expenses (1,970) (1,930) (40)
Cost-to-income ratio (%) (12 months) 75.8 56.9 18.9 75.8 54.0 54.5 56.4 56.9
Cost-to-income ratio stripping out extraordinary expenses (%) (12 months)
54.3 56.9 (2.6) 54.3 53.5 54.5 56.4 56.9
Core income 4,899 4,064 20.6 2,833 2,066 2,152 2,094 2,019 Recurring administrative expenses, depreciation and amortisation
(2,747) (2,345) 17.1 (1,598) (1,149) (1,095) (1,140) (1,157)
Core cost-to-income ratio (12 months) 54.5 56.7 (2.3) 54.5 54.5 55.1 56.3 56.7
Allowances for insolvency risk and other charges to provisions
1H21 1H20 Change % 2Q21 1Q21 4Q20 3Q20 2Q20 € million
Allowances for insolvency risk (328) (1,334) (75.4) (155) (174) (321) (260) (819)
Other charges to provisions (155) (184) (15.9) (106) (49) (40) (23) (41)
Allowances for insolvency risk and other charges to provisions
(483) (1,518) (68.2) (261) (223) (361) (283) (859)
Gains/(losses) on disposal of assets and others
1H21 1H20 Change % 2Q21 1Q21 4Q20 3Q20 2Q20 € million
Negative consolidation difference 4,300 4,300
Real estate results 7 (23) (5) 12 (88) (23) (10)
Other (23) (26) (10.3) (13) (10) 112 (19) (9)
Gains/(losses) on disposal of assets and others 4,284 (49) (18) 4,303 25 (42) (19)

Business activity and results: January – June 2021| 74
Income statement
Below is Bankia's income statement for the first quarter of 2021 and the year 2020 and its quarterly
performance in accordance with the CaixaBank Group's presentation criteria.
With regard to the information reported by Bankia to the market in relation to its performance in 2020, line
items have been reclassified without changing the published total results.
1Q21 2020
reported by Bankia
Reclass. 2020 CABK
criterion1Q20 2Q20 3Q20 4Q20
€ million
Net interest income 448 1,904 12 1.916 461 467 491 497
Dividend income 2 2 1 1Share of profit/(loss) of entities accounted for using the equity method 12 60 60 12 12 9 27
Net fee and commission income 282 1,213 (53) 1,160 269 287 282 322
Trading income 10 160 160 72 71 2 15
Other operating income and expense (41) (250) (146) (396) (39) (101) (43) (214)
Gross income 711 3,088 (187) 2,902 776 736 742 649
Recurring administrative expenses, depreciation and amortisation (444) (1,781) 48 (1,732) (447) (416) (429) (440)
Extraordinary expenses (17)
Pre-impairment income 250 1,308 (138) 1,169 329 319 313 208
Pre-impairment income stripping out extraordinary expenses 267 1,308 (138) 1,169 329 319 313 208
Allowances for insolvency risk (123) (1,044) (1,044) (195) (285) (331) (232)
Other charges to provisions (23) 24 9 34 (14) (11) 82 (24)
Gains/(losses) on disposal of assets and others (23) 23 43 66 (19) 3 (37) 120
Gains/(losses) on disposal of assets and others 81 311 (86) 225 100 26 27 72
Income tax expense (27) (81) 86 5 (6) 22 11 (22)
Profit/(loss) after tax 54 230 230 94 48 38 50
Profit/(loss) attributable to minority interest and others
Profit/(loss) attributable to the Group 54 230 230 94 48 37 50
The main reclassifications carried out to unify the presentation criteria in the total for 2020 are:
- Net fee and commission income: €-53 million, mainly from the recognition of certain expenses associated
with e-payment fees and commissions (€-41 million, previously recognised as higher operating expenses).
- Other operating income and expense: €-146 million, of which the following stand out:
o €-39 million of expenses associated with the real estate activity, which were recognised in
Gains/(losses) on disposal of assets and others.
o €-86 million of guarantee cost of monetisable DTAs, which were recognised in Income tax expense.
Adapting Bankia's financial information using CaixaBank management criteria1
(1) See the unification of loans and advances to customers and customer funds in accordance with the CaixaBank Group's presentation criteria in the 1Q21 Business Activity and
Results Report.

Business activity and results: January – June 2021| 75
a) Quarterly performance of the income statement and solvency ratios
CABK
€ million 2Q21 1Q21 4Q20 3Q20 2Q20
Net interest income 1,524 1,080 1,136 1,114 1,117
Dividend income 52 51 2 51
Share of profit/(loss) of entities accounted for using the equity method 120 65 83 112 39
Net fee and commission income 915 595 603 579 551
Trading income 34 32 54 38 162
Income and expense under insurance or reinsurance contracts 154 164 156 150 141
Other operating income and expense (242) (57) (131) (29) (125)
Gross income 2,555 1,880 1,953 1,965 1,936
Recurring administrative expenses, depreciation and amortisation (1,488) (1,036) (996) (1,025) (1,048)
Extraordinary expenses (1,929) (40)
Pre-impairment income (861) 803 957 940 887
Pre-impairment income stripping out extraordinary expenses 1,068 844 957 940 887
Allowances for insolvency risk (148) (189) (313) (267) (787)
Other charges to provisions (101) (48) (22) (23) (40)
Gains/(losses) on disposal of assets and others (19) 4,302 (44) (19)
Profit/(loss) before tax (1,129) 4,869 623 606 41
Income tax expense 393 (147) (38) (142) 24
Profit/(loss) after tax (736) 4,722 585 465 65
Profit/(loss) attributable to minority interest and others 1 1 (2)
Profit/(loss) attributable to the Group (736) 4,722 584 464 67
Risk-weighted assets 220,311 190,471 126,082 128,073 129,849
Common Equity Tier 1 (CET1) 12.7% 14.1% 13.6% 12.3% 12.1%
Total capital 17.4% 19.1% 18.2% 16.2% 15.8%
BPI
€ million 2Q21 1Q21 4Q20 3Q20 2Q20
Net interest income 111 111 117 109 108
Dividend income 100 42
Share of profit/(loss) of entities accounted for using the equity method 9 12 6 10 1
Net fee and commission income 67 64 67 59 57
Trading income 4 10 2 2
Income and expense under insurance or reinsurance contracts
Other operating income and expense (26) (13) 4 (1) (11)
Gross income 265 183 196 178 198
Recurring administrative expenses, depreciation and amortisation (110) (113) (99) (115) (109)
Extraordinary expenses (1)
Pre-impairment income 153 70 97 63 89
Pre-impairment income stripping out extraordinary expenses 154 70 97 63 89
Allowances for insolvency risk (7) 15 (8) 6 (32)
Other charges to provisions (5) (1) (18) (1)
Gains/(losses) on disposal of assets and others 25 2 1
Profit/(loss) before tax 141 85 95 72 57
Income tax expense (11) (21) (24) (15) (9)
Profit/(loss) after tax 131 63 71 57 48
Profit/(loss) attributable to minority interest and others
Profit/(loss) attributable to the Group 131 63 71 57 48
Risk-weighted assets 18,439 18,113 17,991 17,657 17,650
Common Equity Tier 1 (CET1) 14.3% 14.4% 14.1% 13.9% 13.8%
Total capital 17.4% 17.6% 17.3% 17.1% 17.0%
Historical income statement figures for the CABK and BPI perimeters

Business activity and results: January – June 2021| 76
b) Quarterly cost and income as part of net interest income
CAIXABANK
2Q21 1Q21 4Q20 3Q20 2Q20
€ million Average balance
Income or expense Rate %
Average balance
Income or expense Rate %
Average balance
Income or expense Rate %
Average balance
Income or expense Rate %
Average balance
Income or expense Rate %
Financial Institutions 84,242 224 1.06 53,109 139 1.06 54,169 139 1.02 51,444 122 0.94 26,180 71 1.08
Loans and advances (a) 316,909 1,322 1.67 205,378 935 1.85 206,898 996 1.91 204,992 999 1.94 202,946 1,014 2.01
Debt securities 75,573 43 0.23 35,201 53 0.61 36,598 54 0.59 37,729 56 0.59 41,689 66 0.63
Other assets with returns 63,497 379 2.40 66,103 413 2.53 66,736 412 2.45 65,052 410 2.51 63,272 395 2.51
Other assets 96,248 2 - 60,638 1 - 59,320 3 - 58,759 1 - 58,689 2 -
Total average assets (b) 636,469 1,970 1.24 420,429 1,541 1.49 423,721 1,604 1.51 417,976 1,588 1.51 392,776 1,548 1.59
Financial Institutions 103,196 (91) 0.35 59,397 (59) 0.40 58,583 (63) 0.43 58,829 (61) 0.41 43,933 (34) 0.31
Retail customer funds (c) 335,029 (5) 0.01 210,507 (6) 0.01 214,664 (5) 0.01 212,470 (10) 0.02 204,633 (10) 0.02
Wholesale marketable debt securities & other 46,689 (34) 0.29 28,061 (43) 0.62 29,382 (45) 0.61 29,569 (56) 0.76 28,912 (54) 0.75
Subordinated liabilities 9,727 (7) 0.30 6,218 (16) 1.07 5,983 (18) 1.18 5,400 (18) 1.36 5,400 (18) 1.37
Other funds with cost 75,901 (297) 1.57 76,130 (327) 1.74 75,884 (322) 1.69 73,730 (318) 1.71 71,373 (304) 1.71
Other funds 65,927 (12) - 40,116 (10) - 39,224 (15) - 37,978 (11) - 38,525 (11) -
Total average funds (d) 636,469 (446) 0.28 420,429 (461) 0.44 423,721 (468) 0.44 417,976 (474) 0.45 392,776 (431) 0.44
Net interest income 1,524 1,080 1,136 1,114 1,117
Customer spread (%) (a-c) 1.66 1.84 1.90 1.92 1.99
Balance sheet spread (%) (b-d) 0.96 1.05 1.07 1.06 1.15
BPI
2Q21 1Q21 4Q20 3Q20 2Q20
€ million Average balance
Income or expense Rate %
Average balance
Income or expense Rate %
Average balance
Income or expense Rate %
Average balance
Income or expense Rate %
Average balance
Income or expense Rate %
Financial Institutions 6,584 13 0.78 6,017 12 0.79 5,512 15 1.11 5,264 8 0.60 3,494 5 0.53
Loans and advances (a) 22,959 96 1.68 22,516 94 1.70 22,298 98 1.75 22,015 98 1.77 21,976 95 1.75
Debt securities 7,334 12 0.63 7,238 13 0.71 7,133 13 0.71 7,115 13 0.72 7,206 14 0.76
Other assets with returns - - - - -
Other assets 2,687 - 2,624 - 2,623 - 2,695 - 2,739 -
Total average assets (b) 39,564 121 1.22 38,396 119 1.25 37,566 126 1.33 37,090 119 1.27 35,415 114 1.30
Financial Institutions 5,912 (5) 0.33 5,626 (4) 0.26 5,584 (3) 0.23 5,648 (3) 0.22 4,738 1 (0.06)
Retail customer funds (c) 27,172 3 (0.04) 26,384 3 (0.04) 25,588 2 (0.03) 25,099 1 (0.01) 24,312 1 (0.02)
Wholesale marketable debt securities & other 1,451 (3) 0.81 1,500 (3) 0.77 1,500 (3) 0.85 1,502 (3) 0.91 1,503 (3) 0.88
Subordinated liabilities 300 (4) 5.30 300 (4) 5.34 300 (4) 5.36 300 (4) 5.51 300 (4) 5.52
Other funds with cost - - - - -
Other funds 4,730 (1) - 4,586 - 4,594 (1) - 4,541 (1) - 4,562 (1) -
Total average funds (d) 39,564 (10) 0.10 38,396 (8) 0.08 37,566 (9) 0.10 37,090 (10) 0.11 35,415 (6) 0.07
Net interest income 111 111 117 109 108
Customer spread (%) (a-c) 1.72 1.74 1.78 1.78 1.77
Balance sheet spread (%) (b-d) 1.12 1.17 1.23 1.16 1.23
c) Quarterly change in fees and commissions
CAIXABANK
€ million 2Q21 1Q21 4Q20 3Q20 2Q20
Banking services, securities and other fees 528 313 322 325 313
Sale of insurance products 73 43 37 36 35
Mutual funds, managed accounts and SICAVs 196 142 133 130 121
Pension plans 75 59 71 56 51
Unit Link and other 42 39 41 32 30
Net fee and commission income 915 595 603 579 551
BPI
€ million 2Q21 1Q21 4Q20 3Q20 2Q20
Banking services, securities and other fees 41 36 37 35 33
Sale of insurance products 12 14 19 13 12
Mutual funds, managed accounts and SICAVs 8 9 8 8 8
Pension plans
Unit Link and other 5 4 3 4 4
Net fee and commission income 67 64 67 59 57

Business activity and results: January – June 2021| 77
d) Quarterly change in administrative expenses, depreciation and amortisation
CAIXABANK
€ million 2Q21 1Q21 4Q20 3Q20 2Q20
Gross income 2,555 1,880 1,953 1,965 1,936
Personnel expenses (940) (656) (634) (636) (654)
General expenses (387) (261) (249) (265) (273)
Depreciation and amortisation (160) (119) (113) (123) (121)
Recurring administrative expenses, depreciation and amortisation (1,488) (1,036) (996) (1,025) (1,048)
Extraordinary expenses (1,929) (40)
BPI
€ million 2Q21 1Q21 4Q20 3Q20 2Q20
Gross income 265 183 196 178 198
Personnel expenses (57) (59) (55) (61) (61)
General expenses (36) (36) (27) (37) (37)
Depreciation and amortisation (18) (17) (16) (16) (11)
Recurring administrative expenses, depreciation and amortisation (110) (113) (99) (115) (109)
Extraordinary expenses (1)
e) Changes in the NPL ratio (figures for the CaixaBank perimeter include the contribution of Bankia)
CAIXABANK BPI
30 Jun. 2021 31 Mar. 2021 30 Jun. 2021 31 Mar. 2021
Loans to individuals 4.6% 4.6% 2.1% 2.2%
Home purchases 3.9% 3.8% 1.9% 2.0%
Other 6.5% 7.0% 3.8% 3.8%
Loans to business 3.4% 3.3% 2.3% 2.4%
Corporates and SMEs 3.2% 3.1% 2.3% 2.5%
Real estate developers 6.7% 7.3% 0.0% 0.0%
Public sector 0.3% 0.3% 0.0 0.0
NPL Ratio (loans and contingent liabilities) 3.7% 3.7% 2.1% 2.2%

Business activity and results: January – June 2021| 78
Activity indicators by region
This additional view of the Group’s activities has been included to show loans and funds by the region in which
they originated (for instance, loans and funds of BPI Vida, BPI Gestao de Activos, BPI Global Investment Fund
and the cards business are reported in Portugal and not in Spain, to which they would otherwise relate under
the Group’s corporate structure).
Spain
30 Jun. 2021 31 Mar. 2021 Change % 31 Dec. 2020 Change % Organic change
% € million LOANS AND ADVANCES TO CUSTOMERS Loans to individuals 178,253 177,293 0.5 106,792 66.9 0.9
Home purchases 131,130 132,767 (1.2) 73,586 78.2 (2.2)Other 47,123 44,526 5.8 33,206 41.9 8.0
of which: Consumer lending 17,413 17,609 (1.1) 12,675 37.4 (1.6)
Loans to business 135,841 138,916 (2.2) 96,115 41.3 (3.2)
Corporates and SMEs 129,771 132,590 (2.1) 90,550 43.3 (3.1)Real estate developers 6,070 6,327 (4.1) 5,564 9.1 (4.8)
Public sector 22,116 21,303 3.8 15,005 47.4 5.3Loans and advances to customers, gross 336,210 337,512 (0.4) 217,911 54.3 (0.6)
CUSTOMER FUNDS Customer funds 343,869 334,644 2.8 216,432 58.9 4.3
Demand deposits 314,549 302,928 3.8 202,980 55.0 5.8Time deposits 29,320 31,716 (7.6) 13,451 (19.9)
Insurance contract liabilities 57,129 56,267 1.5 55,025 3.8 1.5of which: Unit Link and other 13,828 12,752 8.4 11,653 18.7 8.4
Reverse repurchase agreements and other 2,087 1,012 2,044 2.1
On-balance sheet funds 403,085 391,923 2.8 273,501 47.4 4.1
Mutual funds, managed accounts and SICAVs 99,052 94,976 4.3 65,852 50.4 5.8Pension plans 43,121 41,904 2.9 32,168 34.0 3.7
Assets under management 142,172 136,880 3.9 98,020 45.0 5.1
Other accounts 13,813 10,177 35.7 3,778 83.3Total customer funds 559,070 538,980 3.7 375,300 49.0 5.3
Portugal
30 Jun. 2021 31 Mar. 2021 Change % 31 Dec. 2020 Change % € million LOANS AND ADVANCES TO CUSTOMERS Loans to individuals 14,339 14,021 2.3 13,856 3.5
Home purchases 12,434 12,172 2.2 11,989 3.7Other 1,905 1,849 3.0 1,867 2.0
of which: Consumer lending 1,500 1,498 0.1 1,495 0.3
Loans to business 10,496 10,442 0.5 10,311 1.8
Corporates and SMEs 10,331 10,285 0.5 10,155 1.7Real estate developers 164 157 4.6 156 5.4
Public sector 1,966 1,845 6.6 1,845 6.6Loans and advances to customers, gross 26,801 26,308 1.9 26,012 3.0
CUSTOMER FUNDS Customer funds 27,322 26,387 3.5 25,802 5.9
Demand deposits 18,888 17,955 5.2 17,344 8.9Time deposits 8,434 8,432 8,458 (0.3)
Insurance contract liabilities 4,256 4,225 0.7 4,334 (1.8)of which: Unit Link and other 3,316 3,081 7.6 2,954 12.3
Reverse repurchase agreements and other 10 11 (12.9) 13 (23.2)
On-balance sheet funds 31,587 30,623 3.1 30,149 4.8
Mutual funds, managed accounts and SICAVs 5,988 5,747 4.2 5,463 9.6Pension plans 3,296 3,303 (0.2) 3,160 4.3
Assets under management 9,284 9,050 2.6 8,623 7.7
Other accounts 1,052 1,281 (17.9) 1,336 (21.3)Total customer funds 41,923 40,954 2.4 40,108 4.5

Business activity and results: January – June 2021| 79
This document is intended exclusively for information purposes and does not aim to provide financial advice or constitutes in any way an
offer to sell, exchange, or acquire, or an invitation to acquire any type of security or any financial service or product of CaixaBank, S.A. (the
“Company”) or of any other company mentioned herein. Anyone who purchases a security at any time must do so solely on the basis of their
own judgement and/or the suitability of the security for their own purposes, and exclusively on the basis of the public information set out in
the documentation drawn up and registered by the issuer in the context of the specific security issue or offer, having availed themselves of
the corresponding professional advice if they consider this necessary or appropriate in accordance with the circumstances, and not on the
basis of the information set out in this document.
This document may contain statements relating to projections or estimates in respect of future business or returns, particularly in relation
to information regarding investments and investees, prepared primarily on the basis of estimates made by the Company. While these
projections and estimates reflect the Company’s current opinion or view of future business prospects, certain risks, uncertainties and other
relevant factors may cause the actual results or outcome to be substantially different to what the Company currently expects. These variables
include market conditions, macroeconomic matters, regulatory and government requirements, fluctuations in national or international stock
markets or in interest and exchange rates, changes in the financial position or our customers, debtors or counterparties, and so forth. These
risk factors, together with any others mentioned in past or future reports, could adversely affect our business and the levels of performance
and results described. Other unknown or unforeseeable factors, or in which there is a degree of uncertainty about their performance and/or
potential impact, could also make the results or outcome differ significantly from those described in our projections and estimates. In
particular, this document contains references to the benefits identified and public results when framing the shared project involving the
merger through absorption of Bankia, S.A. (absorbed company) by CaixaBank (absorbent company) announced on 18 September 2020.
However, CaixaBank cannot guarantee that they materialise under the terms provided or that the Group will not be exposed to complications,
expenses and risks associated with the integration process after the merger became effective on 26 March 2021.
Past financial statements and previous growth rates are no guarantee of the future performance, results or price of shares (including earnings
per share). Nothing contained in this document should be construed as constituting a forecast of future results or profit. Furthermore, this
document was drawn up on the basis of the accounting records held by CaixaBank and the other Group companies, and includes certain
adjustments and reclassifications to apply the principles and criteria operated by the Group companies on a consistent basis with those of
CaixaBank, such as in the specific case of BPI. Therefore, certain aspects of the information provided herein may not match the financial
information reported by this bank. With regard to Bankia's historical information and that related to the performance of Bankia and/or the
Group presented in this document, it should be considered that it has been subject to certain adjustments and reclassifications for the
purpose of adapting it to the CaixaBank Group's presentation criteria. In addition, with the aim of showing the recurring performance of the
results of the new company arising from the merger, a proforma income statement has been drawn up by adding the result of Bankia in the
first quarter of 2021 and the entire year of 2020 to the CaixaBank Group's result. The extraordinary impacts associated with the integration
of Bankia have been reported separately from the results.
This document features data supplied by third parties generally considered to be reliable information sources. However, the accuracy of the
data has not been verified. None of the directors, officers or employees of the company are obliged, either explicitly or implicitly, to ensure
that these contents are accurate or complete, or to keep them updated or correct them in the event any deficiencies, errors or omissions
are detected. Moreover, in reproducing these contents via any medium, CaixaBank may introduce any changes it deems suitable and may
partially or completely omit any portions of this document it chooses. CaixaBank assumes no liability for any discrepancies with this version.
The contents of this disclaimer should be taken into account by any persons or entities that may have to make decisions or prepare or share
opinions relating to securities issued by CaixaBank, including, in particular, decisions reached by the analysts and investors that rely on this
document. All such parties are urged to consult the public documentation and information CaixaBank submits to the Spanish securities
market regulator (Comisión Nacional del Mercado de Valores, CNMV). Be advised that this document contains unaudited financial
information.
This report contains a number of the Alternative Performance Measures (APMs) set out in the Guidelines on Alternative Performance
Measures published by the European Securities and Markets Authority on 30 June 2015 (ESMA/2015/1057) (“the ESMA Guidelines”) so as
to provide a clearer picture of the company’s financial performance and situation. Please be advised that these APMs have not been audited.
These measures constitute additional information and should be treated accordingly. In no event are they intended to replace the financial
information drawn up in accordance with International Financial Reporting Standards (IFRS). Moreover, the way the Group defines and
calculates these measures may differ to the way similar measures are calculated by other companies. As such, they may not be comparable.
Please consult the report's section that includes the details of the APMs used. The report also provides a reconciliation between certain
management indicators and the indicators presented in the consolidated financial statements prepared under IFRS.
This document has not been approved by or filed with the Spanish National Securities Market Regulator (Comisión Nacional del Mercado de
Valores, or CNMV), or by or with any other authority operating in other jurisdictions. In any event, its contents are regulated by the Spanish
law applicable at time of writing. This report is not addressed to any person or legal entity located in any other jurisdiction. Consequently, it
may not necessarily comply with the prevailing standards or legal requisites of other jurisdictions.
Without prejudice to applicable legal requirements or to any other limitations imposed by the CaixaBank Group, permission to use the
contents of this document or the signs, trademarks and logos it contains is expressly denied. This prohibition extends to any reproduction,
distribution, transmission to third parties, public communication or conversion, in any medium, for commercial purposes, without the prior
express consent of the respective proprietary titleholders. Failure to observe this prohibition may constitute a legal infraction sanctionable
under prevailing legislation.
