burns affordability index™ (bai)
TRANSCRIPT
1See Terms and Conditions of Use and Disclaimers.
Distribution to non-clients is prohibited. © 2019
Burns Affordability Index™ (BAI)The Burns Affordability Index™ (BAI) measures the current affordability of housing in a metro compared to the metro’s history. The index factors in the following data:1. Home values2. Incomes3. Mortgage rates
The index uses the housing cost to income ratio as its basis and is calculated on a scale of 0–10. • 0–1 represents the 10% most affordable months in the metro since 1985.• 5 represents the metro’s historical median affordability since 1985.• 9–10 represents the 10% most expensive months in the metro since 1985.
What questions will this index help you answer?• Where are current affordability levels compared
to the peak, trough, and median values?
• What is the four-year forecast for an MSA’saffordability index?
• Which markets are the most under and overvalued based on current affordability?
Where will you find this index in our research?• MSA. In the Metro Analysis and Forecast data
slides, the current BAI value is provided on theGrades and Current Statistics page, on the KeyForecasts page, and the Affordability Indexpage.
• Regional. In our Regional Analysis andForecast report, we roll up the index by the 10major regions and in a map that charts BAI byMSA.
• National. The BAI is rolled-up nationally andlocated in our monthly US Analysis andForecast report.
• By home builder. We analyze publicly-tradedhome builders’ footprints—the number of activecommunities builders have by MSA in ourHome Builder Analysis and Forecast. We thenuse this index to determine which builders arelocated in the most and least affordablemarkets.
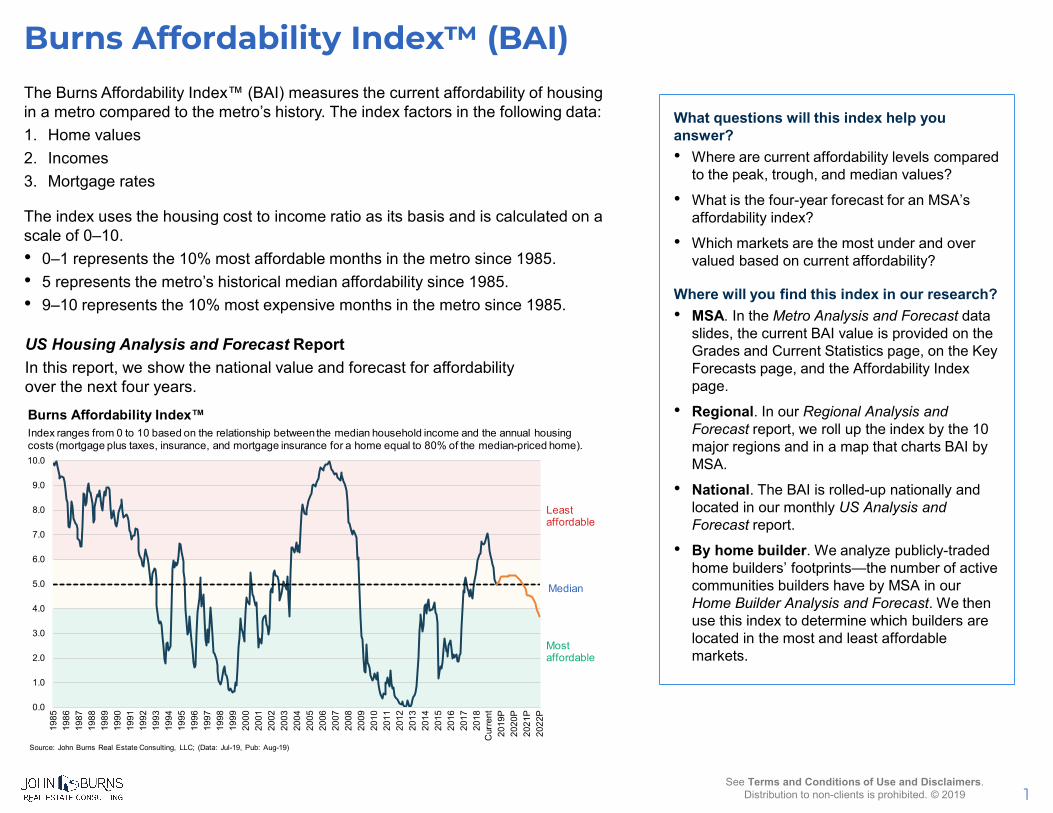
US Housing Analysis and Forecast ReportIn this report, we show the national value and forecast for affordability over the next four years.
0.0
1.0
2.0
3.0
4.0
5.0
6.0
7.0
8.0
9.0
10.0
1985
1986
1987
1988
1989
1990
1991
1992
1993
1994
1995
1996
1997
1998
1999
2000
2001
2002
2003
2004
2005
2006
2007
2008
2009
2010
2011
2012
2013
2014
2015
2016
2017
2018
Cur
rent
2019
P20
20P
2021
P20
22P
Source: John Burns Real Estate Consulting, LLC; (Data: Jul-19, Pub: Aug-19)
Leastaffordable
Burns Affordability Index™Index ranges from 0 to 10 based on the relationship between the median household income and the annual housing costs (mortgage plus taxes, insurance, and mortgage insurance for a home equal to 80% of the median-priced home).
Median
Mostaffordable
2See Terms and Conditions of Use and Disclaimers.
Distribution to non-clients is prohibited. © 2019
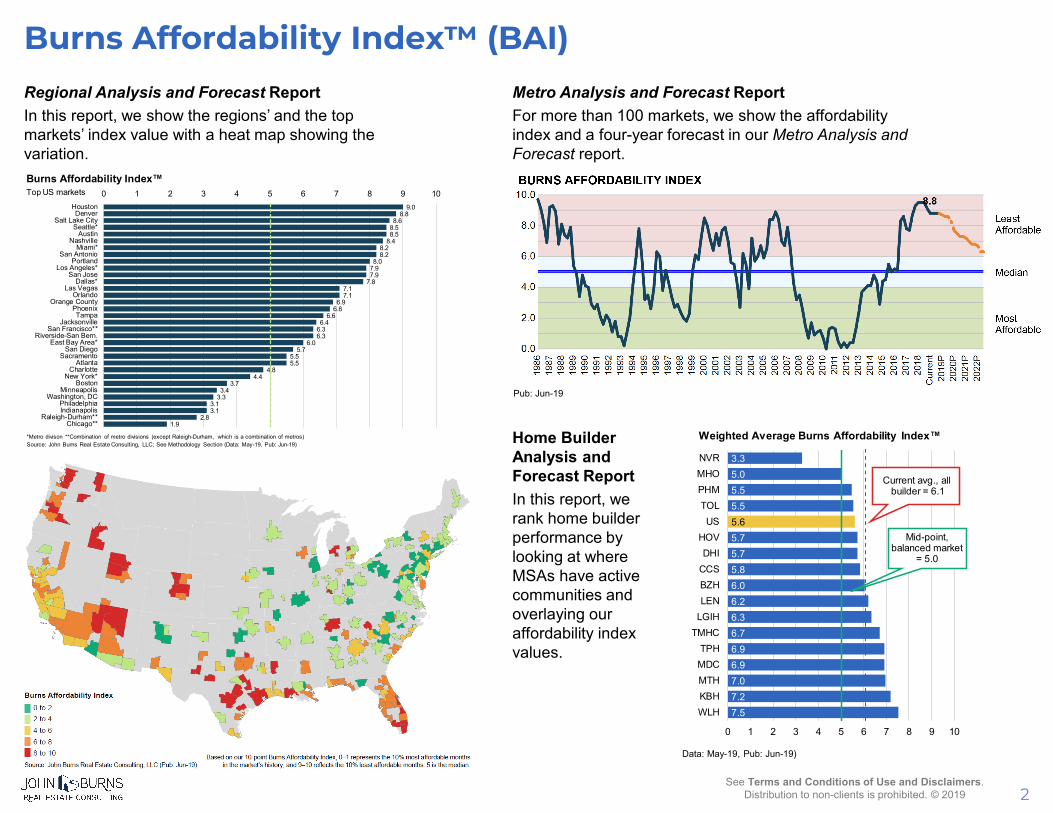
Burns Affordability Index™ (BAI)Regional Analysis and Forecast ReportIn this report, we show the regions’ and the top markets’ index value with a heat map showing the variation.
Metro Analysis and Forecast ReportFor more than 100 markets, we show the affordability index and a four-year forecast in our Metro Analysis and Forecast report.
Home Builder Analysis and Forecast ReportIn this report, we rank home builder performance by looking at where MSAs have active communities and overlaying our affordability index values.
7.57.27.06.96.96.76.36.26.05.85.75.75.65.55.55.03.3
0 1 2 3 4 5 6 7 8 9 10
WLHKBHMTHMDCTPH
TMHCLGIHLENBZHCCSDHI
HOVUS
TOLPHMMHONVR
Weighted Average Burns Affordability Index™
Current avg., allbuilder = 6.1
Mid-point, balanced market
= 5.0
Data: May-19, Pub: Jun-19)
9.08.8
8.68.58.5
8.48.28.2
8.07.97.9
7.87.17.1
6.96.8
6.66.4
6.36.3
6.05.7
5.55.5
4.84.4
3.73.4
3.33.13.1
2.81.9
0 1 2 3 4 5 6 7 8 9 10HoustonDenver
Salt Lake CitySeattle*
AustinNashville
Miami*San Antonio
PortlandLos Angeles*
San JoseDallas*
Las VegasOrlando
Orange CountyPhoenixTampa
JacksonvilleSan Francisco**
Riverside-San Bern.East Bay Area*
San DiegoSacramento
AtlantaCharlotte
New York*Boston
MinneapolisWashington, DC
PhiladelphiaIndianapolis
Raleigh-Durham**Chicago**
Source: John Burns Real Estate Consulting, LLC; See Methodology Section (Data: May-19, Pub: Jun-19)*Metro divison **Combination of metro divisions (except Raleigh-Durham, which is a combination of metros)
Burns Affordability Index™Top US markets
Pub: Jun-19
3See Terms and Conditions of Use and Disclaimers.
Distribution to non-clients is prohibited. © 2019
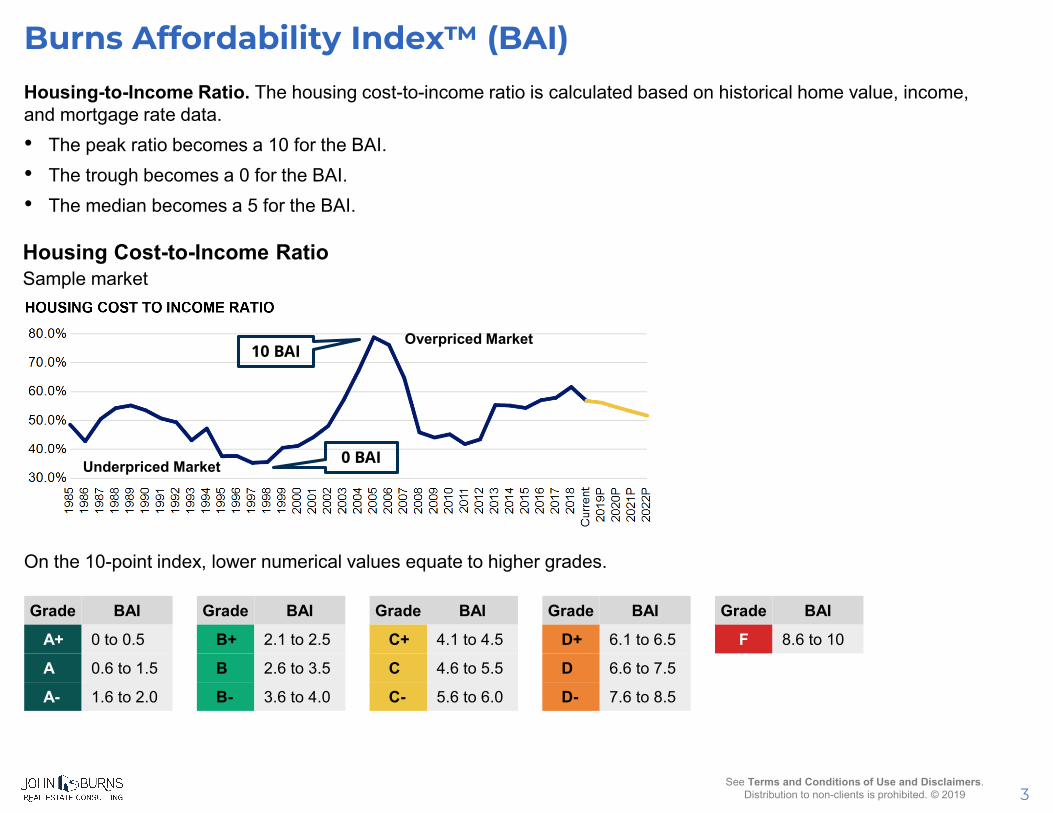
Housing-to-Income Ratio. The housing cost-to-income ratio is calculated based on historical home value, income, and mortgage rate data. • The peak ratio becomes a 10 for the BAI.• The trough becomes a 0 for the BAI.• The median becomes a 5 for the BAI.
10 BAI
0 BAI
Housing Cost-to-Income RatioSample market
Overpriced Market
Underpriced Market
Burns Affordability Index™ (BAI)
Grade BAI
A+ 0 to 0.5
A 0.6 to 1.5
A- 1.6 to 2.0
Grade BAI
B+ 2.1 to 2.5
B 2.6 to 3.5
B- 3.6 to 4.0
Grade BAI
C+ 4.1 to 4.5
C 4.6 to 5.5
C- 5.6 to 6.0
Grade BAI
D+ 6.1 to 6.5
D 6.6 to 7.5
D- 7.6 to 8.5
Grade BAI
F 8.6 to 10
On the 10-point index, lower numerical values equate to higher grades.
4See Terms and Conditions of Use and Disclaimers.
Distribution to non-clients is prohibited. © 2019
The median housing cost to median income ratio is the annual housing cost of a median-priced home divided by the median household income. Housing cost assumes the purchase of a home at 80% of the market’s median-priced existing home with a 5% down payment and a 30-year, fixed-rate mortgage. Payment includes PITI (principal, interest, taxes and insurance) plus mortgage insurance.
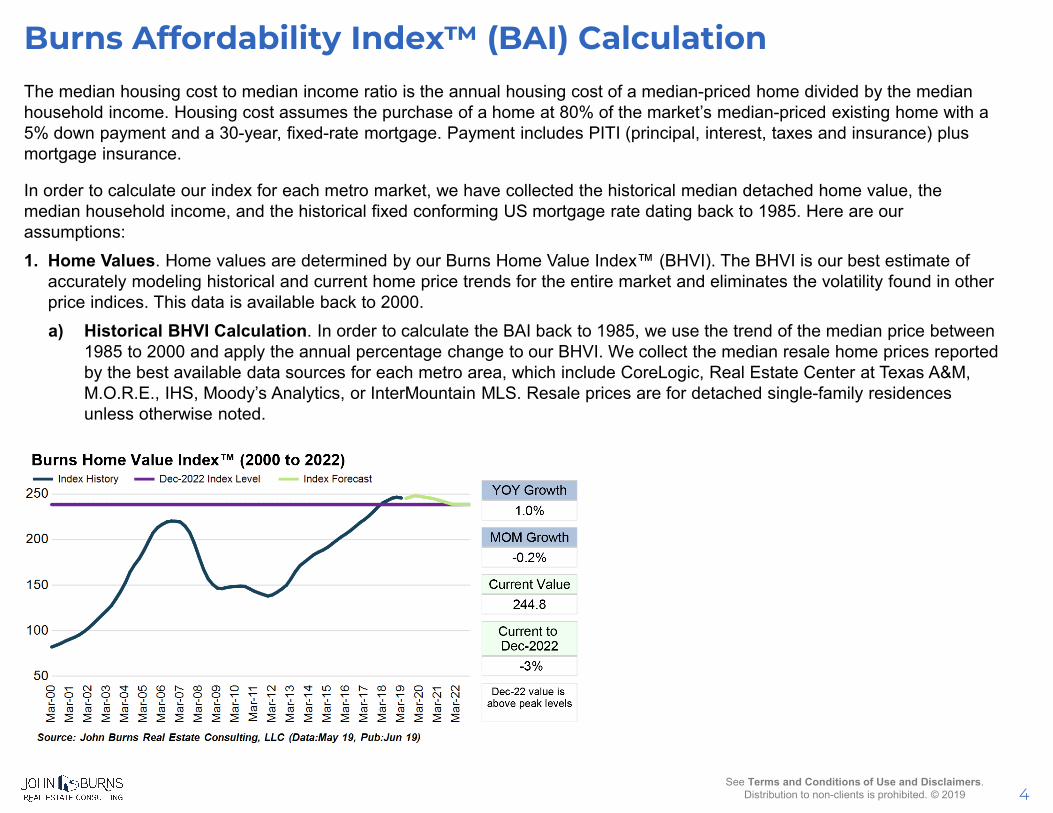
In order to calculate our index for each metro market, we have collected the historical median detached home value, the median household income, and the historical fixed conforming US mortgage rate dating back to 1985. Here are our assumptions:1. Home Values. Home values are determined by our Burns Home Value Index™ (BHVI). The BHVI is our best estimate of
accurately modeling historical and current home price trends for the entire market and eliminates the volatility found in other price indices. This data is available back to 2000.a) Historical BHVI Calculation. In order to calculate the BAI back to 1985, we use the trend of the median price between
1985 to 2000 and apply the annual percentage change to our BHVI. We collect the median resale home prices reported by the best available data sources for each metro area, which include CoreLogic, Real Estate Center at Texas A&M, M.O.R.E., IHS, Moody’s Analytics, or InterMountain MLS. Resale prices are for detached single-family residences unless otherwise noted.
Burns Affordability Index™ (BAI) Calculation
5See Terms and Conditions of Use and Disclaimers.
Distribution to non-clients is prohibited. © 2019
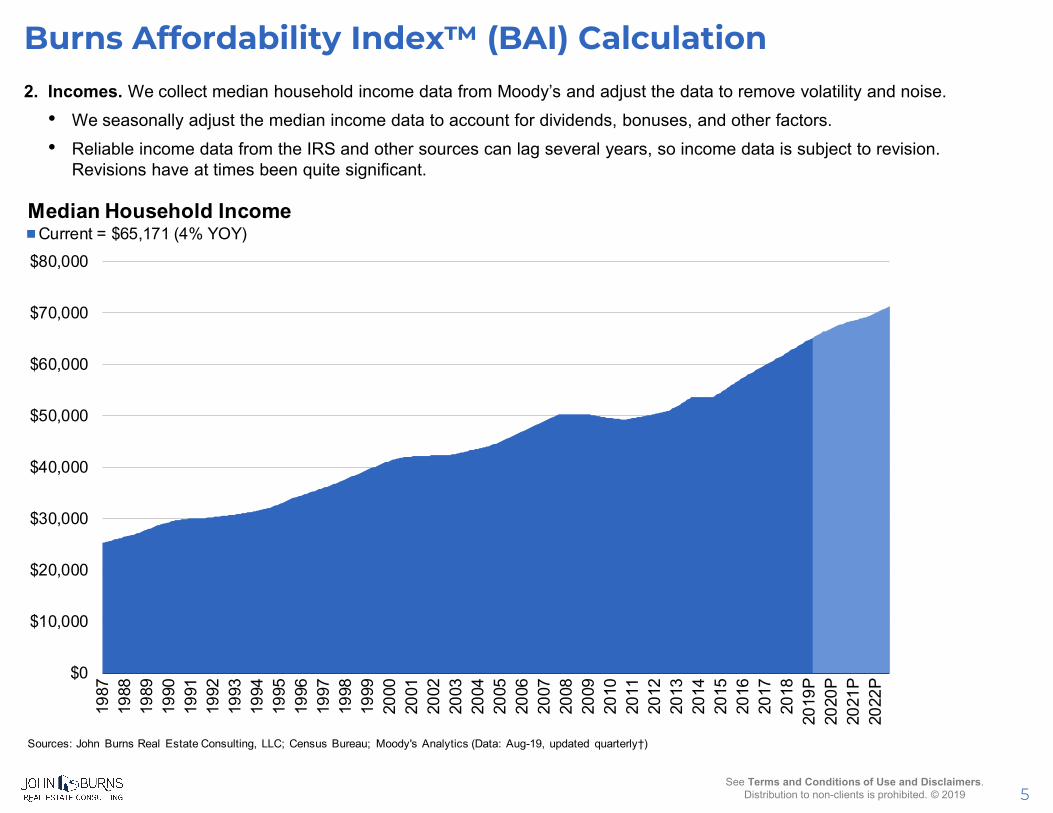
2. Incomes. We collect median household income data from Moody’s and adjust the data to remove volatility and noise. • We seasonally adjust the median income data to account for dividends, bonuses, and other factors. • Reliable income data from the IRS and other sources can lag several years, so income data is subject to revision.
Revisions have at times been quite significant.
$0
$10,000
$20,000
$30,000
$40,000
$50,000
$60,000
$70,000
$80,000
1987
1988
1989
1990
1991
1992
1993
1994
1995
1996
1997
1998
1999
2000
2001
2002
2003
2004
2005
2006
2007
2008
2009
2010
2011
2012
2013
2014
2015
2016
2017
2018
2019
P20
20P
2021
P20
22P
Current = $65,171 (4% YOY)Median Household Income
Sources: John Burns Real Estate Consulting, LLC; Census Bureau; Moody's Analytics (Data: Aug-19, updated quarterly†)
Burns Affordability Index™ (BAI) Calculation
6See Terms and Conditions of Use and Disclaimers.
Distribution to non-clients is prohibited. © 2019
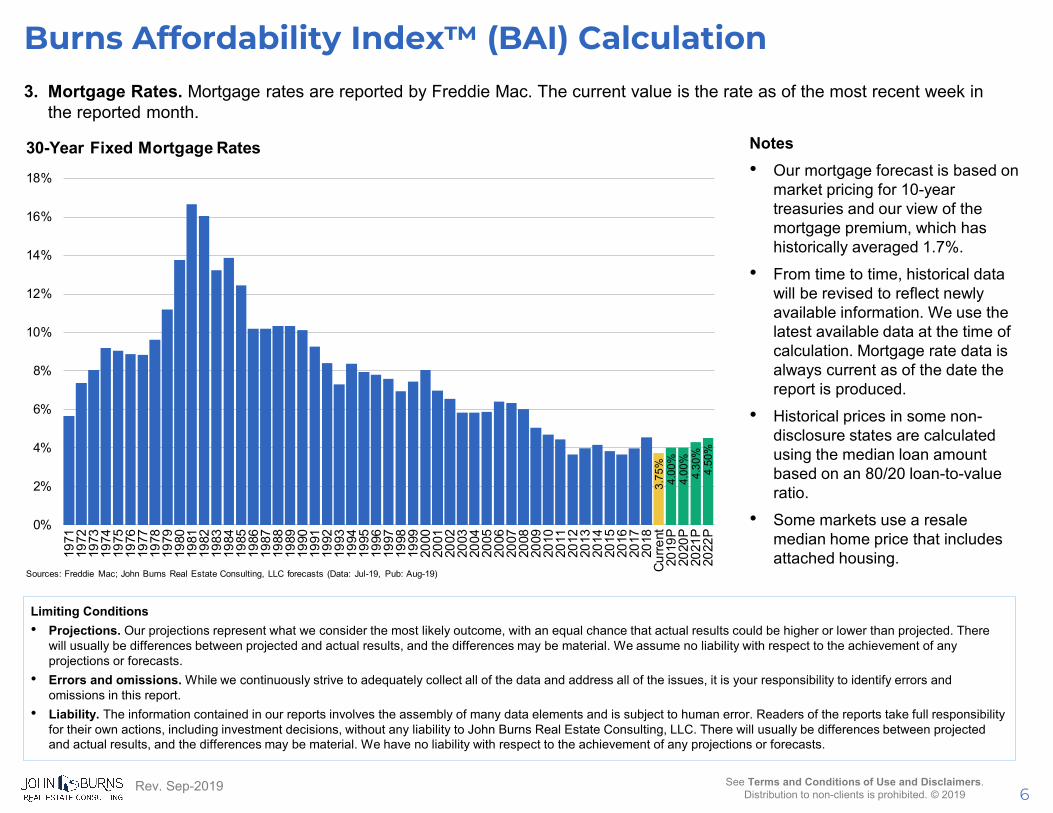
3. Mortgage Rates. Mortgage rates are reported by Freddie Mac. The current value is the rate as of the most recent week in the reported month.
Notes• Our mortgage forecast is based on
market pricing for 10-year treasuries and our view of the mortgage premium, which has historically averaged 1.7%.
• From time to time, historical data will be revised to reflect newly available information. We use the latest available data at the time of calculation. Mortgage rate data is always current as of the date the report is produced.
• Historical prices in some non-disclosure states are calculated using the median loan amount based on an 80/20 loan-to-value ratio.
• Some markets use a resale median home price that includes attached housing.
Limiting Conditions• Projections. Our projections represent what we consider the most likely outcome, with an equal chance that actual results could be higher or lower than projected. There
will usually be differences between projected and actual results, and the differences may be material. We assume no liability with respect to the achievement of any projections or forecasts.
• Errors and omissions. While we continuously strive to adequately collect all of the data and address all of the issues, it is your responsibility to identify errors and omissions in this report.
• Liability. The information contained in our reports involves the assembly of many data elements and is subject to human error. Readers of the reports take full responsibility for their own actions, including investment decisions, without any liability to John Burns Real Estate Consulting, LLC. There will usually be differences between projected and actual results, and the differences may be material. We have no liability with respect to the achievement of any projections or forecasts.
3.75
%4.
00%
4.00
%4.
30%
4.50
%
0%
2%
4%
6%
8%
10%
12%
14%
16%
18%
1971
1972
1973
1974
1975
1976
1977
1978
1979
1980
1981
1982
1983
1984
1985
1986
1987
1988
1989
1990
1991
1992
1993
1994
1995
1996
1997
1998
1999
2000
2001
2002
2003
2004
2005
2006
2007
2008
2009
2010
2011
2012
2013
2014
2015
2016
2017
2018
Cur
rent
2019
P20
20P
2021
P20
22P
Sources: Freddie Mac; John Burns Real Estate Consulting, LLC forecasts (Data: Jul-19, Pub: Aug-19)
30-Year Fixed Mortgage Rates
Burns Affordability Index™ (BAI) Calculation
Rev. Sep-2019