bullseye” trading - day trading the · pdf file“bullseye” trading ... longs...
TRANSCRIPT

JaySignal “BULLSEYE” TRADING
JaySignal is a standalone fibonacci confluence Ninja Trader Indicator that we
lease for $150.00 a month as an add on to our live trading room. It can be used
for additional setups beside my top 3 retracement setups in the live room. It
provides leading red and blue fibonacci extension dots. These dots provide
potential major turning points on all markets including all futures markets, forex
markets and stocks. The unique advantage of the JaySignal is that it has a built
in trend filter so traders can buy and sell retracements with overall trend
direction. This allows the trader not to counter trend trade the markets.
Additionally, a new bar type was created for all markets called the SymRenko
bar that was made to be directly used with the JaySignal. Traders can use their
own time frames or use the SymRenko bar type that we provide with settings
that we suggest with the JaySignal. The SymRenko bar type is only available to

our JaySignal owners and will never be released to the public. This proprietary
bar type makes divergence really pop and easy to see with our BullsEye trades.
The one thing that I have learned over the last 20 plus years of trading is that
the best trading setups are in the direction of overall trend. Divergence with
trend is the key to success with my overall methodology of JaySignal. Using
these leading fibonacci dots with my overall Bullseye trade with the new
SymRenko bar type can give the trader the edge that he or she needs over their
trading oppoenets on a daily basis.
I have found that trading during the correct times are just as important as
executing the trading plan with a leading indicator like JaySignal. I have found
the following times to be the best times to trade the system setups. Depending
where you are located around the world, these times fit most traders.
130am est-1045am est This is the best time range for the system. This will
provide the volume needed to provide excellent setups. The European, London
and New York session provide the needed volume for retracement trading.
745am est-1045am est If you are looking for a time slot to trade only a few
hours a day then this would be the best time window. Several markets open
during this time session and provide great volume to back the JaySignals. This is
the recommended time to trade for all my live room setups for Crude Oil and
Gold. There are only 3 retracement setups to learn in my live room during this
time window. They can be used directly with the JaySignal to confirm the setups
or JaySignal can be used standalone in many markets. When my room setups or
retracements get to the exact area that I want then I will use JaySignal to
confirm a fibonacci Bullseye for the reversal. This gives the traders the ultimate
trade signal.
1045am est-130pm est This is a dangerous time zone to trade because the
market likes to counter the morning move so the coutners will step in and take
profits from the early trends. In other words, trade the 745-1045am est with
trend retracement trades only to find success. In fact, after 1030am est new
positions with trend retracements are dangerous due to the fact that the
market likes to counter coming into the 1045 zone.

130pm est-230pm est Traders can treat this time zone just as they did the
130am-1045am est. Trend retracements using the JaySignal and the live room
setups.
230pm est-530pm est This is another dangerous time zone to trade because the
volume tends to dry up. JaySignal does provide excellent trades pre and post
news during these times such as the FOMC afternoon meetings or Fed minutes.
Additionally, U.S. markets tend to show some great JaySIgnal trades into the
close of 330-415pm est.
630pm est-930pm est. The markets open back up at 6pm est. This is a very slow
time period, however, it does show some great JaySignals at the later part of
this time zone if major news has posted during the day or coming up the
following day.
In summary, the best times to trade the JaySignal system will be from 130am
est-1045am est.
The key to success with the Jaysignal fibonacci dots are to use them with the
new SymRenko bar type. This bar type was designed to make the divergence
trades really show up and to help traders execute trades without subjectivity
using my Bullseye technique. Traders must have a daily plan and execute that
daily plan with only a few defined setups. Having the daily edge is key in all
markets and requires the traders to trade the same setups over and over and
over. This is the only way to gain the edge over the traders trading opponents.
We having weekly recorded JaySignal meetings to provide exact trading
techinques to give the members of JaySignal the daily edge in all markets.
Let’s break down the JaySignal and define the components that make the
JaySignal successful.
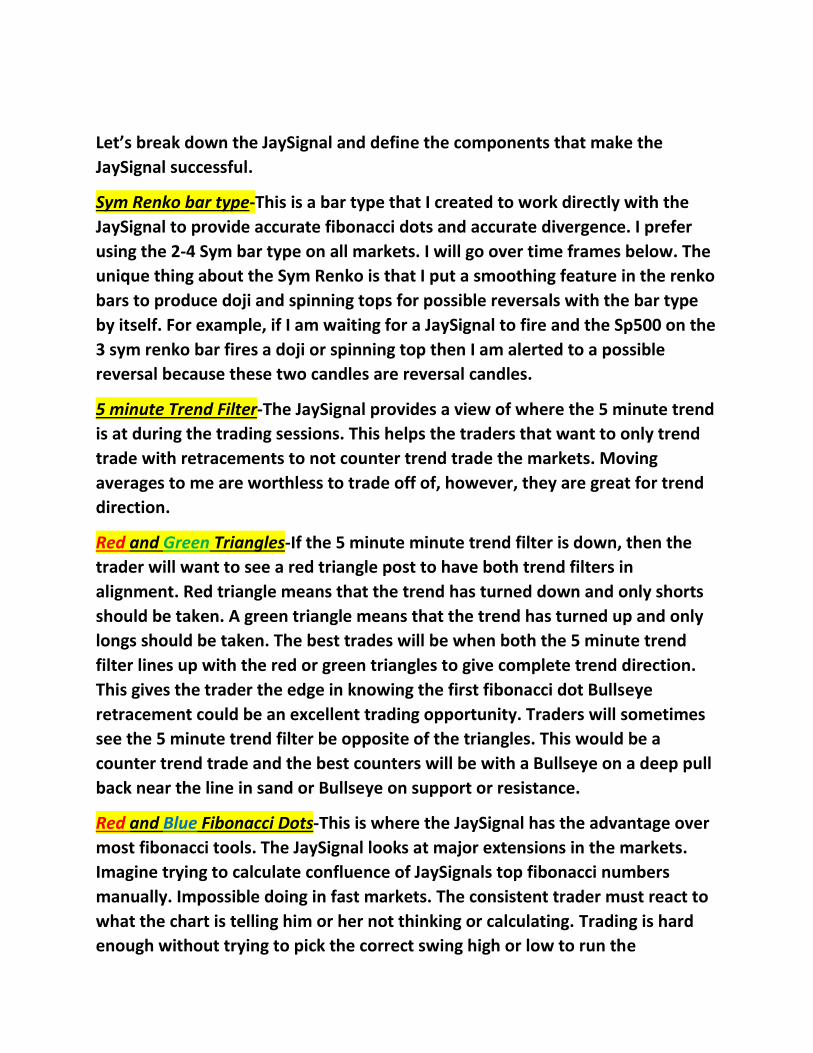
Sym Renko bar type-This is a bar type that I created to work directly with the
JaySignal to provide accurate fibonacci dots and accurate divergence. I prefer
using the 2-4 Sym bar type on all markets. I will go over time frames below. The
unique thing about the Sym Renko is that I put a smoothing feature in the renko
bars to produce doji and spinning tops for possible reversals with the bar type
by itself. For example, if I am waiting for a JaySignal to fire and the Sp500 on the
3 sym renko bar fires a doji or spinning top then I am alerted to a possible
reversal because these two candles are reversal candles.
5 minute Trend Filter-The JaySignal provides a view of where the 5 minute trend
is at during the trading sessions. This helps the traders that want to only trend
trade with retracements to not counter trend trade the markets. Moving
averages to me are worthless to trade off of, however, they are great for trend
direction.
Red and Green Triangles-If the 5 minute minute trend filter is down, then the
trader will want to see a red triangle post to have both trend filters in
alignment. Red triangle means that the trend has turned down and only shorts
should be taken. A green triangle means that the trend has turned up and only
longs should be taken. The best trades will be when both the 5 minute trend
filter lines up with the red or green triangles to give complete trend direction.
This gives the trader the edge in knowing the first fibonacci dot Bullseye
retracement could be an excellent trading opportunity. Traders will sometimes
see the 5 minute trend filter be opposite of the triangles. This would be a
counter trend trade and the best counters will be with a Bullseye on a deep pull
back near the line in sand or Bullseye on support or resistance.
Red and Blue Fibonacci Dots-This is where the JaySignal has the advantage over
most fibonacci tools. The JaySignal looks at major extensions in the markets.
Imagine trying to calculate confluence of JaySignals top fibonacci numbers
manually. Impossible doing in fast markets. The consistent trader must react to
what the chart is telling him or her not thinking or calculating. Trading is hard
enough without trying to pick the correct swing high or low to run the

calculations. JaySignal does the hard worksand will find the confluence of these
fibonacci levels from multiple previous swings and then plots the dots
automatically live on the chart. These dots do not repaint like most novice
indicators. I want to see the ones that do not work to help signals going
forward.
Divergence dots-I have trained hundreds and hundreds of traders and most of
them have one thing in common. They all have counter trend traded at one
point and almost all have found that it was a losing method. Divergence falls in
the same category. Many traders trade divergence incorrectly. I learned long
time ago that trading divergence with overall trend direction is the only way to
trade divergence in my opinion. Novice traders continue to think that they can
catch a falling knife or jump in front of a run a way train with divergence. Yes,
divergence will possible pause the market, however, it typically will just do a
shallow retracement and stop the trader out over and over and over. The key to
trading divergence is trading it with overall trend direction. This is where the
yellow divergence dots come into play over top my fibonacci dots. This is called
the Bullseye trade. I show you how to look for triple divergence on JaySIgnal
setups with trend. This will be the best setup that you can get with the JaySignal
after a trend change. This triple divergence setup is described in my recorded
videos that come with the JaySignal. Knowledge is power in the markets and
this technique is so powerful.
BullsEye(ENTRY) Trade- This is the last component needed for entry. Once the
Bullseye plots then a position or entry can be placed in the market. A Bullseye is
comprised of a blue or red fib dot with the yellow divergence dot right on top of
the fibonacci dot or within 1 bar of the fibonacci dot. This tells the trader that
divergence is now present at the key fibonacci confluence level on the
retracement. For example, once the yellow fib dot fires on top of the red or blue
fib dot the entry should be around 5-7 ticks from the swing high or low. Once
we add our 3 tick hard stop in above or below the swing, a hard stop of 8-13
ticks will be in place. The maximum stop is 13 ticks no matter what using the
new Sym Renko bar type.
Stops-A 13 tick hard stop should be placed before entry. Once entry has been
made then the trader can place or adjust the stop 3 ticks above or below the

last swing high or low. This should lower the stop from 13 ticks to an average of
7-13 ticks depending on the markets. The 13 tick stop is the maximum stop that
I will allow before I consider a JaySignal a failure on all markets. Some markets
like the Sp500 trades are much lower stops. The maximum 13 tick stop are for
volatile markets such as Crude Oil and Gold Futures.
Targets-Getting out and learning how to scale is just as important as entry. This
is where my proprietary Symmetry Dots come into play. The Symmetry Dots are
a one time fee of $297.00 that works in all markets. They are used as
support/resistance and used to scale contracts. These leading dots are very very
important to the traders overall success with the JaySignal. These dots are very
leading and show traders where to exit and scale positions after entry. This
allows the trader to reduce risk and have a free trade after the first Symmetry
Dots are hit. For example, let’s say a trader enters a short of 4 contracts on the
Crude Oil market. I educate traders to exit 50% of the position 2 ticks in front of
the first set of Symmetry Dots. The rest of the position can be automated on the
Ninja dome to be breakeven or breakeven plus one. This creates a free trade on
the remaining positions to let the runners run. The next exit will be 75% off 2
ticks in front of the second set of symmetry dots then let the last runner run to
the third set of symmetry or using a automated trailing top for the final target.
This approach gives the trader a systematic way to approach exits. Scaling is
great at reducing risk on a position and to help increase overall ticks by holding
runners longer and by having targets on all markets. Money management is so
key in the traders success. The Symmetry Dots help the trader achieve that.
Everyone will get stopped out on some trades, it’s the trader that uses the
proper money management that will have success that let the runner run. The
symmetry dots give you a systematic way to do this.
Line in Sand Trades-When the market goes vertical and gets out of balance it
must retrace to get back into balance for continuations. These retest trades are
great trades on the first retest. The key levels to trade off of these retests are
my #3 trade in the room and my line in sand trade using JaySignal. The first test
of the black line in sand trade provides a great opportunity to look for a Bullseye
and a continuation of trend. These trades happen right after the red or blue
triangle and are considered a deep retracement. I have several recorded videos
on this trade that the trader must review. I go over these setups all the time.

***Jerel is great at taking control of your computer if you are a new trader and
setting up your ATM targets and stops. Just set up an appointment with him by
emailing him at [email protected]***** if you have any issue.
Our resource page at www.daytradingthefutures.com has a video on it as well
for self instruction.
This gives you the basic outline of the JaySignal. It is very important to play
back the recorded videos that we have weekly on the JaySignal. The weekly
conference calls are on every Thursday at 5pm est and will be recorded and sent
out if you cannot make it. Let’s go over markets that I follow with the JaySignal.
Remember, JaySignal works on ALL MARKETS so feel free to test it out on the
forex, stocks or any other futures markets. What is nice is that I made the
JaySignal so it DOES NOT REPAINT the fibonacci dots or Bullseye trades so a
trader can look at any market and run it live 23 hours a day and it will show the
exact signals that came up live. Most traders like to use the Ninja market replay
in finding the markets that they like to trade and see how the JaySignal does on
the suggested time frames that I will show you or time frames that the trader
wants to see how it performs. The markt replay will show you the exact live
trades where the dots came up live. It does not repaint when playing live or in
replay. This really helps the trader in all markets to increase performance of the
JaySignal. I like to do a full 23 hour a day, 6 days a week replay when looking at
new markets. You can get a quick gauge/look on how the JaySignal performs
and the consistency of the setups. Let’s first go over a few markets that I follow
with the JaySignal. The following settings are what I currently use. You can
adjust your settings to fit your trading style. I do like to stay within a few
parameters which I will go over. I don’t believe in giving a system out without
key parmaters and settings. I go over these in detail on the conference calls and
updates that Jerel sends out.
I have found that trading the SymRenko between 2-4 Sym Renko produces the
best results with JaySignal. The 2 Sym Renko will show almost all retracement
trades with a ton of Bullseye trades while the larger 4 Sym Renko shows
considerbly less signals with trend direction and less Bullseye trades. This will be
the traders preference. I only show the 2 Sym Renko with a 5.5 setting with 1x
nums in the room with Crude Oil and Gold. I like to see all the retracements that
fire a signal. This is the main reason to use the smaller time frame. The Qm that
I show in the room to give Crude Oil confluence trades are the same exact
settings as Crude and Gold. Jerel will help anyone out that has any issues on
these settings or setting them. It is really easy to do. I find a few things wrong
with most indicators. Most vendors give you the system to figure out your own
settings or the bars repaint. This is one thing that I did not want my members to
go through and I provide the settings and made sure the bars do not repaint. If
the system works then it should not repaint. Many vendors try and hide the
losses that don’t work out. I find that very unproductive and quite wrong as a
trader. Here are the settings to get traders started to see the power of the
JaySIgnal.
I’m going to show you the the smaller time frames to get the most
retracements out of the system and you can always adjust as you perfer. If you
want less setups then just increase the Sym renko to 3 or 4. I go over these in
the recorded videos and you can always run the replay to compare 2-4 Sym bar
type Signals against each other. It only takes a few minutes to see the exact live
setups on all time frames to compare using market replay. Some new traders to
the system will put up these 3 Sym Renko bars types and watch them live beside
each other to get a feel for the speed and accuracy over an entire week. I have
some traders that just love the 2 Sym because of the many setups during the
day and other that only want a few signals during the whole session. This will be
the traders preference. The smaller time frame 2 Sym Renko will be a good start
to show the power of the system.
You can go to a larger Sym Renko like a 3 or 4 for less signals if you wish. I go
over these larger time frame in the recorded videos with settings. To get a quick
idea on any market just replay the 2,3 and 4 Sym Renko beside each other with
the JaySIgnal over the last week of trading on market replay and it will show
you every signal qualified trade that came up live. The dots will not repaint so
you will see the losers and the winners. This way you can fit it to your trading
style and reduce your charts per market with only a few signals. I like to keep
my bar type in between 2-4 Sym Renko and my my setting either between 5.5-
9.5 on all markets. You should keep your nums always at 1 to show ALL Bullseye
trades. The 2 Sym will try and catch every retracement. The larger time time
frames such as the 3 or 4 Sym will try and catch the larger moves with less
signals.

CL-CRUDE OIL FUTURES 2 Sym Renko 5.5 with 1x nums(this is what I show in the
room). Remember, I am only showing the smallest time frame to use to get
traders started seeing the power of the JaySIgnal. Adjust to fit your style. Most
markets that work on the 2 Sym will work on the 3 or 4 Sym with less signals. I
prefer to see all retracement setups in addition to my larger time frames. Larger
time frames are dicussed in my recorded videos. I am finding that showing
traders the smaller time frames are helping them in seeing more setups and
understand the system better in the beginning. Remember, you can find the
best time frame for your style by just putting the 2,3 and 4 Sym Renko beside
each other and market replay back the previous week to see all signals. This is a
quick look on the accuracy of the system 6 days a week running it 23 hours a
day on the replay. You will see all winners and all losers to get a quick feel for
the time frame immediately that you prefer. They don’t differ very much among
all the markets across the board.
QM-CRUDE OIL MINI---2 SYM RENKO 5.5
GC-GOLD FUTURES-2 SYM RENKO 5.5
SI-SILVER FUTURES--3 SYM RENKO 5.5
HG-COPPER-- 3 SYM RENKO 5.5
NG-NATURAL GAS-- 3 SYM RENKO 5.5
ES-SP500—2 or 3 SYM RENKO 5.5
EMD-SP400—2 SYM RENKO 5.5
TF-RUSSELL 2000—2 SYM RENKO 5.5
NQ-NASDAQ FUTURES—3 SYM RENKO 5.5
YM-DOW FUTURES—3 SYM RENKO 5.5
EURO-6E—2 SYM RENKO 5.5
AUSSI-6A—2 SYM RENKO 5.5
YEN-6J—2 SYM RENKO 5.5
6S-SWISS- 2 SYM RENKO 5.5
DAX-FDAX—3 SYM RENKO 5.5
ZS-SOYBEANS—3 SYM RENKO 5.5
***ALL FOREX MARKETS AND STOCKS*****
Below are charts of the above markets showing the JaySignal on November 1,
2013. This will show you the consistency of the setup on a daily basis.
Remember, JaySIgnal can be used as standalone or use it with the #1, #3 and
ATR trade on my 2 minute chart in the live room. When price gets within 3 ticks
of my top setups in the live room the ultimate signal would be a Bullseye with
the JaySignal to confirm the swing top or bottom. This is not needed in the live
room, however, it does give the trades confluence. Let’s look at JaySignal as a
standalone below and how to apply it.
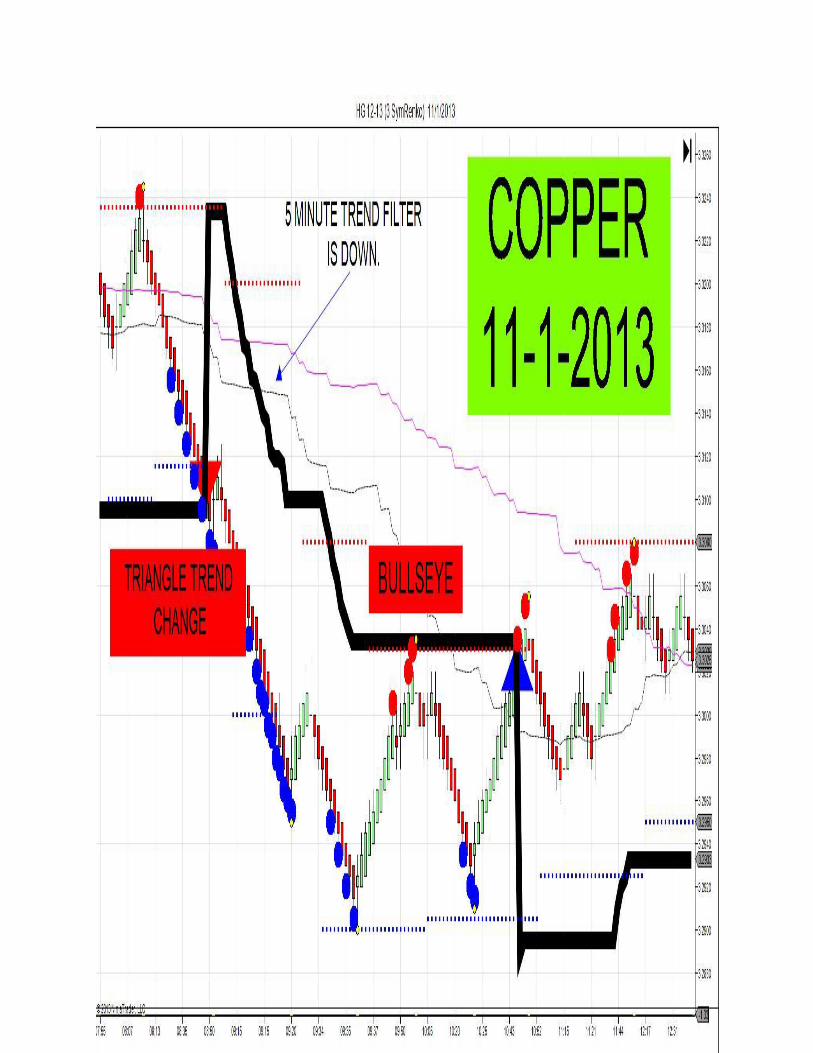
Notice below that the 5 minute trend filter was down showing short bias. The
red triangle trend filter then fired indicating that both trend signals said to look
for shorts only on the first Bullseye Retracement. The Bullseye trade finally fires
calling the high on Crude Oil. Notice how the first two sets of blue symmetry
dots are achieved giving the trader the edge on scaling, reducing risk and
increasing overall ticks for the big runner instead of just scalping the JaySignal.
ALL CHARTS SHOWN BELOW ON MANY DIFFERENT MARKETS ARE FROM
NOVEMBER 1, 2013. THIS IS TO SHOW YOU THE CONSISTENCY OF THE SETUP
WITH THE SAME SETTINGS. YOU KNOW YOU HAVE A GREAT INDICATOR WHEN
IT WORKS UNIVERSAL ON ALL MARKETS.


Notice that divergence with trend creates the ultimate Bullseye trades. The
methodology is to buy and sell trend retracements with fibonacci confluence
red and blue dots with confirmed divergence(Bullseye). The JaySignal does just
that.
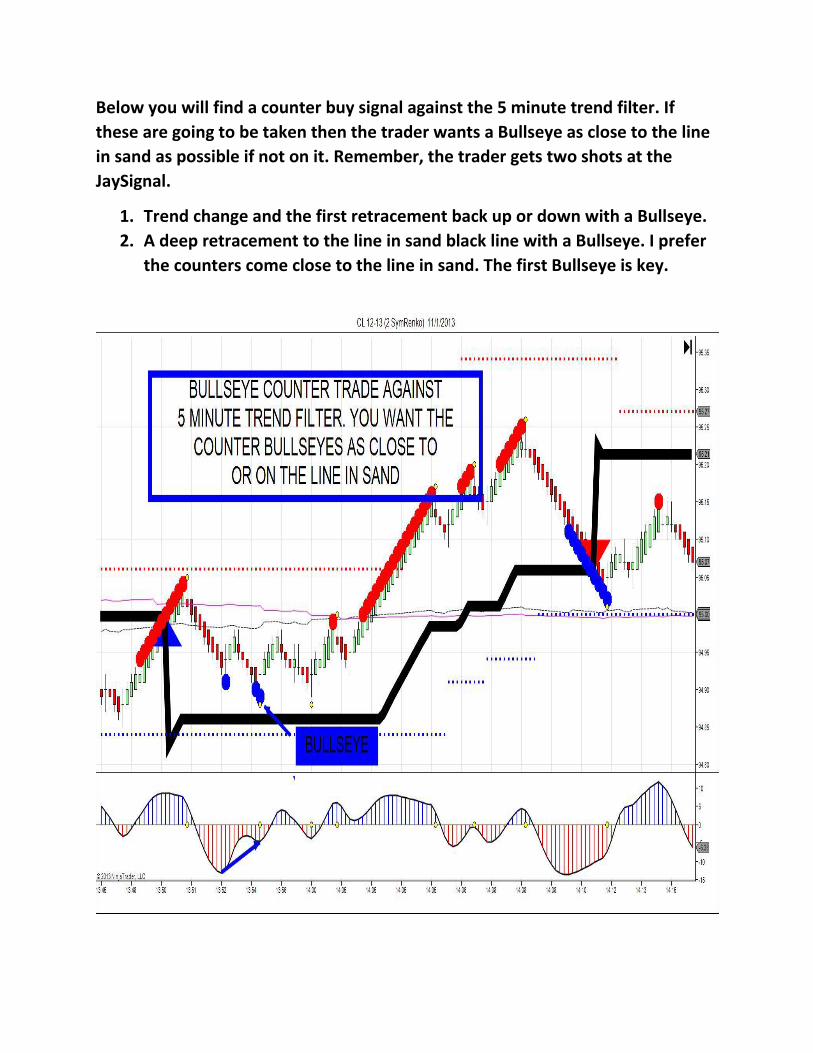
Below you will find a counter buy signal against the 5 minute trend filter. If
these are going to be taken then the trader wants a Bullseye as close to the line
in sand as possible if not on it. Remember, the trader gets two shots at the
JaySignal.
1. Trend change and the first retracement back up or down with a Bullseye.
2. A deep retracement to the line in sand black line with a Bullseye. I prefer
the counters come close to the line in sand. The first Bullseye is key.

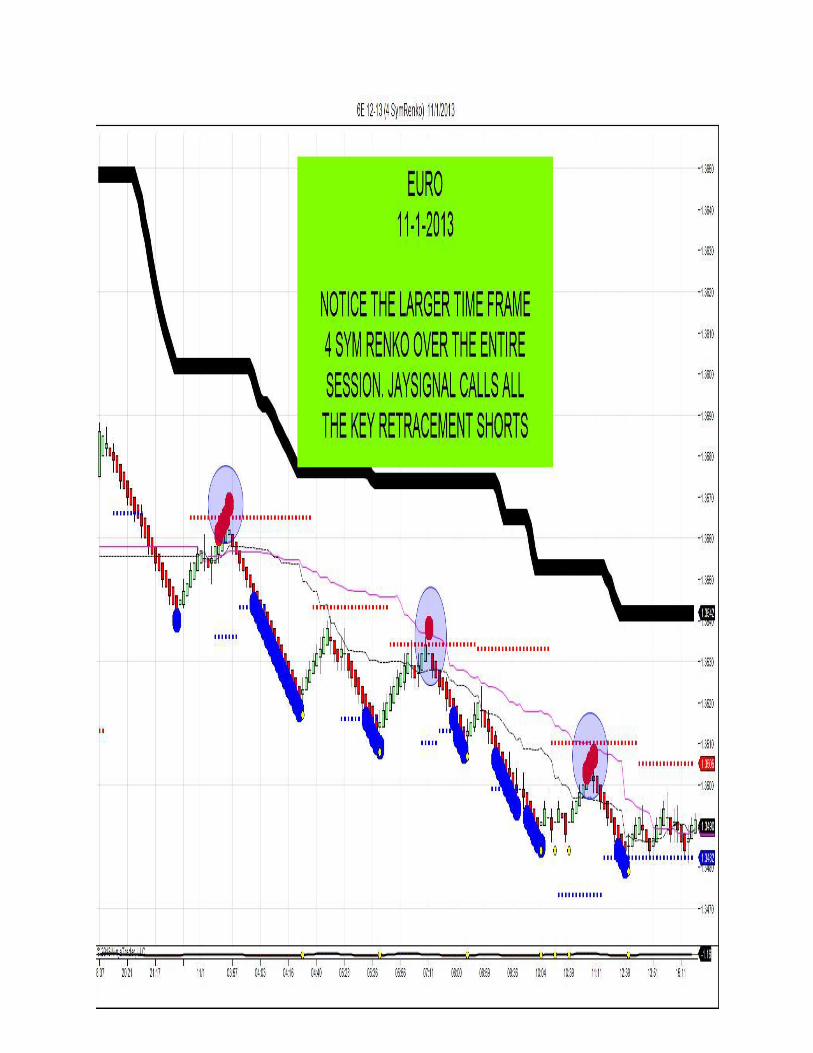
Below you will find a larger 4 Sym Renko bar type. The larger time frames
produce larger moves off of the line in sand trades as shown below.


This will get you started. Remember, we have weekly conference calls that are
only for JaySignal members. We do record these weekly if you cannot make the
calls. These calls are every Thursday at 5pm est. I have taken my 20 plus years of
experience in the markets and provided an edge in all markets daily with my
proprietary live room setups and the JaySignal. The Sym Renko bar will never be
released to the public for sale nor will my Fibonacci software going forward.
They will be for lease only and only for members of the live room. I will
continue to try and give the edge to my members over their trading opponents.
To have that edge a trader must trade the same setups over and over and over
in all markets.
Many Ticks to all members of JaySignal!
Jason Wireman
Please email me with any questions.
To purchase the JaySignal then please email [email protected]
and he will send the paypal links to get you started.
Day Trading the Futures/Symmetry Indicators Risk Disclaimer
Jason Wireman/Day Trading the Futures/Symmetry Indicators or Jason Wireman employees, do not hold themselves out as a Commodity
Trading Advisor (“CTA”). Given this representation, all information and material provided by Jason Wireman or Jason Wireman employees is
for educational purposes only and should not be considered specific investment advice.
CFTC RULE 4.41 -HYPOTHETICAL OR SIMULATED PERFORMANCE RESULTS HAVE CERTAIN LIMITATIONS. UNLIKE AN ACTUAL PERFORMANCE
RECORD, SIMULATED RESULTS DO NOT REPRESENT ACTUAL TRADING. ALSO, SINCE THE TRADES HAVE NOT BEEN EXECUTED, THE RESULTS
MAY HAVE UNDER OR OVER COMPENSATED FOR THE IMPACT, IF ANY OF CERTAIN MARKET FACTORS, SUCH AS LACK OF LIQUIDITY.
SIMULATED TRADING PROGRAMS IN GENERAL ARE ALSO SUBJECT TO THE FACT THAT THEY ARE DESIGNED WITH THE BENEFIT OF
HINDSIGHT. NO REPRESENTATION IS BEING MADE THAT ANY ACCOUNT WILL OR IS LIKELY TO ACHIEVE PROFIT OR LOSSES SIMILAR TO THOSE
SHOWN. PAST PERFORMANCE IS NOT NECESSARILY INDICATIVE OF FUTURE RESULTS.
Commodity Futures Trading Commission – Futures and Options trading has large potential rewards, but also large potential risk. You must
be aware of the risks and be willing to accept them in order to invest in the futures and options markets. Don’t trade with money you can’t
afford to lose. This is neither a solicitation nor an offer to Buy/Sell futures, stocks or options on the same. No representation is being made
that any account will or is likely to achieve profits or losses similar to those discussed on this web site. The past performance of any trading
system or methodology is not necessarily indicative of future results.
NO REPRESENTATION IS BEING MADE THAT ANY ACCOUNT WILL, OR IS LIKELY TO ACHIEVE PROFITS OR LOSSES SIMILAR TO THOSE
DISCUSSED WITH Jason Wireman/DayTradingtheFutures.com/SymmetryIndicators.com or Jason Wireman employees, SUPPORT AND

TEXTS. Jason WIreman's Sotware/Live Room COURSE(S), PRODUCTS AND SERVICES SHOULD BE USED AS LEARNING AIDS ONLY AND SHOULD
NOT BE USED TO INVEST REAL MONEY. IF YOU DECIDE TO INVEST REAL MONEY, ALL TRADING DECISIONS SHOULD BE YOUR OWN.
Trading commodities on margin carries a high level of risk, and may not be suitable for all investors. The high degree of leverage can work
against you as well as for you. Before deciding to invest in commodities you should carefully consider your investment objectives, level of
experience, and risk appetite. The possibility exists that you could sustain a loss of some or all of your initial investment and therefore you
should not invest money that you cannot afford to lose. You should be aware of all the risks associated with commodities trading, and seek
advice from an independent financial adviser if you have any doubts
Education and information contained from Jason Wireman/DayTradingthefutures.com/SymmetryIndicators.com or Jason Wireman
employees, is not an invitation to trade Crude Oil, Gold Futures or any other futures markets. Trading requires risking money in pursuit of
future gain. That is your decision. Do not risk any money you cannot afford to lose. This document does not take into account your own
individual financial and personal circumstances. It is intended for educational purposes only and NOT as individual investment advice. Do
not act on this without advice from your investment professional, who will verify what is suitable for your particular needs & circumstances.
Failure to seek detailed professional personally tailored advice prior to acting could lead to you acting contrary to your own best interests &
could lead to losses of capital.
Use of any of this information is entirely at your own risk, for which Jason Wireman/Daytradingthefutures.com/SymmetryIndicators or
Jason Wireman employees will not be liable. Neither we nor any third parties provide any warranty or guarantee as to the accuracy,
timeliness, performance, completeness or suitability of the information and content found or offered in the material for any particular
purpose. You acknowledge that such information and materials may contain inaccuracies or errors and we expressly exclude liability for any
such inaccuracies or errors to the fullest extent permitted by law. All information/software from Jason
Wireman/DayTradingthefutures/SymmetryIndicators or Jason Wireman employees exists, soley and entirely for educational purposes.
*Risk Disclosure / Risk Disclaimer:
There is a risk of loss in futures, Forex and options trading. There is risk of loss trading futures, Forex and options online. Please trade with
capital you can afford to lose. Past performance is not necessarily indicative of future results. Nothing in this site is intended to be a
recommendation to buy or sell any futures or options market. All information has been obtained from sources, which are believed to be
reliable, but accuracy and thoroughness cannot be guaranteed. Readers are solely responsible for how they use the information and for
their results. SymmetryIndicators, Inc. and DayTradingTheFutures, Inc and their affiliated websites., do not guarantee the accuracy or
completeness of the information or any analysis based thereon.
Margins subject to change without notice.
Commission Rule 4.41(c)(1) applies to "any publication, distribution or broadcast of any report, letter, circular, memorandum, publication,
writing, advertisement or other literature…." Commission Rule 4.41(b) prohibits any person from presenting the performance of any
simulated or hypothetical futures account or futures interest of a CTA, unless the presentation is accompanied by a disclosure statement.
The statement describes the limitations of simulated or hypothetical futures trading as a guide to the performance that a CTA is likely to
achieve in actual trading.
Additional Risk Disclosure Statement for System Traders:
Commission Rule 4.41(b)(1)(I) hypothetical or simulated performance results have certain inherent limitations. Unlike an actual performance
record, simulated results do not represent actual trading. Also, since the trades have not actually been executed, the results may have
under- or over-compensated for the impact, if any, of certain market factors, such as lack of liquidity. Simulated trading programs in general
are also subject to the fact that they are designed with the benefit of hindsight. No representation is being made that any account will or is
likely to achieve profits or losses. There have been no promises, guarantees or warranties suggesting that any trading will result in a profit or
will not result in a loss.
Hypothetical performance results have many inherent limitations, some of which are described below. No representation is being made that
any account will or is likely to achieve profits or losses similar to those shown. In fact, there are frequently sharp differences between
hypothetical performance results and the actual results subsequently achieved by any particular trading program.
One of the limitations of hypothetical performance results is that they are generally prepared with the benefit of hindsight. In addition,
hypothetical trading does not involve financial risk, and no hypothetical trading record can completely account for the impact of financial
risk in actual trading. For example, the ability to withstand losses or adhere to a particular trading program in spite of trading losses are
material points which can also adversely affect actual trading results. There are numerous other factors related to the markets in general or
to the implementation of any specific trading program which cannot be fully account for in the preparation of hypothetical performance
results and all of which can adversely affect actual trading results.
(CFTC RULE 4.41) CALCULATED OR SUGGESTED ENTRY AND EXIT POINTS CAN PRODUCE HYPOTHETICAL OR SIMULATED PERFORMANCE

RESULTS WHICH HAVE CERTAIN INHERENT LIMITATIONS UNLIKE ACTUAL PERFORMANCE RECORD: SIMULATED RESULTS DO NOT REPRESENT
ACTUAL TRADING. ALSO, SINCE THE TRADES HAVE NOT ACTUALLY BEEN EXECUTED, THE RESULTS MAY HAVE UNDER- OR
OVERCOMPENSATED FOR THE IMPACT, IF ANY, OF CERTAIN MARKET FACTORS, SUCH AS LACK OF LIQUIDITY. SIMULATED TRADING
PROGRAMS IN GENERAL ARE ALSO SUBJECT TO THE FACT THAT THEY ARE DESIGNED WITH THE BENEFIT OF HINDSIGHT. NO PRESENTATION
IS BEING MADE THAT ANY ACCOUNT WILL, OR IS LIKELY TO ACHIEVE, PROFITS OR LOSSES SIMILAR TO THOSE PREDICTED OR SHOWN.
HYPOTHETICAL OR SIMULATED PERFORMANCE RESULTS HAVE CERTAIN LIMITATIONS. UNLIKE AN ACTUAL PERFORMANCE RECORD,
SIMULATED RESULTS DO NOT REPRESENT ACTUAL TRADING. ALSO, SINCE THE TRADES HAVE NOT BEEN EXECUTED, THE RESULTS MAY HAVE
UNDER OR OVER COMPENSATED FOR THE IMPACT, IF ANY, OF CERTAIN MARKET FACTORS, SUCH AS LACK OF LIQUIDITY. SIMULATED
TRADING PROGRAMS IN GENERAL ARE ALSO SUBJECT TO THE FACT THAT THEY ARE DESIGNED WITH THE BENEFIT OF HINDSIGHT. NO
REPRESENTATION IS BEING MADE THAT ANY ACCOUNT WILL OR IS LIKELY TO ACHIEVE PROFITS OR LOSSES SIMILAR TO THOSE SHOWN.
SIMULATED RESULTS DO NOT NECESSARILY IMPLY FUTURE PROFITS. THE RISK OF LOSS IN TRADING FOREX OR COMMODITY CONTRACTS
CAN BE SUBSTANTIAL. YOU SHOULD THEREFORE CAREFULLY CONSIDER WHETHER SUCH TRADING IS SUITABLE FOR YOU IN LIGHT OF YOUR
FINANCIAL CONDITION. HYPOTHETICAL PERFORMANCE RESULTS HAVE MANY INHERENT LIMITATIONS, SOME OF WHICH ARE DESCRIBED
BELOW. NO REPRESENTATION IS BEING MADE THAT ANY ACCOUNT WILL OR IS LIKELY TO ACHIEVE PROFITS OR LOSSES SIMILAR TO THOSE
SHOWN. IN FACT, THERE ARE FREQUENTLY SHARP DIFFERENCES BETWEEN HYPOTHETICAL PERFORMANCE RESULTS AND THE ACTUAL
RESULTS SUBSEQUENTLY ACHIEVED BY ANY PARTICULAR TRADING PROGRAM. ONE OF THE LIMITATIONS OF HYPOTHETICAL PERFORMANCE
RESULTS IS THAT THEY ARE GENERALLY PREPARED WITH THE BENEFIT OF HINDSIGHT. IN ADDITION, HYPOTHETICAL TRADING DOES NOT
INVOLVE FINANCIAL RISK AND NO HYPOTHETICAL TRADING RECORD CAN COMPLETELY ACCOUNT FOR THE IMPACT OF FINANCIAL RISK IN
ACTUAL TRADING. FOR EXAMPLE, THE ABILITY TO WITHSTAND LOSSES OR ADHERE TO A PARTICULAR TRADING PROGRAM IN SPITE OF
TRADING LOSSES ARE MATERIAL POINTS WHICH CAN ALSO ADVERSELY AFFECT ACTUAL TRADING RESULTS. THERE ARE NUMEROUS OTHER
FACTORS RELATED TO THE MARKETS IN GENERAL OR TO THE IMPLEMENTATION OF ANY SPECIFIC TRADING PROGRAM WHICH CANNOT BE
FULLY ACCOUNTED FOR IN THE PREPARATION OF HYPOTHETICAL PERFORMANCE RESULTS AND ALL OF WHICH CAN ADVERSELY AFFECT
ACTUAL TRADING RESULTS.