bullsbrook - gnangara - city of swan · bullsbrook - gnangara is bounded by the shires of...
TRANSCRIPT

COMMUNITY PROFILE
2006 and 2001 Enumerated Census information for:
City of Swan
Bullsbrook - Gnangara
The City of Swan Community Profile is designed to inform community groups,Council, investors, business, students and the general public. To achieve this, theProfile is formatted to present the data in simple, clear tables and charts withconcise factual commentary. The Community Profile is based on the 2006 Census ofPopulation and Housing published by the Australian Bureau of Statistics.
Contents:
How many people live here? 3Introduction and summary 3
Key Statistics 5
How old are we? 6
Who are we? 8Where were we born? 8
How many recently arrived? 10
How well do we speak English? 12
What language do we speak at home? 14
What is our religion? 16
What is our individual income? 18
Individual income quartiles 20
What is our household income? 22
Household income quartiles 24
What are our qualifications? 26
What is the highest secondary school year we have completed? 28
Where are we learning? 30
Do we need assistance? 32
What do we do? 34Do we do unpaid work? 34
Unpaid domestic work 36
Unpaid care 38
Unpaid childcare 40
What is our employment status? 42
What industries do we work in? 44
Time series industry categories 46
Time series occupation categories 49
What are our occupations? 52
How do we get to work? 54
How do we live? 56What type of households do we live in? 56
How many people live in each household? 59
Are we owners, renters or buyers? 61
How much do we pay on our housing loan? 63
Housing loan quartiles 65
How much do we pay on our housing rental? 67
Housing rental quartiles 69
What type of internet connection do we have? 71
How many cars do we own? 73
What type of dwellings do we live in? 75
Explanatory notes 77Geography notes 77
Data notes 78
Specific notes 81
DISCLAIMER: Whilst all due care has been taken to ensure the content of this report is accurate and Current, there may be errors or omissions in it and no legal responsibility is accepted for the information and opinions in this website.
Copyright © id.consulting pty ltd - www.id.com.au 2008
Date created: 11/02/2008
Community Profile City of Swan
Page 2

Bullsbrook - Gnangara Introduction and summary (Map and key statistics)
Bullsbrook - Gnangara is a predominantly rural area with a small township at Bullsbrook and a military area west of the township. Bullsbrook - Gnangara is bounded by the Shires of Chittering and Toodyay in the north, the Avon River and the Swan River in the east, Cathedral Avenue, the Swan River, the Great Northern Highway, Ellen Brook Drive, Ellen Brook, Railway Parade, Maralla Road, a line that runs north-south along the proposed Perth-Darwin Highway, the proposed Perth-Darwin Highway, Gnangara Road, Beechboro Road, Woollcott Avenue and Hepburn Avenue in the south and the City of Wanneroo in the west. Bullsbrook - Gnangara includes the localities of Bullsbrook, Lexia, Melaleuca and Upper Swan, the northern part of Cullacabardee, the western parts of Avon Valley and Walyunga National Parks, and the City of Swan part of Gnangara. Bullsbrook is named after a watercourse in the area. Gnangara is named from an Aboriginal word thought to mean ‘spring’.
Settlement of the area dates from the 1890s, following the construction of the Midland railway line. Military land use commenced from 1935. The population increased from the early 1990s, a result of new dwellings being added to the area. Land continues to be used mainly for farming, including grazing, market gardening and viticulture.
Major features of the area include Avon Valley National Park, Walyunga National Park, Whiteman Park, Bullsbrook Nature Reserve, Bells Rapids Park, Jumbuck Hill Park, Ellen Brook Nature Reserve, Gnangara Pine Plantation, Pearce RAAF Base, Perth International Telecommunication Centre, Gnangara Motorcycle Area, Ellenbrook Speedway, Chequers Golf Course, Twin Swamps Wildlife Sanctuary, Brooke Shopping Centre and a number of schools.
Community Profile City of Swan
Page 3
Bullsbrook - Gnangara:
Land Area: 42,745 hectares Density: 0.11 people per hectare (2006)
Community Profile City of Swan
Page 4

Bullsbrook - Gnangara Introduction and summary (Map and key statistics)
The 'Key statistics' table presented below contains summary statistics for Bullsbrook - Gnangara. By default the table displays 2001 and 2006 data as both absolute numbers and percentages (where applicable), along with the change in number between these years. To view 1996 data alongside 2006 data, choose ‘1996' from the drop-down list located above the table on the right hand side.
Key statistics(summary statistics) Bullsbrook - Gnangara
2006 2001
Enumerated datanumber %
City of Swan % number %
City of Swan %
Change 2001 to
2006
Enumerated population, including overseas visitors
Total population (a) 4,548 100.0 100.0 4,240 100.0 100.0 308
Males (a) 2,280 50.1 49.4 2,180 51.4 49.6 100
Females (a) 2,268 49.9 50.6 2,060 48.6 50.4 208
Overseas visitors 48 1.1 0.5 54 1.3 0.5 -6
Enumerated population, excluding overseas visitors
Total population (b) 4,501 100.0 100.0 4,177 99.8 100.0 324
Males (b) 2,247 49.9 49.4 2,130 50.9 49.6 117
Females (b) 2,254 50.1 50.6 2,047 48.9 50.4 207
Population characteristics
Indigenous population 98 2.2 2.8 127 3.0 2.9 -29
Australian born 3,285 73.0 65.2 3,066 73.2 66.5 219
Overseas born 935 20.8 27.7 861 20.6 28.6 74
Australian citizens 3,910 86.9 85.0 3,688 88.1 87.1 222
Australian citizens aged 18+ 2,739 60.9 59.5 2,584 61.7 59.3 155
Institutional population 155 3.4 2.0 138 3.3 2.0 17
Age structure
Infants 0 to 4 years 328 7.3 7.8 305 7.3 8.4 23
Children 5 to 17 years 971 21.6 21.4 877 21.0 22.4 94
Adults 18 to 64 years 2,826 62.8 62.2 2,698 64.5 61.6 128
Mature adults 65 to 84 years 350 7.8 7.9 280 6.7 6.9 70
Senior citizens 85 years and over 23 0.5 0.8 9 0.2 0.7 14
Households and dwellings
Owned 426 24.1 22.6 485 31.5 27.3 -59
Purchasing 775 43.9 45.2 588 38.2 43.6 187
Renting 268 15.2 19.3 251 16.3 18.0 17
Households (occupied private dwellings)
1,576 -- -- 1,450 -- -- 126
Persons counted in households 4,393 -- -- 4,102 -- -- 291
Average household size (persons) 2.79 -- -- 2.83 -- -- -0.04
Total Dwellings 1,765 100.0 100.0 1,538 100.0 100.0 227
Source: Australian Bureau of Statistics, Census of Population and Housing, 2006, 2001, 1996, and 1991.
NOTE: Table totals may not equate with other similar tables due to randomisation of small numbers. Please refer to the specific data notes for more information.
Community Profile City of Swan
Page 5

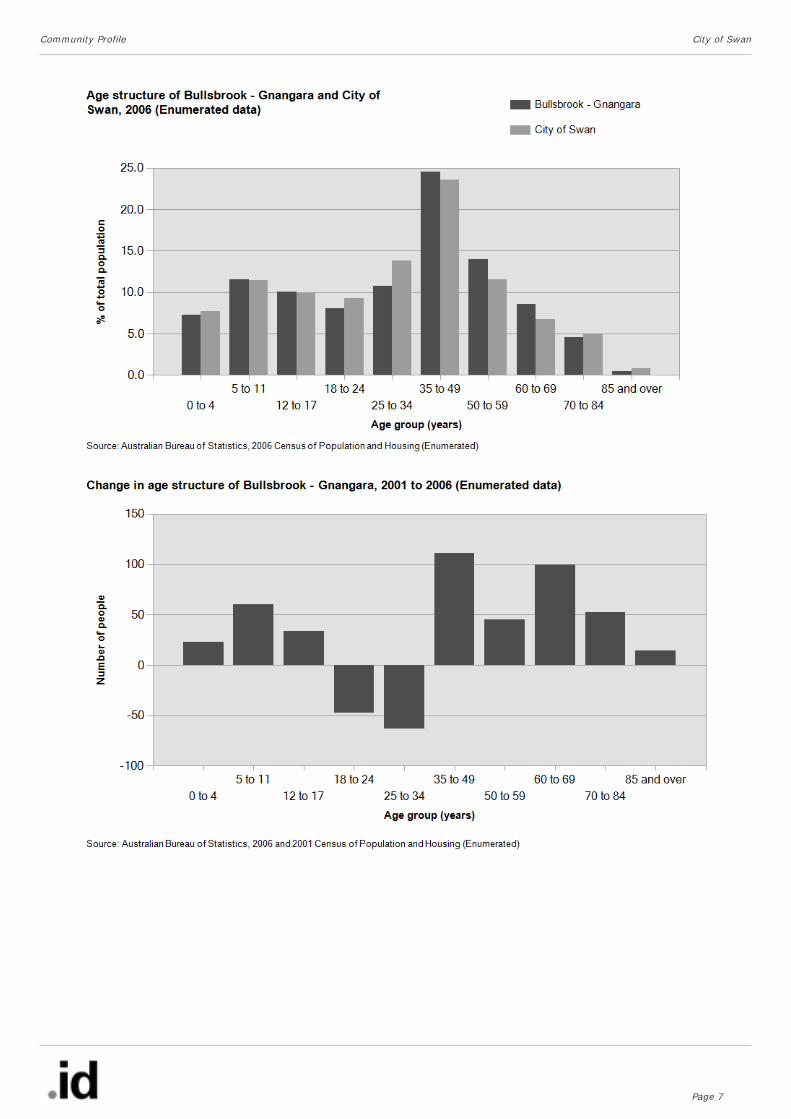
Bullsbrook - Gnangara How old are we? (Age structure)
● A larger percentage of 50 to 59 year olds (14.0% compared to 11.6%);
● A larger percentage of 60 to 69 year olds (8.6% compared to 6.8%), and;
● A smaller percentage of 25 to 34 year olds (10.7% compared to 13.8%).
● 35 to 49 (+111 persons);
● 60 to 69 (+100 persons);
● 5 to 11 (+60 persons), and;
● 25 to 34 (-63 persons).
Derived from the Census question, ‘What is the person’s date of birth (or age last birthday)?’
The Age Structure of the population is the most widely used component of the Census. It is an indicator of an area’s residential role and function and how it is likely to change in the future. The age structure of a population is usually indicative of an area’s era of settlement and provides key insights into the level of demand for services and facilities (as most services and facilities are age-specific).
To get a more complete picture of the demographic characteristics of an area the age structure should be viewed in conjunction with Households and Family types.
Age structureage group (years) Bullsbrook - Gnangara
2006 2001
Enumerated datanumber %
City of Swan % number %
City of Swan %
Change 2001 to
2006
0 to 4 328 7.3 7.8 305 7.3 8.4 23
5 to 11 520 11.6 11.5 460 11.0 12.4 60
12 to 17 451 10.0 9.9 417 10.0 10.0 34
18 to 24 362 8.0 9.3 409 9.8 8.8 -47
25 to 34 483 10.7 13.8 546 13.1 16.0 -63
35 to 49 1,106 24.6 23.6 995 23.9 23.6 111
50 to 59 631 14.0 11.6 586 14.1 10.0 45
60 to 69 388 8.6 6.8 288 6.9 5.7 100
70 to 84 206 4.6 4.9 154 3.7 4.5 52
85 and over 23 0.5 0.8 9 0.2 0.7 14
Total 4,498 100.0 100.0 4,169 100.0 100.0 329
Source: Australian Bureau of Statistics, Census of Population and Housing, 2006, 2001, 1996, and 1991.
NOTE: Table totals may not equate with other similar tables due to randomisation of small numbers. Please refer to the specific data notes for more information.
Analysis of the age structure of Bullsbrook - Gnangara in 2006 compared to the City of Swan shows that there was a similar proportion of people in the younger age groups (0 to 17) but a larger proportion of people in the older age groups (60+).
Overall, 28.9% of the population was aged between 0 and 17, and 13.7% were aged 60 years and over, compared with 29.2% and 12.5% respectively for the City of Swan.
The major differences between the age structure of Bullsbrook - Gnangara and the City of Swan were:
The largest changes in age structure in this area between 2001 and 2006 were in the age groups:
Community Profile City of Swan
Page 6
Community Profile City of Swan
Page 7

Bullsbrook - Gnangara Where were we born? (Birthplace countries)
● A larger percentage of people born in United Kingdom (12.0% compared to 9.0%).
Derived from the Census question, ‘In which country was the person born?’
Country of Birth data identifies where people were born and is indicative of the level of cultural diversity in an area. The mix of Country of Birth groups within an area is also indicative of historical settlement patterns, as source countries for Australia's immigration program have varied significantly over time.
To get a more complete picture of the population’s cultural and ethnic characteristics Country of Birth data should be viewed in conjunction with Language Spoken at Home and Religion data.
Country of Birthtop 4 overseas birthplaces ranked for 2006 (persons)
Bullsbrook - Gnangara
2006 2001
Enumerated datanumber %
City of Swan % number %
City of Swan %
Change 2001 to
2006
United Kingdom 541 12.0 9.0 495 11.9 9.7 46
New Zealand 110 2.4 2.7 107 2.6 2.7 3
Singapore 23 0.5 0.5 23 0.6 0.5 0
Italy 22 0.5 1.1 29 0.7 1.4 -7 Non-English speaking backgrounds 243 5.4 14.2 216 5.2 14.7 27
Main English speaking countries 692 15.4 13.5 639 15.3 13.8 53
TOTAL OVERSEAS BORN 935 20.8 27.7 855 20.5 28.6 80
AUSTRALIA 3,285 73.1 65.3 3,066 73.5 66.5 219
NOT STATED 276 6.1 7.1 253 6.1 4.9 23
Total 4,496 100.0 100.0 4,174 100.0 100.0 322
Source: Australian Bureau of Statistics, Census of Population and Housing, 2006, 2001, 1996, and 1991.
NOTE: Table totals may not equate with other similar tables due to randomisation of small numbers. Please refer to the specific data notes for more information.
Analysis of the country of birth of the population in Bullsbrook - Gnangara in 2006 compared to the City of Swan shows that there was a smaller proportion of people born overseas as well as a smaller proportion of people from a non-English speaking background.
Overall, 20.8% of the population was born overseas, and 5.4% were from a non-English speaking background, compared with 27.7% and 14.2% respectively for the City of Swan.
The dominant non-English speaking country of birth in Bullsbrook - Gnangara was United Kingdom, where 12.0% of the population, or 541 people, were born.
The major difference between the countries of birth of the population in Bullsbrook - Gnangara and the City of Swan was:
Between 2001 and 2006 there were no numerically significant changes in Bullsbrook - Gnangara's country of birth data.
Community Profile City of Swan
Page 8

Community Profile City of Swan
Page 9
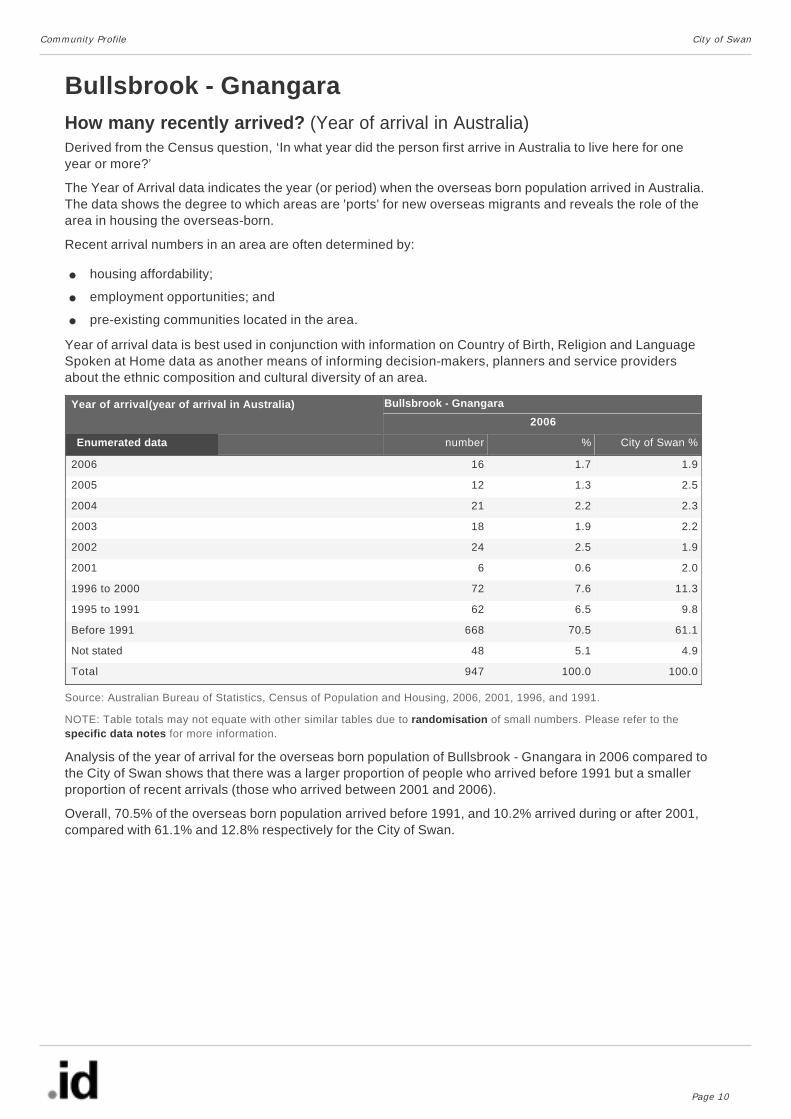
Bullsbrook - Gnangara How many recently arrived? (Year of arrival in Australia)
● housing affordability;
● employment opportunities; and
● pre-existing communities located in the area.
Derived from the Census question, ‘In what year did the person first arrive in Australia to live here for one year or more?’
The Year of Arrival data indicates the year (or period) when the overseas born population arrived in Australia. The data shows the degree to which areas are 'ports' for new overseas migrants and reveals the role of the area in housing the overseas-born.
Recent arrival numbers in an area are often determined by:
Year of arrival data is best used in conjunction with information on Country of Birth, Religion and Language Spoken at Home data as another means of informing decision-makers, planners and service providers about the ethnic composition and cultural diversity of an area.
Year of arrival(year of arrival in Australia) Bullsbrook - Gnangara
2006
Enumerated data number % City of Swan %
2006 16 1.7 1.9
2005 12 1.3 2.5
2004 21 2.2 2.3
2003 18 1.9 2.2
2002 24 2.5 1.9
2001 6 0.6 2.0
1996 to 2000 72 7.6 11.3
1995 to 1991 62 6.5 9.8
Before 1991 668 70.5 61.1
Not stated 48 5.1 4.9
Total 947 100.0 100.0
Source: Australian Bureau of Statistics, Census of Population and Housing, 2006, 2001, 1996, and 1991.
NOTE: Table totals may not equate with other similar tables due to randomisation of small numbers. Please refer to the specific data notes for more information.
Analysis of the year of arrival for the overseas born population of Bullsbrook - Gnangara in 2006 compared to the City of Swan shows that there was a larger proportion of people who arrived before 1991 but a smaller proportion of recent arrivals (those who arrived between 2001 and 2006).
Overall, 70.5% of the overseas born population arrived before 1991, and 10.2% arrived during or after 2001, compared with 61.1% and 12.8% respectively for the City of Swan.
Community Profile City of Swan
Page 10

Community Profile City of Swan
Page 11
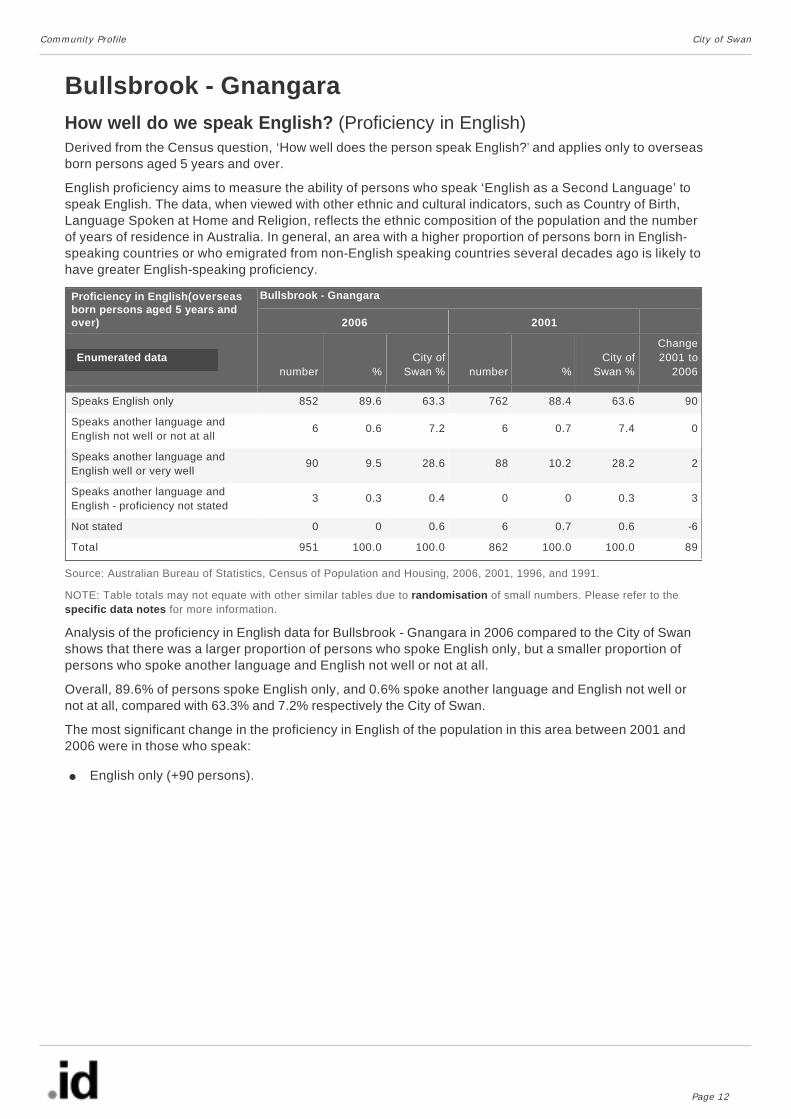
Bullsbrook - Gnangara How well do we speak English? (Proficiency in English)
● English only (+90 persons).
Derived from the Census question, ‘How well does the person speak English?’ and applies only to overseas born persons aged 5 years and over.
English proficiency aims to measure the ability of persons who speak ‘English as a Second Language’ to speak English. The data, when viewed with other ethnic and cultural indicators, such as Country of Birth, Language Spoken at Home and Religion, reflects the ethnic composition of the population and the number of years of residence in Australia. In general, an area with a higher proportion of persons born in English-speaking countries or who emigrated from non-English speaking countries several decades ago is likely to have greater English-speaking proficiency.
Proficiency in English(overseas born persons aged 5 years and over)
Bullsbrook - Gnangara
2006 2001
Enumerated datanumber %
City of Swan % number %
City of Swan %
Change 2001 to
2006 Speaks English only 852 89.6 63.3 762 88.4 63.6 90
Speaks another language and English not well or not at all
6 0.6 7.2 6 0.7 7.4 0
Speaks another language and English well or very well
90 9.5 28.6 88 10.2 28.2 2
Speaks another language and English - proficiency not stated
3 0.3 0.4 0 0 0.3 3
Not stated 0 0 0.6 6 0.7 0.6 -6
Total 951 100.0 100.0 862 100.0 100.0 89
Source: Australian Bureau of Statistics, Census of Population and Housing, 2006, 2001, 1996, and 1991.
NOTE: Table totals may not equate with other similar tables due to randomisation of small numbers. Please refer to the specific data notes for more information.
Analysis of the proficiency in English data for Bullsbrook - Gnangara in 2006 compared to the City of Swan shows that there was a larger proportion of persons who spoke English only, but a smaller proportion of persons who spoke another language and English not well or not at all.
Overall, 89.6% of persons spoke English only, and 0.6% spoke another language and English not well or not at all, compared with 63.3% and 7.2% respectively the City of Swan.
The most significant change in the proficiency in English of the population in this area between 2001 and 2006 were in those who speak:
Community Profile City of Swan
Page 12

Community Profile City of Swan
Page 13

Bullsbrook - Gnangara What language do we speak at home? (Language spoken at home)Derived from the question, ‘Does the person speak a language other than English at home?’
The proportion of the population that speaks a language at home other than English is indicative of how culturally diverse a population is and the degree to which different ethnic groups and nationalities are retaining their language.
This data should be analysed in conjunction with Country of Birth, Year of Arrival and Religion data to assist in identifying specific cultural and ethnic groups in an area.
Languagetop 2 non-English languages ranked for 2006 (persons aged 5 years and over)
Bullsbrook - Gnangara
2006 2001
Enumerated datanumber %
City of Swan % number %
City of Swan %
Change 2001 to
2006
German 22 0.5 0.3 18 0.4 0.3 4
Italian 21 0.5 1.8 34 0.8 2.1 -13 Speak English Only 4,139 91.8 79.7 3,826 91.4 81.3 313
Non-English total 150 3.3 14.1 144 3.4 14.3 6
Not Stated 222 4.9 6.1 217 5.2 4.4 5
Total 4,511 100.0 100.0 4,187 100.0 100.0 324
Source: Australian Bureau of Statistics, Census of Population and Housing, 2006, 2001, 1996, and 1991.
NOTE: Table totals may not equate with other similar tables due to randomisation of small numbers. Please refer to the specific data notes for more information.
Analysis of the language spoken at home by the population of Bullsbrook - Gnangara in 2006 compared to the City of Swan shows that there was a larger proportion of people who spoke English only but a smaller proportion of those speaking a non-English language (either exclusively, or in addition to English).
Overall, 91.8% of the population spoke English only, and 3.3% spoke a non-English language, compared with 79.7% and 14.1% respectively for the City of Swan.
No further analysis of this data is available due to the small number of people speaking a language other than English at home.
Community Profile City of Swan
Page 14

Community Profile City of Swan
Page 15
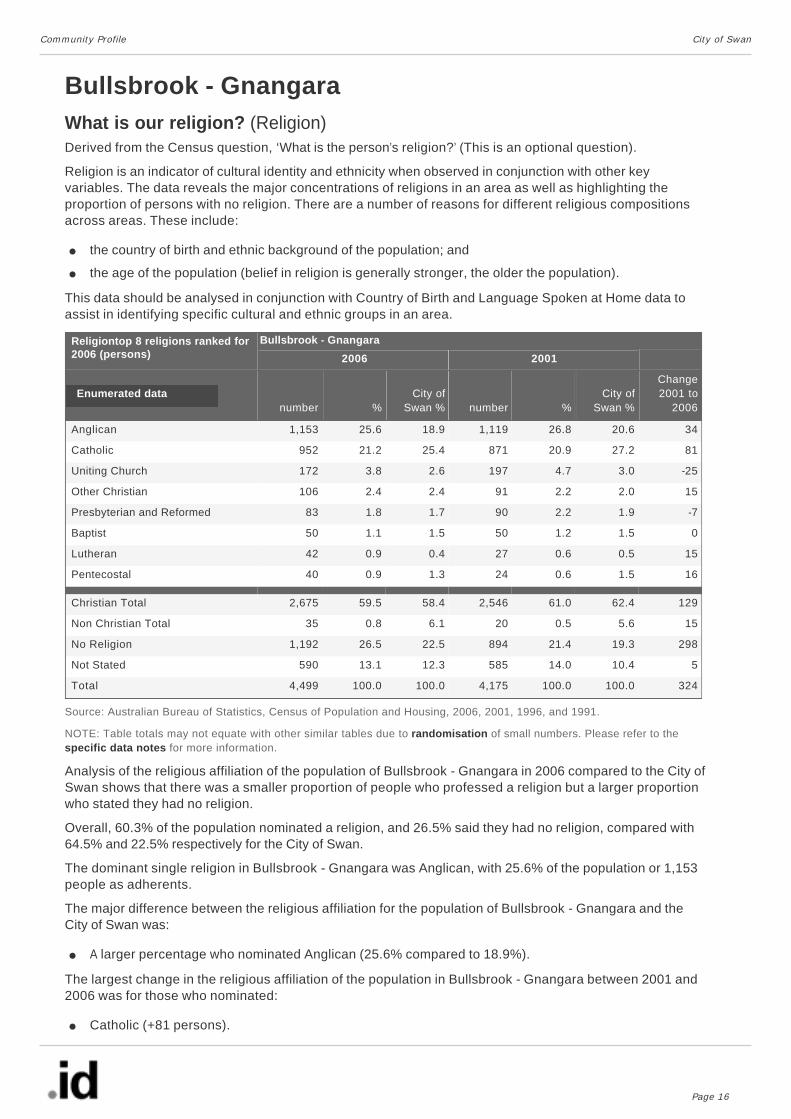
Bullsbrook - Gnangara What is our religion? (Religion)
● the country of birth and ethnic background of the population; and
● the age of the population (belief in religion is generally stronger, the older the population).
● A larger percentage who nominated Anglican (25.6% compared to 18.9%).
● Catholic (+81 persons).
Derived from the Census question, ‘What is the person’s religion?’ (This is an optional question).
Religion is an indicator of cultural identity and ethnicity when observed in conjunction with other key variables. The data reveals the major concentrations of religions in an area as well as highlighting the proportion of persons with no religion. There are a number of reasons for different religious compositions across areas. These include:
This data should be analysed in conjunction with Country of Birth and Language Spoken at Home data to assist in identifying specific cultural and ethnic groups in an area.
Religiontop 8 religions ranked for 2006 (persons)
Bullsbrook - Gnangara
2006 2001
Enumerated datanumber %
City of Swan % number %
City of Swan %
Change 2001 to
2006
Anglican 1,153 25.6 18.9 1,119 26.8 20.6 34
Catholic 952 21.2 25.4 871 20.9 27.2 81
Uniting Church 172 3.8 2.6 197 4.7 3.0 -25
Other Christian 106 2.4 2.4 91 2.2 2.0 15
Presbyterian and Reformed 83 1.8 1.7 90 2.2 1.9 -7
Baptist 50 1.1 1.5 50 1.2 1.5 0
Lutheran 42 0.9 0.4 27 0.6 0.5 15
Pentecostal 40 0.9 1.3 24 0.6 1.5 16 Christian Total 2,675 59.5 58.4 2,546 61.0 62.4 129
Non Christian Total 35 0.8 6.1 20 0.5 5.6 15
No Religion 1,192 26.5 22.5 894 21.4 19.3 298
Not Stated 590 13.1 12.3 585 14.0 10.4 5
Total 4,499 100.0 100.0 4,175 100.0 100.0 324
Source: Australian Bureau of Statistics, Census of Population and Housing, 2006, 2001, 1996, and 1991.
NOTE: Table totals may not equate with other similar tables due to randomisation of small numbers. Please refer to the specific data notes for more information.
Analysis of the religious affiliation of the population of Bullsbrook - Gnangara in 2006 compared to the City of Swan shows that there was a smaller proportion of people who professed a religion but a larger proportion who stated they had no religion.
Overall, 60.3% of the population nominated a religion, and 26.5% said they had no religion, compared with 64.5% and 22.5% respectively for the City of Swan.
The dominant single religion in Bullsbrook - Gnangara was Anglican, with 25.6% of the population or 1,153 people as adherents.
The major difference between the religious affiliation for the population of Bullsbrook - Gnangara and the City of Swan was:
The largest change in the religious affiliation of the population in Bullsbrook - Gnangara between 2001 and 2006 was for those who nominated:
Community Profile City of Swan
Page 16

Community Profile City of Swan
Page 17

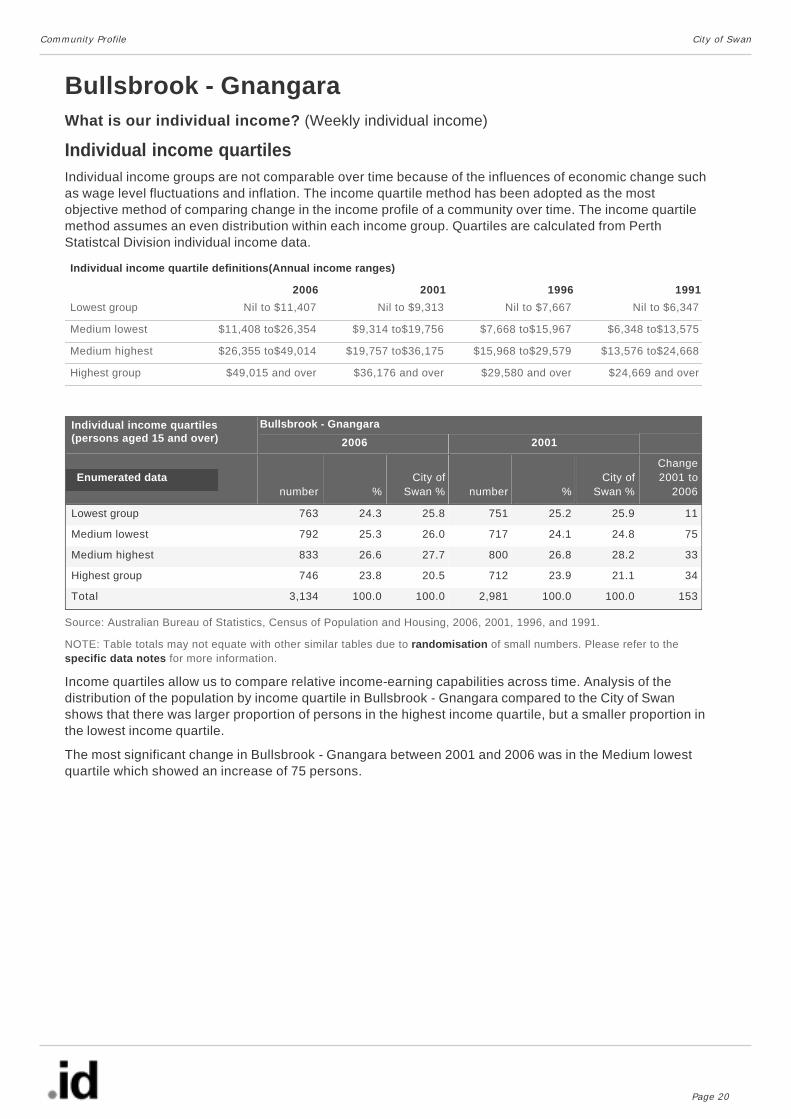
Bullsbrook - Gnangara What is our individual income? (Weekly individual income)
Weekly individual income 2006
● employment status;
● age (as for instance students and retirees often receive a lower income);
● qualifications; and
● the type of employment undertaken by the person.
Derived from the Census question, ‘What is the total of all wages/salaries, government benefits, pensions, allowances and other income the person usually receives?’ This is the gross amount and relates only to persons aged 15 years or more.
Individual Income is an indicator of socio-economic status. With other data sources, such as Household Income, Educational Qualifications and Occupation, it helps to evaluate the economic opportunities and socio-economic status of an area. The amount of income an individual receives is linked to a number of factors including the person’s:
It is interesting to view individual income data in relation to both household income and number of persons usually resident. Areas with relatively high household income may be the result of multiple earners in the household contributing to that household income, so it is possible that some areas that have relatively high household incomes will have relatively low levels of individual income.
To enable a comparison of Individual Income levels of an area over time, Individual Income quartiles have been calculated and presented in the 'Individual income quartiles tab'.
Weekly individual incomeincome groups (persons) Bullsbrook - Gnangara
2006
Enumerated data number % City of Swan %
negative/nil income 261 7.7 7.0
$1 to $149 231 6.8 7.6
$150 to $249 390 11.5 12.8
$250 to $399 407 12.0 12.1
$400 to $599 497 14.6 14.4
$600 to $799 410 12.1 12.2
$800 to $999 269 7.9 8.9
$1,000 to $1,299 336 9.9 8.3
$1,300 to $1,599 147 4.3 3.8
$1,600 to $1,999 88 2.6 2.0
$2,000 or more 98 2.9 2.0
not stated 261 7.7 8.8
Total 3,395 100.0 100.0
Source: Australian Bureau of Statistics, Census of Population and Housing, 2006, 2001, 1996, and 1991.
NOTE: Table totals may not equate with other similar tables due to randomisation of small numbers. Please refer to the specific data notes for more information.
Analysis of individual income levels in Bullsbrook - Gnangara in 2006 compared to the City of Swan shows that there was a larger proportion of persons earning a high income (those earning $1,000 per week or more) but a smaller proportion of low income persons (those earning less than $400 per week).
Overall, 19.7% of the population earned a high income, and 38.0% earned a low income, compared with 16.1% and 39.5% respectively for the City of Swan.
Community Profile City of Swan
Page 18

Community Profile City of Swan
Page 19
Bullsbrook - Gnangara What is our individual income? (Weekly individual income)
Individual income quartilesIndividual income groups are not comparable over time because of the influences of economic change such as wage level fluctuations and inflation. The income quartile method has been adopted as the most objective method of comparing change in the income profile of a community over time. The income quartile method assumes an even distribution within each income group. Quartiles are calculated from Perth Statistcal Division individual income data.
Individual income quartile definitions(Annual income ranges)
2006 2001 1996 1991
Lowest group Nil to $11,407 Nil to $9,313 Nil to $7,667 Nil to $6,347
Medium lowest $11,408 to$26,354 $9,314 to$19,756 $7,668 to$15,967 $6,348 to$13,575
Medium highest $26,355 to$49,014 $19,757 to$36,175 $15,968 to$29,579 $13,576 to$24,668
Highest group $49,015 and over $36,176 and over $29,580 and over $24,669 and over
Individual income quartiles (persons aged 15 and over)
Bullsbrook - Gnangara
2006 2001
Enumerated datanumber %
City of Swan % number %
City of Swan %
Change 2001 to
2006
Lowest group 763 24.3 25.8 751 25.2 25.9 11
Medium lowest 792 25.3 26.0 717 24.1 24.8 75
Medium highest 833 26.6 27.7 800 26.8 28.2 33
Highest group 746 23.8 20.5 712 23.9 21.1 34
Total 3,134 100.0 100.0 2,981 100.0 100.0 153
Source: Australian Bureau of Statistics, Census of Population and Housing, 2006, 2001, 1996, and 1991.
NOTE: Table totals may not equate with other similar tables due to randomisation of small numbers. Please refer to the specific data notes for more information.
Income quartiles allow us to compare relative income-earning capabilities across time. Analysis of the distribution of the population by income quartile in Bullsbrook - Gnangara compared to the City of Swan shows that there was larger proportion of persons in the highest income quartile, but a smaller proportion in the lowest income quartile.
The most significant change in Bullsbrook - Gnangara between 2001 and 2006 was in the Medium lowest quartile which showed an increase of 75 persons.
Community Profile City of Swan
Page 20

Community Profile City of Swan
Page 21

Bullsbrook - Gnangara What is our household income? (Weekly household income)
Weekly household income 2006
● the number of workers in the household;
● the percentage of people unemployed or on other income support benefits; and
● the type of employment undertaken by the household members.
Derived from the Census question, ‘What is the total of all wages/salaries, government benefits, pensions, allowances and other income the person usually receives?’ This is the gross amount and relates only to persons aged 15 years or more.
Household Income is one of the most important indicators of socio-economic status. With other data sources, such as Educational Qualifications and Occupation, it helps to evaluate the economic opportunities and socio-economic status of an area. The amount of income a household generates is linked to a number of factors:
Note: It is important to remember that households vary in size, so that some areas have a greater number of dependents per income generated than others. If the area has a large number of retirees then this will produce a higher proportion of households with low income. This is not necessarily a measure of retirees' affluence, as retirees often have capital resources. Refer to the Age Structure section to understand this element.
To enable a comparison of Household Income levels of an area over time, Household Income quartiles have been calculated and presented in the 'Household income quartiles tab'.
Weekly household incomeincome groups (households) Bullsbrook - Gnangara
2006
Enumerated data number % City of Swan %
Negative / Nil income 12 0.8 0.8
$1 to $149 10 0.7 1.0
$150 to $249 57 3.8 4.0
$250 to $349 51 3.4 5.3
$350 to $499 61 4.0 4.0
$500 to $649 135 8.9 9.1
$650 to $799 84 5.6 6.9
$800 to $999 101 6.7 7.7
$1000 to $1199 179 11.8 12.6
$1200 to $1399 109 7.2 7.0
$1400 to $1699 139 9.2 9.0
$1700 to $1999 110 7.3 6.8
$2000 to $2499 91 6.0 6.3
$2500 to $2999 76 5.0 4.2
$3000 or more 58 3.8 3.1
Partial income stated 187 12.4 9.4
All incomes not stated 53 3.5 2.7
Total 1,513 100.0 100.0
Source: Australian Bureau of Statistics, Census of Population and Housing, 2006, 2001, 1996, and 1991.
NOTE: Table totals may not equate with other similar tables due to randomisation of small numbers. Please refer to the specific data notes for more information.
Analysis of household income levels in Bullsbrook - Gnangara in 2006 compared to the City of Swan shows
Community Profile City of Swan
Page 22

that there was a larger proportion of high income households (those earning $1,700 per week or more) but a smaller proportion of low income households (those earning less than $500 per week).
Overall, 22.1% of the households earned a high income, and 12.7% were low income households, compared with 20.4% and 15.1% respectively for the City of Swan.
Community Profile City of Swan
Page 23

Bullsbrook - Gnangara What is our household income? (Weekly household income)
Household income quartilesHousehold income groups are not comparable over time because of the influences of economic change such as wage level fluctuations and inflation. The income quartile method has been adopted as the most objective method of comparing change in the income profile of a community over time. The income quartile method assumes an even distribution within each income group. Quartiles are calculated from Perth Statistcal Division household income data.
Household income quartile definitions(Annual income ranges)
2006 2001 1996 1991
Lowest group Nil to $30,219 Nil to $22,257 Nil to $18,314 Nil to $16,191
Medium lowest $30,220 to$56,445 $22,258 to$41,958 $18,315 to$34,422 $16,192 to$29,551
Medium highest $56,446 to$94,897 $41,959 to$70,044 $34,423 to$57,642 $29,552 to$48,025
Highest group $94,898 and over $70,045 and over $57,643 and over $48,026 and over
Household income quartiles (households)
Bullsbrook - Gnangara
2006 2001
Enumerated datanumber %
City of Swan % number %
City of Swan %
Change 2001 to
2006
Lowest group 264 20.7 22.8 254 20.9 22.3 10
Medium lowest 323 25.4 27.5 330 27.1 27.1 -6
Medium highest 396 31.1 29.6 345 28.4 29.1 51
Highest group 289 22.7 20.1 286 23.6 21.4 3
Total 1,273 100.0 100.0 1,215 100.0 100.0 58
Source: Australian Bureau of Statistics, Census of Population and Housing, 2006, 2001, 1996, and 1991.
NOTE: Table totals may not equate with other similar tables due to randomisation of small numbers. Please refer to the specific data notes for more information.
Income quartiles allow us to compare relative income-earning capabilities across time. Analysis of the distribution of households by income quartile in Bullsbrook - Gnangara compared to the City of Swan shows that there was larger proportion of households in the highest income quartile, but a smaller proportion in the lowest income quartile.
The most significant change in Bullsbrook - Gnangara between 2001 and 2006 was in the Medium highest quartile which showed an increase of 51 households.
Community Profile City of Swan
Page 24

Community Profile City of Swan
Page 25

Bullsbrook - Gnangara What are our qualifications? (Highest education qualification achieved)
● the age of the population (e.g. older people tend to have more vocational qualifications, while people in
their twenties and thirties are more likely to have a university degree);
● the professional or working ambitions of people (to seek education as youth or retraining as adults);
● the opportunities afforded to people to continue studying beyond compulsory schooling.
● Vocational qualifications (+112 persons), and;
● Bachelor or higher degrees (+74 persons).
Derived from the Census question, ‘What is the level of the highest qualification the person has completed?’ and relates only to persons aged 15 years or more.
Educational Qualifications are one of the most important indicators of socio-economic status. With other data sources, such as Income and Occupation, Educational Qualifications help to evaluate the economic opportunities and socio-economic status of an area. Level of Educational Qualifications in a population relate to a number of factors including:
Highest qualification achieved(persons aged 15 years and over)
Bullsbrook - Gnangara
2006 2001
Enumerated datanumber %
City of Swan % number %
City of Swan %
Change 2001 to
2006
Bachelor or Higher degree 263 7.7 9.0 189 5.9 7.1 74
Advanced Diploma or Diploma 216 6.4 6.7 173 5.4 5.4 43
Vocational 753 22.2 19.1 641 20.2 18.0 112
No qualifications 1,781 52.4 52.2 1,834 57.7 59.1 -53
Not Stated 384 11.3 13.0 344 10.8 10.4 40
Total 3,397 100.0 100.0 3,181 100.0 100.0 216
Source: Australian Bureau of Statistics, Census of Population and Housing, 2006, 2001, 1996, and 1991.
NOTE: Table totals may not equate with other similar tables due to randomisation of small numbers. Please refer to the specific data notes for more information.
Analysis of the qualifications of the population in Bullsbrook - Gnangara in 2006 compared to the City of Swan shows that there was a larger proportion of people holding formal qualifications (Bachelor or higher degree; Advanced Diploma or Diploma; or Vocational qualifications) and a similar proportion of people with no formal qualifications.
Overall, 36.3% of the population held educational qualifications, and 52.4% had no qualifications, compared with 34.8% and 52.2% respectively for the City of Swan.
There were no major differences between Bullsbrook - Gnangara and the City of Swan's highest qualifications achieved data in 2006.
The largest changes in the qualifications of the population in Bullsbrook - Gnangara between 2001 and 2006 were in those with:
Community Profile City of Swan
Page 26

Community Profile City of Swan
Page 27

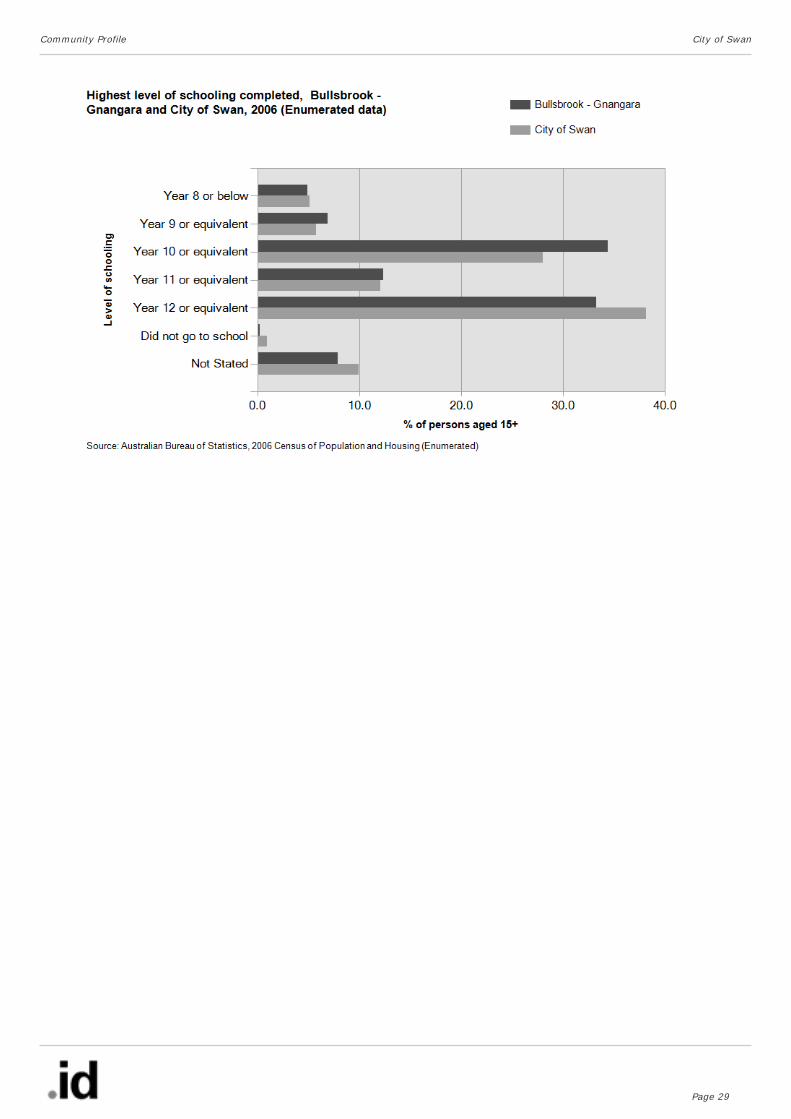
Bullsbrook - Gnangara What is the highest secondary school year we have completed? (Highest level of schooling completed)
● the age of the population, as over time there has been a greater emphasis on acquiring higher
education in order to find employment;
● the working and social aspirations of the population; and
● a lack of access to further education opportunities due to financial constraints or distance to schools.
● A larger percentage of people who left school at Year 10 or equivalent (34.4% compared to 28.0%), and;
● A smaller percentage of people who left school at Year 12 or equivalent (33.3% compared to 38.1%).
Derived from the Census question, ‘What is the highest year of primary or secondary school the person has completed?’ and relates only to persons aged 15 years or more.
The Year of Schooling data is a useful indicator of socio-economic status of an area. With other indicators, such as proficiency in English, the data informs planners and decision-makers as to people's ability to access services. Combined with Educational Qualifications it also allows assessment of the skill base of the population. The reasons for differences in Year of Schooling completed across areas are linked to a number of factors including:
Unfortunately this data is only available for 2006 as there is no comparable data for previous Census years. Please see specific data notes for further detail.
Highest level of schooling completed(persons aged 15 years and over)
Bullsbrook - Gnangara
2006
Enumerated data number % City of Swan %
Year 8 or below 167 4.9 5.1
Year 9 or equivalent 234 6.9 5.8
Year 10 or equivalent 1,163 34.4 28.0
Year 11 or equivalent 417 12.3 12.1
Year 12 or equivalent 1,126 33.3 38.1
Did not go to school 9 0.3 0.9
Not Stated 268 7.9 9.9
Total 3,384 100.0 100.0
Source: Australian Bureau of Statistics, Census of Population and Housing, 2006, 2001, 1996, and 1991.
NOTE: Table totals may not equate with other similar tables due to randomisation of small numbers. Please refer to the specific data notes for more information.
Analysis of the highest level of schooling attained by the population in Bullsbrook - Gnangara in 2006 compared to the City of Swan shows that there was a larger proportion of people who had left school at an early level (Year 10 or less) but a smaller proportion of people who completed Year 12 or equivalent.
Overall, 46.2% of the population left school at Year 10 or below, and 33.3% went on to complete Year 12 or equivalent, compared with 38.9% and 38.1% respectively for the City of Swan.
The major differences between the level of schooling attained by the population in Bullsbrook - Gnangara and the City of Swan were:
Community Profile City of Swan
Page 28
Community Profile City of Swan
Page 29

Bullsbrook - Gnangara Where are we learning? (Education institute attending)
● the age structure of the population, which influences the number of children attending school;
● proximity to tertiary education, which can mean young adults leaving home to be nearer to educational
facilities; and
● the degree to which people are seeking out educational opportunities in adulthood, especially in their
late teens and early twenties.
Derived from the Census question, ‘What type of educational institution is the person attending?’
The share of population attending educational institutions reflects three factors:
Education institute attending(persons)
Bullsbrook - Gnangara
2006 2001
Enumerated datanumber %
City of Swan % number %
City of Swan %
Change 2001 to
2006
Pre School 85 1.9 1.6 45 1.1 1.8 40
Primary - Government 317 7.1 6.6 364 8.7 8.4 -47
Primary - Catholic 33 0.7 1.9 23 0.6 2.0 10
Primary - Independent 97 2.2 1.7 67 1.6 1.5 30
Primary - Total 447 10.0 10.2 454 10.9 11.8 -7
Secondary - Government 209 4.7 4.3 205 4.9 5.0 4
Secondary - Catholic 43 1.0 1.1 23 0.6 1.2 20
Secondary - Independent 68 1.5 1.6 66 1.6 1.2 2
Secondary - Total 320 7.2 7.0 294 7.0 7.4 26
TAFE 74 1.7 2.2 102 2.4 3.1 -28
University 64 1.4 2.4 74 1.8 2.4 -10
Other 21 0.5 0.5 47 1.1 0.7 -26
Not Attending 3,162 71.1 67.7 2,939 70.4 68.6 223
Not Stated 325 7.3 8.9 218 5.2 4.3 107
Total 4,450 100.0 100.0 4,173 100.0 100.0 277
Source: Australian Bureau of Statistics, Census of Population and Housing, 2006, 2001, 1996, and 1991.
NOTE: Table totals may not equate with other similar tables due to randomisation of small numbers. Please refer to the specific data notes for more information.
Analysis of the share of the population attending educational institutions in Bullsbrook - Gnangara in 2006 compared to the City of Swan shows that there was a similar proportion attending primary school, a similar proportion attending secondary school, and a smaller proportion engaged in tertiary level education.
Overall, 10.0% of the population were attending primary school, 7.2% of the population were attending secondary institutions, and 3.1% were learning at a tertiary level, compared with 10.2%, 7.0% and 4.6% respectively for the City of Swan.
There were no major differences between Bullsbrook - Gnangara and the City of Swan's education institute data in 2006, and there were no numerically significant changes between 2001 and 2006.
Community Profile City of Swan
Page 30

Community Profile City of Swan
Page 31
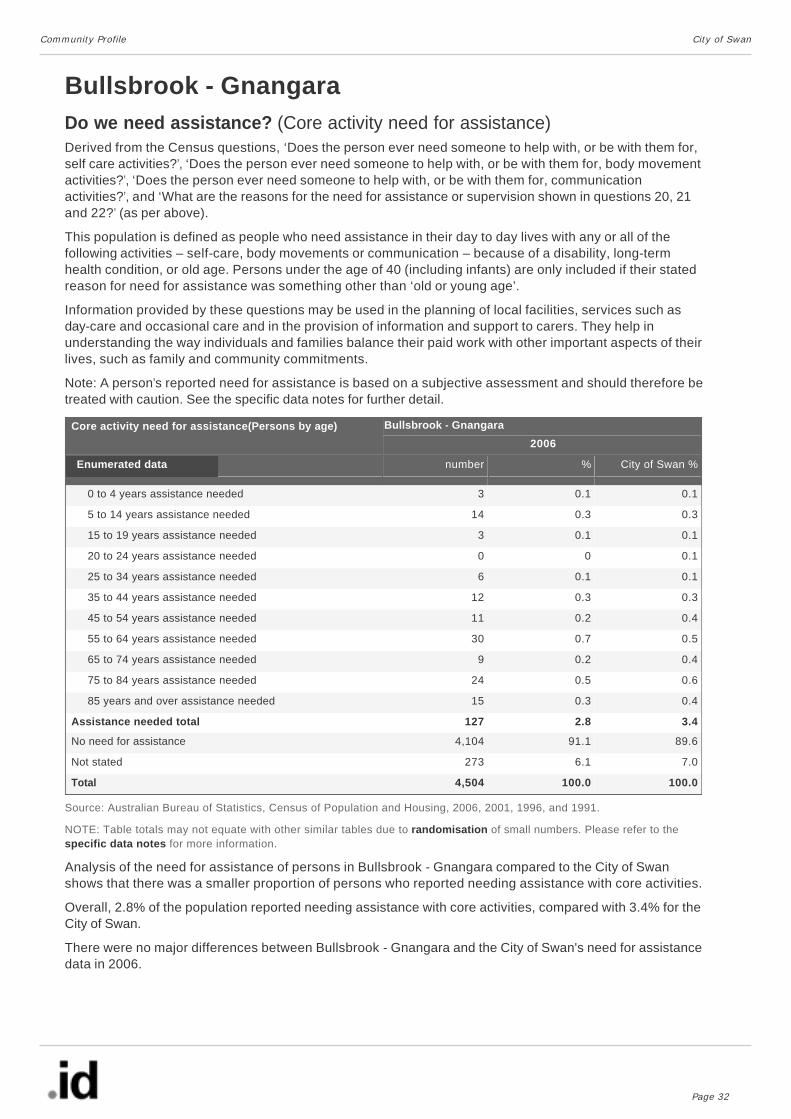
Bullsbrook - Gnangara Do we need assistance? (Core activity need for assistance)Derived from the Census questions, ‘Does the person ever need someone to help with, or be with them for, self care activities?’, ‘Does the person ever need someone to help with, or be with them for, body movement activities?’, ‘Does the person ever need someone to help with, or be with them for, communication activities?’, and ‘What are the reasons for the need for assistance or supervision shown in questions 20, 21 and 22?’ (as per above).
This population is defined as people who need assistance in their day to day lives with any or all of the following activities – self-care, body movements or communication – because of a disability, long-term health condition, or old age. Persons under the age of 40 (including infants) are only included if their stated reason for need for assistance was something other than ‘old or young age’.
Information provided by these questions may be used in the planning of local facilities, services such as day-care and occasional care and in the provision of information and support to carers. They help in understanding the way individuals and families balance their paid work with other important aspects of their lives, such as family and community commitments.
Note: A person’s reported need for assistance is based on a subjective assessment and should therefore be treated with caution. See the specific data notes for further detail.
Core activity need for assistance(Persons by age) Bullsbrook - Gnangara
2006
Enumerated data number % City of Swan %
0 to 4 years assistance needed 3 0.1 0.1
5 to 14 years assistance needed 14 0.3 0.3
15 to 19 years assistance needed 3 0.1 0.1
20 to 24 years assistance needed 0 0 0.1
25 to 34 years assistance needed 6 0.1 0.1
35 to 44 years assistance needed 12 0.3 0.3
45 to 54 years assistance needed 11 0.2 0.4
55 to 64 years assistance needed 30 0.7 0.5
65 to 74 years assistance needed 9 0.2 0.4
75 to 84 years assistance needed 24 0.5 0.6
85 years and over assistance needed 15 0.3 0.4
Assistance needed total 127 2.8 3.4
No need for assistance 4,104 91.1 89.6
Not stated 273 6.1 7.0
Total 4,504 100.0 100.0
Source: Australian Bureau of Statistics, Census of Population and Housing, 2006, 2001, 1996, and 1991.
NOTE: Table totals may not equate with other similar tables due to randomisation of small numbers. Please refer to the specific data notes for more information.
Analysis of the need for assistance of persons in Bullsbrook - Gnangara compared to the City of Swan shows that there was a smaller proportion of persons who reported needing assistance with core activities.
Overall, 2.8% of the population reported needing assistance with core activities, compared with 3.4% for the City of Swan.
There were no major differences between Bullsbrook - Gnangara and the City of Swan's need for assistance data in 2006.
Community Profile City of Swan
Page 32

Community Profile City of Swan
Page 33
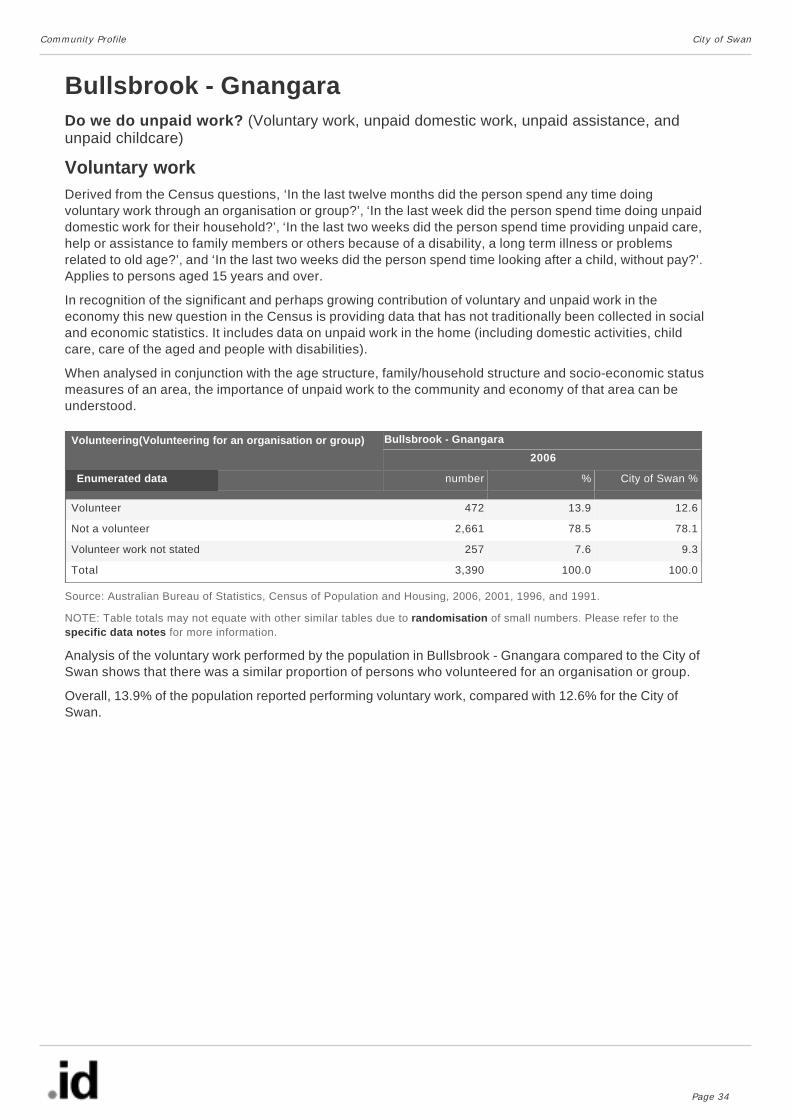
Bullsbrook - Gnangara Do we do unpaid work? (Voluntary work, unpaid domestic work, unpaid assistance, and unpaid childcare)
Voluntary workDerived from the Census questions, ‘In the last twelve months did the person spend any time doing voluntary work through an organisation or group?’, ‘In the last week did the person spend time doing unpaid domestic work for their household?’, ‘In the last two weeks did the person spend time providing unpaid care, help or assistance to family members or others because of a disability, a long term illness or problems related to old age?’, and ‘In the last two weeks did the person spend time looking after a child, without pay?’. Applies to persons aged 15 years and over.
In recognition of the significant and perhaps growing contribution of voluntary and unpaid work in the economy this new question in the Census is providing data that has not traditionally been collected in social and economic statistics. It includes data on unpaid work in the home (including domestic activities, child care, care of the aged and people with disabilities).
When analysed in conjunction with the age structure, family/household structure and socio-economic status measures of an area, the importance of unpaid work to the community and economy of that area can be understood.
Volunteering(Volunteering for an organisation or group) Bullsbrook - Gnangara
2006
Enumerated data number % City of Swan % Volunteer 472 13.9 12.6
Not a volunteer 2,661 78.5 78.1
Volunteer work not stated 257 7.6 9.3
Total 3,390 100.0 100.0
Source: Australian Bureau of Statistics, Census of Population and Housing, 2006, 2001, 1996, and 1991.
NOTE: Table totals may not equate with other similar tables due to randomisation of small numbers. Please refer to the specific data notes for more information.
Analysis of the voluntary work performed by the population in Bullsbrook - Gnangara compared to the City of Swan shows that there was a similar proportion of persons who volunteered for an organisation or group.
Overall, 13.9% of the population reported performing voluntary work, compared with 12.6% for the City of Swan.
Community Profile City of Swan
Page 34

Community Profile City of Swan
Page 35

Bullsbrook - Gnangara Do we do unpaid work? (Voluntary work, unpaid domestic work, unpaid assistance, and unpaid childcare)
Unpaid domestic workDerived from the Census questions, ‘In the last week did the person spend time doing unpaid domestic work for their household?’, ‘In the last two weeks did the person spend time providing unpaid care, help or assistance to family members or others because of a disability, a long term illness or problems related to old age?’, ‘In the last two weeks did the person spend time looking after a child, without pay?’, and ‘In the last twelve months did the person spend any time doing voluntary work through an organisation or group?’. Applies to persons aged 15 years and over.
In recognition of the significant and perhaps growing contribution of voluntary and unpaid work in the economy this new question in the Census is providing data that has not traditionally been collected in social and economic statistics. It includes data on unpaid work in the home (including domestic activities, child care, care of the aged and people with disabilities).
When analysed in conjunction with the age structure, family/household structure and socio-economic status measures of an area, the importance of unpaid work to the community and economy of that area can be understood.
Unpaid domestic work(Persons aged 15 years and over) Bullsbrook - Gnangara
2006
Enumerated data number % City of Swan %
Less than 5 hours 615 18.2 21.1
Between 5 and 14 hours 873 25.8 24.3
Between 15 and 29 hours 435 12.8 11.7
30 hours or more 535 15.8 12.1
Did unpaid domestic work 2,458 72.6 69.2
Did no unpaid domestic work 641 18.9 21.0
Not stated 287 8.5 9.8
Total 3,386 100.0 100.0
Source: Australian Bureau of Statistics, Census of Population and Housing, 2006, 2001, 1996, and 1991.
NOTE: Table totals may not equate with other similar tables due to randomisation of small numbers. Please refer to the specific data notes for more information.
Analysis of the unpaid domestic work performed by the population in Bullsbrook - Gnangara compared to the City of Swan shows that there was a larger proportion of persons who performed 15 hours or over of unpaid domestic work per week.
Overall, 28.6% of the population reported performing 15 hours or over of unpaid domestic work, compared with 23.8% for the City of Swan.
Community Profile City of Swan
Page 36

Community Profile City of Swan
Page 37

Bullsbrook - Gnangara Do we do unpaid work? (Voluntary work, unpaid domestic work, unpaid assistance, and unpaid childcare)
Unpaid careDerived from the Census questions, ‘In the last week did the person spend time doing unpaid domestic work for their household?’, ‘In the last two weeks did the person spend time providing unpaid care, help or assistance to family members or others because of a disability, a long term illness or problems related to old age?’, ‘In the last two weeks did the person spend time looking after a child, without pay?’, and ‘In the last twelve months did the person spend any time doing voluntary work through an organisation or group?’. Applies to persons aged 15 years and over.
In recognition of the significant and perhaps growing contribution of voluntary and unpaid work in the economy this new question in the Census is providing data that has not traditionally been collected in social and economic statistics. It includes data on unpaid work in the home (including domestic activities, child care, care of the aged and people with disabilities).
When analysed in conjunction with the age structure, family/household structure and socio-economic status measures of an area, the importance of unpaid work to the community and economy of that area can be understood.
Unpaid assistance to a person with a disability, long term illness or old age(persons aged 15 years and over)
Bullsbrook - Gnangara
2006
Enumerated data number % City of Swan % Provided unpaid care 317 9.4 9.2
No unpaid care provided 2,798 82.6 81.1
Not stated 271 8.0 9.7
Total 3,386 100.0 100.0
Source: Australian Bureau of Statistics, Census of Population and Housing, 2006, 2001, 1996, and 1991.
NOTE: Table totals may not equate with other similar tables due to randomisation of small numbers. Please refer to the specific data notes for more information.
Analysis of the unpaid care provided by the population in Bullsbrook - Gnangara compared to the City of Swan shows that there was a similar proportion of persons who provided unpaid care either to family members or others.
Overall, 9.4% of the population provided unpaid care, compared with 9.2% for the City of Swan.
Community Profile City of Swan
Page 38

Community Profile City of Swan
Page 39

Bullsbrook - Gnangara Do we do unpaid work? (Voluntary work, unpaid domestic work, unpaid assistance, and unpaid childcare)
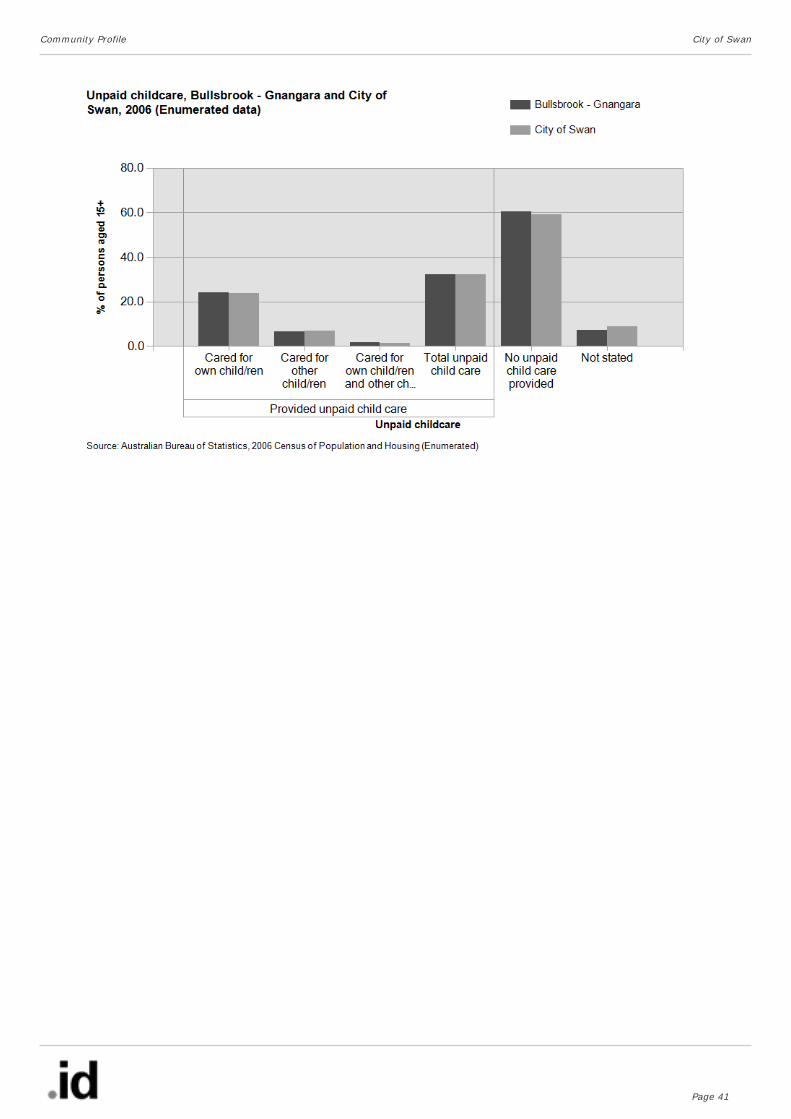
Unpaid childcareDerived from the Census questions, ‘In the last week did the person spend time doing unpaid domestic work for their household?’, ‘In the last two weeks did the person spend time providing unpaid care, help or assistance to family members or others because of a disability, a long term illness or problems related to old age?’, ‘In the last two weeks did the person spend time looking after a child, without pay?’, and ‘In the last twelve months did the person spend any time doing voluntary work through an organisation or group?’. Applies to persons aged 15 years and over.
In recognition of the significant and perhaps growing contribution of voluntary and unpaid work in the economy this new question in the Census is providing data that has not traditionally been collected in social and economic statistics. It includes data on unpaid work in the home (including domestic activities, child care, care of the aged and people with disabilities).
When analysed in conjunction with the age structure, family/household structure and socio-economic status measures of an area, the importance of unpaid work to the community and economy of that area can be understood.
Unpaid child care(persons aged 15 years and over) Bullsbrook - Gnangara
2006
Enumerated data number % City of Swan %
Cared for own child/ren 813 24.0 23.8
Cared for other child/ren 227 6.7 7.0
Cared for own child/ren and other child/ren 54 1.6 1.3
Provided unpaid child care 1,094 32.2 32.1
No unpaid child care provided 2,056 60.6 59.1
Not stated 243 7.2 8.8
Total 3,393 100.0 100.0
Source: Australian Bureau of Statistics, Census of Population and Housing, 2006, 2001, 1996, and 1991.
NOTE: Table totals may not equate with other similar tables due to randomisation of small numbers. Please refer to the specific data notes for more information.
Analysis of the unpaid child care provided by the population in Bullsbrook - Gnangara compared to the City of Swan shows that there was a similar proportion of persons who provided unpaid child care either to their own or to other children.
Overall, 32.2% of the population provided unpaid child care, compared with 32.1% for the City of Swan.
Community Profile City of Swan
Page 40
Community Profile City of Swan
Page 41

Bullsbrook - Gnangara What is our employment status? (Employment status)
● the age structure of the population, which for example influences the number of persons in the
workforce (i.e. population 15 years or more) or retired (i.e. population over 60 years);
● the economic base and employment opportunities available in the area; and
● the education and skill base of the population.
Derived from the Census question, ‘Last week did the person have a full time or part time job of any kind?’ and relates only to persons aged 15 years or more.
The Employment Status of the population is an important indicator of the socio-economic status of an area. It represents the share of the population that is employed full-time, part-time or unemployed, as well as changes over time in the labour force. Employment Status is linked to a number of factors:
Census Employment Status data should be analysed in conjunction with Income, Occupation and Education Qualifications data to identify the relative socio-economic status of an area.
Employment status(persons aged 15 years and over)
Bullsbrook - Gnangara
2006 2001
Enumerated datanumber %
City of Swan % number %
City of Swan %
Change 2001 to
2006
Employed full time 1,445 63.3 62.5 1,300 62.8 59.7 145
Employed part time 702 30.8 30.8 584 28.2 29.6 118
Employed not stated 74 3.2 3.1 49 2.4 2.8 25
Total employed 2,221 97.3 96.4 1,933 93.3 92.2 288
Total unemployed 61 2.7 3.6 138 6.7 7.8 -77
Total labour force 2,282 100.0 100.0 2,071 100.0 100.0 211 Total in labour force 2,282 67.3 64.6 2,071 65.0 63.9 211
Total not in labour force 925 27.3 29.1 968 30.4 32.7 -43
Not stated 185 5.5 6.4 146 4.6 3.4 39
Total 3,392 100.0 100.0 3,185 100.0 100.0 207
Source: Australian Bureau of Statistics, Census of Population and Housing, 2006, 2001, 1996, and 1991.
NOTE: Table totals may not equate with other similar tables due to randomisation of small numbers. Please refer to the specific data notes for more information.
The size of Bullsbrook - Gnangara's labour force in 2006 was 2,282 persons, of which 702 were employed part-time (30.8%) and 1,445 were full time workers (63.3%).
Analysis of the employment status of the population in Bullsbrook - Gnangara in 2006 compared to the City of Swan shows that there was a similar proportion in employment, and a similar proportion unemployed.
Overall, 97.3% of the labour force was employed (65.5% of the population aged 15+), and 2.7% unemployed (1.8% of the population aged 15+), compared with 96.4% and 3.6% respectively for the City of Swan.
Between 2001 and 2006, the number of people employed in Bullsbrook - Gnangara showed an increase of 288 persons and the number unemployed showed a decrease of 77 persons.
The labour force participation rate refers to the proportion of the population over 15 years of age that was employed or actively looking for work. "The labour force is a fundamental input to domestic production. Its size and composition are therefore crucial factors in economic growth. From the viewpoint of social development, earnings from paid work are a major influence on levels of economic well-being." (Australian Bureau of Statistics, Australian Social Trends 1995).
Analysis of the labour force participation rate of the population in Bullsbrook - Gnangara in 2006 shows that there was a larger proportion in the labour force (67.3%) compared with the City of Swan (64.6%).
Community Profile City of Swan
Page 42

Between 2001 and 2006 in Bullsbrook - Gnangara the number of people in the labour force showed an increase of 211 people, or 10.2%.
Community Profile City of Swan
Page 43

Bullsbrook - Gnangara What industries do we work in? (Industry)
2006 industry categories
● the economic base and employment opportunities available in the general region;
● the educational levels of the local population; and
● the working and social aspirations of the population.
Derived from the two Census questions, ‘[What] best describes the business of [your] employer?’ and ‘What are the main goods produced or main services provided by [your] employer’s business?’ and relates only to persons aged 15 years or more.
The Industry data identifies the industries in which the residents of an area work (this may be within the residing area or elsewhere). The Industry Structure of the work force is indicative of the skill base and (to some extent) the socio-economic status and industry structure of an area.
The industries that are prominent in an area are strongly related to a range of factors including:
Industries are classified by grouping businesses which carry out similar productive activities. The 2006 Australian and New Zealand Standard Industrial Classification (ANZSIC) provides the current framework for industry classification in Australia. This classification provides a contemporary and internationally comparable industrial classification system which includes information about “new economy” industries such as Information, Media and Telecommunications. As this is a new classification only 2006 data is available.
Time series industry data (based on the 1993 ANZSIC classification) is available in the tab above named 'Time series industries'.
Industry, 2006 ANZSIC(employed persons) Bullsbrook - Gnangara
2006
Enumerated data number % City of Swan %
Agriculture, Forestry & Fishing 134 6.0 1.5
Mining 44 2.0 2.2
Manufacturing 286 12.8 12.8
Electricity, Gas, Water and Waste Services 30 1.3 0.8
Construction 269 12.1 9.1
Retail Trade 182 8.2 12.4
Wholesale Trade 96 4.3 5.3
Accommodation and Food Services 68 3.1 5.6
Transport, Postal and Warehousing 149 6.7 5.9
Information Media and Telecommunications 26 1.2 1.3
Financial and Insurance Services 47 2.1 2.8
Rental, Hiring and Real Estate Services 41 1.8 1.9
Professional, Scientific and Technical Services 74 3.3 4.7
Administrative and Support Services 64 2.9 3.2
Public Administration and Safety 245 11.0 6.5
Education and Training 142 6.4 5.8
Health Care and Social Assistance 132 5.9 9.5
Arts and Recreation Services 25 1.1 1.3
Other Services 99 4.4 4.5
Inadequately described or Not stated 76 3.4 2.9
Total 2,229 100.0 100.0
Source: Australian Bureau of Statistics, Census of Population and Housing 2006.
Community Profile City of Swan
Page 44

● Manufacturing (286 persons or 12.8%)
● Construction (269 persons or 12.1%)
● Public Administration and Safety (245 persons or 11.0%)
● A larger percentage persons employed in Agriculture, Forestry & Fishing (6.0% compared to 1.5%);
● A larger percentage persons employed in Public Administration and Safety (11.0% compared to 6.5%);
● A smaller percentage persons employed in Retail Trade (8.2% compared to 12.4%), and;
● A smaller percentage persons employed in Health Care and Social Assistance (5.9% compared to
9.5%).
NOTE: Table totals may not equate with other similar tables due to randomisation of small numbers. Please refer to the specific data notes for more information.
An analysis of the jobs held by the resident population in Bullsbrook - Gnangara in 2006 shows the three most popular industry sectors were:
In combination these three industries employed 800 people in total or 35.9% of the employed resident population.
In comparison, the City of Swan employed 12.8% in Manufacturing; 9.1% in Construction; and 6.5% in Public Administration and Safety.
The major differences between the jobs held by the population of Bullsbrook - Gnangara and the City of Swan were:
Community Profile City of Swan
Page 45

Bullsbrook - Gnangara What industries do we work in? (Industry)
Time series industry categories
● the economic base and employment opportunities available in the general region;
● the educational levels of the local population; and
● the working and social aspirations of the population.
Derived from the two Census questions, ‘[What] best describes the business of [your] employer?’ and ‘What are the main goods produced or main services provided by [your] employer’s business?’ and relates only to persons aged 15 years or more.
The Industry data identifies the industries in which the residents of an area work (this may be within the residing area or elsewhere). The Industry Structure of the work force is indicative of the skill base and (to some extent) the socio-economic status and industry structure of an area.
The industries that are prominent in an area are strongly related to a range of factors including:
The data below is based on the 1993 Australian and New Zealand Standard Industrial Classification (ANZSIC) to enable comparisons between 2006, 2001 and 1996 industries.
Industry, 1993 ANZSIC(employed persons)
Bullsbrook - Gnangara
2006 2001
Enumerated datanumber %
City of Swan % number %
City of Swan %
Change 2001 to
2006
Agriculture, Forestry & Fishing 134 6.0 1.5 176 9.0 2.0 -42
Mining 42 1.9 2.2 50 2.5 1.4 -8
Manufacturing 310 13.9 13.3 208 10.6 14.0 102
Electricity, Gas & Water Supply 15 0.7 0.6 3 0.2 0.6 12
Construction 266 12.0 9.1 194 9.9 7.6 72
Wholesale Trade 110 4.9 6.1 130 6.6 6.7 -20
Retail Trade 234 10.5 15.9 238 12.1 16.7 -4
Transport & Storage 152 6.8 5.2 126 6.4 5.2 26
Communication Services 27 1.2 1.6 36 1.8 2.1 -9
Finance & Insurance 44 2.0 2.8 40 2.0 3.1 4
Property & Business Services 162 7.3 9.4 146 7.4 9.7 16
Government Administration & Defence
218 9.8 4.7 189 9.6 4.0 29
Education 125 5.6 5.6 82 4.2 5.1 43
Health & Community Services 149 6.7 9.7 129 6.6 8.9 20
Cultural & Recreational Services 34 1.5 1.7 51 2.6 2.2 -17
Personal & Other Services 82 3.7 4.1 68 3.5 4.2 14
Accommodation, Cafes & Restaurants
56 2.5 3.8 63 3.2 4.2 -7
Non-classifiable economic units 34 1.5 1.5 12 0.6 0.8 22
Not stated 29 1.3 1.4 24 1.2 1.7 5
Total 2,223 100.0 100.0 1,965 100.0 100.0 258
Source: Australian Bureau of Statistics, Census of Population and Housing, 2006, 2001, and 1996.
NOTE: Table totals may not equate with other similar tables due to randomisation of small numbers. Please refer to the specific data notes for more information.
An analysis of the jobs held by the resident population in Bullsbrook - Gnangara in 2006 shows the three
Community Profile City of Swan
Page 46

● Manufacturing (310 persons or 13.9%)
● Construction (266 persons or 12.0%)
● Retail Trade (234 persons or 10.5%)
● A larger percentage persons employed in Government Administration & Defence (9.8% compared to
4.7%);
● A larger percentage persons employed in Agriculture, Forestry & Fishing (6.0% compared to 1.5%);
● A smaller percentage persons employed in Retail Trade (10.5% compared to 15.9%), and;
● A smaller percentage persons employed in Health & Community Services (6.7% compared to 9.7%).
● Manufacturing (+102 persons), and;
● Construction (+72 persons).
most popular industry sectors were:
In combination these three industries employed 810 people in total or 36.4% of the employed resident population.
In comparison, the City of Swan employed 13.3% in Manufacturing; 9.1% in Construction; and 15.9% in Retail Trade.
The major differences between the jobs held by the population of Bullsbrook - Gnangara and the City of Swan were:
The largest changes in the jobs held by the resident population in Bullsbrook - Gnangara between 2001 and 2006 were for those employed in:
Community Profile City of Swan
Page 47

Community Profile City of Swan
Page 48

Bullsbrook - Gnangara What are our occupations? (Occupation)
Time series occupation categories
● the economic base and employment opportunities available in the area;
● the educational qualification levels of the population; and
● the working and social aspirations of the population.
● Tradespersons and Related Workers (417 persons or 18.8%)
● Intermediate Clerical, Sales and Service Workers (307 persons or 13.8%)
● Intermediate Production and Transport Workers (273 persons or 12.3%)
Derived from the two Census questions, ‘In the main job held last week, what was the person's occupation?’ and ‘What are the main tasks that the person himself/herself usually performs in that occupation?’ and relates only to persons aged 15 years or more.
The Occupation data identifies the occupations in which the residents of an area work (this may be within the residing area or elsewhere). The occupational structure of the work force is an important indicator of the characteristics of the labour force. With other indicators, such as Educational Qualifications and Income, Occupation is a key component of evaluating the socio-economic status and skill base of an area. The occupations held by a workforce are linked to a range of factors including:
The data below is based on the 1997 Australian Standard Classification of Occupations, Second Edition (ASCO) to enable comparisons between 2006, 2001 and 1996 occupations.
Occupation, 1997 ASCO(employed persons)
Bullsbrook - Gnangara
2006 2001
Enumerated datanumber %
City of Swan % number %
City of Swan %
Change 2001 to
2006
Managers and Administrators 217 9.8 6.1 186 9.3 6.1 31
Professionals 266 12.0 12.2 243 12.1 11.4 23
Associate Professionals 225 10.1 11.9 210 10.5 11.7 15
Tradespersons and Related Workers 417 18.8 15.0 357 17.8 15.0 60
Advanced Clerical and Service Workers
75 3.4 3.1 96 4.8 3.7 -21
Intermediate Clerical, Sales and Service Workers
307 13.8 18.7 252 12.6 18.6 55
Intermediate Production and Transport Workers
273 12.3 11.1 229 11.4 10.7 44
Elementary Clerical, Sales and Service Workers
166 7.5 10.4 161 8.0 10.9 5
Labourers and Related Workers 244 11.0 9.7 215 10.7 9.9 29
Inadequately described 13 0.6 0.8 42 2.1 0.8 -29
Not Stated 18 0.8 0.9 15 0.7 1.1 3
Total 2,221 100.0 100.0 2,006 100.0 100.0 215
Source: Australian Bureau of Statistics, Census of Population and Housing, 2006, 2001, and 1996.
NOTE: Table totals may not equate with other similar tables due to randomisation of small numbers. Please refer to the specific data notes for more information.
An analysis of the occupations held by the resident population in Bullsbrook - Gnangara in 2006 shows the three most popular occupations were:
In combination these three occupations accounted for 997 people in total or 44.9% of the employed resident
Community Profile City of Swan
Page 49

● A larger percentage persons employed as Tradespersons and Related Workers (18.8% compared to
15.0%);
● A larger percentage persons employed as Managers and Administrators (9.8% compared to 6.1%);
● A smaller percentage persons employed as Intermediate Clerical, Sales and Service Workers (13.8%
compared to 18.7%), and;
● A smaller percentage persons employed as Elementary Clerical, Sales and Service Workers (7.5%
compared to 10.4%).
● Tradespersons and Related Workers (+60 persons), and;
● Intermediate Clerical, Sales and Service Workers (+55 persons).
population.
In comparison, the City of Swan employed 15.0% as Tradespersons and Related Workers; 18.7% as Intermediate Clerical, Sales and Service Workers; and 11.1% as Intermediate Production and Transport Workers.
The major differences between the occupations of the population of Bullsbrook - Gnangara and the City of Swan were
The largest changes in the occupations held by the resident population in Bullsbrook - Gnangara between 2001 and 2006 were:
Community Profile City of Swan
Page 50

Community Profile City of Swan
Page 51

Bullsbrook - Gnangara What are our occupations? (Occupation)
2006 occupation categories
● the economic base and employment opportunities available in the area;
● the educational qualification levels of the population; and
● the working and social aspirations of the population.
● Technicians and Trades Workers (457 persons or 20.5%)
● Clerical and Administrative Workers (322 persons or 14.4%)
● Labourers (305 persons or 13.7%)
Derived from the two Census questions, ‘In the main job held last week, what was the person's occupation?’ and ‘What are the main tasks that the person himself/herself usually performs in that occupation?’ and relates only to persons aged 15 years or more.
The Occupation data identifies the occupations in which the residents of an area work (this may be within the residing area or elsewhere). The occupational structure of the work force is an important indicator of the characteristics of the labour force. With other indicators, such as Educational Qualifications and Income, Occupation is a key component of evaluating the socio-economic status and skill base of an area. The occupations held by a workforce are linked to a range of factors including:
Occupations are classified using a combination of skill level and skill specialisation to form meaningful groups. The 2006 Australian and New Zealand Standard Classification of Occupations (ANZSCO) provides the current framework for occupation classification in Australia. This classification provides a contemporary occupation classification system. As this is a new classification only 2006 data is available.
Time series occupation data (based on the ASCO Second Edition classification) is available in the tab above named 'Time series occupations'.
Occupation, 2006 ANZSCO(employed persons) Bullsbrook - Gnangara
2006
Enumerated data number % City of Swan %
Managers 304 13.6 10.1
Professionals 257 11.5 12.6
Technicians and Trades Workers 457 20.5 17.7
Community and Personal Service Workers 174 7.8 9.7
Clerical and Administrative Workers 322 14.4 16.4
Sales Workers 162 7.3 10.4
Machinery Operators And Drivers 229 10.3 9.1
Labourers 305 13.7 12.2
Inadequately described or Not stated 19 0.9 1.7
Total 2,229 100.0 100.0
Source: Australian Bureau of Statistics, Census of Population and Housing 2006.
NOTE: Table totals may not equate with other similar tables due to randomisation of small numbers. Please refer to the specific data notes for more information.
An analysis of the occupations held by the resident population in Bullsbrook - Gnangara in 2006 shows the three most popular occupations were:
In combination these three occupations accounted for 1,084 people in total or 48.6% of the employed resident population.
In comparison, the City of Swan employed 17.7% as Technicians and Trades Workers; 16.4% as Clerical and Administrative Workers; and 12.2% as Labourers.
Community Profile City of Swan
Page 52

● A larger percentage persons employed as Managers (13.6% compared to 10.1%);
● A larger percentage persons employed as Technicians and Trades Workers (20.5% compared to
17.7%);
● A smaller percentage persons employed as Sales Workers (7.3% compared to 10.4%), and;
● A smaller percentage persons employed as Clerical and Administrative Workers (14.4% compared to
16.4%).
The major differences between the occupations of the population of Bullsbrook - Gnangara and the City of Swan were
Community Profile City of Swan
Page 53
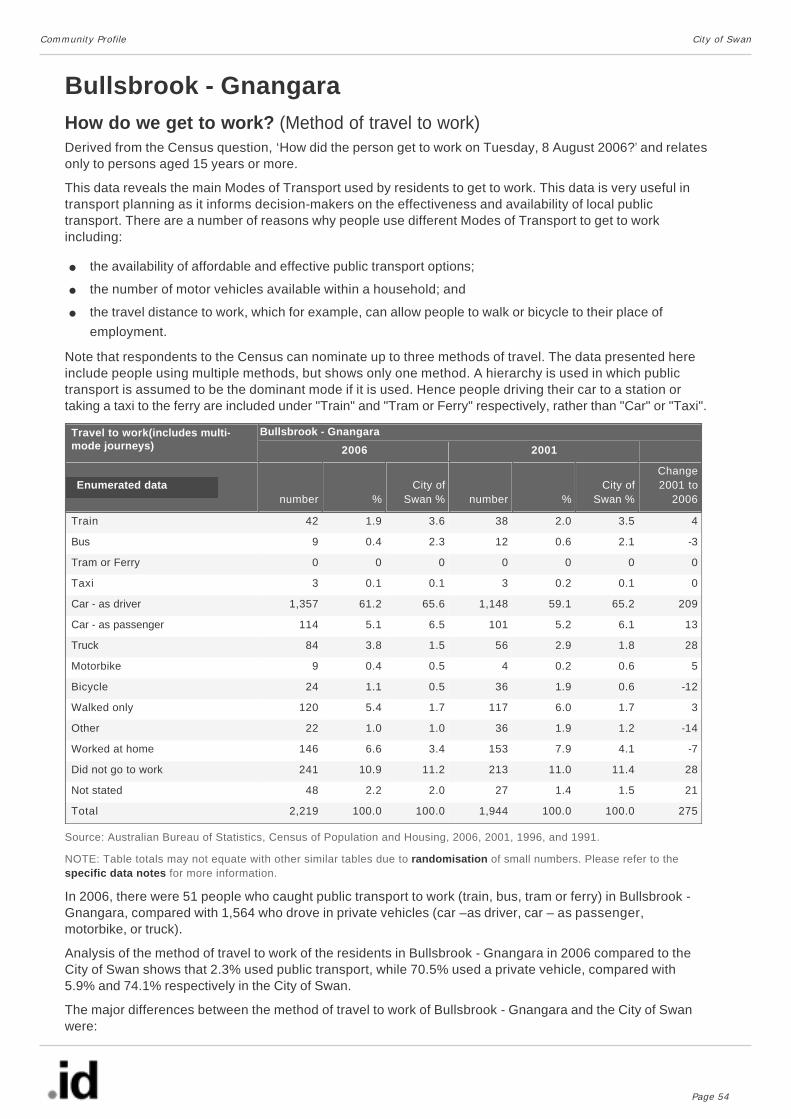
Bullsbrook - Gnangara How do we get to work? (Method of travel to work)
● the availability of affordable and effective public transport options;
● the number of motor vehicles available within a household; and
● the travel distance to work, which for example, can allow people to walk or bicycle to their place of
employment.
Derived from the Census question, ‘How did the person get to work on Tuesday, 8 August 2006?’ and relates only to persons aged 15 years or more.
This data reveals the main Modes of Transport used by residents to get to work. This data is very useful in transport planning as it informs decision-makers on the effectiveness and availability of local public transport. There are a number of reasons why people use different Modes of Transport to get to work including:
Note that respondents to the Census can nominate up to three methods of travel. The data presented here include people using multiple methods, but shows only one method. A hierarchy is used in which public transport is assumed to be the dominant mode if it is used. Hence people driving their car to a station or taking a taxi to the ferry are included under "Train" and "Tram or Ferry" respectively, rather than "Car" or "Taxi".
Travel to work(includes multi-mode journeys)
Bullsbrook - Gnangara
2006 2001
Enumerated datanumber %
City of Swan % number %
City of Swan %
Change 2001 to
2006
Train 42 1.9 3.6 38 2.0 3.5 4
Bus 9 0.4 2.3 12 0.6 2.1 -3
Tram or Ferry 0 0 0 0 0 0 0
Taxi 3 0.1 0.1 3 0.2 0.1 0
Car - as driver 1,357 61.2 65.6 1,148 59.1 65.2 209
Car - as passenger 114 5.1 6.5 101 5.2 6.1 13
Truck 84 3.8 1.5 56 2.9 1.8 28
Motorbike 9 0.4 0.5 4 0.2 0.6 5
Bicycle 24 1.1 0.5 36 1.9 0.6 -12
Walked only 120 5.4 1.7 117 6.0 1.7 3
Other 22 1.0 1.0 36 1.9 1.2 -14
Worked at home 146 6.6 3.4 153 7.9 4.1 -7
Did not go to work 241 10.9 11.2 213 11.0 11.4 28
Not stated 48 2.2 2.0 27 1.4 1.5 21
Total 2,219 100.0 100.0 1,944 100.0 100.0 275
Source: Australian Bureau of Statistics, Census of Population and Housing, 2006, 2001, 1996, and 1991.
NOTE: Table totals may not equate with other similar tables due to randomisation of small numbers. Please refer to the specific data notes for more information.
In 2006, there were 51 people who caught public transport to work (train, bus, tram or ferry) in Bullsbrook - Gnangara, compared with 1,564 who drove in private vehicles (car –as driver, car – as passenger, motorbike, or truck).
Analysis of the method of travel to work of the residents in Bullsbrook - Gnangara in 2006 compared to the City of Swan shows that 2.3% used public transport, while 70.5% used a private vehicle, compared with 5.9% and 74.1% respectively in the City of Swan.
The major differences between the method of travel to work of Bullsbrook - Gnangara and the City of Swan were:
Community Profile City of Swan
Page 54

● A larger percentage of people who walked only (5.4% compared to 1.7%);
● A larger percentage of people who worked at home (6.6% compared to 3.4%), and;
● A smaller percentage of car - as driver commuters (61.2% compared to 65.6%).
● Car - as driver (+209 persons).
The largest change in the method of travel to work by resident population in Bullsbrook - Gnangara between 2001 and 2006 were for those nominated:
Community Profile City of Swan
Page 55

Bullsbrook - Gnangara What type of households do we live in? (Household and family types)
● Couples without child(ren) (+62), and;
● Couples with child(ren) 15 years and under (+50).
Derived from the Census question, ‘What is the person’s relationship [to each other person in the household]?’
The Household and Family structure of the population is an indicator of an area’s residential role and function (relating to the types of housing markets attracted to the area). It is usually indicative of the area’s era of settlement and provides key insights into the level of demand for services and facilities (as most services and facilities are age- and household type-specific).
To get a more complete picture of the demographic characteristics of an area, the Household and Family Type data should be viewed in conjunction with Age Structure data.
Household types(households) Bullsbrook - Gnangara
2006 2001
Enumerated datanumber %
City of Swan % number %
City of Swan %
Change 2001 to
2006
Couples with child(ren) 15 years and under
442 34.2 36.8 392 33.5 38.9 50
Couples with child(ren) over 15 years
175 13.5 13.2 158 13.5 12.9 17
Total couples with child(ren) 617 47.7 50.0 550 47.0 51.8 67
One parent families with child(ren) 15 years and under
117 9.0 10.0 113 9.7 10.9 4
One parent families with child(ren) over 15 years
55 4.3 6.7 56 4.8 6.0 -1
Total one parent families 172 13.3 16.6 169 14.4 16.9 3
Couples without child(ren) 505 39.0 32.0 443 37.9 30.0 62
Other families 0 0 1.4 8 0.7 1.4 -8
Total families 1,294 100.0 100.0 1,170 100.0 100.0 124 One family households 1,246 79.4 73.3 1,118 77.5 75.7 128
Two or more family households 26 1.7 1.4 19 1.3 1.1 7
Total family households 1,272 81.0 74.7 1,137 78.8 76.9 135
Lone person households 202 12.9 18.4 208 14.4 18.0 -6
Group households 30 1.9 2.2 33 2.3 2.3 -3
Other not classifiable households 66 4.2 4.6 64 4.4 2.9 2
Total households 1,570 100.0 100.0 1,442 100.0 100.0 128
Source: Australian Bureau of Statistics, Census of Population and Housing, 2006, 2001, 1996, and 1991.
NOTE: Table totals may not equate with other similar tables due to randomisation of small numbers. Please refer to the specific data notes for more information.
Analysis of the family types in Bullsbrook - Gnangara in 2006 compared to the City of Swan shows that there was a smaller proportion of couple families with child(ren) as well as a smaller proportion of one-parent families.
Overall, 47.7% of total families were couple families with child(ren), and 13.3% were one-parent families, compared with 50.0% and 16.6% respectively for the City of Swan.
The largest changes in family types in Bullsbrook - Gnangara between 2001 and 2006 were:
Comparing Household types between Bullsbrook - Gnangara and the City of Swan in 2006 reveals a larger
Community Profile City of Swan
Page 56

proportion of Family households, but a smaller proportion of lone person households. Family households accounted for 81.0% of total households in Bullsbrook - Gnangara while lone person households comprised 12.9%, (74.7% and 18.4% respectively for the City of Swan).
Between 2001 and 2006 in Bullsbrook - Gnangara, there was an increase in the number of Family households (135), a decrease in lone person households (-6) and a decrease in group households (-3).
Community Profile City of Swan
Page 57

Community Profile City of Swan
Page 58

Bullsbrook - Gnangara How many people live in each household? (Number of persons usually resident)
● A larger percentage of 2 person households (37.0% compared to 31.6%), and;
● A smaller percentage of 1 Person households (13.4% compared to 19.3%).
● 3 person households (+58).
Derived from the three Census questions, ‘Name of each person including visitors who spent the night of Tuesday, 8 August 2006 in this dwelling’, and ‘Where does the person usually live?’, and ‘Are there any persons who usually live in this dwelling who were absent on Census Night (Tuesday, 8 August 2006)?’
The size of households in general follows the life-cycle of families. Households are usually small at the stage of relationship formation (early marriage), and then increase in size with the advent of children. They later reduce in size again as these children reach adulthood and leave home. However, household size can also be influenced by a lack, (or abundance) of affordable housing. Further, overseas migrants and indigenous persons often have a tradition of living with extended family members and/or other families.
Household size(number of persons usually resident)
Bullsbrook - Gnangara
2006 2001
Enumerated datanumber %
City of Swan % number %
City of Swan %
Change 2001 to
2006
1 Person 203 13.4 19.3 208 15.1 18.5 -5
2 Persons 559 37.0 31.6 511 37.0 30.3 48
3 Persons 289 19.1 17.4 231 16.7 17.9 58
4 Persons 272 18.0 19.2 243 17.6 20.0 29
5 Persons 129 8.5 8.6 124 9.0 9.1 5
6 or more Persons 58 3.8 3.8 63 4.6 4.2 -5
Total 1,510 100.0 100.0 1,380 100.0 100.0 130
Source: Australian Bureau of Statistics, Census of Population and Housing, 2006, 2001, 1996, and 1991.
NOTE: Table totals may not equate with other similar tables due to randomisation of small numbers. Please refer to the specific data notes for more information.
Analysis of the number of persons usually resident in a household in the Bullsbrook - Gnangara compared with the City of Swan shows that there were a smaller proportion of lone person households, and a similar proportion of larger households (those with 4 persons or more). Overall there were 13.4% of lone person households, and 30.3% of larger households, compared with 19.3% and 31.6% respectively for the City of Swan.
The major differences in the household size for Bullsbrook - Gnangara and the City of Swan were:
The largest change in the number of persons usually resident in a household in Bullsbrook - Gnangara between 2001 and 2006 was:
Community Profile City of Swan
Page 59

Community Profile City of Swan
Page 60

Bullsbrook - Gnangara Are we owners, renters or buyers? (Housing tenure)
● Being purchased (+187 households), and;
● Owned (-59 households).
Derived from the Census questions, ‘Is this dwelling [owned outright, owned with a mortgage etc]’, and ‘If this dwelling is being rented, who is it rented from?’
Tenure data, to some extent, provide insights into the socio-economic status of an area as well as the role that the area plays in the housing market. For example, a high concentration of private renters may indicate an area attractive to specific housing markets such as young singles and couples, while a concentration of home owners indicates a more settled area (i.e. less transitory), with mature families and empty-nester household types. Tenure can also reflect built form, with a significantly higher share of renters in high density housing and a substantially larger proportion of home-owners in separate houses, although this is not a mutually exclusive pattern.
In conjunction with other socio-economic status information tenure data is useful for analysing a wide range of issues, including housing market analysis (in conjunction with Household and Family Type data) and for identifying public housing areas.
Housing tenure(households) Bullsbrook - Gnangara
2006 2001
Enumerated datanumber %
City of Swan % number %
City of Swan %
Change 2001 to
2006
Owned 426 26.9 24.0 485 33.4 29.0 -59
Being purchased 775 48.9 48.1 588 40.6 46.2 187
Renting - Govt 14 0.9 4.2 0 0 5.3 14
Renting - Other 243 15.3 15.7 251 17.3 13.7 -8
Renting - Not stated 11 0.7 0.6 0 0 0.2 11
Renting - Total 268 16.9 20.5 251 17.3 19.1 17
Other tenure type 9 0.6 0.4 46 3.2 2.0 -37
Not stated 106 6.7 7.0 80 5.5 3.6 26
Total 1,584 100.0 100.0 1,450 100.0 100.0 134
Source: Australian Bureau of Statistics, Census of Population and Housing, 2006, 2001, 1996, and 1991.
NOTE: Table totals may not equate with other similar tables due to randomisation of small numbers. Please refer to the specific data notes for more information.
Care should be taken when analysing change over time for 'Owned' and 'Being purchased' categories as changes to the wording of the responses in the Census questionaire between 2001 and 2006 may have resulted in skewed data. Please see the specific data notes for more detail.
Analysis of the housing tenure of the population of Bullsbrook - Gnangara in 2006 compared to the City of Swan shows that there was a larger proportion of households who owned their dwelling; a similar proportion purchasing their dwelling; and a smaller proportion who were renters.
Overall, 26.9% of the population owned their dwelling; 48.9% were purchasing, and 16.9% were renting, compared with 24.0%, 48.1% and 20.5% respectively for the City of Swan.
The largest changes in housing tenure categories for the households in Bullsbrook - Gnangara between 2001 and 2006 were:
Community Profile City of Swan
Page 61
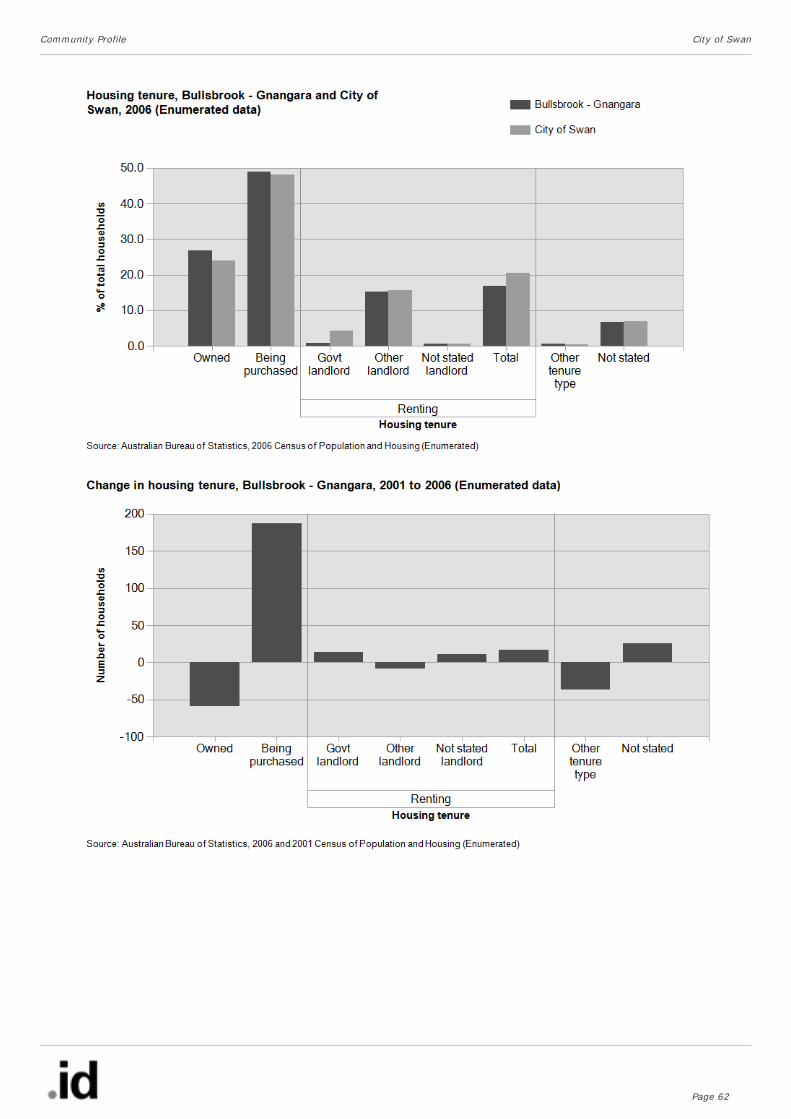
Community Profile City of Swan
Page 62

Bullsbrook - Gnangara How much do we pay on our housing loan? (Monthly housing loan repayments)
Monthly housing loan repayments 2006Derived from the Census questions, ‘How much does your household pay for this dwelling?’ and ‘Is this dwelling [owned outright, owned with a mortgage etc]’
This data is indicative of the residential role and function of an area and is directly related to the value of residential property in an area. When viewed with household income data it may also be indicative of the level of ‘housing stress’ households in the community are under. In ‘mortgage belt’ areas it is expected that households will be paying a higher proportion of their income on their housing compared to well-established areas.
To enable a comparison of Monthly housing loan repayments in an area over time, Housing loan quartiles have been calculated and presented in the 'Housing loan quartiles tab'.
Monthly housing loan repayments(households) Bullsbrook - Gnangara
2006
Enumerated data number % City of Swan %
$1 to $249 16 2.1 1.9
$250 to $399 18 2.3 2.1
$400 to $549 37 4.8 5.0
$550 to $749 57 7.4 7.9
$750 to $949 80 10.4 12.0
$950 to $1,199 113 14.7 16.5
$1,200 to $1,399 84 10.9 12.8
$1,400 to $1,599 60 7.8 9.3
$1,600 to $1,999 107 13.9 13.1
$2,000 to $2,999 94 12.2 9.7
$3,000 and over 38 4.9 2.9
Not stated 67 8.7 6.8
Total 771 100.0 100.0
Source: Australian Bureau of Statistics, Census of Population and Housing, 2006, 2001, 1996, and 1991.
NOTE: Table totals may not equate with other similar tables due to randomisation of small numbers. Please refer to the specific data notes for more information.
Analysis of the monthly housing loan repayments of households in Bullsbrook - Gnangara compared to the City of Swan shows that there was a larger proportion of households paying high mortgage repayments ($2,000 per month or more) but a smaller proportion of households with low mortgage repayments (less than $950 per month).
Overall, 17.1% of households were paying high mortgage repayments, and 27.0% were paying low repayments, compared with 12.6% and 28.9% respectively in the City of Swan.
Community Profile City of Swan
Page 63

Community Profile City of Swan
Page 64

Bullsbrook - Gnangara How much do we pay on our housing loan? (Monthly housing loan repayments)
Housing loan quartilesHousing loan payments are not comparable over time because of the influences of economic change such as inflation. The loan payment quartile method has been adopted as the most objective method of comparing change in the cost of housing of a community over time. The loan payment quartile method assumes an even distribution within each payment group. Quartiles are calculated from Perth Statistcal Division housing loan payment data.
Housing loan quartile definitions(Annual payment ranges)
2006 2001 1996
Lowest group Nil to $10,412 Nil to $7,523 Nil to $6,390
Medium lowest $10,413 to$15,412 $7,524 to$10,518 $6,391 to$9,308
Medium highest $15,413 to$22,124 $10,519 to$14,182 $9,309 to$12,549
Highest group $22,125 and over $14,183 and over $12,550 and over
Housing loan repayment quartiles Bullsbrook - Gnangara
2006 2001
Enumerated datanumber %
City of Swan % number %
City of Swan %
Change 2001 to
2006
Lowest group 175 24.9 25.7 153 28.3 24.8 22
Medium lowest 181 25.8 28.8 138 25.6 29.4 43
Medium highest 174 24.7 26.5 126 23.3 28.2 48
Highest group 174 24.7 19.0 123 22.8 17.6 51
Total 704 100.0 100.0 539 100.0 100.0 165
Source: Australian Bureau of Statistics, Census of Population and Housing, 2006, 2001, and 1996.
NOTE: Table totals may not equate with other similar tables due to randomisation of small numbers. Please refer to the specific data notes for more information.
Housing loan repayment quartiles allow us to compare relative repayment liabilities across time. Analysis of the distribution of households by housing loan repayment quartiles in Bullsbrook - Gnangara compared to the City of Swan shows that there was a larger proportion of households in the highest repayment quartile, but a similar proportion in the lowest repayment quartile.
The most significant change in Bullsbrook - Gnangara between 2001 and 2006 was in the Highest group quartile which showed an increase of 51 households.
Community Profile City of Swan
Page 65

Community Profile City of Swan
Page 66

Bullsbrook - Gnangara How much do we pay on our housing rental? (Weekly housing rental)
Weekly housing rental payments 2006Derived from the Census questions, ‘How much does your household pay for this dwelling?’ and ‘Is this dwelling [owned outright, owned with a mortgage etc]’
This data is indicative of the residential role and function of an area and is directly related to the value of residential property of an area. When viewed with household income data it may also be indicative of the level of ‘housing stress’ households in the community are under.
To enable a comparison of Weekly housing rental repayments in an area over time, Housing rental quartiles have been calculated and presented in the 'Housing rental quartiles tab'.
Weekly housing rental(households) Bullsbrook - Gnangara
2006
Enumerated data number % City of Swan %
$0 to $49 23 8.9 4.7
$50 to $99 16 6.2 12.8
$100 to $139 31 12.0 11.6
$140 to $179 68 26.3 21.6
$180 to $224 72 27.8 25.7
$225 to $274 21 8.1 13.9
$275 to $349 10 3.9 4.4
$350 to $449 3 1.2 0.8
$450 to $549 3 1.2 0.2
$550 and over 3 1.2 0.9
not stated 9 3.5 3.6
Total 259 100.0 100.0
Source: Australian Bureau of Statistics, Census of Population and Housing, 2006, 2001, 1996, and 1991.
NOTE: Table totals may not equate with other similar tables due to randomisation of small numbers. Please refer to the specific data notes for more information.
Analysis of the weekly housing rental payments of households in Bullsbrook - Gnangara compared to the City of Swan shows that there was a similar proportion of households paying high rental payments ($450 per week or more) but a smaller proportion of households with low rental payments (less than $140 per week).
Overall, 2.4% of households were paying high rental payments, and 27.1% were paying low payments, compared with 1.1% and 29.1% respectively in the City of Swan.
Community Profile City of Swan
Page 67

Community Profile City of Swan
Page 68

Bullsbrook - Gnangara How much do we pay on our housing rental? (Weekly housing rental)
Housing rental quartilesRental payments are not comparable over time because of the influences of economic change such as inflation. The rental payment quartile method has been adopted as the most objective method of comparing change in the cost of rental housing of a community over time. The rental payment quartile method assumes an even distribution within each payment group. Quartiles are calculated from Perth Statistcal Division rental payment data.
Housing rental quartile definitions(Annual payment ranges)
2006 2001
Lowest group Nil to $6,973 Nil to $5,456
Medium lowest $6,974 to$9,611 $5,457 to$7,110
Medium highest $9,612 to$12,381 $7,111 to$9,591
Highest group $12,382 and over $9,592 and over
Housing retal payment quartiles Bullsbrook - Gnangara
2006 2001
Enumerated datanumber %
City of Swan % number %
City of Swan %
Change 2001 to
2006
Lowest group 65 26.2 28.3 62 25.2 31.3 3
Medium lowest 80 32.1 27.1 90 36.4 28.8 -9
Medium highest 70 27.9 27.5 59 24.0 25.2 11
Highest group 34 13.8 17.2 35 14.4 14.8 -1
Total 250 100.0 100.0 246 100.0 100.0 4
Source: Australian Bureau of Statistics, Census of Population and Housing, 2006, and 2001.
NOTE: Table totals may not equate with other similar tables due to randomisation of small numbers. Please refer to the specific data notes for more information.
Rental payment quartiles allow us to compare relative rental liabilities across time. Analysis of the distribution of households by rental payment quartiles in Bullsbrook - Gnangara compared to the City of Swan shows that there was a smaller proportion of households in the highest payment quartile, as well as a smaller proportion in the lowest payment quartile.
The most significant change in Bullsbrook - Gnangara between 2001 and 2006 was in the Medium highest quartile which showed an increase of 11 households.
Community Profile City of Swan
Page 69
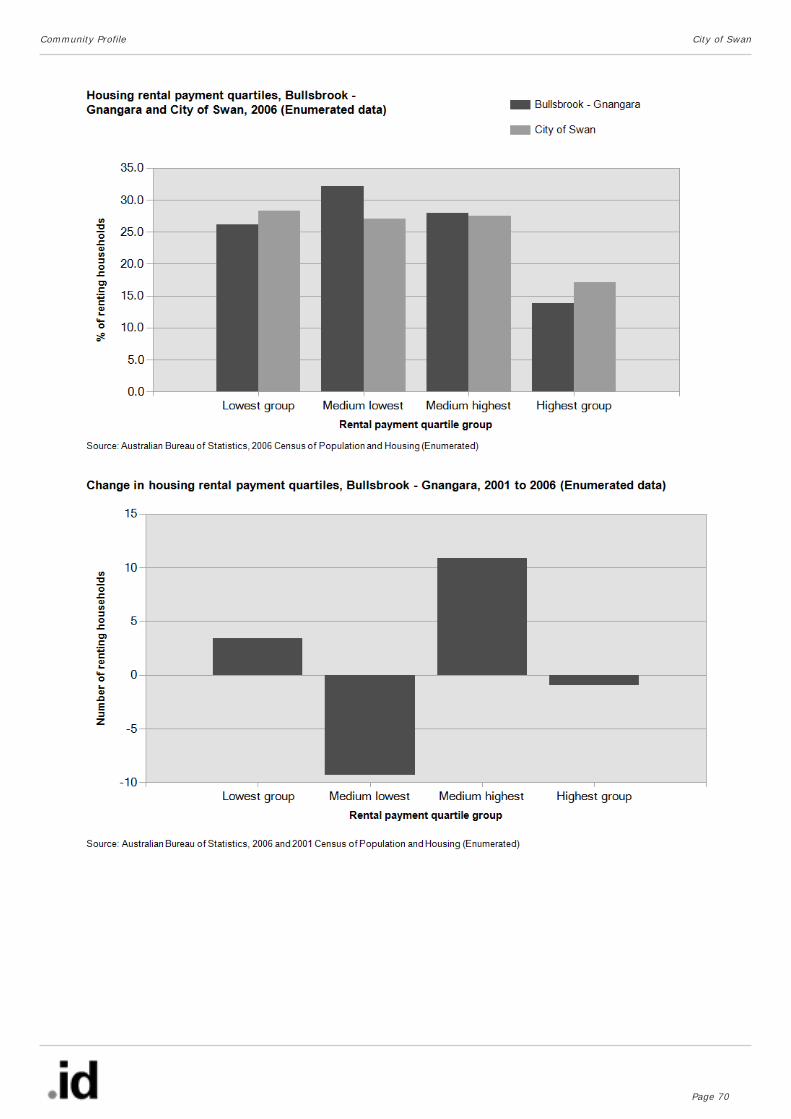
Community Profile City of Swan
Page 70

Bullsbrook - Gnangara What type of internet connection do we have? (Household internet connection)Derived from the Census question, ‘Can the Internet be accessed at this dwelling?’ This question was asked for the first time in the 2006 census, replacing the questions in the 2001 census relating to internet use and computer use. See specific data notes for more detail.
It is widely accepted that broadband internet access is an essential requirement to participate in the so-called ‘new economy’ and households with only dial-up or no internet service are increasingly being left behind in the information age. Increasingly fast internet access is required for accessing essential information and undertaking domestic and non-domestic business as both government and the private sector are increasingly conducting their business, or aspects of it, on-line.
Type of internet connection(Household internet connection)
Bullsbrook - Gnangara
2006
Enumerated data number % City of Swan %
Broadband connection 301 19.0 38.8
Dial-up connection 677 42.8 21.5
Other connection 12 0.8 0.6
Total internet connections 990 62.5 60.9
No internet connection 483 30.5 31.6
Internet connection not stated 110 6.9 7.5
Total households 1,583 100.0 100.0
Source: Australian Bureau of Statistics, Census of Population and Housing, 2006, 2001, 1996, and 1991.
NOTE: Table totals may not equate with other similar tables due to randomisation of small numbers. Please refer to the specific data notes for more information.
Analysis of the type of internet connection of households in Bullsbrook - Gnangara compared to the City of Swan shows that there was a larger proportion of households with either no internet connection or a dial up connection, but a smaller proportion of households with broadband connectivity.
Overall 73.3% of households had no internet connection or a dial up connection, and 19.0% had broadband connectivity, compared with 53.1% and 38.8% respectively in the City of Swan.
Community Profile City of Swan
Page 71

Community Profile City of Swan
Page 72

Bullsbrook - Gnangara How many cars do we own? (Car ownership)
● the age structure of the population and household type, which influences the size of the household and
the number of adults present;
● access to public transport; and
● household income, which can influence the amount of money available to purchase motor vehicles.
● A larger percentage of households with 3 or more vehicles (29.5% compared to 19.3%), and;
● A smaller percentage of households with 1 vehicle (21.3% compared to 29.1%).
● 3 vehicles or more (+107 households).
Derived from the Census question, ‘How many registered motor vehicles owned or used by residents of this dwelling were garaged or parked at or near this dwelling on the night of Tuesday, 8 August 2006?’
The ability of the population to source services and employment is strongly influenced by access to transport. The number of motor vehicles per household quantifies access to private transport. There are three major reasons for a different share of motor vehicles per household:
Car ownership(vehicles per household)
Bullsbrook - Gnangara
2006 2001
Enumerated datanumber %
City of Swan % number %
City of Swan %
Change 2001 to
2006
No vehicles 29 1.8 4.8 52 3.6 5.7 -23
1 vehicle 336 21.3 29.1 362 25.1 33.8 -26
2 vehicles 632 40.1 39.0 583 40.4 39.0 49
3 vehicles or more 465 29.5 19.3 358 24.8 16.7 107
Not stated 114 7.2 7.8 87 6.0 4.8 27
Total 1,576 100.0 100.0 1,442 100.0 100.0 134
Source: Australian Bureau of Statistics, Census of Population and Housing, 2006, 2001, 1996, and 1991.
NOTE: Table totals may not equate with other similar tables due to randomisation of small numbers. Please refer to the specific data notes for more information.
Analysis of the car ownership of the households in Bullsbrook - Gnangara in 2006 compared to the City of Swan shows that 90.9% of the households owned at least one car, while 1.8% did not, compared with 87.4% and 4.8% respectively in the City of Swan.
Of those that owned at least one vehicle, there was a smaller proportion who owned just one car; a similar proportion who owned two cars; and a larger proportion who owned three cars or more.
Overall, 21.3% of the households owned one car; 40.1% owned two cars; and 29.5% owned three cars or more, compared with 29.1%; 39.0% and 19.3% respectively for the City of Swan.
The major differences between the car ownership of the households in Bullsbrook - Gnangara and the City of Swan were:
The largest change in the household car ownership in Bullsbrook - Gnangara between 2001 and 2006 was with those who owned:
Community Profile City of Swan
Page 73

Community Profile City of Swan
Page 74

Bullsbrook - Gnangara What type of dwellings do we live in? (Dwelling types)
● Separate house (+141 dwellings).
Dwelling Type is derived from an assessment by the Census Collector who observes and records the type of dwelling structure.
The types of dwellings that are common to areas are important determinants in the role and function that the area plays in the housing market. A greater concentration of higher density dwellings is likely to attract more young adults and smaller households; while larger, detached or separate dwellings are more likely to have families and prospective families living in them, although this is not a mutually exclusive pattern.
The residential built form often reflects market opportunities or planning policy, such as the building of denser forms of housing around public transport nodes or employment centres.
Dwelling structure(private dwellings)
Bullsbrook - Gnangara
2006 2001
Enumerated datanumber %
City of Swan % number %
City of Swan %
Change 2001 to
2006
Separate house 1,553 88.0 84.7 1,412 91.8 84.9 141
Medium density 12 0.7 8.1 3 0.2 7.3 9
High density 0 0 0.1 0 0 0.1 0
Caravans, cabin, houseboat 3 0.2 1.2 10 0.7 1.3 -7
Other 13 0.7 0.1 12 0.8 0.2 1
Not stated 0 0 0 3 0.2 0.4 -3
TOTAL occupied private dwellings 1,576 89.3 94.1 1,440 93.6 94.2 136
TOTAL unoccupied Dwellings 189 10.7 5.9 98 6.4 5.8 91
TOTAL Dwellings 1,765 100.0 100.0 1,538 100.0 100.0 227
Source: Australian Bureau of Statistics, Census of Population and Housing, 2006, 2001, 1996, and 1991.
(a) ‘Medium density’ includes all semi-detached, row, terrace, townhouses and villa units, plus flats and apartments in blocks of 1 or 2 storeys, and flats attached to houses.
(b) ‘High density’ includes flats and apartments in 3 storey and larger blocks.
NOTE: Table totals may not equate with other similar tables due to randomisation of small numbers. Please refer to the specific data notes for more information.
In 2006, there were 1,553 households who occupied a separate house in the area, while 12 occupied a medium density dwelling, and 0 occupied high density flats and apartments.
Analysis of the types of dwellings of the households in Bullsbrook - Gnangara in 2006 compared to the City of Swan shows that 88.0% occupied a separate house; 0.7% occupied a medium density dwelling; while 0.0% occupied high density dwellings, compared with 84.7%, 8.1%, and 0.1% respectively in the City of Swan.
The largest change in the type of dwellings occupied by households in Bullsbrook - Gnangara between 2001 and 2006 were for those occupying a:
Community Profile City of Swan
Page 75

Community Profile City of Swan
Page 76

Geography notes
● Altone
● Ballajura - Malaga
● Bullsbrook - Gnangara
● Ellenbrook - The Vines
● Guildford - Hazelmere
● Midland
● Swan Hills
● Swan Valley
● Swan View
● West Swan
● Eastern Rejuvenation Area
● Midland Redevelopment Area
● Northern Growth Corridor
Suburb/locality geography
Census data is available at a variety of different geographic levels, for example, State; Local Government; and Census Collector District (a unit of around 200 households). Rarely do these boundaries match actual 'communities', 'suburbs' or 'service catchments' needed for effective decision making.
The Community Profile combines data for the City of Swan along with customised suburbs/localities, aggregated from Census Collector Districts for the Census years: 2006, 2001, 1996, and 1991.
The City of Swan has 13 small areas:
The suburbs and localities in the Community Profile tables are aggregations of 2006 Census Collection Districts (CDs). Where CDs did not fit exactly into the suburb or locality boundaries, estimates were made of the number of dwellings to be included. These estimates use aerial photography, dwelling counts, planning schemes, and street directories to determine what percentage of a CD goes into each suburb. The resulting data provides the most accurate population information for suburbs and localities.
NOTE: The geography in the Community Profile tables may not match the Australian Bureau of Statistics (ABS) suburb boundaries for 2006, which are based on aggregation of whole CDs.
Community Profile City of Swan
Page 77

Data notesAll data in this Profile is sourced from the Australian Bureau of Statistics, copyright in ABS data vests in the Commonwealth of Australia.
Population figures
Enumerated Population
Usual Residence Population
Estimated Resident Population
The most comprehensive population count available in Australia is derived from the Census of Population and Housing, conducted by the Australian Bureau of Statistics every 5 years. It is an official count of all people and dwellings in Australia on Census night, and collects details of age, sex and other characteristics of the population. The last Census was conducted on 8 August 2006 and was the 15th national Census for Australia. The next Census will be conducted on 7 August 2011.
Census statistics are used as the basis for estimating the population at national, state and local government levels, for electoral purposes and the distribution of government funds. They are used by individuals and organisations in the public and private sectors for planning, administration, research and decision making.
Populations are estimated in various ways. It is important to understand how a population has been derived when you are using the data.
Census data in the Community Profile section of profile.id® includes enumerated and usual residence data. The estimated resident population can be found in the Additional Information section of this website.
The 'Enumerated Population' represents where people were counted on Census Night (8 August 2006), which may not be where they usually live. This population figure generally includes overseas visitors and visitors to the area from within Australia, but excludes Australians overseas.
This type of count provides a snapshot at a given point in time. The Census is timed to attempt to capture the typical situation, however, holiday resort areas, such as the Gold Coast and snow fields, may show a large enumeration count compared with the usual residence count.
Where enumerated population data is used in the profile, overseas visitors have been specifically excluded from the tables, but visitors from within Australia are included.
For detailed information about Enumerated population please refer to the ABS Fact Sheet – Population Measures.
This population is derived from the Census. It is the place where a person usually lives, rather than the place where they were counted on Census night. Each person completing the Census is required to state their address of usual residence and this information is used to derive the Usual Residence population.
Census counts compiled on this basis are less likely to be influenced by seasonal factors, such as holiday seasons and snow seasons, and provide information about the usual residents of an area.
In 2006 all Census data are provided for usual residence as well as enumerated population. Previously household information was released as enumerated only (please see the detailed note for household and family type). Additionally, data about usual residence were not published for any data sets prior to 2001. Consequently, a time series has been provided for non-household data comparing 2006 and 2001 data only.
For detailed information about usual residence and enumerated population please refer to the ABS Fact Sheet – Population Measures.
The Estimated Resident Population (ERP) is the official ABS estimate of the Australian population. The ERP is based on results of the Census and is compiled as at 30 June of each Census year. It is updated between Censuses - quarterly for state and national figures, and annually for local government areas. ERP provides a population figure between Censuses.
The ERP is based on the usual residence population and includes adjustments for Census undercount, Australian residents who were temporarily overseas on Census night, and backdates the population to 30
Community Profile City of Swan
Page 78

Randomisation
● Data tables released prior to the 2006 Census had small numbers (values of 1 or 2) randomly adjusted to
either 0 or 3 by the ABS. As tables are randomly adjusted independently of each other, totals differ slightly
across tables with the same population. The affect of randomisation is increased with the aggregation of
Census Collector Districts into suburbs.
● In relation to the 2006 data, a new method called “perturbation” has been introduced. All figures included
within any table may be randomly adjusted by a small amount. These adjustments result in small
introduced random errors. Although the information value of the table as a whole is not impaired, care
should be taken when interpreting very small numbers, since randomisation will affect the relative size of
small numbers far more than larger numbers. The effect of the randomisation methodology also ensures
that values of 1 and 2 do not appear in tables.
Overseas visitors
Table totals and rounding
Household and Family Composition
June. Each year’s updates take into account births, deaths and both internal and overseas migration.
ERPs can be found under the 'Additional Information' section of the menu in the Community Profile.
For detailed information about ERPs please refer to the ABS publication Demographic Estimates and Projections: Concepts, Sources and Methods, 1999.
The information presented in the tables in the Community Profile is based on detailed tables produced by the Australian Bureau of Statistics at the Local Government Area level, and at the Census Collection District (CD) level for suburbs and small areas.
Note: The raw CD level data are then recalculated to exactly reflect the selected boundaries as shown on the maps within the Community Profile.
The Australian Bureau of Statistics (ABS) will randomise information it provides to preserve confidentiality. All cells are slightly adjusted to prevent any identification of personal details. Methodologies for doing this have changed between 2001 and 2006.
No reliance should be placed on small cells as they are impacted by random adjustment, respondent and processing errors.
Table totals and subtotals will be internally consistent but discrepancies may be observed between tables cross-tabulating the same population by different variables. While randomisation compromises the table totals by making them appear inconsistent, this is the best available socio-demographic data at the suburb level. This level of compromise is not statistically significant and should not impact on decision makers making effective resource allocation and planning decisions.
Enumerated data from the 2001 and 2006 Censuses are published by the ABS with "Overseas visitors" appearing as a separate category in many tables. To improve usability of the information the category "Overseas visitors" has been removed from all tables and calculations.
Table totals may not equate with other similar tables due to randomisation of small numbers and percentages may not total to 100 due to rounding of decimal places. All discrepancies are minimal and are statistically insignificant.
This variable describes the type of household within a dwelling. Household composition indicates whether a family is present and whether other unrelated household members are present. Any household, including lone person households, can contain visitors. ‘Visitor only’ households can contain overseas visitors (ABS Census Dictionary 2006).
The 'Other not classifiable' category includes those households which were occupied on Census night but where the Census collector could not make contact; households that contained only persons aged under 15 years; and households which could not be classified elsewhere in this classification because there was insufficient information on the Census form. (ABS Census Dictionary 2006).
Community Profile City of Swan
Page 79
The household and family data are essentially the same for both Usual Residence and Enumerated population counts. The person who fills in the form identifies all persons who are present on Census night and their relationship within the household. Anyone who is temporarily absent is separately identified on the form, so that the type of household and number of usual residents can be identified. However, any table examining the characteristics of people by the type of household they live in will exclude these people as few demographic variables are collected for persons temporarily absent.
Persons who are away from home, will be counted in the household they are present in on Census night (generally in a non-private dwelling or as a visitor in a private dwelling). Although the ABS will know their usual address, and they will be coded back to their area of usual residence, the ABS is not able to impute that person’s relationship to other people also resident at that address. Unlike the Enumerated count, Usual Residence household data does not include ‘visitor only’ households.
Community Profile City of Swan
Page 80

Specific notesAll data in the Community Profile is sourced from the Australian Bureau of Statistics, copyright in ABS data vests in the Commonwealth of Australia.
How many people live here? Introduction and summary
Key Statistics
How old are we?
Who are we? Where were we born?
The summary statistics table contains 'Total population', ‘Overseas population’ 'Gender', 'Indigenous population', ‘Institutional population’ and 'Average household size'; along with a summary of data contained elsewhere in the Profile.
'Total population' and 'Gender' data are shown both including and excluding 'Overseas Visitors'.
'Indigenous population' refers to persons of Aboriginal and/or Torres Strait Islander origin.
‘Institutional population’ refers to people living in non-private dwellings. These types of dwellings are establishments which provide a communal type of accommodation. Examples of categories are hotel, motel, boarding house, private hotel, public hospital (not psychiatric), and childcare institution.
'Average household size' is calculated on the basis of the number people counted in occupied private dwellings (excluding overseas visitors), divided by the number of occupied private dwellings (excluding non-private dwellings, such as institutions and hotels etc).
For notes on other variables in the 'Key statistics' table please see the specific data notes for each of the relevant sections.
Includes all persons except 'Overseas Visitors'.
Between the 2001 and the 2006 Censuses, there was a small change in the way that the question regarding your age was phrased. The 2001 Census asked your age next birthday. In 2006, the question asked either your age last birthday or your date of birth. This change in the way age structure has been collected has not had an impact on the data produced; if date of birth was completed, then the ABS calculated age as at your last birthday. 2006 age data are comparable to prior Censuses.
Includes all persons except 'Overseas Visitors'.
Community Profile City of Swan
Page 81

How many recently arrived?
How well do we speak English?
What language do we speak at home?
What is our religion?
The 'United Kingdom' includes ‘England’, ‘Scotland’, ‘Wales’, ‘Northern Ireland’, ‘Channel Islands, ‘Isle of Man’, and ‘United Kingdom not further defined’.
'Total Overseas born' includes ‘inadequately described’, ‘at sea’, and ‘not elsewhere classified’.
'Main English speaking countries' includes Canada, Ireland, New Zealand, South Africa, the United Kingdom, and the United States of America.
'Non-English speaking backgrounds' refers to persons born in countries not included in 'Main English speaking countries'.
'China (excl. Taiwan Province) ' also excludes the Special Administrative Regions of Hong Kong and Macau.
Birthplace is coded using the Standard Australian Classification of Countries (SACC) 1998..
Excludes persons who did not state their birthplace, and persons born in Australia or in other Australian territories.
Includes Australian residents born overseas who will be in Australia for more than one year.
This is derived from the Census question, ‘How well does the person speak English?’ and applies to all persons who speak a language other than English at home. The table in the profile has been further restricted to refer only to persons born overseas and aged over 5 years (excluding overseas visitors).
English proficiency aims to measure the ability of persons who speak ‘English as a Second Language’ to also speak English. The data, when viewed with other ethnic and cultural indicators, tends to reflect the ethnic composition of the population and the number of years of residence in Australia. In general, an area with a higher proportion of persons born in English-speaking countries or who emigrated from non-English speaking countries several decades ago is likely to have greater English-speaking proficiency.
Note: A person’s English proficiency is based on a subjective assessment and should therefore be treated with caution.
Responses to the question on Proficiency in English in the Census are subjective. For example, one respondent may consider that a response of 'Well' is appropriate if they can communicate well enough to do the shopping, while another respondent may consider such a response appropriate only for people who can hold a social conversation. Proficiency in English should be considered as an indicator of a person's ability to speak English and not a definitive measure of this ability.
For more information on proficiency in English, please refer to the ABS Census Dictionary (2901.0).
Includes all persons except 'Overseas Visitors'.
Language spoken at home is coded using the Australian Standard Classification of Languages (ASCL), 2005-06.
‘Filipino’ was recorded as a separate language from ‘Tagalog’ in the 2006 Census, but no such distinction was made in earlier Censuses. profile.id® combines the two languages together as ‘Tagalog’. Filipino is a standardised version of Tagalog, incorporating words from other indigenous languages within the Philippines.
‘Dari’ was recorded as a separate language from ‘Persian’ in the 2006 Census, but no distinction was made in earlier Censuses. profile.id® combines the two languages together as ‘Persian’. Dari is a localised name for Persian in Afghanistan.
Includes all persons except 'Overseas Visitors'.
Community Profile City of Swan
Page 82

● Oriental Orthodox, nfd
● Armenian Apostolic
● Coptic Orthodox Church
● Syrian Orthodox Church
● Ethiopian Orthodox Church
● Oriental Orthodox, nec
● Apostolic Church, so described
● Church of God, so described
● Australian Christian Churches, so described
● New Church Alliance, so described
What is our individual income?
Individual income quartiles
Religion is coded using the Australian Standard Classification of Religious Groups (ASCRG), 2005.
The religion question in the Census is an optional question and so has quite a high rate of ‘Not Stated’ responses.
The 2006 Census recorded ‘Eastern Orthodox’, which is a new designation for those churches previously described as ‘Orthodox’.
The 2006 Census recorded ‘Assyrian Apostolic’ as a separate religious category. Previously, all religions falling under this category were recorded as ‘Oriental Christian’.
The 2006 Census introduces a new designation called ‘Oriental Orthodox’. The majority of the churches in this group were formerly known as ‘Oriental Christian’. This includes:
'Christian nfd' refers to a Christian religion 'not further defined', and includes:
This data includes total gross income (including pensions and allowances) that a person usually receives each week.
This data applies only to people aged 15 years and over and excludes overseas visitors.
Individual incomes are collected as ranges in the Census.
Individual income groups are not comparable over time because of the influences of economic change such as wage level fluctuations and inflation. The income quartile method has been adopted as the most objective method of comparing change in the income profile of a community over time.
Individual income quartiles look at the distribution of incomes in the City of Swan relative to Perth Statistcal Division. Quartiles split the total population into four equal parts for the Perth Statistcal Division. The table shows the number and proportion of individuals in the City of Swan falling into each segment for the benchmark area.
The table gives a clear picture of where individual incomes in the City of Swan sit relative to Perth Statistcal Division. For the Perth Statistcal Division, 25% of persons fall into each category. If, for example, the City of Swan has 30% in the top category and only 20% in the lowest, this indicates that the City of Swan has proportionally more higher-income individuals and less lower-income individuals.
Individual income quartile definitions(Annual income ranges)
2006 2001 1996 1991
Lowest group Nil to $11,407 Nil to $9,313 Nil to $7,667 Nil to $6,347
Medium lowest $11,408 to$26,354 $9,314 to$19,756 $7,668 to$15,967 $6,348 to$13,575
Community Profile City of Swan
Page 83
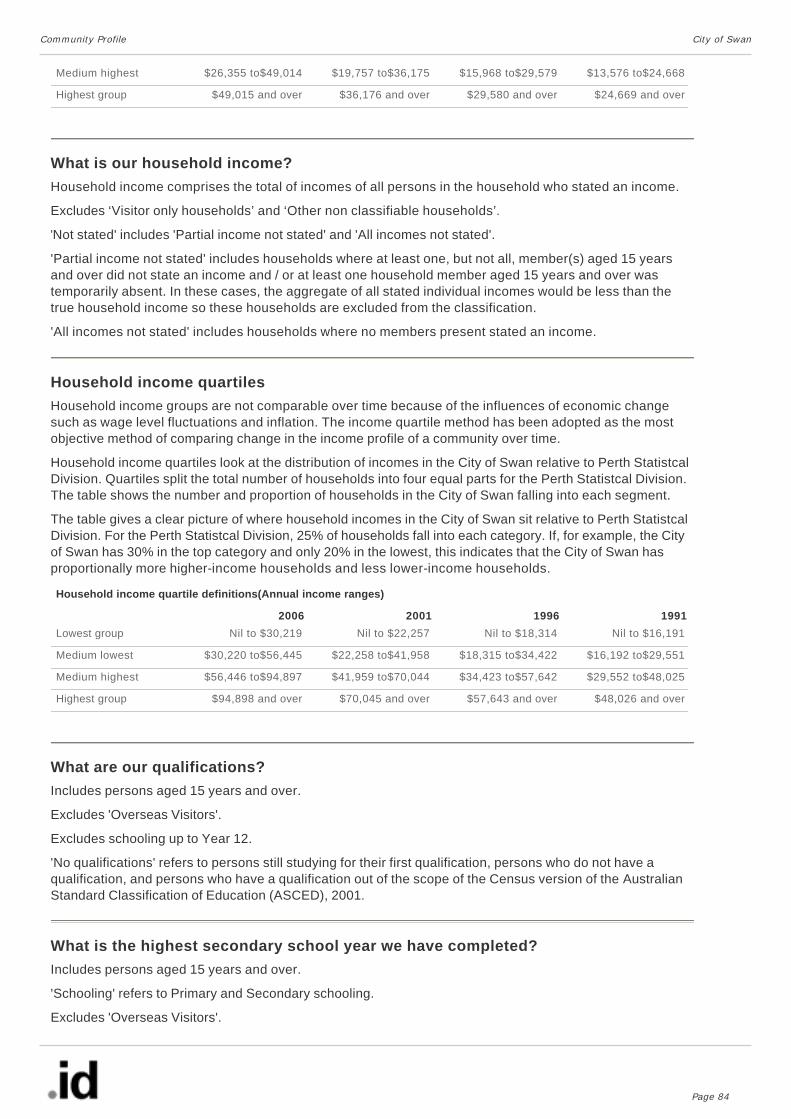
What is our household income?
Household income quartiles
What are our qualifications?
What is the highest secondary school year we have completed?
Medium highest $26,355 to$49,014 $19,757 to$36,175 $15,968 to$29,579 $13,576 to$24,668
Highest group $49,015 and over $36,176 and over $29,580 and over $24,669 and over
Household income comprises the total of incomes of all persons in the household who stated an income.
Excludes ‘Visitor only households’ and ‘Other non classifiable households’.
'Not stated' includes 'Partial income not stated' and 'All incomes not stated'.
'Partial income not stated' includes households where at least one, but not all, member(s) aged 15 years and over did not state an income and / or at least one household member aged 15 years and over was temporarily absent. In these cases, the aggregate of all stated individual incomes would be less than the true household income so these households are excluded from the classification.
'All incomes not stated' includes households where no members present stated an income.
Household income groups are not comparable over time because of the influences of economic change such as wage level fluctuations and inflation. The income quartile method has been adopted as the most objective method of comparing change in the income profile of a community over time.
Household income quartiles look at the distribution of incomes in the City of Swan relative to Perth Statistcal Division. Quartiles split the total number of households into four equal parts for the Perth Statistcal Division. The table shows the number and proportion of households in the City of Swan falling into each segment.
The table gives a clear picture of where household incomes in the City of Swan sit relative to Perth Statistcal Division. For the Perth Statistcal Division, 25% of households fall into each category. If, for example, the City of Swan has 30% in the top category and only 20% in the lowest, this indicates that the City of Swan has proportionally more higher-income households and less lower-income households.
Household income quartile definitions(Annual income ranges)
2006 2001 1996 1991
Lowest group Nil to $30,219 Nil to $22,257 Nil to $18,314 Nil to $16,191
Medium lowest $30,220 to$56,445 $22,258 to$41,958 $18,315 to$34,422 $16,192 to$29,551
Medium highest $56,446 to$94,897 $41,959 to$70,044 $34,423 to$57,642 $29,552 to$48,025
Highest group $94,898 and over $70,045 and over $57,643 and over $48,026 and over
Includes persons aged 15 years and over.
Excludes 'Overseas Visitors'.
Excludes schooling up to Year 12.
'No qualifications' refers to persons still studying for their first qualification, persons who do not have a qualification, and persons who have a qualification out of the scope of the Census version of the Australian Standard Classification of Education (ASCED), 2001.
Includes persons aged 15 years and over.
'Schooling' refers to Primary and Secondary schooling.
Excludes 'Overseas Visitors'.
Community Profile City of Swan
Page 84

Where are we learning?
Do we need assistance?
What do we do?Do we do unpaid work?
● assisting at events and with sports organisations
● helping with school events and activities
● assisting in churches, hospitals, nursing homes and charities
● other kinds of volunteer work (e.g. emergency services, etc.).
Unpaid domestic work
There is no time series for this particular data set owing to differences in the way that the data was recorded. The 2001 Census did not record people who were over 15 years and still at school as having completed a particular year of schooling. Instead they were counted as “Still at school”. However, in 2006 they were coded to the highest year already completed, making the data non-comparable. This means that if an individual is still in the process of completing year 11 during a Census year, they are recorded as having completed year 10. This also means that the number of people who have completed year 10 cannot be treated as being indicative of the number of people who left school after completing year 10 as it will include people who were in the process of completing year 11.
Excludes 'Overseas Visitors'.
'Independent' refers to private and other non-Government schools.
‘Catholic’ refers to infant, primary and secondary schools run independently by the Catholic Church.
'TAFE' refers to 'Technical and Further Education' institutions.
This data identifies people who report a need for assistance due to a 'profound or severe core activity limitation'. This population is defined as people who need assistance in their day to day lives with any or all of the following activities – self-care, body movements or communication – because of a disability, long-term health condition, or old age.
This question relies on people evaluating themselves, (or their carers), as being in need of assistance. Consequently this question provides an indication of the characteristics of people who report, or are reported as requiring, a need for assistance; but cannot be relied upon to provide details as to the total number of people with a 'profound or severe core activity limitation'.
Persons under the age of 40 whose only stated reason for need for assistance was ‘old or young age’ are included under ‘no need for assistance’.
Excludes 'Overseas Visitors'.
This data includes help willingly given in the form of time, service or skills, to a club, organisation or association including:
Voluntary work excludes unpaid work done through a club, organisation or association mainly in order to qualify for government benefits such as Newstart Allowance. It also excludes any activity which is part of a person's paid employment or family business. ABS Census Dictionary 2006.
This data applies to persons aged 15 years and over and to voluntary work undertaken in the 12 months prior to the Census.
This data excludes 'Overseas Visitors'.
This data includes all the domestic work a person does without pay in their own home and in other places, for themselves, their family and other people in their household.
Community Profile City of Swan
Page 85

Unpaid care
● bathing, dressing, toileting and feeding;
● mobility;
● understanding or being understood by others;
● emotional support;
● medication;
● dressing wounds
● food
● housework
● driving
Unpaid childcare
What is our employment status?
What industries do we work in?
This data only applies to persons aged 15 years and over and to domestic work performed in the week prior to Census.
Unpaid domestic work can include meal preparation, service and clean-up; washing, ironing and managing clothes; other housework; gardening, mowing and yard work; home maintenance; car and bike maintenance; household shopping and managing household financial affairs.
This data excludes 'Overseas Visitors'.
Unpaid care (unpaid assistance to a person with a disability, a long term illness or problems related to old age), includes the unpaid help a person gives to another person to assist them with their daily activities. It can include assistance with:
This data applies to persons aged 15 years and over and to care given in the two weeks prior to Census.
This data excludes 'Overseas Visitors'.
This data includes the time a person spends caring for a child or children without being paid. This can include people caring for their own children, whether they usually live with them or not. It can also include people looking after their own grandchildren or the children of other relatives or the children of friends or neighbours.
This data only applies to persons aged 15 years and over and to child care given in the two weeks prior to Census.
This data excludes 'Overseas Visitors'.
Excludes 'Overseas Visitors'
Includes persons aged 15 years and over.
'Employed full time' is defined as having worked 35 hours or more in all jobs during the week prior to Census night.
'Employed part time' is defined as having worked less than 35 hours in all jobs during the week prior to Census night.
The 'Labour force' is defined as all persons aged 15 years and over who are looking for work, or are employed, either full time, part time or casually.
This data describes the industries in which employed people work. It applies only to people aged 15 and
Community Profile City of Swan
Page 86

Time series industry categories
What are our occupations?
Time series occupation categories
How do we get to work?
over who were employed in the week prior to Census.
Data for industry are coded using the Australia and New Zealand Standard Industrial Classification (ANZSIC). The industry classification is updated periodically to take account of emerging industries and changes in the structure of the economy.
For the 2006 Census, the updated ANZSIC06 classification was used, which includes more industry divisions which better reflect the structure of the Australian economy. Data are presented using this classification as an option. However for time series, data are also presented on the older ANZSIC93 classification, as this classification was used in earlier censuses.
For more information please refer to the 2006 Census Dictionary, and ANZSIC classification.
This data describes the industries in which employed people work. It applies only to people aged 15 and over who were employed in the week prior to Census.
Data for industry are coded using the Australia and New Zealand Standard Industrial Classification (ANZSIC). The industry classification is updated periodically to take account of emerging industries and changes in the structure of the economy.
For the 2006 Census, the updated ANZSIC06 classification was used, but people were also coded to the older ANZSIC93 classification. Data in the profiles is presented using both classifications; data for 2006 alone uses ANZSIC06, while time series data uses ANZSIC93 for comparability.
For more information please refer to the 2006 Census Dictionary, and ANZSIC classification.
This data describes the occupations of employed people. It applies only to people aged 15 and over who were employed in the week prior to Census.
Data for occupation are coded using the Australian and New Zealand Standard Classification of Occupations (ANZSCO). The occupation classification is updated periodically to take account of emerging occupation groups and changes to the structure of the labour force.
Data are presented for the broad occupation groupings. For 2006 these were coded using ANZSCO, the most recent classification. These are presented in profile.id® where no time series is required. For time series, the data are presented using the older ASCO 2nd edition classification, to ensure data comparability.
For more information please refer to the 2006 Census Dictionary, and the 2006 Australian and New Zealand Standard Classification of Occupations (ANZSCO).
This data describes the occupations of employed people. It applies only to people aged 15 and over who were employed in the week prior to Census.
Data for occupation are coded using the Australian and New Zealand Standard Classification of Occupations (ANZSCO). The occupation classification is updated periodically to take account of emerging occupation groups and changes to the structure of the labour force.
Data are presented for the broad occupation groupings. For 2006 these were coded using ANZSCO, the most recent classification. These are presented in profile.id® where no time series is required. For time series, the data are presented using the older ASCO 2nd edition classification, to ensure data comparability.
This data looks at the method of travel to work of employed people. It applies only to people aged 15 and over who were employed in the week prior to Census.
Method of travel relates specifically to the journey to work on the morning of Census day. This differs to the
Community Profile City of Swan
Page 87

● 'Train' includes any journey involving a train, whether or not other methods were used.
● 'Bus' includes any journey involving a bus, except for those also involving a train.
● The remaining categories, except for 'Other', only refer to a single method of travel (e.g. 'Car as driver'
when no other method was used).
● 'Other' refers to any method not listed in the standard categories, plus any combination of two or three
methods NOT involving a bus or train.
How do we live?What type of households do we live in?
How many people live in each household?
Are we owners, renters or buyers?
industry and occupation data which relates to the main job held in the week prior to Census.
Respondents can nominate up to three modes of travel. For data presented in the profile, the following aggregations have been used:
Note that the categories "Walked only", "Worked at home" and "Did not go to work" are exclusive and are never combined with other methods.
'Tram or Ferry' includes light rail.
This data excludes 'Overseas Visitors'.
For more information please refer to the Census Dictionary 2006.
This data describes the type of family and non-family households within a dwelling.
The first section of the table counts family units in family households, and breaks them down by the presence of couples, single parents, and children. This classification of a family includes persons who are temporarily absent from the family on Census night.
The second section counts households. Households can contain up to three families, or a lone person, group of unrelated individuals (flatmates etc.) or other household.
The 'Other not classifiable' category includes those households which were occupied on Census Night but where the Census collector could not make contact; households that contained only persons aged under 15 years; and households which could not be classified elsewhere in this classification because there was insufficient information on the Census form. (ABS Census Dictionary 2006).
'Couple with child(ren) 15 years and under' and 'One parent family with child(ren) 15 years and under' refers to families with at least one child aged 15 years or younger. These families may also have older children living at home.
'One parent family with child(ren) over 15 years' and 'Couple with child(ren) over 15 years' refers to families with no children under the age of 15 years.
Data includes same sex couple families.
This data excludes 'Overseas Visitors'.
As the data are counting households, only enumerated counts are applicable.
This data includes enumerated households by the number of persons usually resident, (includes up to three residents who were temporarily absent on Census night).
A household is defined as one or more persons, at least one of whom is at least 15 years of age, usually resident in the same private dwelling.
This data excludes ‘Visitor only’ and 'Other not classifiable' households.
This data presents the tenure type of occupied private dwellings, and for those dwellings being rented,
Community Profile City of Swan
Page 88

How much do we pay on our housing loan?
Housing loan quartiles
provides a breakdown of the type of landlord the dwelling is being rented from.
‘Being purchased’ includes dwellings being purchased under a rent/buy scheme.
'Renting – Govt' refers to households renting from a State/Territory Government housing authority.
'Renting – Other' refers to households renting from private landlords, real estate agents and employers.
'Rented – Not stated' refers to rented dwellings where the landlord type was not stated.
‘Life tenure’ in 2006 has been included under ‘Other tenure type’
Tenure type changes between 2001 and 2006:Though the classification for Census data has remained the same, between 2001 and 2006 there was a change to the wording of dwelling ownership responses to the Tenure Type question on the Census questionnaire. "Fully Owned" in 2001 became "Owned Outright" in 2006, while "Being Purchased" became "Owned with a mortgage". This change in wording may have resulted in more accurate responses to this question, however it has made comparison over time difficult and such analysis should be done with caution. Looking at Australia as a whole, comparing 2006 to 2001 data, the "Being Purchased" category has increased by 5.7%, to 32.2% of private dwellings, while the "Fully Owned" category has decreased by 7.1%, to 32.6% of private dwellings. It is expected that a large part of this change is due to the change in wording, rather than representing change in the real world.
It is recommended that any analysis of change over time in these categories look only at the relative differences between change in local populations and the Australia-wide or state-based benchmarks, rather making inferences about local populations based on their numbers alone. Other categories in the Tenure Type classification are unaffected.
This data shows housing loan repayments being paid on a monthly basis by a household to purchase the dwelling in which it was enumerated (also applicable to caravans).
This data only applies to households (occupied private dwellings) who are purchasing their dwelling. It also includes households who are purchasing their dwelling under a 'rent/buy' scheme.
'Other not classifiable' households are excluded from this data.
Housing loan payments are not comparable over time because of the influences of economic change such as inflation. The loan payment quartile method has been adopted as the most objective method of comparing change in the cost of housing of a community over time.
Housing loan repayment quartiles look at the distribution of housing loan repayments in the City of Swan relative to Perth Statistcal Division. Quartiles split the total number of households into four equal parts for the Perth Statistcal Division. The table shows the number and proportion of households in the City of Swan falling into each segment.
The table gives a clear picture of the level of housing loan repayments in the City of Swan relative to Perth Statistcal Division. For the Perth Statistcal Division, the categories are split so that 25% of households fall into each category, so by comparison, the table will show if there are more or less households in the City of Swan with high repayments than in Perth Statistcal Division. If, for example, the City of Swan has 30% in the top category and only 20% in the lowest, this indicates that the City of Swan has proportionally more households with ‘top quarter’ repayments on their home loans, and less paying relatively low amounts.
Housing loan quartile definitions(Annual payment ranges)
2006 2001 1996
Lowest group Nil to $10,412 Nil to $7,523 Nil to $6,390
Medium lowest $10,413 to$15,412 $7,524 to$10,518 $6,391 to$9,308
Medium highest $15,413 to$22,124 $10,519 to$14,182 $9,309 to$12,549
Highest group $22,125 and over $14,183 and over $12,550 and over
Community Profile City of Swan
Page 89
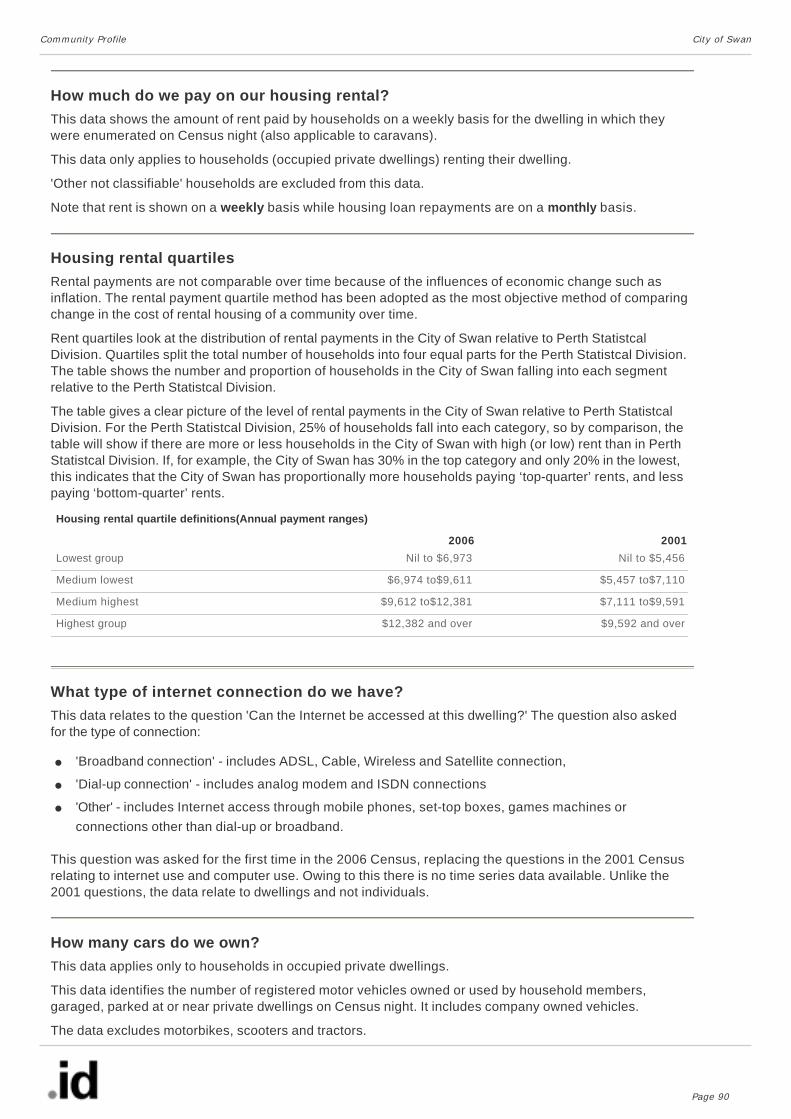
How much do we pay on our housing rental?
Housing rental quartiles
What type of internet connection do we have?
● 'Broadband connection' - includes ADSL, Cable, Wireless and Satellite connection,
● 'Dial-up connection' - includes analog modem and ISDN connections
● 'Other' - includes Internet access through mobile phones, set-top boxes, games machines or
connections other than dial-up or broadband.
How many cars do we own?
This data shows the amount of rent paid by households on a weekly basis for the dwelling in which they were enumerated on Census night (also applicable to caravans).
This data only applies to households (occupied private dwellings) renting their dwelling.
'Other not classifiable' households are excluded from this data.
Note that rent is shown on a weekly basis while housing loan repayments are on a monthly basis.
Rental payments are not comparable over time because of the influences of economic change such as inflation. The rental payment quartile method has been adopted as the most objective method of comparing change in the cost of rental housing of a community over time.
Rent quartiles look at the distribution of rental payments in the City of Swan relative to Perth Statistcal Division. Quartiles split the total number of households into four equal parts for the Perth Statistcal Division. The table shows the number and proportion of households in the City of Swan falling into each segment relative to the Perth Statistcal Division.
The table gives a clear picture of the level of rental payments in the City of Swan relative to Perth Statistcal Division. For the Perth Statistcal Division, 25% of households fall into each category, so by comparison, the table will show if there are more or less households in the City of Swan with high (or low) rent than in Perth Statistcal Division. If, for example, the City of Swan has 30% in the top category and only 20% in the lowest, this indicates that the City of Swan has proportionally more households paying ‘top-quarter’ rents, and less paying ‘bottom-quarter’ rents.
Housing rental quartile definitions(Annual payment ranges)
2006 2001
Lowest group Nil to $6,973 Nil to $5,456
Medium lowest $6,974 to$9,611 $5,457 to$7,110
Medium highest $9,612 to$12,381 $7,111 to$9,591
Highest group $12,382 and over $9,592 and over
This data relates to the question 'Can the Internet be accessed at this dwelling?' The question also asked for the type of connection:
This question was asked for the first time in the 2006 Census, replacing the questions in the 2001 Census relating to internet use and computer use. Owing to this there is no time series data available. Unlike the 2001 questions, the data relate to dwellings and not individuals.
This data applies only to households in occupied private dwellings.
This data identifies the number of registered motor vehicles owned or used by household members, garaged, parked at or near private dwellings on Census night. It includes company owned vehicles.
The data excludes motorbikes, scooters and tractors.
Community Profile City of Swan
Page 90

What type of dwellings do we live in?
Dwelling structure looks at the type of dwelling for all occupied private dwellings. This data is classified by the Census collector on visiting the household, and the categories are broadly based on the density of the housing types.
‘Separate house’ includes all free-standing dwellings separated from neighboring dwellings by a gap of at least half a metre.
‘Medium density’ includes all semi-detached, row, terrace, townhouses and villa units, plus flats and apartments in blocks of 1 or 2 storeys, and flats attached to houses.
‘High density’ includes flats and apartments in 3 storey and larger blocks.
‘Caravans, cabins, houseboats’ includes all such mobile accommodation, both inside and outside caravan parks.
‘Other’ includes houses and flats attached to shops or offices, and improvised homes, tents and sleepers out on Census night.
Unoccupied dwellings are shown separately in the table.
The Census classification for dwelling structure is based on the ABS Standard Dwelling Classification.
Community Profile City of Swan
Page 91