bullitt comp plan chap 3 economic - kriss lowry comp plan chap 3 economic.pdf · of e-commerce...
TRANSCRIPT
Economic Development
C o m p r e h e n s i v e P l a n
Bullitt County
3-1
CHAPTER THREE
ECONOMIC DEVELOPMENT
INTRODUCTION
An analysis of the structure and vitality of a community’s economy is fun-
damental to develop a strategic plan for economic development and for future land
use planning. Studies of the structure of the existing local economy identify the
important economic activities within the community. The extent of economic ac-
tivity and the population supported by such activity influences future economic de-
velopment. The health and growth of the local economy is a key determinant of
how rapidly land will be converted to various land uses and can be gauged by its
stability and balance. Stability is the ability to withstand fluctuations in the re-
gional and national economies. Balance is the degree to which diversification al-
lows the local economy to withstand fluctuations in a particular sector of the econ-
omy.
EMPLOYMENT BY INDUSTRY
Employment information at the county level is available for industries cov-
ered by unemployment insurance. This generally includes all workers except self-
employed individuals, unpaid family members, some student workers, agricultural
workers, domestic workers, rail workers, employees of certain religious organiza-
tions, and certain government employees. A summary of employment in industries
covered by unemployment insurance for 2007, 2009 and 2011 is shown in Figure 3
-1.
Bullitt County had a net increase of 3,007 jobs from 2007 to 2011 (19.6%).
This is a significant increase considering the state of Kentucky overall had a job
loss rate of four percent for the same period due to the economic downturn follow-
ing the collapse of the housing market in 2008. As of 2011, the services sector pro-
vided the largest number of jobs in Bullitt County accounting for 32.9% of the jobs
in the county covered by unemployment insurance. The utilities, trade and trans-
portation sector, which includes warehousing and trucking, had the second largest
number of jobs at accounting for 30.1% of the total. Both of these sectors saw sig-

3-2
Economic Development
Mining
Construction
Manufacturing
Utilities, Trade &
Transportation
InformationFinance,
Insurance, & Real Estate
Services
State & Local Government
Other
FIGURE 3-1BULLITT CO 2011 EMPLOYMENT BY INDUSTRIES
COVERED BY UMEMPLOYMENT INSURANCE BY NAICS INDUSTRIAL DIVISION
% CHANGE INDUSTRY 2007 2009 2011 2007-2011 Mining - - - Construction 1,498 1,187 1,171 -21.83% Manufacturing 2,755 2,439 2,181 -20.83% Utilities, Trade & Transportation 3,716 4,005 5,521 48.57% Information 82 39 55 -32.93% Finance, Insurance, & Real Estate 409 446 555 35.70% Services 4,032 4,920 6,022 49.36% State & Local Government 2,749 2,823 2,765 0.58% Other - - - TOTAL 15,326 15,932 18,333 19.62%
Source: Ky Education & Workforce Dev. Cabinet, Dept. for Workforce Investment
Note: A dash indicates data not disclosed due to privacy requirements.
Economic Development
C o m p r e h e n s i v e P l a n
Bullitt County
3-3
nificant growth during the period and now account for 63% of the jobs in the
county. The construction, manufacturing and information sectors all experienced a
loss of jobs from 2007 to 2011.
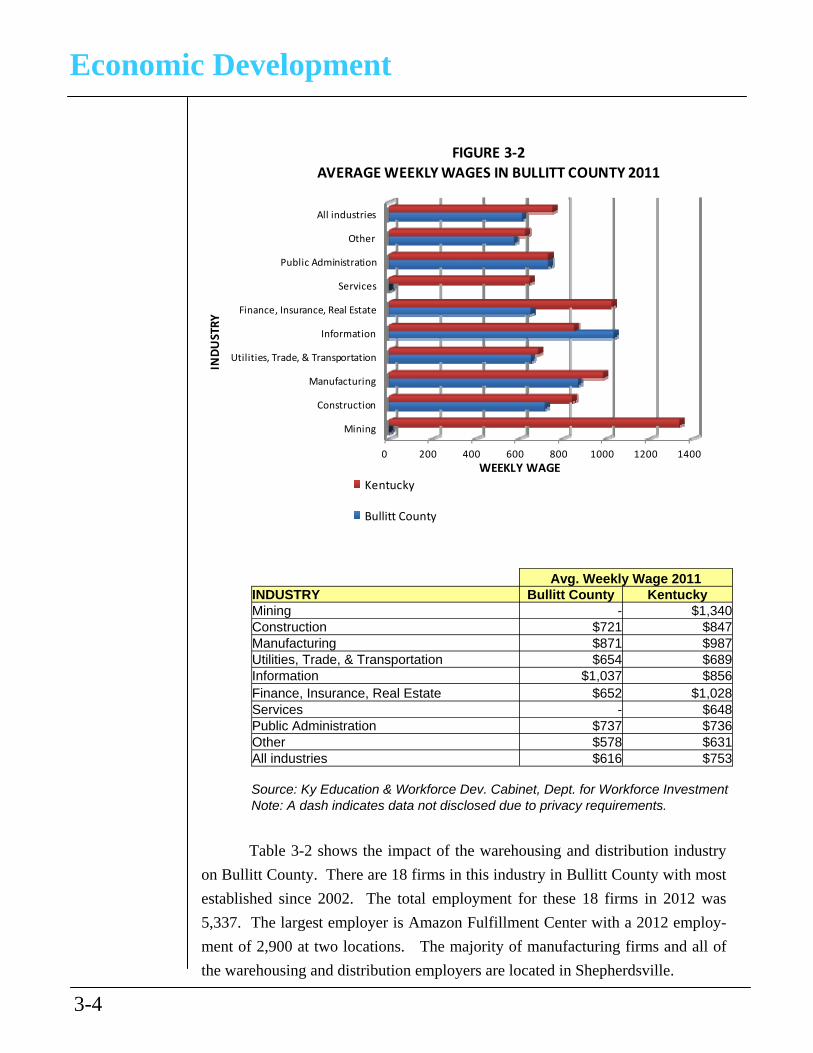
Figure 3-2 shows the average weekly wages in 2011 for industries in Bullitt
County covered by unemployment insurance. Of the industries disclosed, the in-
formation sector paid the highest wages per week followed by manufacturing. Un-
fortunately there are very few information sector jobs in Bullitt County. In Ken-
tucky, the mining sector pays the highest average weekly wages. Mining industry
wages in Bullitt County are not disclosed due to the small number of businesses.
The lowest average weekly wages in Bullitt County are service industry wages.
The exact number is not disclosed to prevent calculation of mining industry wages.
During the period from 2007 to 2011 there has been a trend of job loss in the higher
paying industries such as construction and manufacturing and job increases in
lower paying sectors such as services and utilities, trade and transportation. The
average weekly wages for all industries in Bullitt County were only 81.8 % of the
average for Kentucky overall.
MANUFACTURING & OTHER LARGE INDUSTRIAL EMPLOYERS
The Kentucky Cabinet for Economic Development publishes the Kentucky
Directory of Manufacturers that list manufacturers by county and community.
They also publish the Kentucky Directory of Business and Industry which includes
other large industry employers in addition to manufacturers. These documents
include facilities with ten or more employees that participate in Economic Devel-
opment Cabinet programs. They do not include all industrial facilities in the
county. It should also be noted that the number of employees are the average num-
ber of full time permanent employees and do not include part time, temporary or
contractual workers. These documents provide contact information along with a
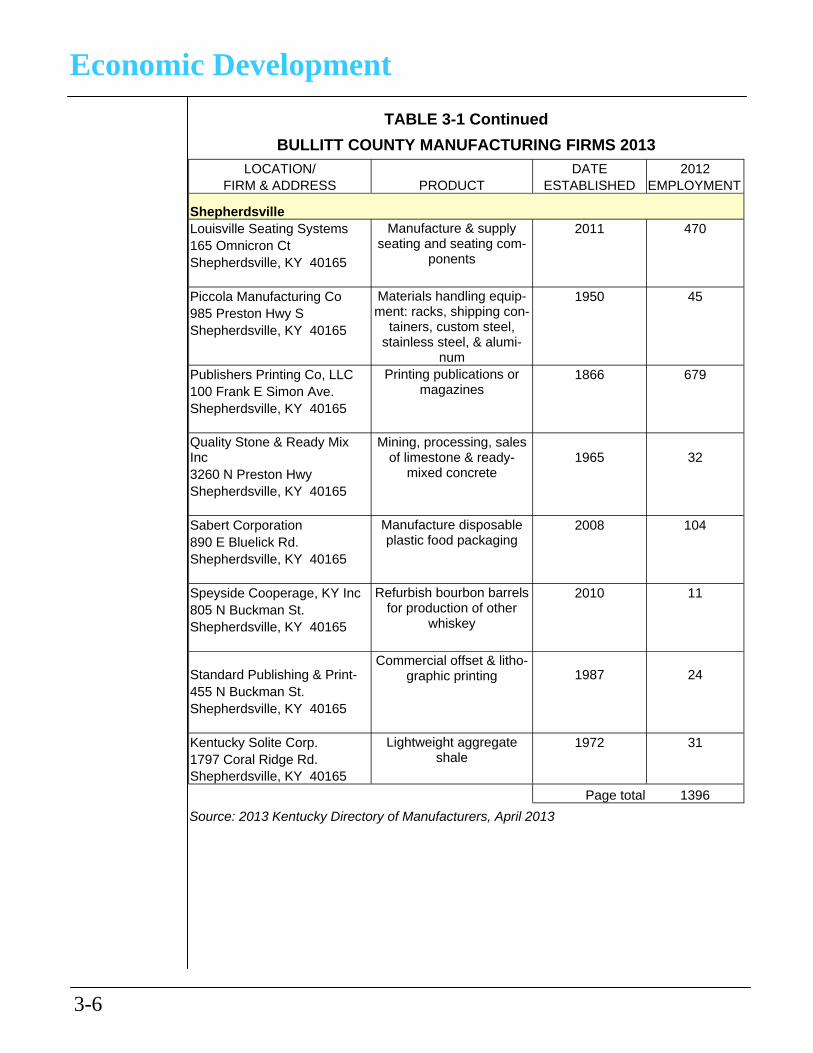
short summary of each business. Table 3-1 lists the manufacturing firms found
throughout Bullitt County. According to the directory, there are a total of 15 manu-
facturing firms in Bullitt County with a 2012 full time employment of 2,213. The
largest manufacturing employer is Publishers Printing Co. with an employment of
1,404 at two facilities in Shepherdsville and Lebanon Junction.
3-4
Economic Development
0 200 400 600 800 1000 1200 1400
Mining
Construction
Manufacturing
Utilities, Trade, & Transportation
Information
Finance, Insurance, Real Estate
Services
Public Administration
Other
All industries
WEEKLY WAGE
INDUSTRY
FIGURE 3‐2
AVERAGE WEEKLY WAGES IN BULLITT COUNTY 2011
Kentucky
Bullitt County
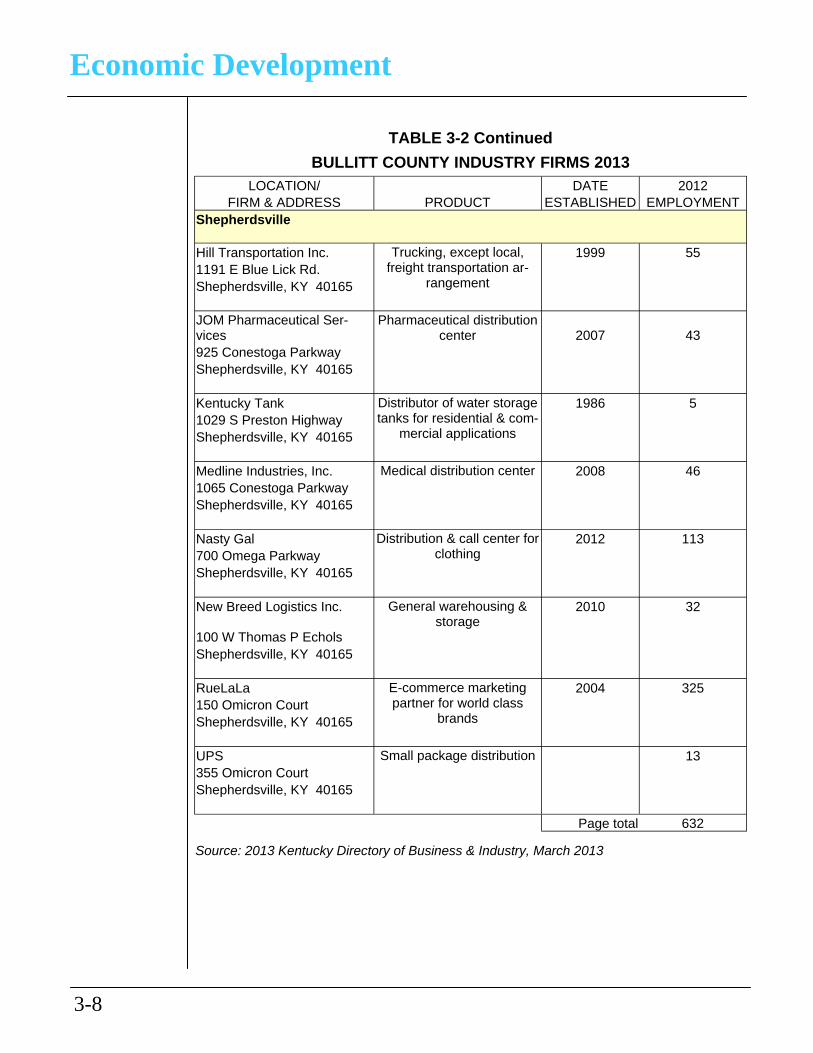
Table 3-2 shows the impact of the warehousing and distribution industry
on Bullitt County. There are 18 firms in this industry in Bullitt County with most
established since 2002. The total employment for these 18 firms in 2012 was
5,337. The largest employer is Amazon Fulfillment Center with a 2012 employ-
ment of 2,900 at two locations. The majority of manufacturing firms and all of
the warehousing and distribution employers are located in Shepherdsville.
Avg. Weekly Wage 2011 INDUSTRY Bullitt County Kentucky Mining - $1,340 Construction $721 $847 Manufacturing $871 $987 Utilities, Trade, & Transportation $654 $689 Information $1,037 $856 Finance, Insurance, Real Estate $652 $1,028 Services - $648 Public Administration $737 $736 Other $578 $631 All industries $616 $753
Source: Ky Education & Workforce Dev. Cabinet, Dept. for Workforce Investment Note: A dash indicates data not disclosed due to privacy requirements.

Economic Development
C o m p r e h e n s i v e P l a n
Bullitt County
3-5
TABLE 3-1
BULLITT COUNTY MANUFACTURING FIRMS 2013
LOCATION/ DATE 2012 FIRM & ADDRESS PRODUCT ESTABLISHED EMPLOYMENT
Hillview Bluelick Aero Enterprize LLC
Machine shop, sub-merged gas and arc welding, general ma-
chining, drilling, boring, lathe & mill work
1970 6 1432 Hillview Blvd. Hillview, KY 40229-4047
Bullitt County Stone Co Crushed limestone 1967 25 305 Bells Mill Rd Shepherdsville, KY 40165
Lebanon Junction Mac Manufacturing Com-pany
Automatic barrel filling devices, stencilers, lifts
& material handling equip., robots, turnta-
bles.
1957 23 235 E Oak St. Lebanon Junction, KY 40150
Publishers Printing Co, LLC Printing publications & magazines
1991 725 13487 S Preston Hwy. Lebanon Junction, KY 40150
Mount Washington Smith's Laminating Shop, Inc.
Custom laminate case-work, countertops, com-
mercial, institutional, detail and restaurant
food service
2005 17 284 Griffin Way Mt. Washington, KY 40047
Shepherdsville Bluegrass Pallets Co. Wood pallets, animal
bedding, mulch, heat treating
1967 13 265 Harshfield Ln Shepherdsville, KY 40165 D G Industries, Inc. Custom metal, steel &
plastic fabricating 1989 8
1270 S Preston Hwy Shepherdsville, KY 40165
Page total 817 Source: 2013 Kentucky Directory of Manufacturers, April 2013
3-6
Economic Development
TABLE 3-1 Continued
BULLITT COUNTY MANUFACTURING FIRMS 2013
LOCATION/ DATE 2012 FIRM & ADDRESS PRODUCT ESTABLISHED EMPLOYMENT
Shepherdsville Louisville Seating Systems Manufacture & supply
seating and seating com-ponents
2011 470 165 Omnicron Ct Shepherdsville, KY 40165 Piccola Manufacturing Co Materials handling equip-
ment: racks, shipping con-tainers, custom steel,
stainless steel, & alumi-num
1950 45 985 Preston Hwy S Shepherdsville, KY 40165
Publishers Printing Co, LLC Printing publications or
magazines 1866 679
100 Frank E Simon Ave. Shepherdsville, KY 40165 Quality Stone & Ready Mix Inc
Mining, processing, sales of limestone & ready-
mixed concrete 1965 32
3260 N Preston Hwy Shepherdsville, KY 40165 Sabert Corporation Manufacture disposable
plastic food packaging 2008 104
890 E Bluelick Rd. Shepherdsville, KY 40165 Speyside Cooperage, KY Inc Refurbish bourbon barrels
for production of other whiskey
2010 11 805 N Buckman St. Shepherdsville, KY 40165
Standard Publishing & Print-Commercial offset & litho-
graphic printing 1987 24 455 N Buckman St. Shepherdsville, KY 40165 Kentucky Solite Corp. Lightweight aggregate
shale 1972 31
1797 Coral Ridge Rd. Shepherdsville, KY 40165
Page total 1396
Source: 2013 Kentucky Directory of Manufacturers, April 2013

Economic Development
C o m p r e h e n s i v e P l a n
Bullitt County
3-7
TABLE 3-2
BULLITT COUNTY INDUSTRY FIRMS 2013 LOCATION/ DATE 2012
FIRM & ADDRESS PRODUCT ESTABLISHED EMPLOYMENT
Shepherdsville Alliance Entertainment LLC Marketer, distributor &
merchandiser of family entertainment products
2003 280 300 Omicron Ct, Ste A Shepherdsville, KY 40165 Amazon Fulfillment Center 1 Fulfillment of online orders 2002 700
271 Omega Parkway, Ste Shepherdsville, KY 40165 Amazon Fulfillment Center 2 Fulfillment center, foot-
wear, handbags, apparel & accessories
2006 2,200 376 Zappos.com Blvd Shepherdsville, KY 40165 APL Logistics Inc. Third party logistics & dis-
tribution warehouse for Dow Corning
2002 84
270 Omega Parkway, Ste Shepherdsville, KY 40165 Best Buy Co Inc. DC# 1376 Warehouse & distribution
of e-commerce services & regional returns
2010 300 600 Park Loop Rd. Shepherdsville, KY 40165 Chegg Inc. Warehouse & distribution
of text books 2009 31
649 Omega Parkway Shepherdsville, KY 40165 Dri-View Manufacturing Custom assembling, pack-
aging & mailing services, warehousing & fullfillmen
services
2004 35 3214 E Blue Lick Rd Shepherdsville, KY 40165 Gilt Groupe E-tailer and fulfillment cen-
ter 2010 225
3208 E Blue Lick Rd. Shepherdsville, KY 40165 Gordon Food Service Food service distribution
center 2004 450
342 Gordon Industrial Dr Shepherdsville, KY 40165
GSI Commerce Solutions Electronic commerce ful-
fillment & distribution 1999 400 350 Omega Parkway Shepherdsville, KY 40165
Page total 4705 Source: 2013 Kentucky Directory of Business & Industry, March 2013
3-8
Economic Development
TABLE 3-2 Continued
BULLITT COUNTY INDUSTRY FIRMS 2013
LOCATION/ DATE 2012 FIRM & ADDRESS PRODUCT ESTABLISHED EMPLOYMENT
Shepherdsville
Hill Transportation Inc. Trucking, except local, freight transportation ar-
rangement
1999 55 1191 E Blue Lick Rd. Shepherdsville, KY 40165 JOM Pharmaceutical Ser-vices
Pharmaceutical distribution center 2007 43
925 Conestoga Parkway Shepherdsville, KY 40165 Kentucky Tank Distributor of water storage
tanks for residential & com-mercial applications
1986 5 1029 S Preston Highway Shepherdsville, KY 40165 Medline Industries, Inc. Medical distribution center 2008 46 1065 Conestoga Parkway Shepherdsville, KY 40165 Nasty Gal Distribution & call center for
clothing 2012 113
700 Omega Parkway Shepherdsville, KY 40165 New Breed Logistics Inc. General warehousing &
storage 2010 32
100 W Thomas P Echols Shepherdsville, KY 40165 RueLaLa E-commerce marketing
partner for world class brands
2004 325 150 Omicron Court Shepherdsville, KY 40165 UPS Small package distribution 13 355 Omicron Court Shepherdsville, KY 40165 Page total 632
Source: 2013 Kentucky Directory of Business & Industry, March 2013

Economic Development
C o m p r e h e n s i v e P l a n
Bullitt County
3-9
U. S. ECONOMIC CENSUS
The U.S. Department of Commerce conducts an Economic Census every
five years to provide a detailed portrait of the U. S. economy from the national to
the local level. The Economic Census covers nearly all of the U.S. economy in its
basic collection of establishment statistics. Censuses of agriculture and govern-
ments are conducted at the same time.
The latest available Economic Census was conducted in 2007. An Eco-
nomic Census is currently being conducted for the year ending December 2012,
however that data will not be available in time to include it in this document. Data
for economic sectors with few establishments in Bullitt County is not available at
the county level as publication of the data could reveal the identity or activity of an
individual or business. County level data is not available for the following sectors:
Mining, Utilities, Construction, Transportation and Warehousing, Finance and In-
surance, and Management of Companies and Enterprises.
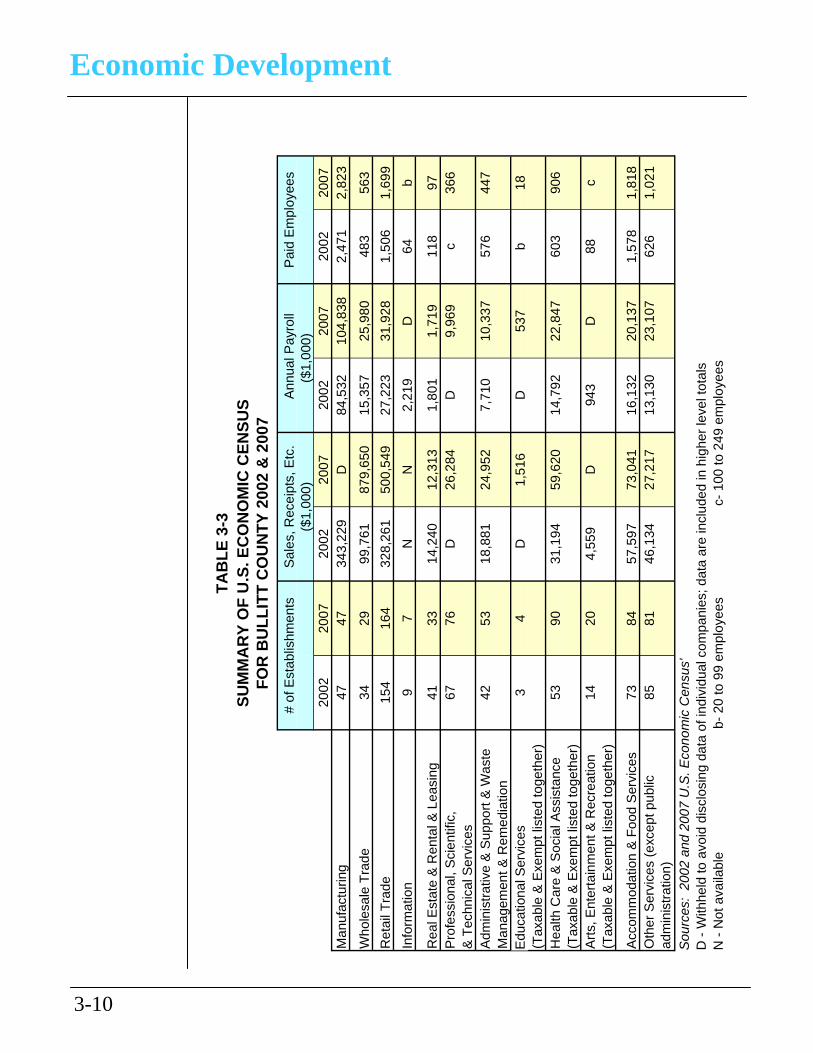
Table 3-3 shows data for all sectors of the Bullitt County economy for
which the 2002 and 2007 U.S. Census data is available at the county level. The
number of establishments for each sector reported is mixed with some sectors in-
creasing and others decreasing in number. The most notable changes from 2002 to
2007 were in the wholesale trade and health care & social assistance sectors of Bul-
litt County’s economy. While the number of wholesale trade establishments de-
creased by five during the period, total sales increased by 782%. The health care
industry experienced a significant increase in the number of establishments and
employment with a 50% increase in paid employees for the period. The number of
health care establishments increased 70%. The “other services” sector had the
greatest increase in the number of paid employees from 626 to 1,021, a 63% in-
crease although the number of establishments actually decreased by four.
3-10
Economic Development
TA
BL
E 3
-3
SU
MM
AR
Y O
F U
.S. E
CO
NO
MIC
CE
NS
US
F
OR
BU
LL
ITT
CO
UN
TY
200
2 &
200
7
# of
Est
ablis
hmen
ts
Sal
es,
Rec
eip
ts, E
tc.
Ann
ual P
ayro
ll P
aid
Em
ploy
ees
($1,
000)
($
1,00
0)
2002
20
07
2002
20
07
2002
20
07
2002
20
07
Man
ufac
turin
g 47
47
34
3,22
9 D
84
,532
10
4,83
8 2,
471
2,82
3
Who
lesa
le T
rade
34
29
99
,761
87
9,65
0 15
,357
25
,980
48
3 56
3
Ret
ail T
rade
15
4 16
4 32
8,26
1 50
0,54
9 27
,223
31
,928
1,
506
1,69
9
Info
rmat
ion
9 7
N
N
2,21
9 D
64
b
Rea
l Est
ate
& R
enta
l & L
easi
ng
41
33
14,2
40
12,3
13
1,80
1 1,
719
118
97
Pro
fess
iona
l, S
cien
tific
, 67
76
D
26
,284
D
9,
969
c 36
6 &
Tec
hnic
al S
ervi
ces
Adm
inis
trat
ive
& S
uppo
rt &
Was
te
42
53
18,8
81
24,9
52
7,71
0 10
,337
57
6 44
7 M
anag
emen
t & R
emed
iatio
n
E
duca
tiona
l Ser
vice
s 3
4 D
1,
516
D
537
b 18
(T
axab
le &
Exe
mpt
list
ed to
geth
er)
Hea
lth C
are
& S
ocia
l Ass
ista
nce
53
90
31,1
94
59,6
20
14,7
92
22,8
47
603
906
(Tax
able
& E
xem
pt li
sted
toge
ther
)
A
rts,
Ent
erta
inm
ent &
Rec
reat
ion
14
20
4,55
9 D
94
3 D
88
c
(Tax
able
& E
xem
pt li
sted
toge
ther
)
Acc
omm
odat
ion
& F
ood
Ser
vice
s 73
84
57
,597
73
,041
16
,132
20
,137
1,
578
1,81
8 O
ther
Ser
vice
s (e
xcep
t pub
lic
85
81
46,1
34
27,2
17
13,1
30
23,1
07
626
1,02
1 ad
min
istr
atio
n)
Sou
rces
: 20
02 a
nd 2
007
U.S
. Eco
nom
ic C
ensu
s'
D -
With
held
to a
void
dis
clos
ing
data
of i
ndiv
idua
l com
pani
es; d
ata
are
incl
uded
in h
ighe
r le
vel t
otal
s
N
- N
ot a
vaila
ble
b- 2
0 to
99
empl
oyee
s c-
100
to 2
49 e
mpl
oyee
s

Economic Development
C o m p r e h e n s i v e P l a n
Bullitt County
3-11
AGRICULTURE
Table 3-4 presents agricultural statistics for Bullitt County. According to the
U.S. Census of Agriculture, there were 519 farms in Bullitt County in 2007, a de-
crease of 20.6% since 1997. In the five years from 2002 to 2007, the number of farm
acres decreased by 16.6% and the number of acres of harvested cropland decreased by
10.2%. The predominate row crops are corn and soybeans. The 2007 Census of Agri-
culture reports that the average size of a farm in Bullitt County is 99 acres with the
median size 44 acres. The average estimated value of all land and buildings per farm
was $373,149 with an estimated market value of $3,786 per acre. The estimated aver-
age value of all machinery and equipment was $48,241 per farm. The total market
value of agricultural products sold in 2007 was $6,291,000 with a $12,122 average per
farm. Of this amount approximately 60% was from crop sales and products (3.76 mil-
lion) and 40% was from animal sales and products (2.53 million). The total income
from farm operations was $741,000. Tables 3-5 shows Bullitt County farms by farm
size. Table 3-6 shows the number of farms by the value of sales.
TABLE 3-5
BULLITT COUNTY FARMS BY SIZE IN
ACREAGE NUMBER 1-9 45
10-49 221 50-179 173 180-499 71 500-999 6 1,000 + 3
TABLE 3-6
FARMS BY VALUE OF SALES IN
VALUE NUMBER < $2,500 265
$2,500 - $4,999 66 $5,000 - $9,999 76
$10-000 - $24,000 64 $25,000 - $49,999 24 $50,000 - $99,999 11
$100,000 < 13
TABLE 3-4
BULLITT COUNTY AGRICULTURAL INFORMATION
YEAR # OF FARMS # OF FARM
ACRES HARVESTED CROPLAND
2007 519 51,148 17,153 2002 616 61,342 19,097 1997 654 61,667 18,272 1992 599 60,911 16,154
Source: Census of Agriculture

3-12
Economic Development
Overall, agriculture represents a relatively small portion of the Bullitt County
economy. Opportunities for growth in agriculture include agritourism such as the
Wine & Bourbon Tour of Bullitt County. This tour includes the Brooks Hill, Milla-
nova, Wight-Meyer and Forest Edge Wineries and the Jim Beam Bourbon Distillery
in Clearmont. There is also a farmer’s market that operates in Mt. Washington from
June to September each year. According to the 2007 Census of Agriculture the total
income from agritourism and recreational services was $6,000 and there were only 25
acres of harvested vegetable acres.
TOURISM
Information on the impact of tourism in Bullitt County can be found in a 2012
study prepared by Certec, Inc. for the Kentucky Tourism, Arts and Heritage Cabinet.
The State of Kentucky is divided into nine tourism and travel regions. Bullitt County
is part of the 15 county Bourbon, Horses & History Region. All nine tourism re-
gions showed gains in revenues between 2011 and 2012. The largest increase oc-
curred in the Bourbon, Horses, & History Region with a 6.3 percent increase be-
tween the two years. According to the study, total tourism and travel expenditures
(both direct and indirect) in Bullitt County were $115,374,615 in 2011 and
$123,360,845 in 2012, a 6.9 percent increase. The total tourism and travel expendi-
tures for the Bourbon, Horses & History Region in 2012 were approximately 3.7 bil-
lion with 2.9 billion in Jefferson County. Bullitt County had the third highest total
expenditures in the region after Jefferson and Hardin Counties. This indicates that the
tourism industry is an important part of the county’s economy. The Jim Beam Ameri-
can Stillhouse Visitor Center in Clermont, which opened in October 2012, had over
100,000 visitors in its first year of operation. This is an increase of some 20,000 visi-
tors to the Jim Beam Distillery from the prior year.
CIVILIAN LABOR FORCE
The civilian labor force is defined as the sum of both employed and unem-
ployed persons 16 years of age and older, excluding armed forces personnel and per-
sons in penal and mental institutions, sanitariums and homes for the aged, infirm, and
needy. Persons “not in the labor force” include those not classified as employed or
unemployed and include retired persons, persons engaged in their own housework,
persons not working while attending school, persons unable to work because of a long
Economic Development
C o m p r e h e n s i v e P l a n
Bullitt County
3-13
term illness, persons discouraged from seeking work because of personal or job mar-
ket factors, and persons who are voluntarily idle.
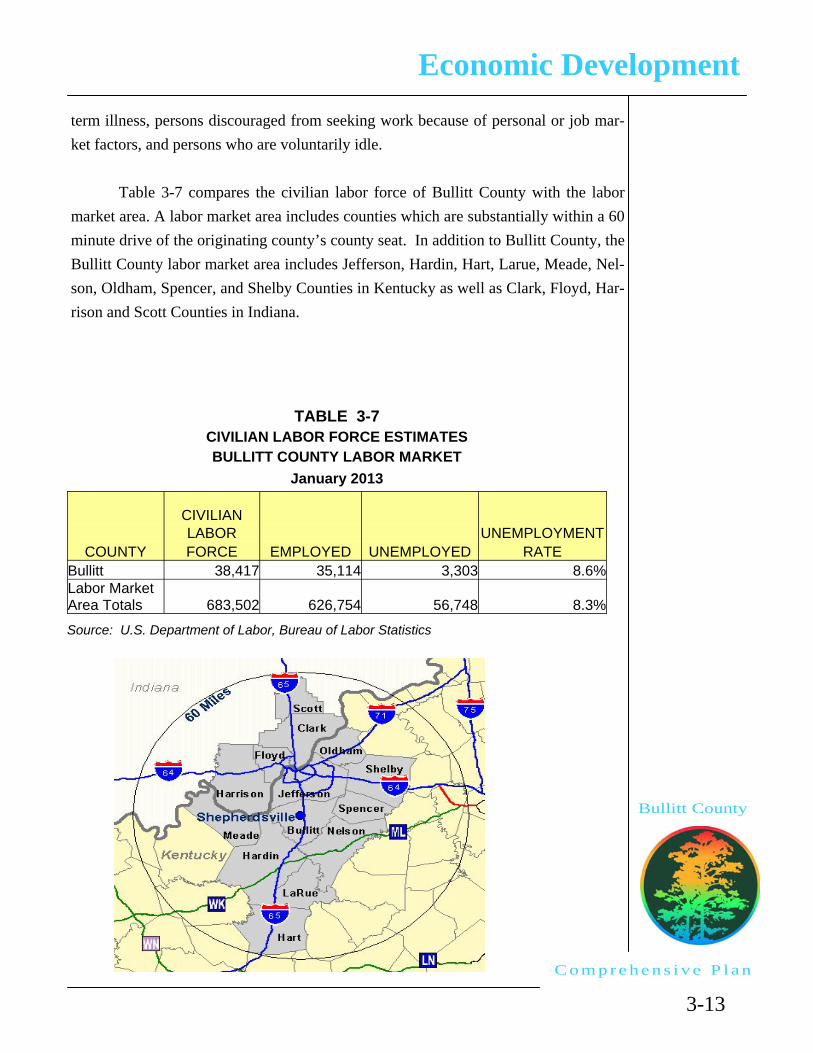
Table 3-7 compares the civilian labor force of Bullitt County with the labor
market area. A labor market area includes counties which are substantially within a 60
minute drive of the originating county’s county seat. In addition to Bullitt County, the
Bullitt County labor market area includes Jefferson, Hardin, Hart, Larue, Meade, Nel-
son, Oldham, Spencer, and Shelby Counties in Kentucky as well as Clark, Floyd, Har-
rison and Scott Counties in Indiana.
TABLE 3-7 CIVILIAN LABOR FORCE ESTIMATES BULLITT COUNTY LABOR MARKET
January 2013
CIVILIAN LABOR UNEMPLOYMENT
COUNTY FORCE EMPLOYED UNEMPLOYED RATE Bullitt 38,417 35,114 3,303 8.6% Labor Market Area Totals 683,502 626,754 56,748 8.3%
Source: U.S. Department of Labor, Bureau of Labor Statistics

3-14
Economic Development
In January of 2013 Bullitt County had a civilian labor force of 38,417 with an
unemployment rate of 8.6%. This is slightly higher than the Bullitt County labor mar-
ket area unemployment rate of 8.3%. Figure 3-3 shows the annual unemployment
rates for the U.S., Kentucky, the Louisville-Jefferson County KY-IN Metropolitan
Statistical Area (Louisville MSA), and Bullitt County over the past five years. Unem-
ployment rates for Bullitt County have typically been slightly higher than the Louis-
ville MSA and the State of Kentucky with the U.S. overall rate lower than local rates.
The Louisville MSA is somewhat different than the Bullitt County Labor Market
Area. It includes Jefferson, Bullitt, Henry, Meade, Nelson, Oldham, Shelby, Spencer
and Trimble Counties in Kentucky as well as Clark, Floyd, Harrison and Washington
Counties in Indiana.
YEAR U.S. KENTUCKY LOUISVILLE MSA BULLITT COUNTY
2007 4.6 5.6 5.3 5.9 2008 5.8 6.6 6.4 7.2 2009 9.3 10.3 10.0 10.7 2010 9.6 10.2 10.2 10.8 2011 8.9 9.5 9.7 10.6 2012 8.1 8.2 Source: Labor Market Statistics, Local Area Unemployment Statistics Program
0.0
1.0
2.0
3.0
4.0
5.0
6.0
7.0
8.0
9.0
10.0
11.0
12.0
FIGURE 3‐3ANNUAL UNEMPLOYMENT RATES
U.S. KENTUCKY
LOUISVILLE MSA BULLITT COUNTY

Economic Development
C o m p r e h e n s i v e P l a n
Bullitt County
3-15
EDUCATION LEVELS
An important characteristic of the labor force is the level of education attained
by the workforce. Table 3-8 shows education levels at the time of the 2011 American
Community Survey. In Bullitt County, 85% of the population 25 years and over were
high school graduates or higher. This compares to 83.1% for Kentucky and 85.9% for
the United States overall. In 2010, 15 % of Bullitt County’s population 25 years and
older had a Bachelor’s degree or higher. These educational levels are lower than the
State of Kentucky (21.1%) and the U. S. (28.5%).
TABLE 3-8
EDUCATION LEVEL 2010
High School Gradu-
ates % Bachelor's De-
gree or Above % Bullitt County 85.0 15.0 Kentucky 83.1 21.1 USA 85.9 28.5
Source: 2011 American Community Survey
COMMUTING PATTERNS
Table 3-9 details the commuting patterns of Bullitt County residents according
to the U.S. Census Bureau. As of 2010 there were 33,495 workers who lived in Bul-
litt County. Only 18.6% also work in Bullitt County with 81.4 % or 27,266 persons
commuting out of the county to work. The majority of Bullitt County residents who
commute travel to Jefferson County to work. Out of 120 Kentucky counties, Bullitt
County was ranked seventh in percentage of its residents commuting out of the county
to work. In 2010, there were 9,489 workers who commuted to Bullitt County to work
representing 60.4% of the workers in Bullitt County. Such large numbers of commut-
ers into and out of the
county undoubtedly
contribute to traffic
congestion.
TABLE 3-9
BULLITT COUNTY COMMUTING PATTERNS
2010 Percent Residents of Bullitt County:
Working and Residing in County 6,229 18.6 Commuting Out of County 27,266 81.4 Total Residents 33,495 100
Employees of Bullitt County Working and Residing in County 6,229 39.6 Commuting Into County 9,489 60.4 Total Employees 15,718 100
Source: US Census Bureau, Journey-to-Work & Migration Statis-tics Branch

3-16
Economic Development
PERSONAL AND HOUSEHOLD INCOME
The U.S. Dept. of Commerce, Bureau of Economic Analysis provides annual
estimates of personal per capita income. Personal per capita income includes income
received from all sources such as wages and salaries, other labor income (employer
contributions to private pension funds, jury and witness fees, etc.) proprietor’s in-
come, rental income, dividend and interest earnings by individuals and transfer pay-
ments not for services rendered (such as food stamps and welfare payments). Per-
sonal contributions for social security are deducted. Table 3-10 shows that the 2011
personal per capita income for Bullitt County is lower than that for Kentucky, the U.S.
and Louisville MSA. It has increased at a faster rate than the U.S. and Louisville
MSA between 2007 and 2011, but slower than the state overall.
TABLE 3-10
PERSONAL PER CAPITA INCOME
PER CAPITA INCOME 2007 2011 % Change
Bullitt County $28,758 $30,533 6.2% Louisville MSA $37,095 $39,037 5.2% Kentucky $31,175 $33,989 9.0% United States $39,506 $41,560 5.2%
Source: U.S. Dept. of Commerce, Bureau of Economic Analysis
The U.S. Census Bureau provides annual estimates of median household in-
come. When median household income is considered, Bullitt County income levels
fare better as shown in Table 3-11. While median household income for the U.S.
overall declined slightly between 2007 and 2011, in Bullitt County it increased at
twice the Kentucky state rate. In 2011 the median household income for Bullitt
County was three percent higher than the U.S. overall and 26.5% higher than the aver-
age for Kentucky.
TABLE 3-11
MEDIAN HOUSEHOLD INCOME
MEDIAN HOUSHOLD INCOME 2007 2011 % Change
Bullitt County $49,861 $52,033 4.4% Kentucky $40,299 $41,141 2.1% United States $50,740 $50,502 -0.5%
Source: US Census Bureau, Small Area Income & Poverty

Economic Development
C o m p r e h e n s i v e P l a n
Bullitt County
3-17
POVERTY RATE
The poverty rate is considered to be the minimum level of monetary income
adequate for families of different sizes in consideration of American consumption pat-
terns. These levels are determined by comparing individual or family income with
annual income thresholds. The income thresholds are adjusted annually. The poverty
rate is the percentage of individuals or families with incomes below the poverty level.
Table 3-12 shows the percent of persons and children in poverty for the US, Kentucky
and Bullitt County. Poverty rates increased at all levels from 2007 to 2011, most
likely due to the economic recession during this period. Poverty rates in Bullitt
County are lower than the overall U.S. rate and significantly lower than the rates for
Kentucky overall.
TABLE 3-12
POVERTY RATES FOR PERSONS & CHILDREN
PERSONS IN POVERTY 2007 2011 Number Rate Number Rate
Bullitt County 7,284 9.9 8,071 10.8 Kentucky 706,947 17.2 809,764 19.1 USA 38,052,247 13.0 48,452,035 15.9
UNDER AGE 18 IN POVERTY 2007 2011 Number Rate Number Rate
Bullitt County 2,316 13.3 3,019 16.7 Kentucky 231,398 23.6 272,115 27.2 USA 13,097,100 18.0 16,386,500 22.5
Source: US Census Bureau, Small Area Income & Poverty Estimates
LOCAL COMMUNITY ECONOMIC DEVELOPMENT ACTIVITIES
A component to the overall economic condition of an area or region is the ex-
tent to which the community engages in economic development activities in order to
promote the area and maintain a diversified economy. The following organizations
are dedicated to assisting Bullitt County in local economic development activities.

3-18
Economic Development
BULLITT COUNTY ECONOMIC DEVELOPMENT AUTHORITY
The Bullitt County Economic Development Authority works towards recruit-
ing new industries and assisting existing industries to expand. It is important that a
county have a diverse mixture of industrial and commercial facilities to allow for
growth. Continued growth of a balanced mix allows an economy to grow and support
expanding populations. The Economic Development Authority is the lead agency in
Bullitt County in support of the needs of small industries and distributors and to sup-
port new industrial developments. The creation of a positive business climate will
assist in the expansion of existing industry and attraction of new industries. In addi-
tion, due to a growing need for commercial growth, the Authority needs to assist in
locations of service industries to provide for the growing population.
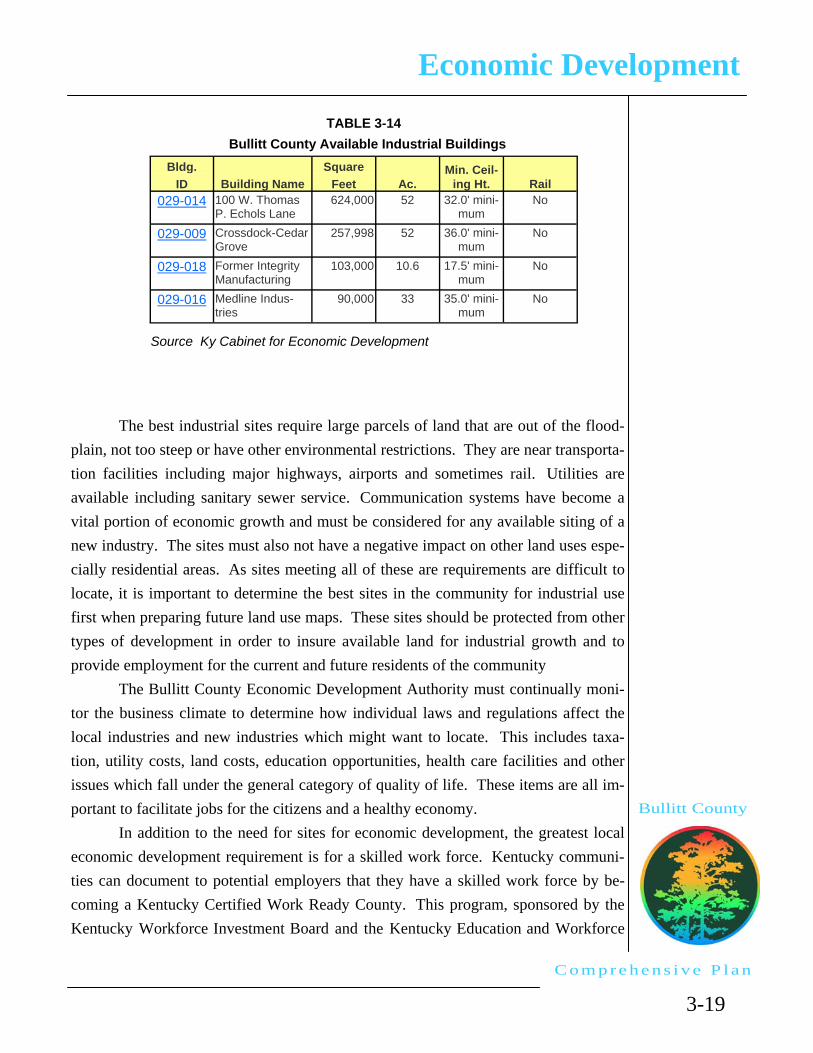
Currently there are seven industrial sites and four industrial buildings listed as
available in Bullitt County on the Kentucky Cabinet for Economic Development web
site as shown on Table 3-13 and 3-14. Sites listed by the Cabinet must be shovel
ready sites of at least 15 acres and meet other criteria. Buildings must be at least
10,000 square feet and ready for occupancy by an industry, corporate office or support
services. There may be other available industrial sites or buildings in Bullitt County
that do not meet the Cabinet’s listing criteria.
TABLE 3-13
Bullitt County Available Industrial Sites
Min. Distance To
Site
Site Name
Total Largest
Rail
Inter-state/
Airport ID Ac. Possible
Tract Parkway 029-009 Lebanon Junc-
tion 143 143 Possible 0.1 26
029-026 Bourbon Trail Industrial Park
221.7 126.9 Possible 1.7 22
029-022 Shepherdsville -- Cedar Grove Business Park Phase 3
134.8 99 No 1.75 14
029-005 Shepherdsville Business Center
133 89 No 0.2 14
029-001 Mt. Washington Business Centre
91.1 75.6 No 6.5 19
029-025 The I-65 Over-look
36 36 No 1.6 29
029-006 Shepherdsville - 56.6 35.9 Possible 0.09 14
Economic Development
C o m p r e h e n s i v e P l a n
Bullitt County
3-19
The best industrial sites require large parcels of land that are out of the flood-
plain, not too steep or have other environmental restrictions. They are near transporta-
tion facilities including major highways, airports and sometimes rail. Utilities are
available including sanitary sewer service. Communication systems have become a
vital portion of economic growth and must be considered for any available siting of a
new industry. The sites must also not have a negative impact on other land uses espe-
cially residential areas. As sites meeting all of these are requirements are difficult to
locate, it is important to determine the best sites in the community for industrial use
first when preparing future land use maps. These sites should be protected from other
types of development in order to insure available land for industrial growth and to
provide employment for the current and future residents of the community
The Bullitt County Economic Development Authority must continually moni-
tor the business climate to determine how individual laws and regulations affect the
local industries and new industries which might want to locate. This includes taxa-
tion, utility costs, land costs, education opportunities, health care facilities and other
issues which fall under the general category of quality of life. These items are all im-
portant to facilitate jobs for the citizens and a healthy economy.
In addition to the need for sites for economic development, the greatest local
economic development requirement is for a skilled work force. Kentucky communi-
ties can document to potential employers that they have a skilled work force by be-
coming a Kentucky Certified Work Ready County. This program, sponsored by the
Kentucky Workforce Investment Board and the Kentucky Education and Workforce
TABLE 3-14
Bullitt County Available Industrial Buildings
Bldg.
Building Name
Square
Ac. Min. Ceil-
ing Ht. Rail ID Feet
029-014 100 W. Thomas P. Echols Lane
624,000 52 32.0' mini-mum
No
029-009 Crossdock-Cedar Grove
257,998 52 36.0' mini-mum
No
029-018 Former Integrity Manufacturing
103,000 10.6 17.5' mini-mum
No
029-016 Medline Indus-tries
90,000 33 35.0' mini-mum
No
Source Ky Cabinet for Economic Development
3-20
Economic Development
Development Cabinet, certifies counties as being work ready by using established
documented criteria such as high school graduation rates, the population’s access to
broadband internet service, community commitment, educational attainment, the num-
ber of National Career Readiness Certificate holders in the county and measurement
of soft skills such as work ethic, attendance/punctuality, communication, teamwork,
leadership and critical thinking. Bullitt County is starting the process to become a
Kentucky Certified Work Ready county at the current time.
BULLITT COUNTY CHAMBER OF COMMERCE
The Bullitt County Chamber of Commerce is located at 295 N. Buckman
Street in Shepherdsville. The Chamber of Commerce offers marketing, networking
and educational opportunities to its members. This group of business leaders encour-
ages and participates in quarterly chamber breaks and ribbon cuttings to welcome and
develop members to be the business voice of the county. The Ambassador Group is
consistently involved in recruiting and maintaining membership. The Woman’s
Council is instrumental in the organization of a monthly luncheon the membership is
invited to attend. There are a variety of speakers that encourage not only entrepreneu-
rial spirit but also philanthropic leadership. There are also committees that organize
Kidsfest, Showcase Bullitt County, career fairs, the golf scramble health fair and an-
nual dinner. Leadership Bullitt County is a monthly program that graduates out-
standing new business leaders to set and carry out new goals to improve the commu-
nity. Recently the Chamber has been directly involved in creating an evolving strate-
gic plan for the county and is working to integrate and enhance the relationship of the
business community with the city and county government.
As of May 2013 the Chamber has approximately 350 members and 15 Board
members. All policies governing the activities and operation of the Chamber are set
by the board of directors. Each member shares an equal vote and is encouraged to
serve on committees. A full time director and professional staff manage the daily op-
eration of the Chamber office.

Economic Development
C o m p r e h e n s i v e P l a n
Bullitt County
3-21
SHEPHERDSVILLE BULLITT COUNTY TOURIST & CONVENTION COM-
MISSION
The Shepherdsville Bullitt County Tourist & Convention Commission pro-
motes tourism in Bullitt County and operates the Paroquet Springs Conference Centre
at 395 Paroquet Springs Drive in Shepherdsville near I-65 Exit 117. There are sepa-
rate directors and staff for tourism and the conference center. The Commission’s
source of funding is primarily a 2% restaurant tax and 4% transient room tax. The 2%
restaurant tax and one percent of the hotel tax goes towards operation of the Confer-
ence Centre. The remaining three percent of the transient room tax provides approxi-
mately $390,000 a year in funding for tourism development.
Tourism marketing activities include operation of a tourist information center
at the Conference Centre. Local tourism is promoted through a tourism web site,
online marketing, print ads, as well as television and radio advertisements. Tourism
staff attend travel and trade shows to promote Bullitt County. Local events are high-
lighted as well as tourism related businesses. The tourism office provides administra-
tive assistance for the Bullitt County Hospitality Association.
The Paroquet Springs Conference Centre attracts many meetings and events to
the City of Shepherdsville. It has 40,000 square feet of banquet, meeting and exhibit
space. The facilities are flexible and can accommodate groups up to 1500. There are
break-out rooms for small meetings and 12,000 square feet of exhibition space for lar-
ger events. The Banquet Room can comfortably seat 200 to 300 persons. There are
complete audio-visual capabilities throughout the Centre and full scale catering ser-
vices in house.