bulk sediment q and q in the mississippi embayment ... sediments qp.pdfbulletin of the seismological...
TRANSCRIPT

2162
Bulletin of the Seismological Society of America, Vol. 95, No. 6, pp. 2162–2179, December 2005, doi: 10.1785/0120050047
Bulk Sediment Qp and Qs in the Mississippi Embayment,
Central United States
by Charles A. Langston, Paul Bodin, Christine Powell, Mitch Withers,Steve Horton, and Walter Mooney
Abstract We have estimated P-wave and S-wave anelastic attenuation coefficientsfor the thick, unconsolidated sediments of the Mississippi embayment, central UnitedStates, using the spectral distance decay of explosion P and Rayleigh waves. Thesediment-trapped P wave, Psed, is observed to ranges of 80 km at 10 Hz, and 1-HzRayleigh waves are observed out to 130 km from a 5000-lb borehole explosion inthe northern part of the embayment. Rayleigh waves of 4 Hz are seen to distancesof 3 km from a smaller 50-lb explosion. Analysis of the group velocity and amplitude-distance decay of both waves yields an average Qs of 100 and Qp of 200 for embay-ment sediments that are independent of frequency. Scatter in the Q estimates comesfrom interference of multiple P-wave reverberations and Rayleigh-wave modes. Theattenuation model is self-consistent in that it is the same as obtained by the analysisof synthetic seismograms using the inferred Q-values. Inferred Qp and Qs values aremore than three times higher than previous estimates and imply that unconsolidatedsediments of the embayment do not significantly attenuate small-strain earthquakeground motions. These estimates represent a lower bound to Q of the sediments sincesignificant scattering is observed in the waveform data that contributes to the distancedecay of wave amplitude. Higher Q values also imply that the unconsolidated sedi-ments of the embayment will form an efficient wave guide for surface waves radiatedfrom shallow earthquakes or large earthquakes that rupture into the sediments, pro-ducing high-amplitude, long-duration wave trains that should be considered in earth-quake hazard assessments.
Introduction
The effect of site conditions is a major issue in evalu-ating the hazards due to strong ground shaking in large earth-quakes. Numerous studies have noted both the amplificationand attenuation effects of deep, unconsolidated sediments onearthquake ground motions (e.g., see Aki, [1988] for an his-torical review). Conventional seismological wisdom sug-gests that the large observed decrease in seismic impedanceof unconsolidated sediments relative to underlying basementrocks serves to significantly amplify a vertically propagatingshear wave. On the other hand, there are suggestions fromstrong-motion observations that sediments can significantlyattenuate high-frequency body waves because of large in-trinsic attenuation. Such large intrinsic attenuation may be aproperty of porous, fluid-filled unconsolidated media or maybe a natural consequence of nonlinear, strain-dependent deg-radation of the shear modulus at high seismic strains (Vuc-etic, 1994).
These issues are particularly important for a large areain the central United States surrounding the New MadridSeismic Zone (NMSZ). The NMSZ is an area of high seismic
hazard based on historical accounts of the 1811–1812 seis-mic sequence (Nuttli, 1973; Johnston and Schweig, 1996)and the geological evidence suggesting the occurrence oflarge magnitude earthquakes with a recurrence interval ofapproximately 500 years (Kelson et al., 1996; Tuttle andSchweig, 1999; Tuttle et al., 2000). Compounding the prob-lem of an active source zone is the near-surface geologicalstructure. The NMSZ is blanketed with a thick layer of upperCretaceous to Recent unconsolidated sediments that are asthick as 1 km under the metropolitan area of Memphis, Ten-nessee (Stearns, 1957; Stearns and Marcher, 1962; Self,1993). A number of empirical studies have suggested thatthese sediments have a significant amplification effect onseismic waves propagating up through them (e.g., Bodin andHorton, 1999; Bodin et al., 2001; Langston, 2003a). Yet,other studies suggest that the unconsolidated sediments arehighly attenuating for high-frequency seismic waves. Bulksediment anelasticity determined in several studies of earth-quake P- and S-wave spectra from 2 to 25 Hz is quite sig-nificant with Qs values ranging from 25 to 40 and Qp values
Bulk Sediment Qp and Qs in the Mississippi Embayment, Central United States 2163
ranging from 25 to 60 (e.g., Liu et al. 1994; Chen et al.1994). Local geotechnical determinations involving analysisof refracted wave pulse widths yield small values of 10–30for Qs for the upper 30 m of the sediments (Wang et al.,1994) and recent VSP results have yielded 22–34 for Qs forthe upper 60 m (Pujol et al., 2002). These geotechnical stud-ies analyzed controlled source shear-wave data in frequencybands above 25 Hz. Other common engineering attenuationmodels suggest that bulk Qs values may be as low as 10based on spectral analysis of local earthquake (small strain)data in the embayment (Hashash and Park, 2001; Park,2003). Such low Qs values may attenuate 5-Hz shear wavesby as much as 40% or more as they propagate up throughthe sediments, completely counteracting wave amplificationdue to the decrease in seismic impedance.
Recently, Langston (2003a,b) showed that the Sp/Sspectral method, the basis of many of the previous Qs andQp estimates, is actually insensitive to anelasticity becauseof significant near-surface site resonance effects. There areno measurements of Qs or Qp for the entire unconsolidatedsedimentary column in the embayment that are independentof major biasing assumptions on the propagation of seismicbody waves.
The purpose of this article is to present a method andresults for determining the bulk Qs and Qp for thick sedi-ments based on the analysis of Rayleigh waves and P wavesgenerated by large controlled source explosions. Thismethod capitalizes on the fact that unconsolidated sedimentshave very low wave velocities so that observation of highfrequency P or Rayleigh waves at large distances greatlyconstrains the average attenuation of the structure. We willuse observations of the trapped sedimentary P wave, Psed, toplace strong constraints on Qp in the frequency band of 3 to10 Hz and observations of 0.4- to 4-Hz Rayleigh wavesto place equally strong constraints on Qs. The method isloosely based on a standard seismological technique for de-termining the distance attenuation of fundamental modeRayleigh waves that is routinely used for long-period earth-quake data interpretation (Aki and Richards, 1980) and oc-casionally used for site-specific studies (e.g., Barker andStevens, 1983). However, we use large explosions detonatedwithin the Mississippi embayment to create high frequencyRayleigh waves and use the redundancy of data availablefrom many permanent and temporary stations at various dis-tances from the source to determine the average distanceattenuation coefficient. The measured group velocities anddistance attenuation coefficients with standard errors arethen used to solve for bulk and attenuation.�1 �1Q Qs p
The physical interpretation of attenuation measurementsis an important issue to be addressed in this work. The em-pirical measurement of apparent anelastic attenuation of aparticular wave always depends on the wave propagationmodel for the wave. For both P and Raleigh waves we willbe using very simple assumptions related to mode and raytheory. However, anelastic attenuation should be a seismo-logical material property of earth structure much like P-wave
or S-wave velocity. Empirical attenuation values will bemodeled using simple layered anelastic velocity models forthe embayment sediments. Synthetic seismograms will becomputed and processed in the same manner as the data asa self-consistency check on the empirically derived attenu-ation values.
We will show that attenuation for the entire sedimentarycolumn is considerably less (i.e., higher Qp and Qs) than hasgenerally been assumed. This has important implications forseismic hazards studies and for seismic hazards in the NMSZ.
The Embayment Seismic Excitation Experiment(ESEE)
Our study (ESEE) was a joint experiment conducted bythe Center for Earthquake Research and Information (CERI)at the University of Memphis and the Active Source Groupat the U.S. Geological Survey (USGS), Menlo Park, Califor-nia (Langston et al., 2002a). The experiment consisted ofthe detonation of chemical explosives emplaced in the lower30 m of 50-m-deep, 20.3-cm (8-in.) steel-cased boreholes.Two sources were employed. On the night of 29 October2002, a 1134 kg (2500 lb) single borehole explosion wasdetonated near Mark Tree, Arkansas (Fig. 1). The next nighta 2268 kg (5000 lb), simultaneous two-borehole explosionwas detonated near Mooring, Tennessee, near the center ofthe NMSZ. Table 1 contains the pertinent source parametersfor the explosions. The smaller explosion had an estimatedlocal magnitude (ML) of 2.8, as recorded by stations of thecooperative New Madrid network, and the larger explosionwas seen to be equivalent to an ML 3.1. The geometry andstyle of the experiment was similar to refraction experimentsperformed by the USGS in the 1980s and early 1990s withinthe NMSZ (Ginzberg et al., 1983; Mooney et al., 1983;Catchings, 1999).
Unlike past refraction experiments, however, the pur-pose of the ESEE was to generate seismic Rayleigh wavesthat could be used to estimate the anelastic attenuation ofthe unconsolidated embayment sediments. Rayleigh waveswere observed from the earlier USGS refraction experiments,and an initial analysis of velocity and attenuation structuresuggested that amplitudes for 0.3- to 5-Hz Rayleigh wavesshould be quite sensitive to anelastic attenuation in the thicklow-velocity embayment sediments. The ESEE explosionswere recorded by approximately 90 short-period and 12broadband stations of the cooperative New Madrid seismicnetwork and by 9 additional temporary broadband stationsthat were deployed to fill in the permanent broadbandnetwork. Each explosion was also monitored by a three-component K2 accelerograph positioned approximately80 m from the shotpoint and by a linear array of 8 three-component K2 accelerographs situated 2.6 km from theMarked Tree source and 1.2 km from the Mooring explo-sion. Strong motion data from the accelerographs will betreated in a companion report. Here we concentrate on theanalysis of the far-field broadband data to derive the ampli-

2164 C. A. Langston, P. Bodin, C. Powell, M. Withers, S. Horton, and W. Mooney
Figure 1. Index map of the New Madrid Seismic Zone in the central United States showingpolitical boundaries, shaded topographic relief, CERI short-period seismic stations (closed tri-angles), CERI broadband seismic stations (open squares), and temporary broadband seismicstations (closed squares). Shot points for the ESEE explosions are shown as stars and are an-notated. Earthquakes of the NMSZ are plotted as gray circles. ESEE was designed to explorethe effects of sediment velocity and attenuation structure within the NMSZ.
Bulk Sediment Qp and Qs in the Mississippi Embayment, Central United States 2165
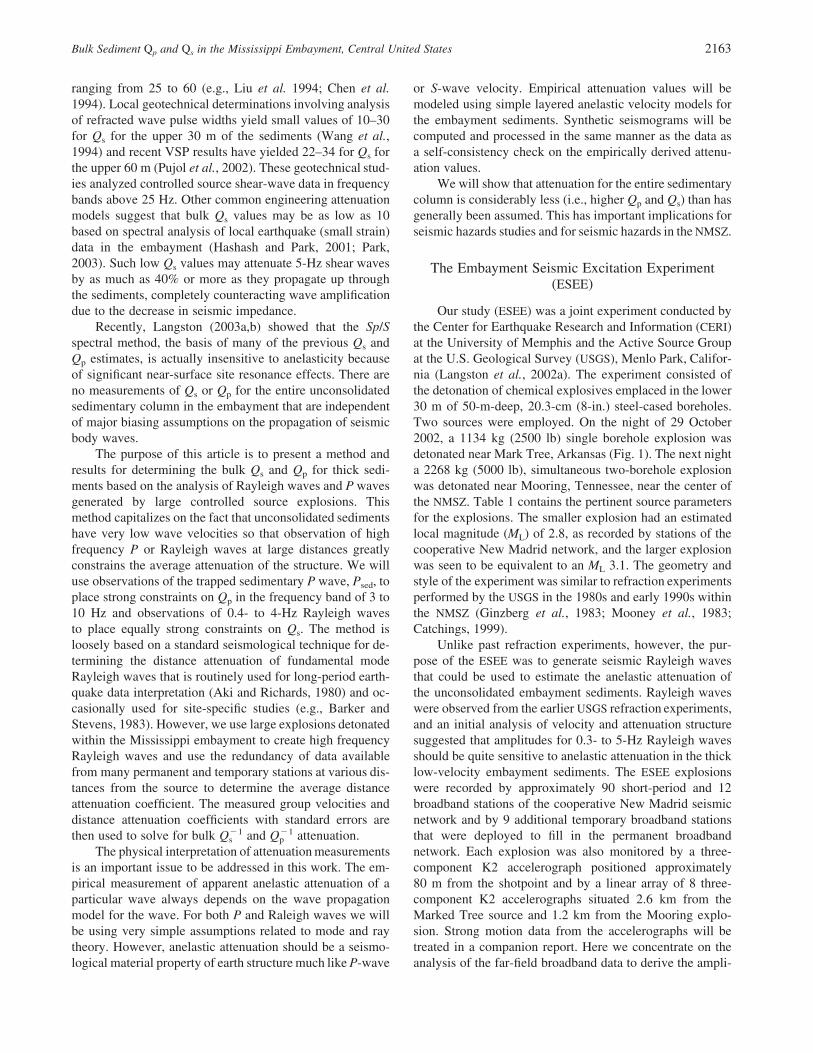
Figure 2. Example of vertical component broadband displacement data showingPsed and Rayleigh waveforms from the Mooring explosion. The character of the seis-mograms is almost entirely controlled by wave propagation within the thick uncon-solidated sediments of the Mississippi embayment.
Table 1Explosion Parameters
LocationDate
(mm/dd/yyyy) Time (UTC)Latitude
(�N)Longitude
(�W)Size(kg)
Marked Tree, Arkansas 10/29/2002 03:40:00.025 35.46031 90.56528 1134Mooring, Tennessee 10/30/2002 04:00:00.025 36.33211 89.58719 2268Marion, Arkansas 04/27/2001 19:02:01.226 35.23014 90.26625 23
tude-distance decay of Rayleigh waves and the trapped Psed
wave that are confined to the unconsolidated sediments.Examples of these waves are shown in Figure 2. Psed is
best seen in the 3- to 10-Hz frequency band and consists ofmultiple turning waves and reflections from the base of theunconsolidated sediments. It has a characteristic group ve-locity of 1.8 to 2.0 km/sec, is generally larger than first ar-riving refraction P-wave phases, and has been observed inpast refraction experiments in the area (e.g., Mooney et al.,1983). Rayleigh waves show normal dispersion and are larg-est in the 1- to 2-Hz frequency band. Rayleigh waves fromthe 5000-lb explosion were detected at 130-km distancewithin the embayment. Figure 3 shows a constructed pseudo-
profile of filtered vertical displacement data. Short-periodembayment Rayleigh waves travel at group velocities of250–500 m/sec causing surprisingly long-duration wavetrains.
Marion, AR, Test Explosion
Rayleigh wave data from a small 23-kg (50-1b) chem-ical explosion were collected in April 2001 for an irregularprofile away from a sand pit near Marion, Arkansas (Fig. 1,Table 1). A student field opportunity arose when CERI net-work personnel were contacted by the owners of an explo-sives company who were disposing of old chemical explo-

2166 C. A. Langston, P. Bodin, C. Powell, M. Withers, S. Horton, and W. Mooney
Figure 3. Pseudoprofile of filtered, vertical-component Rayleigh-wave data as afunction of distance. The data have been bandpassed filtered between 0.4 and 1.5 Hzto show the prominent short-period sediment Rayleigh waves. A travel-time line for agroup velocity of 500 m/sec is plotted on the profile.
sives. An array of 11 three-component K2 accelerographswere deployed in a profile from 14-kg and 23-kg surfaceexplosions. Figure 4 shows ground velocity derived fromvertical acceleration observations from the 23-kg explosion.Rayleigh waves of 1–4 Hz propagate to a distance of 3 kmfrom the shot and have group velocities less than 300 m/sec,attesting to the very low shear-wave velocities observed inthe upper 100 m of the unconsolidated sediments.
Empirical Qp and Qs Analysis
The unconsolidated sediments of the embayment forma very effective seismic wave guide. Figure 5 shows asmoothed version of the velocity model developed by Lang-ston (2003a). Model parameters are tabulated in Table 2. Theaverage properties of this model were constrained using anacoustic well log and travel times of observed earthquakebody-wave phases. The Vp/Vs ratio is well constrained bythe travel-time data and show very high values of 3 or more.The base of the wave guide consists of high-velocity car-bonate rocks. Because seismic-wave velocities generally in-
crease with depth, diving P waves from a surface source willrefract upwards in the structure and surface waves will benormally dispersed. It can be easily shown using group ve-locity dispersion curves that surface waves in the frequencyband of 0.3 to 4 Hz will consist of many interfering highermodes in addition to the fundamental mode. Indeed, a lookat the data in Figure 2 or Figure 3 shows that surface wavesconsist of several different group arrivals with distance in-dicative of the interference of higher and fundamental modesurface waves.
Broadband stations that recorded the explosions arebroadly distributed within the embayment (Fig. 1). Sedimentthickness changes from approximately 500 m to 1000 m overthis station distribution. Stations are not confined to a single,simple linear profile from the sources. Thus, the body wavesand surface waves generally sample different velocity struc-ture in detail, depending on the location of the source andseismic stations.
Ideally, the analysis of the waveforms must take intoaccount complexity of multimode surface-wave propagationand recognize that structure is heterogeneous and changing

Bulk Sediment Qp and Qs in the Mississippi Embayment, Central United States 2167
Figure 4. Pseudoprofile of derived vertical-component velocity from accelerographrecordings of the 23-kg Marion explosion showing the sediment P wave and long wavetrains of the dispersed high-frequency Rayleigh waves. These Rayleigh waves wereused to explore distance-attenuation at higher frequencies.
depending on the source to receiver path. However, the ef-fect of attenuation is so large that these issues of heteroge-neity and wave propagation amount to second-order effectsin the estimate. The approach used here is to cautiouslyadopt several simplifying assumptions in order to estimateanelastic attenuation, and then to validate these assumptionsusing synthetic seismograms for an explosion source inplane-layered structure.
The first simplifying assumption is that the observedsurface waves can be treated as fundamental mode surfacewaves in plane layered media. The vertical displacement am-plitude spectrum for a fundamental mode Rayleigh wave isgiven by
�crˆ|A(x)|e|w(x)| � , (1)1/2r
where we are using the temporal Q formulation (Aki andRichards, 1980, pp. 296–298) that incorporates group veloc-ity, U, into the distance-attenuation coefficient, c, by
x pfc � � . (2)
2UQ UQ
Temporal Q is used because group velocity may be mea-sured from wave group arrivals at individual stations. Thenetwork is too sparse to measure phase velocity.
The data are analyzed by forming a pseudoprofile withdistance, bandpass filtering around a central frequency, com-puting the envelope of the signal using the modulus of theanalytic signal (Farnbach, 1975), and then manually pickingthe arrival time and amplitude of the peak of the envelopefunction. Choice of central frequencies for each bandpassfilter are shown in later figures, are tabulated in Table 3, andwere primarily defined by the available signal-to-noise ratioin the data. The bandpass filter consisted of zero-phase, two-pole butterworth filters with corner frequencies definedaround �5% of the central frequency. Group velocity wasdetermined by computing the slope of the linear time-distance regression fit of the data. The distance attenuationcoefficient was computed by first correcting the amplitudedata for r�1/2 geometrical spreading and then computing the

2168 C. A. Langston, P. Bodin, C. Powell, M. Withers, S. Horton, and W. Mooney
Figure 5. A layered velocity model derived fromLangston (2003a) used to construct synthetic seis-mograms in this paper. Note the large variation in Vp/Vs ratio with depth reflecting large changes in poros-ity within the sediment column. Model parameters aretabulated in Table 2.
Table 2Sediment Velocity Model
Vp
(km/sec)Vs
(km/sec)Density(gm/cc)
Layer Thickness(km)
1.51000 0.29330 1.67870 0.061.60000 0.39220 1.75580 0.041.69858 0.48148 1.81542 0.041.73872 0.51490 1.83594 0.041.86626 0.61454 1.89254 0.041.99781 0.71072 1.94192 0.041.98329 0.70034 1.93680 0.041.97002 0.69080 1.93206 0.041.97232 0.69245 1.93288 0.042.09177 0.77691 1.97350 0.041.95497 0.67993 1.92660 0.041.98876 0.70426 1.93874 0.042.10138 0.78359 1.97660 0.042.01234 0.72107 1.94698 0.041.98906 0.70447 1.93885 0.042.04542 0.74447 1.95825 0.042.14475 0.81358 1.99028 0.042.56665 1.09626 2.10592 0.042.65975 1.15745 2.12840 0.042.54404 1.08136 2.10033 0.042.73649 1.20775 2.14631 0.042.70346 1.18611 2.13867 0.046.10000 3.50000 2.70000 —
slope of the linear fit of the natural log-amplitude-distancedata. The statistics of the fit were determined using standardregression formulas.
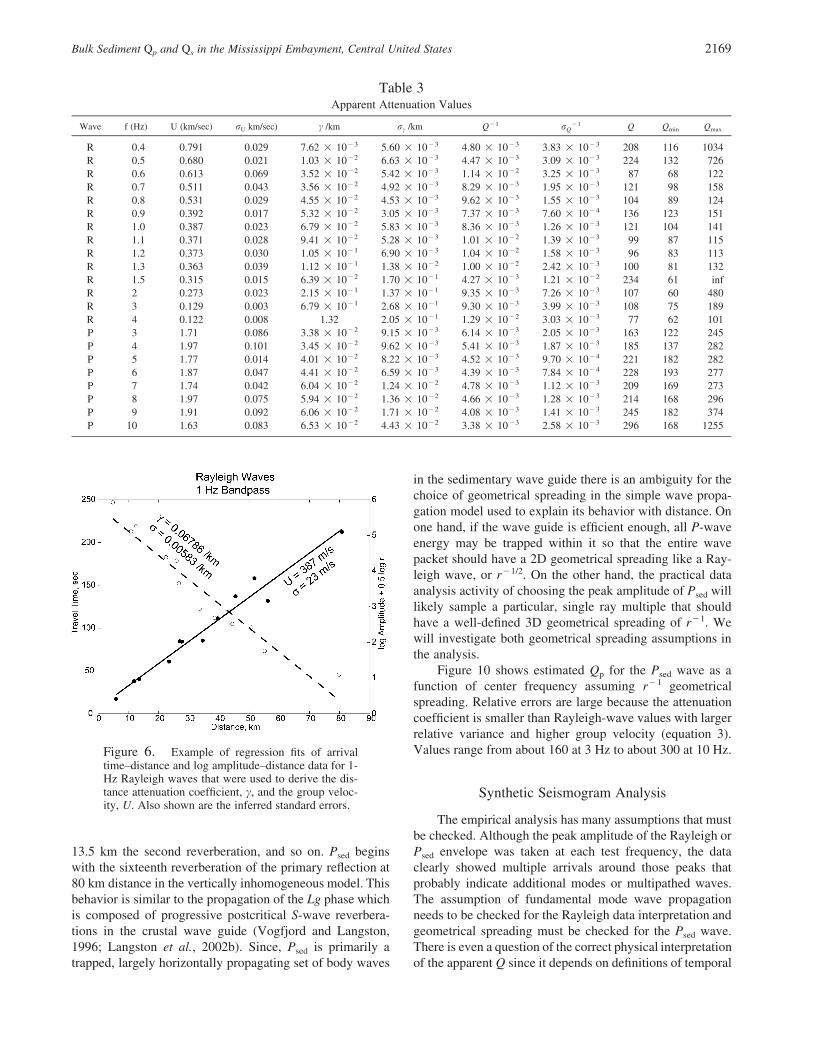
Figure 6 shows an example result for the 1-Hz bandpassof broadband Rayleigh-wave data. The scatter of travel-time
and log-amplitude data about the straight line fit gives anindication of the nature of velocity heterogeneity in the em-bayment. The waveform data for stations at distances greaterthan 20 km showed multiple interfering arrivals that wereprobably due to interfering higher modes or wave multipath-ing due to velocity heterogeneity. Even so, the Rayleighwaves were observed to travel at such low group velocitiesthat picking other adjacent amplitude peaks had little effecton group velocity or distance decay estimates. Use of all ofthe time and amplitude data to determine these parametersseems to be a reasonable approach since the standard errorsin the fit were generally less than 10% (Table 3) and therewere no significant deviations from a linear relationship.
The apparent attenuation at each frequency, Q�1, wasderived from equation (2) having the estimates of U and c.The standard error in the apparent attenuation can be foundfrom a perturbation analysis of equation (2) using the stan-dard errors from the linear fit for U and c (rU and rc, re-spectively). The result is
[r U � r c � r r ]c U c U�1r � . (3)Q
pf
This was used to determine the error in attenuation displayedin Table 3 and the error bars in subsequent plots.
Figure 7 shows the result for the Rayleigh-wave dis-tance attenuation coefficient, c, plotted against center fre-quency. Each coefficient has relatively small error, and thetrend of coefficients versus frequency is nearly linear, im-plying that Q�1 is roughly constant with frequency. Becausesediment wave velocities are so low the group velocity isalso well determined (Fig. 8, Table 3). Combining the groupvelocity and distance attenuation coefficient to compute ap-parent Q yields the results shown in Figure 9. Assuming thatthe apparent Q is most closely related to Qs is reasonablebased on past Rayleigh wave studies but should be treatedas a working hypothesis at this point. Figure 9 also includesresults from analyzing the data from the 23-kg surface ex-plosion recorded near Marion, Arkansas (Fig. 4). Interme-diate results for the small explosion are not shown but aretabulated in Table 3.
The same empirical processing scheme was applied to3-to 10-Hz Psed waves observed in the ESEE vertical com-ponent data except for a different assumed geometricalspreading relationship. Psed is generally composed of post-critical multiple reflections in the unconsolidated sedimentwave guide. Ray theory computations for the model of Fig-ure 5 show that the small positive velocity gradient in themodel causes progressive, postcritical P-wave reverbera-tions to cut out about every 4.5 km in distance from thesource. Under this interpretation, the beginning of the Psed
wave is a different P wave reverberation for differing dis-tances. From 0 to 4.5 km it is composed of the primaryreflection, from 4.5 to 9 km the first reverberation of theprimary reflection within the sediment column, from 9 to
Bulk Sediment Qp and Qs in the Mississippi Embayment, Central United States 2169
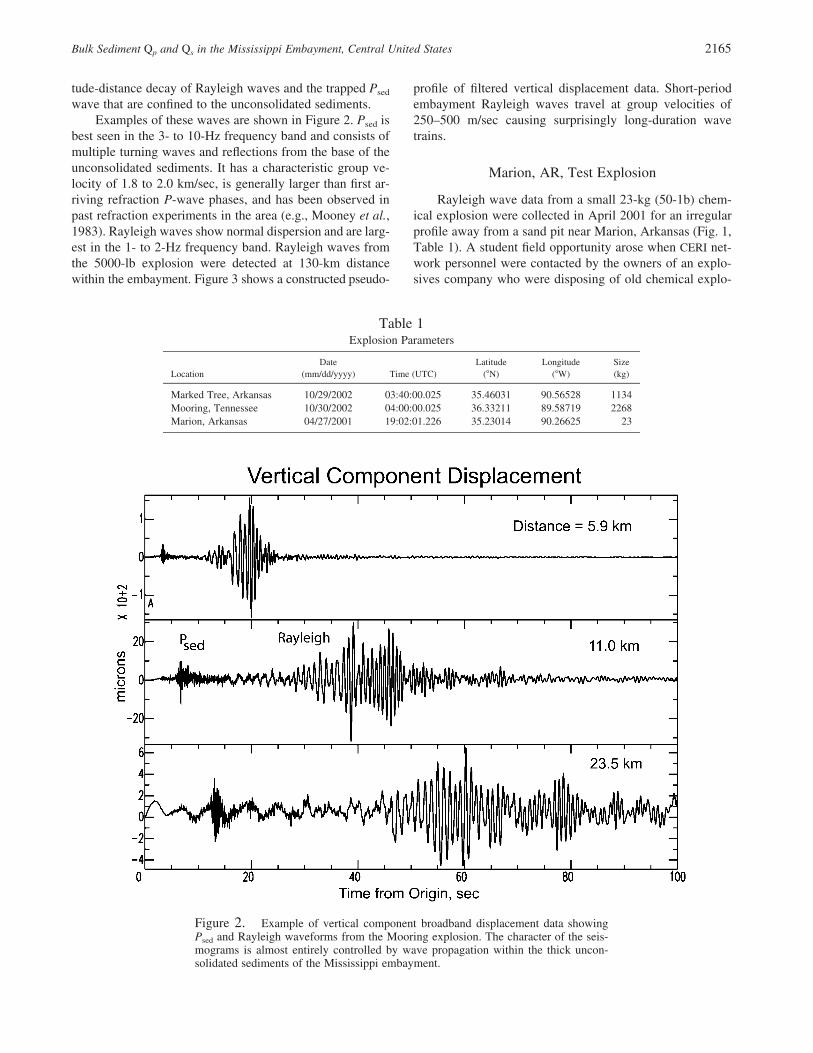
Table 3Apparent Attenuation Values
Wave f (Hz) U (km/sec) rU km/sec) c /km rc /km Q�1 rQ�1 Q Qmin Qmax
R 0.4 0.791 0.029 7.62 � 10�3 5.60 � 10�3 4.80 � 10�3 3.83 � 10�3 208 116 1034R 0.5 0.680 0.021 1.03 � 10�2 6.63 � 10�3 4.47 � 10�3 3.09 � 10�3 224 132 726R 0.6 0.613 0.069 3.52 � 10�2 5.42 � 10�3 1.14 � 10�2 3.25 � 10�3 87 68 122R 0.7 0.511 0.043 3.56 � 10�2 4.92 � 10�3 8.29 � 10�3 1.95 � 10�3 121 98 158R 0.8 0.531 0.029 4.55 � 10�2 4.53 � 10�3 9.62 � 10�3 1.55 � 10�3 104 89 124R 0.9 0.392 0.017 5.32 � 10�2 3.05 � 10�3 7.37 � 10�3 7.60 � 10�4 136 123 151R 1.0 0.387 0.023 6.79 � 10�2 5.83 � 10�3 8.36 � 10�3 1.26 � 10�3 121 104 141R 1.1 0.371 0.028 9.41 � 10�2 5.28 � 10�3 1.01 � 10�2 1.39 � 10�3 99 87 115R 1.2 0.373 0.030 1.05 � 10�1 6.90 � 10�3 1.04 � 10�2 1.58 � 10�3 96 83 113R 1.3 0.363 0.039 1.12 � 10�1 1.38 � 10�2 1.00 � 10�2 2.42 � 10�3 100 81 132R 1.5 0.315 0.015 6.39 � 10�2 1.70 � 10�1 4.27 � 10�3 1.21 � 10�2 234 61 infR 2 0.273 0.023 2.15 � 10�1 1.37 � 10�1 9.35 � 10�3 7.26 � 10�3 107 60 480R 3 0.129 0.003 6.79 � 10�1 2.68 � 10�1 9.30 � 10�3 3.99 � 10�3 108 75 189R 4 0.122 0.008 1.32 2.05 � 10�1 1.29 � 10�2 3.03 � 10�3 77 62 101P 3 1.71 0.086 3.38 � 10�2 9.15 � 10�3 6.14 � 10�3 2.05 � 10�3 163 122 245P 4 1.97 0.101 3.45 � 10�2 9.62 � 10�3 5.41 � 10�3 1.87 � 10�3 185 137 282P 5 1.77 0.014 4.01 � 10�2 8.22 � 10�3 4.52 � 10�3 9.70 � 10�4 221 182 282P 6 1.87 0.047 4.41 � 10�2 6.59 � 10�3 4.39 � 10�3 7.84 � 10�4 228 193 277P 7 1.74 0.042 6.04 � 10�2 1.24 � 10�2 4.78 � 10�3 1.12 � 10�3 209 169 273P 8 1.97 0.075 5.94 � 10�2 1.36 � 10�2 4.66 � 10�3 1.28 � 10�3 214 168 296P 9 1.91 0.092 6.06 � 10�2 1.71 � 10�2 4.08 � 10�3 1.41 � 10�3 245 182 374P 10 1.63 0.083 6.53 � 10�2 4.43 � 10�2 3.38 � 10�3 2.58 � 10�3 296 168 1255
Figure 6. Example of regression fits of arrivaltime–distance and log amplitude–distance data for 1-Hz Rayleigh waves that were used to derive the dis-tance attenuation coefficient, c, and the group veloc-ity, U. Also shown are the inferred standard errors.
13.5 km the second reverberation, and so on. Psed beginswith the sixteenth reverberation of the primary reflection at80 km distance in the vertically inhomogeneous model. Thisbehavior is similar to the propagation of the Lg phase whichis composed of progressive postcritical S-wave reverbera-tions in the crustal wave guide (Vogfjord and Langston,1996; Langston et al., 2002b). Since, Psed is primarily atrapped, largely horizontally propagating set of body waves
in the sedimentary wave guide there is an ambiguity for thechoice of geometrical spreading in the simple wave propa-gation model used to explain its behavior with distance. Onone hand, if the wave guide is efficient enough, all P-waveenergy may be trapped within it so that the entire wavepacket should have a 2D geometrical spreading like a Ray-leigh wave, or r�1/2. On the other hand, the practical dataanalysis activity of choosing the peak amplitude of Psed willlikely sample a particular, single ray multiple that shouldhave a well-defined 3D geometrical spreading of r�1. Wewill investigate both geometrical spreading assumptions inthe analysis.
Figure 10 shows estimated Qp for the Psed wave as afunction of center frequency assuming r�1 geometricalspreading. Relative errors are large because the attenuationcoefficient is smaller than Rayleigh-wave values with largerrelative variance and higher group velocity (equation 3).Values range from about 160 at 3 Hz to about 300 at 10 Hz.
Synthetic Seismogram Analysis
The empirical analysis has many assumptions that mustbe checked. Although the peak amplitude of the Rayleigh orPsed envelope was taken at each test frequency, the dataclearly showed multiple arrivals around those peaks thatprobably indicate additional modes or multipathed waves.The assumption of fundamental mode wave propagationneeds to be checked for the Rayleigh data interpretation andgeometrical spreading must be checked for the Psed wave.There is even a question of the correct physical interpretationof the apparent Q since it depends on definitions of temporal

2170 C. A. Langston, P. Bodin, C. Powell, M. Withers, S. Horton, and W. Mooney
Figure 7. Summary of the Rayleigh-wavedistance attenuation coefficient versus fre-quency.
Figure 8. Summary of observed (circles)and synthetic (triangles) apparent Rayleigh-wave group velocity as a function of fre-quency.
and spatial attenuation for dispersed waves. Qp and Qs areusually defined as specific elastic layer parameters in wavepropagation codes and have clear physical meaning as theanelastic material property. The apparent Q values deter-mined from the data are, at best, smoothed averages of someQp and Qs profile with depth (Ben-Menahem and Singh,1978).
We use a modified Filon method for wavenumber in-tegration of the response of a moment-tensor point sourcein plane-layered media (Apsel, 1979; Barker, 1984). The
displacement response for an isotropic point source at 35-mdepth in the model displayed in Figure 5 was computed forranges between 10 and 100 km. Causal anelasticity is in-cluded in the computation through use of the Futterman(1962) attenuation operator where complex velocity, Veff, isintroduced through
1 1 1 c x i0� 1 � ln � (4)� � � �v v pQ x 2Qeff 0

Bulk Sediment Qp and Qs in the Mississippi Embayment, Central United States 2171
Figure 9. Summary of apparent Qs for theRayleigh-wave data from ESEE and the Marionexplosion as a function of frequency. The min-imum and maximum values were computedfrom the standard errors inferred from Q�1
shown in Table 3.
Figure 10. Summary of apparent Qp for thePsed data from ESEE. Same scheme as Figure 9.
and where v is the elastic velocity (Vp or Vs), Q is either Qp
or Qs, c0 is Euler’s constant, and x0 is a low-frequency cutofffrequency for the attenuation band.
A variety of Q models were assumed in the syntheticseismogram computations. The simplest model was for con-stant Qp and Qs where we parsimoniously assume constantvalues of 200 and 100, respectively. These values seem rea-sonable considering the error bars in the data shown in Fig-
ures 9 and 10. Subjecting the synthetic seismograms(Fig. 11) to the same analysis for apparent distance attenu-ation and group velocity yields the group velocity resultsshown in Figure 8, Qs results from Rayleigh waves in Figure12, and Qp results from Psed waves in Figure 13.
First we note that the synthetic seismograms generallyyielded unambiguous estimates of group velocity from themaximum amplitude peaks of Rayleigh waves as a function

2172 C. A. Langston, P. Bodin, C. Powell, M. Withers, S. Horton, and W. Mooney
Figure 11. Bandpass-filtered synthetic seismograms computed for the sedimentmodel shown in Figure 5. Same scheme as Figure 3.
Figure 12. Apparent Qs inferred from thesynthetic Rayleigh waves. The dotted lineshows the input model value. Qs is generallyunderestimated because of the interference ofhigher mode Rayleigh waves at closer dis-tances.
Bulk Sediment Qp and Qs in the Mississippi Embayment, Central United States 2173
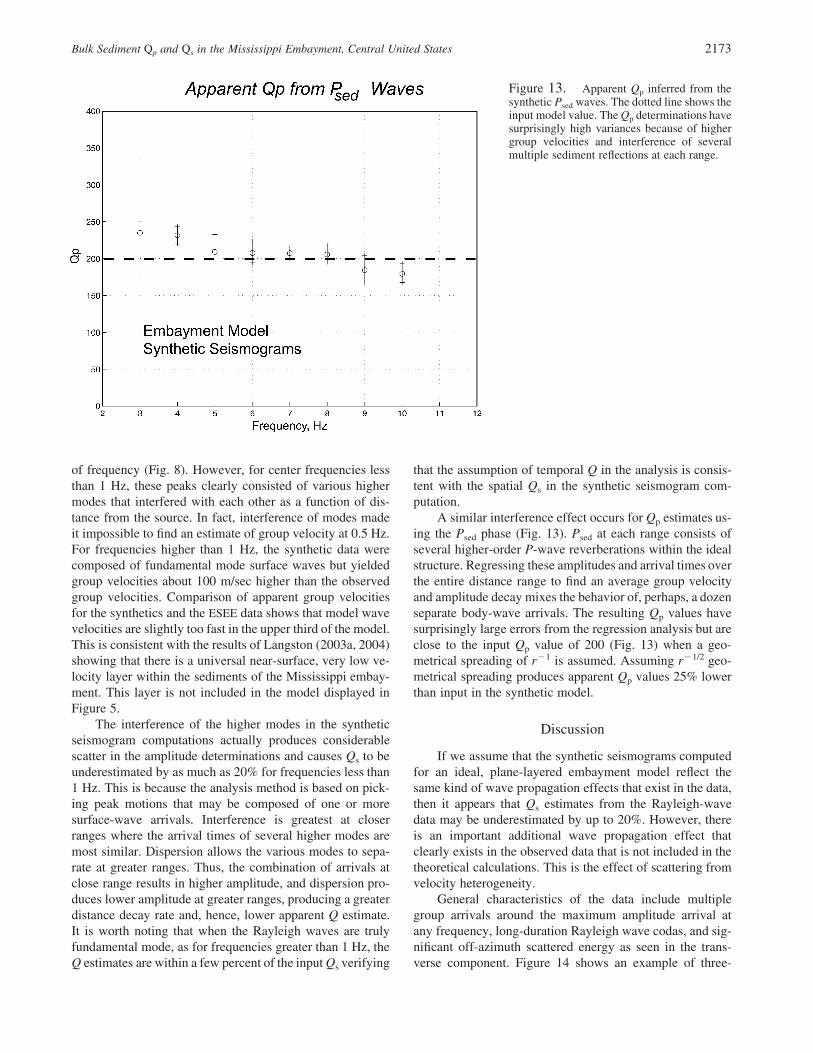
Figure 13. Apparent Qp inferred from thesynthetic Psed waves. The dotted line shows theinput model value. The Qp determinations havesurprisingly high variances because of highergroup velocities and interference of severalmultiple sediment reflections at each range.
of frequency (Fig. 8). However, for center frequencies lessthan 1 Hz, these peaks clearly consisted of various highermodes that interfered with each other as a function of dis-tance from the source. In fact, interference of modes madeit impossible to find an estimate of group velocity at 0.5 Hz.For frequencies higher than 1 Hz, the synthetic data werecomposed of fundamental mode surface waves but yieldedgroup velocities about 100 m/sec higher than the observedgroup velocities. Comparison of apparent group velocitiesfor the synthetics and the ESEE data shows that model wavevelocities are slightly too fast in the upper third of the model.This is consistent with the results of Langston (2003a, 2004)showing that there is a universal near-surface, very low ve-locity layer within the sediments of the Mississippi embay-ment. This layer is not included in the model displayed inFigure 5.
The interference of the higher modes in the syntheticseismogram computations actually produces considerablescatter in the amplitude determinations and causes Qs to beunderestimated by as much as 20% for frequencies less than1 Hz. This is because the analysis method is based on pick-ing peak motions that may be composed of one or moresurface-wave arrivals. Interference is greatest at closerranges where the arrival times of several higher modes aremost similar. Dispersion allows the various modes to sepa-rate at greater ranges. Thus, the combination of arrivals atclose range results in higher amplitude, and dispersion pro-duces lower amplitude at greater ranges, producing a greaterdistance decay rate and, hence, lower apparent Q estimate.It is worth noting that when the Rayleigh waves are trulyfundamental mode, as for frequencies greater than 1 Hz, theQ estimates are within a few percent of the input Qs verifying
that the assumption of temporal Q in the analysis is consis-tent with the spatial Qs in the synthetic seismogram com-putation.
A similar interference effect occurs for Qp estimates us-ing the Psed phase (Fig. 13). Psed at each range consists ofseveral higher-order P-wave reverberations within the idealstructure. Regressing these amplitudes and arrival times overthe entire distance range to find an average group velocityand amplitude decay mixes the behavior of, perhaps, a dozenseparate body-wave arrivals. The resulting Qp values havesurprisingly large errors from the regression analysis but areclose to the input Qp value of 200 (Fig. 13) when a geo-metrical spreading of r�1 is assumed. Assuming r�1/2 geo-metrical spreading produces apparent Qp values 25% lowerthan input in the synthetic model.
Discussion
If we assume that the synthetic seismograms computedfor an ideal, plane-layered embayment model reflect thesame kind of wave propagation effects that exist in the data,then it appears that Qs estimates from the Rayleigh-wavedata may be underestimated by up to 20%. However, thereis an important additional wave propagation effect thatclearly exists in the observed data that is not included in thetheoretical calculations. This is the effect of scattering fromvelocity heterogeneity.
General characteristics of the data include multiplegroup arrivals around the maximum amplitude arrival atany frequency, long-duration Rayleigh wave codas, and sig-nificant off-azimuth scattered energy as seen in the trans-verse component. Figure 14 shows an example of three-

2174 C. A. Langston, P. Bodin, C. Powell, M. Withers, S. Horton, and W. Mooney
Figure 14. Vertical, radial (away from the source), and transverse displacementsfor a broadband station 11 km from the Mooring explosion. The data are plotted versustime and group velocity. Note the relatively large transverse component of motionshowing presumed scattered Rayleigh waves, a scattered Psed wave, and relatively largecoda after the Rayleigh-wave arrival. The transverse component theoretically shouldshow no motion for an axisymmetric isotropic source. The data imply significant ve-locity heterogeneity that is a significant contribution to the apparent attenuation.
component waveforms for a station 11 km from the source.The transverse horizontal component (orthogonal to the ra-dial component) shows significant ground motions at nearlythe same amplitude as the vertical or radial Rayleigh-wavearrival. The coda of the transverse component is lengthyand contains major arrivals with very low apparent groupvelocities. The transverse component even shows a high-amplitude high-frequency Psed phase with associated high-frequency coda. These characteristics are strongly sugges-tive of wave scattering in heterogeneous velocity structureand are not particularly surprising considering the hetero-geneous geological structure of an active river flood plain.
The separation of effects of anelastic attenuation fromthose involving wave scattering is a well-known seismo-logical problem (e.g., Frankel and Wennerberg, 1987). In-clusion of anelastic and scattering attenuation into wave
propagation theories often involve the same functional de-pendence and results in a complete tradeoff between theeffects. Commonly (Dainty, 1981), the total attenuation,Q�1, is just
�1 �1 �1Q � Q � Q . (5)Instrinsic Scattering
In this study we have assumed that there has been no con-tribution from scattering attenuation. Our estimates of in-trinsic attenuation, therefore, must be maximum values or,conversely, the estimates of Qs and Qp must be minimumbounds on the intrinsic Q of the unconsolidated embaymentsediments.
Several past studies of bulk sediment anelasticity in theembayment derived from earthquake P-and S-wave spectraand S/Sp spectral ratios report values of Qs ranging from 25

Bulk Sediment Qp and Qs in the Mississippi Embayment, Central United States 2175
Figure 15. Comparison of synthetic seismograms with the observed vertical dis-placement data at Glass, Tennessee (GLAT). A 2-pole, causal butterworth bandpassfilter with corner frequencies of 0.5 and 8 Hz was applied to the data and syntheticsbecause of the large amount of ambient ground noise below 0.5 Hz contained in thedata. The synthetic waveforms were constructed using the velocity model in Figure 5with the simple Q models as annotated in the figure. An isotropic source with a depthof 35 m was also assumed. This figure shows the large effect that Qs and Qp have onthe distance-attenuation of both P and Rayleigh waves. The low-Q model synthetic, ifexamined in detail, does not show appropriate frequency content, relative phase am-plitudes, or wave-train durations.
to 40 and Qp ranging from 25 to 60 (e.g., Liu et al., 1994;Chen et al., 1994), 2.5 to 4 times smaller than the valuesobtained here. The Rayleigh-wave and Psed data are clearlyinconsistent with the previously determined low Q values.The Rayleigh-wave frequency band overlaps the S/Sp spec-tral ratio data at its low end, but the Psed data occurs directlyin the center of S/Sp spectral ratio band. Several syntheticseismogram calculations for the low values were performedand demonstrated that it would be unlikely that these wavescould even be observed past ranges of 20 km. The differencein distance-amplitude decay results in Rayleigh-wave am-plitudes being different by several orders of magnitude atthe greatest ranges. The empirical analysis is very sensitiveto bulk attenuation in the sediments and easily resolves thedifference between low- and high-Q models.
For example, Figure 15 shows a comparison of syntheticseismograms computed using our Q values and previous val-ues with the vertical displacement data observed at Glass,Tennessee (GLAT). GLAT is only 28 km from the source.
The synthetic seismogram computed using the low Q valuesis highly attenuated relative to the high-Q synthetic. Most ofthe Rayleigh-wave train has been removed by absorption,relative to the longest period Rayleigh waves seen at about40-sec arrival time. Even the Psed phase has been reduced inthe low-Q synthetic so that it is scarcely larger than the low-est frequency Raleigh wave (at 40-sec arrival time). Thehigh-Q synthetic, on the other hand, matches the generalcharacter of the data in frequency content, amplitude, du-ration, and arrival time of the major P-and surface-wavearrivals.
The issue remains of how our present results relate tothe much higher frequency geotechnical results of Wang etal. (1994) and Pujol et al. (2002). If Q is related to anelasticmaterial properties and is independent of frequency, thenlow values of 10 to 34 in the upper 60 m would imply thatQ must increase significantly with depth in the unconsoli-dated sediments. However, trial synthetic seismogram cal-culations assuming a low Qs of 30 in the upper 100 m of the
2176 C. A. Langston, P. Bodin, C. Powell, M. Withers, S. Horton, and W. Mooney
velocity model showed that 1-Hz fundamental mode Ray-leigh waves were actually significantly attenuated with theattenuation being inconsistent with the observations. Thiscould imply that Q is frequency dependent, that Q is sensi-tive to differing wave scattering mechanisms between thethree kinds of experiments, or a combination of both. Weleave this interesting anomaly to future analysis but recog-nize that is an outstanding, important issue.
Our results imply that high-frequency earthquakeground motions will not be appreciably attenuated from pas-sage through the sediment column. A 5-Hz shear wave, forexample, traveling 1 km in a medium (Vs � 0.6 km/sec)with an average Qs of 30 will loose 58% of its amplitude.Only 22% of wave amplitude will be lost if the Qs is 100.Thus, considering small-strain amplitude seismic waves, 5-Hz shear waves should be generally amplified by the em-bayment sediments since the impedance decrease of the sed-iments should dominate over the attenuation effect.
A second challenge posed by lower-than-expected at-tenuation in Mississippi embayment sediments is perhapsmore profound for earthquake hazards. As our ESEE resultsshow, high-Q but low-velocity sediments form an efficientwave guide that may be expected to allow seismic waveswithin it to propagate over long distances. This mode ofpropagation will promote long surface-wave trains with 1-to 3-sec periods, with large amplitudes. These surface waveswould have many cycles of high strains that could causeground failure and liquefaction to long distances and coulddamage structures large enough to resonate at these long-periods. This sort of hazard is generally not considered bymost seismic hazard studies but could be an important con-cern in the Mississippi embayment. It would not be as im-portant if sedimentary Q was small, but the values we esti-mate suggest this should be considered an importantcontributor to hazard. Shallow earthquakes or the shallowpart of large ruptures would best energize the sediment waveguide, and the effect might be completely masked in obser-vations from deeper small earthquakes. To illustrate, weshow seismograms from an M 4.5 earthquake in Bardwell,Kentucky, on the 6 June 2003 (Fig. 16) recorded at a broad-band seismic station 136 km away. The earthquake was 2 kmdeep, but still put significant energy into the sedimentarywave guide. As our synthetic seismogram models show withlow Q, we should not expect to see such large surface wavesessentially trapped within the shallow unconsolidated sedi-ments (with group velocities of 400 m/sec and less), whichappear from 300 to 500 seconds later at this distance.
In the early stages of this study there was a hope thatthe combined use of the Rayleigh-wave and Psed data couldplace constraints on the depth profile of attenuation. Fun-damental mode Rayleigh waves, for example, should pro-gressively sample deeper into the sediment column as wavefrequency decreases. We effectively get some of this depthdependence in the data and synthetics because higher Ray-leigh modes dominate the signal at lower frequencies. How-ever, the resulting empirical Qs estimates reflect averages of
several regions of the sediment profile rather than just thedeeper parts. This was borne out by construction of numer-ical derivatives of the time series using perturbations of theQ profile with depth and processing the data to obtain thedistance attenuation coefficient in the same way as the em-pirical analysis. Existence of multimode surface waves inthe analysis produced relatively large variances in the atten-uation estimates. The variances of the synthetic estimateswere too large to justify modeling the small frequency-dependent variations seen in the empirical determinations(e.g., Fig. 9).
Results from the Psed phase suggest a robust bulk atten-uation determination since Psed consists of whole-layer mul-tiples that sample the entire sediment layer many times de-pending on propagation distance. The inferred value of Qp
(Fig. 10) actually increases at the highest frequencies, butthe variance of the estimate also increases. At this point intime, the simplest interpretation for Q structure in embay-ment sediments is that Qs and Qp are constant with depthand with frequency. Frequency-dependent Q models are notrequired by the data at the level of resolution found from theregression fits of time and amplitude data.
Clouser and Langston (1991) discuss the physical in-terpretation of sediment Q models. In particular, Qp and Qs
can be related through wave scattering mechanisms and an-elasticity of poroelastic media. A common theoretical rela-tionship is often examined to infer the mechanism of an-elastic loss in the material by splitting loss in shear (QS
�1)from loss in volumetric strain or bulk loss (Qk
�1) (Vassiliouet al., 1982):
�1 �1 �1Q � LQ � (1 � L)Q , (6)p S k
where
24 VsL � . (7)� �3 Vp
The average Vp/Vs ratio for embayment sediments is wellknown and is very close to 3 so L � 0.1481 (Langston,2003a). If there is only loss in shear , then the�1(Q � 0)k
inferred Qp of 200 implies a Qs of only 30, inconsistent withthe inferred value. Assuming Qs � 100 and Qp � 200 yieldsQk � 242 for embayment sediments. Thus, significant at-tenuation occurs in compression as well as shear, not con-sidering loss due to scattering.
It is noteworthy that the present attenuation estimatesare most consistent with those of Kang and McMechan(1994) who used controlled source refraction data and ex-amined the scattering characteristics of high-frequency di-rect P and S waves within the NMSZ within a distance rangeof 6 to 10 km. They obtained Qp � 200 and Qs � 68.However, it is clear from the data that they used that theattenuation that they measured is actually appropriate for the

Bulk Sediment Qp and Qs in the Mississippi Embayment, Central United States 2177
Figure 16. Vertical, radial, and transverse displacement data recorded at Gosnell,Arkansas (GNAR), for a recent moderate earthquake (M 4.5) that occurred at Bardwell,Kentucky. Even at this distance of 136 km, the data show high-amplitude, long-durationsurface waves. Rayleigh and Love waves with group velocities of less than 400 m/sechave been excited by this shallow earthquake (h � 2 km) and propagate almost entirelywithin the unconsolidated sediments. The unconsolidated sediments of the Mississippiembayment form an efficient wave guide for waves radiated by shallow events andlarge events that may rupture into the sediments.
portion of the refracted wave paths that exist within the base-ment rocks and not the unconsolidated sediments. Therefore,this agreement is fortuitous and cannot be used for supportof the values found from sediment Rayleigh and P waves.
Results of this study provide additional evidence thatpast body-wave spectral studies to obtain anelastic attenua-tion have been strongly influenced by wave scattering mech-anisms in the embayment sediment velocity structure andfrom seismograph installation practices (Langston, 2003b).K (Kappa) and fmax spectral parameter estimations dependon elastic-wave propagation effects as well as anelastic at-tenuation. These results underline the need to test seismo-logical hypotheses (models) using independent means to ar-rive at realistic bounds on wave propagation parameters.
Conclusions
Lower bounds on Qs and Qp have been determined forthe thick unconsolidated sediments of the Mississippi em-
bayment using explosion-generated Rayleigh waves and Pwaves. Based on the scatter in the arrival-time and amplitudedata, we favor a simple Q model that is independent of fre-quency and depth. Values of 100 for Qs and 200 for Qp
explain the distance decay of fundamental and higher modeRayleigh waves and high-frequency Psed waves. These val-ues are robust and are 2.5 to 4 times larger than previouslyestimated values from earthquake body-wave spectra. Be-cause scattering is an obvious attribute of the observedwaveform data, these anelastic Q estimates must be mini-mum values; Qs and Qp are very likely higher for these thick,unconsolidated sediments. Higher Q implies that 5-Hz shearwaves should be amplified by the embayment sedimentssince the impedance decrease of the sediments should dom-inate over the attenuation effect. These higher Q values alsoimply that the thick sediments of the Mississippi embaymentwill form an efficient wave guide for the propagation ofhigh-amplitude surface waves from shallow earthquakes inthe NMSZ.
2178 C. A. Langston, P. Bodin, C. Powell, M. Withers, S. Horton, and W. Mooney
Acknowledgments
The experimental portion of this work could not have been completedwithout the help of many people. We appreciate the assistance of Ed Crileyand Tom Burdett of the USGS who helped design the ESEE borehole shotpoints. Jack Van Schaack and Ron Kaderabek graciously came out of re-tirement to load and detonate the ESEE explosions. CERI technical personnelGreg Steiner, Jim Bollwerk, Chris McGoldrick, and John Filipcic ably man-aged logistics and helped install field stations during ESEE. Buddy Schweigand Joan Gomberg of the USGS office at CERI arranged for illuminatingeducation and outreach events during the experiment. We appreciate gradu-ate students Ivan Rabak, Daejin Kang, and Qingwen Miao for their helpwith instrumentation preparation and installation. Jim Dorman graciouslyvolunteered to find sites for temporary stations in the central NMSZ. Ap-preciation is given to Charles Glover of the Ritter Land and Seed Co. fortheir help in siting the Mark Tree, Arkansas, source and to James Eddlemonof Mooring, Tennessee, for help in siting the Mooring source. We thankthe owners of Omni Explosives Company for using their property to installa seismograph and for allowing us to record their test explosions. In ad-dition, we thank Jim Fowler and Noel Barstow of IRIS/PASSCAL for theirhelp in providing eight broadband instruments for the temporary deploy-ment. Alemayehu Jemberie provided some useful comments on an earlyversion of the manuscript. David Boore, Francis Wu, and Chandon Saikiaprovided useful review comments. This research was supported by theU.S. Department of the Interior, U.S. Geological Survey under Grant.02HQGR007 and by the National Science Foundation Mid America Earth-quake Center under Project HD-5. We also thank the University of Mem-phis for providing seed support through a Faculty Research Grant. Use ofthe Generic Mapping Tool, program for Figure 1 (Wessel and Smith, 1998)is gratefully acknowledged. The Seismic Analysis Code (Goldstein et al.,2002) was used for much of the analysis.
References
Aki, K. (1988). Local site effects on strong ground motion, in EarthquakeEngineering and Soil Dynamics II—Recent Advances in Ground-Motion Evaluation, J. L. V. Thun (Editor), American Society of CivilEngineers, Park City, Utah, 103–155.
Aki, K., and P. G. Richards (1980). Quantitative Seismology—Theory andMethods, W. H. Freeman and Co., San Francisco, California, p. 298.
Apsel, R. (1979). Dynamic Green’s functions for layered media and appli-cations to boundary value problems, Ph.D. Thesis, University of Cali-fornia, San Diego.
Barker, J. S. (1984). A seismological analysis of the May 1980 MammothLakes, California, earthquakes, Ph.D. Thesis, Pennsylvania State Uni-versity, State College.
Barker, T. G., and J. L. Stevens (1983). Shallow shear wave velocity andQ structures at the El Centro strong motion accelerograph array, Geo-phys. Res. Lett. 10, no. 9, 853–856.
Ben-Menahem, A., and S. J. Singh (1978). Seismic Waves and Sources,Springer-Verlag, New York.
Bodin, P., and S. Horton (1999). Broadband microtremor observation ofbasin resonance in the Mississippi embayment, central U.S.: impli-cations for seismic hazard assessment, Geophys. Res. Lett. 26, 903–906.
Bodin, P., K. Smith, S. Horton, and H. Hwang (2001). Microtremor obser-vations of deep sediment resonance in metropolitan Memphis, Ten-nessee, Engn. Geol. 62, 159–168.
Catchings, R. D. (1999). Regional Vp, Vs, Vp/Vs and Poisson’s ratiosacross earthquake source zones from Memphis, TN, to St. Louis, MO,Bull. Seism. Soc. Am. 89, 1591–1605.
Chen, K.-C., J.-M. Chiu, and Y.-T. Yang (1994). Qp–Qs relations in thesedimentary basin of the Mississippi embayment using convertedphases, Bull. Seism. Soc. Am. 84, 1861–1868.
Clouser, R., and C. Langston (1991). Qp–Qs relations in a sedimentarybasin using converted phases, Bull. Seism. Soc. Am. 81, 733–750.
Dainty, A. M. (1981). A scattering model to explain seismic Q observationsin the lithosphere between 1 and 30 Hz, Geophys. Res. Lett. 8, 1126–1128.
Farnbach, J. S. (1975). The complex envelope in seismic signal analysis,Bull. Seism. Soc. Am. 65, 951–962.
Frankel, A., and L. Wennerberg (1987). Energy-flux model of seismic coda:separation of scattering and intrinsic attenuation, Bull. Seism. Soc. Am.77, 1223–1251.
Futterman, W. I. (1962). Dispersive body waves, J. Geophys. Res. 67,5279–5291.
Ginzberg, A., W. D. Mooney, A. W. Walter, W. J. Lutter, and J. H. Healy(1983). Deep structure of northern Mississippi embayment, AAPGBull. 67, 2031–2046.
Goldstein, P., D. Dodge, and M. Firpo (2002). SAC2000: signal processingand analysis tools for seismologists and engineers, in IASPEI Inter-national Handbook of Earthquake and Engineering Seismology,W. H. K. Lee, H. Kanamori, P. C. Jennings, and C. Kisslinger (Edi-tors), Academic Press, San Diego, California.
Hashash, Y. M. A., and D. Park (2001). Non-linear one-dimensional seis-mic ground motion propagation in the Mississippi embayment, Engn.Geol. 62, 185–206.
Johnston, A. C., and E. S. Schweig (1996). The enigma of the New Madridearthquakes of 1811–1812, Annu. Rev. Earth. Planet. Sci. 24, 339–384.
Kang, I. B., and G. McMechan (1994). Separation of intrinsic and scatteringQ based on frequency-dependent amplitudes of transmitted waves, J.Geophys. Res. 99, 23,875–23,885.
Kelson, K. I., G. D. Simpson, R. B. V. Arsdale, C. C. Haraden, and W. R.Lettis (1996). Multiple Holocene earthquakes along the Reelfoot fault,central New Madrid seismic zone, J. Geophys. Res. 202, 6151–6170.
Langston, C. A. (2003a). Local earthquake wave propagation through Mis-sissippi embayment sediments, part I: body wave phases and localsite responses, Bull. Seism. Soc. Am. 93, 2664–2684.
Langston, C. A. (2003b). Local earthquake wave propagation through Mis-sissippi embayment sediments, part II: influence of local site velocitystructure on Qp–Qs determinations, Bull. Seism. Soc. Am. 93, 2685–2702.
Langston, C. A. (2004). Seismic ground motions from a bolide shock wave,J. Geophys. Res. 109, B12309, doi 10.1029/2004JB003167.
Langston, C. A., W. Mooney, P. Bodin, C. Powell, and M. Withers (2002a).Experiment in New Madrid Zone to employ active source, EOS Trans.AGU 83, 473.
Langston, C. A., A. A. Nyblade, and T. J. Owens (2002b). Regional wavepropagation in Tanzania, East Africa, J. Geophys. Res. 107, B1, doi10.1029/2001JB000167.
Liu, Z., M. E. Wuenscher, and R. B. Herrmann (1994). Attenuation of bodywaves in the central New Madrid seismic zone, Bull. Seism. Soc. Am.84, 1112–1122.
Mooney, W. D., M. C. Andrews, A. Ginzburg, D. A. Peters, and R. M.Hamilton (1983). Crustal structure of the northern Mississippi em-bayment and a comparison with other continental rift zones, Tecton-ophysics 94, 327–348.
Nuttli, O. W. (1973). The Mississippi Valley earthquakes of 1811 and 1812:intensities, ground motions, and magnitudes, Bull. Seism. Soc. Am.63, 227–248.
Park, D. (2003). Estimation of non-linear seismic site effects for deep de-posits of the Mississippi embayment, Ph.D. Thesis, University of Il-linois, Urbana-Champaign.
Pujol, J., S. Pezeshk, Y. Zhang, and C. Zhao (2002). Unexpected values ofQs in the unconsolidated sediments of the Mississippi embayment,Bull. Seism. Soc. Am. 92, 1117–1128.
Self, R. P. (1993). Late Tertiary to early Quaternary sedimentation in theGulf coastal plain and lower Mississippi valley, Southeast. Geol. 33,99–110.
Stearns, R. G. (1957). Cretaceous, Paleocene, and lower Eocene geologic

Bulk Sediment Qp and Qs in the Mississippi Embayment, Central United States 2179
history of the northern Mississippi embayment, Geol. Soc. Am. Bull.68, 1077–1100.
Stearns, R. G., and M. V. Marcher (1962). Late Cretaceous and subsequentstructural development of the northern Mississippi embayment area,Geol. Soc. Am. Bull. 73, 1387–1394.
Tuttle, M. P., and E. S. Schweig (1999). Towards a paleoearthquake chro-nology for the New Madrid seismic zone, U.S. Geol. Surv. NEHRPAnn. Rept, 17 pp.
Tuttle, M. P., J. D. Sims, K. Dyer-Williams, I. R. H. Lafferty, and I. E. S.Schweig (2000). Dating of liquefaction features in the New Madridseismic zone, U.S. Nuclear Regulatory Commission, 78 pp.
Vassiliou, M., C. A. Salvado, and B. R. Tittmann (1982). Seismic Attenu-ation, CRC Press, Boca Raton, Florida.
Vogfjord, K. S., and C. A. Langston (1996). Characteristics of short-periodwave propagation in regions of Fennoscandia, with emphasis on Lg,Bull. Seism. Soc. Am. 86, 1873–1895.
Vucetic, M. (1994). Cyclic threshold shear strains in soils, J. Geotech. Eng.120, 2208–2228.
Wang, Z., R. Street, E. Woolery, and J. Harris (1994). Qs estimation forunconsolidated sediments using first-arrival SH wave critical refrac-tions, J. Geophys. Res. 99, 13,543–13,551.
Wessel, P., and W. H. F. Smith (1998). New, improved version of GenericMapping Tools released, EOS Trans. 79, 579.
Center for Earthquake Research and InformationUniversity of MemphisMemphis, Tennessee 38152
(C.A.L., P.B., C.P., M.W., S.H.)
U.S. Geological SurveyMenlo Park, California
(W.M.)
Manuscript received 18 March 2005.