building science ii
TRANSCRIPT
i
SCHOOL OF ARCHITECTURE, BUILDING & DESIGN
BUILDING SCIENCE 2 (ARC 3413/BLD 61303)
PROJECT 1 – LIGHTING & ACOUSTIC
PERFORMANCE EVALUATION AND DESIGN
RUANG SHAH ALAM
LEONG VUI YUNG 0320362
FUNG HO YENG 0319473
IVY VOO VUI YEE 0319534
LIONG SHUN QI 0315942
LO JIA WOEI 0318585
YVONNE CHIN YUN MIIN 0315662
LECTURER : MOHAMED RIZAL MOHAMED

TABLE OF CONTENTS
1.0 INTRODUCTION 1 - 5
1.1 Abstract
1.2 Acknowledgement
1.3 Site Information
1.3.1 Introduction
1.3.2 Site Selection Reasons
1.3.3 Zoning of Building
2.0 LIGHTING PERFORMANCE EVALUATION 6 - 7
2.1 Introduction on Lighting 8 - 14
2.2 Precedent Study
2.2.1 Introduction
2.2.2 Day-lighting
2.2.3 Artificial Lighting
2.2.4 Data Collected
2.2.5 Conclusion
2.3 Research Methodology 15 - 17
2.3.1 Precedent Study
2.3.2 Preparation
2.3.3 Light Measuring Equipment
2.3.4 Data Collection Method
2.4 Case Study 18
2.4.1 Building Orientation
2.5 Existing Lighting Conditions 19 - 22
2.5.1 Existing Light Fixture
2.6 Materials & Properties 23 - 26
2.7 Lighting Data Analysis
2.7.1 Lighting Data Collection 27 - 31
2.7.1.1 Main Event Space – Zone A & Zone B
2.7.1.2 Covered Outdoor Area – Zone C
2.7.1.3 VIP Dining Area –Zone D
2.7.2 Lighting Contour Diagram & Analysis 32 - 33

2.8 Lighting Calculation Analysis
2.8.1 Daylight Factor Analysis 34 - 41
2.8.1.1 Zone A
2.8.1.2 Zone B
2.8.1.3 Zone C
2.8.1.4 Zone D
2.8.2 Artificial Lighting Analysis 42 - 48
2.8.2.1 Zone A
2.8.2.2 Zone B
2.8.2.3 Zone C
2.8.2.4 Zone D
2.9 Conclusion 49
3.0 ACOUSTIC PERFORMANCE EVALUATION
3.1 Introduction on Acoustic 50 -51
3.2 Precedent Study 52 -59
3.2.1 Introduction
3.2.2 Reverberation Analysis
3.2.3 Sound Transmission Class (STC) Analysis
3.2.4 New Proposed Baffled System
3.2.5 Conclusion
3.3 Research Methodology 60 - 62
3.3.1 Precedent Study
3.3.2 Preparation
3.3.3 Light Measuring Equipment
3.3.4 Data Collection Method
3.4 Existing Noise Sources 63 - 68
3.4.1 External Noise
3.4.1.1 Site Context
3.4.1.2 Vehicles
3.4.1.3 Human Activities
3.4.2 Internal Noise 69 - 74
3.4.2.1 Human Activities
3.4.2.2 Electrical Appliances
3.4.2.2.1 Speakers
3.4.2.2.2 Air Conditioning
3.4.3 Location of Noise Sources 75 - 76
3.5 Materials & Properties 77 - 81
3.6 Acoustic Tabulation & Analysis
3.6.1 Sound Meter Reading & Analysis 82 - 90
3.6.1.1 3.6.1.1 Main Event Space – Zone A & Zone B
3.6.1.2 Covered Outdoor Area – Zone C
3.6.1.3 VIP Dining Area –Zone D
3.6.2 Sound Intensity Level (SIL) 91 - 95
3.6.2.1 Zoning of Spaces
3.6.3 Reverberation Time (RT) 96 - 105
3.6.3.1 Zoning of Spaces
3.6.4 Sound Reduction Index (SRI) 106 - 115
3.6.4.1 Zoning of Spaces
4.0 REFERENCE 116

1 | P a g e
1.0
INTRODUCTION

2 | P a g e
1.1 ABSTRACT
For this project, we were to select a building that has lighting and acoustic features that
can be studied. We have to observe, evaluate, analyse and report on lighting and
acoustics performance of the selected building.
This report will be focusing on the building science in Ruang Shah Alam such as day-
lighting, artificial lighting, noise and sound condition. The report aims to introduce the
lighting and acoustic characteristics and requirement in specific space. Malaysian
Standard (MS1525) is being referred to get more information on the regulations of the
features.

3 | P a g e
1.2 ACKNOWLEDGEMENT
We would like to thank Ruang Shah Alam for allowing our team to have a visit on the
building sciences. We are also grateful that the technicians that spent their weekend on
giving us all the necessary information throughout the building including all lighting,
acoustics and architectural drawings. Without their help, we will not be able to finish the
project.
We would like to extend our gratitude to each individual who has helped and assisted us
to complete this research report as without your involvement, this report would be
insufficient and unsatisfactory. At last, a special thanks to our tutor, Mr Rizal for guiding
us through each tutorial and providing us with an aim to accomplish the task.

4 | P a g e
1.3 SITE INFORMATION
1.3.1 Introduction
RUANG is a company that specializes in providing an event space for occasions, such
as weddings, meetings, brainstorming sessions, exhibitions and others. RUANG
currently has 2 venues, SS18 Subang Jaya and Seksyen 16 Shah Alam. We had visited
the one at Seksyen 16 Shah Alam.
1.3.2 Site Selection Reason
Based on our observation, the event space provides sufficient functional spaces for our
analysis on lighting and acoustic. The double volume event hall and outdoor area even
the upper floor are useful to help us develop an understanding on different lighting
conditions of spaces that facilitates different programs and functions.
In terms of lighting properties, the arrangement of the space provides the site with an
array of day lighting and artificial lighting. For acoustics, the space also designed to
reduce the reflection of the sound.

5 | P a g e
1.3.3 Zoning of Building

6 | P a g e
2.0
LIGHTING
PERFORMANCE
EVALUATION
7 | P a g e
2.1 INTRODUCTION ON LIGHTING
Light is a form of energy manifesting itself as electromagnetic radiation and is closely
related to other forms of electromagnetic radiation such as radiowaves, radar,
microwaves, infrared and ultraviolet radiation and X-rays. Light is the most important
factor in the appreciation and understanding of Architecture. The relationship between
light and architecture is grounded in the principles of physics; it is about energy and
matter but in this particular case it also implies an emotional effect on people. The quality
of lighting in a space defines its character and creates impressions. The human eye
perceives its form through the incidence and reflection of light and in that way acquires
information about the ambiance in a given place. Visual impressions are interpreted in
our brains and put in context to create emotions that move us to take particular actions.
8 | P a g e
2.2 PRECEDENT STUDIES
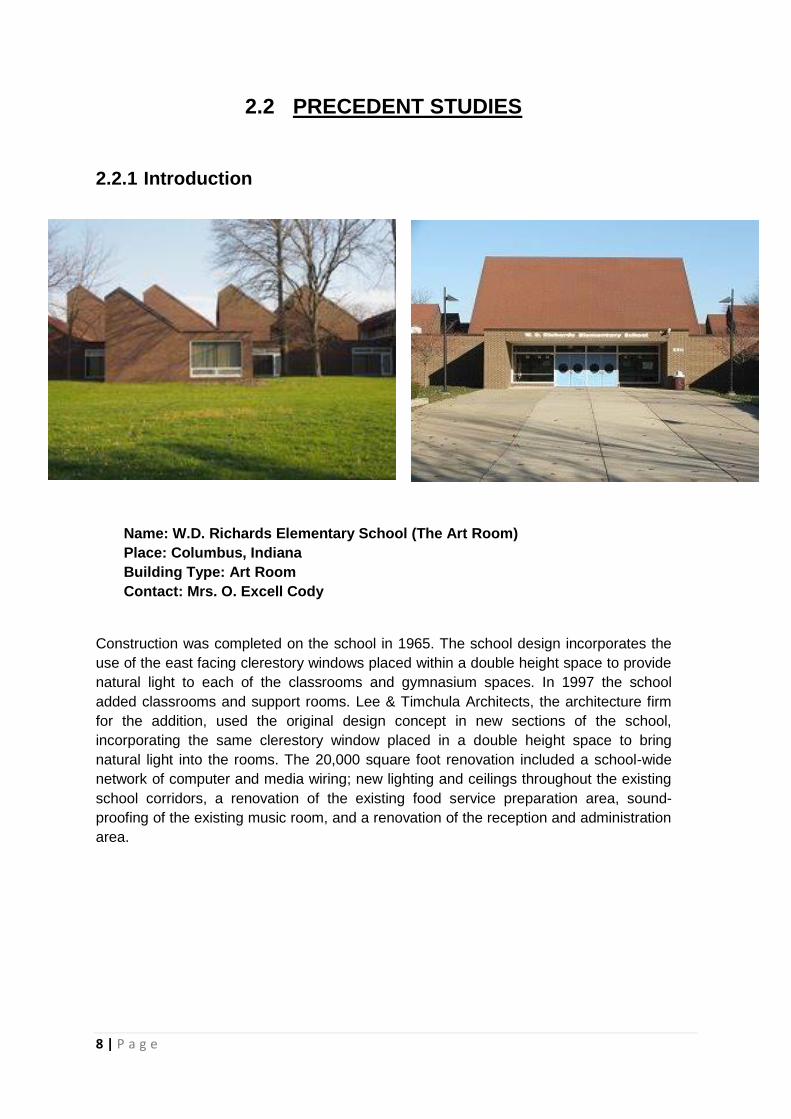
2.2.1 Introduction
Name: W.D. Richards Elementary School (The Art Room)
Place: Columbus, Indiana
Building Type: Art Room
Contact: Mrs. O. Excell Cody
Construction was completed on the school in 1965. The school design incorporates the
use of the east facing clerestory windows placed within a double height space to provide
natural light to each of the classrooms and gymnasium spaces. In 1997 the school
added classrooms and support rooms. Lee & Timchula Architects, the architecture firm
for the addition, used the original design concept in new sections of the school,
incorporating the same clerestory window placed in a double height space to bring
natural light into the rooms. The 20,000 square foot renovation included a school-wide
network of computer and media wiring; new lighting and ceilings throughout the existing
school corridors, a renovation of the existing food service preparation area, sound-
proofing of the existing music room, and a renovation of the reception and administration
area.

9 | P a g e
Plan and Section
Figure 2.2.1B : Reflected ceiling plan showing ceiling tile grid, ceiling heights
and lamp fixture locations.
Figure 2.2.1A : Section through Art Room

10 | P a g e
Interior photographs of the art room
The art room is located in the center core of the school, adjacent to the gymnasium.
Unlike most of the other classrooms, it does not have an exterior wall. The only source of
natural light for the art room is the eastern clerestory window. The design concept of the
room uses the clerestory window to bring exterior light into the room and uses the ceiling
to reflect the natural light into the space and spread that light evenly within the room.
2.2.2 Natural Lighting Using in Art Room
Figure 2.2.2A : Clerestory window from the interior view
Figure 2.2.2A shows that clerestory window above east wall which fully utilize morning
sun but also bring in indirect lighting from afternoon sun. From the figure above, we also
can see that the interior finishes were selected to improve the light reflection. The ceiling
tiles and wall have a high lighting reflectance value which enhancing the natural lighting
provided into the space.
Figure 2.2.1C : Photograph of eastern wall of
the art room
Figure 2.2.1D : Interior photographs of the art
room
11 | P a g e
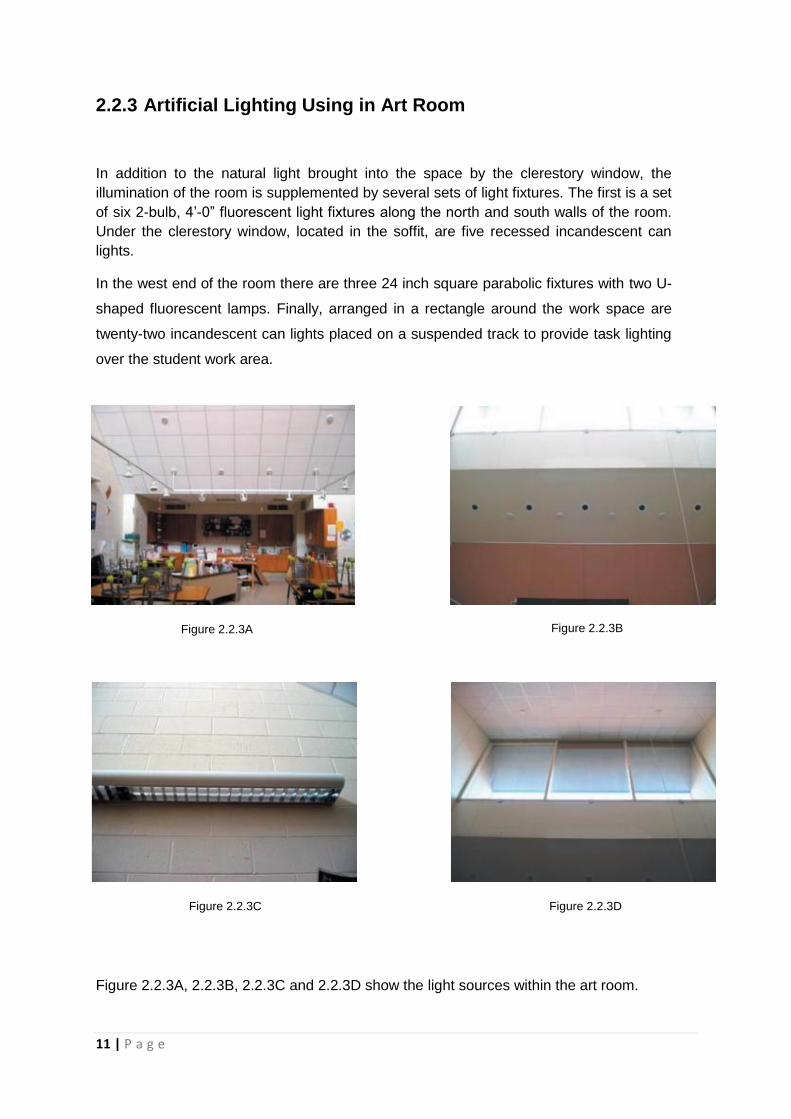
2.2.3 Artificial Lighting Using in Art Room
In addition to the natural light brought into the space by the clerestory window, the
illumination of the room is supplemented by several sets of light fixtures. The first is a set
of six 2-bulb, 4’-0” fluorescent light fixtures along the north and south walls of the room.
Under the clerestory window, located in the soffit, are five recessed incandescent can
lights.
In the west end of the room there are three 24 inch square parabolic fixtures with two U-
shaped fluorescent lamps. Finally, arranged in a rectangle around the work space are
twenty-two incandescent can lights placed on a suspended track to provide task lighting
over the student work area.
Figure 2.2.3A, 2.2.3B, 2.2.3C and 2.2.3D show the light sources within the art room.
Figure 2.2.3A Figure 2.2.3B
Figure 2.2.3C Figure 2.2.3D
12 | P a g e
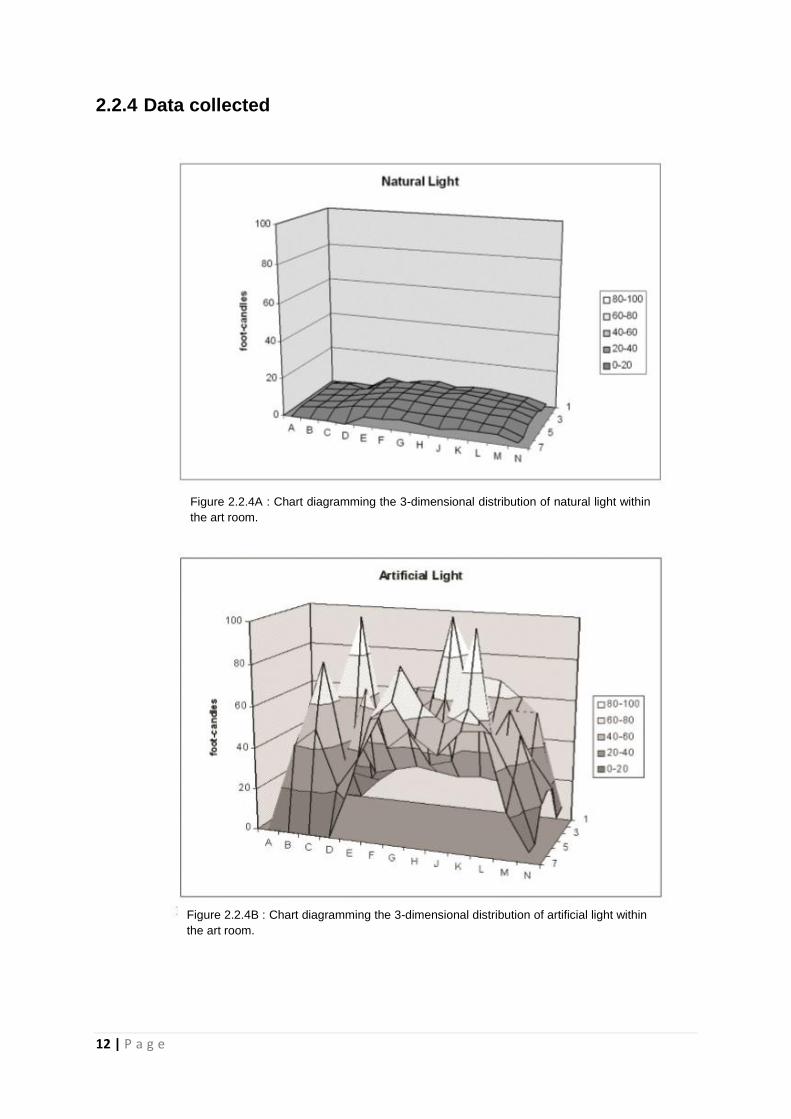
2.2.4 Data collected
Figure 2.2.4A : Chart diagramming the 3-dimensional distribution of natural light within
the art room.
Figure 2.2.4B : Chart diagramming the 3-dimensional distribution of artificial light within
the art room.
13 | P a g e
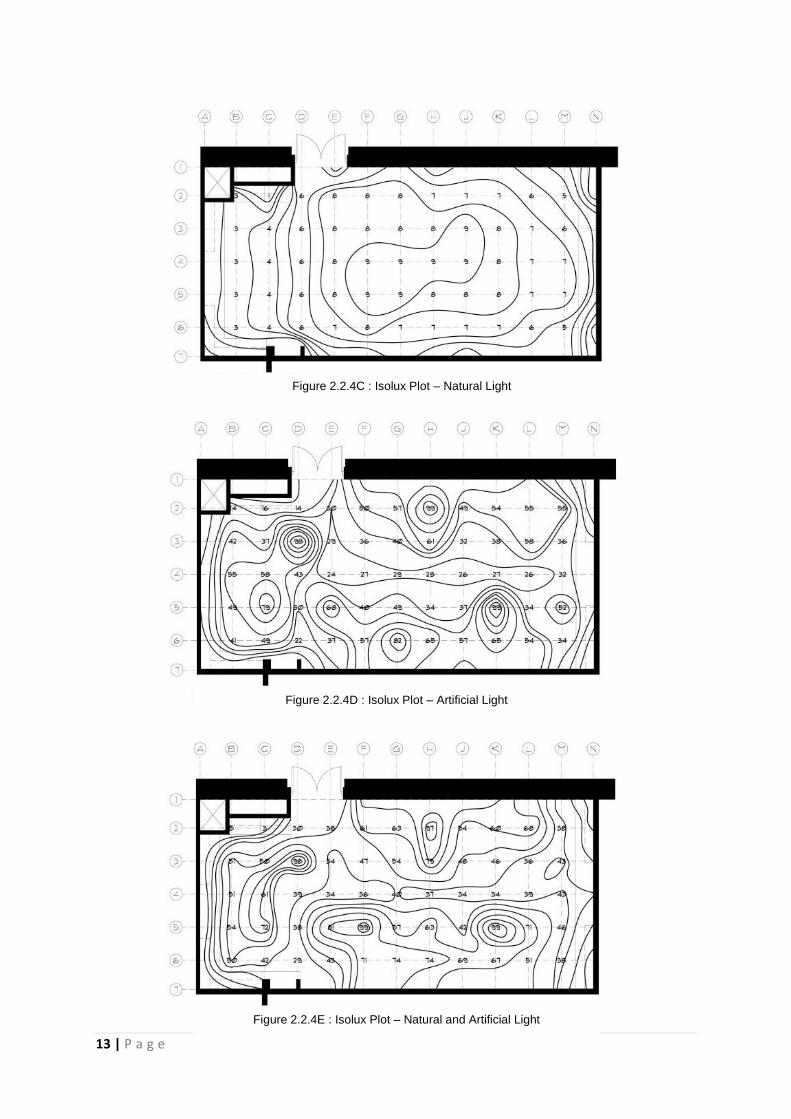
Figure 2.2.4C : Isolux Plot – Natural Light
Figure 2.2.4D : Isolux Plot – Artificial Light
Figure 2.2.4E : Isolux Plot – Natural and Artificial Light

14 | P a g e
2.2.5 Conclusion
Figure 2.2.5A : Visual field map displaying lumination of surfaces within the art room.
We conclude that the natural lighting and artificial light are incorporate together
well within the art room. Through the analysis, we can observe that natural light within
the art room is sufficient to provide for personal orientation and light for occasional visual
tasks. Understanding the limitations in amount of light and the time of day that light is
provided, designers chose to incorporate the use of supplemental lighting found in
various forms. The various light fixtures can be turned on and off to adjust the required
lighting for the various tasks. The light fixtures can be used in conjunction with the
natural light entering the space to provide the most efficient use of energy for the space,
customizing and adjusting the light in the space depending on the task being performed
at any given time.

15 | P a g e
2.3 RESEARCH METHODOLOGY
2.3.1 Precedent Studies
Precedent study that has the same characteristic of our site is being chosen to guide us
how the light functions and affect the space. This enables us to conduct the case study
properly.
2.3.2 Preparation
1. In obtaining approval to use site as case study, calls and emails were made to the
different chosen places.
2. The plan drawings were obtained from the site owner.
3. Preliminary study and identification of the spaces were studied.
4. Precedent studies were done to have a better understanding of how lights function or
affect in the space.
5. Gridlines with distance of 1.5m was plotted on the plan for recording purposes.
6. Digital Lux Meter was supplied by the tutors.
7. The equipment was tested before attending the site visit.
8. A basic standard and regulations such as ASHRAE and MS1525 were also studied
before hand to analyse and compare the readings later on.
16 | P a g e
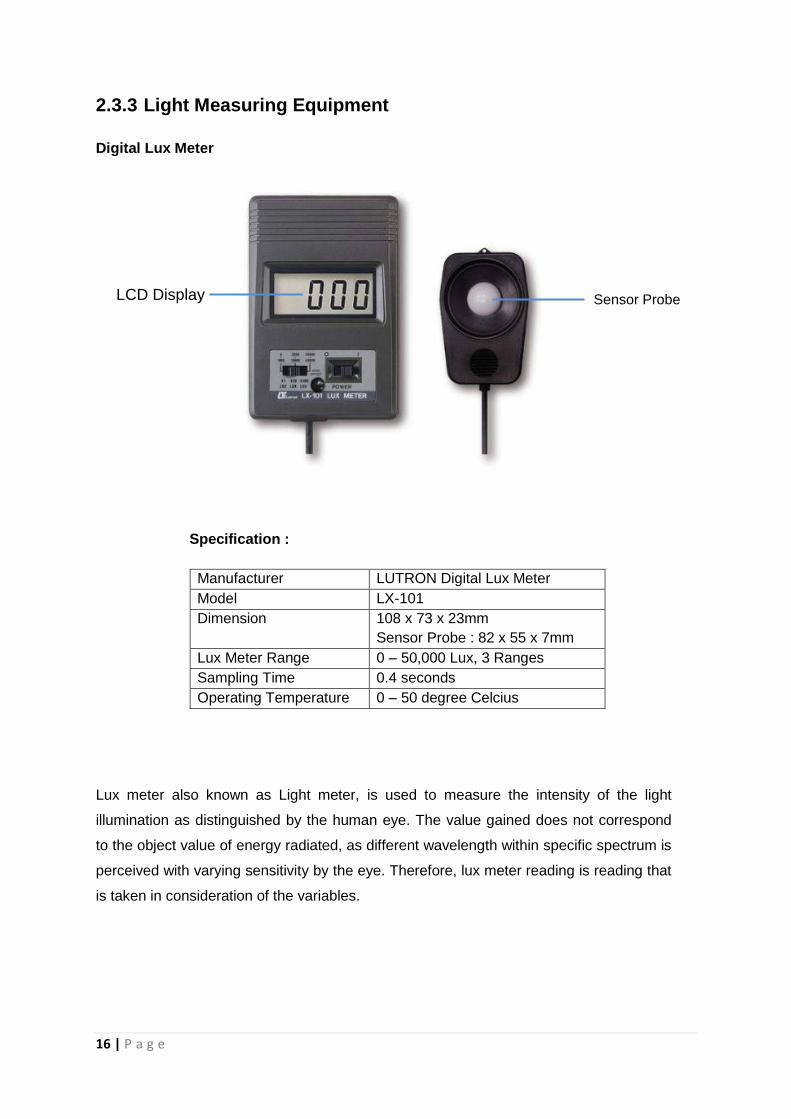
2.3.3 Light Measuring Equipment
Digital Lux Meter
Specification :
Manufacturer LUTRON Digital Lux Meter
Model LX-101
Dimension 108 x 73 x 23mm
Sensor Probe : 82 x 55 x 7mm
Lux Meter Range 0 – 50,000 Lux, 3 Ranges
Sampling Time 0.4 seconds
Operating Temperature 0 – 50 degree Celcius
Lux meter also known as Light meter, is used to measure the intensity of the light
illumination as distinguished by the human eye. The value gained does not correspond
to the object value of energy radiated, as different wavelength within specific spectrum is
perceived with varying sensitivity by the eye. Therefore, lux meter reading is reading that
is taken in consideration of the variables.
Sensor Probe
Sensor Probe
LCD Display

17 | P a g e
Measuring Tape
Measuring tape is used to determine the positions of the lux meter from the ground level
and also used to determine the grid in the space.
2.3.4 Data Collection Method
Data were collected at non peak hours between 5pm-7pm and peak hours between
8pm-10pm. The readings were taken at 1m and 1.5m level above the ground at each
corresponding time with both daylighting and artificial lightings. Materials used in the
space were studied and recorded to indicate the coefficient value and reflectance value
towards the daylighting and artificial lighting.
18 | P a g e
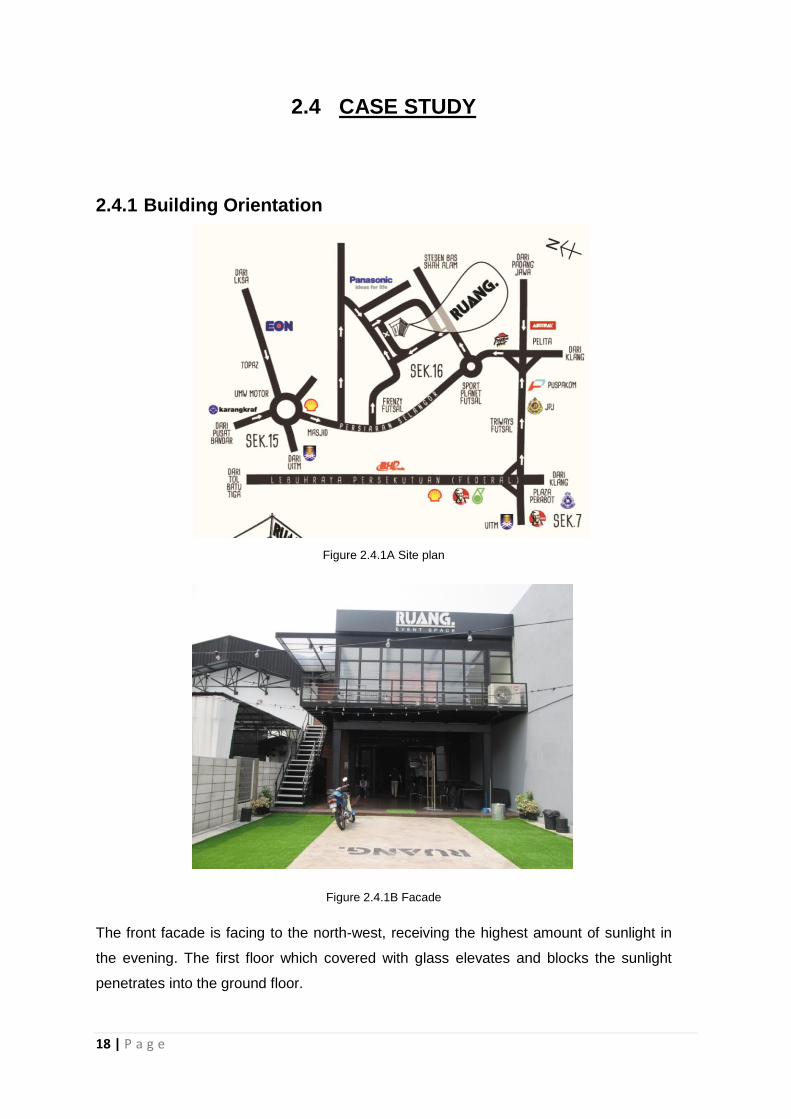
2.4 CASE STUDY
2.4.1 Building Orientation
Figure 2.4.1A Site plan
Figure 2.4.1B Facade
The front facade is facing to the north-west, receiving the highest amount of sunlight in
the evening. The first floor which covered with glass elevates and blocks the sunlight
penetrates into the ground floor.
19 | P a g e
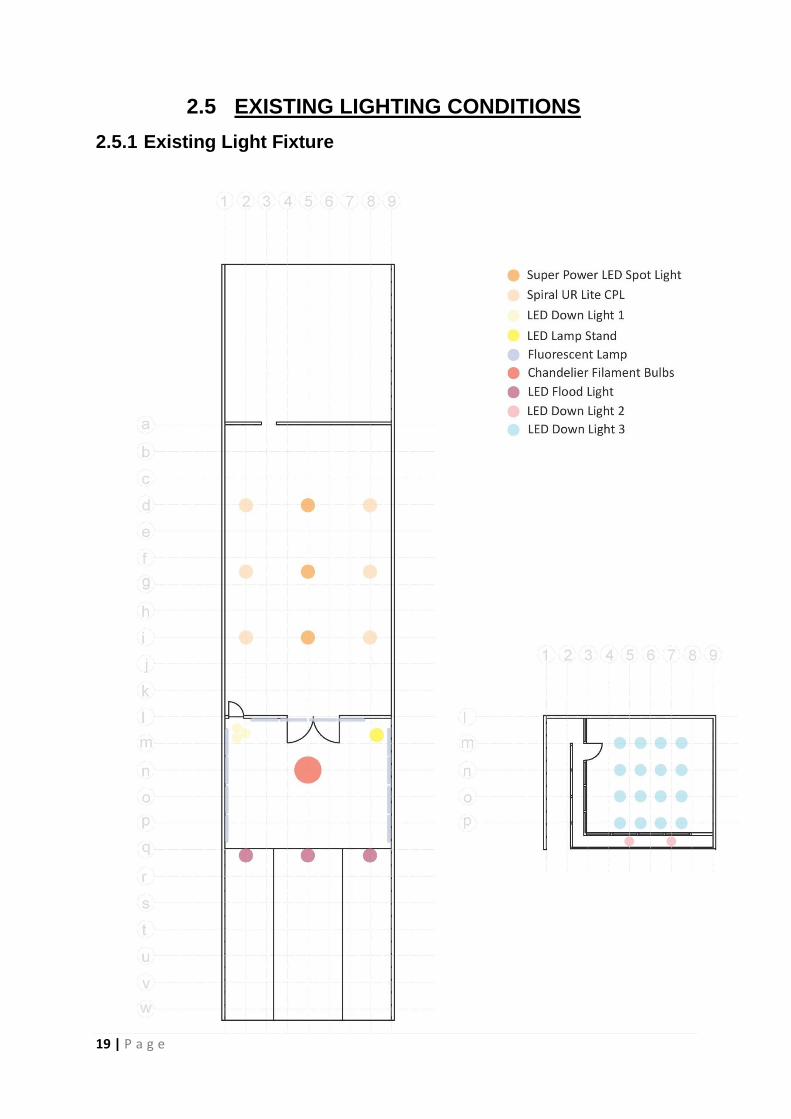
2.5 EXISTING LIGHTING CONDITIONS
2.5.1 Existing Light Fixture

20 | P a g e
Image Type of Lighting Super Power LED Spot
Light
Lamp Luminous Flux (lm) 5000
Specification E27 80% Energy Saving
Rated Colour
Temperature
3000K
Colour Rendering Index 98
Luminaire Type Built in LED Spotlight
Wattage 50W
Placement Middle row of lightings in
the multipurpose hall
Image Type of Lighting Spiral UR Lite CPL
Lamp Luminous Flux (lm) 19500
Specification E27, energy saver,
approx. 8000h lifespan
Rated Colour
Temperature
5000K
Colour Rendering Index 100
Luminaire Type Replaceable bulb for wall-
mounted street lamp
Wattage 325W
Placement Hall wall-mounted lamps
Image Type of Lighting LED Down Light 1
Lamp Luminous Flux (lm) 1200
Specification 80% Energy Saving,
approx. 15000h
Rated Colour
Temperature
3000K
Colour Rendering Index 90
Luminaire Type Decorative Lighting
Wattage 60W
Placement Side entrance metal door

21 | P a g e
Image Type
of Lighting
LED Lamp Stand
Lamp Luminous Flux (lm) 3600
Specification Approx. 15000h lifespan
Rated Colour
Temperature
2700K
Colour Rendering Index 92
Luminaire Type Decorative Lamp Stand
Wattage 60W
Placement On the side at the
entrance
Image Type of Lighting Fluorescent Lamp
Lamp Luminous Flux (lm) 1680
Specification Approx. 30000h lifespan,
non-weatherproof
Rated Colour
Temperature
3900K
Colour Rendering Index 83
Luminaire Type Open Lighting
Wattage 28W
Placement Placed on metal beam
Image Type of Lighting Chandelier Filament
Bulbs
Lamp Luminous Flux (lm) 375
Specification E12 Candelabra
Dimmable Chip-On-Board
(COB) Bulb
Rated Colour
Temperature
2600K
Colour Rendering Index 86
Luminaire Type Dimmable Decorative
Lighting
Wattage 40W
Placement Center of the entrance hall
22 | P a g e
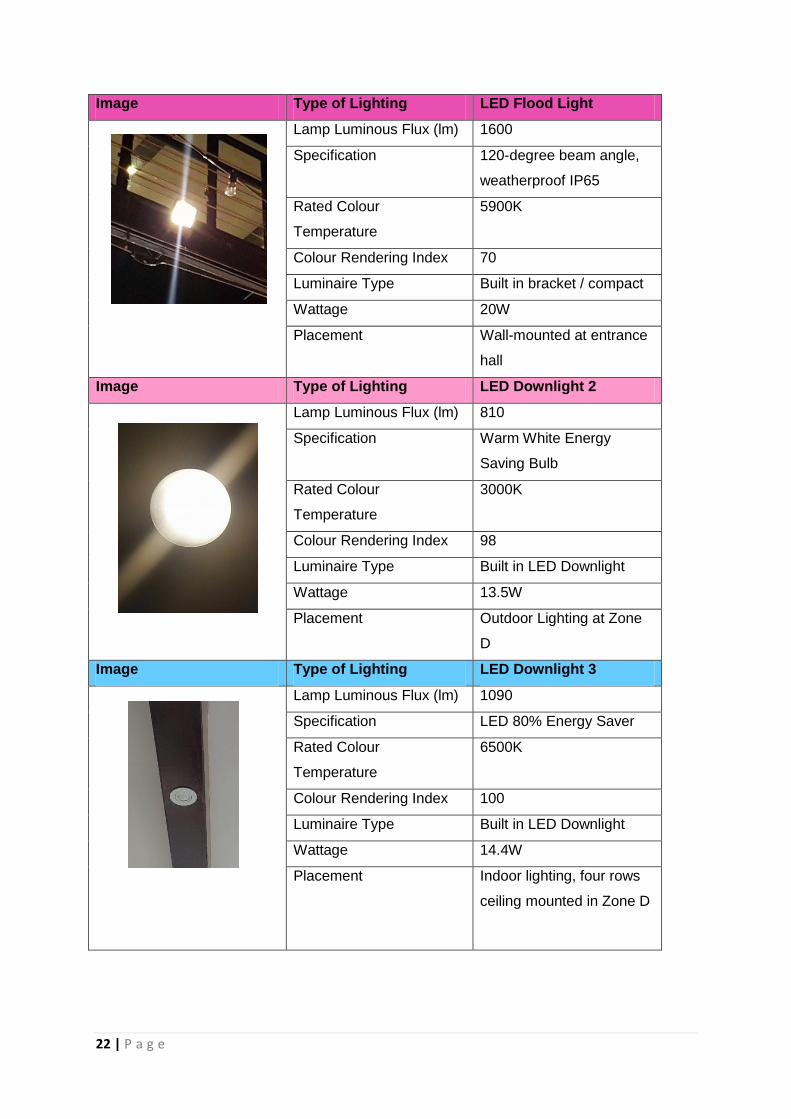
Image Type of Lighting LED Flood Light
Lamp Luminous Flux (lm) 1600
Specification 120-degree beam angle,
weatherproof IP65
Rated Colour
Temperature
5900K
Colour Rendering Index 70
Luminaire Type Built in bracket / compact
Wattage 20W
Placement Wall-mounted at entrance
hall
Image Type of Lighting LED Downlight 2
Lamp Luminous Flux (lm) 810
Specification Warm White Energy
Saving Bulb
Rated Colour
Temperature
3000K
Colour Rendering Index 98
Luminaire Type Built in LED Downlight
Wattage 13.5W
Placement Outdoor Lighting at Zone
D
Image Type of Lighting LED Downlight 3
Lamp Luminous Flux (lm) 1090
Specification LED 80% Energy Saver
Rated Colour
Temperature
6500K
Colour Rendering Index 100
Luminaire Type Built in LED Downlight
Wattage 14.4W
Placement
Indoor lighting, four rows
ceiling mounted in Zone D

23 | P a g e
2.6 MATERIALS & PROPERTIES
The application of materials is an important factor in determining the quality of lighting in
an environment. The materials will affect the total effect of lighting performance in an
enclosed space, known as room Lighting. The lighting can undergo reflection, absorption,
diffusion and diffraction with different shapes, characteristics surface texture and etc of a
material.
Below are the lists of existing material found on the zones of the case study:
Furniture Material
No. Zone
Materials Colour Reflectance Surface Texture
1 Chair
Black 15 Semi- Rough
White 45 Semi- Rough
2 Table
Black 15 Semi- Rough
3 Metal Door
Black 20 Smooth
24 | P a g e
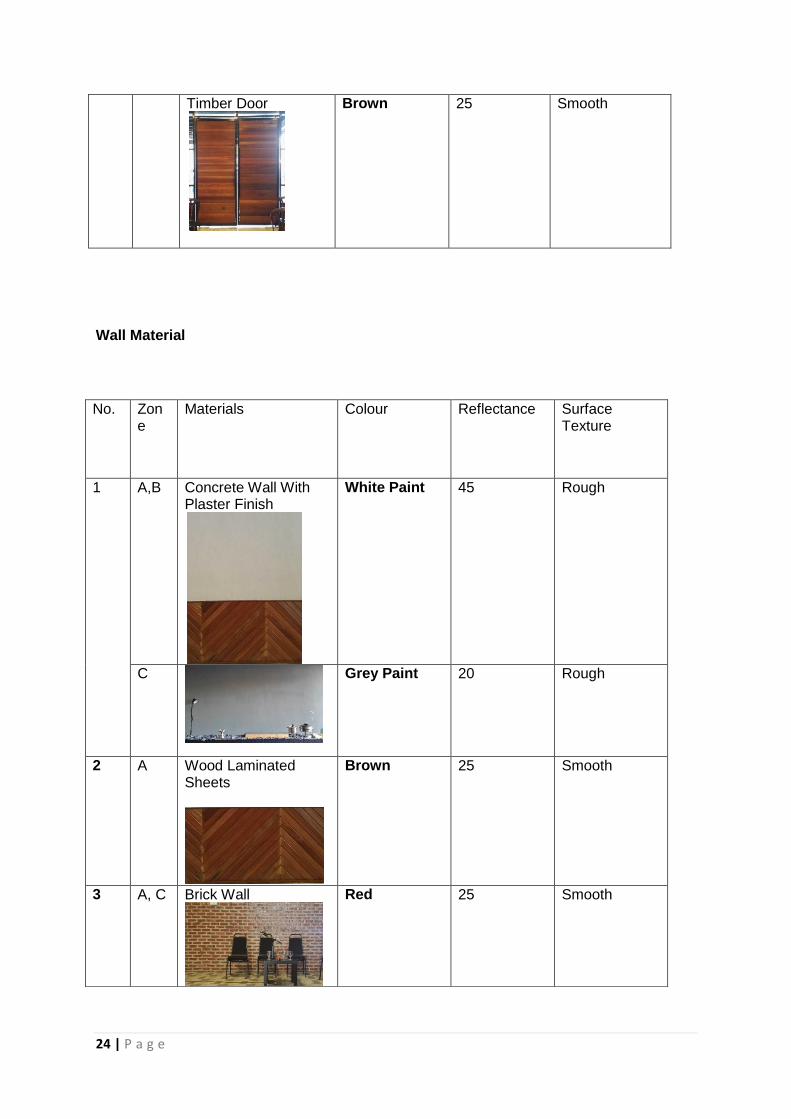
Timber Door
Brown 25 Smooth
Wall Material
No. Zone
Materials Colour Reflectance Surface Texture
1 A,B Concrete Wall With Plaster Finish
White Paint 45 Rough
C
Grey Paint 20 Rough
2 A Wood Laminated Sheets
Brown 25 Smooth
3 A, C Brick Wall
Red 25 Smooth

25 | P a g e
Ceiling Material
No. Zone
Materials Colour Reflectance Surface Texture
1 A Plywood Ceiling with Black paint Finish
Black 15 Rough
2 B Metal Deck Ceiling
Black 20 Smooth
3 C Plywood Ceiling with White Paint Finish
White 45 Smooth
4 A,B,C
Glass Wall
Transparent 0 Smooth
5 A Wood Insulation Panels
Black 15 Rough

26 | P a g e
Floor Material
No. Zone Materials Colour Reflectance Surface Texture
1 A Concrete Floor with White paint Finish
White 45 Semi- Rough
2 B Metal Deck
Grey 20 Rough
3 C Laminated Timber Flooring
Brown 25 Smooth
4 A Carpet Flooring
Cold Colour 20 Semi- Rough
27 | P a g e
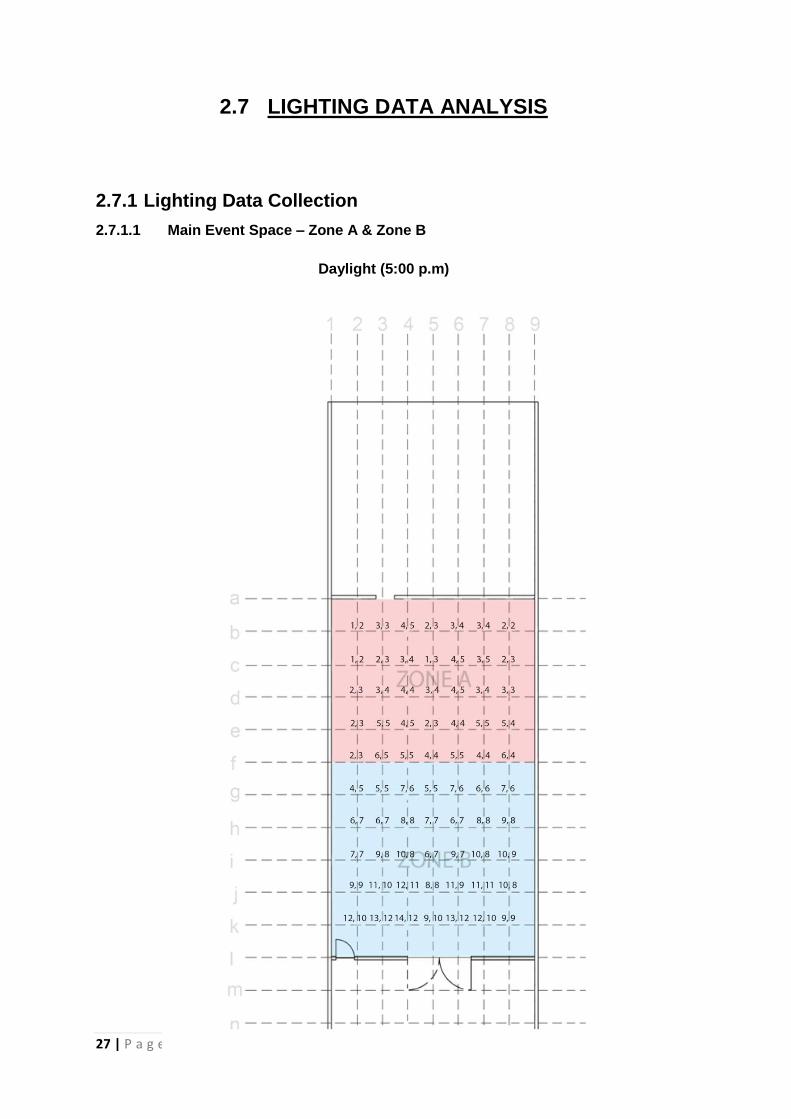
2.7 LIGHTING DATA ANALYSIS
2.7.1 Lighting Data Collection
2.7.1.1 Main Event Space – Zone A & Zone B
Daylight (5:00 p.m)

28 | P a g e
Artificial Lighting (10:00 p.m)

29 | P a g e
2.7.1.2 Covered Outdoor Area – Zone C
Daylight (5:00 p.m)

30 | P a g e
Artificial Lighting (10:00 p.m)
31 | P a g e
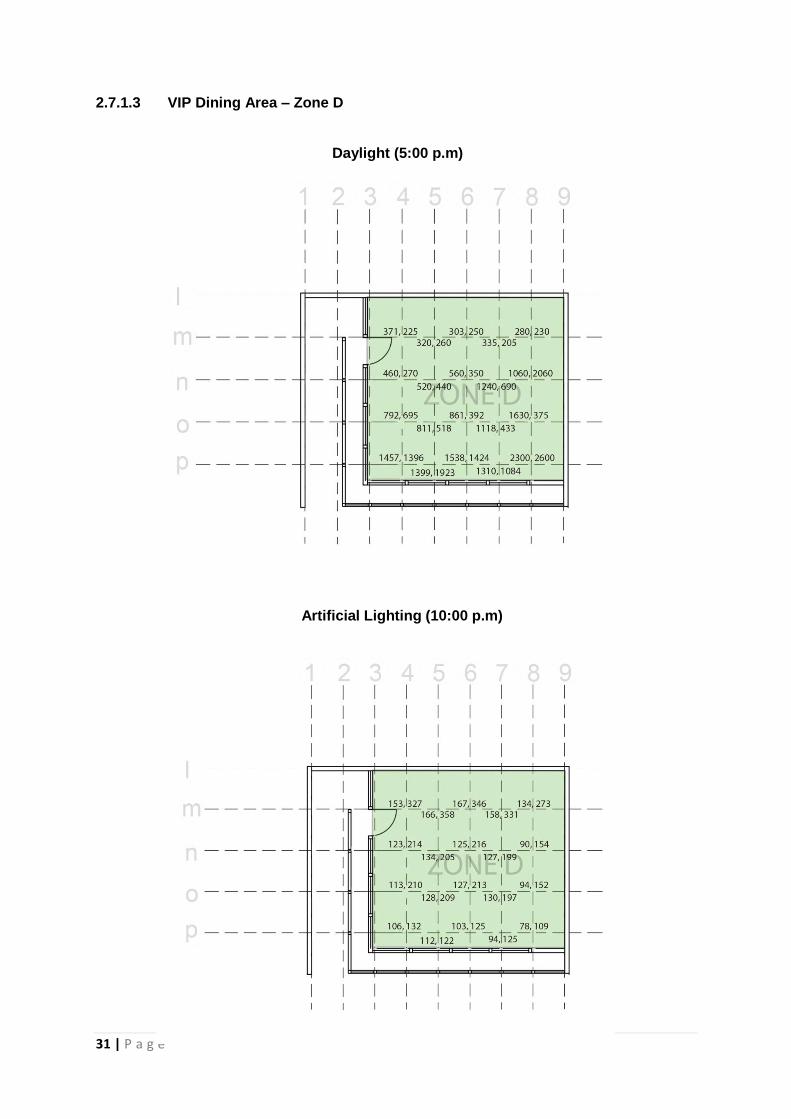
2.7.1.3 VIP Dining Area – Zone D
Daylight (5:00 p.m)
Artificial Lighting (10:00 p.m)
32 | P a g e
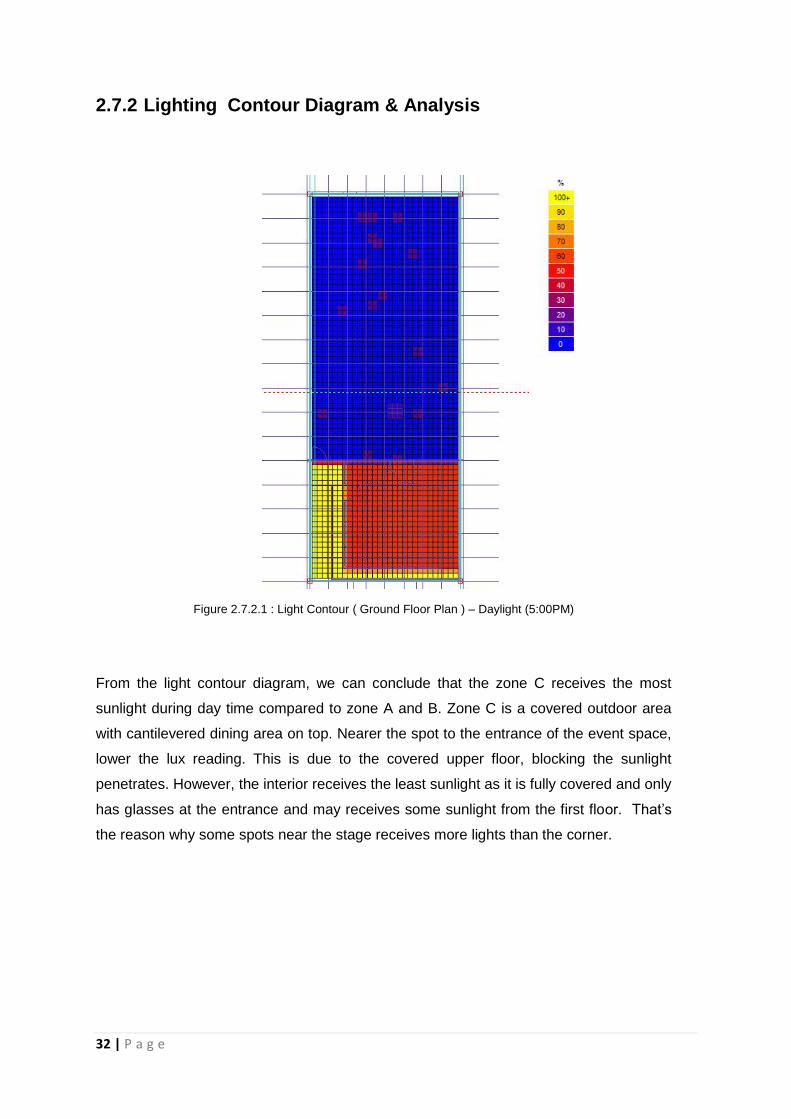
2.7.2 Lighting Contour Diagram & Analysis
Figure 2.7.2.1 : Light Contour ( Ground Floor Plan ) – Daylight (5:00PM)
From the light contour diagram, we can conclude that the zone C receives the most
sunlight during day time compared to zone A and B. Zone C is a covered outdoor area
with cantilevered dining area on top. Nearer the spot to the entrance of the event space,
lower the lux reading. This is due to the covered upper floor, blocking the sunlight
penetrates. However, the interior receives the least sunlight as it is fully covered and only
has glasses at the entrance and may receives some sunlight from the first floor. That’s
the reason why some spots near the stage receives more lights than the corner.

33 | P a g e
Figure 2.7.2.1 : Light Contour (First Floor Plan) – Daylight (5:00PM)
From the diagram above, it shows the light contour of the first floor. At 5:00PM, the
exterior still receive the sunlight. However, for the interior, the amount of sunlight is
higher than the lower ground as there is no blockage from the facade against the
sunlight. The windows at first floor allow the evening sunlight penetrates in.
34 | P a g e
2.8 LIGHTING CALCULATION ANALYSIS
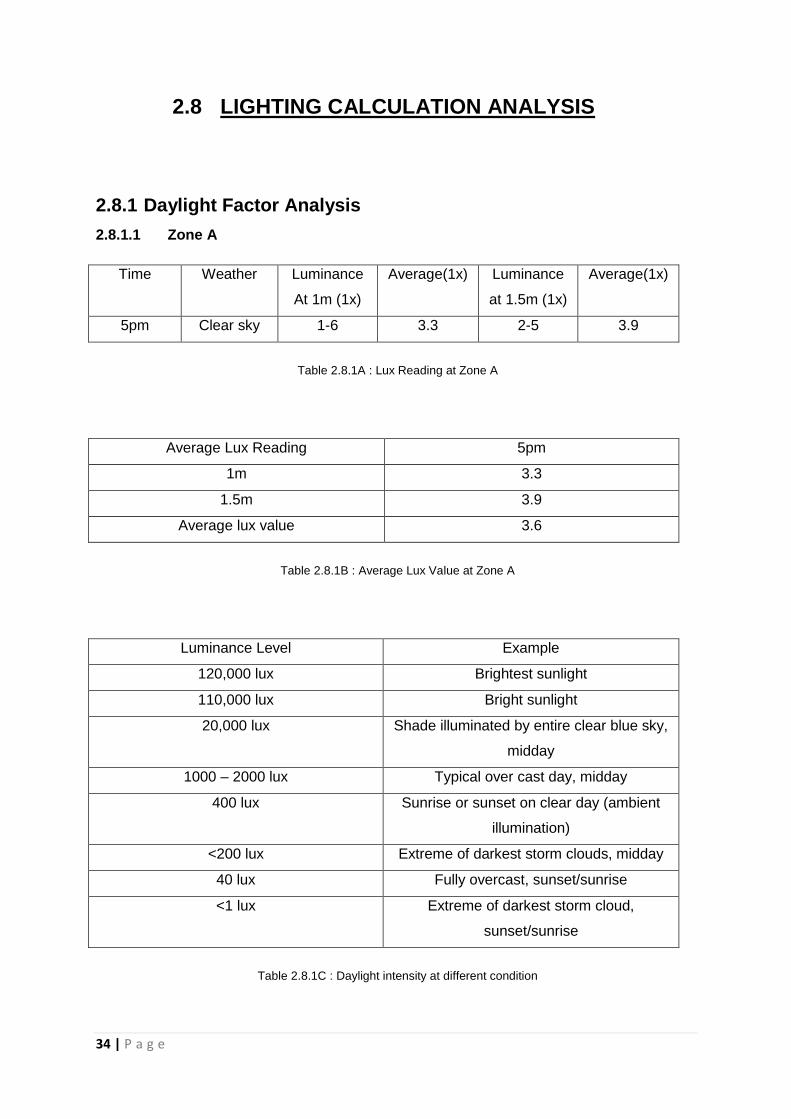
2.8.1 Daylight Factor Analysis
2.8.1.1 Zone A
Time Weather Luminance
At 1m (1x)
Average(1x) Luminance
at 1.5m (1x)
Average(1x)
5pm Clear sky 1-6 3.3 2-5 3.9
Table 2.8.1A : Lux Reading at Zone A
Average Lux Reading 5pm
1m 3.3
1.5m 3.9
Average lux value 3.6
Table 2.8.1B : Average Lux Value at Zone A
Luminance Level Example
120,000 lux Brightest sunlight
110,000 lux Bright sunlight
20,000 lux Shade illuminated by entire clear blue sky,
midday
1000 – 2000 lux Typical over cast day, midday
400 lux Sunrise or sunset on clear day (ambient
illumination)
<200 lux Extreme of darkest storm clouds, midday
40 lux Fully overcast, sunset/sunrise
<1 lux Extreme of darkest storm cloud,
sunset/sunrise
Table 2.8.1C : Daylight intensity at different condition

35 | P a g e
Date and Time 5pm (28 September 2016)
Average lux value reading (E internal) 3.6
Daylight Factor Calculation Formula
internal
external
Standard direct sunlight (E external) 20,000 lux
calculation
=0.018
DF,% Distribution
>6 Very bright with thermal and glare problem
3 – 6 Bright
1 – 3 Average
0 – 1 Dark
Table 2.8.1D : Daylight Factor, DF
Daylight factor is real Daylight factor at Zone A is relatively low. The calculation shown is
0.018 which is the range of dark according to the table provided in MS1525. This is due
to the space is fully covered with the wall, except the entrance let the lights come in.

36 | P a g e
2.8.1.2 Zone B
Time Weather Luminance
At 1m (1x)
Average(1x) Luminance
at 1.5m (1x)
Average(1x)
5pm Clear sky 3-14 7 4-12 8.1
Table 2.8.1.2A : Lux Reading at Zone B
Average Lux Reading 5pm
1m 7
1.5m 8.1
Average lux value 7.6
Table 2.8.1.2B : Average Lux Value at Zone B
Luminance Level Example
120,000 lux Brightest sunlight
110,000 lux Bright sunlight
20,000 lux Shade illuminated by entire clear blue sky,
midday
1000 – 2000 lux Typical over cast day, midday
400 lux Sunrise or sunset on clear day (ambient
illumination)
<200 lux Extreme of darkest storm clouds, midday
40 lux Fully overcast, sunset/sunrise
<1 lux Extreme of darkest storm cloud,
sunset/sunrise
Table 2.8.1.2C : Daylight intensity at different condition

37 | P a g e
Date and Time 5pm (28 September 2016)
Average lux value reading (E internal) 7.6
Daylight Factor Calculation Formula
internal
external
Standard direct sunlight (E external) 20,000 lux
calculation
.
0,000
= 0.038
DF,% Distribution
>6 Very bright with thermal and glare problem
3 – 6 Bright
1 – 3 Average
0 – 1 Dark
Table 2.8.1.2D : Daylight Factor, DF
Daylight factor at Zone B is relatively low, higher than Zone A. The calculation shown is
0.038 which is the range of dark according to the table provided in MS1525. This is due
to the space is fully covered with the wall, except the entrance let the lights come in. It is
also nearer to the entrance, so it has higher daylight factor compared to Zone A.

38 | P a g e
2.8.1.3 Zone C
Time Weather Luminance
At 1m (1x)
Average(1x) Luminance
at 1.5m (1x)
Average(1x)
5pm Clear sky 33-1630 576.7 13-1097 438.6
Table 2.8.1.3A : Lux Reading at Zone C
Average Lux Reading 5pm
1m 576.7
1.5m 438.6
Average lux value 507.7
Table 2.8.1.3B : Average Lux Value at Zone C
Luminance Level Example
120,000 lux Brightest sunlight
110,000 lux Bright sunlight
20,000 lux Shade illuminated by entire clear blue sky,
midday
1000 – 2000 lux Typical over cast day, midday
400 lux Sunrise or sunset on clear day (ambient
illumination)
<200 lux Extreme of darkest storm clouds, midday
40 lux Fully overcast, sunset/sunrise
<1 lux Extreme of darkest storm cloud,
sunset/sunrise
Table 2.8.1.3C : Daylight intensity at different condition

39 | P a g e
Date and Time 5pm (28 September 2016)
Average lux value reading (E internal) 507.7
Daylight Factor Calculation Formula
internal
external
Standard direct sunlight (E external) 20,000 lux
calculation
0,000
= 2.54
DF,% Distribution
>6 Very bright with thermal and glare problem
3 – 6 Bright
1 – 3 Average
0 – 1 Dark
Table 2.8.1.3D : Daylight Factor, DF
Daylight factor at Zone C is at average range. The calculation shown is 2.54 which is the
range of average according to the table provided in MS1525. This is due to the space is
located at the halfly outdoor area. It is covered by the elevated floor above.

40 | P a g e
2.8.1.4 Zone D
Time Weather Luminance
At 1m (1x)
Average(1x) Luminance
at 1.5m (1x)
Average(1x)
5pm Clear sky 320-2300 922.8 205-2600 841.9
Table 2.8.1.4A : Lux Reading at Zone D
Average Lux Reading 5pm
1m 922.8
1.5m 841.9
Average lux value 882.4
Table 2.8.1.4B : Average Lux Value at Zone D
Luminance Level Example
120,000 lux Brightest sunlight
110,000 lux Bright sunlight
20,000 lux Shade illuminated by entire clear blue sky,
midday
1000 – 2000 lux Typical over cast day, midday
400 lux Sunrise or sunset on clear day (ambient
illumination)
<200 lux Extreme of darkest storm clouds, midday
40 lux Fully overcast, sunset/sunrise
<1 lux Extreme of darkest storm cloud,
sunset/sunrise
Table 2.8.1.4C : Daylight intensity at different condition

41 | P a g e
Date and Time 5pm (28 September 2016)
Average lux value reading (E internal) 882.4
Daylight Factor Calculation Formula
internal
external
Standard direct sunlight (E external) 20,000 lux
calculation
.4
0,000
= 4.412
DF,% Distribution
>6 Very bright with thermal and glare problem
3 – 6 Bright
1 – 3 Average
0 – 1 Dark
Table 2.8..4D : Daylight Factor, DF
Daylight factor at Zone D is the highest among all the zones. The calculation shown is
4.412 which is the range of bright according to the table provided in MS1525. This is due
to the space is located at the first floor and surrounded with glass window. Sunlight can
be shines into the space.

42 | P a g e
2.8.2 Artificial Lighting Analysis
2.8.2.1 Zone A
Dimension of Space / L × W (m)
Total Floor Area / A (m2)
Types of Lighting Fixtures Spiral UR Lite CPL Super Power LED Spot
Light
Number of Lighting Fixtures / N 2 1
Lumen of Lighting Fixtures / F
(lm)
19500 5000
Height of Luminaire (m) 5.9 5.85
Height of Work Level (m) 0.5 0.5
Mounting Height / Hm (m) 5.4 5.35
Reflection Factors Ceiling: Black Plywood (0.45)
Wall: Brick Wall (0.25), Wooden Insulation
Panel (0.15), Wooden Laminated Sheets
(0.25), White Concrete Wall (0.45), Grey
Concrete Wall (0.20)
*Wall average = 0.26
Flooring: Carpet Flooring (0.20), White
Concrete Flooring (0.45)
*Flooring average = 0.33
Room Index, RI / K
.0 . 4
.4 .0 . 4
0.
.0 . 4
. .0 . 4
0. 4
Utilization Factor / UF
(Referred Table)
0.3 0.3
Maintenance Factor / MF 0.8 0.8
Standard Illuminance (Lux) Multipurpose: 300 (Panduan Teknik JKR)
43 | P a g e
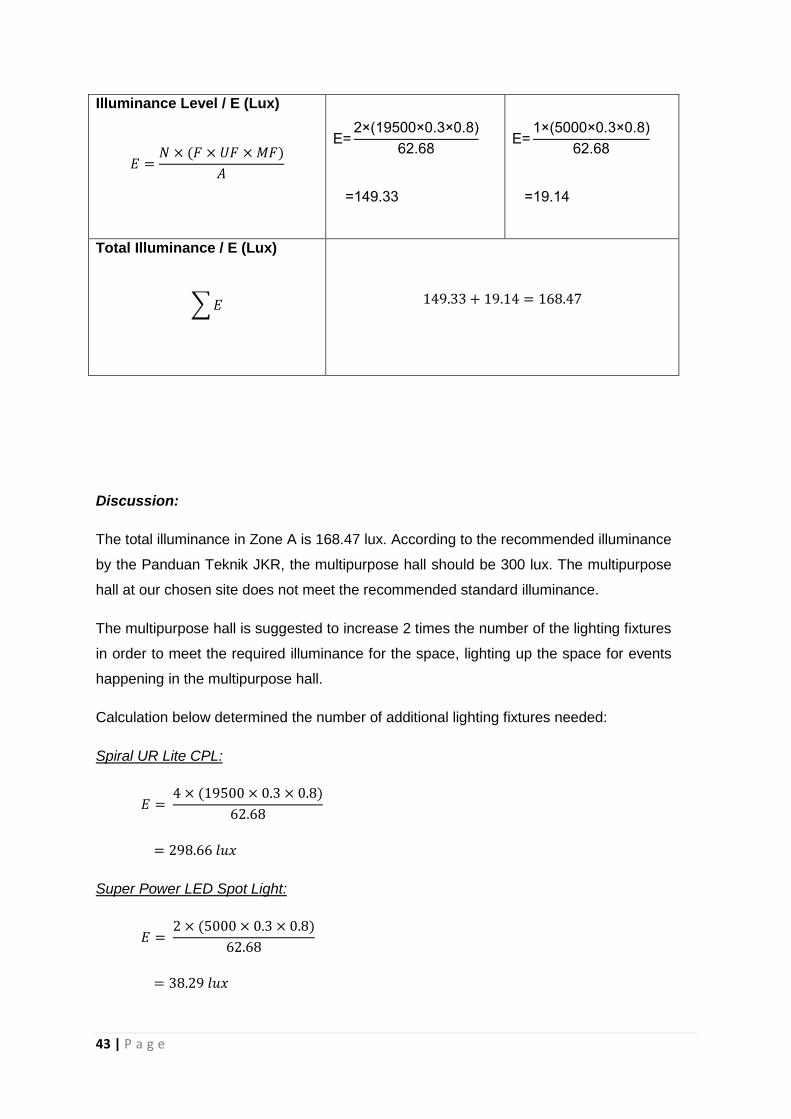
Illuminance Level / E (Lux)
00 0. 0.
.
4 .
000 0. 0.
.
. 4
Total Illuminance / E (Lux)
Discussion:
The total illuminance in Zone A is 168.47 lux. According to the recommended illuminance
by the Panduan Teknik JKR, the multipurpose hall should be 300 lux. The multipurpose
hall at our chosen site does not meet the recommended standard illuminance.
The multipurpose hall is suggested to increase 2 times the number of the lighting fixtures
in order to meet the required illuminance for the space, lighting up the space for events
happening in the multipurpose hall.
Calculation below determined the number of additional lighting fixtures needed:
Spiral UR Lite CPL:
Super Power LED Spot Light:

44 | P a g e
The above calculations showed that increasing 2 times the number of lighting fixtures is
able to reach the recommended standard illuminance for a multipurpose hall, with a
slight exceeding illuminance level of 36.95 lux. This will help illuminate the space better,
giving the users in the space a better lighting experience.

45 | P a g e
2.8.2.2 Zone B
Dimension of Space / L × W (m)
Total Floor Area / A (m2)
Types of Lighting Fixtures Spiral UR Lite CPL Super Power LED Spot
Light
Number of Lighting Fixtures / N 4 2
Lumen of Lighting Fixtures / F
(lm)
19500 5000
Height of Luminaire (m) 5.9 5.85
Height of Work Level (m) 0.5 0.5
Mounting Height / Hm (m) 5.4 5.35
Reflection Factors Ceiling: Black Plywood (0.45)
Wall: Glass Wall (0), Brick Wall (0.25), Wooden
Insulation Panel (0.15), Wooden Laminated
Sheets (0.25), White Concrete Wall (0.45), Grey
Concrete Wall (0.20), Black Metal Door (0.2),
Timber Door (0.25)
*Wall average = 0.22
Flooring: White Concrete Flooring (0.45)
Room Index, RI / K
. . 4
.4 . . 4
0.
. . 4
. . . 4
0.
Utilization Factor / UF
(Referred Table)
0.37 0.37
Maintenance Factor / MF 0.8 0.8
Standard Illuminance (Lux) Multipurpose: 300 (Panduan Teknik JKR)
Illuminance Level / E (Lux)
4 00 0. 0.
4.0
.
000 0. 0.
4.0
.
46 | P a g e
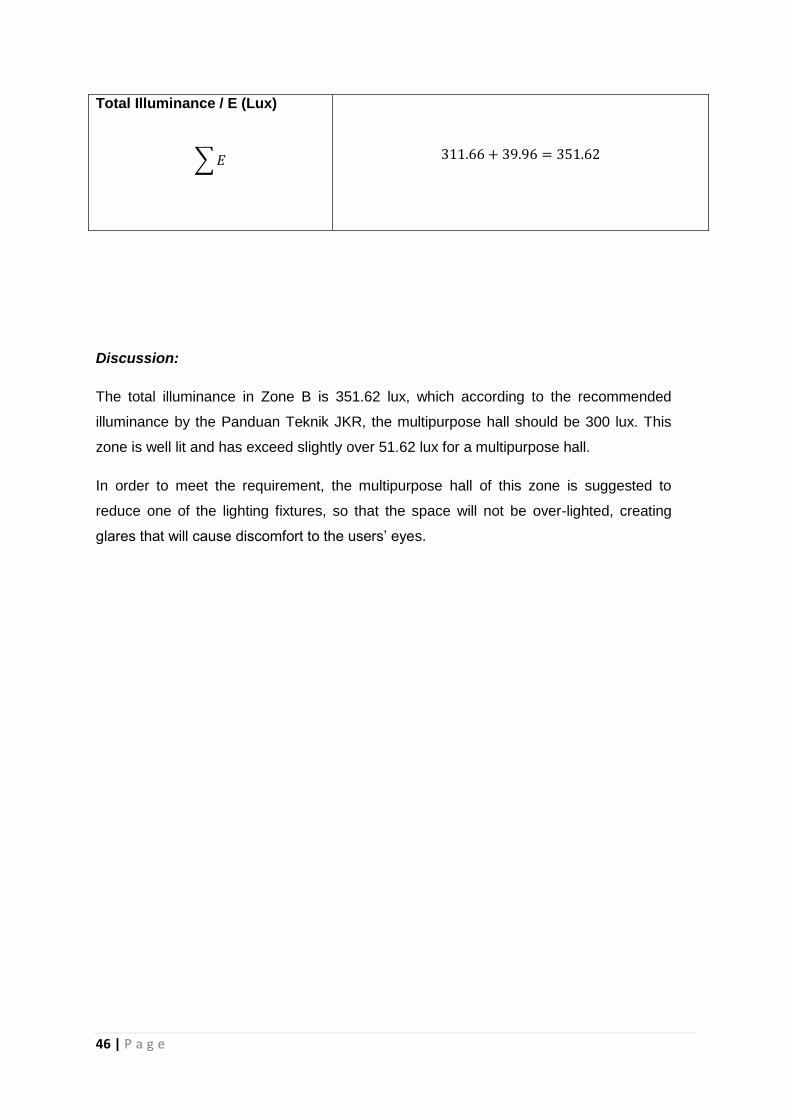
Total Illuminance / E (Lux)
Discussion:
The total illuminance in Zone B is 351.62 lux, which according to the recommended
illuminance by the Panduan Teknik JKR, the multipurpose hall should be 300 lux. This
zone is well lit and has exceed slightly over 51.62 lux for a multipurpose hall.
In order to meet the requirement, the multipurpose hall of this zone is suggested to
reduce one of the lighting fixtures, so that the space will not be over-lighted, creating
glares that will cause discomfort to the users’ eyes.

47 | P a g e
2.8.2.3 Zone C
Dimension of
Space / L × W (m)
Total Floor Area / A
(m2)
Types of Lighting
Fixtures
Fluorescent
Lamp
LED Down
Light 1
LED Lamp
Stand
Chandelier Filament
Bulbs
Number of Lighting
Fixtures / N 12 3 1 10
Lumen of Lighting
Fixtures / F (lm) 1680 1200 3600 375
Height of Luminaire
(m) 3.5 3.3 1.8 3.4
Height of Work
Level (m) 0.8 0.8 0.8 0.8
Mounting Height /
Hm (m) 2.7 2.5 1.0 2.6
Reflection Factors Ceiling: Black Metal (0.20)
Wall: Grey Concrete Wall (0.20), Brick Wall (0.25), Glass Wall (0),
Timber Door (0.25), Black Metal Door (0.20)
*Wall average = 0.18
Flooring: Laminated Timber Flooring (0.25)
Room Index, RI / K
.0 . 4
. .0 . 4
.4
.0 . 4
. .0 . 4
.
.0 . 4
.0 .0 . 4
.
.0 . 4
. .0 . 4
.
Utilization Factor /
UF
(Referred Table)
0.43 0.47 0.58 0.47
Maintenance Factor
/ MF 0.8 0.8 0.8 0.8
Standard Entrance Hall: 100 (MS1525:2014)

48 | P a g e
Illuminance (Lux)
Illuminance Level /
E (Lux)
0 0.4 0.
.
0. 4
00 0.4 0.
.
.
00 0. 0.
.
.
0.4 0.
.
.
Total Illuminance /
E (Lux)
Discussion:
The total illuminance in Zone C is 181.39 lux, which according to the recommended
illuminance by the MS1525:2014 Second Revision, the entrance hall should be 100 lux.
This zone is strongly lit and has exceed over 81.39 lux for an entrance hall.
In order to meet the requirement, the entrance hall of this zone is suggested to just use
the fluorescent lamps, which it has already efficient and sufficient illuminance of 110.64
lux to lit up the space. That way the space will not be over-lighted, creating glares that
will cause discomfort to the users’ eyes. Also, during daytime it is unnecessary to use
artificial lighting since there is sufficient natural lighting.

49 | P a g e
2.9 CONCLUSION
From our observation, we think that Zone A and B are quite dark compared to Zone C
and D during the day time. However, during the night time it is vice versa.
From our measurement and calculation, our observation can be proved to be correct.
During the daytime, the interior is quite dark but the lighting fixture provided in the space
is not enough for the space to be function. From the lumen method, we have found the
number of lighting fixture to installed in the space to reach the recommended standard
illumination of the space.

50 | P a g e
3.0
ACOUSTIC
PERFORMANCE
EVALUATION
51 | P a g e
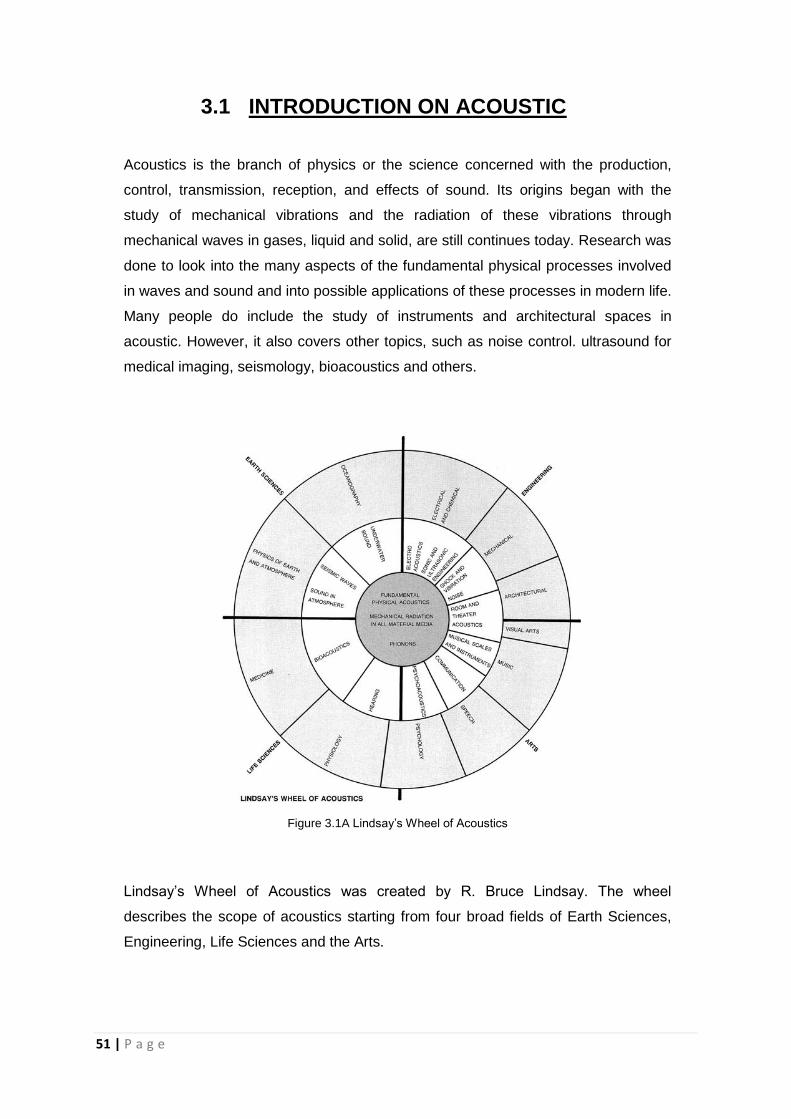
3.1 INTRODUCTION ON ACOUSTIC
Acoustics is the branch of physics or the science concerned with the production,
control, transmission, reception, and effects of sound. Its origins began with the
study of mechanical vibrations and the radiation of these vibrations through
mechanical waves in gases, liquid and solid, are still continues today. Research was
done to look into the many aspects of the fundamental physical processes involved
in waves and sound and into possible applications of these processes in modern life.
Many people do include the study of instruments and architectural spaces in
acoustic. However, it also covers other topics, such as noise control. ultrasound for
medical imaging, seismology, bioacoustics and others.
Figure 3.1A Lindsay’s Wheel of Acoustics
Lindsay’s Wheel of Acoustics was created by . Bruce Lindsay. The wheel
describes the scope of acoustics starting from four broad fields of Earth Sciences,
Engineering, Life Sciences and the Arts.
52 | P a g e
3.2 PRECEDENT STUDY
3.2.1 Introduction
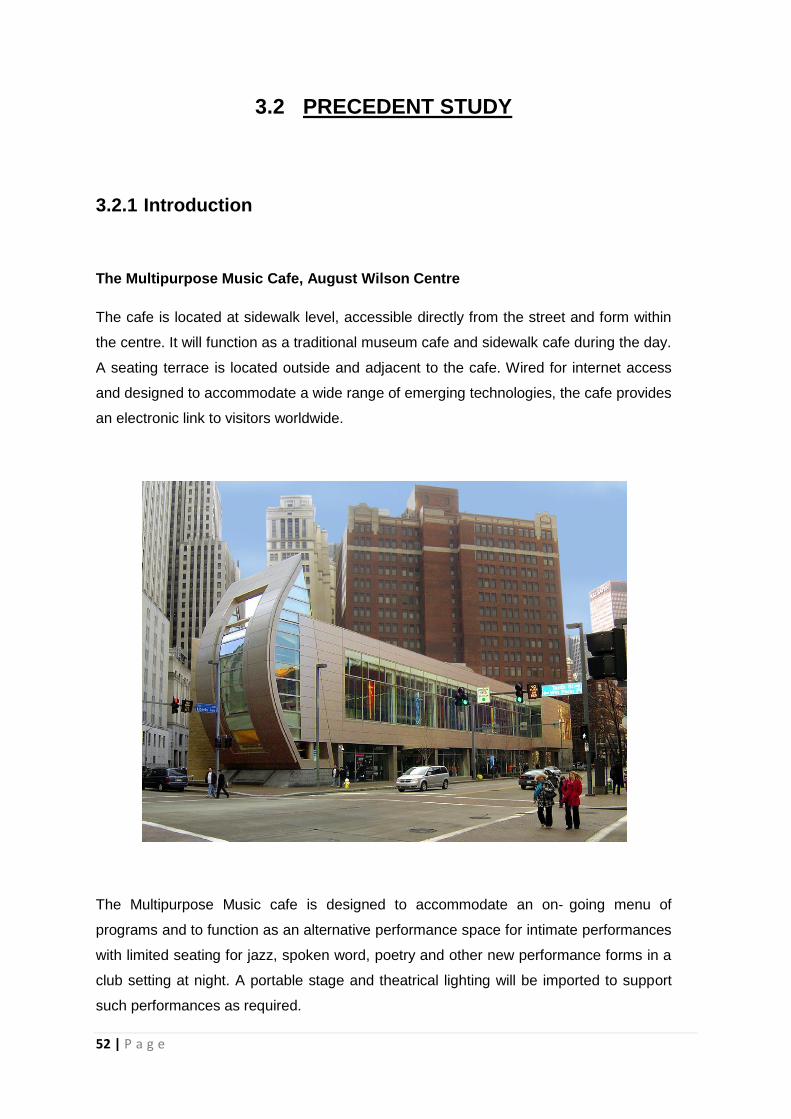
The Multipurpose Music Cafe, August Wilson Centre
The cafe is located at sidewalk level, accessible directly from the street and form within
the centre. It will function as a traditional museum cafe and sidewalk cafe during the day.
A seating terrace is located outside and adjacent to the cafe. Wired for internet access
and designed to accommodate a wide range of emerging technologies, the cafe provides
an electronic link to visitors worldwide.
The Multipurpose Music cafe is designed to accommodate an on‐ going menu of
programs and to function as an alternative performance space for intimate performances
with limited seating for jazz, spoken word, poetry and other new performance forms in a
club setting at night. A portable stage and theatrical lighting will be imported to support
such performances as required.

53 | P a g e
This music cafe is a large rectangular box covered by glass walls, a hard floor and a
sound absorbing treatment on the ceiling behind baffles and duct-work. The space is
design to acknowledge the Cafe mechanical and natural resourced produced. It need for
acoustical design elements which hanging long material baffles and acoustical blanket
over 80% of the underside of the floor structure above.
Based on the use description provided by architect, a reverberation time of
approximately 1.0 second would be ideal. This would place the space somewhere
between speech and speech/ music use. According to the architectural acoustics:
principles and design , a very high STC value (60+) between the music cafe and lobby
would be desirable. This is important to both spaces, as a spoken word performance in
the cafe could suffer if a large crowd was gathering in the lobby for a performance in the
main theater, while the lobby must remain quiet during a performance in the main theater
if patrons are entering or exiting the auditorium since a main set of doors is directly
across from the cafe.
This function is very important as it relates back to our chosen site Ruang (Event
Space), where space are multi-functionary and architectural acoustics is important
to keep to space functioning well.

54 | P a g e
3.2.2 Reverberation Analysis
Reverberation is the prolongation of sound as a result of successive reflections in an
enclosed space after the sound source is turned off.
Figure 3.2.2A & 3.2.2B shows the interior of the Multipurpose music cafe
Figure 3.2.2C : Existing Reflected Ceiling Plan

55 | P a g e
Figure 3.2.2D : Music Café Reverberation Time – Existing Design.
Based on Figure3.2.2D, it illustrates that the existing reverberation times are far from
ideal. One important consideration, however, is that the manufacturer of the metal baffle
ceiling system (Chicago metallic) does not have acoustic data for the product. Therefore,
the product has been omitted from the calculations. Including the baffles in the
calculation would like reduce the very high reverberation times at the lower frequencies,
but It would also reduce the reverberation times at the higher frequencies which are
already lower than the ideal.
56 | P a g e
3.2.3 Sound Transmission Class ( STC ) Analysis
Sound Transmission Class (STC) is an index rating of how well a building partition
attenuates airborne sound.
Through the analysis of the sound transmission class (STC) on the wall between the
cafe and the main lobby reveals a potential for unwanted noise transfer between the
spaces. At 46, the calculated STC falls far below the ideal value of 60+. This problem Is
generated by the use of glass doors to 1/2 laminated glass improves the STC to 49, but
this is only a marginal increase. To really improve the potentially negative situation,
significant changes to the architecture are required. These changes may include
changing the glass to another material such as wood or creating a small vestibule at the
entrances.

57 | P a g e
3.2.4 New Proposed Baffled System
However, in order to improve the reverberation time is much more realistic changes,in
order to do this, the metal baffles and acoustical blanket are eliminated,replacing them
with floating fiberglass sound absorbing panels that are faced in perforated metal. This
product in figure .this change will most likely reduce cost by replacing two material with
one.some changes were necessary In the location and type of HVAC diffusers and
sprinkler heads. Figure 7.15 show the reverberation time based on 900 s feet of the new
acoustics panels. Figure shows the proposed layout of these panels.
Figure 3.2.4A : Alpro Metal Acoustic Baffles for the new design in Multipurpose music cafe

58 | P a g e
The new reverberation times are very close to the desired values. According to Architect
ural Acoustics: Principles and Design optimum reverberation times at 125 hertz should b
e 1.3 times the ideal reverberation time at 500 hertz and a multiplier of 1.15 should be us
ed at 250 hertz. These multipliers are used to correct for the fact that the human ear is l
ess sensitive at lower frequencies. With these factors included, the new design is very n
ear the target. The new ceiling system will provide superior acoustical performance at a
reduced cost.
Figure 3.2.4B : Music Cafe Reflected Ceiling Plan – New Design
Figure 3.2.4C : Music Cafe Reverberation Time – New Design.
Figure 3.2.4D : Music Cafe New Baffle Schedule of Materials

59 | P a g e
3.2.5 Conclusion
In conclusion, the proposed solution to improve reverberation times is both economical
and aesthetically pleasing for the analyzed space, The multipurpose music cafe. Noise
reduction with a space can be archived by two methods improvement of reverberation
time and also increasing the STC value. Reverberation time can be improved to ideal
level through the use of absorptive materials in ceilings and surrounding walls. Provide
optimum acoustical environment. On the other hand, STC values can be increased by
changing the materials of the wall in between spaces, which reduces transmission of
sound from a space, which reduces transmission of sound from a spaces to another,
eliminating unwanted noise.
The biggest challenge in acoustic design in August Wilson Centre is not only improving
the acoustic issues but also the visual aspect. As a designer, it is ultimately the
architect’s decision to maintain a visual quality as well as the appearance for the
performance of the place. August Wilson Centre has being unique architecture throught
unyelding visual character and makes the enginerring of the building complex task.
60 | P a g e
3.3 RESEARCH METHODOLOGY
3.3.1 Precedent Studies
Precedent study chosen helps to have a better understanding on how the surrounding
sound, materials, electrical appliances affect the acoustics of the space.
3.3.2 Preparations
1. In obtaining approval to use site as case study, calls and emails were made to the
different chosen places.
2. The plan drawings were obtained from the site owner.
3. Preliminary study and identification of the spaces were studied.
4. Precedent studies were done to have a better understanding of how lights function or
affect in the space.
5. Gridlines with distance of 1.5m was plotted on the plan for recording purposes.
6. Sound Level Meter was supplied by the tutors.
7. The equipment was tested before attending the site visit.
8. A basic standard and regulations such as ASHRAE and MS1525 were also studied
before hand to analyse and compare the readings later on.
61 | P a g e
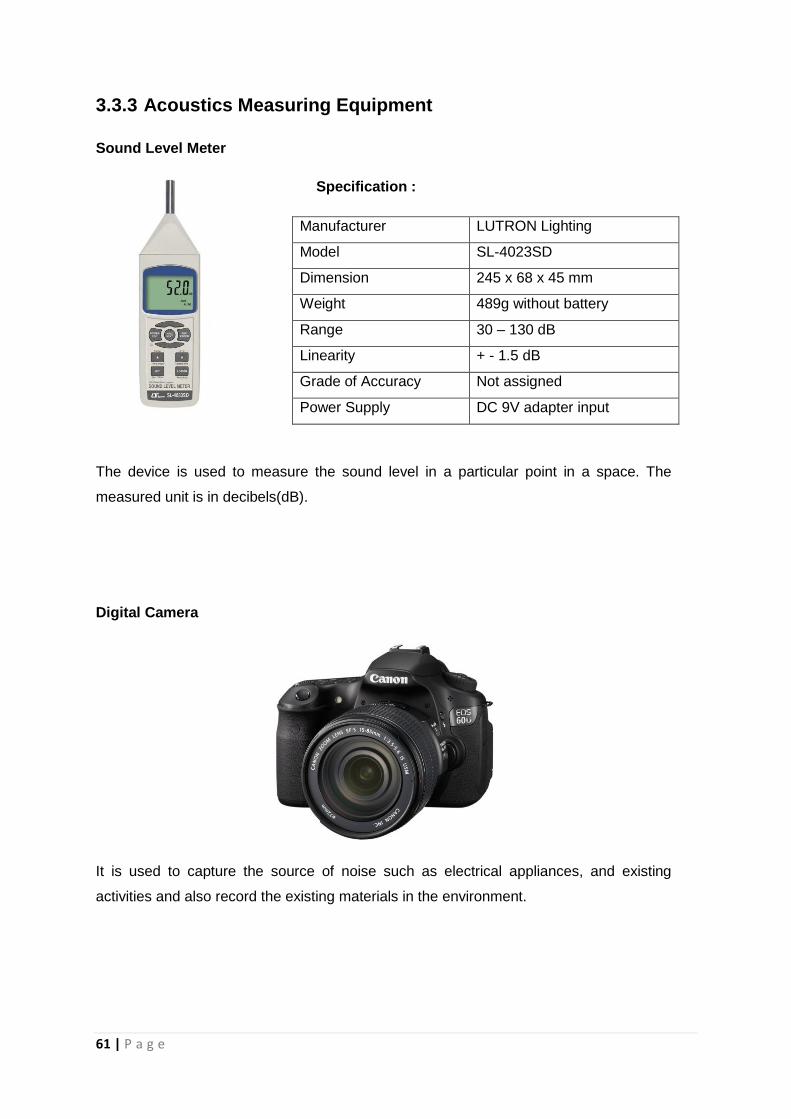
3.3.3 Acoustics Measuring Equipment
Sound Level Meter
Specification :
Manufacturer LUTRON Lighting
Model SL-4023SD
Dimension 245 x 68 x 45 mm
Weight 489g without battery
Range 30 – 130 dB
Linearity + - 1.5 dB
Grade of Accuracy Not assigned
Power Supply DC 9V adapter input
The device is used to measure the sound level in a particular point in a space. The
measured unit is in decibels(dB).
Digital Camera
It is used to capture the source of noise such as electrical appliances, and existing
activities and also record the existing materials in the environment.

62 | P a g e
Measuring Tape
Measuring tape is used to determine the positions of the sound level meter from the
ground level and also used to determine the grid in the space.
3.3.4 Data Collection Method
Data were collected at non peak hours between 5pm-7pm and peak hours between
8pm- 0pm. The acoustics’ readings were taken according to the intersection of the grid
lines at 1m above ground. It was ensured that the sound level meter stabilizes with the
surrounding noise before the readings were taken. The noise source, furniture and
materials used in the spaces were analysed and recorded as there may affect the sound
level recorded.

63 | P a g e
3.4 EXISTING NOISE ANALYSIS
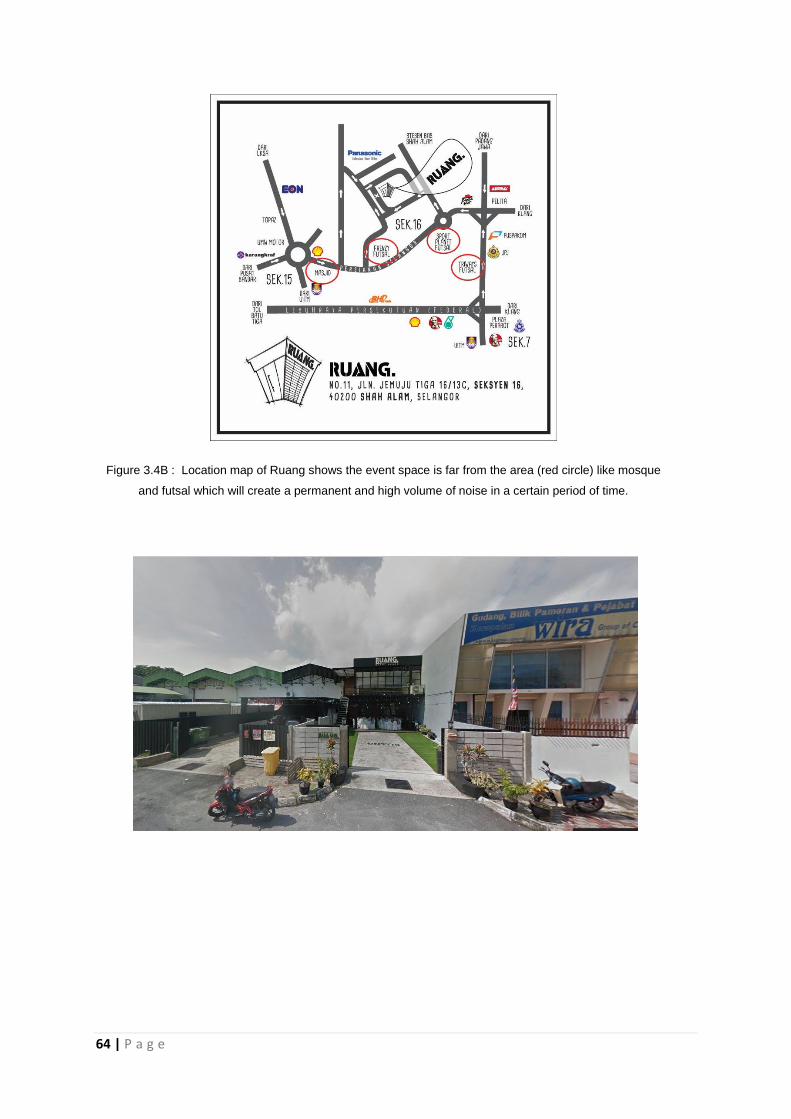
Located at industrial zone where many branded product factories situated. Ruang is
surrounded by many factories and parking is just provided right in front the event space.
Ruang has received plenty of noise from the primary and secondary road as it is facing
these two road which is the only road vehicles usually used and the distance is quite
near. There are tall trees planted between the primary and secondary road which
believe to use as buffer zone that can reduced and blocked the noise from the road but
we found that the tress do not work well on the noise reducing because some of the
trees are decaying and some of the tress are being cut off.
Figure 3.4A : External sound sources from surrounding.
64 | P a g e
Figure 3.4B : Location map of Ruang shows the event space is far from the area (red circle) like mosque
and futsal which will create a permanent and high volume of noise in a certain period of time.

65 | P a g e
Figure 3.4C. & 3.4D : Factories and the vehicles are the main sound source at this site.
Figure 3.4E : The tress as a buffer zone but it do not work well to Ruang.
There is a buffer zone in front the event space with a row of tall trees. But we noticed
that the buffer zone does not work really well on blocking and reducing the noise from
the primary road as we observed that the trees are being chopped and start to decay.
Maintenance and upgrading of the buffer zone should take more concerns and notes
from the authorities.
66 | P a g e
3.4.1 External Noise
3.4.1.1 Site Context
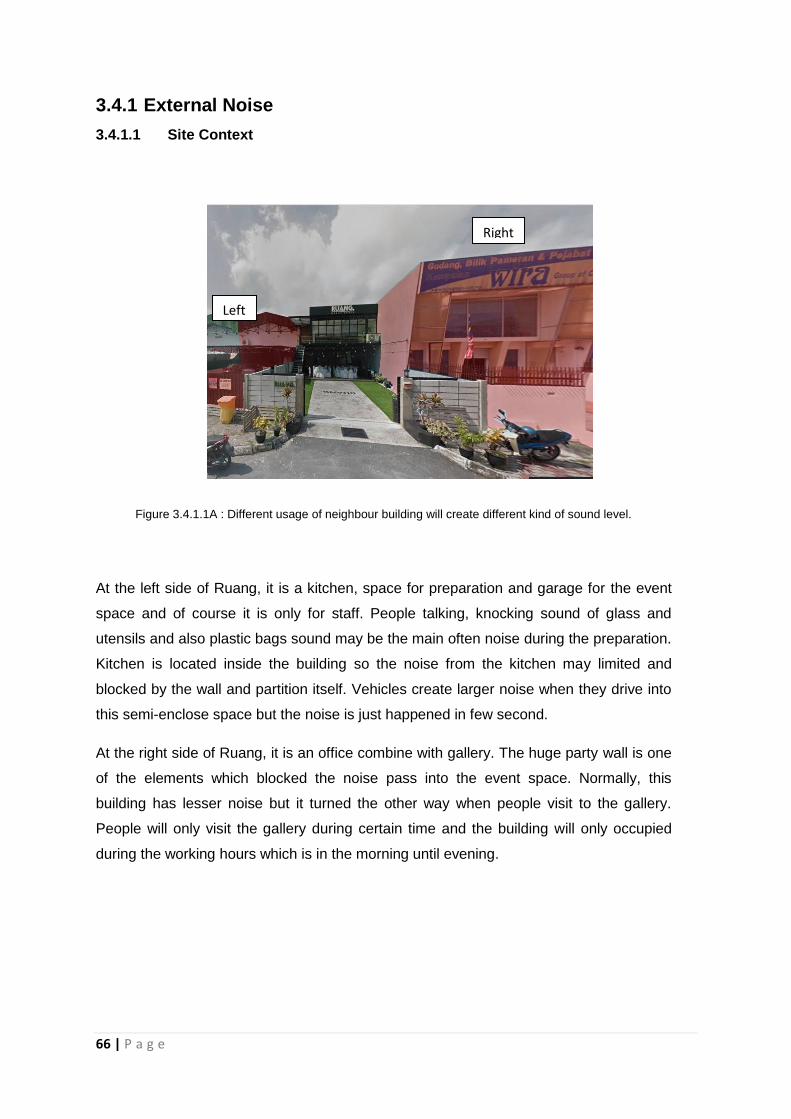
Figure 3.4.1.1A : Different usage of neighbour building will create different kind of sound level.
At the left side of Ruang, it is a kitchen, space for preparation and garage for the event
space and of course it is only for staff. People talking, knocking sound of glass and
utensils and also plastic bags sound may be the main often noise during the preparation.
Kitchen is located inside the building so the noise from the kitchen may limited and
blocked by the wall and partition itself. Vehicles create larger noise when they drive into
this semi-enclose space but the noise is just happened in few second.
At the right side of Ruang, it is an office combine with gallery. The huge party wall is one
of the elements which blocked the noise pass into the event space. Normally, this
building has lesser noise but it turned the other way when people visit to the gallery.
People will only visit the gallery during certain time and the building will only occupied
during the working hours which is in the morning until evening.
Left
Right
67 | P a g e
3.4.1.2 Vehicles
Many company offices and factories were located at this area as this is an industrial area.
Beside the normal vehicles will passing through the road, some heavy vehicles like
lorries and vans will also using this primary road to collect and drop their stocks. In the
other side, there are many residential areas around this site and most of the workers and
resident travel by motorcycles. Motorcycles will create a high frequency sound when
they passed by the road and this noise will make someone feel annoying and unpleasant.

68 | P a g e
3.4.1.3 Human Activities
Figure 3.4.1.3A : Zone C is where the outdoor human activities happening. The largest sound wave
represent the loudest noise in the outdoor area.
The food will be served at the right hand side of the covered outdoor area and this place
will be very crowded and has the highest volume of noise during the peak hour. The
seats and the outdoor area is limited and mostly placed at the uncovered outdoor area
and because of this, people will stand randomly and chit chat with each other while
having their food. In this situation, the noise is quite spread compare with the internal
noise.
The other sound is caused by the steel staircase which located at the left side of the
space. When people step on the steel staircase, the unsmooth steel surface will created
noisy sound when different weight and walking patterns applied on it.
Staircase
Food
Served
Area
Uncovered
Outdoor
Area

69 | P a g e
3.4.2 Internal Noise
3.4.2.1 Human Activities
Figure 3.4.2.1A : The indoor space is coloured in red colour and the two main sound source is
plotted on the floor plan.
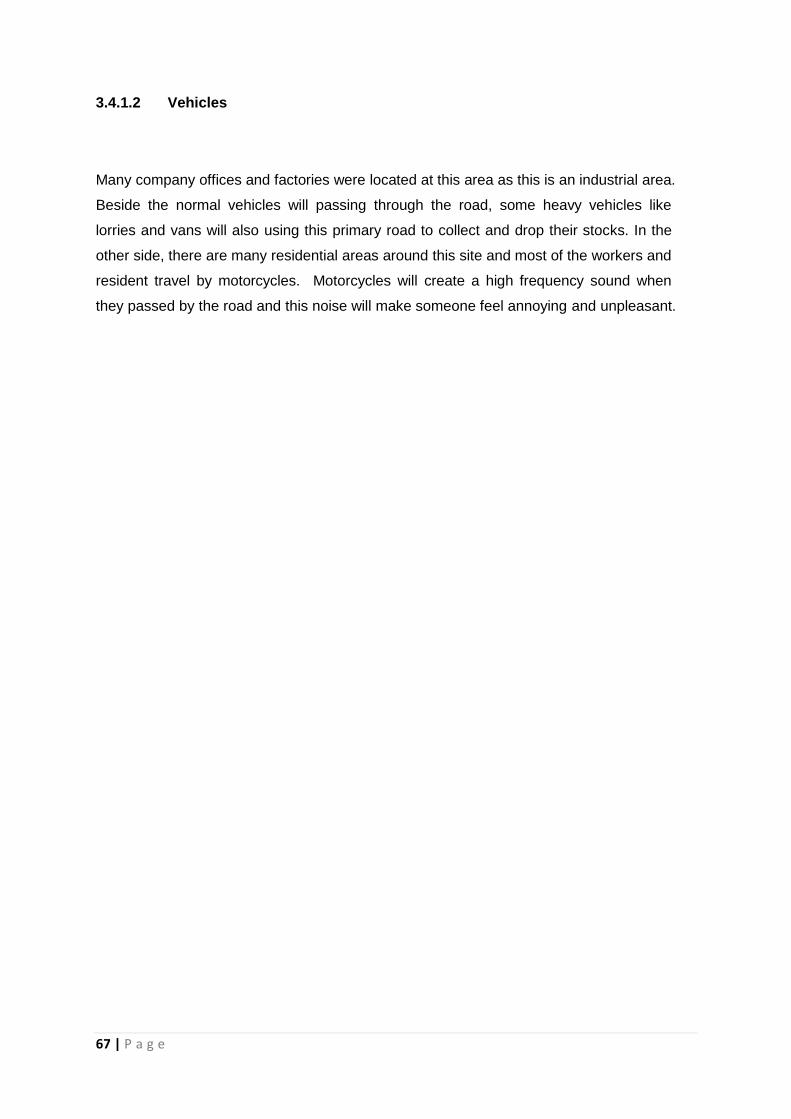
The hall (Zone A & Zone B) usually will full up with people when there is an event or
party and it will be super quiet when there is not occupied. There are mainly two sound
source in the interior, sound from stage especially during peak hour (people speak from
stage and people speak towards the stage) and the entrance (outdoor activities and
nature sound).
Stage
Outdoor
Activities
70 | P a g e
Figure 3.4.2.1B : Sound source from stage which also include the sound when people speak towards the
stage.
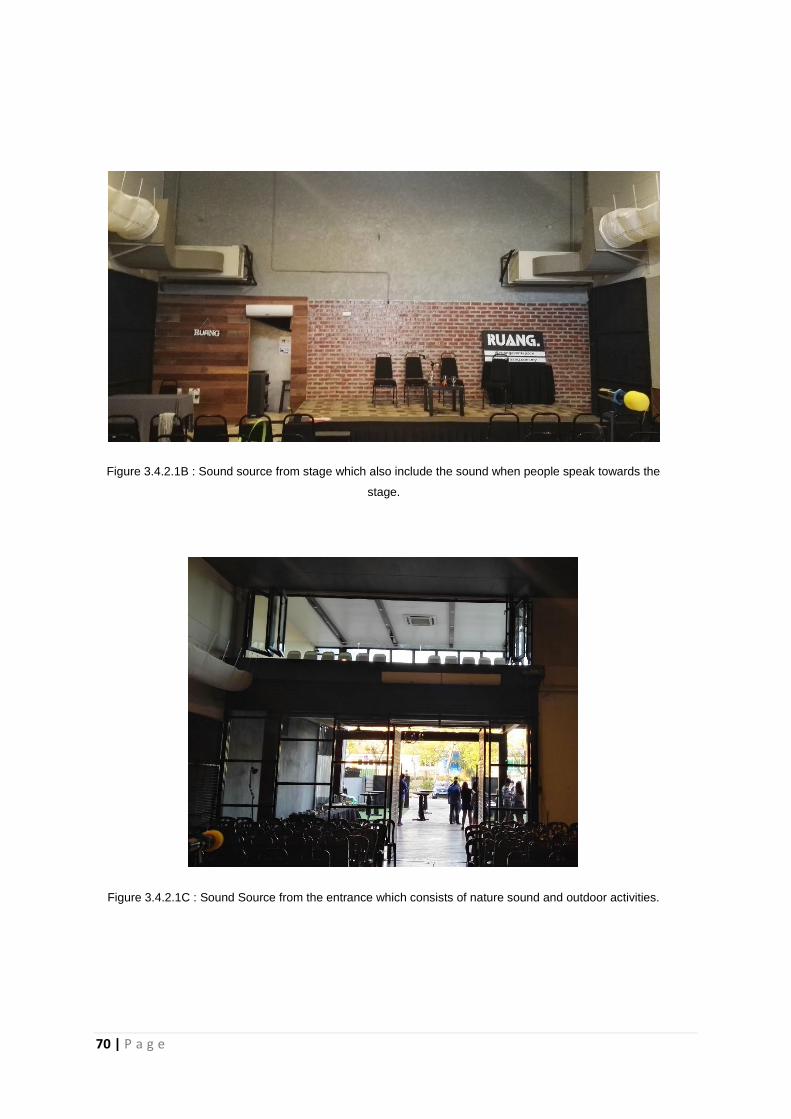
Figure 3.4.2.1C : Sound Source from the entrance which consists of nature sound and outdoor activities.

71 | P a g e
Figure 3.4.2.1D : The situation when the ground floor is occupied.
Figure 3.4.2.1E : First floor is coloured in red colour and the human activities are plotted on the floor plan.
72 | P a g e
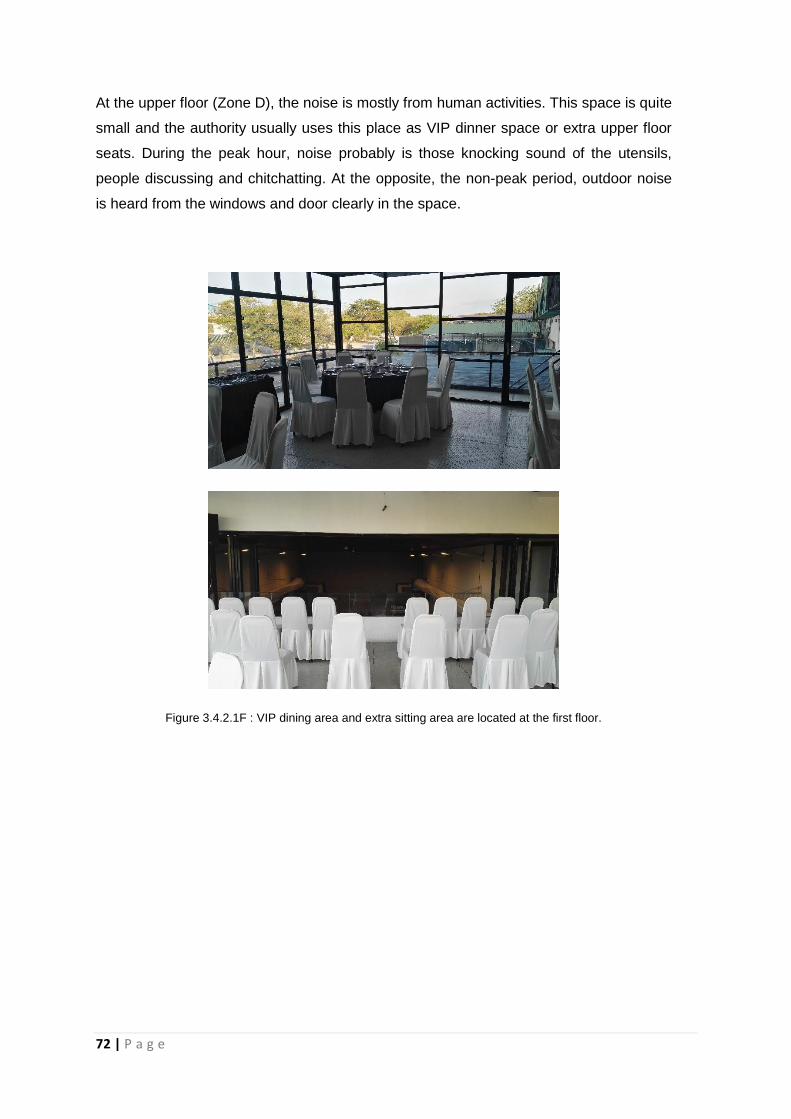
At the upper floor (Zone D), the noise is mostly from human activities. This space is quite
small and the authority usually uses this place as VIP dinner space or extra upper floor
seats. During the peak hour, noise probably is those knocking sound of the utensils,
people discussing and chitchatting. At the opposite, the non-peak period, outdoor noise
is heard from the windows and door clearly in the space.
Figure 3.4.2.1F : VIP dining area and extra sitting area are located at the first floor.

73 | P a g e
3.4.2.2 Electrical Appliances
3.4.2.2.1 Speaker
Speakers are distributed throughout the two floors to enable the music, words and
announcements from the stage or the people who speaking through a mic around the
space.
Figure 3.4.2.2.1A :. The speaker used in the event venue.
74 | P a g e
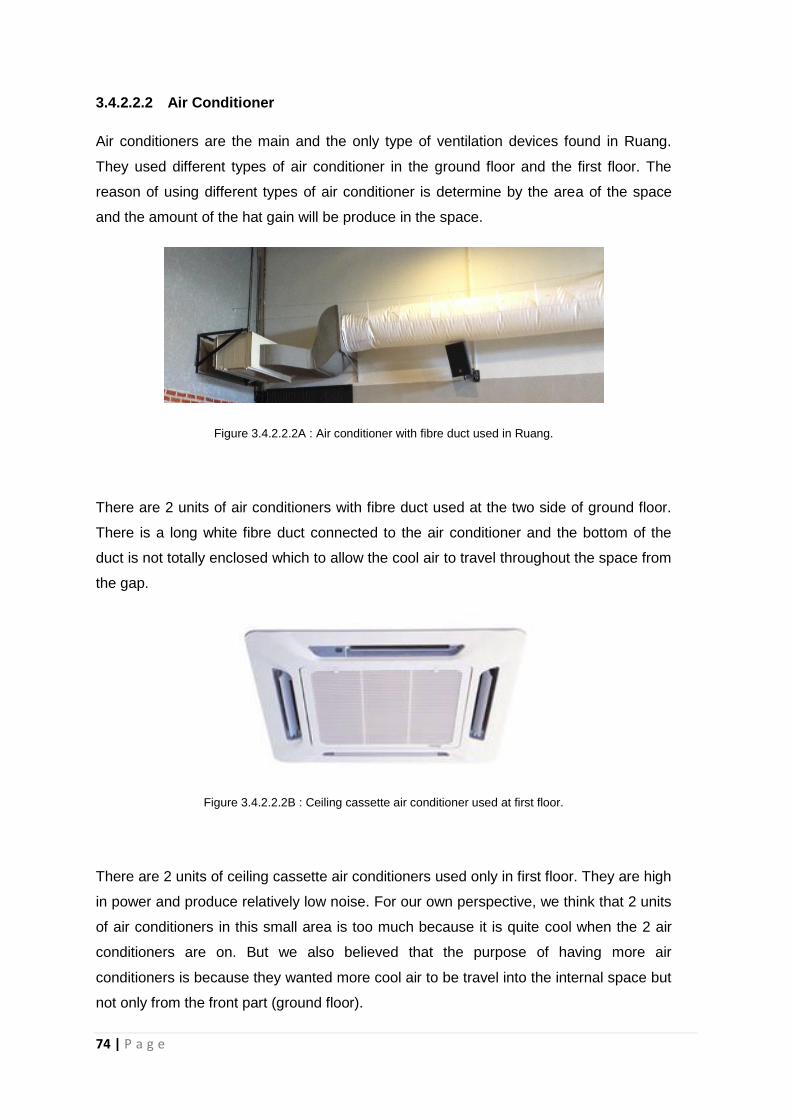
3.4.2.2.2 Air Conditioner
Air conditioners are the main and the only type of ventilation devices found in Ruang.
They used different types of air conditioner in the ground floor and the first floor. The
reason of using different types of air conditioner is determine by the area of the space
and the amount of the hat gain will be produce in the space.
Figure 3.4.2.2.2A : Air conditioner with fibre duct used in Ruang.
There are 2 units of air conditioners with fibre duct used at the two side of ground floor.
There is a long white fibre duct connected to the air conditioner and the bottom of the
duct is not totally enclosed which to allow the cool air to travel throughout the space from
the gap.
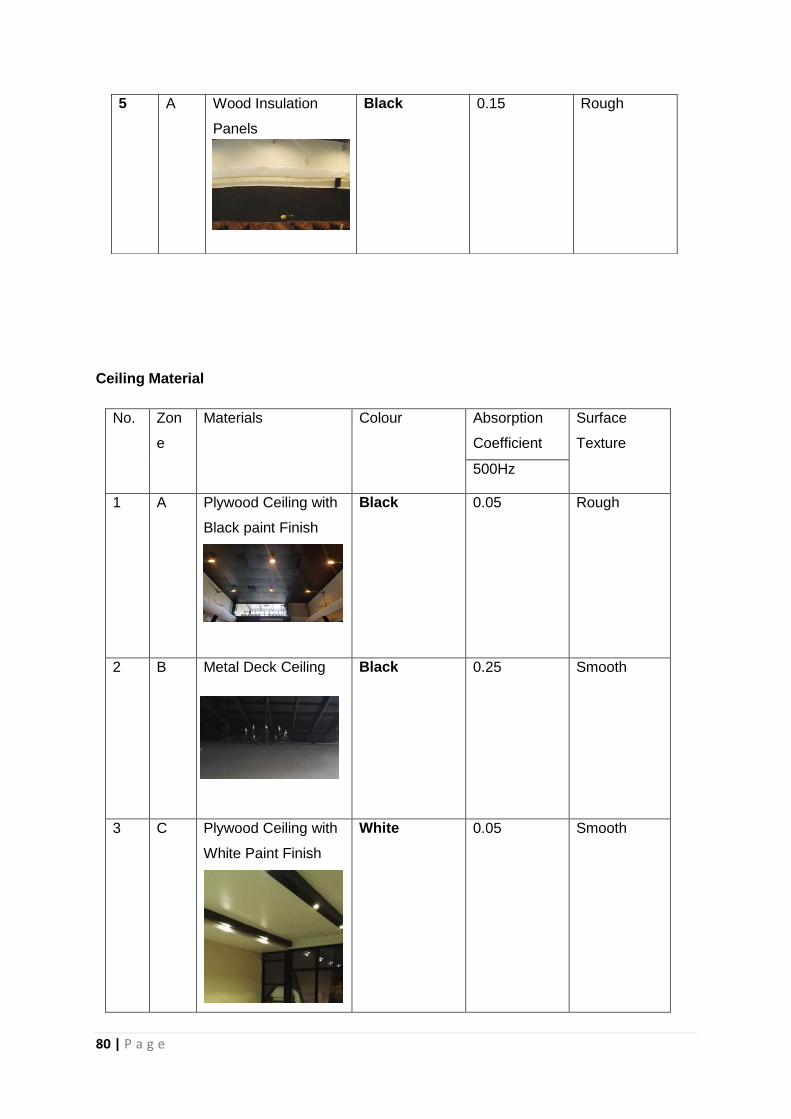
Figure 3.4.2.2.2B : Ceiling cassette air conditioner used at first floor.
There are 2 units of ceiling cassette air conditioners used only in first floor. They are high
in power and produce relatively low noise. For our own perspective, we think that 2 units
of air conditioners in this small area is too much because it is quite cool when the 2 air
conditioners are on. But we also believed that the purpose of having more air
conditioners is because they wanted more cool air to be travel into the internal space but
not only from the front part (ground floor).

75 | P a g e
3.4.3 Location of Noise Sources
Figure 3.4.3A : Identification of sound source found at ground and first floor.

76 | P a g e
Indic
ation
Picture Specification Locatio
n
Unit
Product Name (Air conditioner with fibre
duct)
Ground
Floor
2
Weight -
Dimension -
Total Power 2.2kW
Fan Speed -
Sound Pressure
Level
< 78dB
Placement Wall
Product Name Blackline F15+
(Compact, two-way passive)
Ground
Floor
7
Weight 30.5kg
Dimension (WxHxD) 471mmx690mm x443mm
Power Handing 400W AES, 1600W peak
Frequency
Response
55Hz-18kHz ± 3dB -
10dB@45Hz
Crossover 1.4 kHz passive
Sound Pressure
Level
126dB - 132dB
Placement Wall
Product Name Daikin FFR15CV1 First
Floor
2
Weight 18kg
Dimension 295mmx640mmx640mm
Total Power 940W
Cooling Operation 12500 Btu/hr
Sound Pressure
Level
38-45dB
Placement Ceiling

77 | P a g e
3.5 MATERIALS & PROPERTIES
The application of materials is an important factor in determining the quality of acoustics
in an environment, especially controlling the reverberation time. The materials act as a
medium, be it solids, liquids and gases that will affect the total effect of sound produced
in an enclosed space, known as room acoustics. The sound waves can undergo
reflection, absorption, diffusion and diffraction with different shapes, characteristics
surface texture and etc of a material.
Below are the lists of existing material found on the zones of the case study:
Furniture Material
No. Zon
e
Materials Colour Absorption
Coefficient
Surface
Texture
500Hz
1 Chair
Black 0.28 Semi- Rough
White 0.15 Semi- Rough

78 | P a g e
2 Table
Black 0.15 Semi- Rough
3 Metal Door
Black 0.25 Smooth
Timber Door
Brown 0.20 Smooth

79 | P a g e
Wall Material
No. Zon
e
Materials Colour Absorption
Coefficient
Surface
Texture
500Hz
1 A,B Concrete Wall With
Plaster Finish
White Paint 0.05 Rough
C
Grey Paint 0.05 Rough
2 A Wood Laminated
Sheets
Brown 0.15 Smooth
3 A, C Brick Wall
Red 0.03 Smooth
4 A,B,
C
Glass Wall
Transparent 0.10 Smooth
80 | P a g e
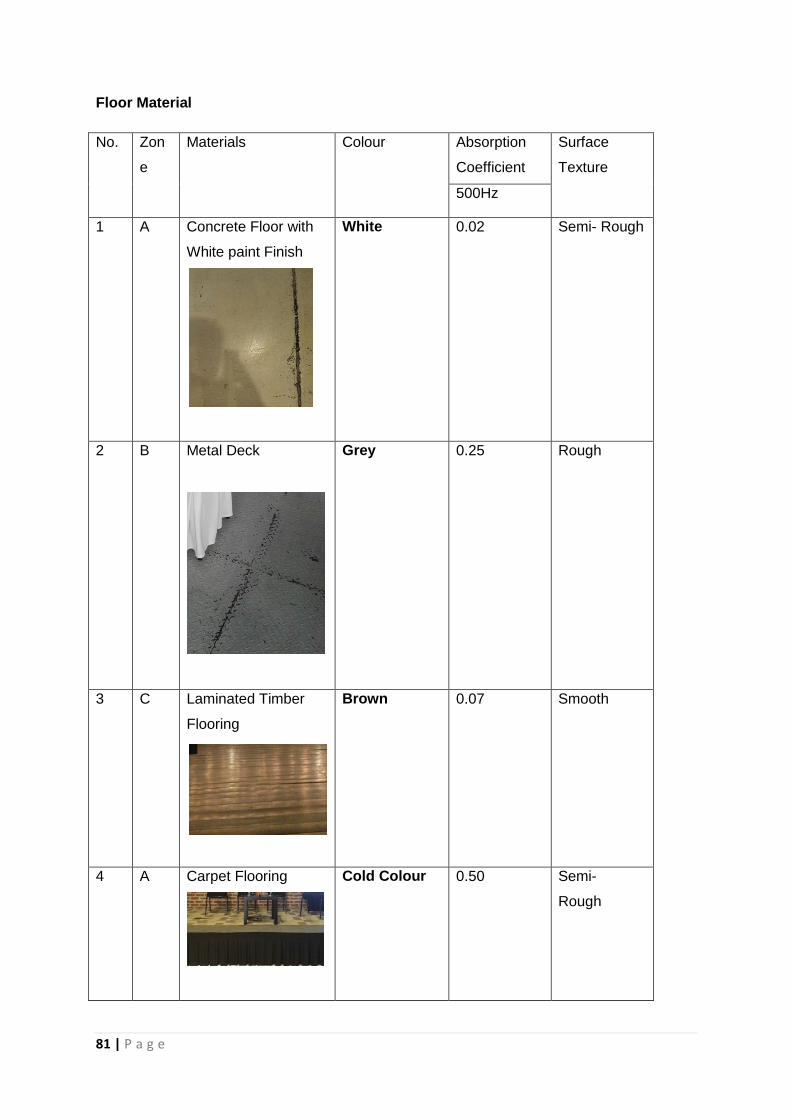
Ceiling Material
No. Zon
e
Materials Colour Absorption
Coefficient
Surface
Texture
500Hz
1 A Plywood Ceiling with
Black paint Finish
Black 0.05 Rough
2 B Metal Deck Ceiling Black 0.25 Smooth
3 C Plywood Ceiling with
White Paint Finish
White 0.05 Smooth
5
A Wood Insulation
Panels
Black 0.15 Rough
81 | P a g e
Floor Material
No. Zon
e
Materials Colour Absorption
Coefficient
Surface
Texture
500Hz
1 A Concrete Floor with
White paint Finish
White 0.02 Semi- Rough
2 B Metal Deck
Grey 0.25 Rough
3 C Laminated Timber
Flooring
Brown 0.07 Smooth
4 A Carpet Flooring
Cold Colour 0.50 Semi-
Rough
82 | P a g e
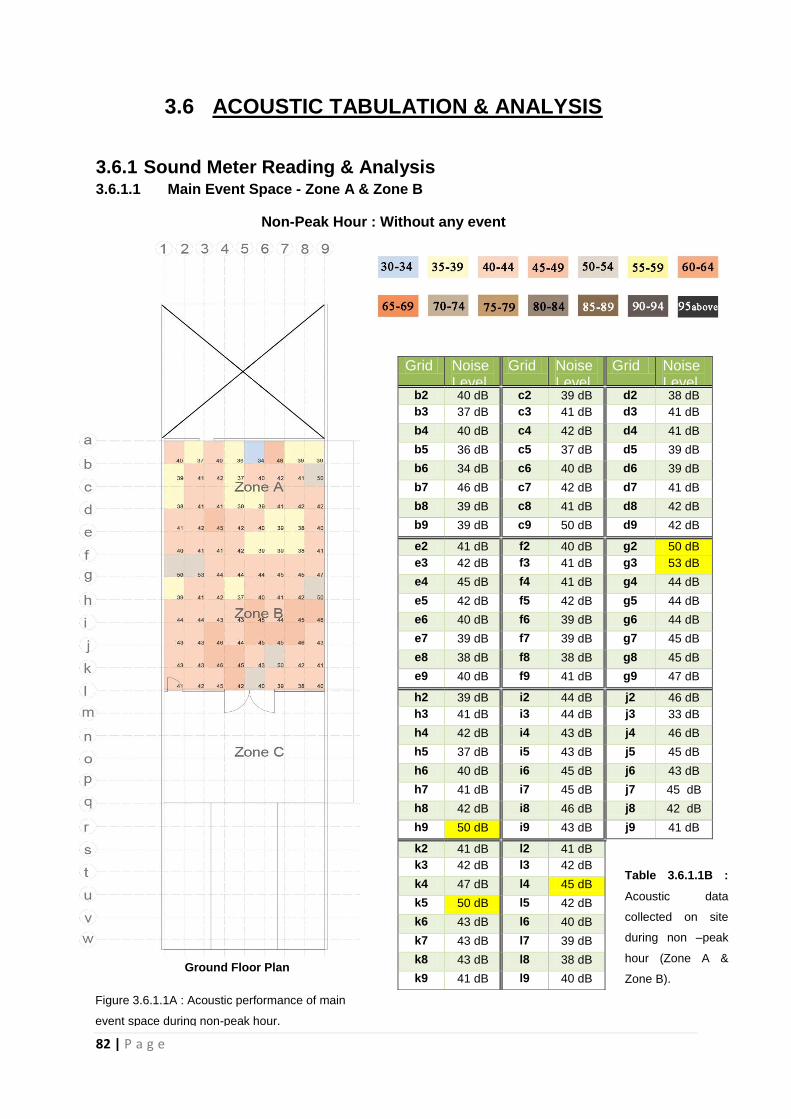
3.6 ACOUSTIC TABULATION & ANALYSIS
3.6.1 Sound Meter Reading & Analysis 3.6.1.1 Main Event Space - Zone A & Zone B
Non-Peak Hour : Without any event
Ground Floor Plan
Grid Noise Level
Grid Noise Level
Grid Noise Level
b2 40 dB c2 39 dB d2 38 dB
b3 37 dB c3 41 dB d3 41 dB
b4 40 dB c4 42 dB d4 41 dB
b5 36 dB c5 37 dB d5 39 dB
b6 34 dB c6 40 dB d6 39 dB
b7 46 dB c7 42 dB d7 41 dB
b8 39 dB c8 41 dB d8 42 dB
b9 39 dB c9 50 dB d9 42 dB
e2 41 dB f2 40 dB g2 50 dB
e3 42 dB f3 41 dB g3 53 dB
e4 45 dB f4 41 dB g4 44 dB
e5 42 dB f5 42 dB g5 44 dB
e6 40 dB f6 39 dB g6 44 dB
e7 39 dB f7 39 dB g7 45 dB
e8 38 dB f8 38 dB g8 45 dB
e9 40 dB f9 41 dB g9 47 dB
h2 39 dB i2 44 dB j2 46 dB
h3 41 dB i3 44 dB j3 33 dB
h4 42 dB i4 43 dB j4 46 dB
h5 37 dB i5 43 dB j5 45 dB
h6 40 dB i6 45 dB j6 43 dB
h7 41 dB i7 45 dB j7 45 dB
h8 42 dB i8 46 dB j8 42 dB
h9 50 dB i9 43 dB j9 41 dB
k2 41 dB l2 41 dB
k3 42 dB l3 42 dB
k4 47 dB l4 45 dB
k5 50 dB l5 42 dB
k6 43 dB l6 40 dB
k7 43 dB l7 39 dB
k8 43 dB l8 38 dB
k9 41 dB l9 40 dB
Table 3.6.1.1B :
Acoustic data
collected on site
during non –peak
hour (Zone A &
Zone B).
Figure 3.6.1.1A : Acoustic performance of main
event space during non-peak hour.
83 | P a g e
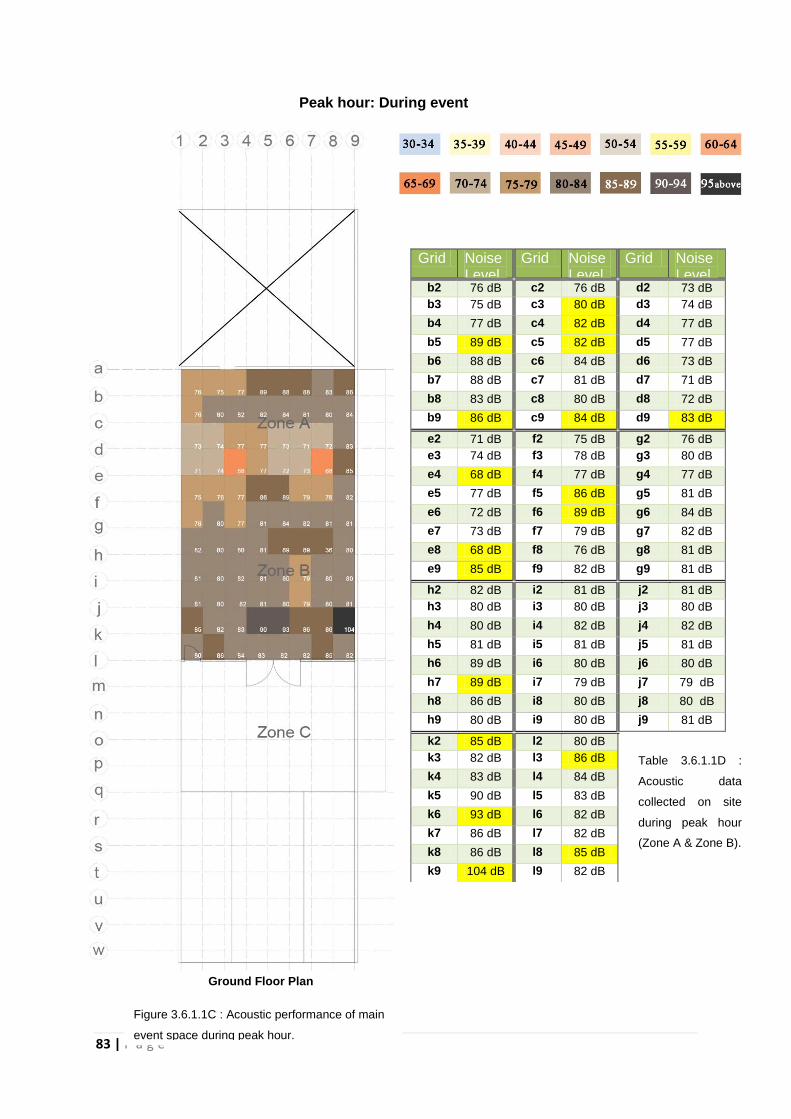
Peak hour: During event
Gro
Ground Floor Plan
Grid Noise Level
Grid Noise Level
Grid Noise Level
b2 76 dB c2 76 dB d2 73 dB
b3 75 dB c3 80 dB d3 74 dB
b4 77 dB c4 82 dB d4 77 dB
b5 89 dB c5 82 dB d5 77 dB
b6 88 dB c6 84 dB d6 73 dB
b7 88 dB c7 81 dB d7 71 dB
b8 83 dB c8 80 dB d8 72 dB
b9 86 dB c9 84 dB d9 83 dB
e2 71 dB f2 75 dB g2 76 dB
e3 74 dB f3 78 dB g3 80 dB
e4 68 dB f4 77 dB g4 77 dB
e5 77 dB f5 86 dB g5 81 dB
e6 72 dB f6 89 dB g6 84 dB
e7 73 dB f7 79 dB g7 82 dB
e8 68 dB f8 76 dB g8 81 dB
e9 85 dB f9 82 dB g9 81 dB
h2 82 dB i2 81 dB j2 81 dB
h3 80 dB i3 80 dB j3 80 dB
h4 80 dB i4 82 dB j4 82 dB
h5 81 dB i5 81 dB j5 81 dB
h6 89 dB i6 80 dB j6 80 dB
h7 89 dB i7 79 dB j7 79 dB
h8 86 dB i8 80 dB j8 80 dB
h9 80 dB i9 80 dB j9 81 dB
k2 85 dB l2 80 dB
k3 82 dB l3 86 dB
k4 83 dB l4 84 dB
k5 90 dB l5 83 dB
k6 93 dB l6 82 dB
k7 86 dB l7 82 dB
k8 86 dB l8 85 dB
k9 104 dB l9 82 dB
Table 3.6.1.1D :
Acoustic data
collected on site
during peak hour
(Zone A & Zone B).
Figure 3.6.1.1C : Acoustic performance of main
event space during peak hour.
84 | P a g e
Analysis
We define the non-peak hour as without event happening and peak hour as event
happening.
Based on the non-peak hour diagram and the table (figure 3.6.1.1A & table 3.6.1.1B),
sound level is around 30 decibel to 50 decibel with average of 43 decibel. During the
sound level collection, the space is totally enclosed, even the doors and the windows at
the upper floor are all closed and all the electrical applications are all switched off. But
because the period we went is the event preparation, so there are some sound from
human activities. For instance, g3 & g4 has a higher decibel as there are workers
walking into the event space during the test. h9 is higher because there are workers
arranging stuffs inside the space during that time. k5 & l4 has different and higher
decibel than the other surrounding grid point is because it is near the entrance and
during the time, there are some outdoor activities like vehicles, human activities and
nature sound come in from the door gaps into the interior.
Based on the peak hour diagram and the table (figure 3.6.1.1C & table 3.6.1.1D), sound
level is around 68 decibel to 104 decibel with average of 80 decibel. During the sound
level collection, the space is having a talk, so there are people speaking at the stage with
mic, people walking around the space in the outdoor and the indoor area, people
chitchatting and all the electrical applications like air conditioner and speaker is
everything switched on. The sound intensity level will be affected by the volume of
people speaking, position of the speaker and human activities. There are some points
like h7, k6, k9 and l3 are higher than the others points because of the people who talk
with mic on the stage is too excited and make his sound frequency and sound volume
before higher during that period. Some points like e9, k2 and l8 have slightly higher
points because there are people moving or discussing during that time. Point f5 and f6
have higher decibel because there is a mic provided at the middle of the venue and let
the public spoke through wards the stage. Of course the area around the speakers (b-c 1,
b-c 9, j-k 1, j-k 9) will get higher decibel then others for instance, c3-c5. e4 and e4 have
a slightly lower decibel because during that period there is a pause of the people who
speaking on the stage.
We noticed that the area near the air conditioner has a weird reading which is b9 and c9
has a highest decibel compare with the other side. We found this noise will occur is due
to the unmaintained air conditioner. For overall, we found that the sound level at the right
side is higher than the left side is because left side has a sound insulator wall provided
but right side doesn’t provide any insulator.

85 | P a g e
3.6.1.2 Covered Outdoor Area - Zone C
Non-Peak Hour : Without any event
Ground Floor Plan
Grid Noise Level
Grid Noise Level
Grid Noise Level
m2 55 dB n2 40 dB o2 58 dB
m3 60 dB n3 53 dB o3 63 dB
m4 58 dB n4 54 dB o4 62 dB
m5 59 dB n5 54 dB o5 61 dB
m6 68 dB n6 65 dB o6 66 dB
m7 53 dB n7 58 dB o7 60 dB
m8 54 dB n8 59 dB o8 62 dB
m9 66 dB n9 58 dB o9 57 dB
p2 58 dB q2 53 dB
p3 60 dB q3 54 dB
p4 61 dB q4 58 dB
p5 60 dB q5 57 dB
p6 65 dB q6 60 dB
p7 60 dB q7 60 dB
p8 61 dB q8 58 dB
p9 65 dB q9 56 dB
Table 3.6.1.2B :
Acoustic data
collected on site
during non –peak
hour (Zone C).
Figure 3.6.1.2A : Acoustic performance of covered
outdoor area during non-peak hour.
86 | P a g e
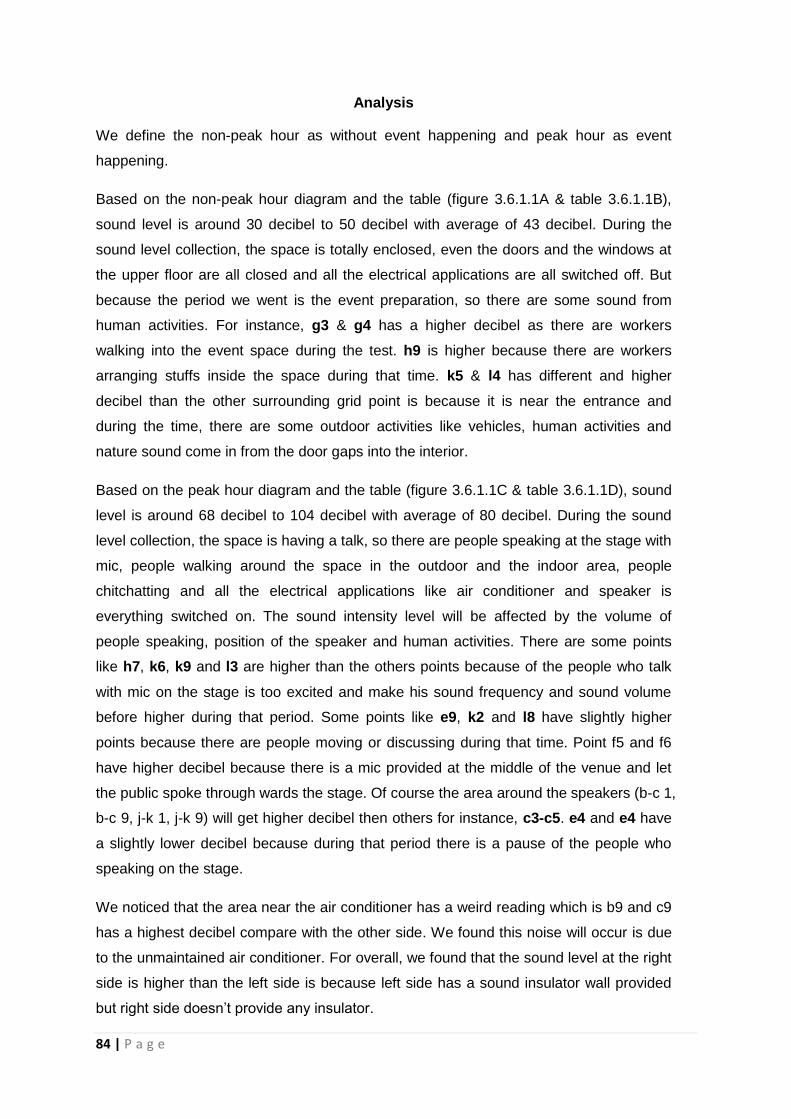
Peak hour: During event
Ground Floor Plan
Grid Noise Level
Grid Noise Level
Grid Noise Level
m2 80 dB n2 75 dB o2 77 dB
m3 74 dB n3 75 dB o3 78 dB
m4 80 dB n4 78 dB o4 81 dB
m5 83 dB n5 77 dB o5 84 dB
m6 86 dB n6 82 dB o6 82 dB
m7 74 dB n7 77 dB o7 75 dB
m8 75 dB n8 75 dB o8 74 dB
m9 75 dB n9 75 dB o9 72 dB
p2 75 dB q2 74 dB
p3 77 dB q3 78 dB
p4 81 dB q4 79 dB
p5 83 dB q5 76 dB
p6 82 dB q6 77 dB
p7 76 dB q7 75 dB
p8 74 dB q8 74 dB
p9 72 dB q9 75 dB
Table 3.6.1.2D :
Acoustic data
collected on site
during peak hour
(Zone C).
Figure 3.6.1.2C : Acoustic performance of
covered outdoor area during peak hour.

87 | P a g e
Analysis
Based on the non-peak hour diagram and table (figure 3.6.1.2A & table 3.6.1.2B), the
sound level is around 40 decibel to 68 decibel with average of 58 decibel. The noise is
more concentrate at (m-q 6) which is in front the entrance because during the data
collection, there are workers chitchatting around there and some the noise from the
friction of the door when someone open the door.
o6 is located at the corner and it has higher decibel among the points surrounding. The
reason of having this reading is because it is a corner, sound usually will more
concentrate and has a lower reverberation in an enclosed area especially a corner. Add
on, the material they used (concrete) of the area (corner) will also affecting the sound
absorption and reverberation. At the opposite site, q9 has lower sound level is because
this point is more to the exterior which is the uncovered outdoor area.
In another case, m2 has lower sound level than o6 is because m2 is located below
staircase and people or sound are quite inactive at that area. When there is sound from
the uncovered outdoor area, the staircase will first blocking the sound before transmit to
m2. But n2 has a higher sound level is because during the time, there is another
teammate walking down from the staircase and the steel staircase has because the
biggest sound source of that area.
Based on peak hour diagram and table (figure 3.6.1.2C & table 3.6.1.2D), the sound
level is around 72 decibel – 86 decibel with average of 75 decibel. The sound is more
concentrate at the centre of the area is because people usually gather at the centre and
chit chatting with each other after they took their food at the right side of the area
because of lacking chairs at the outdoor area and people normally will standing and have
their food on the food at the uncovered outdoor area.
m6 got the highest sound level among all grid points is because it is located at the point
which straight facing the entrance. So, when people open the door, the sound from
inside will directly transmitted to this point first.
Compare to non-peak hour, m2 has higher sound level during peak hour because the
speaker is located at this point. Because of the speaker, the area around the speaker will
have higher sound level (m-p 1)
Overall, the right hand side has lower sound level than the left side is because there are
more stuffs like wooden table, cotton tablecloth, paper cups and other dinning utensils
that has more absorption value at that area which is ready for the guest of the event later.

88 | P a g e
3.6.1.3 VIP Dining Area - Zone D
Non-Peak Hour : Without any event
First Floor Plan
Grid Noise Level
Grid Noise Level
Grid Noise Level
m2 55 dB n2 53 dB o2 53 dB
m3 55 dB n3 53 dB o3 53 dB
m4 56 dB n4 54 dB o4 55 dB
m5 55 dB n5 54 dB o5 55 dB
m6 56 dB n6 54 dB o6 58 dB
m7 54 dB n7 54 dB o7 54 dB
m8 54 dB n8 53 dB o8 54 dB
m9 43 dB n9 53 dB o9 53 dB
p2 53 dB q2 72 dB
p3 53 dB q3 53 dB
p4 54 dB q4 53 dB
p5 55 dB q5 56 dB
p6 54 dB q6 53 dB
p7 53 dB q7 53 dB
p8 53 dB q8 52 dB
p9 52 dB q9 51 dB
Figure 3.6.1.3A : Acoustic performance of
upper floor area during non-peak hour.
Table 3.6.1.3B :
Acoustic data collected
on site during peak
hour (Zone D).
89 | P a g e
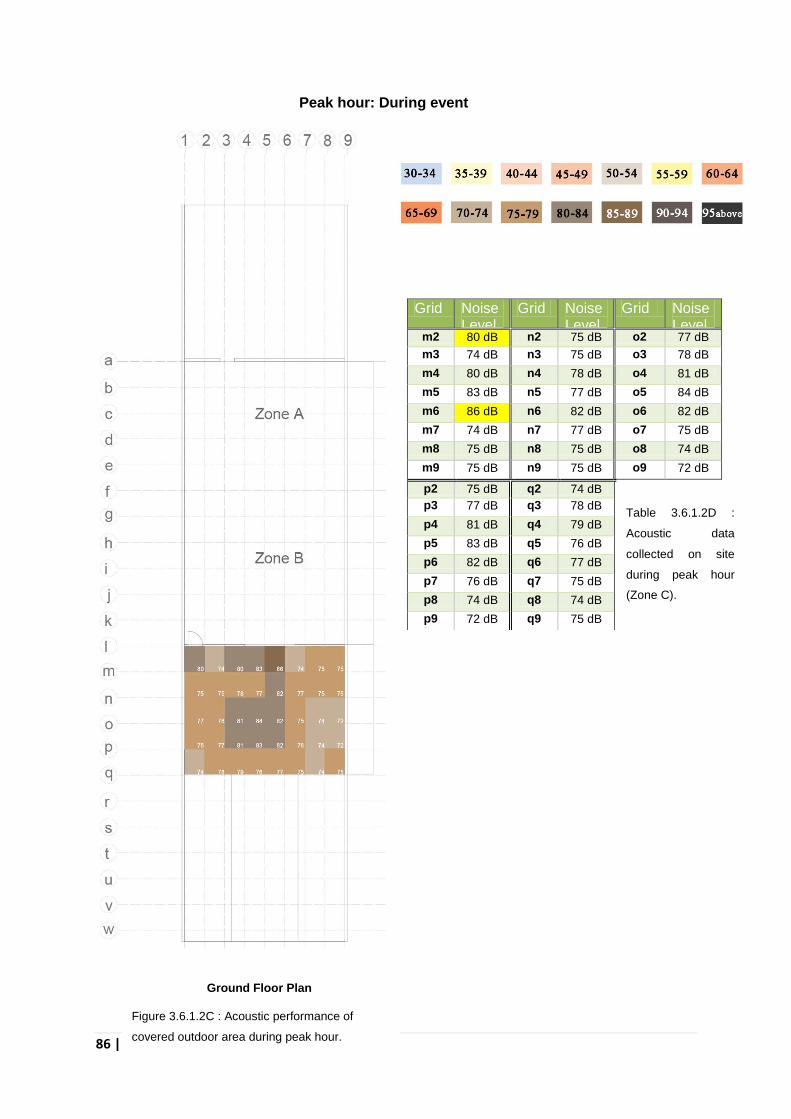
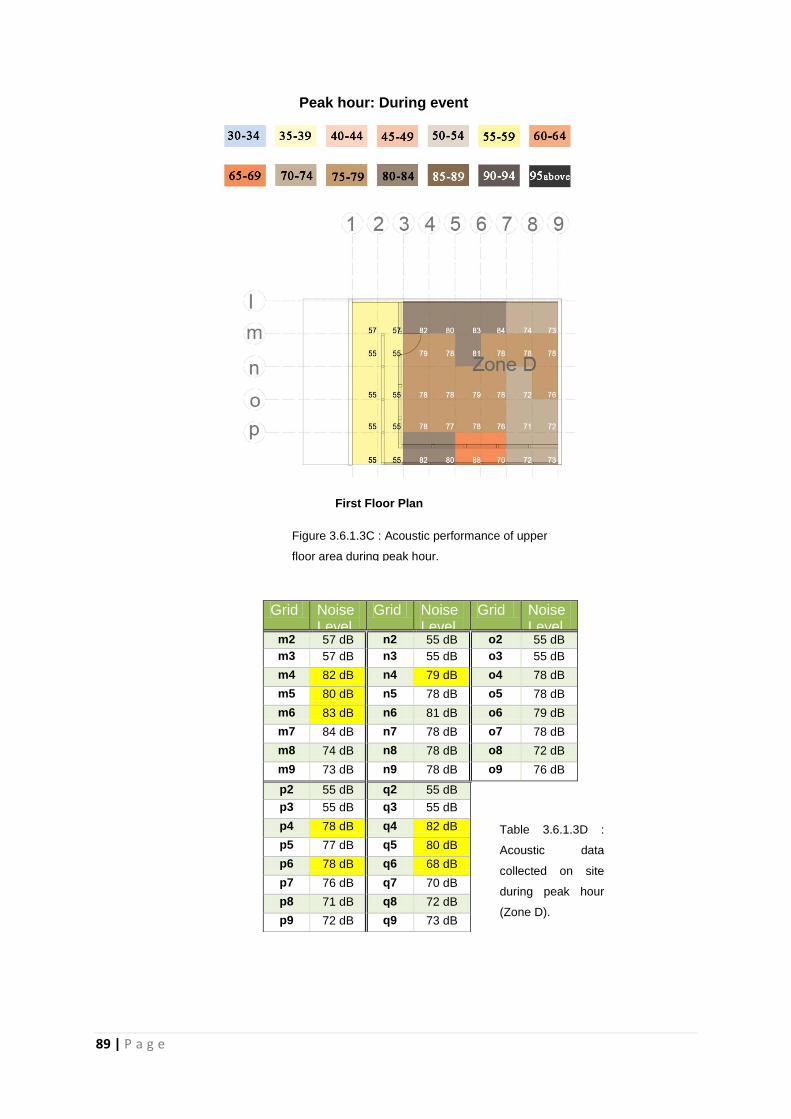
Peak hour: During event
First Floor Plan
Grid Noise Level
Grid Noise Level
Grid Noise Level
m2 57 dB n2 55 dB o2 55 dB
m3 57 dB n3 55 dB o3 55 dB
m4 82 dB n4 79 dB o4 78 dB
m5 80 dB n5 78 dB o5 78 dB
m6 83 dB n6 81 dB o6 79 dB
m7 84 dB n7 78 dB o7 78 dB
m8 74 dB n8 78 dB o8 72 dB
m9 73 dB n9 78 dB o9 76 dB
p2 55 dB q2 55 dB
p3 55 dB q3 55 dB
p4 78 dB q4 82 dB
p5 77 dB q5 80 dB
p6 78 dB q6 68 dB
p7 76 dB q7 70 dB
p8 71 dB q8 72 dB
p9 72 dB q9 73 dB
Figure 3.6.1.3C : Acoustic performance of upper
floor area during peak hour.
Table 3.6.1.3D :
Acoustic data
collected on site
during peak hour
(Zone D).
90 | P a g e
Analysis
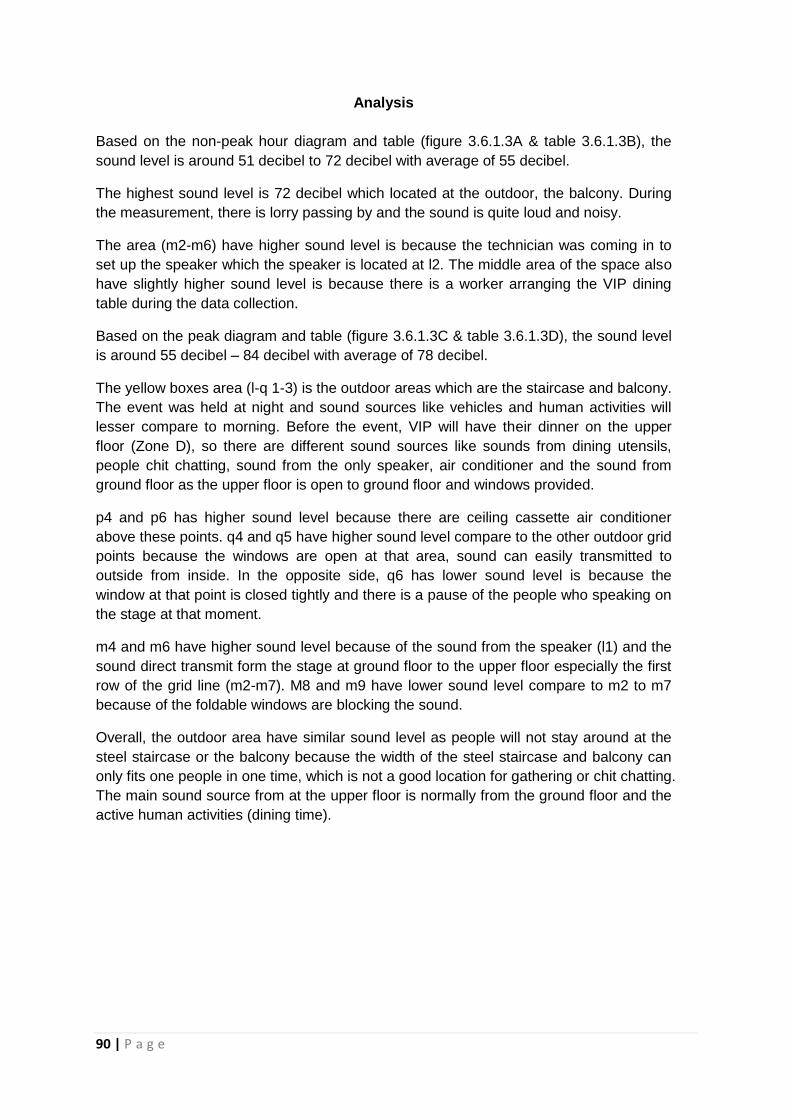
Based on the non-peak hour diagram and table (figure 3.6.1.3A & table 3.6.1.3B), the
sound level is around 51 decibel to 72 decibel with average of 55 decibel.
The highest sound level is 72 decibel which located at the outdoor, the balcony. During
the measurement, there is lorry passing by and the sound is quite loud and noisy.
The area (m2-m6) have higher sound level is because the technician was coming in to
set up the speaker which the speaker is located at l2. The middle area of the space also
have slightly higher sound level is because there is a worker arranging the VIP dining
table during the data collection.
Based on the peak diagram and table (figure 3.6.1.3C & table 3.6.1.3D), the sound level
is around 55 decibel – 84 decibel with average of 78 decibel.
The yellow boxes area (l-q 1-3) is the outdoor areas which are the staircase and balcony.
The event was held at night and sound sources like vehicles and human activities will
lesser compare to morning. Before the event, VIP will have their dinner on the upper
floor (Zone D), so there are different sound sources like sounds from dining utensils,
people chit chatting, sound from the only speaker, air conditioner and the sound from
ground floor as the upper floor is open to ground floor and windows provided.
p4 and p6 has higher sound level because there are ceiling cassette air conditioner
above these points. q4 and q5 have higher sound level compare to the other outdoor grid
points because the windows are open at that area, sound can easily transmitted to
outside from inside. In the opposite side, q6 has lower sound level is because the
window at that point is closed tightly and there is a pause of the people who speaking on
the stage at that moment.
m4 and m6 have higher sound level because of the sound from the speaker (l1) and the
sound direct transmit form the stage at ground floor to the upper floor especially the first
row of the grid line (m2-m7). M8 and m9 have lower sound level compare to m2 to m7
because of the foldable windows are blocking the sound.
Overall, the outdoor area have similar sound level as people will not stay around at the
steel staircase or the balcony because the width of the steel staircase and balcony can
only fits one people in one time, which is not a good location for gathering or chit chatting.
The main sound source from at the upper floor is normally from the ground floor and the
active human activities (dining time).

91 | P a g e
3.6.2 Sound Intensity Level (SIL)
Sound intensity level, SIL also known as Sound pressure level, SPL. The usual context
is the sound measurement of intensity in the air at listener’s location as a sound energy
quantity. The intensity level is defined as the sound power per unit of area and the basic
units are watts/m2 or watts/cm2.
Average sound intensity level is calculated by using Power Addition Method :
SRL or SIL = 10 log10 I
Iref
Where,
SIL = Sound Intensity Level, Iref = 1.0 x 10 -2 Watts
I = Sound power (intensity) Watts
3.6.2.1 Zoning of Spaces
The reverberation time of the main usage space of chosen site (Ruang Event Space)
which is calculated are included :
Unable access
area
Outdoor area
First Floor Plan
Zone A : Main event space front stage
Zone B : Main event space sitting area
Zone C : Open air antechamber
Zone D : VIP dinner space and extra upper floor seats
92 | P a g e
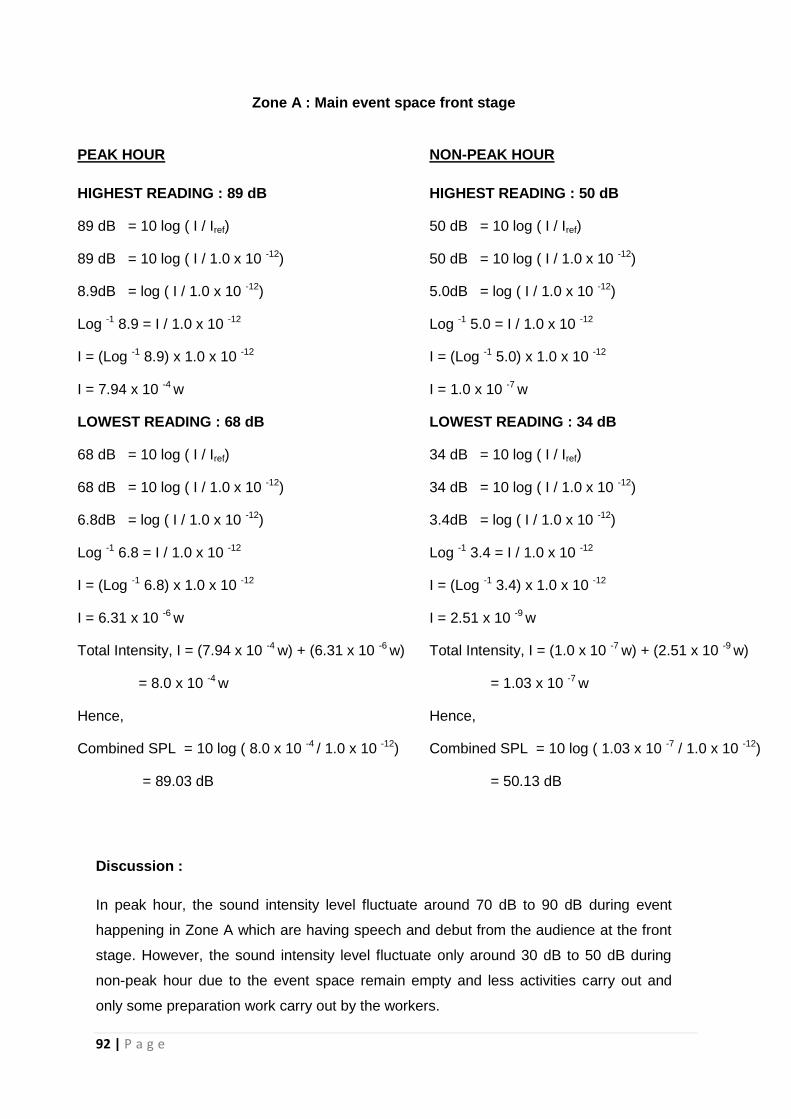
Zone A : Main event space front stage
Discussion :
In peak hour, the sound intensity level fluctuate around 70 dB to 90 dB during event
happening in Zone A which are having speech and debut from the audience at the front
stage. However, the sound intensity level fluctuate only around 30 dB to 50 dB during
non-peak hour due to the event space remain empty and less activities carry out and
only some preparation work carry out by the workers.
PEAK HOUR
HIGHEST READING : 89 dB
89 dB = 10 log ( I / Iref)
89 dB = 10 log ( I / 1.0 x 10 -12)
8.9dB = log ( I / 1.0 x 10 -12)
Log -1 8.9 = I / 1.0 x 10 -12
I = (Log -1 8.9) x 1.0 x 10 -12
I = 7.94 x 10 -4 w
LOWEST READING : 68 dB
68 dB = 10 log ( I / Iref)
68 dB = 10 log ( I / 1.0 x 10 -12)
6.8dB = log ( I / 1.0 x 10 -12)
Log -1 6.8 = I / 1.0 x 10 -12
I = (Log -1 6.8) x 1.0 x 10 -12
I = 6.31 x 10 -6 w
Total Intensity, I = (7.94 x 10 -4 w) + (6.31 x 10 -6 w)
= 8.0 x 10 -4 w
Hence,
Combined SPL = 10 log ( 8.0 x 10 -4 / 1.0 x 10 -12)
= 89.03 dB
NON-PEAK HOUR
HIGHEST READING : 50 dB
50 dB = 10 log ( I / Iref)
50 dB = 10 log ( I / 1.0 x 10 -12)
5.0dB = log ( I / 1.0 x 10 -12)
Log -1 5.0 = I / 1.0 x 10 -12
I = (Log -1 5.0) x 1.0 x 10 -12
I = 1.0 x 10 -7 w
LOWEST READING : 34 dB
34 dB = 10 log ( I / Iref)
34 dB = 10 log ( I / 1.0 x 10 -12)
3.4dB = log ( I / 1.0 x 10 -12)
Log -1 3.4 = I / 1.0 x 10 -12
I = (Log -1 3.4) x 1.0 x 10 -12
I = 2.51 x 10 -9 w
Total Intensity, I = (1.0 x 10 -7 w) + (2.51 x 10 -9 w)
= 1.03 x 10 -7 w
Hence,
Combined SPL = 10 log ( 1.03 x 10 -7 / 1.0 x 10 -12)
= 50.13 dB
93 | P a g e
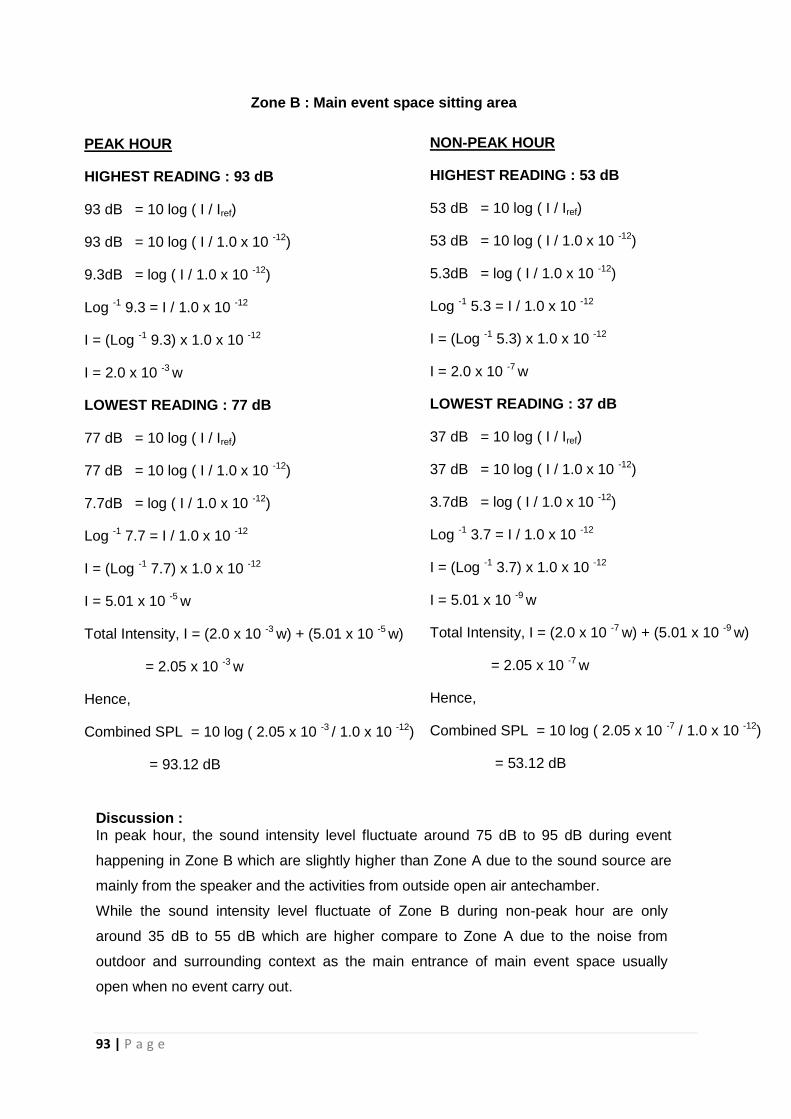
Zone B : Main event space sitting area
Discussion : In peak hour, the sound intensity level fluctuate around 75 dB to 95 dB during event
happening in Zone B which are slightly higher than Zone A due to the sound source are
mainly from the speaker and the activities from outside open air antechamber.
While the sound intensity level fluctuate of Zone B during non-peak hour are only
around 35 dB to 55 dB which are higher compare to Zone A due to the noise from
outdoor and surrounding context as the main entrance of main event space usually
open when no event carry out.
PEAK HOUR
HIGHEST READING : 93 dB
93 dB = 10 log ( I / Iref)
93 dB = 10 log ( I / 1.0 x 10 -12)
9.3dB = log ( I / 1.0 x 10 -12)
Log -1 9.3 = I / 1.0 x 10 -12
I = (Log -1 9.3) x 1.0 x 10 -12
I = 2.0 x 10 -3 w
LOWEST READING : 77 dB
77 dB = 10 log ( I / Iref)
77 dB = 10 log ( I / 1.0 x 10 -12)
7.7dB = log ( I / 1.0 x 10 -12)
Log -1 7.7 = I / 1.0 x 10 -12
I = (Log -1 7.7) x 1.0 x 10 -12
I = 5.01 x 10 -5 w
Total Intensity, I = (2.0 x 10 -3 w) + (5.01 x 10 -5 w)
= 2.05 x 10 -3 w
Hence,
Combined SPL = 10 log ( 2.05 x 10 -3 / 1.0 x 10 -12)
= 93.12 dB
NON-PEAK HOUR
HIGHEST READING : 53 dB
53 dB = 10 log ( I / Iref)
53 dB = 10 log ( I / 1.0 x 10 -12)
5.3dB = log ( I / 1.0 x 10 -12)
Log -1 5.3 = I / 1.0 x 10 -12
I = (Log -1 5.3) x 1.0 x 10 -12
I = 2.0 x 10 -7 w
LOWEST READING : 37 dB
37 dB = 10 log ( I / Iref)
37 dB = 10 log ( I / 1.0 x 10 -12)
3.7dB = log ( I / 1.0 x 10 -12)
Log -1 3.7 = I / 1.0 x 10 -12
I = (Log -1 3.7) x 1.0 x 10 -12
I = 5.01 x 10 -9 w
Total Intensity, I = (2.0 x 10 -7 w) + (5.01 x 10 -9 w)
= 2.05 x 10 -7 w
Hence,
Combined SPL = 10 log ( 2.05 x 10 -7 / 1.0 x 10 -12)
= 53.12 dB
94 | P a g e
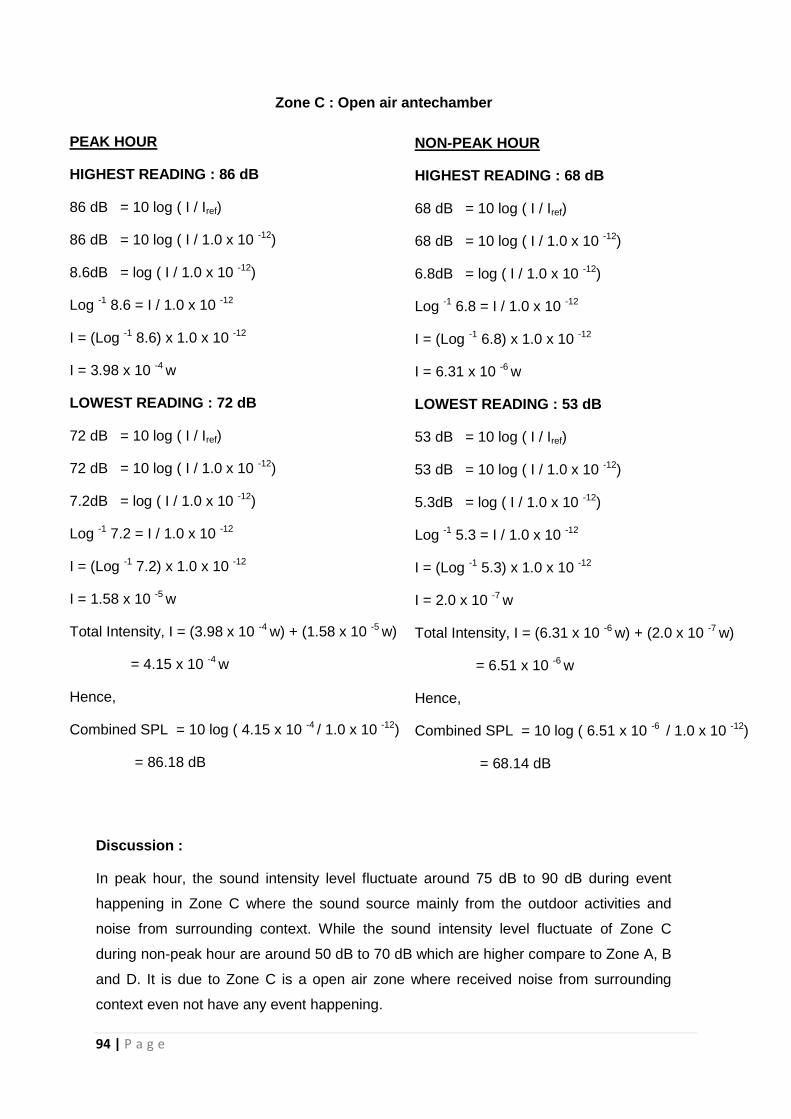
Zone C : Open air antechamber
Discussion :
In peak hour, the sound intensity level fluctuate around 75 dB to 90 dB during event
happening in Zone C where the sound source mainly from the outdoor activities and
noise from surrounding context. While the sound intensity level fluctuate of Zone C
during non-peak hour are around 50 dB to 70 dB which are higher compare to Zone A, B
and D. It is due to Zone C is a open air zone where received noise from surrounding
context even not have any event happening.
PEAK HOUR
HIGHEST READING : 86 dB
86 dB = 10 log ( I / Iref)
86 dB = 10 log ( I / 1.0 x 10 -12)
8.6dB = log ( I / 1.0 x 10 -12)
Log -1 8.6 = I / 1.0 x 10 -12
I = (Log -1 8.6) x 1.0 x 10 -12
I = 3.98 x 10 -4 w
LOWEST READING : 72 dB
72 dB = 10 log ( I / Iref)
72 dB = 10 log ( I / 1.0 x 10 -12)
7.2dB = log ( I / 1.0 x 10 -12)
Log -1 7.2 = I / 1.0 x 10 -12
I = (Log -1 7.2) x 1.0 x 10 -12
I = 1.58 x 10 -5 w
Total Intensity, I = (3.98 x 10 -4 w) + (1.58 x 10 -5 w)
= 4.15 x 10 -4 w
Hence,
Combined SPL = 10 log ( 4.15 x 10 -4 / 1.0 x 10 -12)
= 86.18 dB
NON-PEAK HOUR
HIGHEST READING : 68 dB
68 dB = 10 log ( I / Iref)
68 dB = 10 log ( I / 1.0 x 10 -12)
6.8dB = log ( I / 1.0 x 10 -12)
Log -1 6.8 = I / 1.0 x 10 -12
I = (Log -1 6.8) x 1.0 x 10 -12
I = 6.31 x 10 -6 w
LOWEST READING : 53 dB
53 dB = 10 log ( I / Iref)
53 dB = 10 log ( I / 1.0 x 10 -12)
5.3dB = log ( I / 1.0 x 10 -12)
Log -1 5.3 = I / 1.0 x 10 -12
I = (Log -1 5.3) x 1.0 x 10 -12
I = 2.0 x 10 -7 w
Total Intensity, I = (6.31 x 10 -6 w) + (2.0 x 10 -7 w)
= 6.51 x 10 -6 w
Hence,
Combined SPL = 10 log ( 6.51 x 10 -6 / 1.0 x 10 -12)
= 68.14 dB

95 | P a g e
Zone D : VIP dinner space and extra upper floor seats
Discussion :
In peak hour, the sound intensity level fluctuate around 70 dB to 85 dB during event
happening in Zone D where the sound source mainly from the speaker and people who dine
at Zone D. However, the sound intensity level fluctuate only around 50 dB to 60 dB during
non-peak hour due to the VIP dinner space and extra upper floor seats area of Zone D
normally remain enclosed and less activities carry out and only some preparation work carry
out by the workers.
PEAK HOUR
HIGHEST READING : 83 dB
83 dB = 10 log ( I / Iref)
83 dB = 10 log ( I / 1.0 x 10 -12)
8.3dB = log ( I / 1.0 x 10 -12)
Log -1 8.3 = I / 1.0 x 10 -12
I = (Log -1 8.3) x 1.0 x 10 -12
I = 2.0 x 10 -4 w
LOWEST READING : 68 dB
68 dB = 10 log ( I / Iref)
68 dB = 10 log ( I / 1.0 x 10 -12)
6.8dB = log ( I / 1.0 x 10 -12)
Log -1 6.8 = I / 1.0 x 10 -12
I = (Log -1 6.8) x 1.0 x 10 -12
I = 6.31 x 10 -6 w
Total Intensity, I = (2.0 x 10 -4 w) + (6.31 x 10 -6 w)
= 2.06 x 10 -4 w
Hence,
Combined SPL = 10 log ( 4.05 x 10 -4 / 1.0 x 10 -12)
= 83.14 dB
NON-PEAK HOUR
HIGHEST READING : 58 dB
58 dB = 10 log ( I / Iref)
58 dB = 10 log ( I / 1.0 x 10 -12)
5.8dB = log ( I / 1.0 x 10 -12)
Log -1 5.8 = I / 1.0 x 10 -12
I = (Log -1 5.8) x 1.0 x 10 -12
I = 6.31 x 10 -7 w
LOWEST READING : 53 dB
53 dB = 10 log ( I / Iref)
53 dB = 10 log ( I / 1.0 x 10 -12)
5.3dB = log ( I / 1.0 x 10 -12)
Log -1 5.3 = I / 1.0 x 10 -12
I = (Log -1 5.3) x 1.0 x 10 -12
I = 2.0 x 10 -7 w
Total Intensity, I = (6.31 x 10 -7 w) + (2.0 x 10 -7 w)
= 8.31 x 10 -7 w
Hence,
Combined SPL = 10 log ( 8.31 x 10 -7 / 1.0 x 10 -12)
= 59.20 dB

96 | P a g e
3.6.3 Reverberation Time (RT)
Reverberation time (RT) at 500Hz
The reverberation time is defined as the length of time required for sound to decay 60
decibels (dB) from its initial level after the sound is stopped in an enclosed space.
Reverberation time is calculated to indicate the reverberation quality and describing the
acoustical quality of an enclosure. The reverberation time of an enclosed space can be
controlled by the distances between the surface of the room, the materials absorption
coefficient of the surface and the frequency of the sound. In addition, different kind of
materials have various kind of absorption coefficient in different frequency. Hence, acoustical
absorption coefficient of material in 500Hz frequency are taken as reference to calculate
reverberation time.
Table and calculation below shows the total sound absorption at 500Hz during peak
hour(event happening) and non-peak hour(no event happening).
The reverberation time of a space is linked to the surface enclosed and its volume by the
Sabine Formula :
RT = T x V
A
Where,
RT = Reverberation Time
T = Reverberation time in seconds (0.16s)
V = Volume of the room (m3)
A = Total absorption of room surface
Recommendation of reverberation time for various spaces:
Internal space Reverberation time, s
Multipurpose space 1.00 - 1.25
Open air space Very short
Dining area 0.7 - 0.8
A = S1a1 + S2a2 + S3a3 ….. Snan
S = Surface area of material
a = Absorption coefficient of
material
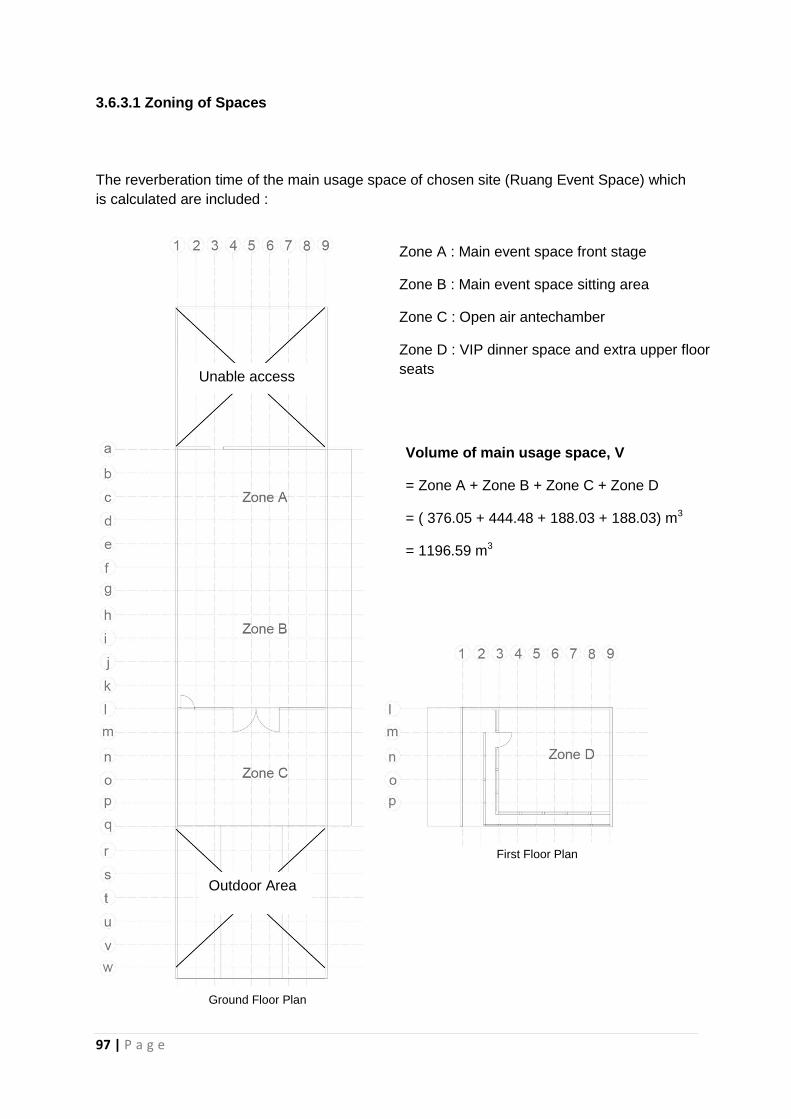
97 | P a g e
3.6.3.1 Zoning of Spaces
The reverberation time of the main usage space of chosen site (Ruang Event Space) which
is calculated are included :
Zone A : Main event space front stage
Zone B : Main event space sitting area
Zone C : Open air antechamber
Zone D : VIP dinner space and extra upper floor
seats
Volume of main usage space, V
= Zone A + Zone B + Zone C + Zone D
= ( 376.05 + 444.48 + 188.03 + 188.03) m3
= 1196.59 m3
Unable access
area
Outdoor Area
Ground Floor Plan
First Floor Plan

98 | P a g e
Zone A : Main event space front stage
Building
component
Material Surface area, S
(m2)
Absorption
coefficient, a
Absorption of room
surface, A
Wall Concrete Wall With
Plaster Finish
83.24 0.05 4.162
Wood Laminated
Sheets
14.18 0.15 2.127
Unfurnished Brick Wall
26.52 0.03 0.796
Wood Insulation Panels
14.18 0.15 2.127
Floor Concrete Floor with
White paint Finish
51.00 0.02 1.020
Carpet Flooring
11.68 0.50 5.84
Ceiling Plywood Ceiling with
Black paint Finish
62.68 0.05 3.134
Furniture Timber Door
6.00 0.2 1.200
Total Absorption, A (non-peak hour) 20.406
Furniture Chair
31.50 0.28 8.820
People 80.00 0.42 33.60
Total Absorption, A (peak hour) 62.826
Volume of Zone A
V = 8.84 m x 7.09 m x 6 m
= 376.05 m3

99 | P a g e
Discussion :
The reverberation time for Zone A in 500 Hz of absorption at non-peak period is 2.949s and
0.958s during peak period. According to the recommendation of reverberation time for
multipurpose space which is 1.00s - 1.25s, the reverberation time of non-peak period at
Zone A exceeds the standard which could form noise interruption to user. However, it won’t
brings big impact to user due to non-peak period of Zone A is without having any event and
less activities.
Reverberation Time, RT ( Non-peak hour)
RT = (T x V) / A
= ( 0.16 s x 376.05 m3 ) / 20.406
= 2.949 s
Reverberation Time, RT ( Peak hour)
RT = (T x V) / A
= ( 0.16 s x 376.05 m3 ) / 62.826
= 0.958 s

100 | P a g e
Zone B : Main event space sitting area
Building
component
Material Surface area, S
(m2)
Absorption
coefficient, a
Absorption of room
surface, A
Wall Concrete Wall With
Plaster Finish
50.28 0.05 2.514
Wood Laminated
Sheets
16.76 0.15 2.514
Glass Wall
53.04 0.10 5.304
Wood Insulation Panels
16.76 0.15 2.514
Floor Concrete Floor with
White paint Finish
74.10 0.02 1.482
Ceiling Plywood Ceiling with
Black paint Finish
74.10 0.05 3.705
Furniture Timber Door
6.00 0.2 1.200
Total Absorption, A (non-peak hour) 19.233
Furniture Chair
44.10 0.28 12.348
People 110 0.42 46.200
Total Absorption, A (peak hour) 77.781
Volume of Zone B
V = 8.84 m x 8.38 m x 6 m
= 444.48 m3

101 | P a g e
Discussion :
The reverberation time for Zone B in 500 Hz of absorption at non-peak period is 3.698s and
0.914s during peak period. According to the recommendation of reverberation time for
multipurpose space which is 1.00s - 1.25s, the reverberation time of non-peak period at
Zone B totally exceeds the standard which form noise interruption and heavy echo to user.
However, it still acceptable due to non-peak period of Zone B is without having any event
and less activities. While the reverberation time at peak period at Zone B is too short which
needed improvement by implementing surface treatment of building component and surface
materials.
Reverberation Time, RT ( Non-peak hour)
RT = (T x V) / A
= ( 0.16 s x 444.48 m3 ) / 19.233
= 3.698 s
Reverberation Time, RT ( Peak hour)
RT = (T x V) / A
= ( 0.16 s x 444.48 m3 ) / 77.781
= 0.914 s

102 | P a g e
Zone C : Open air antechamber
Building
component
Material Surface area, S
(m2)
Absorption
coefficient, a
Absorption of room
surface, A
Wall Concrete Wall With
Plaster Finish
21.27 0.05 1.064
Unfurnished Brick Wall
4.50 0.03 0.135
Glass Wall
53.04 0.10 5.304
Floor Laminated Timber
Flooring
62.68 0.07 4.388
Ceiling Metal Deck Ceiling
62.68 0.25 15.670
Furniture Timber Door
6.00 0.2 1.200
Total Absorption, A (non-peak hour) 27.761
Furniture Table 9.00 0.28 2.520
People 30 0.42 12.600
Total Absorption, A (peak hour) 42.881
Volume of Zone C
V = 8.84 m x 7.09 m x 3 m
= 188.03 m3
103 | P a g e
Discussion :
The reverberation time for Zone C in 500 Hz of absorption at non-peak period is 1.084s and
0.702s during peak period. According to the recommendation of reverberation time for open
air space which is very short, the reverberation time of both non-peak period and peak
period at Zone C are under the acceptable level.
Reverberation Time, RT ( Non-peak hour)
RT = (T x V) / A
= ( 0.16 s x 188.03 m3 ) / 27.761
= 1.084 s
Reverberation Time, RT ( Peak hour)
RT = (T x V) / A
= ( 0.16 s x 188.03 m3 ) / 42.881
= 0.702 s
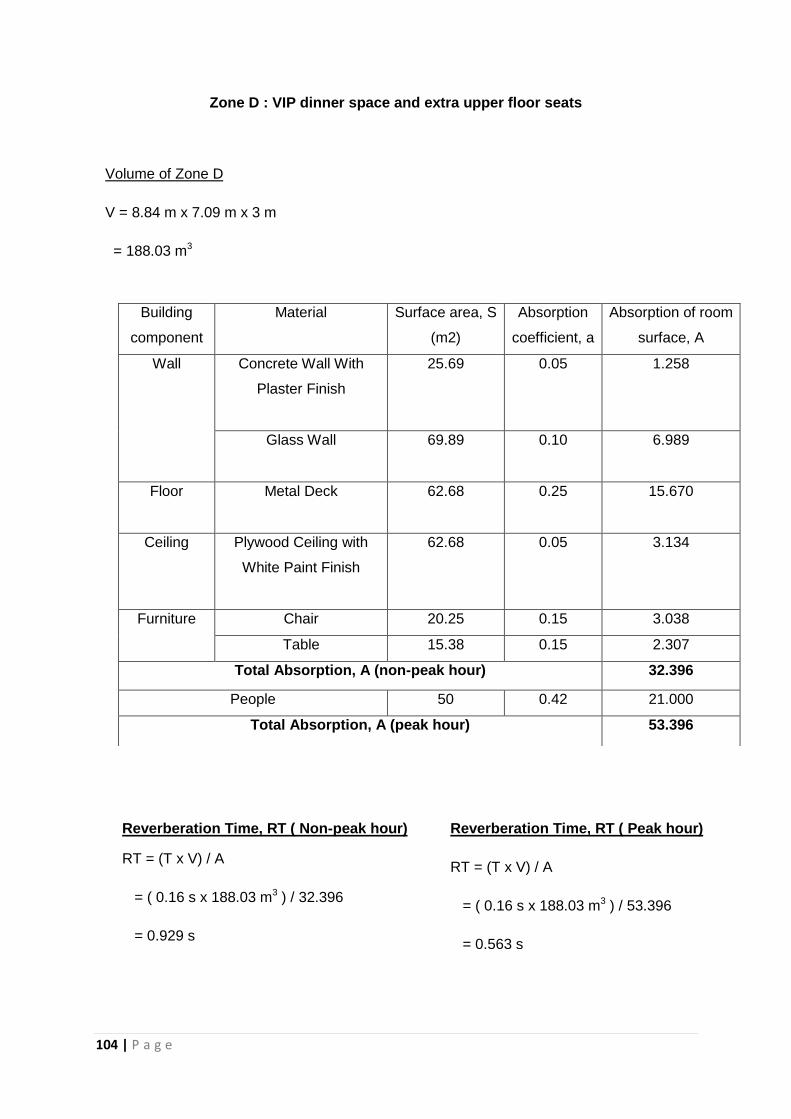
104 | P a g e
Zone D : VIP dinner space and extra upper floor seats
Building
component
Material Surface area, S
(m2)
Absorption
coefficient, a
Absorption of room
surface, A
Wall Concrete Wall With
Plaster Finish
25.69 0.05 1.258
Glass Wall
69.89 0.10 6.989
Floor Metal Deck
62.68 0.25 15.670
Ceiling Plywood Ceiling with
White Paint Finish
62.68 0.05 3.134
Furniture Chair 20.25 0.15 3.038
Table 15.38 0.15 2.307
Total Absorption, A (non-peak hour) 32.396
People 50 0.42 21.000
Total Absorption, A (peak hour) 53.396
Volume of Zone D
V = 8.84 m x 7.09 m x 3 m
= 188.03 m3
Reverberation Time, RT ( Non-peak hour)
RT = (T x V) / A
= ( 0.16 s x 188.03 m3 ) / 32.396
= 0.929 s
Reverberation Time, RT ( Peak hour)
RT = (T x V) / A
= ( 0.16 s x 188.03 m3 ) / 53.396
= 0.563 s
105 | P a g e
Discussion :
The reverberation time for Zone D in 500 Hz of absorption at non-peak period is 0.929s and
0.563s during peak period. According to the recommendation of reverberation time for
dinning space which is between 0.7s - 0.8s, the reverberation time of both non-peak period
and peak period at Zone D are out of the required standard. Thus, Zone D need special
implementation of acoustic treatment in order to improve the acoustic quality of Zone D to
meet the required reverberation time ran.
106 | P a g e
3.6.4 Sound Reduction Index (SRI)
The sound reduction index, SRI also known as Sound Transmission Loss, TL is used to
measure the number of decibels lost when a sound of a given frequency is transmitted
through the structure such as a wall, window, door, or ventilator of the chosen site, Ruang
Event Space.
The sound reduction index of a space is linked to the transmission coefficient of material
and the surface area of material and the calculation is based on the formula below :
SRI = TL = 10 log 10 1
TAV
Where,
TL = Transmission Loss
SRI = Sound Reduction Index
TAV = Average transmission coefficient of material
TAV = S1TC1 + S2TC2 + S3TC3 ….. SnTCn
Total surface area
Where,
S = Surface area of material
TC = Transmission coefficient of material
Recommendation of Internal Noise level for various spaces:
Internal space Internal Noise Level, dB
Multipurpose space 25
Open air space 45 -50
Dining area 45

107 | P a g e
3.6.4.1 Zoning of Spaces
The Sound Reduction Index of the main usage space of chosen site ( Ruang Event Space)
are included :
Outdoor area
Unable access
area
Zone A : Main event space front stage
Zone B : Main event space sitting area
Zone C : Open air antechamber
Zone D : VIP dinner space and extra upper floor seats
Ground Floor Plan
First Floor Plan
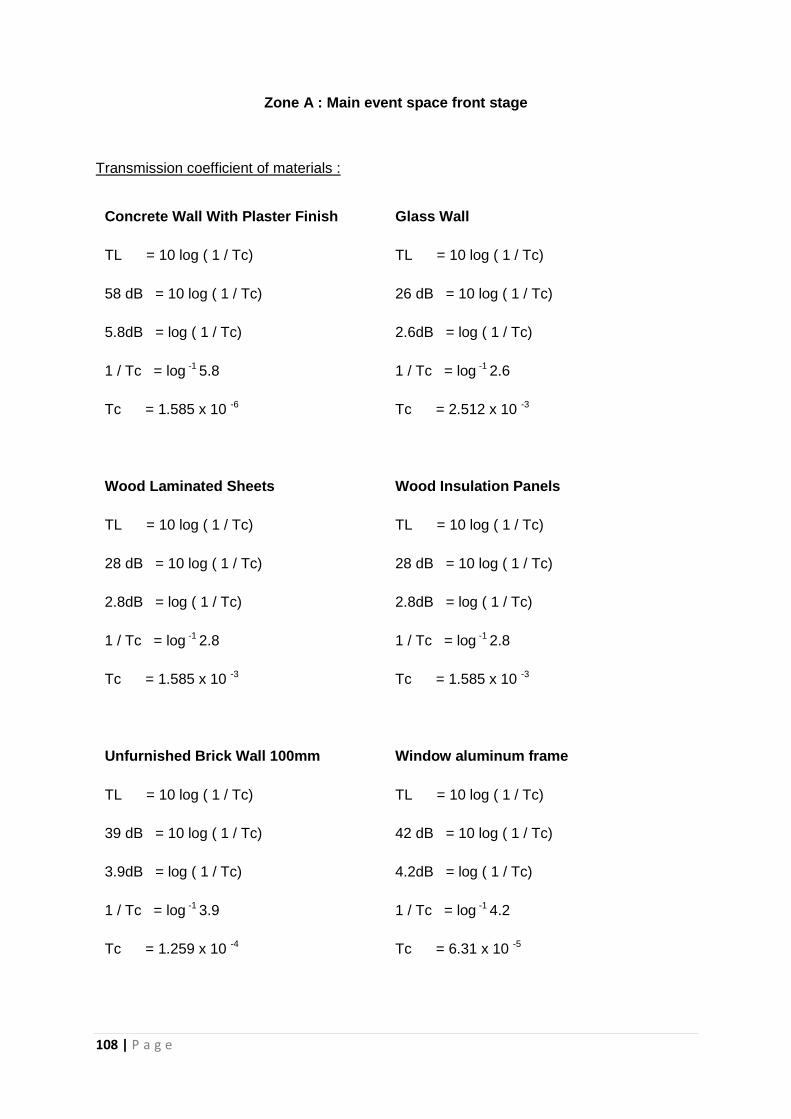
108 | P a g e
Zone A : Main event space front stage
Transmission coefficient of materials :
Concrete Wall With Plaster Finish
TL = 10 log ( 1 / Tc)
58 dB = 10 log ( 1 / Tc)
5.8dB = log ( 1 / Tc)
1 / Tc = log -1 5.8
Tc = 1.585 x 10 -6
Wood Laminated Sheets
TL = 10 log ( 1 / Tc)
28 dB = 10 log ( 1 / Tc)
2.8dB = log ( 1 / Tc)
1 / Tc = log -1 2.8
Tc = 1.585 x 10 -3
Unfurnished Brick Wall 100mm
TL = 10 log ( 1 / Tc)
39 dB = 10 log ( 1 / Tc)
3.9dB = log ( 1 / Tc)
1 / Tc = log -1 3.9
Tc = 1.259 x 10 -4
Glass Wall
TL = 10 log ( 1 / Tc)
26 dB = 10 log ( 1 / Tc)
2.6dB = log ( 1 / Tc)
1 / Tc = log -1 2.6
Tc = 2.512 x 10 -3
Wood Insulation Panels
TL = 10 log ( 1 / Tc)
28 dB = 10 log ( 1 / Tc)
2.8dB = log ( 1 / Tc)
1 / Tc = log -1 2.8
Tc = 1.585 x 10 -3
Window aluminum frame
TL = 10 log ( 1 / Tc)
42 dB = 10 log ( 1 / Tc)
4.2dB = log ( 1 / Tc)
1 / Tc = log -1 4.2
Tc = 6.31 x 10 -5

109 | P a g e
Material Surface
area, S
(m2)
SRI
(dB)
Transmission
coefficient of
material (TC)
Transmission coefficient
of material (T)
= S x Tc
Concrete Wall With Plaster
Finish
83.24 58 1.585 x 10 -6
1.319 x 10 -4
Wood Laminated Sheets
14.18 28 1.585 x 10 -3 0.022
Unfurnished Brick Wall
100mm
26.52 39 1.259 x 10 -4 3.339 x 10 -3
Wood Insulation Panels
14.18 28 1.585 x 10 -3 0.022
Average transmission coefficient of material, TAV
TAV = S1TC1 + S2TC2 + S3TC3 ….. SnTCn
Total surface area
TAV = (1.319 x 10 -4 ) + (0.022) + (3.339 x 10 -3 ) + (0.022)
(83.24 + 14.18 + 26.52 + 14.18) m2
= 0.047 / 138.12
= 3.402 x 10 -4
Sound Reduction Index, SRI
SRI = 10 log ( 1 / TAV)
= 10 log ( 1/ 3.402 x 10 -4)
= 34.68 dB

110 | P a g e
Zone B : Main event space sitting area
Transmission coefficient of materials :
Concrete Wall With Plaster Finish
TL = 10 log ( 1 / Tc)
58 dB = 10 log ( 1 / Tc)
5.8dB = log ( 1 / Tc)
1 / Tc = log -1 5.8
Tc = 1.585 x 10 -6
Wood Laminated Sheets
TL = 10 log ( 1 / Tc)
28 dB = 10 log ( 1 / Tc)
2.8dB = log ( 1 / Tc)
1 / Tc = log -1 2.8
Tc = 1.585 x 10 -3
Unfurnished Brick Wall 100mm
TL = 10 log ( 1 / Tc)
39 dB = 10 log ( 1 / Tc)
3.9dB = log ( 1 / Tc)
1 / Tc = log -1 3.9
Tc = 1.259 x 10 -4
Glass Wall
TL = 10 log ( 1 / Tc)
26 dB = 10 log ( 1 / Tc)
2.6dB = log ( 1 / Tc)
1 / Tc = log -1 2.6
Tc = 2.512 x 10 -3
Wood Insulation Panels
TL = 10 log ( 1 / Tc)
28 dB = 10 log ( 1 / Tc)
2.8dB = log ( 1 / Tc)
1 / Tc = log -1 2.8
Tc = 1.585 x 10 -3
Window aluminum frame
TL = 10 log ( 1 / Tc)
42 dB = 10 log ( 1 / Tc)
4.2dB = log ( 1 / Tc)
1 / Tc = log -1 4.2
Tc = 6.31 x 10 -5
Solid timber door
TL = 10 log ( 1 / Tc)
37 dB = 10 log ( 1 / Tc)
3.7dB = log ( 1 / Tc)
1 / Tc = log -1 3.7
Tc = 1.995 x 10 -4

111 | P a g e
Material Surface
area, S
(m2)
SRI
(dB)
Transmission
coefficient of
material (TC)
Transmission coefficient
of material (T)
= S x Tc
Concrete Wall With Plaster
Finish
67.04 58 1.585 x 10 -6
1.063 x 10 -4
Wood Laminated Sheets
16.76 28 1.585 x 10 -3 0.027
Glass Wall
53.04 26 2.512 x 10 -3 0.133
Wood Insulation Panels
16.76 28 1.585 x 10 -3 0.027
Window aluminum frame 13.1 42 6.31 x 10 -5 8.266 x 10 -4
Solid timber door 6 37 1.995 x 10 -4 1.197 x 10 -3
Average transmission coefficient of material, TAV
TAV = S1TC1 + S2TC2 + S3TC3 ….. SnTCn
Total surface area
TAV = (1.063 x 10 -4 ) + (0.027) + (0.133) + (0.027) + (8.266 x 10 -4) + (1.197 x 10 -3)
(93.56 + 16.76 + 53.04 + 16.76 + 13.1 + 6) m2
= 0.189 / 172.7
= 1.098 x 10 -3
Sound Reduction Index, SRI
SRI = 10 log ( 1 / TAV)
= 10 log ( 1/ 1.098 x 10 -3)
= 29.59 dB
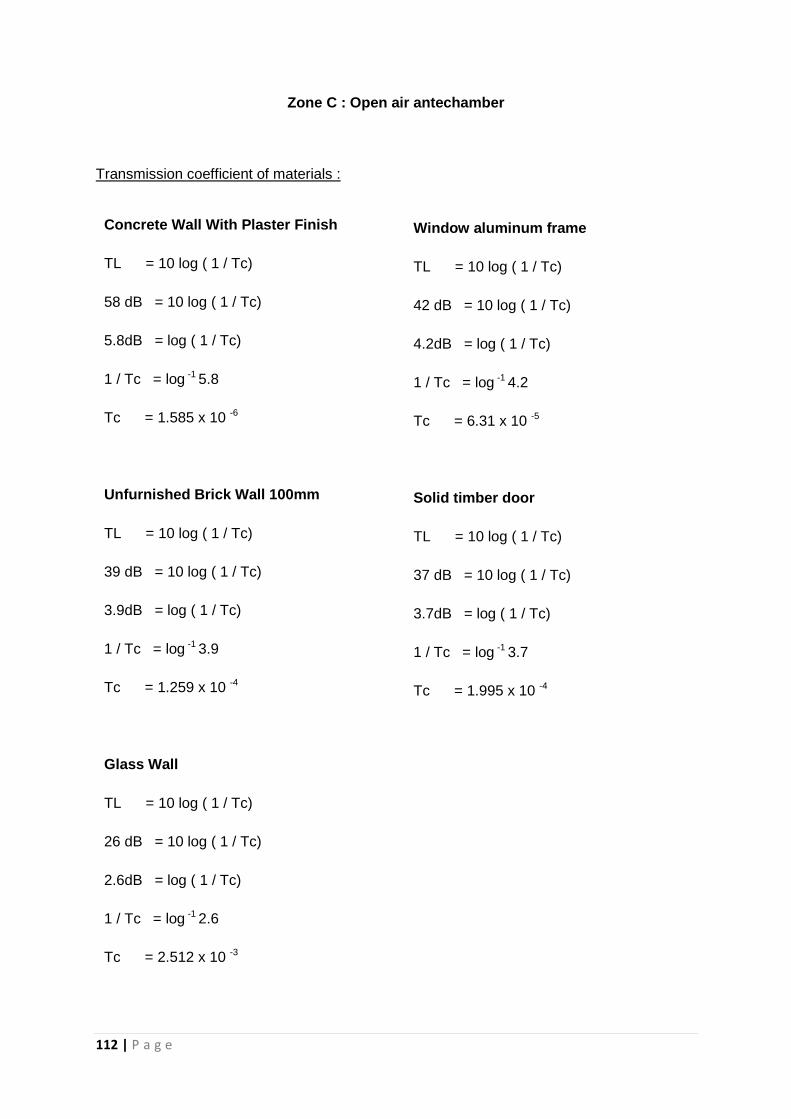
112 | P a g e
Zone C : Open air antechamber
Transmission coefficient of materials :
Concrete Wall With Plaster Finish
TL = 10 log ( 1 / Tc)
58 dB = 10 log ( 1 / Tc)
5.8dB = log ( 1 / Tc)
1 / Tc = log -1 5.8
Tc = 1.585 x 10 -6
Unfurnished Brick Wall 100mm
TL = 10 log ( 1 / Tc)
39 dB = 10 log ( 1 / Tc)
3.9dB = log ( 1 / Tc)
1 / Tc = log -1 3.9
Tc = 1.259 x 10 -4
Glass Wall
TL = 10 log ( 1 / Tc)
26 dB = 10 log ( 1 / Tc)
2.6dB = log ( 1 / Tc)
1 / Tc = log -1 2.6
Tc = 2.512 x 10 -3
Window aluminum frame
TL = 10 log ( 1 / Tc)
42 dB = 10 log ( 1 / Tc)
4.2dB = log ( 1 / Tc)
1 / Tc = log -1 4.2
Tc = 6.31 x 10 -5
Solid timber door
TL = 10 log ( 1 / Tc)
37 dB = 10 log ( 1 / Tc)
3.7dB = log ( 1 / Tc)
1 / Tc = log -1 3.7
Tc = 1.995 x 10 -4

113 | P a g e
Reference : Staff, S. O. (n.d.). Recommended reverberation times for 7 key spaces.
Retrieved October 31, 2016, from
http://info.soundofarchitecture.com/blog/recommended-reverberation-times-for-7-key-spaces
Material Surface
area, S
(m2)
SRI
(dB)
Transmission
coefficient of
material (TC)
Transmission coefficient
of material (T)
= S x Tc
Concrete Wall With Plaster
Finish
21.27 58 1.585 x 10 -6
3.371 x 10 -5
Unfurnished Brick Wall 100mm
4.5 39 1.259 x 10 -4 5.666 x 10 -4
Glass Wall
53.04 26 2.512 x 10 -3 0.133
Window aluminum frame 13.1 42 6.31 x 10 -5 8.266 x 10 -4
Solid timber door 6 37 1.995 x 10 -4 1.197 x 10 -3
Average transmission coefficient of material, TAV
TAV = S1TC1 + S2TC2 + S3TC3 ….. SnTCn
Total surface area
TAV = (3.371 x 10 -5 ) + (5.666 x 10 -4 ) + (0.133) + (8.266 x 10 -4) + (1.197 x 10 -3)
(21.27 + 4.5 + 53.04 + 13.1 + 6) m2
= 0.137 / 97.91
= 1.399 x 10 -3
Sound Reduction Index, SRI
SRI = 10 log ( 1 / TAV)
= 10 log ( 1/ 1.399 x 10 -3)
= 28.54 dB
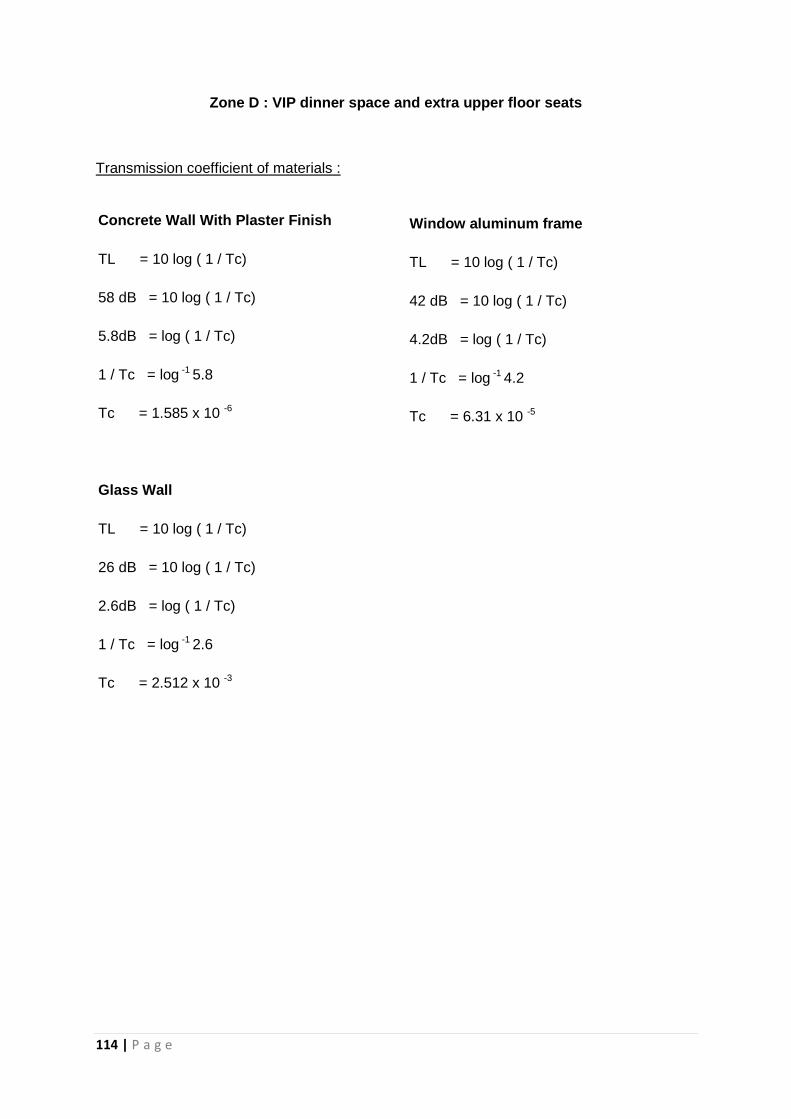
114 | P a g e
Zone D : VIP dinner space and extra upper floor seats
Transmission coefficient of materials :
Concrete Wall With Plaster Finish
TL = 10 log ( 1 / Tc)
58 dB = 10 log ( 1 / Tc)
5.8dB = log ( 1 / Tc)
1 / Tc = log -1 5.8
Tc = 1.585 x 10 -6
Glass Wall
TL = 10 log ( 1 / Tc)
26 dB = 10 log ( 1 / Tc)
2.6dB = log ( 1 / Tc)
1 / Tc = log -1 2.6
Tc = 2.512 x 10 -3
Window aluminum frame
TL = 10 log ( 1 / Tc)
42 dB = 10 log ( 1 / Tc)
4.2dB = log ( 1 / Tc)
1 / Tc = log -1 4.2
Tc = 6.31 x 10 -5

115 | P a g e
Material Surface
area, S
(m2)
SRI
(dB)
Transmission
coefficient of
material (TC)
Transmission coefficient
of material (T)
= S x Tc
Concrete Wall With Plaster
Finish
25.69 58 1.585 x 10 -6
4.072 x 10 -5
Glass Wall
69.89 26 2.512 x 10 -3 0.176
Window aluminum frame 17.26 42 6.31 x 10 -5 1.089 x 10 -3
Average transmission coefficient of material, TAV
TAV = S1TC1 + S2TC2 + S3TC3 ….. SnTCn
Total surface area
TAV = (4.072 x 10 -5 ) + (0.176) + (1.089 x 10 -3)
(25.69 + 68.89 + 17.26) m2
= 0.177 / 112.84
= 1.569 x 10 -3
Sound Reduction Index, SRI
SRI = 10 log ( 1 / TAV)
= 10 log ( 1/ 1.569 x 10 -3)
= 28.04 dB
116 | P a g e
4.0
REFERENCE

117 | P a g e
Reference : Staff, S. O. (n.d.). Recommended reverberation times for 7 key spaces.
Retrieved October 31, 2016, from
http://info.soundofarchitecture.com/blog/recommended-reverberation-times-for-7-key-
spaces
Reference : Staff, S. O. (n.d.). Recommended reverberation times for 7 key spaces.
Retrieved October 31, 2016, from
http://info.soundofarchitecture.com/blog/recommended-reverberation-times-for-7-key-
spaces
Ground Floor Plan