building momentum - mansfield, texas message ... the trinity railway system located in arlington and...
TRANSCRIPT

MANSFIELD•tlH s
City of Mansfield, TexasAnnual Operating Budget
For Fiscal YearOctober 1, 2016 - September 30, 2017
Program of ServicesFor Fiscal Year
October 1, 2016 - September 30, 2017As Adopted by the Mansfield City Council
BuildingMomentum

CITY OF MANSFIELD, TEXAS
ANNUAL OPERATING BUDGET
FOR FISCAL YEAR 2016-2017
The 2016-2017 Budget will raise more revenue from
property taxes than last year’s budget by an amount of
$3,626,084 which is a 6.49% increase over last year’s budget.
The property tax revenue to be raised from new property
added to the tax roll is $1,163,798.
The amounts above are based on the City’s approved Fiscal Year 2016-2017 tax rate of $0.7100
per $100 of assessed valuation, which is the same tax rate as Fiscal Year 2015-2016.
City Council Record Vote
The members of the governing body voted on the adoption of the 2016-2017 Budget as follows:
FOR: Mayor David Cook, Council Members Stephen Lindsey, Darryl Haynes, Wendy Burgess,
Brent Newsom and Cory Hoffman
AGAINST: None
PRESENT AND NOT VOTING: None
ABSENT: Mayor Pro-Tem Larry Broseh
TAX RATE ADOPTED BUDGET
2015-2016
ADOPTED BUDGET
2016-2017
Property Tax Rate 0.710000 0.710000
Effective Tax Rate 0.720352 0.666731
Effective M & O Rate 0.474735 0.436873
Rollback Rate 0.754388 0.711045
Debt Rate 0.241675 0.239223
The total amount of municipal debt obligations owed by the City of Mansfield as of 9/30/2016 is
$153,675,365, including principal and interest.

TABLE OF CONTENTS (Click on a page number to go directly to that page.)
INTRODUCTION How to Read This Document ................................................................................................... 5
Organization Chart ................................................................................................................... 6
Mansfield at a Glance ......................................................................................................... 7-11
Distinguished Budget Award ................................................................................................. 12
Credits .................................................................................................................................... 13
BUDGET MESSAGE Budget Message ................................................................................................................ 15-28
Fund/Department Matrix ....................................................................................................... 20
Summary of Full-Time Equivalent Positions .................................................................... 29-32
Budget Phases ........................................................................................................................ 34
Budget Calendar ................................................................................................................ 35-36
Budget Process ................................................................................................................. 37-40
Basis of Budgeting ............................................................................................................ 41-44
Financial Policies .............................................................................................................. 44-48
LONG-TERM FINANCIAL PLAN City of Mansfield Strategic Plan ....................................................................................... 49-75
Assumptions ...................................................................................................................... 66-70
Summary of Projects ......................................................................................................... 71-75
MAJOR REVENUES ......................................................................................................... 77-86
GOALS AND OBJECTIVES
Goals and Objectives Statement ............................................................................................ 87
Annual Service Program Goals & Objectives ................................................................... 88-94
BUDGET SUMMARY
Business Matrix ..................................................................................................................... 95
Combined Budget Summary .................................................................................................. 96
General Fund Summaries and Revenue Sources ............................................................ 97-103
Utility Fund Summaries and Schedules ........................................................................ 104-108
Law Enforcement Center Summaries and Schedules ................................................... 109-110
Environmental Services Fund Summaries .................................................................... 111-112
Special Revenue Fund Summaries ................................................................................ 113-118
Capital Projects Funds: Parks, Streets, Utility, Building, Equipment ........................... 119-123
DEBT SERVICE FUNDS
Definition of Debt Service Fund .......................................................................................... 125
Debt Policy.................................................................................................................... 126-131
General Obligation Debt Summaries ................................................................................... 132
Water & Sewer Debt Summaries ......................................................................................... 133
MPFDC Debt Service Summaries ....................................................................................... 134
MEDC Debt Service Summaries ......................................................................................... 135
Environmental Services Debt Summaries ............................................................................ 136
GENERAL FUND
Definition of General Fund ................................................................................................ 137
General Government Division ..................................................................................... 138-149
Business Services Division.......................................................................................... 150-167
Police Division ............................................................................................................ 168-194
Fire Division ................................................................................................................ 195-205
Planning Division ........................................................................................................ 206-212
Development Services Division .................................................................................. 213-222
Community Services Division ..................................................................................... 223-238
Public Works Division ................................................................................................ 239-247
ENTERPRISE FUNDS
Definition of Enterprise Fund ............................................................................................. 249
Environmental Services Fund...................................................................................... 250-252
Water & Sewer Fund (Utility Services Division) ........................................................ 253-264
Law Enforcement Center Fund ................................................................................... 265-278
SPECIAL REVENUE FUNDS Definition of Special Revenue Fund .................................................................................. 279
Hotel/Motel Tax Fund ................................................................................................. 280-283
Mansfield Park Facilities Development Corporation Fund ......................................... 284-288
Mansfield Economic Development Corporation Fund ................................................ 289-291
Tree Mitigation Fund……………………………………………………………………..292
CAPITAL PROJECTS FUNDS Definition and Phases of Capital Projects Fund .......................................................... 293-295
Summary of Capital Projects Funds ................................................................................... 296
Street Construction Fund ............................................................................................. 297-298
Utility Construction Fund ............................................................................................ 299-300
Building Construction Fund ....................................................................................... 300-301
Parks Construction Fund ............................................................................................. 302-303
Equipment Replacement Fund ........................................................................................... 304
Mansfield Economic Development Fund ........................................................................... 305
ATTACHMENTS
Historical Analysis ............................................................................................................. 307
Top Employers ................................................................................................................... 308
Acronyms ........................................................................................................................... 309
Budget Glossary .......................................................................................................... 310-318
Computation of Legal Debt Margin ................................................................................... 319
Property Tax Rate Schedule ........................................................................................ 319-320
Tax Rate Ordinance ..................................................................................................... 321-322
Budget Ordinance ........................................................................................................ 323-325


5
HOW TO READ THIS DOCUMENT
You are holding the published City of Mansfield Budget for the fiscal year beginning October 1, 2016
and ending September 30, 2017. This document has been prepared to help you, the reader, learn of the
issues affecting the Mansfield community. Many people believe a City budget is only a financial plan.
Although you can learn much of the City’s financial portfolio, the 2016-2017 Budget Document has been
designed to serve other functions as well. The budget is a policy document as it presents major policies
that guide how the City is managed. The budget also is an operational guide that gives the public, elected
officials and City Staff information pertaining to the production and performance of individual
departments. The budget is drafted as a communication device: information is conveyed verbally and
visually in a way that should be easy to understand, even by those unfamiliar with the City of Mansfield.
THE BUDGET FORMAT
The Budget Document is divided into four major sections: Introductory, Financial/Operational, Budget
Summary and Attachments. The introductory section contains the City Manager’s letter addressed to City
Council, which explains the major issues and policies that affected the development of the FY2016-2017
budget. This section also describes the City’s goals, a synopsis of the City’s major projects and the City’s
overall organizational structure.
The Financial/Operational section describes various aspects of the City’s organizational structure as well
as fund and department group information. The City of Mansfield uses the fund method of accounting.
A fund is a unit that tracks the application of public resources. For example, the Utility Fund is
established to keep track of revenues and expenses within the Utility Division. Most interest is in the
General Fund which includes City operations: General Government, Business Services, Police, Fire,
Planning, Development Services, Public Works and Parks/Community Services. Financial statements are
provided for each fund. The financial statement shows the beginning balances, revenues, expenditures,
and ending balances for the year. Accompanying the statements are narratives and illustrations that
describe the major aspects of a particular fund. There may be one or more departments that comprise
each fund. Each department is presented with a mission statement, a brief synopsis of the key
departmental increases or decreases, a listing of the unit’s accomplishments for the previous fiscal year
and operational objectives for the 2016-2017 fiscal year. Selected performance measures for each
department are presented. The funding and staffing for each department are summarized for a number of
years.
The Budget Summary section provides details on individual funds including Enterprise Funds and Capital
Improvement Funds.
Finally, various attachments are presented towards the back of the document that include adopted budget
and tax rate ordinances, major companies, historical analysis of the tax rate, acronyms and a Glossary of
Terms.
Please contact the City’s Business Services Division for questions related to the 2016-2017 Budget
Document at 817-276-4262.

6
City Manager
Deputy City
Manager
Parks and Recreation
Cultural Arts
Library and Museum
Communications and
Marketing
Human Resources
City Secretary’s Office
Deputy City
ManagerWater and Sewer
Utilities
Development Services
Planning
Public Works
Environmental Services
Fire Division
Police Division
Deputy City
Manager
Finance
Accounting
Budget
Purchasing
Information Technology
Sanitation
Tax Collection
Legal Department
Mayor and City Council
Citizens of Mansfield
MEDC
MPFDC

7
MANSFIELD AT A GLANCE
COMMUNITY PROFILE
The City of Mansfield is located in the southeastern portion of Tarrant County strategically located 25
miles from Dallas and 20 miles from Fort Worth. Some areas of the City extend into Johnson and Ellis
Counties. Mansfield is bound by the cities of Arlington on the north, Grand Prairie on the east and Fort
Worth on the west. The City enjoys a strategic location connected by U. S. Highway 287 that runs north
and south through the City, and State Highway 360 that provides a direct connection between Arlington,
Grand Prairie and the Dallas/Fort Worth International Airport.
The City of Mansfield is located approximately 30 minutes from the 4th busiest airport in the country:
the Dallas/Fort Worth International Airport. The Trinity Railway System located in Arlington and Grand
Prairie provides mass transit availability to the citizens of Mansfield to both Dallas and Fort Worth.
Railroad Freight Service is provided by the Union Pacific Railroad.
The City of Mansfield’s population is estimated to approach 68,786 for fiscal year 2016/2017. In
addition, the estimated population within a 15 mile radius of the City is estimated to be 1,103,678 based
on figures from the North Central Council of Governments. Mansfield has approximately 36.69 square
miles, of which over 40% remains undeveloped. The typical Mansfield household earns an income of
approximately $111,177 and has an average home value of approximately $209,094. The City of
Mansfield is considered one of the fastest growing cities in Tarrant County as estimated by the North
Central Council of Governments. Money Magazine recognized the City of Mansfield as a top place to
live in 2007, 2009, 2011 and 2014, and NerdWallet included Mansfield on its list of America’s Best
Small Cities for Families in 2016.
The Mansfield economy is supported by major retail developments including Home Depot, Wal-Mart,
Lowe’s, Kohl’s, Kroger Marketplace and Target Super Center. Existing industrial businesses including
Klein Tools, Solvay Polymers, Pier 1 Imports and Mouser Electronics, continue to contribute to the City’s
tax base. The Mansfield Economic Development Corporation, which supports existing and new business
through the ½ cent sales tax adopted in 1997, enhances the City of Mansfield’s economic development
program.
The City is served by the Mansfield Independent School District, one of the highest-rated school
districts in the Dallas/Fort Worth metropolitan area by the Texas Education Agency. The City currently
has five high schools (Grades 9-12), one high school (Grades 11-12), one Alternative Education Center,
one Career and Technology Academy, six middle schools (Grades 7-8), six intermediate schools (Grades
5-6) and 23 elementary schools (Grades K-4). Enrollment for the 2016-2017 schoolyear is estimated to
approach 33,809 students.
Higher Education opportunities include several major colleges and universities: Southern Methodist
University, Texas Christian University, University of North Texas, The University of Texas at Arlington,
The University of Texas at Dallas, Texas Women’s University, Dallas Baptist University, University of
Dallas, Baylor University and the Tarrant and Dallas Community College Districts.
Medical Services are provided by local hospitals including Mansfield Methodist Medical Center,
Arlington Memorial Hospital, Columbia Medical Center-Arlington, Huguley Hospital, Harris Hospital
and John Peter Smith County Hospital.

8
Recreation and Culture are a major part of the City’s attraction, including Joe Pool Lake which is
approximately 10 minutes from the City, Cedar Hill State Park consisting of 2,000 acres, the Mansfield
National Golf Club and Walnut Creek Country Club. Citizens enjoy a state-recognized parks system that
includes over 800 acres of community parks, trails and athletic fields. In 2001, the City opened the
Mansfield Activities Center to provide recreational activities for children, adults and senior citizens. In
2001, the City also opened a new 17,000 square foot library with state-of-the-art library services. In 2009,
Mansfield adopted the Parks, Recreation, Open Space, and Trails Master Plan. The Main Street Theatre,
Arts Program and the Mansfield Historical Society provide cultural opportunities for the citizens of
Mansfield. Local recreation venues include Big League Dreams Sports Park, Hawaiian Falls Water Park
and the scheduled openings of Fieldhouse USA in late 2016 (an indoor basketball/volleyball facility with
space for hosting special events) and the Dallas Stars Center recreational ice rink in late 2017.

9
KEY DEMOGRAPHICS
Demographic Information Based On the 2010 Census
Fiscal Annual Median Household School Unemployment
Year Population Age Income Enrollment Rate
1980 8,102 29.5 36,406 3,866 5.0%
1990 15,549 35 40,700 7,600 4.9%
2000 28,031 33.15 42,154 13,418 2.6%
2010 56,368 32.3 82,037 31,010 8.5%
2011 56,850 32.3 82,037 32,177 8.5%
2012 57,494 32.3 82,037 32,577 8.3%
2013 58,217 32.3 91,618 32,732 7.2%
2014 59,230 32.3 91,959 32,778 5.4%
2015 62,246 32.3 97,391 33,394 5.1%
2016 63,248 35.5 98,943 33,809 4.0%
2017 68,786 35.2 111,177 33,809 3.9%
City or 1980 1990 2000 2010 2016 Percent
County Census Census Census Census Estimated Change
Mansfield 8,102 15,615 28,031 56,368 68,786 18.1%
Arlington 160,113 261,717 332,969 365,438 388,125 5.8%
Ft. Worth 385,164 447,619 534,694 741,206 812,238 8.7%
Tarrant County 860,880 1,170,103 1,446,219 1,809,034 1,982,498 8.7%
Dallas County 1,556,419 1,852,810 2,218,899 2,638,139 2,553,385 -3.3%
*Percent change from 2010 Census
0
20,000
40,000
60,000
80,000
2000 2012 2013 2014 2015 2016 2017
Population
School Enrollment

10
TOP TAXPAYERS
Mouser Electronic Wal-Mart Real Estate Business Trust
Mid-America Apartments, LP T Villas Di Lucca Texas
Advenir@Mansfield L.L.C. Advenir@Walnut Creek L.L.C.
Mansfield KDC Klein Tools, Inc.
Oncor Electric Delivery Co. SIR Mansfield Landing L.L.C.
Demographic Information Based On the 2010 Census and The Retail Coach January 2016.
POPULATION LAND AREA
City of Mansfield 68,786 36.69 Square Miles
Tarrant County 1,982,498
AGE HOUSEHOLD INCOME $111,177
0-17 28.3% Less than $14,999 5%
18-24 10.5% $15,000-$24,999 5%
25-34 10.9% $25,000-$34,999 5%
35-44 14.8% $35,000-$49,999 9%
45-54 16.0% $50,000-$74,999 16%
55-64 10.9% $75,000-$99,999 12%
65+ 8.6% $100,000 Plus 48%
SEX OCCUPATION
Male 49% Professional 28%
Female 51% Managerial 17%
Technician 8%
RACE Sales 11%
White 69% Teacher 10%
Black 18% Manufacturing 9%
Hispanic or Latin 8% Labor 4%
Other 5% Clerical 3%
Agriculture 1%
Other 9%
HOUSING UNITS SCHOOL YEARS COMPLETED
Residential Units 18,755 High School Graduates 28%
Average Home Value $209,094 Some College-No Degree 33%
Bachelor Degree or Higher 40%

11
New Construction
$0
$20,000,000
$40,000,000
$60,000,000
$80,000,000
$100,000,000
$120,000,000
$140,000,000
$160,000,000
$180,000,000
2009 2010 2011 2012 2013 2014 2015 Budget
2016
Budget
2017
Commercial
Residential
0
1,000,000,000
2,000,000,000
3,000,000,000
4,000,000,000
5,000,000,000
6,000,000,000
2011 2012 2013 2014 2015 2016 2017
Taxable Valuation

12

13
GFOA DISTINGUISHED BUDGET AWARD
The Government Finance Officers Association of the United States and Canada (GFOA) promulgates
certain procedures and standards that are accepted as authoritative guidelines for governmental budget
reporting. GFOA awards the “Distinguished Budget Presentation Award” to those governmental entities
whose annual budget conforms to the GFOA requirements.
The Government Finance Officers Association (GFOA) presented an Award for Distinguished Budget
Presentation to the City of Mansfield, Texas for its annual budget for the fiscal year beginning October 1,
2015 and ending September 30, 2016. This represents the 31st year the City has received this award.
The budget for FY 2016-2017 will be submitted to the GFOA for review.
Credits
This document has been compiled according to generally accepted budgeting and accounting guidelines
and practices.
As presented, this budget represents a comprehensive, in-depth review and plan for all expenditures and
services offered by the City of Mansfield, Texas.
Although much credit is due to all City division and department directors for many hours of staff time
devoted to the preparation of this document, several deserve special credit and recognition for their
assistance in the development and quality of this document.
Clayton Chandler City Manager
Peter Phillis Deputy City Manager
Troy Lestina Assistant Business Services Director
Gary Cardinale Budget & Purchasing
Jennifer Goldthwaite Budget & Purchasing
Shelly Lanners Deputy City Manager
Bart VanAmburgh Director of Public Works
Felix Wong Director of Planning
Joe Smolinski Deputy City Manager
Bill Lane In-house City Attorney

15
September 8, 2016
To the Honorable Mayor and Members of the City Council:
The Administration is pleased to present to you the City of Mansfield’s Operating and Capital
Improvement Programs for Fiscal Year 2016-2017. This document is a comprehensive, in-depth and easy
to read text that provides the foundation and footing for the entire organization’s fiscal activities during
the next year. The Budget Document reflects current industry trends using performance measurement data
and expanded illustrations to enhance the overall readability of the document.
It represents a statement of the City’s Fiscal Policies.
It represents a statement of the City’s Service Policies.
It accommodates the City’s revised Strategic Plan.
It communicates priorities of the citizens, Council, and Management for Fiscal Year 2016-2017 and
the future.
The accompanying statements and analysis tell a great story about the strength of our economy and the
dividends that each citizen is receiving as a result of good planning and good management of fiscal
resources. It is a story that has been told many times to the rating services, to prospective industries, and
other agencies. By nature, the Budget Message contains forward-looking projections. An examination of
past projections and estimates add credibility to what is presented.
The City of Mansfield is committed to conservative budgeting practices, including utilizing one time
revenues for one time expenditures, developing new revenue sources, adding staff as needed in public
safety, and managing operational costs while maintaining current service levels.
We have grown revenue, improved debt ratios, increased financial reserves, expanded the tax base, built
the local economy, realized higher per capita incomes and maintained the current tax rate of .71 cents.
Our outlook for long term growth is positive, and we remain cautious based on the current economic
environment. We continue to budget both revenues and expenditures conservatively but with anticipated
projected increases in new retail, residential and commercial construction.
City Council, working with staff, is committed to quality development. This has only been accomplished
through the committed efforts of many individuals making tough business decisions to ensure that our
goals to create value are maintained. More specifically, the City Council has been aggressive in
establishing impact fees or development fees that require new development to pay for its share of new
improvements and services. Tough decisions requiring minimum standards in the zoning of properties
and types of construction have created values that have benefited not only the City, but also the Mansfield
Independent School District. Economic development efforts have resulted in several new commercial and
industrial developments including Klein Tools, Kroger Marketplace, Villas Di Luca and many other
projects currently in progress. New public/private partnerships including the Fieldhouse project and
Dallas Stars Center project continue to add quality recreation venues to our parks and recreation system.
Simply put, the efforts of the City Council, the Planning and Zoning Commission, the Mansfield
Economic Development Corporation, the Mansfield Park Facilities Development Corporation and all
other boards and commissions have assisted the entire management team in building quality and value.
Quality builders are attracted to this community, its services and its school system. Commercial and retail
developers are keenly interested in the City’s progressive development policies.

16
The budget that accompanies the service program maintains this focus and priority of recognizing that
growth must produce value and quality.
Public Input
The City conducted two public hearings on August 22 and August 29, 2016. Citizen input was heard
during the allocation of the Hotel/Motel revenues. The City Council allocated approximately $713,300 in
total funds to promote tourism, historical preservation and the arts. Citizens and members of individual
groups seeking funding petitioned the City Council. The budget and tax rate were adopted unanimously
by City Council as presented by the City Manager. The City Manager presented a detailed list of priorities
including staffing, equipment and infrastructure needs during the public hearings.
On September 8, 2016 the City Council of Mansfield, Texas adopted the Annual Service Program for
Fiscal Year 2016-2017.
Management Strategies
Management monitors all development activity within the City during the year to manage the resources of
the City. The economic climate in the City of Mansfield continues to prosper along with the improving
economies of the state and nation. Well-timed infrastructure improvements, stringent development
standards and aggressive economic development strategies have created additional opportunities for
commercial and retail expansions. The residential market continues to add new development throughout
the City.
2016-2017 Budget Highlights
The City Council maintained the tax rate of $0.71 per $100 of valuation.
The City will improve programs in Public Safety, Streets, Community Services and Code Compliance.
The City will provide a 3% salary adjustment for all employees to remain competitive within the market
place.
New industrial, commercial and retail opportunities are being developed by the Mansfield Economic
Development Corporation, including site development for Broad Street at Hwy 287, Mansfield Retail
Center and other retail establishments throughout the City.
Continued emphasis on planning and infrastructure improvements including the design and construction
of the Fieldhouse, Stars Center, “The Back Yard,” Pond Branch, South Main Street development and
other developments in the downtown area.
New residential developments that include up to 2,312 single family homes are in some phase of
platting, design or set to begin construction.
Protection of the City’s credit ratings - All rated funds with strong fund balance positions.
The City has improved the estimated fund balance to $12,020,382.
Maintain and expand existing service levels.
Continue to explore additional revenue sources.
Add three Firefighters, three Police Officers, one Property Evidence Technician and one Arts Council
Coordinator in the General Fund.
Fund $1,250,377 in public safety vehicles, equipment and technology upgrades.

17
Local Economic Factors Affecting the 2016-2017 Service Programs
Improved industrial, commercial and residential valuations.
Increased interest in development along State Highway 360, Highway 287 and downtown.
Retail, commercial and industrial recruitment and retention.
Increased marketing efforts City-wide.
Sales tax is estimated to increase in 2016-2017 due to increased retail activity and development of new
retail centers.
Reduction in Gas Well valuations from decreases in natural gas prices.
Lower unemployment.
Strategic location in the Dallas/Fort Worth area - North/South corridors of Highway 360 and 287.
A well-planned City including desirable neighborhoods, excellent schools and superior City services.
Continue aggressive Economic Development programs.
Current average household family income of $111,177.
Impact of Economy on Surrounding Area Cities
City of Arlington - population growth based on the 2010 census of 10% since 1990. Major
developments including the new Dallas Cowboy’s Stadium and the Arlington Highlands retail center.
City of Fort Worth - population growth based on the 2010 census of 38.6% since 1990.
Dallas/Fort Worth Region - the region’s estimated unemployment of approximately 3.8% is below the
national average.
Impact of National and Global Economies
The national economy continues to improve.
Relocation of traditional population centers to the southwest region.
Terrorism.
Impact of uncertainty overseas.
The continued effect of the Affordable Health Care Act.
The 2016 National Elections.

18
Mission for Fiscal Year 2016-2017
City Management developed priorities and goals based on strategic planning meetings with City Council,
City Staff and various boards and commissions. These meetings were held to allow for City Council’s
input in developing the City’s Long Term Strategic Plan and the 2016-2017 Budget. Management and
City Council also revised the Strategic Plan to incorporate revenue and expense estimates in a recovering
national, state and local economy. Management met with key staff members to allow input in the
development of the 2016-2017 Budget. Similar themes, priorities and goals were identified by both City
Council and the City’s staff for the upcoming budget year.
“The mission of the City of Mansfield, Texas is to provide the highest quality service at the best
value” by providing a Desirable Community, Sustaining the Economy, Maintaining Services,
Maintaining a Positive Image and Making Good Business Decisions resulting in
SERVICE WITH EXCELLENCE.
In planning for the 2016-2017 Budget and Operating Plan, the management team strongly evaluated
existing service levels and measured the impact of 2016-2017 service plans on the City’s comprehensive
Long Term Financial Plan. The decision was made to move forward in maintaining and expanding current
service programs to meet the needs of the community.

19
SERVICE PROGRAM FOR FISCAL YEAR 2016-2017
In the preliminary presentation of the 2016-2017 Service Program to City Council, Management listed the
results and conclusions of strategic planning sessions held with Council and Staff that assisted in
developing the overall direction of the Service Program for FY 2016-2017. In the final presentations to
City Council on August 22, 2016 and August 29, 2016, Management presented a balanced budget and
discussed the following challenges, goals, objectives and priorities for FY 2016-2017:
Challenges:
Sustaining momentum.
Strategic Long Term Plan - dealing with an improving economy and expanding service demands.
Maintaining and enhancing long term public/private partnerships.
Organizational development - quality workforce and quality services.
Fund balance - maintaining and improving reserves.
Economic development - inventory of quality commercial properties.
Goals & Objectives:
Maintain or improve existing service levels within the existing tax rate.
Continue development of infrastructure - streets, facilities and utilities.
Maintain AA+ bond rating – maintain and improve fund balance, coverage and debt ratios.
Continue quality residential and commercial development.
Continue quality Park and Linear Trail development.
Maintain or improve public safety services.
Downtown revitalization.
Development of the Arts.
Priorities:
Maintain existing tax rate of $0.71000.
Maintain and expand improved service levels - sustainability of current and future operations.
Maintain the City’s credit rating and fund balance requirements.
Expansion of the tax base - economic development.
Improve, design and expand the Linear Park System.
Maintain a quality work force.
Ensure quality land use, planning and development.
Creation of Arts
2016-2017 Major Priorities and Issues
In an effort to identify the major issues related to the 2016-2017 Service Plan, the following is a brief
summary of issues related to the previously discussed issues, challenges and priorities facing the City of
Mansfield in the coming year. The City of Mansfield has developed a Long Term Financial Plan to reflect
the themes and priorities defined by City Management.

20
City of Mansfield
Fund/Department Matrix
General Fund
General Government
Business Services
Police
Fire
Planning
Development
Community Services
Public Works
Enterprise Funds
Utility Division
Law Enforcment Center
Environmental Services
Special Revenue Funds
Mansfield Park Facilities Development Corporation
Mansfield Economic Development Corporation
Hotel/Motel Tax
Tree Mitigation
Capital Projects Funds
Street Construction
Utility Construction
Building Construction
Parks Construction
Equipment Replacement
21
GENERAL FUND
Revenues
The overall General Fund budget for FY 2016-2017 is $52,208,793 or an increase of 9.13% over expected
revenues in FY 2015-2016. Property tax collections make up approximately 53% of the General Fund
operating revenue. Property tax revenue increased approximately $3,102,543. Revenue increases include
sales tax, franchise tax, permits and other miscellaneous revenues. Projected sales tax revenues increased
$880,075, or 9% from the expansion of commercial and retail tax base.
Staffing
The 2016-2017 Service Plan includes the addition of three Firefighters, three Police Officers, one
Property Evidence Technician, and one Arts Council Coordinator. Five positions are frozen in the FY
2016-2017 budget in the amount of $571,154.
Operations and Maintenance
Operating and Maintenance costs increased approximately 2.97% due to increases in public grounds
maintenance, increased utilities for new City infrastructure, sanitation, new contracts, festivals and
technology upgrades. Salaries and benefits increased 10.08% or $3,308,121 due to a merit increase of
approximately 3%, market adjustments, public safety overtime and compliance requirements of the
Affordable Health Care Act. Operations and Maintenance cost increases include $79,250 in traffic due to
increased street light costs, $51,312 in operating costs for the new Arts Council, $114,736 in Fire
overtime and $372,496 in support of the Fieldhouse USA Project. Special event cost increases are
$15,990 for shuttle rentals. Street maintenance cost increases are $29,693.
Transfers
Transfers are estimated to be $420,158 for the City’s insurance program, $372,496 for the Fieldhouse
USA project and supplemental funding for the Law Enforcement Center of $413,196.
Equipment
The City will finance $1,250,377 in equipment including public safety vehicles, technology and
equipment, technology upgrades in all departments and facility improvements.
Debt
The General Obligation Debt payment is $13,349,613 or total General Obligation Debt of $114,790,000.
This includes debt for the Law Enforcement Center Fund. The overall debt ratio has remained relatively
consistent. The City has made a conscious effort to reduce the percentage of General Fund revenue
dedicated to debt service. Management and City Council are working to reduce the costs of infrastructure
improvements through the use of impact fees and developer contributions. Impact fees have declined over
the past two fiscal years because of residential and commercial development.

22
ENTERPRISE FUNDS
Water & Sewer Fund
Revenues
The overall Utility Fund budget for FY 2016-2017, including debt, is $29,817,745. Water sales and
sewer treatment sales account for 95.9% of all revenue. Water and sewer rates were raised this year due to
increases in water purchase and sewer treatment costs.
Staffing
The 2016-2017 Service Plan includes the addition of one new tradesman position.
Operations and Maintenance
Operations and Maintenance costs increased approximately 6.42% due to increases in water treatment and
sewer treatment costs from the Trinity River Authority and the Tarrant Regional Water District.
Equipment
Approximately $293,379 for new equipment is budgeted in FY 2016-2017.
Transfers
The Utility Fund transfer to the General Fund is approximately $1,406,513.
Debt
The Utility Fund debt payment in FY 2016-2017 is $6,059,234.
Law Enforcement Center Fund
Revenues
The Law Enforcement Center budget for FY 2016-2017 is $10,962,212 or an increase of 8.1% over FY
2015-2016. The increase is from the estimated additional revenue from housing contracts with the Cities
of Fort Worth, Kennedale and Burleson and a new federal housing rate of $63.30 per inmate.
Staffing
No new positions have been added in FY 2016-2017.
Operations and Maintenance
Operations and maintenance costs increased 2.31% due to increased supply and maintenance costs.
Transfers
Transfers from the General Fund are $413,196 in FY 2016-2017.

23
Equipment
Approximately $39,284 for new mobile data terminals is budgeted in FY 2016-2017.
Debt
The remaining debt on the Law Enforcement Center ($620,000) is budgeted in the General Obligation
Debt Service Fund.
Environmental Services Fund
Revenues
The overall Environmental Services Operating Fund budget for FY 2016-2017 is $5,689,540 which
includes $3,220,000 in revenue bonds that will be issued for drainage improvements. City Council
approved a rate increased in FY 2015-2016 to provide additional funding for capital improvements.
Staffing
Two new positions are budgeted in FY 2016-2017 to provide storm water inspections and public
education requirements.
Operations and Maintenance
Operations and Maintenance costs increased 2.49% from increased cleaning of box culverts and drainage
ditches.
Transfers
No transfers are budgeted in FY 2016-2017.
Equipment
No new equipment is budgeted in FY 2016-2017.
Debt
The debt service payment in the Environmental Services Fund is $528,170.

24
SPECIAL REVENUE FUNDS
Hotel/Motel Tax Fund
The Hotel/Motel Tax Fund budget is from tax revenue assessed on hotel rooms within the City of
Mansfield. Seven hotels are located within the City limits with approximately 504 beds. The budget for
FY 2016-2017 is $713,300.
Several factors have contributed to revenue in the hotel occupancy tax fund, including the increased
emphasis on tourism, new improvements to recreational venues such as Big League Dreams Sports Park
and Hawaiian Falls, increased special events including Rockin’ 4th of July, downtown events including
music and arts festivals, and regional sports tournaments including the Rotary Basketball Tournament and
Future Men’s Professional Tennis Tournament. The Fieldhouse USA sports/events venue and the Dallas
Stars recreational ice rink will also contribute to increases in overnight stays in local hotels.
Mansfield Park Facilities Development Corporation Fund (MPFDC)
Revenues
The revenues for the MPFDC Fund are $4,579,962 in FY 2016-2017. Revenues are derived from a ½ cent
sales tax approved by the voters in 1992. Since inception, these revenues have steadily increased. Sales
tax for operations is estimated to be $3,263,808. User fee revenue is estimated to be $1,316,154 including
recreation fees and contract payments from the Hawaiian Falls Water Park, Big League Dreams and the
Mansfield National Golf Course.
Staffing
Three part-time positions have been added in FY 2016-2017 due to the increasing service demands in new
and existing parks and trails.
Operations and Maintenance
The operating budget, exclusive of estimated funds available for projects, decreased $118,275 due to
reductions in estimated contract services and supplies in existing parks.
Transfers
Approximately $14,000 is budgeted for the MPFDC portion of insurance coverage.
Equipment
No new equipment is budgeted in FY 2016-2017.
Debt
The debt service payment in the Mansfield Park Facilities Development Corporation is $1,941,171.

25
Mansfield Economic Development Corporation Fund (MEDC)
Revenues
The sales tax revenue MEDC Fund is $5,204,979 in FY 2016-2017. Revenues are from a ½ cent sales tax
approved by the voters in 1992. Since inception, these revenues have steadily increased. Sales tax and
reserves are used to finance projects.
Staffing
No new positions are budgeted in FY 2016-2017.
Operations and Maintenance
The operating budget decreased slightly due to reductions in supply and contract service costs.
Debt
The debt service payment in the Mansfield Economic Development Fund is $1,202,784.
Transfers
$12,096 is budgeted for the MEDC portion of insurance coverage.
Equipment
No new equipment or facility improvements are budgeted in FY 2016-2017.
0%
10%
20%
30%
40%
50%
2009 2010 2011 2012 2013 2014 2015 2016 2017
Total Debt Service Operating Percentage

26
CAPITAL PROJECT FUNDS
Historically, the Capital Improvement Program has preceded development in all areas of the City. The
Capital Improvement Program is developed with the following guidelines whenever possible:
The Capital Improvement Program is developed to match costs against expenses occurring in
corresponding periods of time. In other words, the development and timing of infrastructure
improvements is crucial to maintaining current and future developments while maintaining or lowering
debt ratios. Since 1995, development fees have funded approximately $99,012,735 in improvements.
Development fees offset the amount of borrowings in the Street and Utility funds.
The impact of infrastructure improvements on operating and maintenance costs is evaluated and measured
annually during the budget development process and during revisions to the Long Term Financial Plan.
Operating and Maintenance cost impacts in FY 2016-2017 are reflected in increased utility costs, staffing
increases and to additional service requirements related to expansion of existing facilities, new facilities
and transmission lines.
Building Construction Fund
Facility improvements in FY 2016-2017 include $15,100,000 for construction of the Dallas Stars Center
recreational ice rink.
Street Construction Fund
Street and roadway improvements in FY 2016-2017 are budgeted at $23,395,732. Street impact fees will
be utilized wherever possible to supplement funding for these projects. In FY 2016-2017, the City
anticipates issuing $18,350,000 in bonds for street improvements as identified by Staff and approved by
City Council.
Utility Construction Fund
Utility improvements in FY 2016-2017 are budgeted at $8,026,574. Revenue bonds and impact fees in
prior years will fund these projects. Water and sewer impact fees will be utilized wherever possible to
supplement funding for these projects.
Parks Construction Fund
Park improvements in FY 2016-2017 are budgeted at $20,545,556, of which $10,690,556 is for
Fieldhouse USA.
Equipment Replacement Fund
Vehicles, equipment and technology improvements in FY 2016-2017 are budgeted at $1,250,377.

27
FISCAL YEAR 2016-2017 SERVICE PROGRAM IN SUMMARY
Continue to sustain positive performance, maintain service levels and plan for future
development.
The City of Mansfield has taken positive steps to fulfill broad goals identified by City Council and City
Staff in FY 2016-2017. While non-financial goals and strategies are essential and form the framework of
the Service Plan in FY 2016-2017, The City of Mansfield will continue to maintain a positive financial
framework in order to provide quality of life to all citizens. The City will:
Maintain the City’s bond ratings to effectively fund infrastructure improvements and increase the
Fund Balance.
Continue quality residential and commercial development.
Maintain a quality workforce without staff reductions and improve service programs in Public
Safety, Parks, Code Enforcement and Public Grounds.
Provide a quality living environment for all citizens.
The Financial Goals and Strategies to achieve these goals are very similar to those of the past. The City of
Mansfield achieved these goals in prior years and anticipates achieving these goals again in FY 2016-
2017.
The City will maintain a quality workforce by offering a competitive compensation package.
The City will maintain the General Fund Balance reserves.
The City will develop economic development strategies.
The City will provide a safe community.
The City will provide new and improved roads and infrastructure to reduce traffic congestion.
The City will continue to provide a “Superior” water system and “Best” parks system.
The City will expand service programs in Public Safety, Parks, Code Enforcement and Public
Grounds.
LONG TERM GOALS FOR FISCAL YEAR 2016-2017 AND BEYOND
The City of Mansfield has developed goals and strategies in FY 2016-2017 with awareness that these
goals and strategies are building blocks for future long term goals. The long term goals in future years
will include:
Continue to maintain positive growth and enhance the local economic activity.
Maintain the City’s debt ratios and fund infrastructure improvements in a timely manner.
Maintain and expand the Fund Balance.
Maintain and improve the City of Mansfield’s bond ratings.
Maintain a quality workforce.
Maintain a level tax rate.

28
Management’s Goals and Objectives
Maintain a Constant Tax Rate.
Maintain a Quality Workforce.
Maintain and Improve the City's Bond Ratings.
Maintain the City's Fund Balance.
Maintain the City's Debt Ratios and Fund Infrastucture Improvements.
Maintain Positive Growth and Enhance Local Economic Activity.

29
FULL TIME EQUIVALENT POSITIONS
Do You Know?
The City of Mansfield Staff Consists of 544 Full Time Equivalent Positions
507 505 507 506 506 511
524 529
533
544
480
490
500
510
520
530
540
550
2008 2009 2010 2011 2012 2013 2014 2015 2016 2017
Police 37%
Fire 27%
Utility 9%
Environmental 18%
Community Services
9%
FY16/17 New Positions

30
2014-2015 2015-2016 2016-2017 2016-2017
Full Time Equivalent Positions Budget Budget Budget Change
General Fund
General Government
Administration 4 4 3 -1
Legal 2 1 3 2
Human Resources 4 4 4
Total General Government 10 9 10 1
Business Services
Finance 3 3 3
Accounting 3 3 3
Budget & Purchasing 1 1 1
Information Technology 4 4 4
City Secretary 3 3 3
Total Business Services 14 14 14 0
Police
Public Safety Administration 4 4 0 -4
Police Administration 9 9 9
Police Communications 24 24 24
Police Patrol 51 51 52 1
Traffic 3 3 3
CVE 2 2 2
K-9 2 2 2
Criminal Investigations 18 19 20 1
Task Force (Grant Funded) 1 3 3
Municipal Court 7 7 7
Community Resource 2 1 5 4
Animal Control 7 7 7
Total Police 130 132 134 2
Fire
Fire Administration 4 4 4
Fire Prevention 5 5 5
Emergency Management 1 1
Fire Operations 74 73 76 3
Total Fire 83 83 86 3
Planning & Development
Planning 8 8 8
Administration 2 2
Code Compliance 5 5
Building Maintenance 5 5 3 -2
Building Inspections 14 15 9 -6
Total Planning & Development 27 28 27 -1
Community Services
Senior Citizens 3.5 3.5 4 0.5
Park Operations 16.5 16.5 16.5
Library 11 11 11
Historical Services 1 1 1
Communications & Marketing 2 2 2
Arts 1 1
Cultural Arts 1 1 1
Total Community Services 35 35 36.5 1.5
Public Works
Engineering 13 13.5 13.5
Traffic 3 3 3
Street Maintenance 13 14 14
Total Public Works 29 30.5 30.5 0
Total General Fund 328 331.5 338 6.5

31
2014-2015 2015-2016 2016-2017 2016-2017
Full Time Equivalent Positions Budget Budget Budget Change
Enterprise Funds
Utiltiy Fund
Administration 4 5 6 1
Billing & Collections 7 7 7
Meter Reading & Repair 8 7 7
General Service 9 9 9
Water Treatment 12.5 9.5 11.5 2
Water Quality 1 4 4
Water Demand Management 1 2 1 -1
Laboratory Services 1 2 0 -2
Sewer 8 6 7 1
Total Utility Fund 51.5 51.5 52.5 1
Law Enforcement Center
Administration 2 2 2
Operations 77 77 77
City Marshal 17 17 17
Support 10 10 10
Kitchen 0 0 0
Medical 5 5 5
Total Law Enforcement Center 111 111 111 0
Drainage Fund
Operations 2 2 4 2
Total Drainage Fund 2 2 4 2
Total Enterprise Funds 164.5 164.5 167.5 3
Special Revenue Funds
Mansfield Parks Fund 27 28 29.5 1.5
Mansfield Economic Development 5 5 5
Tree Mitigation Fund 3 2 2
Hotel Motel Fund 1 2 2
Total Special Revenue Funds 36 37 38.5 1.5
Total All Funds 528.5 533.0 544.0 11.0

32
General 62%
Enterprise 31%
Special Revenue
7%
Staffing By Fund
General
Government 3%
Business Services
4%
Public Safety 65%
Development 8%
Public Works 9%
Community
Services 11%
General Fund Staffing

33
BUDGET AND FINANCIAL POLICIES

34
Budget Phases
Needs Assessment Phase
January-May
Policy and Strategy Phase
March-July
Budget Development Phase
May-August
Review and Modification Phase
August-September
Adoption Phase
September

35
BUDGET CALENDAR
FISCAL YEAR 2016-2017
January 19, 2016 Tuesday Meeting with all Division and Department Managers to clarify challenges
remaining in 2016 and challenges related to the FY 16/17 budget.
February 8, 2016, Monday Present budget packets and instructions to Division/Department Heads and
review the information with the department staff.
March 11, 2016, Friday Missions, Goals and Objectives and Performance Measures submitted to the
Budget Department and City Manager’s Office.
March 21, 2016, Monday Executive Staff meeting to identify upcoming budget schedule, timeline, and
major capital project development.
March 25, 2016, Friday Division/Department Heads submit to Business Administrative Services and
Human Resources current and projected FY 16/17 personnel level of funding,
new position requests and request for re-classification of any positions.
April 29, 2016, Friday Chief appraiser prepares and certifies estimate of taxable value for the county,
municipality, and school district participating in the appraisal district; estimate
of preliminary taxable value.
May 13, 2016, Friday Division/Department Heads submit their departmental budgets to
Budget/Accounting for FY 16/17 expenditures and revised figures for FY 15/16.
May 20, 2016, Friday Business Administrative Services Director calculates preliminary tax and other
revenues and presents to the City Manager for the FY 16/17 proposed budget.
The City anticipates receiving the preliminary tax roll from T.A.D. on this date.
June 1, 2016, Wednesday First Review - City Manager or his designee reviews budget requests with
Department Heads.
June 13, 2016, Monday Special Council Meeting to review capital projects and funding sources with
City Council.
June 27, 2016, Monday Budget/Accounting prepares departmental line item budget reports and submits
to City Manager or his designee incorporating FY 16/17 budget projections and
revised figures for FY 15/16.
July 11, 2016 Monday Preliminary Budget Presentation with City Council.
July 21, 2016, Thursday Post agenda for July 25, 2016 Open Meeting Notice.
July 25, 2016, Monday Last Day for Chief Appraiser to certify appraisal roll.
July 25, 2016, Monday Preliminary Budget Presentation to City Council.
August 4, 2016, Thursday Post agenda for Monday, August 8, 2016 - Open Meeting Notice.
August 8, 2016, Monday Date taxing units must publicize effective tax and roll back rates and other
applicable items (or as soon as practical thereafter).
August 8, 2016, Monday Meeting to announce intention to adopt a tax rate on August 22, 2016.
Presentation of the proposed FY 16/17 budget.
36
August 12, 2016, Friday “Notice of 2017 Tax Year Proposed Property Tax Rate” (1st quarter page notice)
published at least seven days before public hearing scheduled on August 22,
2016 on the FY 16/17 Budget and use of Hotel/Motel Tax Revenue.
August 22, 2016, Monday 1st Public Hearing; Public Hearing on FY 16/17 Budget and use of Hotel/Motel
Tax Revenue. Publish first “Notice of Vote on Tax Rate” and Second Notice on
Public Hearing.
August 29, 2016, Monday 2nd
Public Hearing on FY 16/17 Budget and Use of Hotel/Motel Tax Revenue.
City Council is scheduled to review formal applications for use of Hotel/Motel
Tax Revenue.
September 6, 2016, Wednesday Council Meeting – 1st reading of budget and tax rate adoption ordinances.
September 7, 2016, Thursday Special Council Meeting – 2nd
reading of budget and tax rate adoption
ordinances.
September 8, 2016, Friday Special Council Meeting – 3rd
and final reading of budget and tax rate adoption
ordinances.
The City’s charter requires that the budget be adopted by September 15 of the given year.
37
THE CITY OF MANSFIELD BUDGET PROCESS
THE CITY’S ROLES AND RESPONSIBILITIES
Every staff member plays a role in budgeting, whether in its formation, implementation, administration or
evaluation. Ultimately, of course, each department manager through the City Manager is accountable to
the City Council and citizens for the performance of departmental staff in meeting specific objectives.
Actual budget responsibility can be identified specifically as follows:
The Department Manager is responsible for preparing an estimate of remaining cost requirements for
the current fiscal year, projecting the base budget requirements for the next fiscal year and developing
other requests that change or revise the program so that it will be more effective, efficient, productive and
economical.
The Departmental Administrative Support Staff serves as a vital communication link between the
department and the budget staff. Support staff is responsible for coordinating information, checking to see
if forms are completed properly, making sure necessary supporting documentation is submitted,
monitoring the internal review process to meet timelines, gathering performance measurement
information, entering departmental budgets into the City’s financial system and serving as the
departmental troubleshooter for problems throughout the budget process.
The Strategic Plan Committee is comprised of staff from each major division of the City and is
responsible for the planning, development and presentation of the City’s modified capital and operational
strategic plan. The Strategic Plan Committee presents recommendations to the Deputy City Manager,
Budget Director and the City Manager for review.
The Division Directors, Deputy City Managers and Department Directors are responsible for
reviewing historical performance, anticipating future problems and opportunities, considering alternative
solutions and modifying and assembling their departmental data into a cohesive budget information
package. Division Directors critically evaluate all requests, prioritize, and submit a budget plan including
only those requests that support City Council priorities, City Manager work plan, administrative direction
and the departmental mission and objectives. Performance measures are evaluated to determine the
effectiveness of individual divisions and departments.
The Deputy City Manager, Assistant Finance Director and Budget Director within the Business
Services Division are responsible for preparing short and long range revenue and expenditure forecasts,
gathering and evaluating performance measures, calculating departmental projected budget targets,
assisting departments, reviewing departmental budgets with department directors or staff, collating,
analyzing and summarizing departmental requests and preparing budget review materials for the
Executive Staff and City Council.
The City Manager’s and Deputy City Managers’ key role is to translate City Council goals and
objectives into recommended funding decisions.
The City Manager is responsible for reviewing the total financial and operational program, formulating a
City-wide proposed budget and proposing a budget to City Council.

38
The City Council is responsible for the review of the City Manager’s proposed budget, approval of the
tax rate and approval of the final budget. The City charter requires adoption of the final budget no later
than September 15 of each fiscal year.
BUDGET PROCESS
The budget process is the key to the development of the City of Mansfield’s overall strategic plan and
affords individual departments the opportunity to reassess goals and objectives, evaluate programs using
performance measurement data and develop strategies to accomplish them. Even though the budget may
be reviewed by the City Council in July and August and adopted in September, its preparation begins at
least eight months prior, with projection of City fund balances, revenue and expenditure forecasts,
citizens, boards, commissions and departmental needs assessments. It is with this groundwork that the
departmental requests are made and subsequently reviewed.
The following summary provides a brief description of the various phases of the budget process and
timeframes in which the budget preparation, review and adoption takes place.
BUDGET PHASES
Priority Needs Assessment Phase - This is the foundation of assessing what the current and projected
programmatic and operational needs of each department are as seen by the Citizens of Mansfield, City
Council, Boards, Commissions and individual division/department directors. City Staff and City Council
reviews occur during this phase to identify and prioritize the needs and desires of each group. Community
feedback is an important component of the budget process in assessing citizen satisfaction with services
and establishing priorities for the upcoming budget year. Updates to the Strategic Plan normally occur
during this period and are presented to Council during the budget process. City Council has identified the
need to maintain and upgrade maintenance of the City’s right of ways and medians, increase architectural
standards for new development, create more neighborhood and linear parks, encourage more retail,
commercial and industrial development within the City, implement and continue the Capital Improvement
Program, and provide additional police and fire staff.
Financial Trend Analysis Phase - an integral part of Mansfield’s decision-making process that includes
both short and long-range economic and financial forecasts. In fiscal year 2000, the City developed a 10-
Year Strategic Plan that is updated annually and modified to integrate the City’s operational and capital
requirements with both a short term and long-term goals. City infrastructure needs are identified during
this process and play an important role in the forecasting related to short and long term operating needs.
During this phase, strategic forecasting assumptions are made including changes in fund balance
projections, revenue, expenditure, compensation adjustments and costs adjustments. Preliminary
assumptions result in the City’s forecasted fiscal capacity and provide a balanced financial framework
upon which operating (departmental) and capital (infrastructure projects) budget targets can be developed.
Policy/Strategy Development Phase - City Council’s goals and directives set the tone for the
development of the budget. The Council identifies key policy issues that will provide the direction of the
budget. The Strategic Planning Committee updates the City’s 10-Year Strategic Plan, identifying critical
objectives and the strategies to be employed in meeting those objectives. It is within this framework that
the department’s budget plans are formulated. The City Council identifies needs to establish priorities,
identify existing service levels and review financial and economic trends and forecasts. City Council also
discusses policy direction with the Executive Staff.
Budget Development Phase - Based upon City Council’s priorities and strategic policy direction,
departments develop program objectives and work plans for the budget period. The Budget Department
39
submits to each department their prior year and year-to-date expenditures for review. Base budgets are
then developed which represent existing service levels and adjustments for price changes, inflation and/or
compensation adjustments. Departmental staff is asked to evaluate programs and positions. Departmental
staff reviews service level requirements and makes decisions regarding new programs, increased or
decreased staffing and changing resource allocation. Departments use the Strategic Plan to identify
additional staffing requirements and obtain appropriate salary levels for each proposed new staff member.
The Deputy City Manager, Assistant Finance Director and Budget Director review all budget data
submissions from individual departments to ensure each department has submitted accurate and concise
data.
Budget Review and Modification Phase - The Budget Director sets a budget calendar and schedules
meetings with each department/division director. Individual meetings occur with most departments at
least twice prior to budget workshops with City Council. Budget requests are reviewed and
recommendations for each department are reviewed during this phase. New staffing, operational
expenditures, revenue projections and capital requests are reviewed to determine the overall resources
available to fund departmental requests. Performance measures are reviewed to determine the overall
effectiveness of each departmental program. City Council and City Manager priorities and goals are
reviewed with individual departments to ensure that individual budgets reflect the priorities set by City
Council and the City Manager. Recommendations are then forwarded to the City Manager for review.
Adoption Phase - A proposed operational and financial plan is presented to City Council through a
schedule of budget workshops prior to public hearings. The City Staff communicates the proposed budget
to the citizens during these workshops in the form of power point presentations, handouts, cable access
recordings or a combination of these formats. Public Hearings are held and City Council adopts the tax
levy and budget consistent with the City Charter and State law.
Implementation Phase - Departments are accountable for budgetary controls throughout the fiscal year.
Expenditure patterns are examined, compared to budget plans, and corrective action is taken as necessary
during the fiscal year. The Finance team reviews the budgeted revenues, expenditures, and current
demographic, economic and financial trends monthly that may impact the City and plan strategy to ensure
the City’s financial integrity. City Council is also provided a monthly financial report disclosing the
City’s actual revenue, expenditure and fund balance performance as compared to the budget plan.
REVIEW AND APPROVAL OF THE BUDGET
The City Council considers the proposed budget and holds budget workshops and public hearings in
August and September. The budget workshops provide an opportunity for City management, directors
and the general public to offer information and recommendations to the City Council.
Legally, the 2016-2017 budget must be adopted by September 15th. City Charter requires three public
readings of the budget ordinance before it is adopted by City Council. The adoption of the budget
ordinance authorizes expenditures from all funds within the City including the General, Debt Service,
Enterprise, Special Revenue, and Capital funds. The City’s fiscal year begins October 1st and ends
September 30th of each year.
IMPLEMENTATION OF THE BUDGET
Upon adoption, the staff prepares the operating budget, incorporating all changes authorized by City
Council. Each division is advised of the approved budget for their departments.

40
AMENDMENT TO THE BUDGET
The City of Mansfield operating budget is adopted at the department level. Any transfers between
departments or projects over $5,000 may require City Council approval. Any change orders to budgeted
capital improvement projects must be approved by City Council.
USE OF CONTINGENCY RESERVE
When additional funding is required to offset unexpected revenue shortfalls, unexpected expenditure
increases or events that threaten the public health or safety, contingency operating funds may be
authorized by the City Manager and/or City Council so that budgeted service levels can be maintained.
BUDGETARY AND ACCOUNTING BASIS
The operating budget is developed by fund using Generally Accepted Accounting Principles (GAAP)
except that depreciation and amortization are not budgeted. All funds are budgeted on a modified accrual
basis.
OPERATING AND CAPITAL BUDGET RELATIONSHIP/ORGANIZATION
The City of Mansfield Budget for Fiscal Year 2016-2017 is comprised of:
The operating budget, which includes all departmental budgets - General Fund, Debt Service Funds,
Enterprise Funds, Special Revenue Funds and Capital Projects Funds. The operating budget includes
portions of the City’s Strategic Plan that includes both operational and capital requirements.
The operating budget includes a balanced financial plan for all funds for fiscal year 2016-2017 and
forecasts the results of operations by fund for the period. The effect of the Capital Improvement Program
upon operations is reflected in the Capital Projects Fund. The operating budget includes fund summaries
and presentations by City operating departments without regard to fund. Each division is divided into
operating departments, and a budget summary by department is included for each division. Performance
measures are incorporated for each department within each division.
The Capital Project Fund is presented on a budget basis. The Capital Fund Projects include the Street
Construction Fund, Utility Construction Fund, Building Construction Fund, Parks Construction Fund,
Environmental Services Construction Fund and Equipment Replacement Fund. State Law requires an
adequate budget to pay for the entire construction contract and appropriated in the period in which the
contract is entered; therefore, expenditures are presented on a budget basis as opposed to cash flow basis.
Funding sources for the Capital Improvement Program are presented on a budget basis. The revenue
sources are presented in the period that the funding will be realized in order to provide continuity between
the operating budget and the capital budget. As a result of presenting on a budgetary basis, funding
sources may not equal budgeted expenditures in each period, creating a fund balance as cash accumulates
for larger expenditures in later years.

41
City of Mansfield Fund Structure by Budgetary Basis
Modified Accrual
Basis of Accounting
General Fund Special Revenue
Funds
Mansfield Parks Facilities
Mansfield Economic
Development
Hotel/Motel Tax
Tree Mitigation
Debt Service
Funds
General Fund
Mansfield Parks Facilities
Mansfield Economic
Development
Capital Funds
Building
Parks
Streets
Utility
Economic Development
Equipment
Environmental Services Capital
Projects
Full Accrual
Basis of Accounting
Proprietary Funds
Enterprise Funds
Water & Sewer Fund
Law Enforcement
Center
Environmental Services
Fund
Debt Service Funds
Water & Sewer Fund
Environmental Services Fund

42
BASIS OF BUDGETING AND ACCOUNTING IN SUMMARY
The City of Mansfield’s “Basis of Budgeting” for all funds is based upon a modified accrual basis of
accounting. The modified accrual basis is a combination of cash and accrual accounting in that
expenditures are immediately incurred as a liability while revenues are not recorded until actually
received or are measurable and available for expenditure.
The operating budget is developed by fund utilizing Generally Accepted Accounting Principles (GAAP)
except that depreciation and amortization are not budgeted. A complete description is provided below.
BALANCED BUDGET POLICY
The City of Mansfield has adopted a balanced budget for all funds. Current appropriations in all funds are
limited to the sum available, unencumbered cash balances and revenues estimated to be received in the
current budget period. Expenditure and subsidy appropriations for mandated and priority programs are to
be made against current revenue sources and not dependent upon uncertain reserves or fluctuating prior
period fund balances. To the extent possible, current operations will be funded by current revenues. The
use of unencumbered prior period balances in all funds shall be scrutinized and carefully limited and
subject to review by the City Manager and City Council.
Fund Organization
The accounts of the City are organized on the basis of funds, each of which is considered to be a separate
accounting entity. The operations of each fund are accounted for with a separate set of self-balancing
accounts. Governmental resources are allocated to and accounted for in individual funds based upon the
purpose for which they are to be spent and the means by which spending activities are controlled.
GOVERNMENTAL FUND TYPES:
General Fund
The General Fund is the operating fund of the City. All general tax revenues and other receipts that are
not restricted by law or contractual agreement to some other fund are accounted for in this fund. General
operating expenditures, the fixed charges, and the capital improvement costs that are not paid through
other funds are paid from the General Fund.
Special Revenues Funds
The Special Revenue Funds are used to account for the proceeds of specific revenue resources (other than
major capital projects) that are legally restricted to expenditures for specified purposes. These funds
include Hotel/Motel Tax, Mansfield Park Facilities Development Corporation (MPFDC), The Mansfield
Economic Development Corporation (MEDC) and the Tree Mitigation Fund.
Debt Service Funds
The Debt Service Funds include the General Debt Service Fund, Water & Sewer, Environmental Services
Fund, MPFDC and MEDC. These funds are used to account for the accumulation of resources for and the
payment of principal and interest on general long-term debt and revenue bond debt. The primary sources
of revenues are ad valorem taxes which are levied by the City for the General Debt Service Fund, sales

43
tax for the MPFDC and MEDC Debt Service Funds, and user fees for the Water & Sewer Funds and
Environmental Service Funds.
Capital Projects Funds
The Capital Projects Funds account for the financial resources to be used for the acquisition of capital
facilities other than those recorded in Proprietary Funds. The Capital Projects Funds are used to account
for the acquisitions of capital facilities financed from general obligation bond proceeds or certificate of
obligation proceeds, or transfers from other funds. The City's Capital Projects Funds consist of the
following funds: Street Improvement, Utility Improvement, Building Construction, Park Construction,
Equipment Replacement, and Economic Development.
TIRZ (Tax Increment Reinvestment Zone)
The Tax Increment Reinvestment Zone is a specific fund designated to capture the tax increment in a
defined geographic zone. The tax increment is to pay for the public improvements specific to the zone or
area defined by ordinance. Any increase in value or property value increment may be used to pay for the
debt for these public improvements or be used to reimburse the developer for the public improvements
paid for by the developer on behalf of the City.
PROPRIETARY FUND TYPES:
Enterprise Funds
The Enterprise Funds are used to account for operations that are financed and operated in a manner
similar to private business enterprises where the costs (expenses, including depreciation) of providing
goods or services to the general public on a continuing basis are financed through user charges. The
City's Enterprise Funds are the Water & Sewer Fund, Environmental Services Fund and the Law
Enforcement Center Fund. These funds are accounted for on a full accrual basis of accounting.
BUDGET CONTROL
As set forth in the City Charter, the City Council adopts an annual budget prepared in accordance with
Generally Accepted Accounting Principles. The City Manager may transfer part or all of any
unencumbered appropriation balance among programs within a department. The City Council may
require their approval of these transfers above a limit they wish to establish.
All unused appropriations, except appropriations for capital expenditures, lapse at the close of the fiscal
year to the extent they have not been expended or encumbered. An appropriation for a capital
expenditure shall continue in force until the purpose for which it was made has been accomplished or
abandoned. The purpose of any such appropriation shall be deemed abandoned if three years pass without
any disbursement from or encumbrance of the appropriation.
BASIS OF ACCOUNTING
The accounting and financial reporting treatment applied to a fund is determined by its measurement
focus. All governmental funds are accounted for using a current financial resources measurement focus.
All proprietary funds are accounted for on a flow of economic resources measurement focus utilizing a
Modified Accrual basis of accounting.

44
Governmental Fund Types - All governmental funds are accounted for using the modified accrual basis
of accounting. Under the modified accrual basis, revenues and other financial resource increments are
recognized when they become susceptible to accrual, that is, when they become both "measurable" and
"available" to finance expenditures of the current period. "Measurable" means that amounts can be
reasonably determined within the current period. "Available" means that amounts are collectible within
the current period or soon enough thereafter to be used to pay liabilities of the current period.
Proprietary Fund Types - Revenues and expenses are recognized using the accrual basis of accounting.
Revenues are recognized in the accounting period in which they are earned, and expenses are recognized
in the period incurred following the economic resources measurement focus.
FINANCIAL REPORTING AND POLICIES
Financial and Operational Policies
The City of Mansfield, Texas has developed financial and operational policies which guided the
development of the budget for fiscal year 2016-2017. The budget has been developed using an analysis
of historical data, current data and forecasted data. The staff identified areas of growth and future needs
in each department. The staff put in place several policies and procedures which determine the overall
budget including expected population growth, expansion of services, debt service requirements, capital
improvements, operational maintenance requirements, and staffing level requirements. Each department
is evaluated as to current needs and the projected needs in the next budget year and the following nine
years. Availability of funds is considered to determine what areas may need additional funding. A
complete prior year analysis and future analysis is utilized to determine what areas may be increased,
decreased or remain constant for the upcoming year. Individual departments are required to submit
departmental budgets for the upcoming fiscal year. The Business Services Department reviews individual
budgets and creates a priority list for each department based on department and administration
considerations. The budget for each department is reviewed by the City Manager's office to ensure each
department is properly funded. The budget’s operational and financial policies are reviewed throughout
the year.
Financial Reporting Policy
Following the conclusion of the fiscal year, the Business Services Department shall prepare a
Comprehensive Annual Financial Report (CAFR) in accordance with generally accepted accounting and
financial reporting principles established by the Governmental Accounting Standards Board (GASB) and
the SEC. The document shall also satisfy all criteria of the Government Finance Officers Association’s
Certificate of Achievement for Excellence in Financial Reporting. The City has implemented GASB 34,
43, 45 & 54. Monthly, semiannual and quarterly reports on the City’s finances are reported to City
Council.
The CAFR shall show the status of the City’s finances on the basis of General Accepted Accounting
Principles (GAAP). The CAFR shall show fund revenues and expenditures on both a GAAP basis and
budget basis for comparison purposes. In all but two cases, this reporting conforms to the way the City
prepares its budget: compensated absences (accrued but unused sick leave) are not reflected in the budget
but are accounted for in the CAFR’s long-term debt position; and depreciation is not shown in the
budget’s proprietary funds, although the full purchase price of equipment and capital improvements is
reflected as uses of working capital.
Included as part of the Comprehensive Annual Financial Report are the results of the annual audit
prepared by independent Certified Public Accountants designated by City Council. The Business

45
Services Department shall issue a report monthly to the Council reflecting the City’s financial condition
for the month. The monthly report shall present the financial condition of the City in a user friendly and
understandable format consistent with the budget.
Revenue Policies
To protect the City’s financial integrity, the City will maintain a diversified and stable revenue system to
shelter it from fluctuations in any one revenue source.
For every annual budget, the City shall levy two property tax rates: operation/maintenance and debt
service. The debt service levy shall be sufficient for meeting all current principal and interest payments.
The debt service levy and related debt service expenditures shall be accounted for in the Debt Service
Fund. The operation and maintenance levy shall be accounted for in the General Fund.
The City will maintain a policy of levying the lowest tax rate on the broadest tax base. Minimal
exemptions will be provided to homeowners, senior citizens, and disabled veterans.
The City will establish user charges and fees at a level that attempts to recover the full cost of providing
the service. User fees, particularly utility rates, should identify the relative costs of service for different
classes of customers. When possible, utility rates should be designed to reduce peak (hour and day)
demands on the utility systems.
The City will make every reasonable attempt to ensure accurate measurements of variables impacting
taxes and fees (e.g. verification of business sales tax payments, verification of appraisal district property
values, and accuracy of water meters.)
The City will attempt to maximize the application of its financial resources by obtaining supplementary
funding through agreements with other public and private agencies for the provision of public services or
the construction of capital improvements.
The City will consider other market rates and charges levied by other public and private organizations for
similar services in establishing tax rates, fees and charges.
When developing the annual budget, the Business Services Department shall project revenues from every
source based on actual collections from the preceding year and estimated collections of the current fiscal
year, while taking into account known circumstances which will impact revenues for the new fiscal year.
The revenue projections for each fund should be made conservatively.
Operating Expenditure Policies
Operating expenditures shall be accounted, reported, and budgeted for in the following major categories:
operating, recurring expenditures including personnel services, supplies, maintenance, contractual
services, and capital replacement/lease. The annual budget shall appropriate sufficient funds for
operating, recurring expenditures necessary to maintain established quality and scope of City services.
The City will constantly examine the methods for providing public services in order to reduce operating,
recurring expenditures and/or enhance quality and scope of public services with no increase in cost.
Personnel service expenditures will reflect the minimum staffing needed to provide established quality
and scope of City services. To attract and retain employees necessary for providing high-quality service,
the City shall maintain a compensation and benefit package competitive with the public and, when

46
quantifiable, private service industries. Supply expenditures shall be sufficient for ensuring the optimal
productivity of City employees.
Maintenance expenditures shall be sufficient for addressing the deterioration of the City’s capital assets to
ensure the optimal productivity of the capital assets. Maintenance should be conducted to ensure a
relatively stable level of maintenance expenditures for every budget year.
The City will utilize contract labor for the provision of City services whenever private contractors can
perform the established level of service at less expense. The City will regularly evaluate its agreements
with private contractors to ensure the established levels of service are performed at the least expense to
the City.
Existing capital equipment shall be replaced when needed to ensure the optimal productivity of City
employees. Existing capital equipment associated with General Fund operations in excess of $5,000 will
be charged to individual departments who purchase those items.
Expenditures for additional capital equipment shall be made only to enhance employee productivity,
improve quality of service, or expand scope of service. To assist in controlling the growth of operating
expenditures, operating departments within the General Fund will submit their annual budgets to the City
Manager within a ceiling calculated by the Business Services Department from the General Fund’s Long
Term Financial Plan. Projected expenditures that exceed the ceiling must be submitted as separate
expanded level of service requests.
Fund Balance Policy
The annual budget shall be presented to Council with each fund reflecting an ending fund balance that is
no less than 25% of that fund’s annual operating expenditures. To satisfy the particular needs of
individual funds, ending fund balances may be established which exceed the 25% minimum. Fund
balance that exceeds the minimum level established for each fund may be appropriated for non-recurring
capital projects or programs. The City will exercise diligence in avoiding the appropriation of fund
balance for recurring operating expenditures. In the event fund balance is appropriated for recurring
operating expenditures to meet the needs of the community, the budget document shall include an
explanation of the circumstances requiring the appropriation and the methods to be used to arrest the
future use of fund balance for operating expenditures.
Fund Transfer Policy
With the exceptions noted below, there will be no operating transfers between funds. Any costs incurred
by one fund to support the operations of another shall be charged directly to the fund. (For example,
actual hours worked by General Fund employees for Water & Sewer Fund events.)
Fund transfers may occur when surplus fund balances are used to support non-recurring capital expenses
or when needed to satisfy debt service obligations.
Debt Expenditures
The City will issue debt only to fund capital projects that cannot be supported by current, annual
revenues. To minimize interest payments on issued debt, the City will maintain a regular debt retirement
policy by issuing debt with maximum maturities not exceeding twenty (20) years. Retirement of debt
principal will be structured to ensure constant annual debt payment. The City will attempt to maintain
base bond ratings (prior to insurance) of Aa2 (Moody’s Investors service), AA+ (Standard & Poor’s) and

47
AA+ (Fitch, IBCA), on its general obligation debt (see Debt Policy). Annual financial reviews are
conducted by Fitch, Moody’s and Standard & Poor’s. Post issuance compliance policy was implemented
in 2012.
Capital Projects Expenditure Policy
The City will develop a multi-year plan for capital projects, which identifies all projects likely to be
constructed within a ten-year horizon. The multi-year plan will reflect for each project the likely source
of funding and attempt to quantify the project’s impact to future operating expenditures. Capital projects
will be constructed to protect or improve the community’s quality of life, protect or enhance the
community’s economic vitality, and support and service new development. To minimize the issuance of
debt, the City will attempt to support capital projects with appropriations from operating revenues or
excess fund balances, i.e. “pay-as-you-go.”
Utility Capital Expenditures
The City will design utility rates sufficient for meeting the annual coverage requirement that will
accumulate resources to replace or rehabilitate aging infrastructure that no longer can be serviced by
regular maintenance. Attempts should be made to fund the reserve at a level approximate to the annual
average coverage requirement as reported in the City’s annual Comprehensive Annual Financial Report.
Long Term Financial Plan Policy
The City will adopt every annual budgets in context of a long term financial plan for the General Fund
and Water & Sewer Fund. Financial plans for other funds may be developed as needed. The General
Fund and Water & Sewer Fund long term plans will establish assumptions for revenues, expenditures and
changes to fund balance over a ten-year horizon. The assumptions will be evaluated each year as part of
the budget development process.
Economic Development Policy
The City will assess and collect ½ percent on each taxable sales transaction in the City and utilize the
revenue to encourage commercial and industrial development within the City. Commercial and industrial
development provides additional tax revenues, local employment, and shifts a portion of the tax base from
the homeowner to the industrial/commercial entity. The MEDC board has set a goal to split the tax
burden equally between the homeowner and industrial/commercial development.
Infrastructure Development Policy
The development of capital improvements, including street and utility construction, will provide the
necessary infrastructure for residential and commercial development. The City has instituted an
aggressive ten-year capital improvement program to develop the City's infrastructure. This program will
be funded with the growth in tax base as projected. The improvements are being timed to coincide with
annual growth in the City.
Service Development Policy
The City of Mansfield has approved 11 new positions in FY 2016-2017 to meet increased service needs.
Planning and Development Policy

48
The City has and will increase its technical assistance to residential and commercial developers in an
effort to develop systematic growth and development. Residential and commercial zoning has been
developed to fit the City's master plan.
Budget Preparation Policy
The budget development is based on community and individual department needs as identified by the
citizens' survey, City Council and individual division projections. The budget is based on the projected
growth of both revenue and expense factors City-wide over a ten year period. Projected commercial and
industrial development are also factored into the overall budget plan. Council and management have
adopted a modified Strategic Plan to outline the operational and infrastructure demands from the effects
of the economy. This plan will be reviewed and revised regularly.
Purchasing Policy
The City continues to develop a City-wide purchasing plan to simplify, expedite and provide cost savings
to all City departments. The consolidation of purchases, cooperative purchasing and the expanded use of
the bid process provides cost savings now and in the future.
Investment Policy
The investment policy applies to all financial assets of the City of Mansfield. Investments and investment
reporting comply with the Public Funds Investment Act.
Other Policies
Growth pays for growth - one time revenues will be used to pay for one time expenditures.
Operational increases in cost may only be funded by a permanent increase in revenue or a
structurally balanced budget.
Pay as you go funding - including T.M.R.S., OPEBS, capital infrastructure and impact fees.
Amortization is limited to life expectancy.
Utility Coverage Factor is equal to 1.30 annually.
All members of Management and City Council are subject to ethics disclosure (any dealings that
could have a direct or indirect gain.)

49
STRATEGIC PLAN
UPDATE
FOR
FY 2017-2026
Prepared and Presented on
June 6, 2000
By Task Force 2000 Committee
Original Resolution Adopted by Resolution No. 1501
Modified Version Adopted by Resolution No. 2964-13

50
City of Mansfield, Texas
Strategic Plan
2017-2026
Executive Summary
51
THE CITY OF MANSFIELD, TEXAS
Strategic Fiscal Plan
History and Purpose of the Plan
Mansfield, Texas, is located in the southern sector of the fourth largest metropolitan area
in the United States of America. The City of Mansfield encompasses 36.69 square miles.
Current population estimates by City Planners suggest that the City is home to 67,628
people. In 1970, the City claimed 3,658 residents. Since 1970, the City’s population has
grown by 63,970 residents. Mansfield, Texas is the third largest City in the County, and
is third only to Fort Worth, and Arlington, Texas in Tarrant County.
Population growth is expected to continue in the Dallas-Arlington-Fort Worth region.
The Council of Governments, a coalition of local governments in the metropolitan area,
continues to project growth in the population North Texas and specifically in Tarrant
County over the next three decades. Mansfield City Planners also project growth in the
City of Mansfield with an estimated population of 165,000 residents within in the next
thirty to forty years.
In the decade of the 1970s, community leaders recognized the demands of meeting the
needs of the new residents within the City of Mansfield, Texas. Infrastructure was aging
and unable to support the expectations of a new and increasing population. City
resources were limited: including - limited professional staff, limited infrastructure, and
limited funding capacity. The land use was agricultural. Community leaders gathered,
raised taxes, recruited, retained professional staff and began building a community. These
community leaders are still active in the community today.
In addressing the service demands of the community, the City of Mansfield jumped in
front of the expectations of growth in the decade of the 1980’s and began creating and
adopting several planning models to manage and guide in the development of the City’s
infrastructure to support the needs of the growing community and its demand for
services. These planning models included the Master Land Use Plan, the Master
Thoroughfare Plan, the Master Drainage Plan, the Master Water & Sewer Plan, the
Master Parks Plan, and the master fiscal plan and the City’s Strategic Plan. Planning
models are generally based upon the expectations of future populations and the expected
use of infrastructure and services necessary to support the expected populations. These
models are carefully designed and some require the public’s involvement ensure that
these documents are consistent with the interest of the vested stakeholders in the
community. Plans change little year after year because of the deliberative processes and
the assumptions used in planning for future land use and needed infrastructure. Generally,

52
the primary planning model that drives the rest of the planning models is the land use
model because it determines population densities, expected populations and land uses. Of
course, these plans are reviewed and modified by the City based upon changes in the use
of the land or other reasons deemed to be appropriate by the City.
The City’s Strategic Plan is a fiscal planning model that encompasses the other
infrastructure planning models and focuses on the City’s financial capacity, projected
financial capacity and the City’s ability to pay for expected infrastructure improvements
and the City services needed to service the growing population. The Strategic Plan
focuses on the two primary activities of the City of Mansfield, Texas: General
Infrastructure and Services and Water & Sewer Services. These two activities are also
referred to as Corporations of the City which address the basic demands of the citizens
and patrons of the City of Mansfield, Texas.
Fiscal Planning Guide
The Strategic Plan is a business model intended to guide Management in making and
evaluating business decisions affecting the community and managing the City’s
organization. These decisions include the allocation funding for programs, such as public
safety, street maintenance, park and recreational venues, water, sewer services and the
administration of these City services. Year over year, these essential programs, are
managed and developed to meet the needs of the residents of the City.
The City’s first Strategic Plan was adopted and accepted by the City of Mansfield on
November 27, 2000. It has been revised and subsequently adopted on April 22, 2002,
December 8, 2003, September 12, 2005, July 28, 2008, August 31, 2010, October 10,
2011 and October 28, 2013.
Existing and
New
Population
Infrastructure
& Services
Fiscal ability
to provide for
Infrastructure
& Services

53
Guiding Policies and Development of the Strategic Plan
The City of Mansfield, Texas, annually prepares and reviews its comprehensive Strategic
Plan. This plan is guided by and directed by long-term fiscal policies that have been in
place over three decades. The benefits of these long-term fiscal policies are evident from
the results of the fiscal performance of the City and the strength of the City’s credit or it
ability to repay its obligations within the community it serves and its creditors.
Guiding Fiscal Policy - Growth pays for Growth
The current residents of the City are only asked to bear the costs of services; the cost of
infrastructure development and the related services needed to support the development is
to be paid for by the population creating demand for these costs. This policy essentially
manages the cost of development and cost of services with the new recipients of these
services. The policy also encourages the timely development of infrastructure and
discourages the City from developing its infrastructure too quickly because funding
becomes too costly for existing stakeholders. Growth pays for Growth.
Other Policies and Practices
Policies and practices are only as effective as the City’s ability and political willingness
to adhere to its policies and practices. The City Councils of the City of Mansfield, Texas,
have supported and encouraged fiscal accountability and responsibility through the
adoption of fiscal policies and the practices of fiscal policies. The instituted financial
policies and practices generally govern, the fiscal performance of the City: a few of the
practices are as follows:
Revenues
One Time Revenues Matched with One Time Expenses
Manage User Fees to Match the Market Costs
Cash Reserve Requirements
Effective Utilization of Potential Tax Base (undeveloped land)
Expenses
Service Excellence-Quality of Service at the Lowest Costs
Community Safety
Managed Growth-planning and Infrastructure Development
Recruitment of Skilled Workforce-Competitive Salary Program
Protection of the City’s Credit Ratings
Another key policy in keeping the City’s fiscal condition in good health is the annual
rating review with three rating houses: Fitch, Moody’s and Standard & Poor’s. The
rating houses refer to this annual review as market surveillance which is a formalized
requirement of the rating agencies. The City annually presents the City’s financial

54
condition before each of the rating houses in New York, New York. This policy allows
Management to clearly express its views before rating committee chairs who evaluate the
City’s credit. Management of the City is considered to be strong by the agencies.
Fiscal Policy is Measured
Each year in evaluating the Strategic Plan, Management considers its guiding policy by
monitoring indices that encourage good fiscal health. These indices also alert
Management of potential fiscal distress, stress or variances from the City’s guiding fiscal
policy of letting “Growth Pay for Growth”. Key indices include: debt ratios, coverage
requirements and cash reserve requirements. Debt ratios are evaluated before the issuance
of debt or additional borrowings; coverage requirements or the percentage of earnings
greater above annual debt payments; solvency are monitored and measured annually to
the wealth of the community and the service needs of the citizens. If these indices get too
low or too high, Management acts to restore these indices to their normal levels.
Strategic Plan
The Plan has been designed to meet the current and future service demands of the
community based upon current management practices and current funding provisions of
existing programs. It allows for the expected or projected service needs of the community
for the next ten fiscal years, 2017-2026. The service needs include the Capital
Improvement Programs, Operating & Capital Equipment Programs, Employee
Recruitment Programs, and Expansion of Existing Programs. Major divisions and
departments have provided input and need assessments for the expected service level
requirements into the future.
The Plan is designed for continuous adjusting based on economic variables and local
activity drivers that affect the service requirements. It provides for a degree of certainty
in setting expectations for future spending and is expressive in its intent of future
spending patterns, but is not to be construed as the final funding authority for future
programs, future indebtedness or commitments to any program, vendor, stakeholder or
other interested party of the City as occurrences in the development of the City may alter
or change the priority of funding needed to service the City.
Financial Forecast and Projections
The Strategic Plan is a planning tool used to guide and address these demands for funding
while identifying potential stress points or weaknesses in the services being provided by
the City. It is also designed to steer the City clear of fiscal distress or warn Management
of potential fiscal stress when assuming a certain assumptions in spending patterns,
inflationary provisions, infrastructure programs, and recruitment, retention programs. It
also encourages the City to think into the future and in so doing, it encourages program
managers to anticipate the future costs of future populations as well as current
populations, while providing for the financial stability of the community by projecting
the future costs of City services.

55
The Strategic Plan includes revenues and expenditures for a period of ten years. The
objective of the forecast is simply to measure or guide the allowance of costs. Over the
ten year forecast, revenues and expenditures are projected to increase considerably over
the next ten years as the population is expected to increase 29% over the next decade.
The City’s economy is influenced some by the national economy, but is more influenced
by its population growth and its economic development programs. In years past from
1970 till today the City’s population has boomed almost 65,000 residents. During this
period time the national economy has moved through many economic cycles including
the Great Recession and the City population has continued to grow because of its location
in the North Texas. Growth over the next decade is expected to be more of a modest
pace of growth in the population and the number of new businesses moving into the
community.
In forecasting revenues and expenses for the City’s General Fund and Water, Sewer Fund
into the future, Management projects revenue trends to average in a range of 5% to 7%
over the next ten years with expenses being controlled or managed to approximately 3%
over the next ten years. The City could experience higher cost of operations because of
the effects of federal monetary policy, rising interest rates, energy prices, commodity
prices, labor markets, costs of raw water, and the costs of treating sewer water. Current
spending patterns suggest that minimum costs could increase 3% year over year, but
these spending patterns are extremely subject to economic variables that could easily
adjust the trajectory of presently projected spending pattern. Detailed projections by
revenue source and spending purposes are provided in following tables.
Key Rates
Tax Rate projections over the next ten years predict the tax rate to remain constant or at
its current rate of $.71 cents per $100 in assessed valuation of property within the City of
Mansfield, Texas. Water and Sewer rates are expected to remain constant over the next
ten years with the exception of modest rate increases year over year. Modest increases
are expected to pay for the significant cost increases being passed along to the City for
the cost of delivering raw water to the City’s water treatment facilities and the cost of
treating the City’s sewer water. The City is closely monitoring these rate increases that
are being charged by Tarrant Regional Water District and Trinity River Authority to the
City for their capital improvement programs. These rates may or may not increase
depending upon the costs being passed along to the City’s customers.
Current Economy, Future Economy
The City has increased service expectations as it has adjusted service programs to meet
the current demand for services. Department heads have submitted and requested funding
that is well beyond the City’s ability to fund the requesting funding. In an effort to
maintain existing services, the City has significantly reduced future spending
expectations because of the uncertainty in the national and global economies. All the
while, the City is seeing continued growth in its residential, commercial, and industrial
sectors of its economy and employment percentages are healthy and expected to remain

56
healthy in the City. The State of Texas employment percentages continue to fluctuate as
the State’s economy adjusts from the ever changing prices of oil and gas. Even though
the State is suffering from a drought in the oil and gas industry the overall economy of
the State is fairly stable as Texas is a leader in the exportation of goods around the world.
Although, nationally some areas of the country are still struggling in their recovery from
the Great Recession, the State of Texas and the North Texas region are doing well and
the signatures of fundamental growth are present. The City expects these trends to
continue into the future barring any unforeseen economic calamity.
Growth expectations are based on projected population estimates by the City’s planning
department. Support for these population projections are corroborated by the continued
growth in the overall population of the State of Texas, and the continued population
growth in the North Texas region.
0
20,000
40,000
60,000
80,000
100,000
2016 2017 2018 2019 2020 2021 2022 2023 2024 2025 2026
Population Estimates
The near term financial trends present favorable operating conditions within the City, and
Management will continue to monitor the near term trends as projections are based on
improving economic conditions within the City. Measurement indices of fiscal policies
will be monitored by Management too. Continued assessment of the economy will
condition Management’s action and responses in adjusting the revenues and expenses of
the City’s primary activities.
Strategic Plan Highlights
Population
Estimated 2017: 68,786
Estimated 2026: 87,041

57
Expected population increases create the need for housing stock, infrastructure, and retail
development. In the last decade of 2001 to 2010, the City added some 32,000 residents,
1990’s decade the City added 10,000 residents. The population growth in the last two
decades has been robust. The expected population increase over the next decade is 19,413
persons.
Capital Improvements
General Fund Improvements: $136,250,000
Water & Sewer Fund Improvements: $ 50,385,000
Most of the General Fund improvements are for the improvement of the City’s street
infrastructure. General Fund improvements will be funded through the capital markets.
The Water and Sewer Fund’s significant improvements are attributable to the expansion
of the treatment facility. The Water and Sewer Fund improvements will be funded
through a combination of the capital markets and cash. Impact Fees are a significant
resource used to offset the costs of these future improvements and will be used as they
are collected over the next ten years for both activities.
Service Improvements & Operating Equipment
General Fund Personnel $8,174,062
General Fund Equipment $12,058,727
Management has placed a priority on funding positions for the Public Safety Department.
Most of the equipment is for the replacement and addition to the Public Safety vehicle
inventory. The Water and Sewer Fund expects to maintain existing levels of service
personnel over the next decade.
0
100
200
300
400
500
2017 2018 2019 2020 2021 2022 2023 2024 2025 2026
General Fund FTE

58
Strategic Planning Process and Development of the Strategic Plan
January – March
Divisions submit Staffing and Equipment requests for the ten year period.
Divisions submit Capital Projects for Streets, Utility and Building Projects.
May – June
Business Services updates the Strategic Plan based on revised staffing,
equipment and capital requirements. Management and Staff estimate projected
availability of funding for new staffing, equipment and capital requirements.
February – April
Business Services reviews historical, current and future revenue sources and
estimates budgeted revenues and expenditure growth.
June – September
Management reviews the updates to the Strategic Plan and Management
presents the Plan for approval.
59
What does the Strategic Plan mean to the Citizens of Mansfield?
The Strategic Plan provides a blueprint of staffing, operating and capital requirements in
the FY 2017-2026 budget and anticipated requirements into future years. The plan is
adjusted annually as conditions change and priorities change based on current and future
growth projections. By identifying future needs, the City Council and City Management
are better able to plan and develop strategies to maintain current service levels, structure
debt to provide for infrastructure improvements and maintain financial stability. The plan
identifies strengths and challenges in current and future years that enable City Council
and Management to better plan for and adjust operations as needed.
How does the Strategic Plan relate to the Fiscal Year 2017 Budget?
The FY 2017 budget provides funding to maintain the current service levels in all
departments and provides for future growth and a strong equity position for the city. In
prior and future years, Public Safety has been the focal point of attention in the needs
assessment provided by City Council and Management. With the expansion of the city’s
park and recreation system, additional resources have been allocated to provide additional
services for the expanded programming requirements. The ongoing maintenance of city
streets and right of ways requires resources to be allocated to this service function as
well. The Strategic Plan incorporates local, state and national economic trends and
providing estimates for future budget years. The City has reviewed the fee structures in
previous years to adequately match fees with cost of operations. These revenues have
also been included in the FY 2017 budget and projected into future years.
How does the Strategic Plan improve overall Service Performance?
By identifying staffing, capital and operational requirements, additional resource
allocation may be adjusted to reflect the increased service demand for each department
and program. Anticipating future needs to service the expected population growth
requires each division and department to critically evaluate operational requirements,
staffing levels and capital requirements. Limited funding refines operational efficiencies
and highlights service levels that meet or do not meet the citizen’s expectation. In
summary, each division and department is charged with developing new and better
operational techniques to maintain the service levels demanded by citizens and staff. The
retention of a quality workforce maintains the overall service performance at all levels of
the organization. Management and Council have committed to providing the “Best
Value” for all citizens.
60
The Results of the Plan
The Plan is a financial planning model used by Management and Staff and has become an
effective management tool in managing the business concern of the City of Mansfield,
Texas. It has become a guide, indicator and reference point for the Rating Agencies and
the investment community in assessing the credit strength of the City. The Plan is a
forward-looking statement and includes the City’s expectations, hopes, intentions and
strategies regarding the future. These forward looking statements included herein are
necessarily based on various assumptions and estimates inherently subject to various
risks and uncertainties, including risks and uncertainties relating to possible invalidity of
the underlying assumptions and estimates and possible changes or developments in
social, economic, business, industry, market, legal and regulatory circumstances and
conditions and actions taken or omitted to be taken by third parties, including customers,
suppliers, business partners, competitors and legislative, judicial and any other
governmental authorities or officials. Assumptions related to the foregoing involve
judgments with respect to, among other things, future economic, competitive, market
conditions and future business decisions all of which are difficult or impossible to predict
accurately and many which are beyond the control of the City. Any such assumptions
could be inaccurate and there can be no assurance that the forward-looking statements
included in this Executive Summary will prove to be accurate or binding.
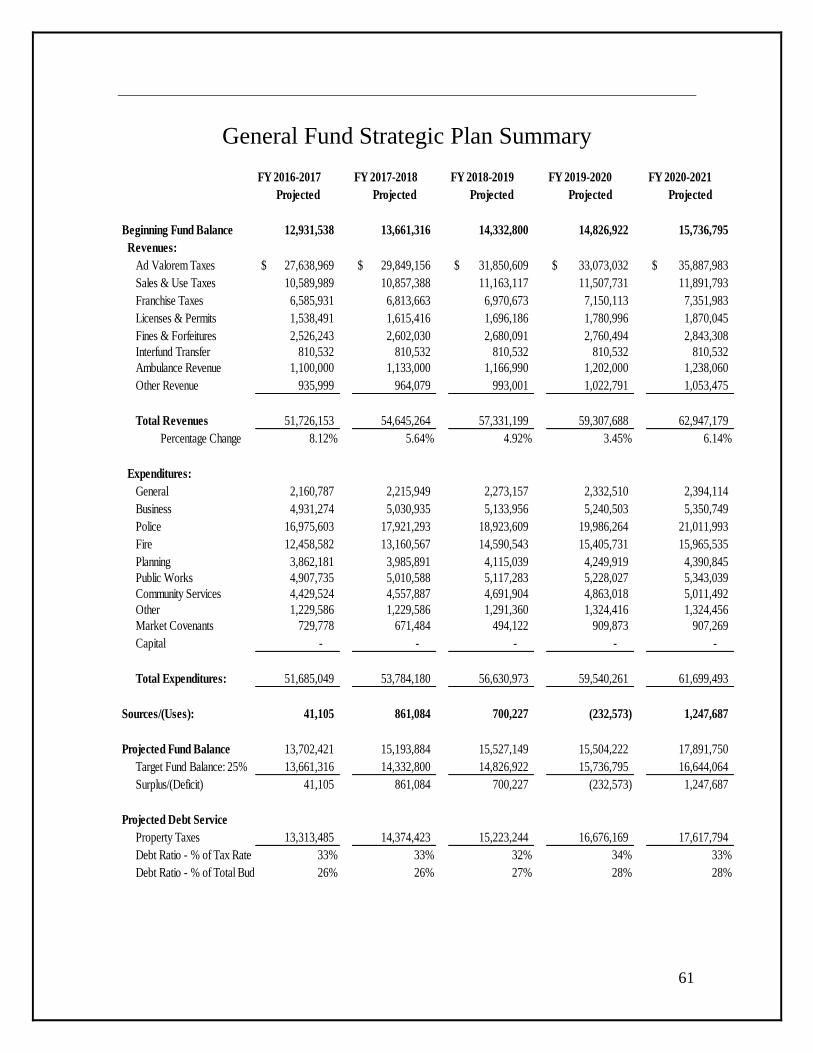
61
General Fund Strategic Plan Summary
FY 2016-2017 FY 2017-2018 FY 2018-2019 FY 2019-2020 FY 2020-2021
Projected Projected Projected Projected Projected
Beginning Fund Balance 12,931,538 13,661,316 14,332,800 14,826,922 15,736,795
Revenues:
Ad Valorem Taxes 27,638,969$ 29,849,156$ 31,850,609$ 33,073,032$ 35,887,983$
Sales & Use Taxes 10,589,989 10,857,388 11,163,117 11,507,731 11,891,793
Franchise Taxes 6,585,931 6,813,663 6,970,673 7,150,113 7,351,983
Licenses & Permits 1,538,491 1,615,416 1,696,186 1,780,996 1,870,045
Fines & Forfeitures 2,526,243 2,602,030 2,680,091 2,760,494 2,843,308
Interfund Transfer 810,532 810,532 810,532 810,532 810,532
Ambulance Revenue 1,100,000 1,133,000 1,166,990 1,202,000 1,238,060
Other Revenue 935,999 964,079 993,001 1,022,791 1,053,475
Total Revenues 51,726,153 54,645,264 57,331,199 59,307,688 62,947,179
Percentage Change 8.12% 5.64% 4.92% 3.45% 6.14%
Expenditures:
General 2,160,787 2,215,949 2,273,157 2,332,510 2,394,114
Business 4,931,274 5,030,935 5,133,956 5,240,503 5,350,749
Police 16,975,603 17,921,293 18,923,609 19,986,264 21,011,993
Fire 12,458,582 13,160,567 14,590,543 15,405,731 15,965,535
Planning 3,862,181 3,985,891 4,115,039 4,249,919 4,390,845
Public Works 4,907,735 5,010,588 5,117,283 5,228,027 5,343,039
Community Services 4,429,524 4,557,887 4,691,904 4,863,018 5,011,492
Other 1,229,586 1,229,586 1,291,360 1,324,416 1,324,456
Market Covenants 729,778 671,484 494,122 909,873 907,269
Capital - - - - -
Total Expenditures: 51,685,049 53,784,180 56,630,973 59,540,261 61,699,493
Sources/(Uses): 41,105 861,084 700,227 (232,573) 1,247,687
Projected Fund Balance 13,702,421 15,193,884 15,527,149 15,504,222 17,891,750
Target Fund Balance: 25% 13,661,316 14,332,800 14,826,922 15,736,795 16,644,064
Surplus/(Deficit) 41,105 861,084 700,227 (232,573) 1,247,687
Projected Debt Service
Property Taxes 13,313,485 14,374,423 15,223,244 16,676,169 17,617,794
Debt Ratio - % of Tax Rate 33% 33% 32% 34% 33%
Debt Ratio - % of Total Budget 26% 26% 27% 28% 28%
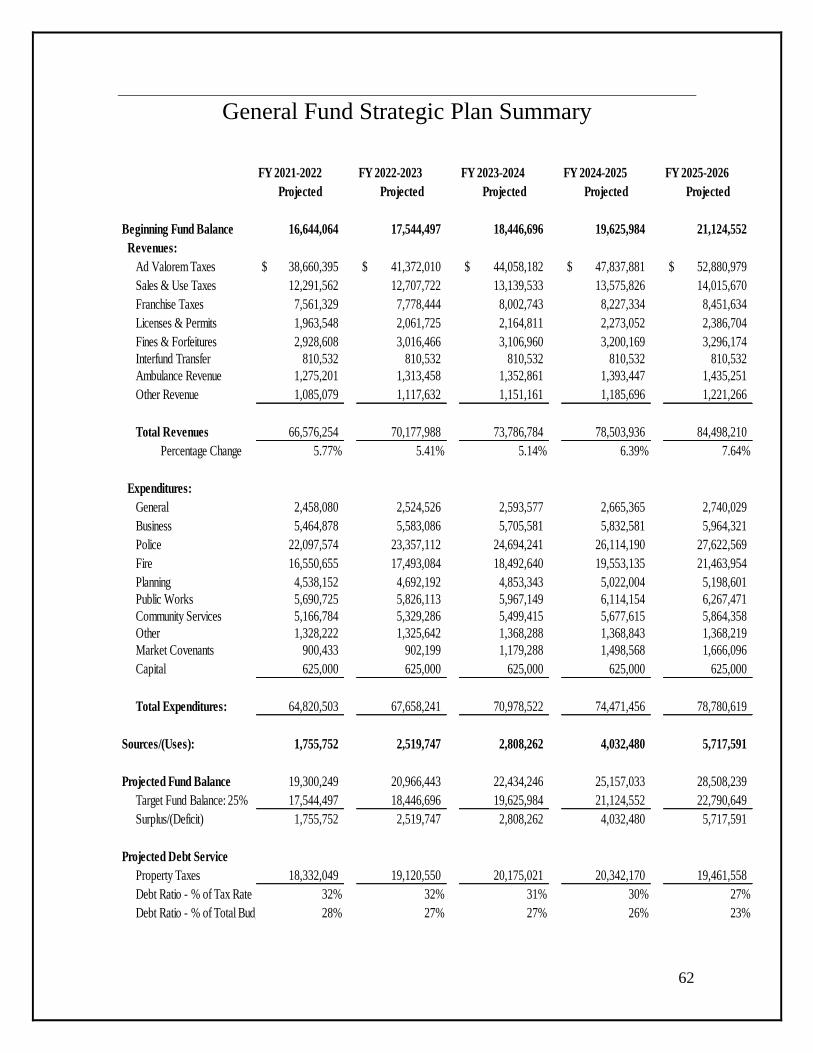
62
General Fund Strategic Plan Summary
FY 2021-2022 FY 2022-2023 FY 2023-2024 FY 2024-2025 FY 2025-2026
Projected Projected Projected Projected Projected
Beginning Fund Balance 16,644,064 17,544,497 18,446,696 19,625,984 21,124,552
Revenues:
Ad Valorem Taxes 38,660,395$ 41,372,010$ 44,058,182$ 47,837,881$ 52,880,979$
Sales & Use Taxes 12,291,562 12,707,722 13,139,533 13,575,826 14,015,670
Franchise Taxes 7,561,329 7,778,444 8,002,743 8,227,334 8,451,634
Licenses & Permits 1,963,548 2,061,725 2,164,811 2,273,052 2,386,704
Fines & Forfeitures 2,928,608 3,016,466 3,106,960 3,200,169 3,296,174
Interfund Transfer 810,532 810,532 810,532 810,532 810,532
Ambulance Revenue 1,275,201 1,313,458 1,352,861 1,393,447 1,435,251
Other Revenue 1,085,079 1,117,632 1,151,161 1,185,696 1,221,266
Total Revenues 66,576,254 70,177,988 73,786,784 78,503,936 84,498,210
Percentage Change 5.77% 5.41% 5.14% 6.39% 7.64%
Expenditures:
General 2,458,080 2,524,526 2,593,577 2,665,365 2,740,029
Business 5,464,878 5,583,086 5,705,581 5,832,581 5,964,321
Police 22,097,574 23,357,112 24,694,241 26,114,190 27,622,569
Fire 16,550,655 17,493,084 18,492,640 19,553,135 21,463,954
Planning 4,538,152 4,692,192 4,853,343 5,022,004 5,198,601
Public Works 5,690,725 5,826,113 5,967,149 6,114,154 6,267,471
Community Services 5,166,784 5,329,286 5,499,415 5,677,615 5,864,358
Other 1,328,222 1,325,642 1,368,288 1,368,843 1,368,219
Market Covenants 900,433 902,199 1,179,288 1,498,568 1,666,096
Capital 625,000 625,000 625,000 625,000 625,000
Total Expenditures: 64,820,503 67,658,241 70,978,522 74,471,456 78,780,619
Sources/(Uses): 1,755,752 2,519,747 2,808,262 4,032,480 5,717,591
Projected Fund Balance 19,300,249 20,966,443 22,434,246 25,157,033 28,508,239
Target Fund Balance: 25% 17,544,497 18,446,696 19,625,984 21,124,552 22,790,649
Surplus/(Deficit) 1,755,752 2,519,747 2,808,262 4,032,480 5,717,591
Projected Debt Service
Property Taxes 18,332,049 19,120,550 20,175,021 20,342,170 19,461,558
Debt Ratio - % of Tax Rate 32% 32% 31% 30% 27%
Debt Ratio - % of Total Budget 28% 27% 27% 26% 23%

63
Utility Fund Strategic Plan Summary
FY 2016-2017 FY 2017-2018 FY 2018-2019 FY 2019-2020 FY 2020-2021
Projected Projected Projected Projected Projected
Revenues:
Water Sales 15,154,288$ 16,043,283$ 17,273,644$ 17,102,551$ 18,806,344$
Sewer Sales 10,739,176 10,819,250 11,413,147 11,615,746 12,504,621
Wholesale 2,348,283 2,348,283 2,348,283 2,348,283 2,348,283
Other Fees 1,232,871 1,232,871 1,232,871 1,232,871 1,232,871
Impact Fees 1,228,507 1,228,507 1,228,507 1,310,407 1,359,548
Interest Income 971 971 971 971 971
Total Revenues 30,704,096 31,673,165 33,497,423 33,610,829 36,252,638
Percentage Change 3.16% 5.76% 0.34% 7.86%
Expenses:
Administration 1,138,724 1,170,663 1,203,515 1,237,308 1,272,068
Billing and Collection 1,000,819 1,028,469 1,056,901 1,086,138 1,116,202
Meter Reading and Repair 895,337 921,632 948,705 976,579 1,005,276
Water & Distribution 930,195 956,787 984,150 1,012,307 1,041,281
Waste Water Collection 7,570,086 7,539,770 7,751,181 8,180,177 8,455,083
Water Quality Control 9,056,645 9,663,058 9,975,211 10,305,881 10,549,806
Other 473,081 480,595 488,319 496,260 504,423
Transfers 810,532 810,532 810,532 810,532 810,532
Total Expenditures: 21,875,420 22,571,506 23,218,515 24,105,180 24,754,671
Operating Revenue 8,828,676 9,101,659 10,278,908 9,505,649 11,497,967
Other Expenditures:
Debt Service 6,459,234 6,275,009 7,186,534 6,534,834 8,035,871
Total Other Expenses: 6,459,234 6,275,009 7,186,534 6,534,834 8,035,871
Net Operating Activity: 2,369,442 2,826,650 3,092,374 2,970,815 3,462,096
Coverage Factor:
Annual Debt Service 1.37 1.45 1.43 1.45 1.43
Maximum Annual Require 1.37 1.45 1.43 1.45 1.43
Average Annual Require 1.38 1.42 1.60 1.48 1.79

64
Utility Fund Strategic Plan Summary
FY 2021-2022 FY 2022-2023 FY 2023-2024 FY 2024-2025 FY 2025-2026
Projected Projected Projected Projected Projected
Revenues:
Water Sales 19,446,511$ 20,298,016$ 21,327,764$ 22,200,070$ 23,108,053$
Sewer Sales 13,013,256 13,818,353 14,522,518 15,116,486 15,734,753
Wholesale 2,348,283 2,348,283 2,348,283 2,348,283 2,348,283
Other Fees 1,232,871 1,232,871 1,232,871 1,232,871 1,232,871
Impact Fees 1,408,688 1,457,828 1,457,828 1,457,828 1,457,828
Interest Income 971 971 971 971 971
Total Revenues 37,450,580 39,156,322 40,890,235 42,356,509 43,882,759
Percentage Change 3.30% 4.55% 4.43% 3.59% 3.60%
Expenses:
Administration 1,307,824 1,344,604 1,381,312 1,419,160 1,458,045
Billing and Collection 1,147,118 1,178,909 1,210,622 1,243,188 1,276,629
Meter Reading and Repair 1,034,823 1,065,244 1,095,604 1,126,828 1,158,943
Water & Distribution 1,071,097 1,101,778 1,132,408 1,163,889 1,196,245
Waste Water Collection 8,857,893 9,525,838 9,881,152 10,249,719 10,632,033
Water Quality Control 10,914,972 11,417,551 11,848,793 12,296,386 12,760,952
Other 512,816 521,445 530,048 538,881 547,948
Transfers 810,532 810,532 810,532 810,532 810,532
Total Expenditures: 25,657,074 26,965,902 27,890,470 28,848,582 29,841,327
Operating Revenue 11,793,506 12,190,420 12,999,765 13,507,927 14,041,432
Other Expenditures:
Debt Service 8,231,871 8,506,034 8,272,709 8,039,181 8,042,881
Total Other Expenses: 8,231,871 8,506,034 8,272,709 8,039,181 8,042,881
Net Operating Activity: 3,561,635 3,684,386 4,727,056 5,468,746 5,998,551
Coverage Factor:
Annual Debt Service 1.43 1.43 1.57 1.68 1.75
Maximum Annual Require 1.43 1.43 1.57 1.68 1.75
Average Annual Require 1.84 1.90 2.02 2.10 2.19
65
For illustration purposes the plan has been prepared to allow for modest rate adjustments
over the next five years and allowed for no rates adjustments in the last five years of the
plan to show the impact of holding rates constant. This model suggests fiscal stress will
be encountered during this period unless revenue or expenses are adjusted. The Average
Annual Requirement is the leading indicator of potential fiscal stress. Although
decreasing, other coverage factors remain fairly constant and suggest a good bill of fiscal
health of the Water and Sewer Fund. Rates during this period may or may not be
adjusted depending upon the factors affecting the economic variables assumed in this
model.

66
City of Mansfield, Texas
Strategic Plan
2017-2026
ASSUMPTIONS
PROJECTS, EXPENSES, REVENUES

67
GENERAL FUND ASSUMPTIONS
Revenues
Table 1
Table 1 estimates the amount of residential construction and corresponding increase in the
population based on an assumed multiplier.
Estimated Estimated Estimated Estimated Estimated
Year Population Units Multiplier Added Population Population
Current 67,628 376 3.08 1,158 68,786
2017 68,786 450 3.08 1,386 70,172
2018 70,172 525 3.08 1,617 71,789
2019 71,789 600 3.08 1,848 73,637
2020 73,637 675 3.08 2,079 75,716
2021 75,716 700 3.08 2,156 77,872
2022 77,872 726 3.08 2,236 80,108
2023 80,108 750 3.08 2,310 82,418
2024 82,418 751 3.08 2,313 84,731
2025 84,731 750 3.08 2,310 87,041
2026 87,041 500 3.08 1,540 88,581
Ad Valorem Tax Assumptions
Table 2
Table 2 estimates the estimated value of new construction of a single family residential dwelling
and the corresponding property value. The tax rate assumption for Ad Valorem Taxes $.71 cents.
Estimated New New Total New Total New
Year Living Units Commercial Living Unit Value Construction Value Ad Valorem Tax
Current 376 - - - -
2017 450 - - - -
2018 525 60,501,357 129,534,375 190,035,732 1,349,254
2019 600 65,341,466 142,228,359 207,569,825 1,473,746
2020 675 70,568,783 155,476,084 226,044,867 1,604,919
2021 700 176,214,285 174,623,199 350,837,484 2,490,946
2022 726 112,311,428 185,658,431 297,969,859 2,115,586
2023 750 88,896,343 197,275,447 286,171,790 2,031,820
2024 751 96,008,050 209,071,994 305,080,044 2,166,068
2025 750 103,688,694 214,445,002 318,133,696 2,258,749
2026 500 111,983,789 219,656,263 331,640,052 2,354,644

68
Table 3
Table 3 estimates the estimated value of the existing tax base and new construction value. The tax
rate assumption for Ad Valorem Taxes $.71 cents per $100.
Beginning New Existing Less: TIRZ #1 Less: TIRZ #2 Estimated Total Projected
Year Value Construction Value Value Increase Valuation Valuation Valuation Ad Valoreum Tax
Current 5,365,579,777$ -$ -$ (95,907,882)$ (115,384)$ 5,269,556,511$ 37,652,182$
2017 5,841,067,724 - - (110,060,677) (1,577,072) 5,729,429,975 40,952,454
2018 5,841,067,724 190,035,732 292,053,386 (141,044,529) (2,804,864) 6,179,307,449 44,223,579
2019 6,323,156,842 207,569,825 252,926,274 (188,877,308) (30,762,542) 6,564,013,091 47,073,853
2020 6,783,652,941 226,044,867 203,509,588 (240,813,517) (49,748,951) 6,922,644,928 49,749,201
2021 7,213,207,396 350,837,484 216,396,222 (295,848,136) (52,114,952) 7,432,478,014 53,505,777
2022 7,780,441,102 297,969,859 233,413,233 (354,103,774) (54,551,932) 7,903,168,488 56,992,444
2023 8,311,824,194 286,171,790 249,354,726 (415,707,236) (57,062,023) 8,374,581,451 60,492,561
2024 8,847,350,710 305,080,044 265,420,521 (478,882,858) (59,647,416) 8,879,321,001 64,233,203
2025 9,417,851,275 318,133,696 282,535,538 (543,670,906) (62,310,370) 9,412,539,233 68,180,051
2026 10,018,520,509 331,640,052 300,555,615 (610,112,683) (65,053,214) 9,975,550,279 72,342,537
Sales Tax Assumptions
Table 4
Table 4 estimates the sales tax, mixed drink tax and utility sales tax. Beginning in FY
2016-2017, Sales Tax is expected to increase an average of 3% annually.
Estimated Mixed Utility Total Annual
Year Units Per Capita Sales Tax Drink Tax Sales Tax Sales Tax
Current 376 150.24$ 10,160,562$ 176,120$ 23,227$ 10,359,908$
2017 450 150.99 10,386,215 180,031 23,743 10,589,989
2018 525 151.75 10,648,469 184,577 24,342 10,857,388
2019 600 152.51 10,948,314 189,774 25,028 11,163,117
2020 675 153.27 11,286,298 195,633 25,800 11,507,731
2021 700 154.04 11,662,970 202,162 26,662 11,891,793
2022 726 154.81 12,055,046 208,958 27,558 12,291,562
2023 750 155.58 12,463,198 216,033 28,491 12,707,722
2024 751 156.36 12,886,701 223,374 29,459 13,139,533
2025 750 157.14 13,314,598 230,791 30,437 13,575,826
2026 500 157.93 13,745,979 238,268 31,423 14,015,670

69
$0
$5,000,000
$10,000,000
$15,000,000
2017 2018 2019 2020 2021 2022 2023 2024 2025 2026
Projected Sales Tax
Franchise Fee Assumptions
Table 5
Table 5 estimates the franchise tax collected on electricity, gas, phone and cable services.
Estimated Annual Percentage Estimated
Year Franchise Tax Increase Increase Total
Current 6,501,626$ -$ 6,501,626$
2017 6,585,931 84,305 1% 6,585,931
2018 6,813,663 227,732 3% 6,813,663
2019 6,970,673 157,010 2% 6,970,673
2020 7,150,113 179,440 3% 7,150,113
2021 7,351,983 201,870 3% 7,351,983
2022 7,561,329 209,346 3% 7,561,329
2023 7,778,444 217,115 3% 7,778,444
2024 8,002,743 224,299 3% 8,002,743
2025 8,227,334 224,591 3% 8,227,334
2026 8,451,634 224,300 3% 8,451,634
0
1,000,000
2,000,000
3,000,000
4,000,000
5,000,000
6,000,000
7,000,000
8,000,000
9,000,000
2017 2018 2019 2020 2021 2022 2023 2024 2025 2026
Projected Franchise Tax

70
Operating Expense Assumptions
The Operating Expense assumptions include an annual increase in personnel costs and
operating costs of approximately 3%. New positions will be evaluated based on building
permit activity and related population growth. The Capital Improvement Program has
been structured to add infrastructure improvements annually with minimal impact on
operating cost and debt ratios. The Strategic Plan is structured to provide:
Operating expense growth based on population growth and development
requirements.
Increased staffing primarily in Public Safety.
Annual increases in operating costs including utilities, fuel and supplies.
The addition of new positions based on population growth related to residential
building permit activity.
Summary of Full Time Equivalent Positions
Full Time
Equivalents Budget Budget Budget Budget Budget
Positions 2017 2018 2019 2020 2021
General Government 9 9 9 9 9
Business Services 14 14 14 14 14
Police 136 140 144 148 151
Fire 86 89 98 101 101
Development 28 28 28 28 28
Community Services 36 36 36 36 36
Public Works 30 30 30 30 30
339 346 359 366 369
Full Time Equivalents Budget Budget Budget Budget Budget
Positions 2022 2023 2024 2025 2026
General Government 9 9 9 9 9
Business Services 14 14 14 14 14
Police 154 158 162 166 170
Fire 101 104 107 110 119
Development 28 28 28 28 28
Community Services 36 36 36 36 36
Public Works 33 33 33 33 33
375 382 389 396 409

71
Summary of Street Construction Projects
Note: costs include the expected collection of impact fees and may vary from amounts
borrowed depending upon the anticipated collection of impact fees.
FY 2017- $17,650,000
Day Miar (E Broad to Seeton) Design/ROW
Holland (Phase III) Design/ROW
Misc. Residential/Intersection Reconstruction
North Street Study at Bridge/RR
Debbie – 157 to US Business 287
Price Road Design
S. Main (Broad to Hurst)
Schematic, ROW Russell/Connector
School Flasher Coord. System
Seeton Bridge at Joe Pool Lake
SH 360 Participation
Tarrant CDBG
Turner Warnell Construction
FY 2018 - $17,650,000
Day Miar Construction (1/2)
Design Debbie Lane Ultimate Improvements Design
Holland Construction Remainder Phase III
Holland Phase II Design
Misc. Residential/Intersection Reconstruction
North Street CDBG
Price Road Construction
FY 2019 - $17,000,000
Day Miar Construction (1/2)
Debbie Lane Ultimate Construction
Holland Phase II Construction
Misc. Residential/Intersection Reconstruction

72
FY 2020 - $16,400,000
Cannon Extension (South to Roundabout)
Gertie Barrett (Bus 287 to Country Meadow)
Misc. Residential/Intersection Reconstruction
Mitchell Road (Broad to Railroad)
S Main Resurfacing (Hunt to Heritage)
US 287 Frontage Roads (Lonestar to Railroad)
FY 2021 - $16,200,000
Debbie – Additional Lanes (WC/Matlock)
FM 157 at US 287 (Ramps and U-Turns)
Misc. Residential Roadways
Mitchell Road (Heritage to Mathis)
Signals (Matlock/Ragland)
FY 2022 - $18,550,000
Broad – Additional 2 Lanes (Matlock/Holland)
Callendar (US 287 to Debbie Lane)
Misc. Residential Roadways
National Parkway – Additional 2 Lanes
Route A/East/6th
Ave
FY 2023 - $11,800,000
Lone Star Bridge Widening
Lone Star (US 287 to Chambers)
Matlock – Additional Lanes (Debbie to Ragland)
Misc. Residential Roadways
FY 2024 - $7,000,000
Misc. Residential Roadways
Misc. Arterial/Collector Roadways
FY 2025 - $3,000,000
Misc. Residential Roadways

73
Summary of Land Acquisitions and Facility Construction Projects
FY 2017 - $0
FY 2018 - $0
FY 2019 - $5,000,000 Fire Station #5-$5,000,000
FY 2020 - $0
FY 2021 - $0
FY 2022 - $6,100,000 Public Safety Building Expansion-$6,100,000
FY 2023 - $0
FY 2024 - $6,000,000 Fire Station #6-$6,000,000
FY 2025-$0
FY 2026- $0

74
Summary of Utility Construction Projects
Note: costs include the expected collection of impact fees and may vary from amounts
borrowed depending upon the anticipated collection of impact fees.
FY 2017 - $3,900,000
20”, 16” & 12” Water Lines Main Street & US 287
16” Water Line Main St – Main Street Lofts
SH360 Lift Station Replacement
Misc. Utilities for Roadway Bond Projects
Knob Hill Distribution System Replacement
Odor Control at Holland Lift Station
FY 2018 - $11,735,000
30” Water Line Matlock South of Broad St
Walnut Creek Sewer Interceptor – Phase 1
Misc. Utilities for Roadway Bond Projects
Clearwell #4 @ Bud Ervin Water Plant - APAI
Clearwell #4 @ Bud Ervin Water Plant - Construction
FY 2019 - $1,700,000
12” Water Line North Main Street
Misc. Utilities for Roadway Bond Projects
FY 2020 - $15,100,000
Walnut Creek Sewer Interceptor – Phase 2
Misc. Utilities for Roadway Bond Projects
Final Expansion of Bud Ervin Water Treatment Plant (60MGD) - APAI
Final Expansion of Bud Ervin Water Treatment Plant (60MGD) - Construction
FY 2021 - $1,800,000
24” Water Line Newt Patterson
Misc. Utilities for Roadway Bond Projects
FY 2022 - $7,750,000
Lone Star 2.5 MG EST
Misc. Utilities for Roadway Bond Projects

75
FY 2023 - $600,000
Misc. Utilities for Roadway Bond Projects
FY 2024- $600,000
Misc. Utilities for Roadway Bond Projects
FY 2025 - $6,600,000
Phase 1 Future Water Treatment Plant Design
Misc. Utilities for Roadway Bond Projects
FY 2026 - $600,000
Misc. Utilities for Roadway Bond Projects


77
MAJOR REVENUES
General Fund
City revenues are based on a combination of factors including analysis of historical revenue, anticipated
changes in the local economic environment and projected growth and development throughout the City.
The City of Mansfield also uses a variety of factors in determining the availability of revenue to fund
operations throughout the City, including but not limited to qualitative and quantitative revenue
forecasting, trend analysis, multiple regression, time series analysis, multi-year historical data, national,
state and local economic trends, undeveloped land, actual and proposed development, quantitative and
qualitative factors including plats, building permits and the Long Term Financial Plan.
The City of Mansfield has historically used conservative estimates to forecast revenues in all funds. In
FY 2016-2017, the City has aggressively estimated revenues based on current residential and commercial
developments approved by City Council, aggressive economic development efforts and increased
commercial and residential developments within the City. Development in the medical corridor and the
southeast portion of the City is expected to continue in FY 2016-2017. Residential and commercial
property valuations have followed recent local, state and national trends. Property values increased
approximately 10% of which new construction was approximately $147,038,257. Mineral valuations
dropped from FY 2015-2016 levels. Recent and projected new retail centers are expected to generate
additional sales tax revenue.
A total of $52,208,793 is projected in the General Fund for FY 2016-2017. This represents a 9.13%
increase over the FY 2015-2016 budget or $4,369,228 in increased revenue. The assumptions used by the
City to formulate the projected 2016-2017 budget are explained and illustrated on the pages that follow.
The property tax rate is $0.71 in FY 2016-2017 and represents no increase in the property tax rate.
Actual Actual Actual Budget Budget
Description 2012-2013 2013-2014 2014-2015 2015-2016 2016-2017 Percent
Property Tax 19,773,381$ 21,216,486$ 23,097,995$ 24,503,364$ 27,605,907$ 12.66%
Sales Tax 8,237,822 9,221,933 9,882,734 9,709,913 10,589,988 9.06%
Franchise Fees 6,090,152 6,305,535 6,537,035 6,561,645 6,585,932 0.37%
Permits 1,335,904 1,372,241 1,824,809 2,202,335 1,556,211 -29.34%
Fines & Fees 2,576,698 2,374,178 2,525,912 2,525,427 2,526,241 0.03%
Transfers 810,532 810,532 810,532 810,532 1,208,513 49.10%
Other 1,626,681 5,448,488 1,848,936 1,526,350 2,135,999 39.94%
Total 40,451,170$ 46,749,393$ 46,527,953$ 47,839,565$ 52,208,793$ 9.13%
Percentage 15.57% -0.47% 2.82% 9.13%

78
General Fund Revenue Composition
Budget 2016-2017
Property Tax
53% Sales Tax
20%
Franchise Tax
13%
Fines
5% Permits
3% Transfers
2% Other
4%

79
Property Tax Revenue
Property tax accounts for approximately 53% of all revenue in the General Fund. Property tax revenue is
budgeted at $27,605,907 in FY 2016-2017, an increase of 12.66% or $3,102,542. The increase in property
tax is from a substantial increase in existing and new property valuations as well as new growth. New
construction activity in FY 2016-2017 is anticipated to increase as economic conditions improve and
commercial and retail developments increase. Property tax estimates are based on the valuation of real
and personal property within the City of Mansfield. In FY 2016-2017 the average residential home
increased in value approximately 9.6%. New construction in FY 2016-2017 was approximately
$147,038,257. The production of natural gas and value of mineral interests within the City of Mansfield
decreased immaterially over prior years due to the reduced price of natural gas.
New Property Value
-4%
-2%
0%
2%
4%
6%
8%
10%
12%
2008 2009 2010 2011 2012 2013 2014 2015 2016 2017
Average Home Value
$0
$50,000
$100,000
$150,000
$200,000
$250,000
2008 2009 2010 2011 2012 2013 2014 2015 2016 2017

80
Sales Tax Revenue
Sales tax accounts for approximately 20% of all revenue in the General Fund. Sales tax revenue also
supports the Mansfield Park Facilities Development Corporation and Mansfield Economic Development
Corporation. Sales tax is budgeted at $10,589,988 in FY 2016-2017 or a 9.06% increase over FY 2015-
2016 budget estimates. In 2016-2017, the City anticipates continued growth in retail spending activity
from new retail development and the improving economy. Retail and entertainment venues including
Hawaiian Falls Water Park, Big League Dreams Sports Park, Fieldhouse project and the medical corridor
will continue to attract retail and commercial development in the short and long term. Through the
Mansfield Economic Development program, the City is constantly searching for new retail, commercial
and industrial developments to grow its retail base. The City continues to attract high quality development
and expects increased retail activity to continue into 2017.
Franchise Tax Revenue
Franchise tax accounts for approximately 13% of all revenue in the General Fund. Franchise tax revenue
includes revenue from electric, gas, telephone, cable and sanitation franchise agreements. In FY 2016-
2017, franchise tax revenue is projected to increase less than 1% from revenues derived from the City’s
sanitation service, gas, cable and electric franchise fees. The electric and gas franchise taxes are tied to
actual usage and weather conditions. Annually, franchise fees have increased an average of 6-7%. The
actual number of users and the weather patterns throughout the year determines the electric and gas
franchise fee revenue. The revenue may increase or decrease depending on the volume usage of kilowatt-
hours per household, hot or dry conditions during the year and the number of new residential and
commercial users.
$0
$2,000,000
$4,000,000
$6,000,000
$8,000,000
$10,000,000
$12,000,000
2010 2011 2012 2013 2014 2015 Budget
2016
Budget
2017
Sales & Use Tax Revenue

81
Licenses and Permits
The license and permit revenues are derived primarily from residential and commercial building activity.
Historically, 5% of the General Fund budget has been derived from permit activity. In FY 2016-2017,
budgeted permit activity accounts for approximately 3% of the General Fund budget. The City anticipates
this revenue to increase from new residential and commercial developments that will begin some phase of
design and construction.
0%
10%
20%
30%
40%
50%
60%
70%
80%
90%
100%
2013 2014 2015 Budget 2016 Budget 2017
Franchise Fee Revenue
Gas Telephone Electric Cable Sanitation Other Gas Royalty Income
$0
$500,000
$1,000,000
$1,500,000
$2,000,000
$2,500,000
2011 2012 2013 2014 2015 Budget
2016
Budget
2017
Building Permit Revenue

82
Fines & Forfeitures
The fines and forfeiture revenue make up approximately 5% of General Fund budgeted revenue in FY
2016-2017. Two primary sources, gas well inspection fees and court fines, account for 77.1% of the total
revenue generated in this activity. Other revenues include animal shelter fines, library fines, alarm permit
fees and miscellaneous fines. Gas well inspection fees are budgeted at $460,000 and court fines are
budgeted at $1,445,968.
DEBT SERVICE FUND REVENUE ASSUMPTIONS
FY 2016-2017 revenues in the Debt Service Fund are based on the amount of outstanding General Fund
Operating Debt requirements. The budgeted amount for FY 2016-2017 in the Debt Service Fund is
$13,349,613. The budgeted amount is $523,541 more than FY 2015-2016.
Property Tax Revenue
Property tax accounts for 100% of all funding in the General Obligation Debt Service Fund. Illustrated
below is a summary of the Debt Service Fund historical, current and future projections.
$0
$500,000
$1,000,000
$1,500,000
$2,000,000
$2,500,000
$3,000,000
2011 2012 2013 2014 2015 Budget
2016
Budget
2017
Fines Revenue
0%
5%
10%
15%
20%
25%
30%
35%
40%
45%
2009 2010 2011 2012 2013 2014 2015 Budget
2016
Budget
2017
General Obligation Debt Service as a Percentage of Property Tax
Revenue

83
ENTERPRISE FUND REVENUE ASSUMPTIONS
FY 2016-2017 budgeted revenues are based on a combination of factors including analysis of historical
revenue, anticipated changes in the local economic environment and projected growth and development
throughout the City. Enterprise Fund revenue includes the Water & Sewer Fund, Law Enforcement
Center Fund and the Environmental Services Fund. Each fund has revenue that is unique to the fund and
is described in the following paragraphs.
Water & Sewer Fund
The budgeted revenue in the Water & Sewer fund is $29,817,745 in FY 2016-2017 or an increase of
3.47% over FY 2015-2016 due to rate increases and demand for water and sewer treatment. The primary
revenue source in this fund is water sales, which makes up 59.1% of all budgeted revenue, and sewer
service, which makes up 37.4% of all revenue.
Law Enforcement Center Fund
The budgeted revenue in the Law Enforcement Center Fund is $10,962,212 or an 8.11% increase over FY
2015-2016. The increase in revenue for FY 2016-2017 is due to a 4% contract increase from the City of
Fort Worth contract and the projected increase in other contract housing of prisoners. The City of Fort
Worth contract is budgeted at $6,909,227 to house prisoners.
The primary revenue source in this fund is the rental of jail beds to the City of Fort Worth and the United
States Government, which makes up 90.5% of budgeted revenue. The Law Enforcement Center rents
beds to the United States Government at a new rate of $63.30 per day. This represents an increase of
$16.70 per inmate over the prior fiscal year. Other revenue includes telephone commissions, prisoner
transportation charges, housing for the Cities of Kennedale and Burleson, and salary reimbursements for
additional services.
$0
$5,000,000
$10,000,000
$15,000,000
$20,000,000
$25,000,000
$30,000,000
$35,000,000
2010 2011 2012 2013 2014 2015 Budget
2016
Budget
2017
Water & Sewer Revenue

84
Environmental Services Fund
The budgeted revenue in the Environmental Services Fund for FY 2016-2017 is $2,469,540 or an 88.7%
increase over FY 2015-2016 due to a fee adjustment for all users. $3,220,000 will be used to fund
projects, and bonds will be issued to pay for these improvements. $528,170 is dedicated for principal and
interest payments. The increased revenue is based on historical revenue patterns over the last three years.
SPECIAL REVENUE FUND ASSUMPTIONS
FY 2016-2017 revenues are based on a combination of factors including analysis of historical revenue,
anticipated changes in the local economic environment and projected growth and development throughout
the City. The Special Revenue Fund includes the Hotel/Motel Tax Fund, Mansfield Park Facilities
Development Corporation Fund, Tree Mitigation Fund and the Mansfield Economic Development Fund.
Each fund has revenue that is unique to that fund and is described in the following illustrations.
$0
$2,000,000
$4,000,000
$6,000,000
$8,000,000
$10,000,000
$12,000,000
2010 2011 2012 2013 2014 2015 Budget
2016
Budget
2017
Operating Revenue for the Law Enforcement Center
$0
$1,000,000
$2,000,000
$3,000,000
$4,000,000
$5,000,000
$6,000,000
2012 2013 2014 2015 Budget 2016 Budget 2017
Special Revenue Funds
MPFDC MEDC HOTEL/MOTEL TREE MITIGATION
85
Hotel/Motel Tax Fund
The budgeted revenue for FY 2016-2017 in the Hotel/Motel Tax Fund is $713,300 or an increase of 26%
over FY 2015-2016. Revenue from this fund is derived from a hotel/motel tax of 7% on hotel and motel
occupied rooms within the City of Mansfield. In FY 2012-2013, the City expanded the tourism program
to develop a City-wide marketing strategy to attract special events, conferences and sporting events that
promote the use of hotels within the City of Mansfield. Recent developments in Arlington including the
new Dallas Cowboy’s Stadium, and local venues including Big League Dreams Sports Park and Hawaiian
Falls Water Park, have contributed to the demand for hotel space. The Fieldhouse and Dallas Stars Center
are anticipated to have a positive impact on hotel/motel tax as well.
Mansfield Park Facilities Development Corporation
The operating budgeted revenue for FY 2016-2017 in the Mansfield Park Facilities Development
Corporation (MPFDC) budget is $4,579,962 for operations and an additional $1,941,171 in sales tax
revenue to pay for debt service. In 1992, the citizens voted a ½ cent sales tax to provide parks, cultural
facilities and equipment to enhance and expand the City of Mansfield’s park system. The primary sources
of revenue from this fund are derived from sales tax, grants, impact fees and rental fees. Sales tax
accounts for 79.8% of budgeted revenue. The primary revenue source in this activity will continue to
increase as new retail and commercial developments continue throughout the City. Big League Dreams,
Hawaiian Falls Water Park, the Mansfield National Golf Club and the Fieldhouse will generate additional
sales tax revenue from visitors utilizing these recreational venues.
Mansfield Economic Development Corporation
The operating budget for FY 2016-2017 in the Mansfield Economic Development Corporation (MEDC)
budget is $976,943. Included in this fund is $1,202,784 for debt service and additional funding for
contractually obligated projects. In 1992, the citizens voted a ½ cent sales tax to provide economic
development funds to provide a funding mechanism to encourage retail, commercial and industrial
development within the City of Mansfield to reduce the residential tax burden. The primary source of
revenue from this fund is derived from sales tax, which makes up 99% of budgeted revenue.
Tree Mitigation Fund
No revenue is budgeted in the Tree Mitigation Fund for FY 2016-2017.
CAPITAL PROJECTS FUND REVENUE ASSUMPTIONS
The Capital Projects Fund includes the Street Construction Fund, Utility Construction Fund, Building
Construction Fund, Parks Construction Fund, Economic Development Construction Fund and Equipment
Replacement Fund. The revenue sources for these funds include bond proceeds, impact fees,
contributions, transfers, interest earnings, grants and other uncategorized revenue. Impact fees include
roadway impact fees and water & sewer impact fees. Roadway impact fees are charged to the builder or
developer on a per lot basis for residential homes at a rate of $1,000 per lot; commercial and special use
impact fees are charged on a per square footage basis. Water & Sewer impact fees are charged based on
the size of the water and sewer line connection to the water and sewer system.
While bond proceeds continue to be the major source of revenue for the Capital Projects Fund, impact
fees have also become a major revenue source. Average impact fees per single family unit total $7,300.
86
Since 1995, roadway impact fees, water & sewer impact fees and park development fees have totaled
$99,012,735. Impact fee revenue is projected to continue in future years, but the City has been
conservative in its estimates for impact fee contributions. Impact fees are utilized to reduce the amount of
bond issuance in the Street Construction and Utility Construction funds.
Contributions from developers and the Mansfield Economic Development Fund provide additional
revenue in these funds. Contributions are not budgeted on an annual basis in the Capital Projects Fund
since these revenues cannot be projected with any degree of certainty.
Transfers, interest and expense recovery revenues make up the remaining revenue sources of the Capital
Project Fund. Generally, transfers from the General Fund and bond provide the major revenue source for
the Equipment Replacement Fund unless the City opts to finance the purchase of equipment.
The City Council and Management team have made a conscious effort to develop alternative revenue
sources by the utilization of impact fees and developer contributions.
Street Construction Fund
The budgeted revenue for FY 2016-2017 in the Street Construction Fund is $23,395,732 or an increase of
46% from FY 2015-2016. Impact fees are projected to generate an estimated $700,000 in FY 2016-2017.
Utility Construction Fund
The budgeted revenue for FY 2016-2017 in the Utility Construction Fund is $8,026,574 or a decrease of
70.2%. Impact fees are budgeted at $1,100,000.
Building Construction Fund
The budgeted revenue in the Building Construction Fund is $15,100,000. Facility expansions include the
design and construction of the Dallas Stars Center.
Mansfield Parks Facilities Development Corporation Construction Fund
The budgeted revenue in the Mansfield Parks Facilities Corporation Construction Fund is $20,545,556.
Major projects include completion of the Fieldhouse project and Pond Branch construction.
Mansfield Economic Development Corporation Construction Fund
The budgeted revenue in the Mansfield Economic Development Facilities Construction Fund is
$19,954,572. Major projects include design and construction along Broad Street and Regency Parkway.
Equipment Replacement Fund
The primary source of revenue will be the issuance of Certificates of Obligation of $1,250,377 to fund
facility improvements, technology improvements, public safety vehicles and equipment. Additional
revenue sources include auction proceeds on the disposal of vehicles and equipment.

87
GOALS AND OBJECTIVES STATEMENT
Incorporated in the FY 2016-2017 budget is the continuation of the original program as set forth by the
administration and identified in the annual statement of Goals and Objectives. The FY 2016-2017 budget
represents a renewed challenge in continuation of these goals through identification of major objectives.
These have been restated in understanding of the forward direction and continued improvements
accomplished by taking positive and deliberate steps to meet our goals of "A SATISFIED PUBLIC, A
SKILLED WORK FORCE, AND A COST EFFECTIVE SERVICE DELIVERY."
Although financial goals and objectives are present throughout the budget, critical to all the citizens of
Mansfield are non-financial goals and strategies to enhance the quality of life for all residents.
Further, it is important to understand how short term and long term goals relate to the overall objectives
expected by the citizens of Mansfield.
Individual division/department goals and objectives can be found in each division/department section of
the budget document.

88
FINANCIAL AND NON-FINANCIAL GOALS & OBJECTIVES
City Council and City Staff met to establish priorities and broad-based goals for Fiscal Year 2016-2017.
Incorporated into the overall Strategic Planning Session was “A Collective Vision” or simply put:
“To provide our citizens the highest quality service at the Best Value”
In order to accomplish this vision, City Council and City Staff recognize the importance of strategic
planning and the development of goals and effective strategies for implementation of established goals
and priorities. The following broad-based goals were established:
Continue to Develop Infrastructure
Relieve traffic congestion by improvements to major arteries and intersections.
Complete infrastructure improvements including streets, drainage and utilities to prepare for
future development along the Broad Street corridor and State Highway 360.
Maintain High Quality Development
Maintain a highly competitive program for recruiting economic development projects.
Continue to review large projects to ensure that they meet current development standards and
comply with adopted residential and commercial requirements.
Streamline the development process to take advantage of development opportunities.
Enhance Public Safety
Enhance the Public Safety departments by increasing response times, community involvement
and utilizing community-based groups to assist in keeping the City safe.
Provide additional staff, equipment and vehicles to ensure the Public Safety departments are able
to respond to citizens’ needs in a timely manner.
Create a Total Living Environment
Alleviate congestion at intersections of major highways and roads with consideration of future
needs along Broad Street, Downtown and State Highway 360.
Develop strategies to maintain a “satisfied public.”
Continue to revitalize the downtown area.
Promote the arts by creating an Art’s Council and staff to develop the arts throughout the
community.
Maintain the City’s Financial Condition
Maintain current debt ratios and fund balances.
Manage a balanced budget in all funds.
Maintain or improve the City’s bond ratings.
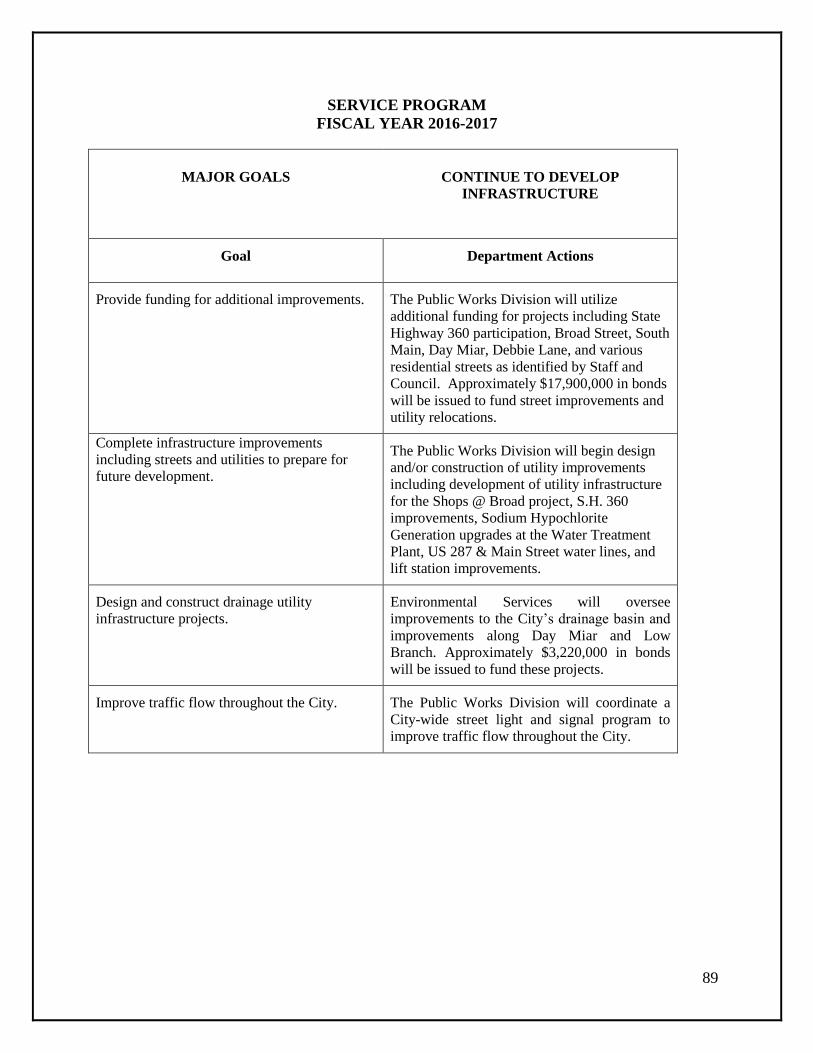
89
SERVICE PROGRAM
FISCAL YEAR 2016-2017
MAJOR GOALS
CONTINUE TO DEVELOP
INFRASTRUCTURE
Goal
Department Actions
Provide funding for additional improvements. The Public Works Division will utilize
additional funding for projects including State
Highway 360 participation, Broad Street, South
Main, Day Miar, Debbie Lane, and various
residential streets as identified by Staff and
Council. Approximately $17,900,000 in bonds
will be issued to fund street improvements and
utility relocations.
Complete infrastructure improvements
including streets and utilities to prepare for
future development.
The Public Works Division will begin design
and/or construction of utility improvements
including development of utility infrastructure
for the Shops @ Broad project, S.H. 360
improvements, Sodium Hypochlorite
Generation upgrades at the Water Treatment
Plant, US 287 & Main Street water lines, and
lift station improvements.
Design and construct drainage utility
infrastructure projects. Environmental Services will oversee
improvements to the City’s drainage basin and
improvements along Day Miar and Low
Branch. Approximately $3,220,000 in bonds
will be issued to fund these projects.
Improve traffic flow throughout the City. The Public Works Division will coordinate a
City-wide street light and signal program to
improve traffic flow throughout the City.

90
SERVICE PROGRAM
FISCAL YEAR 2016-2017
MAJOR GOALS
MAINTAIN HIGH QUALITY
DEVELOPMENT
Goal
Department Actions
Maintain existing planning and zoning
requirements. The Planning and Building Services Divisions
will ensure all developments comply with
existing planning and building standards.
Work with the development community to
provide responsive, consistent zoning. The Planning and Building Services Divisions
will ensure that each developer understands the
planning and zoning requirements and be
responsive to any questions relating the City’s
current standards.
Discuss and develop incentives to developers
for high quality projects. The Mansfield Economic Development
Corporation will identify projects that may
qualify for funding of various high quality
projects.
Develop alternative funding sources and
developer participation wherever possible. City Council approved TIRZ funding areas
within the City to create an economic
mechanism to fund infrastructure improvements
and expand those areas within the City.
Continued developer participation will be
encouraged wherever possible.
Continue to develop and monitor the City’s
development guidelines to ensure quality
projects and maintain property values.
The Planning, Building Services and Public
Works Divisions will review all plans
submitted and ensure compliance with
architectural standards, setback requirements,
signage and square footage requirements. The
Development Review Committee will review
each project to ensure all projects meet
established guidelines.

91
SERVICE PROGRAM
FISCAL YEAR 2016-2017
MAJOR GOALS
ENHANCE PUBLIC SAFETY
Goal
Department Actions
Provide funding for four new police positions
and three firefighter/paramedics. City Council and Management will provide
funding for the City’s additional Police and
Fire positions to ensure a high level of public
safety throughout the City.
Maintain and improve response times
throughout the City. The addition of Police and Fire positions will
enable the departments to provide additional
staff both in Patrol and Fire Operations.
Provide equipment and vehicles to ensure
Police and Fire Divisions are able to respond to
calls without service interruption.
Funds will be made available for
approximately $707,805 in new vehicles and
equipment in the Police and Fire Divisions.
Provide Emergency Medical Dispatching and
Computerized Dispatch Mapping. Funding will be made available for
approximately $263,000 to provide
Computerized Dispatch Mapping and
Emergency Dispatch Mapping.
Maintain and enhance the training in all public
safety departments. Maintain a high level of training to provide
Mansfield citizens with a professional public
safety workforce.
Maintain and improve Emergency
Management.
Ensure that Emergency Management and
Response procedures are in place to respond to
public safety emergencies, weather events and
natural disasters.

92
SERVICE PROGRAM
FISCAL YEAR 2016-2017
MAJOR GOALS
CREATE A TOTAL LIVING
ENVIRONMENT
Goal
Department Actions
Alleviate congestion at intersections of major
highways and roads with consideration of
future needs along Broad Street, Downtown
and State Highway 360.
The Public Works Division will continue to
make improvements along Broad Street,
Highway 287, State Highway 360 and
Downtown to reduce congestion.
Continue to maintain the “Best Parks System.” The Public Grounds Department and the
MPFDC will expand maintenance of existing
parks and public grounds by expanding
irrigated medians and making improvements to
the existing park program.
Continue to maintain a “Superior” Water &
Sewer System. The Utility Division will continue to expand
the use of the latest technology to provide
service delivery to all areas of the City. The
Utilities Division will continue to expand the
conservation programs, reduce costs utilizing
the latest technology and monitor flow patterns
throughout the City.
Continue to revitalize downtown. The Public Works Division and Community
Services Division will complete improvements
to Pond Branch and open up additional walking
and restaurant venues downtown.
Promote the Arts by creating an Art’s Council
and staff to develop the Arts throughout the
community.
Community Services will add one additional
Art’s Council staff person to promote the Arts
activities throughout the City.

93
SERVICE PROGRAM
FISCAL YEAR 2016-2017
MAJOR GOALS
CREATE A TOTAL LIVING
ENVIRONMENT
Goal
Department Actions
Create new public/private partnerships to
provide new recreation venues within the City. The Business Services Division, MPFDC, and
Development Services Division will oversee
projects to construct two public/private
partnerships: Fieldhouse USA and the Dallas
Stars recreational ice rink.
Provide recreation venues to opportunities for
all citizens. The Fieldhouse project is under construction
and will be completed in 2017. The Dallas
Stars project will begin construction in FY
2017-2018.
Improve the City’s existing park system.
Design and construction will begin on upgrades
to Chandler Park, Phillip Thompson Sports
Complex, McKnight West, McClendon West,
Mansfield Sports Complex, Pond Branch and
bike route improvements.
Coordinate with existing partners to improve
current partnerships. Continue to enhance existing public/private
partnerships including Big League Dreams,
Hawaiian Falls and the Mansfield National
Golf Course by promoting these venues
through the City’s Communications and
Marketing Department.
Partner with the Mansfield Independent School
District whenever possible.
The City will continue to partner with the
Mansfield Independent School District for joint
recreational and sporting events.

94
SERVICE PROGRAM
FISCAL YEAR 2016-2017
MAJOR GOALS
MAINTAIN THE AA+ BOND RATING
Goal
Department Actions
Issue debt only in amounts approximate to debt
being paid off. City Administration and the Business Services
Division will maintain current debt ratios while
continuing to maintain the current fund balance
policy of 25% of operating expenditures.
Ensure expenditures are in line with revenues. Maintain a balanced budget in all funds. Ensure
operational and staff additions do not exceed
budgeted projections or extend the City’s
ability to adequately provide for infrastructure
improvements in a growing local economy.
Create opportunity for expanded revenues. Review the current fee structure including
ambulance fees, developer fees and other fees
to generate additional revenue.
Limit the tax burden on taxpayers.
Continue to retain existing commercial business
and create opportunity/incentives for new retail
and residential developments. Increase quality
projects.
Continue to encourage economic development
throughout the City. The City will encourage quality residential and
commercial development to ensure average
home values continue to rise and commercial
developments provide opportunities for citizens
to utilize retail establishments within the City
of Mansfield.
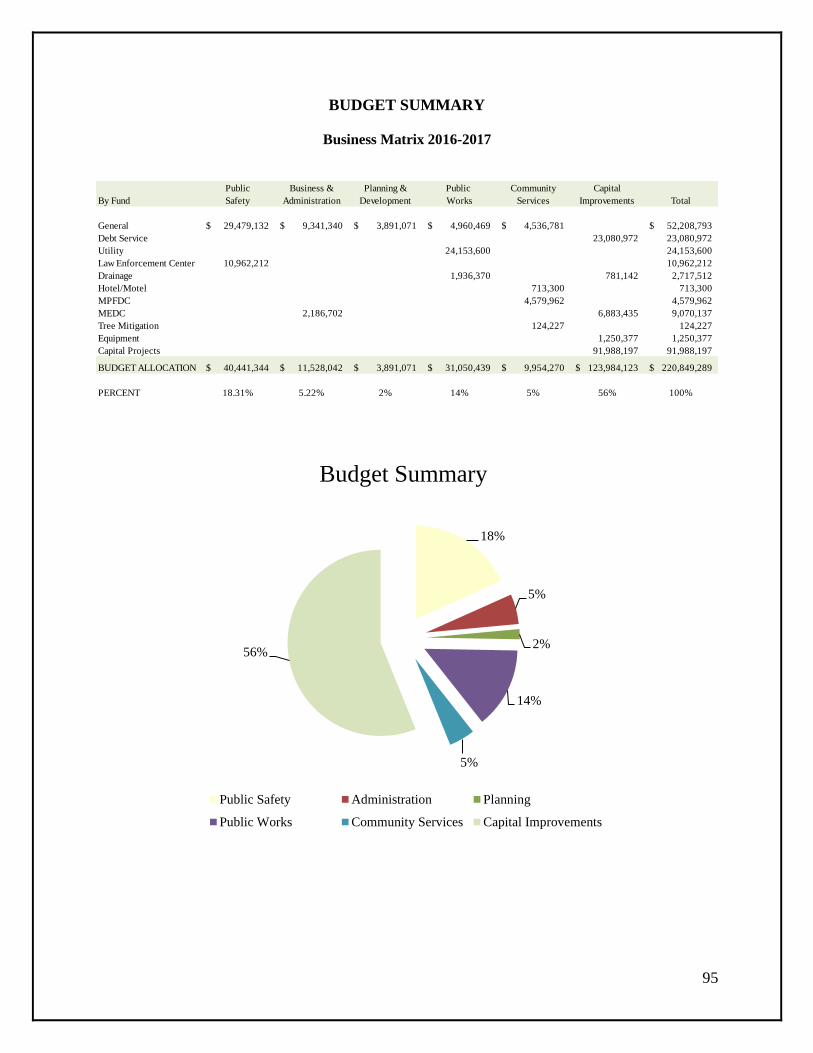
95
BUDGET SUMMARY
Business Matrix 2016-2017
Public Business & Planning & Public Community Capital
By Fund Safety Administration Development Works Services Improvements Total
General 29,479,132$ 9,341,340$ 3,891,071$ 4,960,469$ 4,536,781$ 52,208,793$
Debt Service 23,080,972 23,080,972
Utility 24,153,600 24,153,600
Law Enforcement Center 10,962,212 10,962,212
Drainage 1,936,370 781,142 2,717,512
Hotel/Motel 713,300 713,300
MPFDC 4,579,962 4,579,962
MEDC 2,186,702 6,883,435 9,070,137
Tree Mitigation 124,227 124,227
Equipment 1,250,377 1,250,377
Capital Projects 91,988,197 91,988,197
BUDGET ALLOCATION 40,441,344$ 11,528,042$ 3,891,071$ 31,050,439$ 9,954,270$ 123,984,123$ 220,849,289$
PERCENT 18.31% 5.22% 2% 14% 5% 56% 100%
18%
5%
2%
14%
5%
56%
Budget Summary
Public Safety Administration Planning
Public Works Community Services Capital Improvements

96
BU
DG
ET
SU
MM
AR
Y-A
LL
FU
ND
S C
OM
BIN
ED
FIS
CA
L Y
EA
R 2
01
6-2
01
7
20
16
-20
17
20
15
-20
16
20
14
-20
15
Specia
l D
ebt
Capit
al
Bu
dg
et
Bu
dg
et
Actu
al
Gen
eral
Reve
nu
eS
ervi
ce
Proje
cts
En
terpris
eA
ll F
un
dA
ll F
un
dA
ll F
un
d
Fu
nd
Fu
nds
Fu
nds
Fu
nds*
Fu
nds
Types
Types
Types
SO
UR
CE
S
Pro
pert
y T
axe
s27,6
05,9
07
$
13,3
49,6
13
$
40,9
55,5
20
$
37,3
34,4
36
$
34,7
18,6
13
$
Gen
era
l S
ale
s &
Use T
ax
10,5
89,9
88
7,9
79,3
03
3,1
43,9
55
21,7
13,2
46
20,5
09,3
69
21,1
44,5
48
Fra
nch
ise T
axe
s6,5
85,9
32
6,5
85,9
32
6,5
61,6
45
6,5
37,0
35
Fin
es &
Fees
2,5
26,2
41
528,1
70
2,4
69,5
40
5,5
23,9
51
2,5
25,4
27
3,8
35,4
97
Ch
arg
es f
or
Serv
ices
1,1
07,4
32
6,0
59,2
34
40,7
78,9
86
47,9
45,6
52
40,9
11,4
60
46,9
78,5
16
Lic
en
ses &
Perm
its
1,5
56,2
11
1,5
56,2
11
2,2
02,3
34
1,8
24,8
09
Inte
rest
8,0
00
5,0
00
971
13,9
71
5,0
00
62,7
95
Inte
rgo
vern
men
tal R
ev
en
ues
-
Mis
cellan
eo
us R
ev
en
ue
1,9
05,3
18
17,1
30,3
78
3,2
20,0
00
22,2
55,6
96
1,5
21,3
50
8,6
81,5
43
Bo
nd
Pro
ceed
s &
Pri
or
Year
Pro
jects
*70,9
88,2
39
70,9
88,2
39
70,6
25,8
64
12,9
52,9
13
Gra
nt
Pro
ceed
s &
Co
ntr
ibu
tio
ns
222,6
82
2,6
64
225,3
46
-
-
Imp
act
Fees
700,0
00
1,1
00,0
00
1,8
00,0
00
1,6
00,0
00
3,4
81,9
16
Op
era
tin
g T
ran
sfe
rs I
n1,2
08,5
14
1,2
08,5
14
810,5
32
1,8
34,2
50
TO
TA
L S
OU
RC
ES
52,2
08,7
93
26,2
24,7
77
23,0
80,9
72
71,6
88,2
39
47,5
69,4
97
220,7
72,2
78
184,6
07,4
17
142,0
52,4
35
US
ES
Sala
ry &
Ben
efi
ts36,1
29,5
80
3,1
59,3
83
14,8
82,4
80
54,1
71,4
43
50,5
41,2
36
46,1
18,5
96
Su
pp
lies
7,3
95,0
34
6,8
71,1
49
22,9
55,8
31
37,2
22,0
14
28,2
52,9
72
38,5
22,9
73
Co
nta
ctu
ral S
erv
ices
6,9
99,5
33
469,7
08
7,4
69,2
41
7,7
23,4
74
7,5
93,0
53
Cap
ital O
utl
ay
& P
rio
r Y
ear
Pro
jects
15,1
89,5
18
72,1
76,0
41
6,8
63,9
17
94,2
29,4
76
74,7
75,4
22
21,6
34,0
72
Eco
no
mic
In
cen
tiv
es
414,7
36
414,7
36
Reserv
e64,0
60
2,8
67,2
69
2,9
31,3
29
Cu
ltu
ral S
erv
ices
-
278,9
15
Deb
t S
erv
ice
23,0
80,9
72
23,0
80,9
72
21,6
70,4
26
24,3
81,4
16
Op
era
tin
g T
ran
sfe
rs O
ut
1,2
05,8
50
1,2
05,8
50
1,6
43,8
86
3,4
99,5
46
TO
TA
L U
SE
S52,2
08,7
93
25,6
89,7
58
23,0
80,9
72
72,1
76,0
41
47,5
69,4
97
220,7
25,0
61
184,6
07,4
16
142,0
28,5
71
TO
TA
L S
OU
RC
ES
/(U
SE
S)
(0)
535,0
19
0
(487,8
02)
0
47,2
18
0
BE
GIN
NIN
G N
ET
AS
SE
TS
12,0
20,3
82
16,6
27,1
13
5,2
27,0
66
27,0
17,3
53
158,4
64,8
08
218,1
27,3
35
218,1
27,3
35
218,1
03,4
71
Adju
stm
en
ts(0
)
00
00
00
23,8
64
EN
DIN
G N
ET
AS
SE
TS
12,0
20,3
82
$
16,6
27,1
13
$
5,2
45,1
01
$
27,0
17,3
53
$
158,4
64,8
08
$
218,1
74,5
53
$
218,1
27,3
35
$
218,1
27,3
35
$
*In
clu
des p
roceed
s f
rom
pre
vio
us b
on
d issu
es a
nd
rem
ain
ing
fu
nd
ing
fo
r o
n-g
oin
g p
roje
cts
.
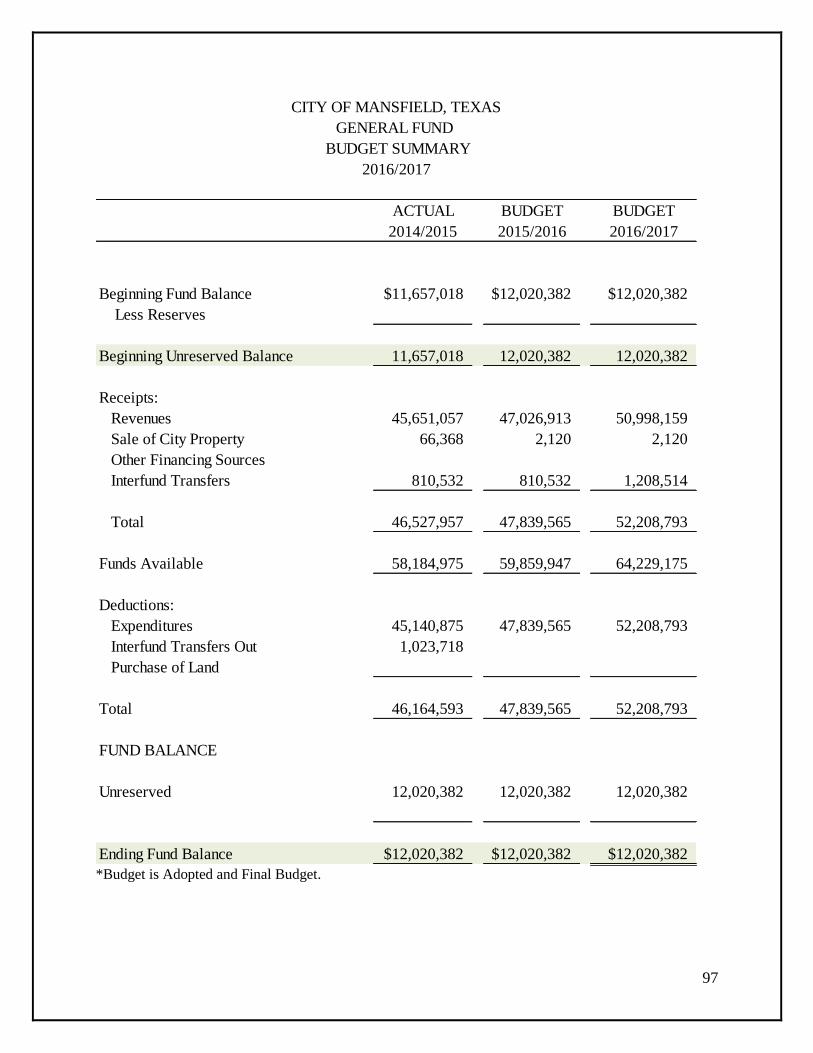
97
*Budget is Adopted and Final Budget.
ACTUAL BUDGET BUDGET
2014/2015 2015/2016 2016/2017
Beginning Fund Balance $11,657,018 $12,020,382 $12,020,382
Less Reserves
Beginning Unreserved Balance 11,657,018 12,020,382 12,020,382
Receipts:
Revenues 45,651,057 47,026,913 50,998,159
Sale of City Property 66,368 2,120 2,120
Other Financing Sources
Interfund Transfers 810,532 810,532 1,208,514
Total 46,527,957 47,839,565 52,208,793
Funds Available 58,184,975 59,859,947 64,229,175
Deductions:
Expenditures 45,140,875 47,839,565 52,208,793
Interfund Transfers Out 1,023,718
Purchase of Land
Total 46,164,593 47,839,565 52,208,793
FUND BALANCE
Unreserved 12,020,382 12,020,382 12,020,382
Ending Fund Balance $12,020,382 $12,020,382 $12,020,382
GENERAL FUND
BUDGET SUMMARY
2016/2017
CITY OF MANSFIELD, TEXAS

98
ACTUAL BUDGET BUDGET
2014/2015 2015/2016 2016/2017
TAXES:
Ad Valorem Taxes
Current Year 22,556,558$ 24,103,364$ 27,288,571$
Delinquent 180,524 200,000 144,330
Penalty & Interest 150,664 200,000 173,006
TOTAL 22,887,746 24,503,364 27,605,907
Sales & Use Taxes
General Sales Tax 9,708,973 9,574,913 10,409,957
Mix Drinks Tax 173,761 135,000 180,031
TOTAL 9,882,734 9,709,913 10,589,988
Franchise Taxes
Gas 276,354 358,727 273,111
Telephone 183,817 193,000 183,000
TXU Electric 2,225,069 2,268,716 2,268,715
Cable Television 948,894 840,000 937,000
Sanitation 2,691,420 2,691,202 2,718,334
Telephone Lines 87,251 105,000 105,654
Gas Royalty Income 24,542 - -
Johnson Co. Electric 99,688 105,000 100,118
TOTAL 6,537,035 6,561,645 6,585,932
TOTAL TAXES 39,307,515 40,774,922 44,781,827
LICENSES & PERMITS:
Electrical Licenses 52,500 40,000 48,000
Building Permits 1,244,467 1,967,554 1,048,020
Plumbing Permits 128,241 40,072 110,000
Electrical Permits 157,770 40,448 140,448
Miscellaneous Permits 241,831 114,260 209,743
TOTAL LICENSES &
PERMITS 1,824,809 2,202,334 1,556,211
CITY OF MANSFIELD, TEXAS
GENERAL FUND
SCHEDULE OF REVENUES
2016/2017
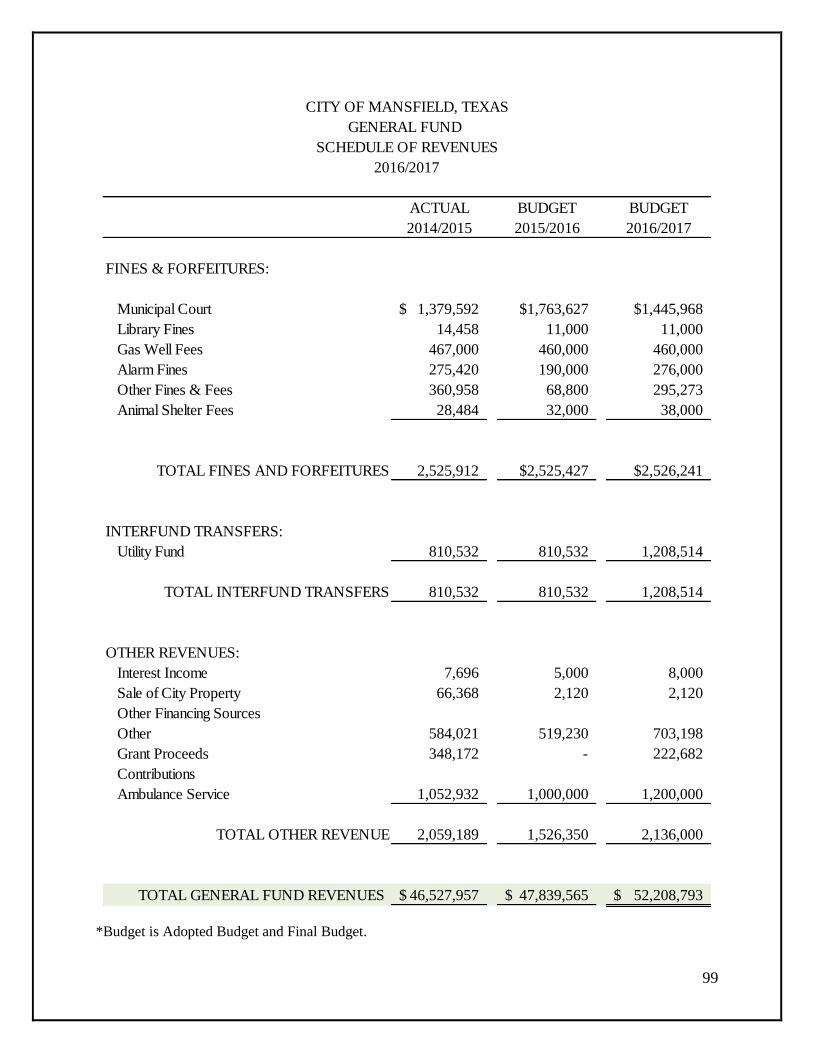
99
*Budget is Adopted Budget and Final Budget.
ACTUAL BUDGET BUDGET
2014/2015 2015/2016 2016/2017
FINES & FORFEITURES:
Municipal Court 1,379,592$ $1,763,627 $1,445,968
Library Fines 14,458 11,000 11,000
Gas Well Fees 467,000 460,000 460,000
Alarm Fines 275,420 190,000 276,000
Other Fines & Fees 360,958 68,800 295,273
Animal Shelter Fees 28,484 32,000 38,000
TOTAL FINES AND FORFEITURES 2,525,912 $2,525,427 $2,526,241
INTERFUND TRANSFERS:
Utility Fund 810,532 810,532 1,208,514
TOTAL INTERFUND TRANSFERS 810,532 810,532 1,208,514
OTHER REVENUES:
Interest Income 7,696 5,000 8,000
Sale of City Property 66,368 2,120 2,120
Other Financing Sources
Other 584,021 519,230 703,198
Grant Proceeds 348,172 - 222,682
Contributions
Ambulance Service 1,052,932 1,000,000 1,200,000
TOTAL OTHER REVENUE 2,059,189 1,526,350 2,136,000
TOTAL GENERAL FUND REVENUES 46,527,957$ 47,839,565$ 52,208,793$
2016/2017
GENERAL FUND
SCHEDULE OF REVENUES
CITY OF MANSFIELD, TEXAS

100
REVENUE BY MAJOR SOURCE
EXPENDITURE BY MAJOR FUNCTION
$0
$5,000,000
$10,000,000
$15,000,000
$20,000,000
$25,000,000
$30,000,000
2014 2015 Budget 2016 Budget 2017
Property Tax Sales Tax Franchise TaxLicenses & Permits Fines & Forfeitures Interfund TransfersOther
$0
$5,000,000
$10,000,000
$15,000,000
$20,000,000
$25,000,000
$30,000,000
$35,000,000
2014 2015 Budget 2016 Budget 2017
Public Safety Administrative Community Services
Public Works Planning & Development
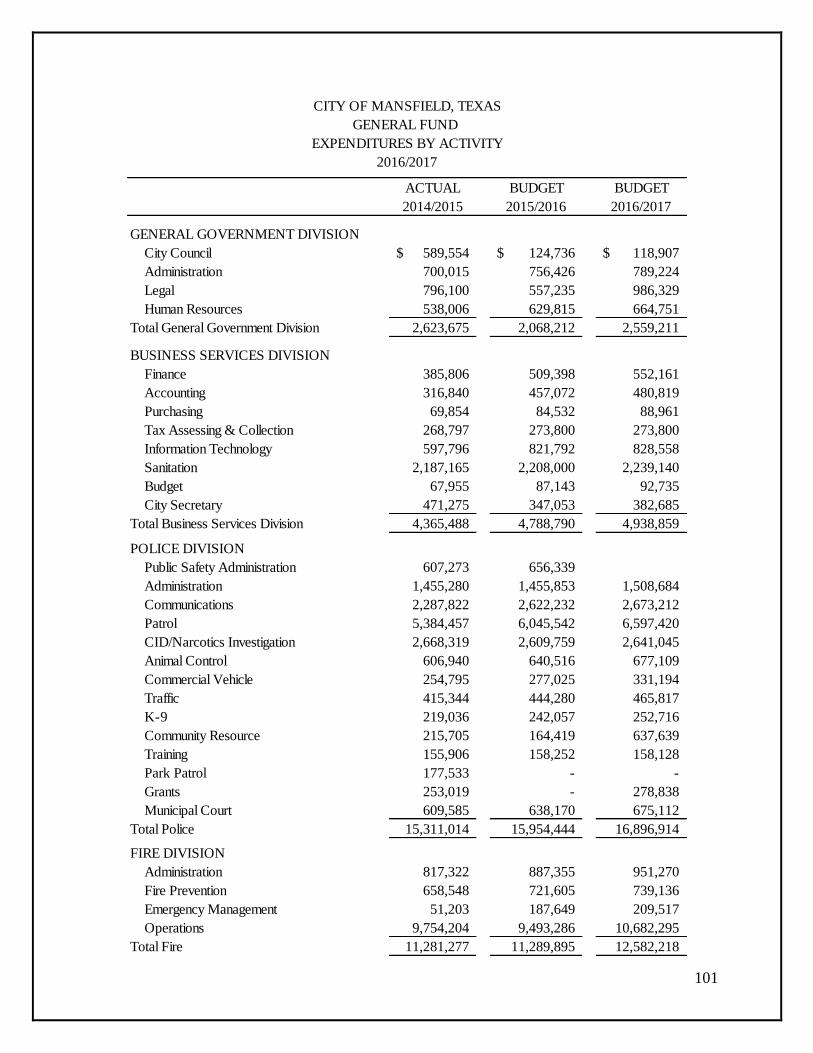
101
ACTUAL BUDGET BUDGET
2014/2015 2015/2016 2016/2017
GENERAL GOVERNMENT DIVISION
City Council 589,554$ 124,736$ 118,907$
Administration 700,015 756,426 789,224
Legal 796,100 557,235 986,329
Human Resources 538,006 629,815 664,751
Total General Government Division 2,623,675 2,068,212 2,559,211
BUSINESS SERVICES DIVISION
Finance 385,806 509,398 552,161
Accounting 316,840 457,072 480,819
Purchasing 69,854 84,532 88,961
Tax Assessing & Collection 268,797 273,800 273,800
Information Technology 597,796 821,792 828,558
Sanitation 2,187,165 2,208,000 2,239,140
Budget 67,955 87,143 92,735
City Secretary 471,275 347,053 382,685
Total Business Services Division 4,365,488 4,788,790 4,938,859
POLICE DIVISION
Public Safety Administration 607,273 656,339
Administration 1,455,280 1,455,853 1,508,684
Communications 2,287,822 2,622,232 2,673,212
Patrol 5,384,457 6,045,542 6,597,420
CID/Narcotics Investigation 2,668,319 2,609,759 2,641,045
Animal Control 606,940 640,516 677,109
Commercial Vehicle 254,795 277,025 331,194
Traffic 415,344 444,280 465,817
K-9 219,036 242,057 252,716
Community Resource 215,705 164,419 637,639
Training 155,906 158,252 158,128
Park Patrol 177,533 - -
Grants 253,019 - 278,838
Municipal Court 609,585 638,170 675,112
Total Police 15,311,014 15,954,444 16,896,914
FIRE DIVISION
Administration 817,322 887,355 951,270
Fire Prevention 658,548 721,605 739,136
Emergency Management 51,203 187,649 209,517
Operations 9,754,204 9,493,286 10,682,295
Total Fire 11,281,277 11,289,895 12,582,218
CITY OF MANSFIELD, TEXAS
GENERAL FUND
EXPENDITURES BY ACTIVITY
2016/2017

102
ACTUAL BUDGET BUDGET
2014/2015 2015/2016 2016/2017
PLANNING DIVISION
Administration 823,641$ 990,481$ 1,040,798$
Planning & Zoning Commission 9,190 13,441 11,581
Historic Landmark Commission 932 4,563 4,320
Board of Adjustments 1,219 3,135 3,274
Total Planning Division 834,982 1,011,620 1,059,973
DEVELOPMENT SERVICES DIVISION
Code Enforcement & Inspections 1,273,421 1,623,433 1,784,119
Building Maintenance 889,386 1,086,639 1,046,977
Total Development Services Division 2,162,807 2,710,072 2,831,096
PUBLIC WORKS DIVISION
Engineering 445,988 418,760 418,812
Street Maintenance 2,675,453 3,189,159 3,300,332
Traffic Control 1,073,196 1,129,884 1,241,325
Total Public Works Division 4,194,637 4,737,803 4,960,469
COMMUNITY SERVICES DIVISION
Senior Lifestyles 255,223 268,834 285,009
Communications & Marketing 400,155 332,753 335,767
Public Grounds 1,849,103 2,214,703 2,361,491
Library 750,451 1,015,526 1,067,080
Historical Services 39,983 54,474 67,913
Arts Commission - - 130,852
Cultural Services 232,314 268,625 288,670
Total Community Services Division 3,527,229 4,154,915 4,536,782
NON-DEPARTMENTAL
Land Purchase 72,950 - -
Other Operating Expenses 359,204 290,460 637,421
Transfer to Other Funds 1,431,329 833,354 1,205,850
Total Non-Departmental 1,863,483 1,123,814 1,843,271
TOTAL EXPENDITURES 46,164,592$ 47,839,565$ 52,208,793$
EXPENDITURES BY ACTIVITY
2016/2017
GENERAL FUND
CITY OF MANSFIELD, TEXAS

103
*Budget is Adopted Budget and Final Budget.
ACTUAL BUDGET BUDGET
2014/2015 2015/2016 2016/2017
Beginning Fund Balance 855,768$ 726,099$ 731,099$
Additions:
Property Taxes, Current 11,830,867 12,831,072 13,349,613
Prior Year Delinquent Taxes
Miscellaneous
Bond Proceeds
Interest Earnings 432
Total 11,831,299 12,831,072 13,349,613
Funds Available 12,687,067 13,557,171 14,080,712
Deductions:
Bond Principal 7,450,000 8,415,000 8,865,000
Bond Interest 4,112,371 4,411,072 4,484,613
Capital Lease Payments
Bond Issuance Costs 155,800
Refunding Bonds issued (11,700,000)
Payment to refund bond agent 12,940,000
Premium on bonds issued (1,773,891)
Discount on bonds issued 68,304
Fiscal charges 708,384
Total 11,960,968 12,826,072 13,349,613
Ending Fund Balance 726,099$ 731,099$ 731,099$
GENERAL DEBT SERVICE FUND
BUDGET SUMMARY
2016/2017
CITY OF MANSFIELD, TEXAS

104
WATER & SEWER FUND
WORKING CAPITAL
2016/2017
ACTUAL BUDGET BUDGET
2014/2015 2015/2016 2016/2017
Working Capital, Beginning 16,360,730$ 24,640,885$ 27,902,531
Additions:
Water Sales 17,105,911 17,065,051 17,616,943
Sewer Service 9,790,377 10,739,588 11,157,249
Charges for Services 835,653 784,959 820,026
Impact Fees - -
Contributions 2,221,176
Other Income 124,167 226,956 222,556
Total 30,077,284 28,816,554 29,816,774
Funds Available 46,438,014 53,457,439 57,719,305
Deductions:
Operating Expenses 17,096,059 18,685,521 20,265,353
Capital Outlay (258,625) (194,579)
Total 17,096,059 18,426,896 20,070,774
Debt Requirements:
Current Maturities 4,095,000 3,630,000 4,020,000
Interest & Fiscal Charges 2,183,331 2,231,826 2,049,234
Total 6,278,331 5,861,826 6,069,234
Other Changes Net Increase (Decrease):
Restricted Assets 1,560,616
Interest Earnings on Restricted Assets (16,645) (971) (971)
Transfers/Reserves 1,008,532 1,406,513
Total 1,543,971 1,007,561 1,406,513
Working Capital, Ending 24,640,885 27,902,531 29,979,176
Debt Service Coverage:
Operating Revenues 30,077,284 28,817,525 29,817,745
Reserves 2,650,209 2,086,645
Net increase on Restricted Assets 971 971
Less: Operating Expenses (17,096,059) (18,685,521) (20,265,353)
Net Income Available 12,981,225 12,783,184 11,640,008
Annual Debt Service Requirement 6,278,331$ 5,861,826$ 6,069,234$
Coverage Factor 2.07 2.18 1.92
Maximum Annual Requirement 6,343,514$ 6,324,720$ 6,059,234$
Covrage Factor 2.05 2.02 1.92
Annual Coverage Requirements 4,256,649$ 4,295,506$ 3,236,984$
Coverage Factor 3.05 2.98 3.60

105
*Budget is Adopted Budget and Final Budget.
2016/2017
ACTUAL BUDGET BUDGET
2014/2015 2015/2016 2016/2017
Water Sales 17,105,911$ 17,065,051$ 17,616,943$
Sewer Service 9,790,377 10,739,588 11,157,249
Water Penalties 531,157 556,502 556,502
Water Taps 9,638 21,379 21,379
Meter Set Fee 88,115 65,624 65,624
Restore Service Fee 108,405 93,954 125,021
Sewer Taps 2,770 1,500 1,500
Utility/Inspect/Pretreatment 130,563 76,000 80,000
Contributions 2,221,176
Miscellaneous/Transfers 89,172 196,956 192,556
Total 30,077,284$ 28,816,554$ 29,816,774$
Interest Income 16,645 971 971
TOTAL 30,093,929 28,817,525 29,817,745
CITY OF MANSFIELD, TEXAS
WATER & SEWER FUND REVENUES
BUDGET SUMMARY

106
*Budget is Adopted Budget and Final Budget.
2016/2017
ACTUAL BUDGET BUDGET
2014/2015 2015/2016 2016/2017
Administration 794,985$ 907,492$ 1,115,305$
Billing and Collections 870,247 981,412 1,029,818
Meter Reading and Repairs 748,173 896,530 973,740
Water Distribution 1,031,489 896,376 943,198
Wastewater Collection 6,119,999 6,545,042 7,083,243
Water Quality Control 6,622,513 7,602,733 8,420,452
Other Operating Expenses 908,653 855,936 699,597
Total Operating Expenses 17,096,059 18,685,521 20,265,353
Depreciation 3,858,313
Operating Transfers Out 1,774,608 1,008,532 1,406,513
Debt Service 2,581,696 5,861,826 -
Reserve 2,650,209 2,086,645
8,214,617 9,520,567 3,493,158
TOTAL EXPENSES 25,310,676$ 28,206,088$ 23,758,511$
CITY OF MANSFIELD, TEXAS
WATER & SEWER FUND EXPENSES
BUDGET SUMMARY

107
$0
$2,000,000
$4,000,000
$6,000,000
$8,000,000
$10,000,000
$12,000,000
$14,000,000
$16,000,000
$18,000,000
$20,000,000
2013 2014 2015 Budget 2016 Budget 2017
Water & Sewer Revenue
Water Revenue Sewer Revenue
$0
$1,000,000
$2,000,000
$3,000,000
$4,000,000
$5,000,000
$6,000,000
$7,000,000
2013 2014 2015 Budget 2016 Budget 2017
Water & Sewer Expenses
Water Purchase Sewer Treatment

108
*Budget is Adopted Budget and Final Budget.
2016/2017
ACTUAL BUDGET BUDGET
2014/2015 2015/2016 2016/2017
Beginning Net Assets 4,104,652$ 4,612,364$ 4,612,364$
Additions:
Utility Operating 6,769,398 5,861,826 6,059,234
Interest Income 16,645
Total 6,786,043 5,861,826 6,059,234
Assets Available 10,890,695 10,474,190 10,671,598
Deductions:
Transfer to Operating Fund
Bond Principal 4,095,000 3,630,000 4,020,000
Bond Interest 2,183,331 2,231,826 2,039,234
Proceeds from Capital Debt
Paying Agents Fees -
Total 6,278,331 5,861,826 6,059,234
Ending Net Assets 4,612,364$ 4,612,364$ 4,612,364$
WATER & SEWER DEBT SERVICE FUND
BUDGET SUMMARY
CITY OF MANSFIELD, TEXAS
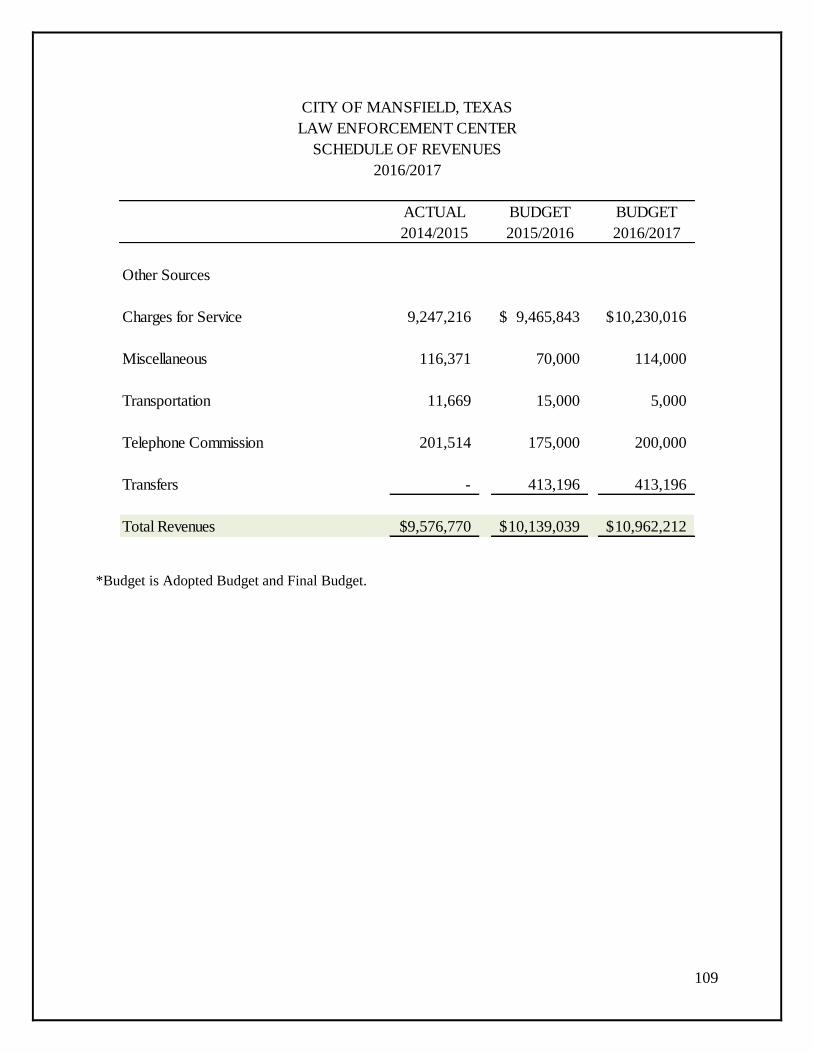
109
*Budget is Adopted Budget and Final Budget.
ACTUAL BUDGET BUDGET
2014/2015 2015/2016 2016/2017
Other Sources
Charges for Service 9,247,216 9,465,843$ 10,230,016$
Miscellaneous 116,371 70,000 114,000
Transportation 11,669 15,000 5,000
Telephone Commission 201,514 175,000 200,000
Transfers - 413,196 413,196
Total Revenues $9,576,770 10,139,039$ 10,962,212$
LAW ENFORCEMENT CENTER
SCHEDULE OF REVENUES
2016/2017
CITY OF MANSFIELD, TEXAS

110
*Budget is Adopted Budget and Final Budget.
ACTUAL BUDGET BUDGET
2014/2015 2015/2016 2016/2017
Administration 301,378$ 294,420$ 309,866$
Operations 5,800,324 5,846,732 6,442,058
City Marshal 1,735,692 1,866,053 1,946,311
Support Services 969,080 1,041,045 1,061,507
Food Services 491,128 499,298 498,568
Medical Services 533,223 591,491 703,902
Other Operating Expenses 221,367 - -
Total Operating Expenses 10,052,192 10,139,039 10,962,212
Depreciation 264,372 - -
Debt Service 40,604 - -
Sub-Total 304,976 - -
Total Expenses 10,357,168$ 10,139,039$ 10,962,212$
LAW ENFORCEMENT CENTER
SCHEDULE OF EXPENSES
2016/2017
CITY OF MANSFIELD, TEXAS

111
*Budget is Adopted Budget and Final Budget.
ACTUAL BUDGET BUDGET
2014/2015 2015/2016 2016/2017
Beginning Net Assets 4,345,009$ 4,848,439$ 4,848,439$
Additions:
Drainage Fee 1,309,585 1,308,471 2,469,540
Grant Revenue
Interest Income 517
Other Income 451,799 3,220,000
Total 1,761,901 1,308,471 5,689,540
Assets Available 6,106,910 6,156,910 10,537,979
Deductions:
Administrative 328,809 536,187 1,028,954
Transferred to Debt Service 278,508 527,970 -
Operations 534,279 113,721
Project Appropriations 3,220,000
Reserve 780,624
Depreciation Expense 116,875
Bond Coverage 130,593 131,792
Total 1,258,471 1,308,471 5,161,370
Ending Net Assets 4,848,439$ 4,848,439$ 5,376,609$
CITY OF MANSFIELD, TEXAS
ENVIRONMENTAL SERVICES FUND
BUDGET SUMMARY
2016/2017

112
*Budget is Adopted Budget and Final Budget.
ACTUAL BUDGET BUDGET
2014/2015 2015/2016 2016/2017
Beginning Net Assets 78,339$ 89,051$ 94,051$
Additions:
Bond Proceeds - - -
Interest 517 - -
Drainage Fee 555,064 532,970 528,170
Total 555,581 532,970 528,170
Assets Available 633,920 622,021 622,221
Deductions:
Bond Principal 375,000 390,000 400,000
Bond Interest 169,869 137,970 128,170
Paying Agent Fees - - -
Total 544,869 527,970 528,170
Ending Net Assets 89,051$ 94,051$ 94,051$
CITY OF MANSFIELD, TEXAS
ENVIRONMENTAL SERVICES DEBT SERVICE FUND
BUDGET SUMMARY
2016/2017

113
*Budget is Adopted Budget and Final Budget.
ACTUAL BUDGET BUDGET
2014/2015 2015/2016 2016/2017
Beginning Fund Balance 817,866$ 1,143,496$ 1,143,496$
Additions:
Other Revenue
Taxes 717,284 641,425 713,300
Total 717,284 641,425 713,300
Funds Available 1,535,150 1,784,921 1,856,796
Deductions:
Other 143,802 283,425 320,620
Historical Preservation 26,364 35,000 34,680
CVB/Tourism 221,488 323,000 358,000
Total 391,654 641,425 713,300
Ending Fund Balance 1,143,496$ 1,143,496$ 1,143,496$
CITY OF MANSFIELD, TEXAS
SPECIAL REVENUE HOTEL/MOTEL FUND
BUDGET SUMMARY
2016/2017

114
*Budget is Adopted Budget and Final Budget.
ACTUAL BUDGET BUDGET
2014/2015 2015/2016 2016/2017
Beginning Fund Balance 935,003$ 550,264$ -$
Additions:
Fees
Other 742
Interest Earnings 172
Total 914
Funds Available 935,917 550,264
Deductions:
Operating Costs 385,653 550,264 -
Total 385,653 550,264 -
Ending Fund Balance 550,264$ -$ -$
SPECIAL REVENUE TREE MITIGATION FUND
BUDGET SUMMARY
2016/2017
CITY OF MANSFIELD, TEXAS

115
*Budget is Adopted Budget and Final Budget.
ACTUAL BUDGET BUDGET
2014/2015 2015/2016 2016/2017
Beginning Fund Balance 8,677,942$ 10,305,587$ 10,305,587$
Additions:
Sales Tax Revenue 3,608,684 3,545,353 3,263,808
Interest 4,583 3,000 3,000
Contributions 2,770 2,664
Other 1,031,793 61,620 203,058
Prior Year Funding
Bond Proceeds
Gas Royalty Income 331,673 150,000 150,000
Rental 1,027,050 1,017,922 957,432
Total 6,006,553 4,777,895 4,579,962
Funds Available 14,684,495 15,083,482 14,885,549
Deductions:
Administration 2,822,447 1,196,241 1,389,913
Operating Costs 712,039 3,581,654 2,327,490
Project Appropriation 844,422 - 862,559
Total 4,378,908 4,777,895 4,579,962
Ending Fund Balance 10,305,587$ 10,305,587$ 10,305,587$
CITY OF MANSFIELD, TEXAS
MANSFIELD PARK FACILITIES DEVELOPMENT CORPORATION
BUDGET SUMMARY
2016/2017

116
*Budget is Adopted Budget and Final Budget
BUDGET BUDGET BUDGET
2014/2015 2015/2016 2016/2017
Beginning Fund Balance 207,380$ 207,809$ 207,809$
Additions:
Sales Tax Revenue 1,245,803 1,242,104 1,941,171
Interest Income
Total 1,245,803 1,242,104 1,941,171
Funds Available 1,453,183 1,449,913 2,148,980
Deductions:
Bond Principal 805,000 835,000 1,035,000
Interest 440,374 407,104 906,171
Paying Agent Fees
Total 1,245,374 1,242,104 1,941,171
Ending Fund Balance 207,809$ 207,809$ 207,809$
MANSFIELD PARK FACILITIES DEVELOPMENT CORPORATION
REVENUE DEBT SERVICE FUND
BUDGET SUMMARY
2016/2017
CITY OF MANSFIELD, TEXAS

117
*Budget is Adopted Budget and Final Budget.
ACTUAL BUDGET BUDGET
2014/2015 2015/2016 2016/2017
Beginning Net Assets 11,661,265$ 4,629,514$ 4,629,514$
Additions:
Sales Tax Revenue 4,854,487 4,777,457 5,204,979
Prior Year Funding 5,183,286 16,927,320
Gain on Sale of Capital Assets 1,571
Gas Royalty Income 3,344
Interest 2,000 2,000
Total 4,859,402 9,962,743 22,134,299
Assets Available 16,520,667 14,592,257 26,763,813
Deductions:
Administration 783,838 921,373 976,943
Debt Payment 480,762 1,202,454 -
Transfer to other Funds 15,101 12,096 12,096
Project Appropriation 10,611,452 7,826,820 19,942,476
Total 11,891,153 9,962,743 20,931,515
Ending Net Assets 4,629,514$ 4,629,514$ 5,832,298$
CITY OF MANSFIELD, TEXAS
MANSFIELD ECONOMIC DEVELOPMENT CORPORATION
BUDGET SUMMARY
2016/2017

118
*Budget is Adopted Budget and Final Budget.
ACTUAL BUDGET BUDGET
2014/2015 2015/2016 2016/2017
Beginning Net Assets $0 $0 $0
Additions:
Sales Tax Revenue 1,316,318 1,202,454 1,202,784
Total 1,316,318 1,202,454 1,202,784
Assets Available 1,316,318 1,202,454 1,202,784
Deductions:
Bond Principal 760,000 905,000 920,000
Interest 556,318 297,454 282,784
Total 1,316,318 1,202,454 1,202,784
Ending Net Assets $0 $0 $0
MANSFIELD ECONOMIC DEVELOPMENT CORPORATION
REVENUE DEBT SERVICE FUND
BUDGET SUMMARY
2016/2017
CITY OF MANSFIELD, TEXAS

119
*Budget is Adopted Budget and Final Budget.
2016/2017
BUDGET BUDGET BUDGET
2014/2015 2015/2016 2016/2017
Beginning Net Assets -$ -$ -$
Additions:
Sale of City Property
Grant Revenue
Bond Proceeds 5,545,000 21,855,000 20,545,556
Transfer In
Interest Earnings
Total 5,545,000 21,855,000 20,545,556
Assets Available 5,545,000 21,855,000 20,545,556
Deductions
Project Appropriations 5,545,000 21,855,000 20,545,556
Transfers
Total 5,545,000 21,855,000 20,545,556
Ending Net Assets -$ -$ -$
CITY OF MANSFIELD, TEXAS
PARKS CONSTRUCTION
BUDGET SUMMARY
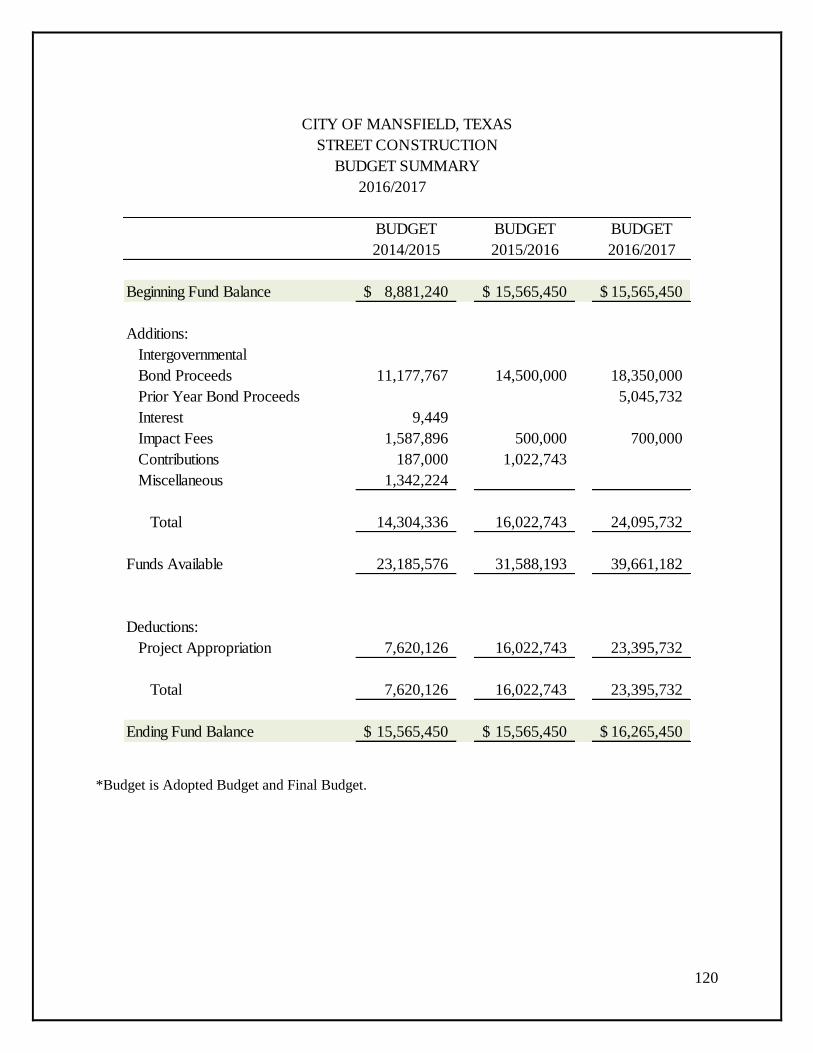
120
*Budget is Adopted Budget and Final Budget.
2016/2017
BUDGET BUDGET BUDGET
2014/2015 2015/2016 2016/2017
Beginning Fund Balance 8,881,240$ 15,565,450$ 15,565,450$
Additions:
Intergovernmental
Bond Proceeds 11,177,767 14,500,000 18,350,000
Prior Year Bond Proceeds 5,045,732
Interest 9,449
Impact Fees 1,587,896 500,000 700,000
Contributions 187,000 1,022,743
Miscellaneous 1,342,224
Total 14,304,336 16,022,743 24,095,732
Funds Available 23,185,576 31,588,193 39,661,182
Deductions:
Project Appropriation 7,620,126 16,022,743 23,395,732
Total 7,620,126 16,022,743 23,395,732
Ending Fund Balance 15,565,450$ 15,565,450$ 16,265,450$
CITY OF MANSFIELD, TEXAS
STREET CONSTRUCTION
BUDGET SUMMARY

121
*Budget is Adopted Budget and Final Budget.
2016/2017
BUDGET BUDGET BUDGET
2014/2015 2015/2016 2016/2017
Beginning Net Assets 14,861,347$ 8,230,234$ 8,230,234$
Additions:
Impact Fees 1,894,020 1,100,000 1,100,000
Bond proceeds 6,000,000 6,926,574
Interest Earnings 5,280 4,704
Miscellaneous Income
Contributions 6,615
Prior Year Funding 19,863,142
Transfer
Total 1,905,915 26,967,846 8,026,574
Assets Available 16,767,262 35,198,080 16,256,808
Deductions:
Project Appropriations 8,537,028 26,967,846 8,026,574
Total 8,537,028 26,967,846 8,026,574
Ending Net Assets 8,230,234$ 8,230,234$ 8,230,234$
CITY OF MANSFIELD, TEXAS
WATER & SEWER CONSTRUCTION
BUDGET SUMMARY
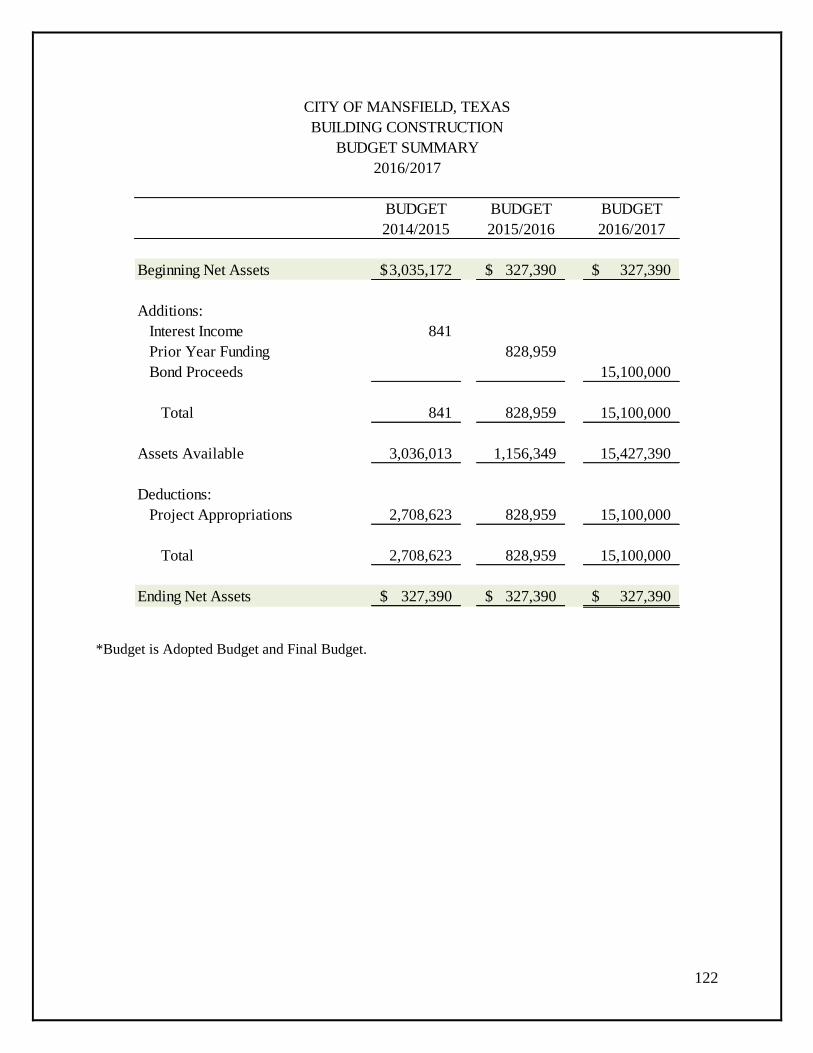
122
*Budget is Adopted Budget and Final Budget.
2016/2017
BUDGET BUDGET BUDGET
2014/2015 2015/2016 2016/2017
Beginning Net Assets 3,035,172$ 327,390$ 327,390$
Additions:
Interest Income 841
Prior Year Funding 828,959
Bond Proceeds 15,100,000
Total 841 828,959 15,100,000
Assets Available 3,036,013 1,156,349 15,427,390
Deductions:
Project Appropriations 2,708,623 828,959 15,100,000
Total 2,708,623 828,959 15,100,000
Ending Net Assets 327,390$ 327,390$ 327,390$
CITY OF MANSFIELD, TEXAS
BUILDING CONSTRUCTION
BUDGET SUMMARY

123
*Budget is Adopted Budget and Final Budget.
2016/2017
BUDGET BUDGET BUDGET
2014/2015 2015/2016 2016/2017
Beginning Net Assets 1,222,776$ 1,512,402$ -$
Additions:
Sale of City Property 22,293
Grant Revenue
Bond Proceeds 1,775,146 1,250,377
Miscellaneous Revenue
Transfers 1,023,718 1,245,551
Interest Earnings 18
Total 2,821,175 1,245,551 1,250,377
Assets Available 4,043,951 2,757,953 1,250,377
Deductions
Equipment 2,531,549 2,757,953 1,250,377
Transfers
Total 2,531,549 2,757,953 1,250,377
Ending Net Assets 1,512,402$ -$ -$
CITY OF MANSFIELD, TEXAS
EQUIPMENT REPLACEMENT
BUDGET SUMMARY

125
DEBT SERVICE FUND
The General Obligation Debt Service Fund is used to account for payment of principal and
interest on the City of Mansfield’s general obligation bonds and capital lease payments.
Revenue Debt Service Funds are used to account for Revenue Bonds whose principal and
interest are payable from earnings of the City of Mansfield’s Enterprise Funds.
Special Revenue Debt Service Funds are used to account for Sales Tax Revenue Bonds whose
principal and interest are payable from a special ½ ¢ sales tax.

126
CITY OF MANSFIELD DEBT MANAGEMENT POLICY
Purpose The City recognizes that effective management of the public’s funds is an investment of the public’s
funds within the community in which it serves. It is with this understanding that the City of Mansfield
establishes its debt policy to guide decision makers in investing the public’s money within the City of
Mansfield, Texas.
“Tax-exempt financing is used by state and local governments to raise capital to finance public capital
improvements and other projects, including infrastructure facilities that are vitally important to
sustained economic growth.”
- Tax-Exempt Financing, a Primer
It is upon this principal that the City of Mansfield, Texas determines the necessity to incur debt in order to
finance the Capital Improvement Program (CIP) of the City. The management of the City’s debt is vital
for maintaining the expected cost of services and the continued infrastructure development within this
community. With the incurrence of additional debt, the City is able to pay for the infrastructure needs of
the community without overly burdening the constituency in any given period by increasing or decreasing
the fee structure necessary to support the capital improvement. As a result, the management of the City’s
debt portfolio is designed to minimize the impact to its constituency.
Authorization The Constitution of the State of Texas and the general laws of the State of Texas allow for and permit
Texas cities, as authorized by the City, to issue direct obligations or bonds for the purpose of financing
improvements and capital assets.
Although the Federal Government does not govern local spending authority, it closely regulates and
monitors the types of issuances and the authority for issuance through the Federal Income Tax Code,
Sections 141 through 150. The Federal Income Tax Code restricts the nature and character of Bond
Interest in how it is treated as income for income tax reporting, thereby controlling and creating markets
for tax-exempt instruments.
Uses of Debt Financing and Capital Improvements
Debt financing shall be used to fund infrastructure improvements and the purchasing of capital
assets as long as the asset life of the improvement or capital asset is beyond the cost of financing
the improvement or the capital asset.
Debt financing shall be used as a funding source when the improvements or the purchase of
capital assets cannot be acquired from current revenue sources or direct fees like impact fees. In
addition, if the purchase of capital assets and construction of infrastructure improvements can be
funded through available resources (fund balance, current revenue or any other recurring revenue)
then the cost of money should be considered against the value of available resources in
determining pay-as-you-go financing.
Affordability of Additional Debt and Legal Debt Limit In Fiscal Year 2000, the City of Mansfield developed a 10-year Strategic Plan that anticipates the
financial future of the City of Mansfield, Texas. This plan is a comprehensive planning model that
enables Management to assess the financial well-being of the City. It quantifies the impact of growth and
development and speaks plainly about the fiscal condition of the City. This Strategic Plan incorporates

127
future revenue sources, operating expenses and projected capital improvement projects for all of the
City’s activities: Governmental Funds and Enterprise Funds. This Strategic Plan measures the City’s
ability to authorize and issue additional debt over the next ten years. Each year, the plan is revised to
reflect growth, population estimates and current operating revenues.
The City shall use an objective, analytical approach to determine whether it can afford to assume
new debt beyond what it retires each year. This process shall compare generally accepted
standards of affordability to the current values for the City.
General Obligation Bonds:
Debt per capita
Debt as a percent of taxable value
Debt service as a percent of current revenues and current expenditures
Debt tax rate as a percent of the City’s tax rate
Revenue Bonds:
Pledged revenues shall be a minimum of 110% of annual debt service
Pledged revenues shall be a minimum of 125% of average annual debt service
Pledged revenues shall be 130% of maximum annual debt service for financial planning
purposes
Annual adjustments to the City’s rate structures will be made as necessary to maintain a 130%
coverage factor
The City will keep outstanding debt within the limits prescribed by State Statute, which does not
prescribe a legal debt limit. However, Article XI, Section 5 of the Texas Constitution, applicable
to cities with a population of more than 5,000, limits the ad valorem tax rate to $2.50 per $100
assessed valuation.
Types of Debt and Criteria for Issuance of Types of Debt The City may choose to issue debt under any provision allowed for and permitted by State Statute.
Although debt is an obligation to be repaid, it can assume many forms. The form and character of debt is
typically determined by the nature of the funding source and nature of the asset to be purchased or
improved. However, debt can generally be categorized into two types, as determined by the Federal
Income Tax Code: Governmental Bonds and Private Activity Bonds, either of which may be taxable or
tax-exempt. In determining the type of security for financing an improvement or purchasing of a capital
asset, the City may consider the following, and is not limited to the following:
Debt Form
General Obligation Facility:
General Obligation Bonds (“GOs”)
Tax levy as security for the bonds
Voter’s Approval
Specific Public Purpose
Certificates of Obligation (“COs”) Tax levy and/or revenue pledge as security
Specific public purpose
Public Notice; hearings and advertisement

128
Public Property Finance Contractual Tax levy and/or revenue pledge as security
Obligations (“PPFCOs”) Acquisition of personal property
Alternative for lease/purchase
Anticipation Notes Tax levy and/or revenue pledge as security
Construction of Public Works
Acquisition of real and personal property
Cumulative cash flow deficit
Professional services
Maturity is maximum of seven years
Revenue Facility:
Revenue Bonds Revenue pledge as security
Pledge to set rates and fees to meet covenants
Bond Reserve Fund for surety
Covenant reporting
Equitable rate structure
First lien security with parity
Construction of capital improvements
Contract Revenue Bonds City contracts with entities
Tax levy and/or revenue pledge as security
Ownership of title may occur with entity or
City
Special Obligation Facility:
Tax Increment Financing District (“TIF”) Development district established
Construction of improvements
Incremental increase in value property only
Taxable by TIF
Non-Profit Corporations Established corporations
Property Finance Authority Revenue pledge of the corporation
Mansfield Park Facilities Development
Corp
Covenant reporting
Mansfield Economic Development Corp First lien security with parity
Acquisition of real or personal property
Public/private infrastructure improvements
City may or may not own title
Specific services
Public Improvement District (“PID”) Specific improvement
Securitized by pledged assessments
Specific benefactors
Other Credit Facility:
Capital Lease Annual tax or revenue appropriation
Tax-exempt

129
Acquisition of personal property
Able to refinance
Line of Credit Qualify statutorily
Immediate need for financing
Borrowings retired with bond proceeds
Fulfill bond reserve covenants
Borrowings repaid from current resources
Commercial Paper Revenue pledge as security
Demand from the market for small issuer
Commercial paper
Derivatives Minimize risk of market
Reduced costs versus fixed costs
Creates flexibility
Understood risk warrants the savings
Surety Bond & Bond Insurance Debt service is less than cost of insurance
Double AA rated insurer
Competitive offers from two insurers
Debt Structure
Historically, the City of Mansfield’s debt structures have been designed to coincide with the fiscal
policies of the City of Mansfield, Texas, essentially allowing growth to pay for growth by properly setting
the maturities of the debt to equal or less than the usefulness of the improvement or asset.
Typical debt structure of a bond issuance:
Term or serial bonds structured for annual payments
Traditional call feature that does not influence the price of the bonds
Average bond life of 10.5 years to 12.0 years
Level payments for twenty years
Pricing structured to allow for premiums and discounts
First year payment to begin in second year of construction
Bond insurance
Surety bond if warranted
The City of Mansfield has sought non-traditional avenues of capital improvement financing; however, the
City is considered a “small issuer” under the law. It has been more economical for the City to maintain
this type of debt structure for its bond sales. This does not preclude the City from considering different
structures or structuring its issuance differently from its typical debt structure. The purpose of the
structure is to provide the City with the lowest possible costs under market conditions at the time of
issuance.
Methods of Sale
Competitive Sale: The City shall seek to issue its debt obligations in a competitive bidding environment.
Bids shall be awarded on a True Interest Cost, providing the bidders meet other bidding requirements. In
some instances, the City may award the sale to the lowest Net Interest Cost bidder depending on the
economic substance of the transaction. If the competitive bidding process is not conducive to soliciting
the lowest cost of financing a bond issuance, the City may choose to negotiate the sale.

130
Negotiated Sale: The City shall seek to weigh the selection of underwriter before negotiating a bond sale.
The selection of the underwriter shall encourage the best economic environment in which the City will
benefit from selling its bonds. Typically, negotiated sales will occur when the market volatility is
unpredictable. In some cases this may mean investors are not willing to commit capital in uncertain
economic environments, or the size of the issue may not attract the bids for a successful sale. Moreover,
the primary purpose of the negotiated sale is to solicit the interest rate environment for the City to sell
bonds.
Private Placement: The City will seek to privately place its bonds with a select group of investors when
the issuance warrants the sophistication of the buyer. The City will ensure that the placement fee is less
than a typical underwriter’s fee in a negotiated offering of a comparable type sale in a similar sale
environment.
Refunding of Debt
The City of Mansfield, Texas shall monitor the municipal bond market for opportunities to refund
outstanding debt to save the City from future interest costs. As a general rule, the savings shall be at least
3% greater than the cost of carrying the existing debt inclusive of issuance costs and any cash
contributions. However, if the value of the savings exceeds the cost of the refunding and is greater than
$100,000 but is less than 3% of the savings, then the City shall consider refunding the existing debt.
Arbitrage rules are to be considered when refunding debt.
Credit Objectives
The City of Mansfield, Texas shall seek to attain and maintain the highest possible bond ratings for its
outstanding debt without compromising the delivery of basic City services. Currently, the City maintains
four ratings with Fitch, Moody’s, and Standard & Poor’s.
Fitch, IBCA Moody’s Standard & Poor’s
General Obligation AA+ Aa2 AA+
Sales Tax Revenue AA+ Aa2 AA-
Drainage Revenue AA Aa2 AA
Water & Sewer AA Aa2 AA+
It is and will be the continued policy of the City of Mansfield to provide full disclosure of information
about the City’s operating activity to the rating agencies. The City shall maintain an open line of
communication with the rating agencies to allow for the free exchange of information between the City
and the agencies.
Secondary Market Disclosure
SEC 15c2-12 regulations became effective July 3, 1995. The City shall continue to provide financial data
to the Nationally Recognized Municipal Information Depository (NRMSIRs) and the State Information
Depositories (SIDs). The City will and has complied with secondary reporting requirements of SEC
15c2-12.
Financial Advisor
The City will retain an external financial advisor. The financial advisor must have comprehensive
municipal debt experience and experience in diverse financial structuring requirements. The City
financial advisor must also be of reputable character and in good standing with SEC and the MSRB.

131
Bond Counsel
The City will retain an external bond counsel. Bond Counsel must have comprehensive municipal debt
experience and experience in diverse financial structuring requirements. Bond Counsel must also be of
reputable character and in good standing with Texas Law Review Board.
Other Service Providers
The City shall select other service providers (e.g. escrow agents, verification agents, trustees, arbitrage
consultants, etc.) as necessary to meet legal requirements and minimize net City debt costs.
Arbitrage Compliance
The City shall maintain its books and records in a manner consistent with the provision allowed for under
the Internal Revenue Code Section 148. Furthermore, the City shall have its arbitrage exposure
calculated annually and appropriately recognized in the City’s Comprehensive Annual Financial
Statement.
Investment of Bond Proceeds
All bond proceeds shall be invested in accordance with the City Investment Policy. The proceeds shall be
invested as part of the City’s consolidated cash pool and accounted for separately and accordingly to bond
covenants and the Internal Revenue Code.
Calculation of the City of Mansfield Legal Debt Limit
The City Charter of the City of Mansfield, Texas and the statutes of the State of Texas do not prescribe a
legal debt limit. However, Article XI, Section 5 of the Texas Constitution, applicable to cities of more
than 5,000 populations, limit the ad valorem tax rate to $2.50 per $100 of assessed valuation. The City
operates under a Home Rule Charter that also imposes a limit of $2.50 per $100 of assessed valuation.
The FY 2016-2017 budgeted property tax rate is $0.71000 per $100 valuation with a tax margin of
$1.79000 per $100 valuation based upon the maximum ad valorem tax rate noted above. Additional
revenues up to $91,884,072 per year could be raised before reaching the maximum allowable tax base.
Assessed Value x Legal Debt Limit (15% of Assessed Value)
-
General Obligation Bonds and Certificates of Obligation
=
Legal Debt Margin
The Assessed Taxable Valuation in FY 2016-2017 is $5,181,378,189
The Legal Debt Limit is $777,206,728
General Obligation Bonds and Certificates of Obligation is $153,675,365
The Legal Debt Margin is $623,531,363

132
CITY OF MANSFIELD, TEXAS
GENERAL FUND
SCHEDULE OF DEBT PAYMENTS
,
Fiscal Year Principal Interest Total
2016-2017 8,865,000 4,484,613 13,349,613
2017-2018 8,675,000 4,199,173 12,874,173
2018-2019 8,295,000 3,927,744 12,222,744
2019-2020 8,160,000 3,645,669 11,805,669
2020-2021 8,000,000 3,353,294 11,353,294
2022-2026 35,125,000 12,317,849 47,442,849
2027-2031 24,005,000 5,727,813 29,732,813
2032-2036 13,665,000 1,229,210 14,894,210
Total 114,790,000$ 38,885,365$ 153,675,365$
$10,000,000
$10,500,000
$11,000,000
$11,500,000
$12,000,000
$12,500,000
$13,000,000
$13,500,000
FY 2016-2017 FY 2017-2018 FY 2018-2019 FY 2019-2020 FY 2020-2021

133
CITY OF MANSFIELD, TEXAS
WATER & SEWER FUND
SCHEDULE OF DEBT PAYMENTS
Fiscal Year Principal Interest Total
2016-2017 4,020,000 2,039,234 6,059,234
2017-2018 4,000,000 1,875,009 5,875,009
2018-2019 3,875,000 1,711,534 5,586,534
2019-2020 3,180,000 1,554,834 4,734,834
2020-2021 3,300,000 1,435,871 4,735,871
2022-2026 15,365,000 5,027,676 20,392,676
2027-2031 10,705,000 1,528,938 12,233,938
2032-2035 1,710,000 174,600 1,884,600
Total 46,155,000$ 15,347,696$ 61,502,696$
$0
$1,000,000
$2,000,000
$3,000,000
$4,000,000
$5,000,000
$6,000,000
$7,000,000
FY 2016-2017 FY 2017-2018 FY 2018-2019 FY 2019-2020 FY 2020-2021

134
CITY OF MANSFIELD, TEXAS
MANSFIELD PARK FACILITIES DEVELOPMENT FUND
SCHEDULE OF DEBT PAYMENTS
Fiscal Year Principal Interest Total
2016-2017 1,035,000 906,171 1,941,171
2017-2018 1,075,000 874,196 1,949,196
2018-2019 1,340,000 850,730 2,190,730
2019-2020 1,380,000 821,977 2,201,977
2020-2021 1,405,000 785,498 2,190,498
2022-2026 7,020,000 3,269,000 10,289,000
2027-2031 4,180,000 2,205,626 6,385,626
2032-2036 4,175,000 1,357,415 5,532,415
2037-2040 3,265,000 403,547 3,668,547
Total 24,875,000$ 11,474,160$ 36,349,160$
$1,800,000
$1,850,000
$1,900,000
$1,950,000
$2,000,000
$2,050,000
$2,100,000
$2,150,000
$2,200,000
$2,250,000
FY 2016-2017 FY 2017-2018 FY 2018-2019 FY 2019-2020 FY 2020-2021

135
CITY OF MANSFIELD, TEXAS
MANSFIELD ECONOMIC DEVELOPMENT FUND
SCHEDULE OF DEBT PAYMENTS
Fiscal Year Principal Interest Total
2016-2017 920,000 282,784 1,202,784
2017-2018 940,000 264,884 1,204,884
2018-2019 955,000 243,652 1,198,652
2019-2020 975,000 220,010 1,195,010
2020-2021 1,010,000 194,000 1,204,000
2022-2026 3,530,000 498,969 4,028,969
2027-2031 925,000 153,263 1,078,263
2032-2032 205,000 8,200 213,200
Total 9,460,000$ 1,865,762$ 11,325,762$
$1,190,000
$1,192,000
$1,194,000
$1,196,000
$1,198,000
$1,200,000
$1,202,000
$1,204,000
$1,206,000
FY 2016-2017 FY 2017-2018 FY 2018-2019 FY 2019-2020 FY 2020-2021
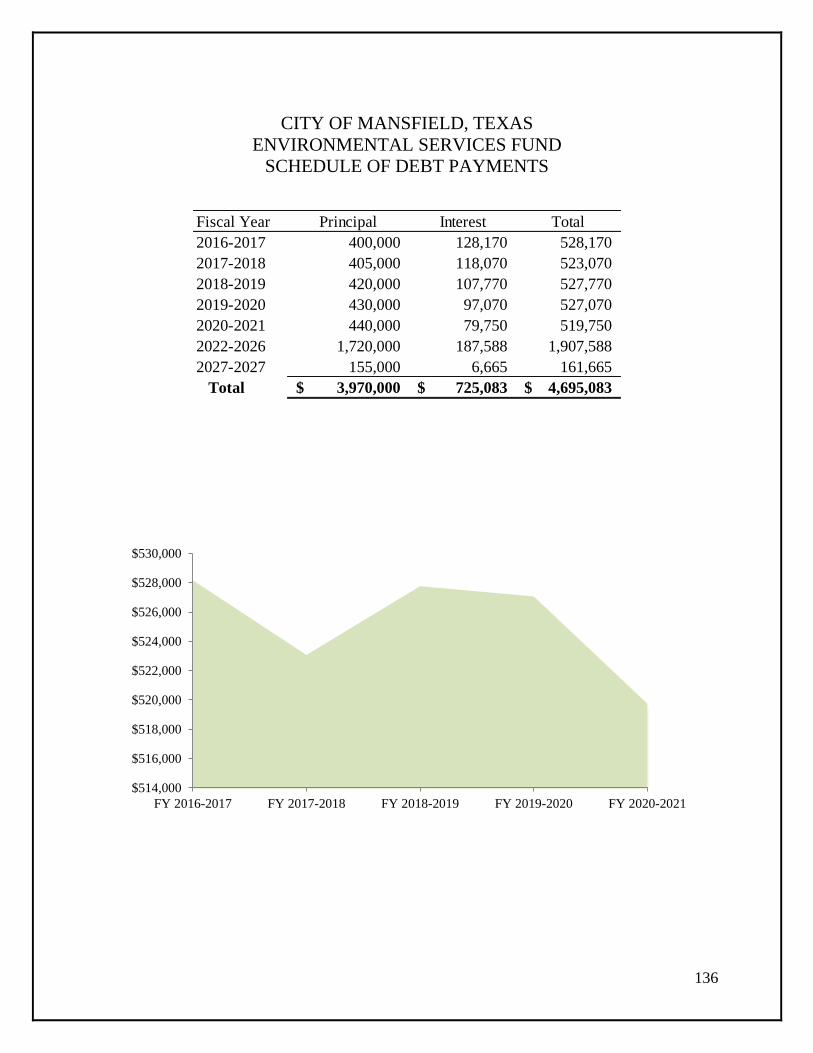
136
CITY OF MANSFIELD, TEXAS
ENVIRONMENTAL SERVICES FUND
SCHEDULE OF DEBT PAYMENTS
Fiscal Year Principal Interest Total
2016-2017 400,000 128,170 528,170
2017-2018 405,000 118,070 523,070
2018-2019 420,000 107,770 527,770
2019-2020 430,000 97,070 527,070
2020-2021 440,000 79,750 519,750
2022-2026 1,720,000 187,588 1,907,588
2027-2027 155,000 6,665 161,665
Total 3,970,000$ 725,083$ 4,695,083$
$514,000
$516,000
$518,000
$520,000
$522,000
$524,000
$526,000
$528,000
$530,000
FY 2016-2017 FY 2017-2018 FY 2018-2019 FY 2019-2020 FY 2020-2021

137
GENERAL FUND
The General Fund is the operating fund of the City. It is used to account for all revenues and
expenditures relating to operations of the City of Mansfield that are not accounted for in other
funds.

138
City CouncilMaintain a line of communication to take advantage of citizen input.
Provide forums, discussions and open meetings to allow citizen input in municipal issues.
Encourage healthy debate among members of Council to develop innovative ideas.
Schedule meetings, workshops and special meetings to allow staff, citizens and boards to pool ideas.
Recruit new industry as well as aid in the retention and expansion of existing business.
Be open and fair-minded to all types of groups within the city.
AdministrationThe City Manager’s Office
Direct and maintain an effective service organization with high productivity and quality of service.
Provide effective communication and information to City Council on the conditions of the city.
Prepare annual service plan including strategic planning, budget and staffing.
Review infrastructure of the organization and change the organizational structure as needed.
Administer the operations of 15 service departments and 544 paid staff.
Legal DepartmentEliminate lawsuits to the city.
Provide cost effective, accurate and
current legal service and advice to staff,
Council and various boards.
Settle any claims against the city at
minimum cost.
Advise staff of any changes in legislation.
Human ResourcesProvide a comprehensive and competitive
salary and benefit program at the best
value to the citizens.
Enhance safety training programs.
Review and update job descriptions.
Process all payroll and benefit related
actions.
GENERAL GOVERNMENT DIVISION
General Government Division Highlights
15 Service Departments supervised
544 FTE comprise the City of Mansfield workforce
General Fund Operating Budget of $52,208,793 in FY 2016/2017

139
GENERAL GOVERNMENT DIVISION AT A GLANCE
Budget Summary
The General Government Division increased 23.74% due to a merit increase, market adjustments, new
applicant tracking and the move of two full time staff from the Public Safety Division to the Legal
Department.
Actual Budget Budget % Change
Departments 2014-2015 2015-2016 2016-2017 2016-2017
City Council 589,554$ 124,736$ 118,907$ -4.67%
Administration 700,015 756,426 789,224 4.34%
Legal 796,100 557,235 986,329 77.00%
Human Resources 538,006 629,815 664,751 5.55%
Total 2,623,675$ 2,068,212$ 2,559,211$ 23.74%
Division Actual Budget Budget % Change
Summary 2014-2015 2015-2016 2016-2017 2016-2017
Personnel Services 1,318,499$ 1,187,394$ 1,638,696$ 38.01%
Operations 830,176 880,818 920,514 4.51%
Capital
Projects 475,000
Total 2,623,675$ 2,068,212$ 2,559,211$ 23.74%
$0
$500,000
$1,000,000
$1,500,000
$2,000,000
$2,500,000
$3,000,000
Actual 2014-2015 Budget 2015-2016 Budget 2016-2017
General Government Budget

140
CITY COUNCIL DEPARTMENT
MISSION STATEMENT:
The City Council serves as the legislative branch of the City of Mansfield representing all citizens. The
Council establishes legislative policy through the adoption of ordinances and resolutions in order to
provide a safe, pleasant environment within the community and efficient delivery of public service.
Department at a Glance
The City Council consists of the Mayor and six elected council members. Each member serves a three
year term. The City Council meets the 2nd
and 4th Monday of each month and conducts joint meetings
with other appointed boards at various times during the year. The City Council budget decreased 4.67% in
FY 2016-2017.
Key Goals and Objectives
Goal 1
Recognize community issues and concerns and develop strategies beneficial to all citizens.
Objectives:
Maintain open lines of communication to take advantage of citizen and staff input.
Provide forums, discussions and open meetings to allow citizen involvement.
Continue to incorporate ideas from strategic planning sessions with City Council, boards and
commissions wherever possible.
Create opportunities to develop the downtown area of the City.
Goal 2
Develop legislation that will benefit present and future citizens of Mansfield.
Objectives:
Encourage healthy debate among council members to develop innovative ideas.
Schedule meetings, workshops and forums to allow staff, citizens and boards to pool ideas and
information.
Maintain a strong financial position and credit rating.
Goal 3
Create an environment that promotes a satisfied public, a skilled workforce and cost effective service.
Objectives:
Ensure all City services provide all citizens with access to all services.
Recruit commercial and retail development to reduce the tax burden on the citizens of Mansfield.
Enhance the living environment for all citizens.
Provide for the safety of all citizens.
Performance Objectives
Recognize community issues and concerns and develop strategies beneficial to all citizens.
Develop legislation that will benefit present and future citizens of Mansfield.

141
Measurable Outcomes:
The average cost per citizen has remained relatively constant over a four year period.
Create a total living environment by improving infrastructure, enhancing quality development,
utilizing technology, enhancing tourism and providing safety and security to all citizens.
Actual Actual Budget Budget
City Council 2013/2014 2014/2015 2015/2016 2016/2017
Demand
Council Meetings 35 41 40 40
Subcommittee Meetings 11 13 20 26
Emergency Meetings 0 0 1 1
Workload
Public Hearings 55 82 65 75
Ordinances Enrolled 34 49 50 50
Resolutions Enrolled 99 108 125 110
Effectiveness
Master Plan Update 1 0 1 1
Bond Rating Upgrades 1 1 1 1
City Council Actual Budget Budget % Change
Departments 2014-2015 2015-2016 2016-2017 2016-2017
Personnel Services
Operations 114,554$ 124,736$ 118,907$ -4.67%
Capital
Projects 475,000
Total 589,554$ 124,736$ 118,907$ -4.67%

142
CITY ADMINISTRATION DEPARTMENT
MISSION STATEMENT:
The mission of the City Administration Department is to manage and direct the business of the City and
the legislative policies established by City Council.
Department at a Glance
The Administration Department includes the City Manager, an Assistant City Manager position, three
Deputy City Managers and one Secretary, however, the Deputy City Managers are budgeted separately
within division budgets and funds. This department budget represents only the costs associated with the
City Manager, Assistant City Manager and Secretary. The City Administration budget increased 4.34%
due to a merit increase and market adjustments.
Key Goals and Objectives
Goal 1
Direct and maintain an effective service organization with high productivity, quality of service and best
value to all citizens.
Objectives:
Provide internal support through daily management and direction.
Maintain and motivate an experienced and knowledgeable staff.
Structure the service organization for maximum effectiveness.
Maintain a high credit rating of AA+ or better.
Goal 2
Market the City and provide effective communication and information to the City Council and
community on organizational issues and service issues.
Objectives:
Provide monthly financial reports and agenda support information to City Council and
management departments in order to make the necessary policy decisions.
Provide a strong Public Information Department for dissemination of information.
Provide citizen access to City government utilizing the City web site to enhance communication.
Provide capital and operational updates on a regular basis utilizing the City web site, citizen
newsletter and other media to provide information to all citizens.
Goal 3
Provide for the maximum utilization of all resources.
Objectives:
Analyze, monitor and modify the City’s strategic plan.
Maximize revenues and improve cost efficiencies.
Present a balanced budget and develop service program recommendations.
Analyze and direct the City’s economic development program.
Provide the annual service plan complete with a balanced budget.
Make annual presentations to national credit rating services to maintain the City’s bond ratings.
Prepare a Capital Improvement Plan with long term goals (Strategic Plan).

143
Performance Objectives
Maintain a highly skilled workforce.
Enhance the annual report and information to all citizens.
Incorporate City Council and citizen recommendations into the annual service plan.
Measurable Outcomes:
Strong valuation growth.
Increased service levels in all areas.
Recruitment and retention of a quality workforce.
Actual Actual Budget Budget
Administration 2013/2014 2014/2015 2015/2016 2016/2017
Demand
Council meetings 35 37 38 40
Open Records Requests 852 1,244 1,412 1,500
Budget Workshops 2 2 2 2
Strategic Planning Sessions 2 2 2 2
City Wide Staffing 524 528 533 544
Workload
Ordinances Enrolled 34 49 50 50
Resolutions Enrolled 99 108 125 110
Service Departments Managed 15 15 15 15
City Wide Budgets 145,424,216$ 156,043,643$ 184,607,416$ 220,849,289$
Productivity
Open Records Requests-30 days 100% 100% 100% 100%
New Service Programs None 1 1 1
Net Taxable Residential Value 175,802$ 183,606$ 190,916$ 209,094$
Effectiveness
Property Tax Rate 0.71 0.71 0.71 0.71
New Construction Value 91,761,113$ 111,108,516$ 109,519,641$ 147,038,257$
Staff Turnover 7% 10% 7% 8%
General Fund New FTE 4 5 11
Administration Actual Budget Budget % Change
Summary 2014-2015 2015-2016 2016-2017 2016-2017
Personnel Services 587,735$ 656,615$ 692,780$ 5.51%
Operations 112,280 99,811 96,444 -3.37%
Capital
Projects
Total 700,015$ 756,426$ 789,224$ 4.34%
2014-2015 2015-2016 2016-2017 2016-2017
Full Time Equivalent Positions Budget Budget Budget Additions
City Manager 1 1 1
Assistant City Manager 2 2 1 -1
Executive Secretary 1 1 1
Total 4 4 3 -1

144
LEGAL DEPARTMENT
MISSION STATEMENT:
The mission of the Legal Department is to be the legal advisor to the City of Mansfield and all offices,
staff and departments within the organization, in relation to their official powers and duties.
Department at a Glance
The Legal Department includes the City Attorney, Paralegal and Grant Coordinator/Legal Liaison. The
Legal Department budget increased 77% in FY 2016-2017 due to the reorganization of the Public Safety
Division, merit increases and market adjustments.
Key Goals and Objectives
Goal 1
Reduce the legal exposure of the City in its operation.
Objectives:
Provide guidance and assistance to City staff and City Council.
Review contracts, ordinances and resolutions to ensure legal conformity.
Work with staff to recognize risk exposure.
Goal 2
Provide cost effective and accurate legal counsel to City Council, staff and various boards within the City.
Objectives:
Advise City Council, boards and staff of changes in legislation and develop changes as needed.
Provide timely review and preparation of documents.
Goal 3
Represent the City in Municipal Court prosecution and settle claims against the City.
Objectives:
Work closely with City Council, boards and staff to advise an expeditious course of action and
effective settlement.
Determine weaknesses and strengths of any case filed and recommend a prompt and cost
effective settlement.
Performance Objectives
Reduce legal fees in the General Fund by eliminating lawsuits against the City of Mansfield.
Process open records requests in a timely manner, while providing cost effective and accurate
legal services.
Receive grant funding for all applications submitted.

145
Measurable Outcomes
Fewer law suits against the City and a reduction in legal fees.
Open records requests processed in 30 days or less.
100% of grant applications receive grant funding.
Actual Actual Budget Budget
Legal 2013/2014 2014/2015 2015/2016 2016/2017
Demand
Council meetings 31 31 38 38
Open Records Requests 852 1,244 1,412 1,500
Emergency Meetings 2 2 2 2
Workload
Subpoenas 88 85
Interagency Requests 221 371
Hotel/Motel Reimbursement Requests 70 89
Misc. Requests 152 160
Grant Applications 13 11 12 8
Grants Received 7 8 8 8
Grants-Dollar Value 316,848$ 304,210$ 305,698$ 426,071$
Grants-City Required Funding 1 1 1 1
Productivity
Open Records Requests-30 days 100% 100% 100% 100%
Staff hours-Open Records Requests 100 100 100 100
Grant Applications 13 11 12 8
Grants Received 7 8 8 8
Effectiveness
General Fund Legal Fees 189,154$ 372,780$ 444,621$ 444,621$
Grants Received 7 8 8 8
Grants-Dollar Value 316,848$ 304,210$ 305,698$ 426,071$
Grants-City Required Funding 1 1 1 1
Legal Actual Budget Budget % Change
Summary 2014-2015 2015-2016 2016-2017 2016-2017
Personnel Services 410,924$ 93,764$ 485,801$ 418.11%
Operations 385,176 463,471 500,528 8.00%
Capital
Projects
Total 796,100$ 557,235$ 986,329$ 77.00%
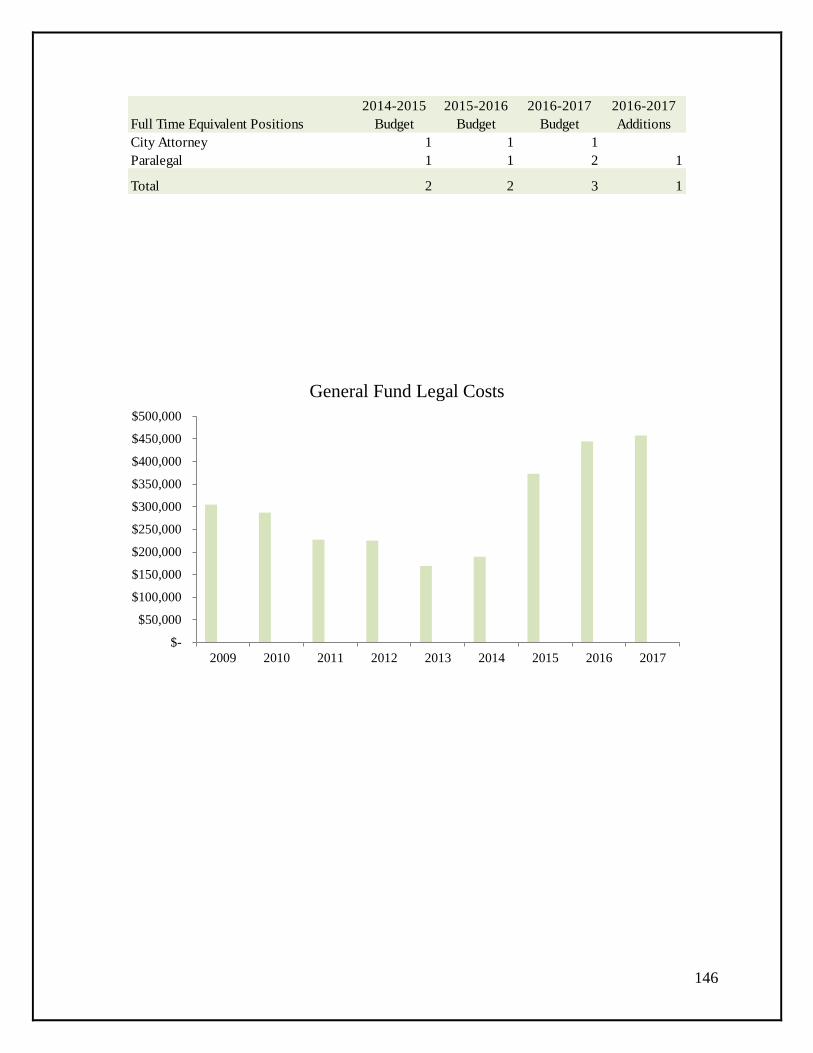
146
General Fund Legal Costs
2014-2015 2015-2016 2016-2017 2016-2017
Full Time Equivalent Positions Budget Budget Budget Additions
City Attorney 1 1 1
Paralegal 1 1 2 1
Total 2 2 3 1
$-
$50,000
$100,000
$150,000
$200,000
$250,000
$300,000
$350,000
$400,000
$450,000
$500,000
2009 2010 2011 2012 2013 2014 2015 2016 2017

147
HUMAN RESOURCES DEPARTMENT
MISSION STATEMENT:
The Human Resources Department administers as a strategic business partner dedicated to ensuring the
most effective use of human resources to meet the long-term strategic goals of the City.
Department at a Glance
The Human Resources Department includes the Human Resource Director, one Benefits Manager, one
Administrative Assistant and one Human Resource Specialist. The overall budget for FY 2016-2017
increased 5.55% due to a merit increase, market adjustments and a new applicant tracking system.
Key Goals and Objectives
Goal 1
Recruit and retain an efficient and effective workforce.
Objectives:
Establish a new on-line applicant tracking system for new positions as well as assist new hires in
their orientation process.
Assist supervisors with selection testing including panel interviews, written tests, practical tests
and profile analysis.
Revise job descriptions to reflect changes in essential physical functions based on ADA training.
Analyze the effectiveness of recruiting methods, i.e. advertising, testing, on the job training, etc.
Goal 2
Continue to enhance employee performance through training and development.
Objectives:
Establish course catalog of ongoing mandatory core supervisor training modules and determine
cost effective providers.
Track training including hours and costs per employee.
Research on-line training opportunities to reduce cost and time for compliance classes.
Establish wellness goals and incentives for employees to achieve and implement wellness and
disease management programs.
Establish an employee committee to allow for a voice for the employee organization to discuss
policies, wellness initiatives and other topics.
Goal 3
Ensure competitive compensation by providing merit increases and equity adjustments as market
conditions warrant.
Objectives:
Provide survey data from the Metroplex Survey and Texas Municipal League to determine
competitive salaries.
Provide reports for upper management to monitor compliance with compensation goals and
objectives.
Make annual adjustments to the pay plan to align with market conditions.
Provide quarterly reports outlining the frequency and severity of health and safety claims.

148
Performance Objectives
Recruit and retain an efficient workforce.
Continue to enhance employee performance through training and development.
Ensure competitive compensation.
Measurable Outcomes:
Reduce workers compensation claims.
Reduce liability claims.
Actual Actual Budget Budget
Human Resources 2013/2014 2014/2015 2015/2016 2016/2017
Demand
City Wide Staffing (FTE) 526 529 533 544
Positions filled 55 60 60 75
Terminations Processed 59 75 83 90
Workload
Applications Processed 1,524 1,545 1,550 1,700
Unemployment Claims filed 9 9 9 11
Payroll Actions Processed 163 175 183 201
Job Studies 6 6 6 6
Liability Claims Processed 20 20 20 20
Property Damage Claims Processed 10 10 10 10
Disciplinary Actions 17 20 20 30
Productivity
Payroll Actions Processed 113 175 183 201
Workers Compensation Claims 36 40 42 53
Effectiveness
Employee Turnover 7.0% 9.8% 7.0% 8.0%
Probationary Turnover 13.00% 13.00% 13.00% 15.00%
Total Liability Claims 50,000$ 50,000$ 50,000$ 50,000$
Workers Compensation Claims 190,485$ 200,000$ 201,000$ 210,000$
Property Damage Claims 25,000$ 26,500$ 27,000$ 27,000$
Absenteeism Costs 680,000$ 700,000$ 710,000$ 710,000$
Human Resources Actual Budget Budget % Change
Summary 2014-2015 2015-2016 2016-2017 2016-2017
Personnel Services 319,840$ 437,015$ 460,115$ 5.29%
Operations 218,166 192,800 204,636 6.14%
Capital
Projects
Total 538,006$ 629,815$ 664,751$ 5.55%

149
2014-2015 2015-2016 2016-2017 2016-2017
Full Time Equivalent Positions Budget Budget Budget Additions
Human Resource Director 1 1 1
Fund Benefits Manager 1 1 1
Administrative Assistant 1 1 1
HR Specialist 1 1 1
Total 4 4 4

150
BUSINESS SERVICES DIVISION
Finance
Maintain strict financial accountability
Maintain strong financial control and budget
compliance
Maintain credibility with the investment community
Maintain a 25% fund balance requirement
Administer and record all financial transactions
Oversee the annual audit and budget process
Budget & Purchasing
Prepare annual budget
Administer annual budget
Administer purchasing
function
Approve all purchases
Issue purchase orders
Information Technology
Upgrade hardware & software
Maintain City-wide computer
systems
Administer WAN & LAN
City-wide
Accounting
Provide all users with accurate
financial data
Ensure internal controls are
maintained
Process invoices and payroll
Administer purchasing card
program
Sanitation
Franchise
Agreement
Trash & Recycle
contract
Tax Assessing &
Collection
Contract with Tarrant
County to collect
property tax
City Secretary
Ensure the integrity of records and history of local government
Maintain a professional and legal municipal election process
Implement and maintain the records management program
Prepare City Council agendas
maintain archived records
BUSINESS SERVICES DIVISION AT A GLANCE
Business Services Division Highlights
The Division manages over $221M in budgets City-wide.
The Division has received the GFOA Budget and CAFR awards annually.
The Division processed over $163M payments in 2015 and issued 1,488
purchase orders.

151
BUSINESS SERVICES DIVISION AT A GLANCE
Budget Summary
The total Business Services Division budget increased 3.13% in FY 2016-2017 due to the increased cost
of sanitation services, a merit increase and annual contract maintenance costs.
Actual Budget Budget % Change
Departments 2014-2015 2015-2016 2016-2017 2016-2017
Finance 385,806$ 509,398$ 552,161$ 8.39%
Accounting 316,840 457,072 480,819 5.20%
Purchasing 69,854 84,532 88,961 5.24%
Tax Assessment 268,797 273,800 273,800 0.00%
Information Technology 597,796 821,792 828,557 0.82%
Sanitation 2,187,165 2,208,000 2,239,140 1.41%
Budget 67,955 87,143 92,735 6.42%
City Secretary 471,275 347,053 382,685 10.27%
Total 4,365,487$ 4,788,790$ 4,938,859$ 3.13%
Division Actual Budget Budget % Change
Summary 2014-2015 2015-2016 2016-2017 2016-2017
Personnel Services 1,464,429$ 1,694,165$ 1,814,446$ 7.10%
Operations 2,901,058 3,094,625 3,124,413 0.96%
Capital
Projects
Total 4,365,487$ 4,788,790$ 4,938,859$ 3.13%

152
FINANCE DEPARTMENT
MISSION STATEMENT:
The mission of the Finance Department is to administer, support and guide the financial programs of the
City in an effective manner that allows for creation and development of the annual service programs and
budgets, monthly reports, annual reports and creditable bond ratings.
Department at a Glance
The Finance Department includes one Deputy City Manager, the Assistant Business Services Director and
one Financial Analyst. The Finance Department budget increased 8.39% in FY 2016-2017 due to a merit
increase, promotions and market adjustments.
Key Goals and Objectives
Goal 1
Maintain strict financial accountability.
Objectives:
Administer the recording and reporting of all financial transactions.
Work closely with auditors and oversee the annual audit process ensuring all financial statements
and policies are a true and accurate picture of the City’s finances.
Maintain strict compliance with Generally Accepted Accounting Principles.
Goal 2
Maintain strong financial control and budget compliance.
Objectives:
Review and report to the City Council and City Manager the status of financial activity on a
monthly basis.
Provide strict control over expenditures and all accounting transactions to ensure proper
authorization prior to the encumbrance and/or purchase of goods and services.
Maintain auditable records in accordance with generally accepted auditing standards.
Implement new technology improvements to provide accurate and timely financial data.
Goal 3
Maintain financial credibility with the investment community necessary to ensure the availability of
future capital spending.
Objectives:
Maintain a 1.10 Bond Covenant that includes a 1.30 Utility Debt Coverage factor annually.
Search for ways to improve the revenue position and reduce funding costs.
Ensure open communication with all bond rating agencies and financial markets.
Performance Objectives
Enhance the bond rating of the City in all funds.
Review and revise the City’s rate structure as needed.
Publish annual and semi-annual reports.
Maintain strong financial management in all funds.
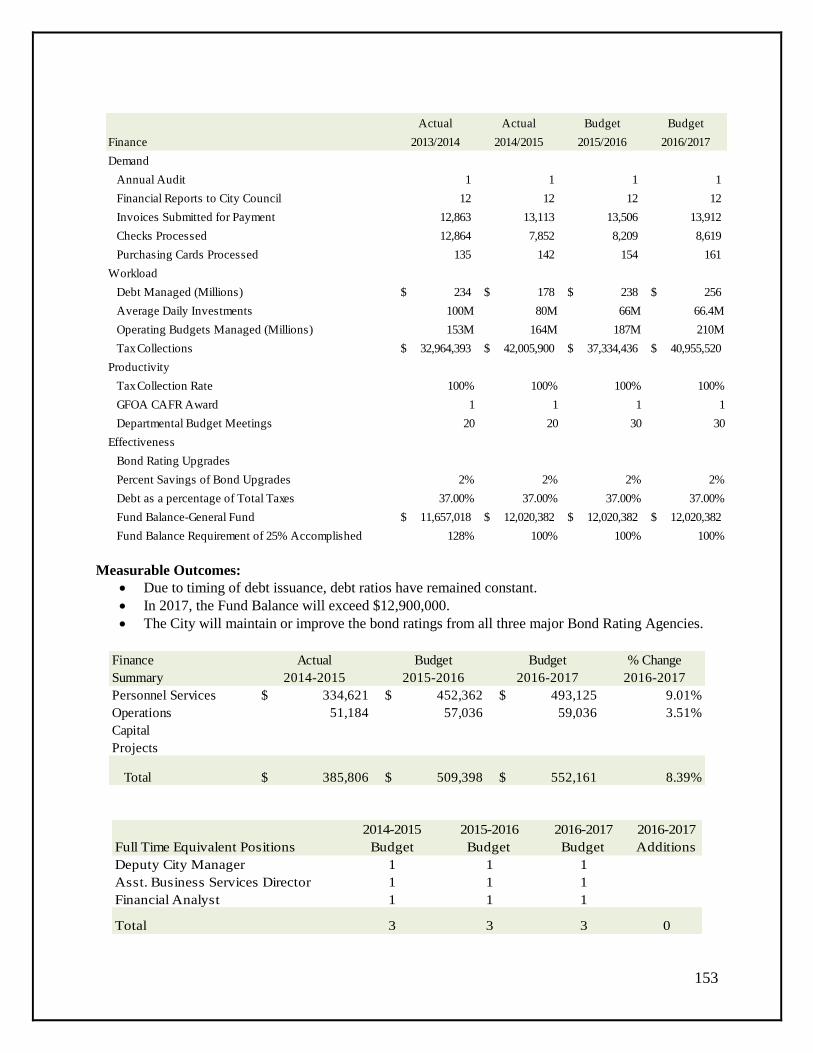
153
Measurable Outcomes:
Due to timing of debt issuance, debt ratios have remained constant.
In 2017, the Fund Balance will exceed $12,900,000.
The City will maintain or improve the bond ratings from all three major Bond Rating Agencies.
Actual Actual Budget Budget
Finance 2013/2014 2014/2015 2015/2016 2016/2017
Demand
Annual Audit 1 1 1 1
Financial Reports to City Council 12 12 12 12
Invoices Submitted for Payment 12,863 13,113 13,506 13,912
Checks Processed 12,864 7,852 8,209 8,619
Purchasing Cards Processed 135 142 154 161
Workload
Debt Managed (Millions) 234$ 178$ 238$ 256$
Average Daily Investments 100M 80M 66M 66.4M
Operating Budgets Managed (Millions) 153M 164M 187M 210M
Tax Collections 32,964,393$ 42,005,900$ 37,334,436$ 40,955,520$
Productivity
Tax Collection Rate 100% 100% 100% 100%
GFOA CAFR Award 1 1 1 1
Departmental Budget Meetings 20 20 30 30
Effectiveness
Bond Rating Upgrades
Percent Savings of Bond Upgrades 2% 2% 2% 2%
Debt as a percentage of Total Taxes 37.00% 37.00% 37.00% 37.00%
Fund Balance-General Fund 11,657,018$ 12,020,382$ 12,020,382$ 12,020,382$
Fund Balance Requirement of 25% Accomplished 128% 100% 100% 100%
Finance Actual Budget Budget % Change
Summary 2014-2015 2015-2016 2016-2017 2016-2017
Personnel Services 334,621$ 452,362$ 493,125$ 9.01%
Operations 51,184 57,036 59,036 3.51%
Capital
Projects
Total 385,806$ 509,398$ 552,161$ 8.39%
2014-2015 2015-2016 2016-2017 2016-2017
Full Time Equivalent Positions Budget Budget Budget Additions
Deputy City Manager 1 1 1
Asst. Business Services Director 1 1 1
Financial Analyst 1 1 1
Total 3 3 3 0

154
$0
$2,000,000
$4,000,000
$6,000,000
$8,000,000
$10,000,000
$12,000,000
$14,000,000
Actual
2007
Actual
2008
Actual
2009
Actual
2010
Budget
2011
Actual
2012
Actual
2013
Actual
2014
Actual
2015
Budget
2016
Budget
2017
Unreserved General Fund Balance
0%
10%
20%
30%
40%
50%
60%
70%
80%
Actual
2008
Actual
2009
Actual
2010
Budget
2011
Budget
2012
Budget
2013
Budget
2014
Budget
2015
Budget
2016
Budget
2017
Historical General Fund Summary
General Operating Debt

155
ACCOUNTING DEPARTMENT
MISSION STATEMENT:
The Accounting Department mission is to provide an accounting system for safeguarding the City’s assets
through the recording and reporting of financial transactions in a manner consistent with Generally
Accepted Accounting Principles and legally mandated standards.
Department at a Glance
The Accounting Department includes the Accounting Supervisor, Accounts Payable Clerk and Chief
Accountant. The Accounting budget increased 5.20% in FY 2016-2017 due to a merit increase and
market adjustments.
Key Goals and Objectives
Goal 1
Provide all users with accurate financial data on a timely basis.
Objectives:
Disburse reports to service departments within 5 business days after month end closing.
Compile monthly financial reports to the Assistant Finance Director at the close of the month.
Submit reports to regulatory agencies as requested.
Goal 2
Receive the award from the Government Finance Officers Association for outstanding financial reporting
in the CAFR.
Objectives:
Prepare the annual report in accordance with Generally Accepted Accounting Principles.
Implement the latest accounting changes that provide accurate financial reports to both internal
and external customers.
Prepare all reports in a manner to ensure ease of reading and clear understanding for the reader.
Ensure all assets are accurately reflected in the annual CAFR.
Goal 3
Ensure adequate and appropriate financial controls are in place.
Objectives:
Safeguard assets from unauthorized loss or dispositions.
Ensure payments and purchase card transactions are processed in accordance with financial
policy.
Ensure all invoices submitted and payments made will receive discounts whenever possible.
Performance Objectives
Pay all invoices submitted within 30 days.
Process all purchase card transactions within 30 days.
Ensure all payments are applied correctly to the appropriate accounts.

156
Measurable Outcomes:
All payments are processed within 30 days.
Purchase cards have been issued to reduce the amount of invoice processing and processing costs.
Actual Actual Budget Budget
Accounting 2013/2014 2014/2015 2015/2016 2016/2017
Demand
Invoices submitted for payment 12,863 13,113 13,506 13,912
Checks processed for payment 12,863 7,852 8,209 8,619
Purchase Cards processed for payment 135 142 154 161
Invoices reviewed for payment 12,863 13,113 13,506 13,912
Workload
Payments Disbursed (Millions) 168 156 184 209
Purchase Card processed 135 142 154 161
Payrolls processed 28 28 28 28
Journal entries processed 5,515 5,791 5,512 5,622
Productivity
Invoices processed 12,863 13,113 13,506 13,912
Purchase Cards processed 135 142 154 161
Financial Reports Compiled 14 14 14 14
Effectiveness
Payments processed within 30 days 100% 100% 100% 100%
Purchase Cards processed within 30 days 0% 0% 100% 100%
Average Time for payment approval (days) 3 3 3 3
Accounting Actual Budget Budget % Change
Summary 2014-2015 2015-2016 2016-2017 2016-2017
Personnel Services 237,639$ 275,152$ 298,649$ 8.54%
Operations 79,201 181,921 182,171 0.14%
Capital
Projects
Total 316,840$ 457,072$ 480,819$ 5.20%
2014-2015 2015-2016 2016-2017 2016-2017
Full Time Equivalent Positions Budget Budget Budget Additions
Accounting Supervisor 1 1 1
Chief Accountant 1 1 1
Accounts Payable Clerk 1 1 1
Total 3 3 3 0

157
PURCHASING DEPARTMENT
MISSION STATEMENT:
The Purchasing Department mission is to provide a cost effective platform that enables the City’s
departments to purchase the goods and services necessary for the operations of the departmental programs
of the City to meet the needs of the citizens of Mansfield, Texas.
Department at a Glance
The Purchasing Department has relegated the ordinary purchasing activity of the department to the City’s
individual departments. Staffing of the Purchasing Department is equally allocated between the Budget
Department and the Purchasing department. The Purchasing Department budget increased 5.24% due to a
merit increase and market adjustment.
Key Goals and Objectives
Goal 1
Continue to develop a centralized purchasing program that is cost effective and provides end users with
the best value.
Objectives:
Provide bulk buying opportunities whenever possible.
Utilize cooperative purchasing agreements to reduce costs and provide timely purchasing of
goods and services.
Educate and provide service departments with E-Commerce opportunities utilizing web-based
buying and disposition of retired assets.
Develop specifications that may be used by multiple departments.
Goal 2
Utilize the latest technology to enhance the purchasing process.
Objectives:
Continue to utilize on-line purchasing opportunities to procure goods and services.
Utilize vendor web sites to provide direct access to all goods and services and reduce
procurement costs.
Utilize web-based bid tabulation opportunities and HUB vendor notifications.
Dispose of retired City assets utilizing on-line auctions.
Goal 3
Ensure compliance with the City’s purchasing polices.
Objectives:
Ensure all legislative changes are incorporated into the City Purchasing Policy.
Ensure purchase order thresholds and requirements are met by all departments.
Educate and train all departments in the purchasing process to ensure compliance with all local,
state and federal law.

158
Performance Objectives
Utilize technology to enhance the purchasing function.
Ensure compliance with the purchasing policy.
Ensure timely issuance of purchase orders.
Provide service departments with E-Commerce opportunities.
Measurable Outcomes:
All payments are processed within 30 days.
All purchase orders are issued within 5 days.
On Line auctions have resulted in additional net proceeds from the sale of obsolete equipment
and reduced expenses related to live auctions.
Actual Actual Budget Budget
Purchasing 2013/2014 2014/2015 2015/2016 2016/2017
Demand
Request for Purchase Orders 1,463 1,488 1,520 1,596
Payment Authorizations Submitted 19,489 19,899 20,297 20,703
Vendor Applications Reviewed 176 188 200 225
"On-Line" Auctions 12 12 12 12
Workload
Purchase Orders Issued 1,463 1,488 1,520 1,596
Payment Authorizations approved 19,489 19,899 20,297 20,703
Specification Development (hours) 60 35 20 45
Vendors Approved 275 286 300 325
Productivity
Dollar Value of Purchase orders 65,915,417$ 79,685,693$ 82,076,264$ 84,538,552$
City-Wide Specifications Developed 4 4 6 9
Effectiveness
Cooperative Purchasing Agreements 8 8 8 8
Purchase Orders issued within 5 days 100% 100% 100% 100%
Vendors approved within 5 days 100% 100% 100% 100%
Proceeds from auctioned property 62,085$ 88,660$ 2,120$ 50,000$
Purchasing Actual Budget Budget % Change
Summary 2014-2015 2015-2016 2016-2017 2016-2017
Personnel Services 64,650$ 77,173$ 81,765$ 5.95%
Operations 5,204 7,360 7,196 -2.22%
Capital
Projects
Total 69,854$ 84,532$ 88,961$ 5.24%
2014-2015 2015-2016 2016-2017 2016-2017
Full Time Equivalent Positions Budget Budget Budget Additions
Budget & Purchasing Director* 0.5 0.5 0.5
Total 0.5 0.5 0.5 0
*Split with the Budget Department.

159
BUDGET DEPARTMENT
MISSION STATEMENT:
The Budget Department mission is to develop, coordinate and monitor the City’s budget program for each
department, make budget amendments as necessary, and keep management informed of revenue and
expenditure patterns throughout the budget year.
Department at a Glance
The Budget Department salary and benefits costs are split with the Purchasing Department. The Budget
Department budget increased 6.42% slightly due to a merit increase and market adjustment.
Key Goals and Objectives
Goal 1
Maintain the integrity of the adopted budget in all funds.
Objectives:
Approve only budgeted expenditures unless otherwise authorized by City Council or
management.
Provide real-time line item expenditures to all service departments for review.
Monitor revised appropriations to ensure the availability of funds and legal compliance.
Goal 2
Prepare the City’s budget based on City Council and City Manager prioritization of new and existing
programs utilizing available resources.
Objectives:
Ensure City Council and City Administration priorities are addressed in the budget.
Incorporate policy and performance objectives into the operating budgets of all service
departments.
Require detailed justification for any new program that may require additional funding.
Goal 3
Continue to receive the GFOA Outstanding Budget Presentation Award.
Objectives:
Prepare the budget document incorporating revenues, expenditures, performance measures and
statistical analysis to present a balanced budget.
Create a budget document that is easy to read, appealing to the reader and contains all budget
information related to the City’s Annual Service Plan.
Provide access to the budget document in a PDF format and on the City of Mansfield website
Performance Objectives
Obtain the Outstanding Budget Presentation Award.
Enhance the budget document using charts, graphs and tables.
Ensure actual expenditures do not exceed budgeted expenditures.

160
Measurable Outcomes:
Expenditures historically have not exceeded budget amounts.
Long Term planning has become an integral part of the budget process.
Budget projections are quantifiable and utilize historical patterns to develop multi-year trends.
Actual Actual Budget Budget
Budget 2013/2014 2014/2015 2015/2016 2016/2017
Demand
Departmental Budget Meetings 15 15 15 19
Scheduled Budget Workshops 2 2 2 2
Financial Reports Submitted 12 12 12 12
Line Item Supply Cost List 420 431 435 460
Workload
GFOA Award Submission 1 1 1 1
Long Term Financial Plan Meetings 2 2 15 15
Operating Budgets Managed (Millions) 153M 156M 184M 209M
Productivity
Percent of Actual vs. Budget Expenditures 100% 100% 98% 100%
Reproduction Savings 25,000$ 25,000$ 66,233$ 75,252$
Effectiveness
Distinguished Budget Award 1 1 1 1
Actual vs. Budget Expenditures 100% 100% 100% 100%
Budget Actual Budget Budget % Change
Summary 2014-2015 2015-2016 2016-2017 2016-2017
Personnel Services 64,649$ 76,173$ 81,765$ 7.34%
Operations 3,306 10,970 10,970 0.00%
Capital
Projects
Total 67,955$ 87,143$ 92,735$ 6.42%
2014-2015 2015-2016 2016-2017 2016-2017
Full Time Equivalent Positions Budget Budget Budget Additions
Budget & Purchasing Director* 0.5 0.5 0.5
Total 0.5 0.5 0.5 0
*Split with the Purchasing Department.

161
INFORMATION TECHNOLOGY DEPARTMENT
MISSION STATEMENT:
The Information Technology Department’s mission is to provide support, maintain and continuously seek
to improve a high quality, cost effective Local Area Network and Wide Area Network (LAN/WAN) that
meets current and future requirements for staff and the citizens of the City of Mansfield.
Department at a Glance
The Information Technology Department budget increased slightly by 0.82% due to a merit increase and
increases in annual maintenance contract requirements. The Information Technology Department includes
the IT Director, Assistant Director, Web Master and Network Administrator.
Key Goals and Objectives
Goal 1
Update broadcasting equipment in Council Chambers and the Multi-Purpose Room.
Objectives:
Replace analog cameras with digital cameras in both areas.
Replace microphones in the Multi-Purpose Room.
Replace overhead speakers in Council Chambers.
Goal 2
Update the Conference Room’s technology.
Objectives:
Replace projector(s) with Newline Interactive TruTouch Displays.
Replace standard phones with conference call phones.
Goal 3
Maintain current hardware to provide for negligible network downtime.
Objectives:
Continue annual maintenance contracts.
Purchase hot-spare firewall for minimal downtime on hardware failure.
Replace aged network devices.
Performance Objectives
Provide upgraded equipment for broadcasting in Council Chambers and Multi-Purpose Room.
Update equipment in the main Conference Room.
Maintain current hardware and take steps to reduce network downtime.

162
Measurable Outcomes:
Improved quality of City Council Meeting broadcasts.
Improved collaboration and efficiency during meetings held in the main Conference Room.
Network uptime as close to 99.99% as possible.
Actual Actual Budget Budget
Information Technology 2013/2014 2014/2015 2015/2016 2016/2017
Demand
PC/Laptops Supported 400+ 450+ 450+ 450+
Software Applications Supported 59 63 70
Mobile Devices Supported (NEW) 350+
Workload
Average IT Requests Daily 20 21 22 23
E-Mail Accounts Maintained 360+ 375 425 455
Facilities Supported 15 15 15 18
Network Infrastructure Hardware Supported 350+ 400+ 500+
Productivity
Websites Maintained (NEW) 12
Domain Names Maintained (NEW) 42
Effectiveness
IT Service Requests answered within 2 hours 100% 100% 100% 100%
City Network Downtime Less than 1% Less than 1% Less than 1% Less than 1%
E-Mail Downtime Less than 1% Less than 1% Less than 1% Less than 1%
Website Downtime Less than 1% Less than 1% Less than 1% Less than 1%
IT Actual Budget Budget % Change
Summary 2014-2015 2015-2016 2016-2017 2016-2017
Personnel Services 371,163$ 525,875$ 546,755$ 3.97%
Operations 226,633 295,918 281,802 -4.77%
Capital
Projects
Total 597,796$ 821,792$ 828,557$ 0.82%
2014-2015 2015-2016 2016-2017 2016-2017
Full Time Equivalent Positions Budget Budget Budget Additions
IT Director 1 1 1
IT Manager 1 1 1
City Web Master 1 1 1
Desk Top Support Specialist 1 1 1
Total 4 4 4 0

163
SANITATION DEPARTMENT
MISSION STATEMENT:
The Sanitation Department mission is to provide the citizens of Mansfield, Texas a cost effective,
resource conscious, waste disposal process that removes refuse and recyclable materials of residents and
businesses within the City of Mansfield.
Department at a Glance
The City of Mansfield has individually contracted with its Sanitation Services Company to perform the
collection of refuse and recyclable materials on behalf of the City. The relationship between the City of
Mansfield and the company is administered through the Finance Department and the City Administration
Department. The Sanitation budget increased 1.41% due to increased commercial and residential
customers.
Key Goals and Objectives
Goal 1
Increase residential and commercial participation in the recycling program.
Objectives:
Educate and inform the citizens as to the value of recycling.
Research and find ways to make recycling easier and fun for citizens.
Convey to participants the necessity to recycle and extend the life of local landfills.
Develop the recycling cart program to fit the individual needs of the citizens.
Goal 2
Work with the contractor to increase public satisfaction.
Objectives:
Increase communication by resolving complaints immediately.
Require the contractor to use the latest technology and equipment to service the citizens.
Require the contractor to project a professional image by using up to date equipment and a
professional workforce.
Goal 3
Provide the Best Value to the citizens.
Objectives:
Work with the disposal contractor to ensure residential and commercial customers receive the
best service available by requiring a regular schedule City-wide.
Establish minimum service levels to ensure customer satisfaction.
Monitor service levels and rates structure within the marketplace as compared to the City’s
services and fees.
Adhere to minimum service levels to ensure customer satisfaction.
Performance Objectives
Increase the use of recycling by citizens and commercial accounts.
Reduce service complaints.

164
Measurable Outcomes:
Customer complaints are resolved within 24 hours of receipt.
Recycling has increased due to public education and the availability of recycling bins at City hall.
Actual Actual Budget Budget
Sanitation 2013/2014 2014/2015 2015/2016 2016/2017
Demand
Waste Disposal Accounts (residential) 17,354 17,605 17,791 18,191
Wasted Disposal Accounts (commercial) 777 797 821 837
Workload
Annual Waste Disposal Pick-Ups 1,885,624 1,913,808 1,935,639 1,978,946
Waste Disposal Area (sq. miles) 36.64 36.64 36.64 36.64
Productivity
Avg. Residential Pick-Up per Week 2 2 2 2
Percent of Disposal Pick-Ups Weekly 100% 100% 100% 100%
Effectiveness
Complaints resolved within 24 hours 100% 100% 100% 100%
Sanitation Actual Budget Budget % Change
Summary 2014-2015 2015-2016 2016-2017 2016-2017
Personnel Services
Operations 2,187,165$ 2,208,000$ 2,239,140$ 1.41%
Capital
Projects
Total 2,187,165$ 2,208,000$ 2,239,140$ 1.41%

165
TAX ASSESSING AND COLLECTION DEPARTMENT
MISSION STATEMENT:
The Tax Assessing and Collection Department mission is to provide cost effective service in the
collection of current property tax collection, delinquent property tax accounts and provide accurate
accounting of the property tax collections for the City of Mansfield.
Department at a Glance
The Tax Assessing and Collection function is performed via contract with the Tarrant County Tax
Assessor-Collector. The department has no staffing, and operating costs are contractual costs for the
service provided by the County Tax Assessor. The operating budget did not increase in FY 2016-2017.
Key Goals and Objectives
Goal 1
Provide a cost effective and efficient service to the citizens.
Objectives:
Contract with Tarrant County for the collection of all taxes.
Record and report monthly tax collections to the Business Services Division.
Performance Objectives
Ensure the efficient collection of all property taxes.
Measurable Outcomes:
Collect 100% of all current and delinquent property taxes.
Actual Actual Budget Budget
Tax Assessment 2013/2014 2014/2015 2015/2016 2016/2017
Demand
Taxable Valuation (millions) 4,690$ 4,690$ 5,002$ 5,453$
Statements Mailed 21,267 21,388 21,727 22,127
Workload
Taxable Accounts 21,267 21,388 21,727 22,127
Current Collections 32,964,393$ 42,005,900$ 37,334,436$ 40,955,520$
Productivity
Statements Mailed 21,267 21,388 21,727 22,127
Effectiveness
Collection rate 100% 100% 100% 100%
Tax Assessment Actual Budget Budget % Change
Summary 2014-2015 2015-2016 2016-2017 2016-2017
Personnel Services
Operations 268,797$ 273,800$ 273,800$ 0.00%
Capital
Projects
Total 268,797$ 273,800$ 273,800$ 0.00%

166
CITY SECRETARY DEPARTMENT
MISSION STATEMENT:
The mission of the City Secretary’s Office is to promote open and responsive government by recording
and preserving the City’s legislative history and official documents, providing public information, and
conducting municipal elections in accordance with State Law.
Department at a Glance
The City Secretary Department budget increased 10.27% in FY 2016-2017 due to a 3% merit increase
and increased costs of records storage and meeting expenses.
Key Goals and Objectives
Goal 1
Ensure the integrity of records and historical information of the City of Mansfield.
Objectives:
Establish a filing system that will preserve and protect legislative history, contracts, and other
official documents maintained by the City Secretary’s Office.
Establish an inventory of records maintained by the City Secretary’s Office to facilitate expedient
retrieval of information and records.
Coordinate the production of records requested pursuant to the Texas Public Information Act.
Goal 2
Facilitate an effective Records Management Program.
Objectives:
Assist other City departments with implementation and ongoing execution of the Records
Management Program.
Facilitate the approval and destruction process for expired records stored in-house and off-site.
Goal 3
Maintain a professional, legal, and ethical municipal election process.
Objectives:
Partner with other governmental agencies to streamline the voting process for City of Mansfield
residents within Tarrant, Ellis, and Johnson Counties.
Attend educational seminars to stay abreast of legislative changes impacting election procedures
and local candidates for office.
Performance Objectives
Ensure the integrity of the legal documents of the City.
Continue to enroll ordinances and resolutions as mandated by City Council.
Ensure the integrity of the election process.

167
Measurable Outcomes:
Process requests for public information within ten business days of submission.
Complete destruction of records maintained off-site within twelve months after expiration of the
prescribed preservation period mandated by Texas State Library & Archives Commission Record
Control Schedules.
Actual Actual Budget Budget
City Secretary 2013/2014 2014/2015 2015/2016 2016/2017
Demand
Council Meetings 35 41 40 40
Subcommittee Meetings 11 13 20 26
Emergency Meetings 0 0 1 1
Workload
Ordinances Enrolled 34 49 50 50
Resolutions Enrolled 99 108 125 110
Open Record Requests Processed 442 389 475 400
Vital Records Processed 2,989 2,915 3,000 3,000
Vehicle Registrations Processed 0 117 318 318
Bid Openings Conducted 8 27 30 30
Effectiveness
Open Records Requests within 10 days 100% 100% 100% 100%
Records Destroyed within 12 months 50% 50% 50% 80%
City Secretary Actual Budget Budget % Change
Summary 2014-2015 2015-2016 2016-2017 2016-2017
Personnel Services 391,707$ 287,431$ 312,387$ 8.68%
Operations 79,568 59,622 70,298 17.91%
Capital
Projects
Total 471,275$ 347,053$ 382,685$ 10.27%
2014-2015 2015-2016 2016-2017 2016-2017
Full Time Equivalent Positions Budget Budget Budget Additions
City Secretary 1 1 1
Assistant City Secretary 1 1 1
Records Manager 1 1 1
Total 3 3 3 0

168
POLICE DIVISION
Administration
Administer all activities of the Police Division
Provide quality police services to the citizens
Reduce crime wherever possible
Encourage community involvement
Assist local agencies as needed
Assist City departments as needed
Patrol
Respond to calls for service
Provide a safe community
Deter crime
Traffic Enforcement
Criminal Investigations
Investigate and solve crimes
Implement a victims assistance
program
Establish a polygraph program
Prosecute offenders
Communications
Dispatch services City-wide
Maintain City-wide radio system
Maintain 911 system
Maintain records
Municipal Court
Collect and adjudicate fines
Clear outstanding warrants
Provide customers with clear and
concise information
Traffic Enforcement
Special Services
Commercial Vehicle Enforcement
Training
Community Resources
Provide community with programs
to increase public awareness
Implement electronic
fingerprinting of youth
Provide the “Every 15 Minute”
program
Police Division Highlights
In 2016-2017, the Patrol Department’s calls for
service are estimated to exceed 65,000.
The Criminal Investigations Department is expected
to clear 1,620 cases in FY 2016-2017.

169
POLICE DIVISION AT A GLANCE
Budget Summary
The Police Division budget increased 5.91% in FY 2016-2017. The increase is due to a merit increase,
market adjustment, four new police positions and increased overtime costs. The Public Safety
Administration Department has been reallocated to the Legal Department and Criminal Investigations
Department.
Actual Budget Budget % Change
Departments 2014-2015 2015-2016 2016-2017 2016-2017
Public Safety Administration* 607,273$ 656,339$ -$ -100.00%
Police Administration 1,455,280 1,455,852 1,508,684 3.63%
Communications 2,287,822 2,622,233 2,673,212 1.94%
Patrol Operations 5,327,915 6,045,542 6,597,420 9.13%
CID 2,668,319 2,609,759 2,641,045 1.20%
Animal Control 606,940 640,516 677,109 5.71%
Commercial Vehicle Enforcement 254,795 277,025 331,194 19.55%
Traffic 415,344 444,280 465,817 4.85%
K-9 219,036 242,057 252,716 4.40%
Community Resource 215,705 164,419 637,639 287.81%
Municipal Court 609,585 638,170 675,112 5.79%
Training 155,906 158,252 158,129 -0.08%
Park Patrol** 177,531
Grants 309,561 - 278,838 100.00%
Total 15,311,014$ 15,954,444$ 16,896,914$ 5.91%
*Moved to Legal and Criminal Investigation
**Moved to the Patrol Department
Division Actual Budget Budget % Change
Summary 2014-2015 2015-2016 2016-2017 2016-2017
Personnel Services 12,624,692$ 13,220,719$ 14,219,020$ 7.55%
Operations 2,686,323 2,733,725 2,677,894 -2.04%
Capital -
Projects
Total 15,311,014$ 15,954,444$ 16,896,914$ 5.91%

170
MISSION STATEMENT FOR THE POLICE DIVISION:
Our mission is to provide the highest level of service, in partnership with the community, to foster a safe
atmosphere promoting the highest quality of life for all people.
Do You Know? The Mansfield Police Patrol Department is expected to answer 65,025 calls for service in 2016/2017.
0
10,000
20,000
30,000
40,000
50,000
60,000
70,000
80,000
Actual
2007
Actual
2008
Actual
2009
Actual
2010
Actual
2011
Actual
2012
Actual
2013
Budget
2014
Budget
2015
Budget
2016
Budget
2017
Patrol Calls for Service

171
POLICE ADMINISTRATION
Department at a Glance
The Police Administration Department includes two Assistant Police Chiefs, one training sergeant, one
administrative assistant, four administrative staff and one custodian to support the Police Division. The
Administration Department budget increased 3.63% due to a merit increase and market adjustment.
Key Goals and Objectives
Goal 1
Continuation of archiving paper police records to a digital format.
Objectives:
Increase storage capabilities by moving to a digital format.
More effective retrieval of archived documents.
Goal 2
Receive recognition status through the Texas Police Chief’s Association Law Enforcement Recognition/
“Best Practices” program.
Objectives:
Complete submission of designated policies and prepare for on-site evaluation.
Receive recognition status within the first quarter of the fiscal year.
Goal 3
Continuation of management succession planning.
Objectives:
Identify critical training for each position of management.
Identify the education requirements to achieve advancement.
Performance Objectives
Continue archiving paper police records to digital format.
Receive recognition status through the Texas Police Chief’s Association Law Enforcement
Recognition/”Best Practices” program.
Continue with management succession planning.

172
Measurable Outcomes:
Increase storage space through technology.
Receive recognition status.
Completed advancement objectives for the existing management team.
Police Actual Actual Budget Budget
Administration 2013/2014 2014/2015 2015/2016 2016/2017
Demand
Population Increase 1% 1% 1.6% 8.0%
Calls for Service 57,356 64,000 72,641 65,025
Service Area (miles) 36.64 36.64 36.64 36.64
Workload
Division Staffing 10 10 9 9
Arrests 1,673 2,952 2,107 2,700
Operating budget $1,510,329 $1,455,280 $1,455,853 $1,508,684
Productivity
Average cost per Citizen $27.16 26.49 24.2 22.31
Department Budget Meetings 8 8 15 8
Effectiveness
Department Turnover 0 0 0 0
Training Hours per Officer 80.75 80 80.75 120
Percent of Mandatory Training Over 100% Over 100% Over 100% Over 100%
Police Administration Actual Budget Budget % Change
Summary 2014-2015 2015-2016 2016-2017 2016-2017
Personnel Services 880,241$ 894,763$ 963,303$ 7.66%
Operations 575,039 561,089 545,381 -2.80%
Capital
Projects
Total 1,455,280$ 1,455,852$ 1,508,684$ 3.63%
Police Administration 2014-2015 2015-2016 2016-2017 2016-2017
Full Time Equivilent Positions Budget Budget Budget Additions
Police Chief 1 1 1
Assistant Chief 1 1 1
Training Sergeant 1 1 1
Administrative Assistant 1 1 1
Custodian 1 1 1
Administrative Support 4 4 4
Total 9 9 9 0

173
COMMUNICATIONS
Department at a Glance
The Communications Department includes the Communications Supervisor, one radio systems manager,
one assistant radio systems manager and twenty-one dispatch positions. The Communications Department
budget increased 1.94% due to a merit increase, additional radios and radio related equipment, annual
contract service cost increases and supply cost increases.
Key Goals and Objectives
Goal 1
Provide a high level of call taking service with the community during 9-1-1 emergency calls into the
Communications Center Program.
Objectives:
Complete a minimum of thirty quality assurance reviews monthly on random 9-1-1 emergency
calls.
Review calls with employees in any area of call taking that shows a need for improvement during
quality assurance reviews.
Goal 2
Improve officer safety and response time.
Objectives:
Establish automated vehicle location system.
Ensure all Communications employees receive training for proficiency.
Goal 3
Engage in the community to educate citizens about the Communications Department and the services
provided to them.
Objectives:
Participate in an educational role in four community programs/events.
Demonstrate the proper purpose of the Public Safety Answering Point.
Performance Objectives
Enhance the Communications Department (Tele Communicator) in-service training program.
Enhance the emergency readiness plan for the Communication Department.
Engage in the community to educate citizens about the Communications Department and the
services provided to them.

174
Measurable Outcomes:
Develop policy and procedures and train Communications employees to obtain EMD
certification.
Complete install of hardware/software and train Communications personnel in the automated
vehicle location system by March 31, 2017.
Participate in four community functions and educate citizens about the Communications
Department.
Actual Actual Budget Budget
Communications 2013/2014 2014/2015 2015/2016 2016/2017
Demand
Calls for Service 86,627 98,363 95,000 93,500
911 calls for Service 36,166 40,471 43,000 38,500
Workload
Calls for Service 86,627 98,363 95,000 93,500
Calls for Service per 8 hour shift 79 90 91 85
911 calls per 8 hour shift 33 37 39 35
Productivity
Avg. Cost per Citizen $ 33.15 $ 39.30 $ 44.35 $ 42.24
Average Staffing per Shift 4 4 4 4
Effectiveness
Dispatched calls under 8 minutes 97% 96% 97% 97%
Percent of mandatory training 100% 100% 100% 100%
Communications Actual Budget Budget % Change
Summary 2014-2015 2015-2016 2016-2017 2016-2017
Personnel Services 1,657,182$ 1,936,074$ 2,046,790$ 5.72%
Operations 630,640 686,159 626,422 -8.71%
Capital
Projects
Total 2,287,822$ 2,622,233$ 2,673,212$ 1.94%
Communications 2014-2015 2015-2016 2016-2017 2016-2017
Full Time Equivilent Positions Budget Budget Budget Additions
Communications Supervisor 1 1 1
Radio Systems Manager 1 1 1
Assistant Radio Systems Mgr. 1 1 1
Dispatchers 21 21 21
Total 24 24 24 0

175
PATROL
Department at a Glance
The Police Patrol Department includes the Assistant Police Chief, one Captain, six Sergeants, five
Corporals and thirty-eight patrol officers. The Patrol Department increased 9.13% due to a merit increase,
overtime increases, the addition of one patrol position and increased costs for additional computers and
related supplies.
Key Goals and Objectives
Goal 1
Improve patrol officers’ cross training.
Objectives:
Officers will rotate with other units (i.e. auto theft, Criminal Investigations, K-9) to experience
other aspects of the department, when scheduling allows.
Assign supervisors to districts to identify crime trends and develop and implement plans to deal
with the issues.
Goal 2
Implement the use of an Officer Committee.
Objectives:
Improve the communication between patrol officers and supervisors/administration.
Receive ideas and feedback from patrol representatives in reference to improving the Patrol
Department.
Goal 3
Improve response times for calls for service.
Objectives:
Enhance the technology capturing in route and on scene times.
Add technology to track and select the closest available unit.
Performance Objectives
Enhance community relationships by establishing and initiate the District Corporal Program to
improve relationships and project a positive light on the Mansfield Police Department within the
Community.
Expand the Patrol Officer’s involvement with the Police Department.
Initiate the Emergency Decal Program for Mansfield Businesses.

176
Measurable Outcomes:
Measured by morale improvement of officers as they are able to experience things within the
department they have not had an opportunity to do so before.
Measured by the decrease of inaccurate information that patrol officers receive.
Measured by a decrease in the overall response time by 10%.
Actual Actual Budget Budget
Patrol 2013/2014 2014/2015 2015/2016 2016/2017
Demand
Calls for Service 56,606 69,517 75,000 65,025
911 calls for Service 36,132 28,602 44,000 27,150
Service Area 36.64 36.64 36.64 36.64
Workload
Departmental Staffing 49 49 51 54
Departmental Budget $5,522,057 $5,327,915 $6,045,542 $6,597,419
Traffic Citations 5,267 6,721 5,500 4,790
DWI Arrests 116 86 160 128
Accidents-Non-Injury 465 594 485 600
Accidents-Injury 315 362 345 410
Productivity
Average Cost per citizen $ 93.43 $ 94.70 $ 99.41 $ 104.25
Average Staffing per Shift 8 8 8 8
Patrol Officers per square mile 0.2 1 1 1.47
Effectiveness
Calls Answered under 8 minutes 82% 81% 82% 82%
Turnover 1 2 1 4
Accidents-Injury 315 362 345 410
Patrol Actual Budget Budget % Change
Summary 2014-2015 2015-2016 2016-2017 2016-2017
Personnel Services 4,785,517$ 5,457,199$ 5,966,477$ 9.33%
Operations 542,398 588,344 630,943 7.24%
Capital
Projects
Total 5,327,915$ 6,045,542$ 6,597,420$ 9.13%
Patrol 2014-2015 2015-2016 2016-2017 2016-2017
Full Time Equivilent Positions Budget Budget Budget Additions
Assistant Chief 1 1 1
Captain 1 1 1
Patrol Sergeant 5 5 5
Training Sergeant 1 0 0
Patrol Corporals 5 6 6
Patrol Officers 38 38 39 1
Total 51 51 52 1

177
TRAFFIC
Department at a Glance
The Traffic Department captures actual costs and performance measures of traffic enforcement and
investigations within the City. The Traffic Department consists of one traffic investigator and two motor
officers. The Traffic Department budget increased 4.85% due to a merit increase, overtime increases and
supply cost increases.
Key Goals and Objectives
Goal 1
Reduce the number of violations of motor vehicles violating the “Move Over Law.”
Objectives:
Conduct baseline survey by November 1 to track effectiveness of the listed goal in the Highway
287 corridor.
Utilize dedicated time periods (minimum of 8 hours per month) to detect and enforce violations
of vehicles passing authorized emergency vehicles in closest lane or failing to reduce speed to
enhance officer safety.
Goal 2
Continue to identify and enforce violations of Handicap Parking and Fire Lane parking statutes in major
commercial areas along the Highway 287 corridor, with a “zero tolerance” policy.
Objectives:
Observe dedicated spaces within the target area and ascertain the spaces are properly marked.
Contact businesses to address spaces that do not comply with required markings for corrective
actions.
Utilize dedicated time periods (minimum of 2 area checks per day) to detect and enforce
violations of unauthorized vehicles utilizing marked and dedicated handicap spaces.
Goal 3
Continue to monitor traffic violations in high collision areas with a goal of reducing hazardous violations
by 10%.
Objectives:
Work dedicated details (at least 2 hours per week) in areas defined as “high collision areas” based
on stats and data provided by the Crime Analyst.
Utilize message board and speed detection trailer as a visual reminder to motorists of specific
issues.
Performance Objectives
Reduce the number of violations of the “Move Over Law” occurring on the roadways,
creating a first responder safety issue.
Enhance the enforcement of traffic violations in and around active school zones to provide
for a safer environment for children.
Continue to monitor traffic violations in high collision areas with the goal of reducing
violations.

178
Measurable Outcomes:
Reduce the number of violations for “Move Over Law” on the highways of the City of Mansfield
by 25%.
Identify and enforce Handicap and Fire Lane parking violations in the Hwy 287 corridor with a
“zero tolerance” approach to violations, thereby reducing safety issues for both citizens and first
responders.
Reduce the number of hazardous traffic violations in identified “high collision areas” by 10%.
Actual Actual Budget Budget
Traffic 2013/2014 2014/2015 2015/2016 2016/2017
Demand
Calls for Service 3,273 3,189 3,402 3,650
911 calls for Service 34 35 51 55
Service Area 36.64 36.64 36.64 36.64
Workload
Department Staffing 3 2 3 3
Arrests 1 0 1 1
Traffic Citations 2,787 2,789 1,986 1,414
DWI Arrests 0 0 0 0
Accidents-Non Injury 11 40 37 75
Accidents-Injury 2 37 21 35
Productivity
Accidents-Non Injury 11 40 37 75
Accidents-Injury 17 37 21 35
Effectiveness
Accidents-Non Injury 11 40 37 75
Accidents-Injury 17 37 21 35
Traffic Actual Budget Budget % Change
Summary 2014-2015 2015-2016 2016-2017 2016-2017
Personnel Services 384,445$ 403,380$ 426,430$ 5.71%
Operations 30,899 40,900 39,387 -3.70%
Capital
Projects
Total 415,344$ 444,280$ 465,817$ 4.85%
Traffic 2014-2015 2015-2016 2016-2017 2016-2017
Full Time Equivilent Positions Budget Budget Budget Additions
Traffic Investigator 1 1 1
Motor Officers 2 2 2
Total 3 3 3 0

179
COMMERCIAL VEHICLE ENFORCEMENT
Department at a Glance
The Commercial Vehicle Enforcement Department includes one Sergeant and one patrol officer. The
Commercial Vehicle Enforcement budget increased 19.55% due to merit increase, overtime increases and
salary adjustments.
Key Goals and Objectives
Goal 1
Continue to reduce violations through education and enforcement on Federal Motor Carrier Safety
Alliance regulated private passenger carrier vehicles within the City limits of Mansfield.
Objectives:
Increase enforcement on smaller, for-hire “party” vehicles, such as small buses and limousines
carrying passengers within the City for events.
Locate and seek out at least one additional qualifying carrier within City limits and provide
education and assistance with gaining and maintaining compliance.
Goal 2
Continue to reduce Hazardous Traffic violations by commercial motor vehicles utilizing roadways in the
City limits by 25%.
Objectives:
Establish baseline survey within 30 days to trace effectiveness of the listed goal.
Utilize dedicated time periods (minimum of 4 hours per week) to detect and enforce Hazardous
Traffic violations on the roadways of the City of Mansfield.
Goal 3
Continuation of targeted and random enforcement activities to ensure commercial motor vehicle safety
within the City limits of Mansfield and surrounding jurisdictions.
Objectives:
Use of random and targeted safety inspections, as outlined by the Commercial Vehicle Safety
Alliance and Texas Department of Public Safety, to continue the reduction of commercial motor
vehicle non-compliance within the territorial limits of Mansfield.
Continue to establish relationships with local and regional carriers as a source of education and
support, with the goal of addressing potential issues, prior to vehicles and drivers utilizing area
roadways.
Performance Objectives
Increased identification of hazardous traffic violations committed by motor vehicles and
passenger cars operating around commercial motor vehicles.
Detect and enforce violations by hazardous materials transporters who utilize the roadways within
the City.
Continuation of specific and random inspection activities to respond to commercial motor vehicle
safety issues within the City of Mansfield and surrounding jurisdictions.

180
Measurable Outcomes:
Reduce weight and vehicle inspection violations.
Reduce injury and fatality accidents.
Increase contacts to educate current commercial vehicle companies to follow local, state and federal
guidelines.
Actual Actual Budget Budget
Commercial Vehicle Enforcement 2013/2014 2014/2015 2015/2016 2016/2017
Demand
Calls for Service 1,405 1,767 1,700 2,050
911 calls for Service 104 47 50 95
Service Area 36.69 36.69 36.69 36.69
Workload
Arrests 13 13 16 19
Traffic Citations 1,268 1,653 1,600 1,815
DWI Arrests 1 0 2 1
Accidents-Non Injury 22 5 26 60
Accidents-Injury 19 2 22 30
Productivity
Average Cost per Citizen $ 4.29 $ 4.29 $ 4.58 $ 5.23
Officers per Square Mile 0.05 0.05 0.05 0.08
Effectiveness
Contacts 1,601 618 2,100 2,200
Inspections 682 496 800 875
Infractions 1,834 1,489 2,100 2,200
Vehicles Placed Out of Service 199 193 200 225
Weight Violations 89 74 105 130
Vehicles With No Violations 297 137 344 348
Post Crash Inspections 4 3 6 8
Federal Citations Issued 267 216 295 315
State Citations Issued 1,001 1,370 1,100 1,500
Accidents-Injury 19 5 20 30
Accidents-Fatality 1 2 2 2
Percent of Mandatory Training 100% 100% 100% 100%
Commercial Vehicle Enforcement Actual Budget Budget % Change
Summary 2014-2015 2015-2016 2016-2017 2016-2017
Personnel Services 229,407$ 240,155$ 296,653$ 23.53%
Operations 25,388 36,870 34,542 -6.31%
Capital
Projects
Total 254,795$ 277,025$ 331,194$ 19.55%
CVE 2014-2015 2015-2016 2016-2017 2016-2017
Full Time Equivilent Positions Budget Budget Budget Additions
Sergeant 1 1 1
Patrol Officer 1 1 1
Total 2 2 2 0

181
CRIMINAL INVESTIGATIONS
Department at a Glance
The Criminal Investigation Department includes one captain, three sergeants, one victim assistance
coordinator, ten detectives, two property technicians, one civilian investigator and one crime analyst. The
CID budget increased 1.20% due to a merit increase and the reorganization of the Police Division.
Key Goals and Objectives
Goal 1
Clear 80% of all cases within 60 days of assignment.
Objectives:
Supervisors will monitor cases and ensure each has received adequate attention and all reasonable
leads have been exhausted.
Captain will hold monthly staff meetings and review open cases with Sergeants and Detectives.
Goal 2
All employees in CID will attend at least 16 hours of additional continuing education specific to their
areas of assignment.
Objectives:
During employee evaluation in October 2016, employees will be tasked with finding a class or
conference that provides continuing education specific to their job role.
Supervisors will adjust work and on-call scheduling of other members of the unit to ensure these
continuing education opportunities can be accomplished for each member.
Goal 3
Property Technicians and Property Room Supervisor will improve the current process of storage and
retention of evidence, resulting in 25% more usable shelf space.
Objectives:
Property Room Sergeant will ensure Property Technicians are presenting timely property
disposition requests to detectives for assessments.
Property Technicians will establish a new storage bin template design that organizes and uses all
available space more effectively.
Performance Objectives
Utilize technology to enhance property storage to provide the most efficient storage, retrieval,
processing and disposition of all property and evidence.
Enhance the time allocation of Criminal Investigators.
Enhance the existing division technology to improve efficiency.
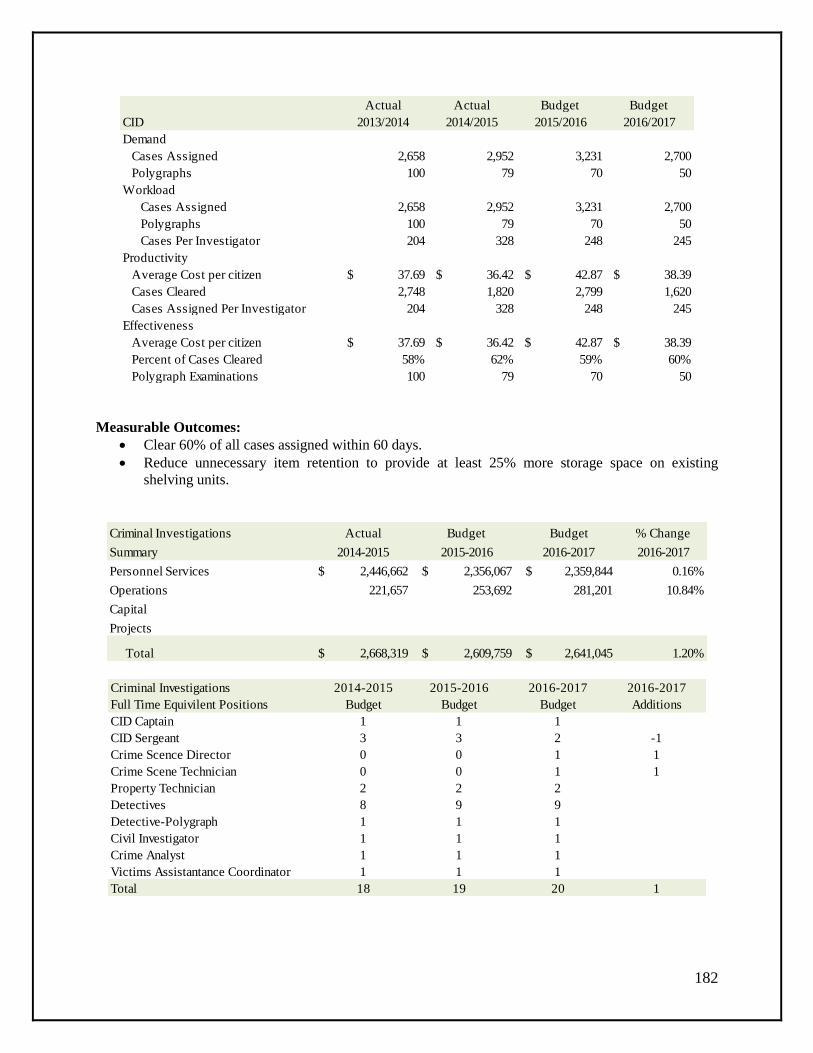
182
Measurable Outcomes:
Clear 60% of all cases assigned within 60 days.
Reduce unnecessary item retention to provide at least 25% more storage space on existing
shelving units.
Actual Actual Budget Budget
CID 2013/2014 2014/2015 2015/2016 2016/2017
Demand
Cases Assigned 2,658 2,952 3,231 2,700
Polygraphs 100 79 70 50
Workload
Cases Assigned 2,658 2,952 3,231 2,700
Polygraphs 100 79 70 50
Cases Per Investigator 204 328 248 245
Productivity
Average Cost per citizen $ 37.69 $ 36.42 $ 42.87 $ 38.39
Cases Cleared 2,748 1,820 2,799 1,620
Cases Assigned Per Investigator 204 328 248 245
Effectiveness
Average Cost per citizen $ 37.69 $ 36.42 $ 42.87 $ 38.39
Percent of Cases Cleared 58% 62% 59% 60%
Polygraph Examinations 100 79 70 50
Criminal Investigations Actual Budget Budget % Change
Summary 2014-2015 2015-2016 2016-2017 2016-2017
Personnel Services 2,446,662$ 2,356,067$ 2,359,844$ 0.16%
Operations 221,657 253,692 281,201 10.84%
Capital
Projects
Total 2,668,319$ 2,609,759$ 2,641,045$ 1.20%
Criminal Investigations 2014-2015 2015-2016 2016-2017 2016-2017
Full Time Equivilent Positions Budget Budget Budget Additions
CID Captain 1 1 1
CID Sergeant 3 3 2 -1
Crime Scence Director 0 0 1 1
Crime Scene Technician 0 0 1 1
Property Technician 2 2 2
Detectives 8 9 9
Detective-Polygraph 1 1 1
Civil Investigator 1 1 1
Crime Analyst 1 1 1
Victims Assistantance Coordinator 1 1 1
Total 18 19 20 1

183
MUNICIPAL COURT
Department at a Glance
The Municipal Court Department includes one Municipal Judge, one court administrator, one bailiff and
four court clerks. Three associate judges are funded on a contractual basis. The Municipal Court budget
increased 5.79% in due to a merit increase, annual contract fee increases and per service cost increases.
Key Goals and Objectives
Goal 1
Reduce wait time at the window by at least 15%.
Objectives:
Fully integrate automated document fill of known information to speed the process at the window
and for those waiting in line.
Maintain two clerk minimum staffing at the window whenever possible.
Goal 2
Increase continuing education (CE) for each member of the department.
Objectives:
Research and assign in-house CE training to each member of the department that is specific to
their assigned roles. Minimum of 4 hours for each member.
Send each member to at least one outside sourced training event to assist in developing
networking among other agencies in the area. Minimum of 8 hours for each member.
Goal 3
Technology improvements acquired for better customer service experience.
Objectives:
Assess and select the most appropriate software for better integration of online payments in
conjunction with the encode software package.
Further utilize the phone tree automated calling system to remind defendants of such events as
due dates for payments, court dates, etc.
Performance Objectives
Enhance customer service by reducing the wait time at the customer service window.
Provide additional continuing education for all clerks above and beyond that which is mandated.
Enhance warrant compliance initiatives.
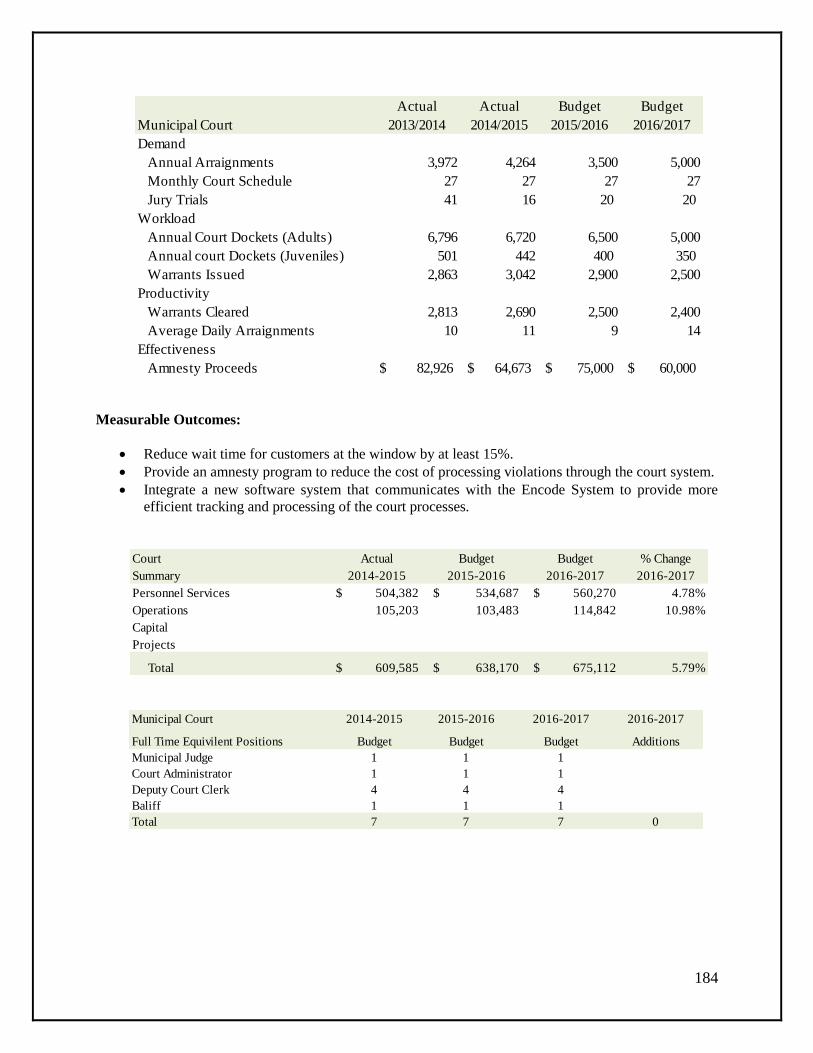
184
Measurable Outcomes:
Reduce wait time for customers at the window by at least 15%.
Provide an amnesty program to reduce the cost of processing violations through the court system.
Integrate a new software system that communicates with the Encode System to provide more
efficient tracking and processing of the court processes.
Actual Actual Budget Budget
Municipal Court 2013/2014 2014/2015 2015/2016 2016/2017
Demand
Annual Arraignments 3,972 4,264 3,500 5,000
Monthly Court Schedule 27 27 27 27
Jury Trials 41 16 20 20
Workload
Annual Court Dockets (Adults) 6,796 6,720 6,500 5,000
Annual court Dockets (Juveniles) 501 442 400 350
Warrants Issued 2,863 3,042 2,900 2,500
Productivity
Warrants Cleared 2,813 2,690 2,500 2,400
Average Daily Arraignments 10 11 9 14
Effectiveness
Amnesty Proceeds 82,926$ 64,673$ 75,000$ 60,000$
Court Actual Budget Budget % Change
Summary 2014-2015 2015-2016 2016-2017 2016-2017
Personnel Services 504,382$ 534,687$ 560,270$ 4.78%
Operations 105,203 103,483 114,842 10.98%
Capital
Projects
Total 609,585$ 638,170$ 675,112$ 5.79%
Municipal Court 2014-2015 2015-2016 2016-2017 2016-2017
Full Time Equivilent Positions Budget Budget Budget Additions
Municipal Judge 1 1 1
Court Administrator 1 1 1
Deputy Court Clerk 4 4 4
Baliff 1 1 1
Total 7 7 7 0

185
COMMUNITY RESOURCES
Department at a Glance
The Community Resource Department includes five Community Resource Officers. The Community
Resource Department budget increased 287.81% due to the transfer of four additional officers to the
department and a merit increase.
Key Goals and Objectives
Goal 1
Develop Emergency Response Team (ERT) from among Citizen on Patrol participants.
Objectives:
Train members to respond to critical incidents and provide support.
ERT to provide rehab, nourishment and support services.
Goal 2
Increase citizen volunteer participation in the department.
Objectives:
Increase citizen Police Academy registration to a total of 20.
Expand the role of Volunteer in Policing members in all events involving the department.
Goal 3
Provide a rolling store-front officer.
Objectives:
Conduct a business meeting inviting all corridor representatives to meet each other and discuss
their challenges and security suggestions.
Place a rolling store-front officer in the Highway 287 corridor, changing the location bi-monthly.
Performance Objectives
Develop Emergency Response Support Team (ERST) from volunteer Citizen on Patrol
participants.
Maintain high visibility in City parks and the business corridor during peak hours.
Enhance the Business 287 corridor enforcement.
Continue to increase the volunteer staff for the Police Department and implement a new volunteer
program for office staff.

186
Measurable Outcomes:
ERT of at least 6 members developed and trained by June 1, 2016.
Increase Citizens on Patrol Academy numbers by 3.
Place rolling store-front in at least 8 different locations throughout the year.
Actual Actual Budget Budget
Community Resources 2013/2014 2014/2015 2015/2016 2016/2017
Demand
High Schools Serviced 6 6 6 6
Special Events 6 10 12 10
Citizen Police Academy Classes 1 1 1 2
Workload
Community Programs Attended 70 80 95 120
Average Class-Citizen Academy 10 15 20 15
Children fingerprinted 100 100 125 150
Productivity
Average Cost per citizen $4.23 $4.18 $2.70 $10.07
Home Inspections 20 8 18 20
Effectiveness
Percent of Scheduled Meetings 100% 100% 100% 100%
Children fingerprinted 100 100 125 150
Community Resource Actual Budget Budget % Change
Summary 2014-2015 2015-2016 2016-2017 2016-2017
Personnel Services 171,059$ 106,487$ 575,513$ 440.45%
Operations 44,647 57,932 62,126 7.24%
Capital
Projects
Total 215,705$ 164,419$ 637,639$ 287.81%
Community Resources 2014-2015 2015-2016 2016-2017 2016-2017
Full Time Equivilent Positions Budget Budget Budget Additions
Community Resource Officers 2 1 5 4
Total 2 1 5 4

187
K-9 SERVICES
Department at a Glance
The K-9 Department increased 4.40% due to a merit increase and additional K-9 handler training
requirements.
Key Goals and Objectives
Goal 1
Provide the Patrol Department with intensive training on establishing a perimeter in the event of a K-9
tracking incident.
Objectives:
Provide classroom training with clearly defined objectives to be used in the field.
Provide scenario based training during the hours of daylight and darkness.
Goal 2
Continue to be the leader in the multi-agency training group that has been established.
Objectives:
Search for new training sites not only within the City, but also in surrounding cities.
Reach out to other agencies that may be in need of joining an established training group.
Goal 3
Develop a multi-agency agreement with the use of a K-9 Training Group.
Objectives:
Establish a relationship with surrounding agencies in order to assist or request assistance when
needed.
Establish a relationship with the Tarrant County Narcotics Unit in order to assist them when
needed. Also allow them to have access to the members of the aforementioned training group.
Performance Objectives
Enhance training equipment and software to K9 officers to include implementation of technology
to aid in canine evaluations.
Continue K9 education for the Mansfield Police Department and outside agencies.
Enhance emergency protocols for canine and handler injuries.

188
Measurable Outcomes:
Increase the number of Burglary Alarms, Burglary-in-Progress and Robbery-in-Progress calls the
K-9 Unit responds to by at least 25%.
Complete training for the Patrol Department within the first quarter of FY 2016-2017.
Increase the number of “Assist Other Agency” calls the K-9 Unit responds to by 25%.
Actual Actual Budget Budget
K-9 2013/2014 2014/2015 2015/2016 2016/2017
Demand
Request for Assistance 54 55 60 60
Workload
Building Searches 14 13 23 17
Assist other Agencies 26 14 30 30
Narcotic searches 38 21 45 50
Productivity
Average Cost per citizen $ 3.86 $ 3.81 $ 3.98 $ 3.99
Percent of Narcotic Finds 20% 45% 20% 30%
Effectiveness
Percent of Narcotic Finds 20% 45% 20% 30%
Average Cost per citizen $ 3.86 $ 3.81 $ 3.98 $ 3.99
K-9 Actual Budget Budget % Change
Summary 2014-2015 2015-2016 2016-2017 2016-2017
Personnel Services 207,501$ 214,049$ 215,794$ 0.82%
Operations 11,535 28,009 36,922 31.83%
Capital
Projects
Total 219,036$ 242,057$ 252,716$ 4.40%
K-9 2014-2015 2015-2016 2016-2017 2016-2017
Full Time Equivilent Positions Budget Budget Budget Additions
K-9 Officer 2 2 2
Total 2 2 2 0

189
ANIMAL CARE AND CONTROL
Department at a Glance
The Animal Control Department budget increased 5.71% due to a merit adjustment, market adjustments
and supply costs.
Key Goals and Objectives
Goal 1
Increase City licensing and microchipping for domestic animals.
Objectives:
Streamline the reclaim process by targeting and licensing domestic animals that are not currently
licensed or microchipped.
Return more animals to their home in the field rather than taking them into the animal shelter.
Goal 2
Enhance the community/neighborhood educational program.
Objectives:
Create an educational pamphlet explaining City ordinances pertaining to animal ownership, such
as barking dog, City licenses, rabies vaccination, at large, and basic care requirements.
Send Animal Control officers, as well as volunteers in the Police Program, into neighborhoods to
speak with citizens and distribute educational pamphlets in an attempt to reduce the number of
calls for service in the neighborhood.
Goal 3
Post intake animals online in an attempt to reunite them with their owners.
Objectives:
Post descriptions of animals brought into the animal shelter on the City website as well as
Facebook to increase animal reclaims.
Create an interactive map for the City website to allow the public to see where animals have been
impounded as well as to track problem areas.
Performance Objectives
Improve spay and neuter of adoptable animals prior to adoption.
Enhance the Emergency Evacuation Plan for shelter of animals and community livestock.
Increase community/neighborhood outreach programs.

190
Measurable Outcomes:
Increase City licensing and microchipping for domestic animals by 10%.
Conduct monthly door-to-door educational community contacts.
Improve opportunities to reunite owners with lost animals by posting intake animal profiles
online.
Actual Actual Budget Budget
Animal Control 2013/2014 2014/2015 2015/2016 2016/2017
Demand
Annual Service Calls 3,228 2,654 3,750 3,000
Animals Impounded 2,295 1,826 2,500 2,000
Workload
Animals Impounded 2,295 1,826 2,500 2,000
Animals Reclaimed, Rescued etc. 797 716 700 700
Animals Euthanized 657 636 650 600
Productivity
Animals Adopted 611 354 800 530
Animal Control Deposits $34,876 $37,942 $50,000 $49,000
Effectiveness
Animals Adopted 611 354 800 530
Animals Impounded 2,295 1,826 2,500 2,000
Service Calls answered within 24 100% 100% 95% 100%
Animals Returned as % 61% 39% 65% 35%
Animals Euthanized as % 29% 35% 35% 28%
Animal Control Actual Budget Budget % Change
Summary 2014-2015 2015-2016 2016-2017 2016-2017
Personnel Services 483,548$ 490,805$ 529,108$ 7.80%
Operations 123,391 149,711 148,001 -1.14%
Capital
Projects
Total 606,940$ 640,516$ 677,109$ 5.71%
Animal Control 2014-2015 2015-2016 2016-2017 2016-2017
Full Time Equivilent Positions Budget Budget Budget Additions
Animal Control Manager 1 1 1
Animal Control Officers 3 3 3
Kennel Technician 2 2 2
Receptionist 1 1 1
Total 7 7 7 0

191
TRAINING
Department at a Glance
The Training Department budget decreased less than 1% due to estimated reduced supply requirements.
No full-time equivalents or personnel costs are included in the Training budget.
Key Goals and Objectives
Goal 1
Enhance the officer’s preparedness for weapons system transitions/malfunctions.
Objectives:
Enhance knowledge of weapon handling skills during weapon transitions/malfunctions on all
weapons the officer is required to carry.
Build officer’s confidence to survive during equipment failures through ongoing training drills.
Goal 2
Improve in-house training for continuing education for police officers, tele-communicators, corrections
officers, and civilians.
Objectives:
Host two in-house classes per month, with one focusing on civilian staff.
Provide the maximum amount of opportunity for our staff/officers to attend in-house training in a
cost effective manner.
Goal 3
Increase officer readiness through verbal de-escalation and weapon selection training.
Objectives:
Increase individual police officer’s and correctional officer’s skill level by providing additional,
ongoing one-on-one simulator based training at least monthly.
Build officer’s confidence and skill level with verbal de-escalation techniques and weapons
selection, through simulator scenario training.
Performance Objectives
Enhance the officer’s preparedness for equipment malfunctions.
Improve in-house training for continuing education.
Enhance each sworn officer’s scenario training.

192
Measurable Outcomes:
Provide quarterly weapons systems transitions/malfunction training drills for all sworn officers.
Host two in-house training classes per month for a total of twenty four for the fiscal year.
Provide monthly readiness simulator based training to each police officer and correctional officer.
Tactical Actual Actual Budget Budget
Training Facility (Range) 2013/2014 2014/2015 2015/2016 2016/2017
Demand
Staff Trained (City) N/A 101 101 104
Certified Police Officers Trained N/A 0 32 40
Range Operation Hours (Total) N/A 254 977 1000
Range Maintenance Hours (Total) N/A 28 80 70
TCOLE Required Training hours N/A 2 2 2
Firearms Instructors (Number) N/A 5 5 5
Firearms Instructors Range Training N/A 0 206 200
Workload
Certified Police Officers (City) N/A 101 101 104
Certified Fire Officers (City) N/A 5 5 5
Certified Police Officers Trained N/A 0 32 30
Specialized Training Courses N/A 0 2 3
Specialized Training Hours N/A 0 100 100
TCOLE Mandated Qualifying N/A 1 1 1
TCOLE Mandated Night Qualifying N/A 0 1 1
Productivity
Certified Police Officers (City) N/A 101 101 104
Certified Fire Officers (City) N/A 5 5 5
Certified Police Officers Trained N/A 0 32 30
Specialized Training Courses N/A 0 2 3
Specialized Training Hours N/A 0 100 100
Effectiveness
Training Hours per FTE N/A 4 13 16
Training Actual Budget Budget % Change
Summary 2014-2015 2015-2016 2016-2017 2016-2017
Personnel Services
Operations 155,906 158,252 158,129 -0.08%
Capital
Projects
Total 155,906$ 158,252$ 158,129$ -0.08%

193
AUTO BURGLARY & THEFT PREVENTION AUTHORITY GRANT
Department at a Glance
The Mansfield Police Division has received a grant through the Texas Automobile & Theft Prevention
Authority (ABTPA) since 2011. Each year the Police Division submits for funding to operate a multi-
agency Task Force to combat auto thefts and thefts from vehicles. In FY 2016-2017, $278,838 is
budgeted for grant funds. These funds provide 80% of the salaries for five full-time investigators and one
secretary. City of Mansfield personnel include one secretary, one investigator and one administrator. The
Task Force coverage area includes Ellis and Johnson Counties and the Cities of Mansfield, Burleson and
Kennedale.
Key Goals and Objectives
Goal 1
Reduce auto theft.
Objectives:
Reduce auto theft through proactive measures including but not limited to undercover operations
and vehicle inspections.
Collaborate with insurance agencies as well as other law enforcement agencies to combat auto
theft.
Goal 2
Reduce auto burglary.
Objectives:
Reduce auto burglary through proactive measure including but not limited to undercover
operations and vehicle inspections.
Collaborate with insurance agencies as well as other law enforcement agencies to combat auto
burglary.
Goal 3
Improve public awareness/prevention.
Objectives:
Educate and inform the citizens on prevention methods.
Educate and train area wide law enforcement on auto theft.
Performance Objectives
Reduction in auto thefts.
Reduction in auto burglaries.
Increased public awareness and prevention.
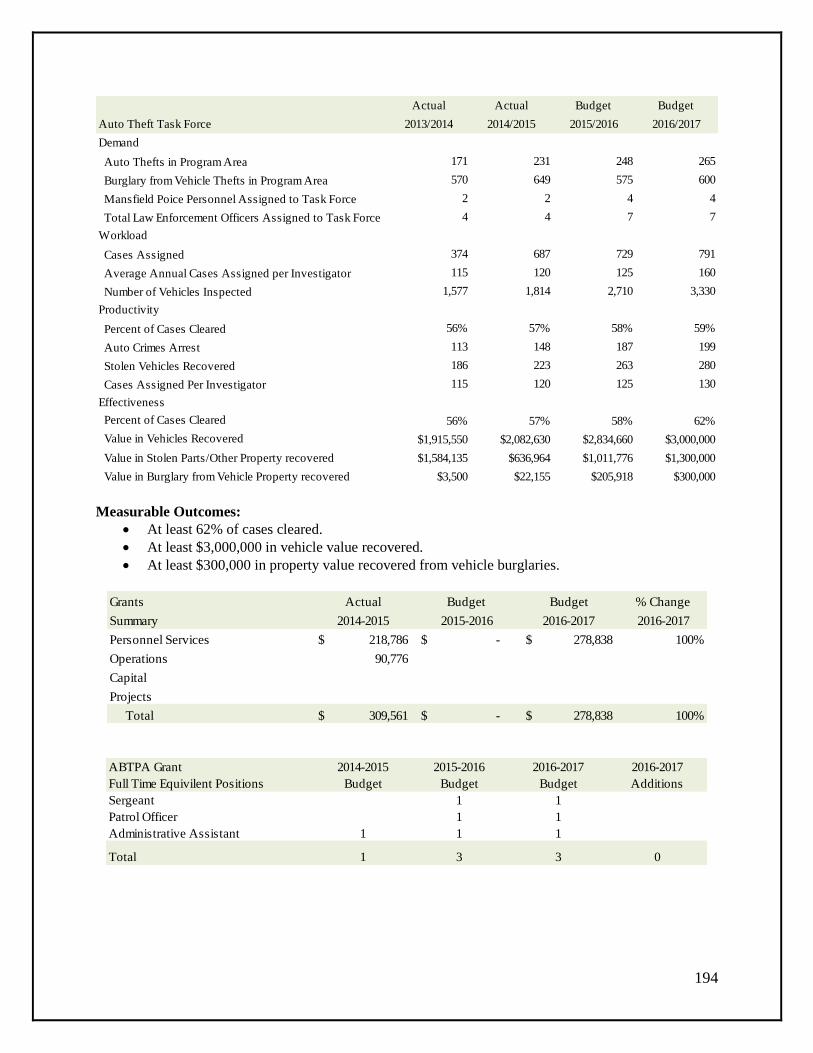
194
Measurable Outcomes:
At least 62% of cases cleared.
At least $3,000,000 in vehicle value recovered.
At least $300,000 in property value recovered from vehicle burglaries.
Actual Actual Budget Budget
Auto Theft Task Force 2013/2014 2014/2015 2015/2016 2016/2017
Demand
Auto Thefts in Program Area 171 231 248 265
Burglary from Vehicle Thefts in Program Area 570 649 575 600
Mansfield Poice Personnel Assigned to Task Force 2 2 4 4
Total Law Enforcement Officers Assigned to Task Force 4 4 7 7
Workload
Cases Assigned 374 687 729 791
Average Annual Cases Assigned per Investigator 115 120 125 160
Number of Vehicles Inspected 1,577 1,814 2,710 3,330
Productivity
Percent of Cases Cleared 56% 57% 58% 59%
Auto Crimes Arrest 113 148 187 199
Stolen Vehicles Recovered 186 223 263 280
Cases Assigned Per Investigator 115 120 125 130
Effectiveness
Percent of Cases Cleared 56% 57% 58% 62%
Value in Vehicles Recovered $1,915,550 $2,082,630 $2,834,660 $3,000,000
Value in Stolen Parts/Other Property recovered $1,584,135 $636,964 $1,011,776 $1,300,000
Value in Burglary from Vehicle Property recovered $3,500 $22,155 $205,918 $300,000
Grants Actual Budget Budget % Change
Summary 2014-2015 2015-2016 2016-2017 2016-2017
Personnel Services 218,786$ -$ 278,838$ 100%
Operations 90,776
Capital
Projects
Total 309,561$ -$ 278,838$ 100%
ABTPA Grant 2014-2015 2015-2016 2016-2017 2016-2017
Full Time Equivilent Positions Budget Budget Budget Additions
Sergeant 1 1
Patrol Officer 1 1
Administrative Assistant 1 1 1
Total 1 3 3 0

195
Administration
Administer Fire Department Operations
Protect all citizens from hazards
Protect all employees from hazards
Maintain a highly skilled workforce
Provide ambulance billing services
Fire Operations
Provide pre-hospital emergency care
& transportation
Update medical protocols annually
Respond to fire/EMS calls promptly
Prevention
Provide annual Fire Inspection
Services
Reduce the risks & effects of fire
Enforce fire codes & laws
Emergency Management
Monitor weather conditions
Develop and implement emergency disaster
procedures
Review and update Emergency Operations Plans
Test emergency operations plans
FIRE DIVISION
Fire Division Highlights
The Fire Division is projected to transport 2,848 patients in FY
2016-2017.
90% of the time, calls for service are answered within 8 minutes.
100% of mandatory training is provided.
9,643 calls for service are projected in FY 2016-2017.

196
MISSION STATEMENT FOR THE FIRE DIVISION:
Mansfield Fire Rescue is a customer service organization that exists to protect the lives and property of
our citizens, members, and visitors, and to foster the feeling of safety – any place, any time – through
planning, mitigation, response, and restoration.
VISION STATEMENT: We will give an all-out effort to refine our service delivery, expand our capabilities, increase our
efficiency, and elevate the superior level of customer service we now provide to continually heighten the
standard of excellence in our industry.
Do You Know?
The Mansfield Fire Department responds to 90% of all calls in less than 8 minutes.
Actual Budget Budget % Change
Departments 2014-2015 2015-2016 2016-2017 2016-2017
Fire Administration 817,322$ 887,355$ 951,270$
Prevention 658,548 721,605 739,135 2.43%
Emergency Management 51,203 187,649 209,517 11.65%
Fire Operations 9,754,204 9,493,286 10,682,295 12.52%
Total 11,281,276$ 11,289,895$ 12,582,218$ 11.45%
Division Actual Budget Budget % Change
Summary 2014-2015 2015-2016 2016-2017 2016-2017
Personnel Services 9,975,477$ 9,938,792$ 11,116,377$ 11.85%
Operations 1,300,905 1,351,104 1,465,840 8.49%
Capital 4,894 - -
Projects
Total 11,281,276$ 11,289,895$ 12,582,218$ 11.45%

197
FIRE ADMINISTRATION
Department at a Glance
The Fire Administration Department increased by 7.20% due to a merit increase, market adjustments and
increases in ambulance billing costs. Fire Administration consists of the Fire Chief, Assistant Fire Chief,
Secretary and Administrative Services Coordinator.
Key Goals and Objectives
Goal 1
Maintain the safety and wellness of our personnel by being responsible and proactive towards compliance
with NFPA standards while promoting positive leadership.
Objectives:
Provide efficient staffing levels within admin to support activity of Fire and EMS operations by
adding a resource officer.
Provide the highest level of service to our customers and community through updated
technology/software, equipment and vehicles.
Increase training and support opportunities to our Citizens Response Team (CRT).
Goal 2
Protect our personnel and the public from hazards by reducing/eliminating unnecessary risks.
Objectives:
Complete the installation of the Opticom System at non-protected intersections for emergency
response control of traffic lights, increasing safety.
Replace PPE for personnel after 5 years to ensure the highest level of quality gear providing
protection, as well as ample reserve PPE.
Installation of exhaust removal systems in our apparatus bays within the fire stations.
Goal 3
Develop a replacement plan to maintain quality equipment with updated technology and safety devices.
Objectives:
Evaluate all fleet vehicles, equipment and computer devices that have surpassed a useful
lifespan, which results in increased maintenance costs and down time.
Replace all computer equipment (MDTs) to provide for improved technology and
performance.
Enhance station/vehicle maintenance management through records and training.
Performance Objectives
Maintain the safety, health and wellness of our personnel while promoting positive leadership.
Protect our staff from Line of Duty Hazards by reducing/eliminating risks.
Protect the City of Mansfield from liability.

198
Measurable Outcomes:
Reduction of injuries and illnesses with an increase in health and wellness awareness.
Reduction of maintenance costs related to newer vehicles and equipment.
Increase activity levels of CFAAA Support Team Training.
Actual Actual Budget Budget
Fire Administration 2013/2014 2014/2015 2015/2016 2016/2017
Demand
Population Increase 2.6% 1.5% 1.6% 1.9%
Fire Division Staff 83 83 83 86
Service Area (miles) 36.69 36.69 36.69 36.69
Workload
Patients Seen 3,746 4,063 4,063 4,478
Patients Transported 2,347 2,568 2,568 2,848
Information Tech Support Calls 275 279 281 285
Facilities Maintained 4 4 4 4
Productivity
Average Transport Time to Hospital 10:51 Minutes 10:34 Minutes 9.5 Minutes 10:23 Minutes
FTE per Capita 1.16 1.25 1.26$ 1.26$
Effectiveness
Average Transport Time to Hospital 10:51 Minutes 10:34 Minutes 9.5 Minutes 10:23 Minutes
Ambulance Billing (annual) $972,738 $1,052,932 $1,000,000 $1,200,000
Fire Administration Actual Budget Budget % Change
Summary 2014-2015 2015-2016 2016-2017 2016-2017
Personnel Services 543,990$ 566,997$ 609,361$ 7.47%
Operations 273,332 320,358 341,910 6.73%
Capital
Projects
Total 817,322$ 887,355$ 951,270$ 7.20%
Fire Administration 2014-2015 2015-2016 2016-2017 2016-2017
Full Time Equivilent Positions Budget Budget Budget Additions
Fire Chief 1 1 1
Assistant Fire Chief 1 1 1
Administrative/Technical Services 1 1 1
Secretary 1 1 1
Total 4 4 4 0

199
FIRE PREVENTION
Department at a Glance
The Fire Prevention Department budget increased 2.43% in FY 2016-2017 due to merit increase and
increases promotions and supply costs. The department consists of the Fire Marshal and four Fire
Inspectors. The general responsibilities include public education, fire inspection, fire investigation, gas
well inspections and emergency management.
Key Goals and Objectives
Goal 1
Increase Prevention Department staffing.
Objectives:
Reestablish the vital position of Assistant Fire Marshal, who will be responsible for all decisions
in the absence of the Fire Marshal and assist in day-to-day operations.
Add a dedicated plans examiner to address day-to-day completion of plan reviews and assist with
fire code recommendations as needed.
Add one additional inspector/investigator to enhance the department by allowing more
participation in inspections, public education, investigations and community service events.
Goal 2
Continue to provide current department staff with advanced training opportunities.
Objectives:
Provide continuing education and training in all facets of fire prevention, including public
education, fire and arson investigation, inspections and plan reviews in order to provide better
services to the citizens and customers of the City.
Goal 3
Streamline Fire Prevention Activities.
Objectives:
Proceed with the adoption and use of the 2015 International Fire Code with Local Amendments.
Enhance the process of fire safety inspections to maintain annual inspections of all businesses
within the City and enhance plan review and permitting processes to provide improved customer
service.
Cross train staff members in all areas of duties and responsibilities allowing for better support of
citizens, business owners, developers and other City staff.
Performance Objectives
Increase public education.
Develop and implement a company inspection program.
Increase the number of annual inspections.

200
Measurable Outcomes:
Provide for better allocation of work load among Fire Prevention employees.
Provide for advancement and educational opportunities within the Prevention Department.
Increase productivity by creating a better environment and tasks that complement the employees.
Actual Actual Budget Budget
Fire Prevention 2013/2014 2014/2015 2015/2016 2016/2017
Demand
Inspections 2,874 2,804 3,100 2,917
Alarm Inspections New 38 54 56 73
Fires Investigated 55 24 58 50
Workload
Gas Well Inspections 866 217 108 76
Plan reviews 228 325 260
Certificate of Occupancy Requested 143 151 230 250
Productivity
Avg. Cost per Citizen 11.38$ 11.38$ 10.00$ 9.83$
Attendance of Public Education Classes 26,000 15,287 27,000 22,500
Effectiveness
Fire deaths 0 0 0 0
ISO Rating 2 2 2 2
Fire Prevention Actual Budget Budget % Change
Summary 2014-2015 2015-2016 2016-2017 2016-2017
Personnel Services 591,403$ 636,388$ 652,281$ 2.50%
Operations 67,145 85,217 86,855 1.92%
Capital
Projects
Total 658,548$ 721,605$ 739,135$ 2.43%
Fire Prevention 2014-2015 2015-2016 2016-2017 2016-2017
Full Time Equivilent Positions Budget Budget Budget Additions
Fire Marshal 1 1 1
Fire Inspector 4 4 4
Total 5 5 5 0
201
FIRE EMERGENCY MANAGEMENT
Department at a Glance
The Emergency Department budget increased 11.65% due to a merit increase, overtime costs and
increased cost related to annual contract costs of gas detection equipment and replacement of flood gates.
The department includes one Emergency Management Coordinator.
Key Goals and Objectives
Goal 1
Improve service delivery and efficiency for Mansfield through increased staffing.
Objectives:
Develop a position for Assistant Emergency Manager.
Improved delivery of mandated training exercises for City staff.
Improved ability to research, apply and audit grant opportunities.
Goal 2
Improve warning and hazard protection capabilities to our citizens.
Objectives:
Replace/repair the creek level sensors and floodgates with annual maintenance program.
Purchase the Local Area Warning System (LAWS) for downtown area and City parks.
Update data and information with Code Red with a full test call of system.
Goal 3
Improve Emergency Operations Center situational awareness during severe weather or special events.
Objectives:
Installation of mesh node and camera systems at the Station 3 water tower, the Public Safety
Building and downtown.
Continued development of the drone program.
Train our volunteer citizens Ham Radio Group and the Crisis Response Team on disaster
assessment and research the creation of a Community Emergency Response Team.
Performance Measures
Update and integrate the Emergency Disaster Plan with the County.
Improve Emergency Management Resources.
Conduct disaster drills.

202
Measurable Outcomes:
Results of improved delivery of emergency management services.
Results of fewer swift water rescues and injuries to our citizens.
Results of improved situational awareness.
Actual Actual Budget Budget
Emergency Management 2013/2014 2014/2015 2015/2016 2016/2017
Demand
Disaster Declarations 0 1 0 0
Code Red notification launches 20 10 15 20
Weather Warning Notification Launch 80 112 80 125
Workload
Exercises Participated 4 9 6 6
Emergency Management Plan Updates 10 2 10 11
Productivity
Average Cost per citizen 0.61$ 0.61$ 2.96$ 3.04$
EOC Activations 12 19 15 15
Effectiveness
Severe Weather deaths 0 0 0 0
Emergency Management Actual Budget Budget % Change
Summary 2014-2015 2015-2016 2016-2017 2016-2017
Personnel Services 11,968$ 143,512$ 158,729$ 10.60%
Operations 39,235 44,137 50,788 15.07%
Capital
Projects
Total 51,203$ 187,649$ 209,517$ 11.65%
Emergency Management 2014-2015 2015-2016 2016-2017 2016-2017
Full Time Equivilent Positions Budget Budget Budget Additions
Coordinator 0 1 1
Total 0 1 1 0

203
FIRE OPERATIONS
Department at a Glance
The Fire Operations Department includes the Assistant Fire Chief of Operations, three Battalion Chiefs,
one Training Battalion Chief, seven Captains, six Lieutenants, twelve Apparatus Operators and forty six
Firefighters. The Operations Department budget increased 12.52% due to a merit increase, market
adjustments, overtime, medical supply costs increases and additional training cost increases.
Key Goals and Objectives
Goal 1
Hire an additional six firefighter/paramedic positions.
Objectives:
Decrease the amount of overtime required to operate by increasing shift numbers from 23
assigned per shift to 25 assigned per shift.
Provide for safer and more efficient incident response by reducing hours worked and,
subsequently, firefighter fatigue; optional staffing of 4 personnel on a Quint.
Reduce the amount of overtime required to maintain higher minimum staffing needs resulting
from adding a fourth ambulance.
Goal 2
Restructure the department to increase efficiency and improve current operational capabilities by
redesigning our organization to be more functional and better positioned for future growth.
Objectives:
Add a 24-hour Tahoe-based EMS unit comprised of an EMS supervisor and Paramedic
Firefighter to respond to certain EMS calls in place of fire apparatus, reducing the number of fire
apparatus responses while still placing an Officer in Command on scene.
Create an EMS Division under the Operations Chief to give needed attention to a growing area of
responsibility—one that needs to maintain constant awareness on quality improvement and
compliance with ever-changing rules and legislation.
Develop a Community Healthcare Program to improve quality of life for identified high risk
patients living in our City by making home visits to assist with education and other health
concerns.
Goal 3
Increase the capabilities of our training division by providing a Burn Tower for the deployment of crews
to complete fire ground training drills and specialty rescue on a routine basis.
Objectives:
Increase the amount of hands-on training in the areas of high risk/low frequency situations that
are commonly linked to firefighter line of duty deaths.
Decrease all associated costs of training for required annual burn drills and technical rescue skills;
decrease the amount of time crews are out of service, limit the amount of overtime needed, and
reduce the mileage, fuel usage and maintenance costs required to drive to the nearest fully
capable training center.
Train staff to operations level standards to be able to safely complete a rescue in various
situations, by increasing both the amount of training and the emphasis on skill retention for all

204
special operations disciplines (swift water, rescue, rope, trench, structural collapse and confined
space).
Performance Objectives
Hire an additional six firefighter positions and raise the minimum staffing level.
Create an EMS division to respond to calls where a fire apparatus is not required.
Increase the capabilities of our training division by providing a training tower for the deployment
of crews to complete fire ground training drills and specialty rescue on a routine basis.
Measurable Outcomes:
Increase fire ground safety and decrease fatigue by increasing staffing. Increased staffing will
result in a reduction in overtime.
Decrease costs of maintenance and fuel used by fire apparatus. Increase in-patient care
benchmarks and patient satisfaction by following up on identified high risk patients.
With the addition of a training facility, we expect to see an increase in fundamental skills related
to firefighting, such as hose deployment, ventilation, victim location and removal. Additionally,
we should experience increases in our “All Hazards” rescue capabilities throughout the
department by purchasing equipment, increasing training, and developing organized teams.
Actual Actual Budget Budget
Fire Operations 2013/2014 2014/2015 2015/2016 2016/2017
Demand
Calls for Service 8,149 8,671 9,538 9,643
Calls for EMS Service 3,583 3,849 4,335 5,353
Structure Fires 33 40 44 48
Workload
Patients Seen 3,746 4,063 3,815 4,478
Patients Transported 2,347 2,568 2,379 2,848
Minimum Staffing per Day 21 21 21 21
Mutual Aid Given - Fire 60 58 54 56
Mutual Aid Given - EMS 56 62 54 60
Fleet Maintained 37 37 33 33
Average Ambulances Staffed per Day 4 4 4 4
Productivity
Average Cost per citizen 143.61$ 151.33$ 140.38$ 154.90$
FTE per Capita 1.25$ 1.25$ 1.09$ 1.26$
Effectiveness
Calls Answered under 8 minutes 87% 90% 85% 90%
Fire Deaths 0 0 0 0
Structure Total Values0 53,592,427$ 27,425,750$ 27,374,960$ 17,395,970$
Total Dollar Loss-Fire 2,620,148$ 1,675,500$ 1,367,208$ 1,368,103$
Total Dollars Saved 50,972,279$ 25,750,250$ 26,007,752$ 16,027,867$
Mandatory Training Provided Over 100% Over 100% Over 100% Over 100%

205
Fire Operations Actual Budget Budget % Change
Summary 2014-2015 2015-2016 2016-2017 2016-2017
Personnel Services 8,828,117$ 8,591,894$ 9,696,007$ 12.85%
Operations 921,194 901,392 986,288 9.42%
Capital 4,894
Projects
Total 9,754,204$ 9,493,286$ 10,682,295$ 12.52%
Fire Operations 2014-2015 2015-2016 2016-2017 2016-2017
Full Time Equivilent Positions Budget Budget Budget Additions
Assistant Fire Chief 1 1 1
Battalion Chiefs 4 4 4
Training Captain 1 1 1
Captains 6 6 6
Lieutenants 7 6 6
Apparatus Operator 12 12 12
Firefighter 43 43 46 3
Total 74 73 76 3

206
PLANNING DIVISION
AdministrationProvide support services for the planning staff.
Schedule meetings with departments and developers.
Coordinate approvals required by City Council.
PlanningImplement procedures that facilitate quality
development within the City.
Review and approve residential, commercial and
industrial development.
Enforce City land use plans and zoning ordinances.
Coordinate planning and zoning activities.
Enforce architectural and tree preservation ordinances.
Historic Landmark CommissionPromote preservation and designation of
historic landmarks.
Promote the renovation and improvement of
historic areas.
Planning & Zoning CommissionUpdate long range land use plans and
development policies.
Identify key planning areas and implement
programs that encourage quality
development.
Board of AdjustmentHear and decide appeal requests to the City’s zoning
ordinances.
Authorize variances to the zoning ordinances.
Rule on the status of non-conforming uses.
Tree
Mitigation Fund
Planning Division Highlights
The Planning Division is projected to answer 9,200
informational requests from the public related to City
planning and zoning in FY 2016-2017.

207
PLANNING DIVISION AT A GLANCE
Budget Summary
The Planning Division includes the Planning Department, Planning & Zoning, Historic Landmark
Commission, Board of Adjustment and the Tree Mitigation Fund. The Tree Mitigation Fund summary
will be found in the Special Revenue Funds section of the budget. Several boards and commissions
operations are funded through this division including the Planning & Zoning Commission, consisting of a
seven-member board, the Historic Landmark Commission, consisting of a six-member board and the
Board of Adjustment consisting of a five-member board. The Planning Division budget increased 4.78%
due to a merit increase and market adjustments.
Actual Budget Budget % Change
Departments 2014-2015 2015-2016 2016-2017 2016-2017
Planning Administration 823,641$ 990,481$ 1,040,798$ 5.08%
Planning & Zoning 9,190 13,441 11,581 -13.84%
Historic Landmark 932 4,563 4,320 -5.33%
Board of Adjustment 1,219 3,135 3,274 4.45%
Total 834,982$ 1,011,620$ 1,059,974$ 4.78%
Division Actual Budget Budget % Change
Summary 2014-2015 2015-2016 2016-2017 2016-2017
Personnel Services 786,174$ 949,851$ 1,003,186$ 5.62%
Operations 48,807 61,769 56,788 -8.06%
Capital
Projects
Total 834,982$ 1,011,620$ 1,059,974$ 4.78%
Planning Division 2014/2015 2015/2016 2016/2017 2016/2017
Full Time Equivalent Positions Budget Budget Budget Additions
Director of Planning 1 1 1
Planners 3 3 3
Secretary 1 1 1
Landscape Administrator 1 1 1
Planning Technician 1 1 1
Gas Well Inspector 1 1 1
Total 8 8 8 0

208
PLANNING ADMINISTRATION
MISSION STATEMENT:
The mission of the Planning Administration Department is to enhance the quality of life for the citizens of
Mansfield by encouraging quality growth, development, redevelopment and stabilization of
neighborhoods through a concentrated effort of planning, land use controls and historic preservation.
Department at a Glance
The Planning Administration Department includes the Director of Planning, a Secretary, four Planners,
one Gas Well Inspector and one Landscape Administrator. The Planning Administration budget increased
5.08% due to a merit increase and market adjustment.
Key Goals and Objectives
Goal 1
Provide professional, administrative and technical planning services.
Objectives:
Provide planning services to City Council, the Planning & Zoning Commission and the citizens
of Mansfield.
Prepare and publish notices, agendas and minutes for the Planning & Zoning Commission,
Zoning Board of Adjustment and Historic Landmark Commission.
Prepare staff reports to the City Council, Planning and Zoning Commission, Zoning Board of
Adjustment and Historic Landmark Commission.
Goal 2
Improve the development application processes, procedure, coordination and communication.
Objectives:
Examine current application forms, processes and procedures.
Define and introduce specific service delivery improvements.
Provide a streamlined development review process.
Goal 3
Implement the City’s development plan and ordinances.
Objectives:
Recommend plans, projects and amendments to the City’s development ordinances to improve
the quality of development.
Provide assistance and education to developers and citizens on the City’s development
regulations.
Promote redevelopment in the older parts of Mansfield through planning and financing efforts.
Goal 4
Inspect and provide reports on all gas well activity within the City of Mansfield.
Objectives:
Inspect all gas well sites at least once per month.

209
Ensure gas well regulations and ordinances are followed on all drilling sites.
Provide regular reports and respond to any emergency situations that may develop.
Performance Objectives
Provide professional, administrative and technical planning services.
Improve development processes, procedures, coordination and communications.
Implement the City’s development plans and ordinances.
On a regular basis, inspect all gas well activity within the City.
Measurable Outcomes:
All plats have been approved within 30 days and are expected to continue in FY 2016-2017.
All gas wells will be inspected a minimum of once per month.
Regular gas well activity reports will be available to staff and citizens via the City of Mansfield
website.
Actual Actual Budget Budget
Planning 2013/2014 2014/2015 2015/2016 2016/2017
Demand
Departments 6 6 6 6
Informational Requests 9,023 9,135 9,200 9,200
Rezoning Requests 17 17 14 15
Residential Lots Platted 471 488 1,500 550
Gas Wells 206 206 208 207
Workload
Gas Well Inspections per Week 15 15 15 15
Meetings Attended 98 98 120 120
Commercial Acres Platted 182 18 50 50
Planning & Zoning Meetings 21 22 24 24
Zoning amendments proposed 5 7 3 5
Productivity
Agendas prepared 34 35 50 50
Informational Requests 9023 9135 9200 9200
Land Use Plans Adopted 0 0 0 0
Plats Approved within 30 days 100% 100% 100% 100%
Effectiveness
Informational requests processed 9023 9135 9200 9200
Plats Approved within 30 days 100% 100% 100% 100%

210
PLANNING AND ZONING COMMISSION
MISSION STATEMENT:
The mission of the Planning and Zoning Commission is to continuously provide updated comprehensive
Future Land Use Plans, to exercise control over subdivision of land and to advise City Council on matters
related to zoning and impact fees.
Department at a Glance
The Planning & Commission budget decreased 13.84% in FY 2016-2017 due to decreases in advertising
and publication costs.
Key Goals and Objectives
Goal 1
Identify key planning areas within the City of Mansfield and implement programs that encourage quality
development and enhance property values.
Objectives:
Conduct periodic review of problems, complaints, concerns and questions about local zoning and
development policies, and make recommendations regarding appropriate changes to current
policies and procedures.
Carry out studies and public hearings for zoning changes and amendments requested by the City
Council and identified by staff.
Conduct changes in Land Use categories and development trends and make recommendations
regarding proper changes to local codes and fees.
Goal 2
Update long range plans and develop long range policies.
Objectives:
Update the Future Land Use Plan, Thoroughfare Plan, Water & Sewer Plan and Subdivision
Ordinances to reflect the changing residential and commercial development areas in and around
the City of Mansfield.
Amend the zoning regulations to comply with Future Land Use.
Review the Capital Improvements Plan and Impact Fee Analysis and recommend any changes to
City Council.
Note: No full time positions are budgeted in this activity. Performance measures and measurable
outcomes may be found in the Planning Department overall performance measures.
Actual Budget Budget % Change
Planning & Zoning 2014-2015 2015-2016 2016-2017 2016-2017
Personnel Services 1,720$ 2,053$ 2,639$ 28.54%
Operations 7,470 11,388 8,942 -21.48%
Capital
Projects
Total 9,190$ 13,441$ 11,581$ -13.84%

211
HISTORIC LANDMARK COMMISSION
MISSION STATEMENT:
The mission of the Historic Landmark Commission is to promote the restoration and preservation of the
City of Mansfield’s valuable heritage and historic resources.
Department at a Glance
The Historic Landmark Commission budget decreased 5.33% in FY 2016-2017 due to reduced overtime
costs. Salary and Benefits are related to overtime cost requirements of the Planning Secretary to attend
and record the minutes of the Commission meetings.
Key Goals and Objectives
Goal 1
Promote the preservation and designation of historic landmarks.
Objectives:
Set priorities for implementation of goals and objectives identified in the Historic Preservation
Plan.
Review nominations of properties that are submitted to the City of Mansfield or State of Texas
for designation as recorded historic landmarks.
Provide training to members of the Commission related to the promotion and review of historic
landmarks.
Apply for state and federal grants.
Goal 2
Promote the renovation and improvement of the Historic downtown area.
Objectives:
Encourage private property and business owners to preserve and restore historic landmarks within
the downtown area.
Evaluate proposed restoration work on historic landmarks to ensure compliance with the design
guidelines for downtown Mansfield.
Note: No full time positions are budgeted in this activity. Performance measures and measurable
outcomes may be found in the Planning Department overall performance measures.
Actual Budget Budget % Change
Historic Landmark 2014-2015 2015-2016 2016-2017 2016-2017
Personnel Services 304$ 491$ 250$ -49.11%
Operations 628 4,072 4,070 -0.04%
Capital
Projects
Total 932$ 4,563$ 4,320$ -5.33%
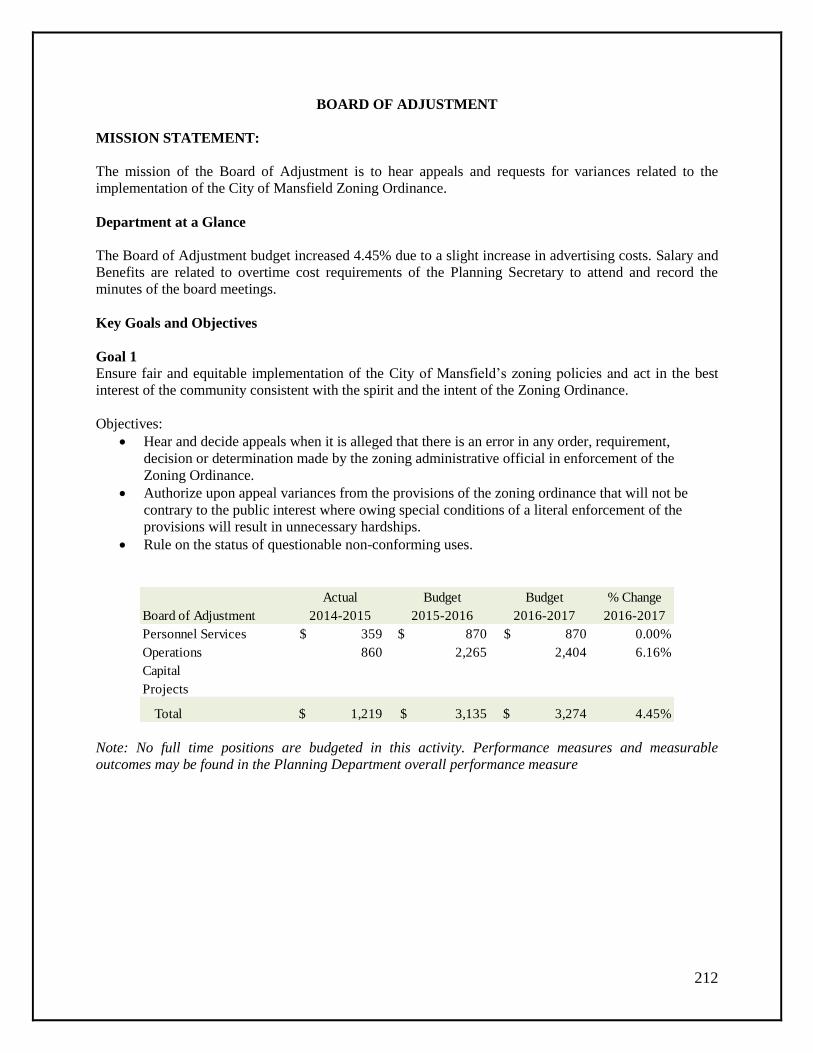
212
BOARD OF ADJUSTMENT
MISSION STATEMENT:
The mission of the Board of Adjustment is to hear appeals and requests for variances related to the
implementation of the City of Mansfield Zoning Ordinance.
Department at a Glance
The Board of Adjustment budget increased 4.45% due to a slight increase in advertising costs. Salary and
Benefits are related to overtime cost requirements of the Planning Secretary to attend and record the
minutes of the board meetings.
Key Goals and Objectives
Goal 1
Ensure fair and equitable implementation of the City of Mansfield’s zoning policies and act in the best
interest of the community consistent with the spirit and the intent of the Zoning Ordinance.
Objectives:
Hear and decide appeals when it is alleged that there is an error in any order, requirement,
decision or determination made by the zoning administrative official in enforcement of the
Zoning Ordinance.
Authorize upon appeal variances from the provisions of the zoning ordinance that will not be
contrary to the public interest where owing special conditions of a literal enforcement of the
provisions will result in unnecessary hardships.
Rule on the status of questionable non-conforming uses.
Note: No full time positions are budgeted in this activity. Performance measures and measurable
outcomes may be found in the Planning Department overall performance measure
Actual Budget Budget % Change
Board of Adjustment 2014-2015 2015-2016 2016-2017 2016-2017
Personnel Services 359$ 870$ 870$ 0.00%
Operations 860 2,265 2,404 6.16%
Capital
Projects
Total 1,219$ 3,135$ 3,274$ 4.45%

213
DEVELOPMENT SERVICES
DIVISION
Code EnforcementIdentifies and processes substandard
structures for demolition.
Enforces sign ordinances.
Investigates complaints received from
citizens and staff.
Enforces all City codes related to
buildings and structures.
Building SafetyProvides plan review of
residential and commercial
projects.
Conducts inspections daily.
Enforces established City codes.
Issues building related permits.
Building MaintenanceMaintains all City facilities.
Maintains all janitorial contracts.
Identifies facility issues and issues
work orders.
Performs preventive maintenance
activities.
Development Services
Administration
750
350 299 282
338 366 335
225
300 300 300 300
0
200
400
600
800
1000
2007 2008 2009 2010 2011 2012 2013 2014 2015 2016 2015 2016
Historcial Permit Activity
Residential Permits
Commercial Permits
Development Services Division Highlights
Residential building permit applications for FY 2016-2017
are estimated to be over 450.
Inspection requests are answered within 2 business days.

214
DEVELOPMENT SERVICES DIVISION AT A GLANCE
Budget Summary
The Development Services Division includes Development Services Administration, Building
Maintenance, Building Safety/Inspections and Code Compliance. The staff enforces both code and
inspection requirements throughout the City. The Development Services Division budget increased
4.47% due to a merit increase and market adjustments. The Development Services Division has been
reorganized into four separate departments as seen below. Some positions have been reassigned within
the division.
Development Services Actual Budget Budget % Change
Departments 2014-2015 2015-2016 2016-2017 2016-2017
Administration 1,273,421$ 1,623,433$ 278,798$ -82.83%
Safety/Inspections 932,280
Code Compliance 573,041
Building Maintenance 889,386 1,086,639 1,046,977 -3.65%
Total 2,162,807$ 2,710,072$ 2,831,097$ 4.47%
Division Actual Budget Budget % Change
Summary 2014-2015 2015-2016 2016-2017 2016-2017
Personnel Services 1,381,197$ 1,801,177$ 1,913,865$ 6.26%
Operations 760,065 908,895 917,232 0.92%
Capital 21,545
Projects
Total 2,162,807$ 2,710,072$ 2,831,097$ 4.47%

215
DEVELOPMENT SERVICES ADMINISTRATION DEPARTMENT
MISSION STATEMENT:
The mission of the Development Services Division is to ensure the safe and lawful use of buildings and
properties by enforcing building and construction codes which safeguard each citizen’s health, property
and welfare by facilitating complaint development with integrity, efficiency and professionalism. The
City of Mansfield Development Services is committed to becoming a premier municipal building
organization dedicating to enhancing the quality of life for all Mansfield citizens and making our city
safer. We are committed to improving performance and developing procedures that are streamlined,
understandable and transparent.
Department at a Glance
The Administration Department was created in FY 2016-2017 to oversee the operations of the Building
Safety, Building Maintenance and Code Enforcement Departments, as well as oversee the development of
major construction projects. The Development Services Administration Department includes the Director
of Development Services and one Administrative Analyst. Reorganization of the Development Services
Division resulted in a 82.83% budget decrease for the Administration Department and reallocation of
funds to the subordinate departments.
Key Goals and Objectives
Goal 1
Work with parties (design professionals, developers and City staff) involved in the development and
revitalization of structures within the City to enhance and improve our process to promote development
and ensure safe and habitable buildings.
Objectives:
Continue to work with various City departments and be proactive in identifying development
hindrances; work with the development team to find solutions.
Meet with the development team as often as needed to process building permits in a timely
manner.
Review preliminary design assumptions.
Utilize consistent, fair and equitable approach to Code Enforcement and encourage voluntary
compliance with ordinance violations.
Goal 2
Develop and build a competent staff.
Objectives:
Review and update existing departmental policies and procedures, developing new ones as
needed.
Develop cross training for personnel to broaden scope of services to the community thus
improving customer service by providing quick and reliable inspection services.
Have weekly/monthly staff meetings to provide an opportunity for staff to discuss status of
projects, problems they faced in the field or office, updates to codes, ordinances and laws.
Goal 3
Prepare for the future.

216
Objectives:
Research and purchase equipment as needed for a virtual environment that will allow us to
improve the permitting process, track inspections, back-up records and maintain accurate
information.
Update software and equipment to enable the ability to develop professional informational
handouts for the education of the citizens, general public and professionals.
Expedite the review process between departments to streamline the permitting process thus
enhancing customer service.
Performance Objectives
Improve external and internal customer service.
Update technology and provide additional workspace for Development Services department staff.
Improve documentation of enforcement and inspection actions.
Measurable Outcomes:
New, quality City developments that will enhance the attractiveness of Mansfield for its citizens
and visitors.
A well-trained, competent, and effective team of inspectors, code enforcers, and maintenance
personnel.
Development Services Actual Budget Budget % Change
Administration 2014-2015 2015-2016 2016-2017 2016-2017
Personnel Services 1,142,568$ 1,492,313$ 274,434$ -81.61%
Capital 21,545 - -
Operations 109,308 131,120 4,365 -96.67%
Total 1,273,421$ 1,623,433$ 278,798$ -82.83%
Development Services Administration 2014/2015 2015/2016 2016/2017 2016/2017
Full Time Equivilent Positions Budget Budget Budget Additions
Director of Development Services 1 1 1
Administrative/Technical Analyst 1 1 1
Total 2 2 2 0

217
BUILDING MAINTENANCE DEPARTMENT
MISSION STATEMENT:
The mission of the Building Maintenance Department is to provide a safe, clean work environment for the
City’s employees and maintain aesthetically pleasing facilities for employees, visitors, and residents.
Department at a Glance
The Building Maintenance Department is responsible for all City-owned facilities including City Hall,
Public Safety buildings, Library, Activity Center, Law Enforcement Center and Station House. The
department budget increased 7.79% due to additional supply and janitorial contract costs. The Building
Maintenance Department includes one supervisor and two technicians.
Key Goals and Objectives
Goal 1
Continue to expand the preventative maintenance program in order to reduce cost and stabilize budget
forecasts.
Objectives:
Perform a comprehensive evaluation of all City facilities and associated equipment.
Set preventative maintenance priorities using a risk assessment matrix.
Goal 2
Reduce energy consumption City-wide.
Objectives:
Conduct an energy audit of all City facilities and associated equipment.
Continue LED light fixture replacement program.
Evaluate HVAC systems and replace and/or repair when necessary.
Goal 3
Maintain all existing facilities.
Objectives:
Negotiate and administer all janitorial, generator and elevator maintenance contracts.
Implement technology used for record keeping and tracking of maintenance requests.
Schedule routine equipment replacement.
Performance Objectives
Identify facilities and property for preventative maintenance to avoid potential failures.
Improve on reducing the City’s facilities energy cost.
Strive to keep our facilities clean and comfortable for employees and citizens.

218
Measurable Outcomes:
Complaints from citizens and staff have been reduced by 95%.
95% of all work orders are completed within 30 days.
All preventative maintenance work orders are completed within 30 days.
Actual Actual Budget Budget
Building Maintenance 2013/2014 2014/2015 2015/2016 2016/2017
Demand
Municipal Facilities 68 108 71 71
Square Footage Maintained 332,058 332,058 428,851 428,851
Work Orders (annually) 1,525 1,640 1,650 1,850
Workload
Monthly Preventative Maintenance Inspections 75 79 79 40
Daily Buildings Cleaned 4 4 5 3
Work Orders completed 1,520 1,640 1,640 1,825
New Square Footage 2,054 - 96,793 -
Productivity
Elevator Lifts maintained 4 4 4 4
Daily Buildings Cleaned 4 4 5 3
Maintenance Contracts Monitored 5 5 5 5
Effectiveness
Staff Complaints 8 6 8 5
Citizen Complaints None None None -
Work Orders completed within 30 days 95% 95% 95% 95%
Development Services Actual Budget Budget % Change
Building Maintenance 2014-2015 2015-2016 2016-2017 2016-2017
Personnel Services 238,629$ 308,864$ 282,388$ -8.57%
Operations 650,757 777,775 764,589 -1.70%
Total 889,386$ 1,086,639$ 1,046,977$ -3.65%
Building Maintenance 2014/2015 2015/2016 2016/2017 2016/2017
Full Time Equivilent Positions Budget Budget Budget Additions
Building Maintenance Supervisor 1 1 1
Building Maintenance Technician 3 3 2 -1
Custodian 1 1 0 -1
Total 5 5 3 -2

219
BUILDING SAFETY/INSPECTIONS DEPARTMENT
MISSION STATEMENT:
The mission of the Building Safety/Inspections Department is to ensure the safe and lawful use of
buildings and properties within the City by implementing building and construction codes which
safeguard public health, safety and welfare.
Department at a Glance
The Building Safety/Inspections Department is responsible for executing the enforcement of adopted City
building codes in an effort to promote and ensure safe, habitable structures are being constructed. The
Building Safety Department includes the Chief Building Official, a plans examiner supervisor, one
building permit coordinator, one permit technician, three building inspectors, and one secretary.
Key Goals and Objectives
Goal 1
Ensure that buildings are safe and habitable by ensuring they are compliant with all applicable City codes
and ordinances.
Objectives:
Establish clear expectations with developers through the Development Review Committee and
pre-plan submittal process.
Provide accurate, consistent, timely plan review and facilitate the review with other City
departments.
Conduct thorough on-site inspections of buildings and structures using methods established by
current codes and ordinances.
Goal 2
Continue to provide a competent work force capable of meeting the demands on the department.
Objectives:
Maintain written, organized standard operating procedures which ensure competency, consistency
and efficiency.
Provide opportunities for personal and professional growth through continued commitment to
continuing education.
Evaluate current staffing levels and ensure that the department remains capable of providing
quality customer service as the City continues to grow.
Goal 3
Work closely with regional partners to provide for consistency with legislative changes, laws and
mandates.
Objectives:
Attend the North Central Texas Council of Governments meetings and serve on boards and
committees.
Attend the North Texas Chapter of the International Code Council meetings and participate in
legislative efforts.
Attend the Building Official Association of Texas meetings.

220
Performance Objectives
Ensure buildings are safe and sustainable.
Retain a highly skilled staff.
Verify that enforcement policies are consistent with state, local and federal mandates.
Measurable Outcomes:
All permits are issued within 30 days, with the goal of 5 days for residential, and 10-15 days for
commercial initial plan review.
Inspections are conducted within 2 business days.
A 100% trained and qualified staff.
Actual Actual Budget Budget
Building Safety/Inspections 2013/2014 2014/2015 2015/2016 2016/2017
Demand
Permit Applications 4,494 4,463 4,864 5,301
Residential Building Permits Issued 215 302 307 300
Workload
Commercial Permits Issued 137 159 192 215
Residential Building Permits Issued 215 302 307 300
Productivity
Total Inspections by Inspectors 13,258 15,619 16,601 18,095
Effectiveness
Residential Inspections within 5 Days 100% 100% 100% 100%
Total Permits Issued 4,324 4,352 4,743 5,176
Development Services Actual Budget Budget % Change
Safety/Inspections 2014-2015 2015-2016 2016-2017 2016-2017
Personnel Services -$ -$ 878,602$
Capital - - -
Operations - - 53,678
Total -$ -$ 932,280$
Building Safety/Inspections 2014/2015 2015/2016 2016/2017 2016/2017
Full Time Equivilent Positions Budget Budget Budget Additions
Chief Building Official 1 1 1
Plans Examiner Supervisor 1 1 1
Plans Examiner 1 1
Building Permit Coordinator 1 1 1
Permit Clerk 1 1 1
Building Inspectors 3 3 3
Secretary 1 1 1
Total 8 8 9 1

221
CODE COMPLIANCE DEPARTMENT
MISSION STATEMENT:
The mission of the Code Compliance Department is to protect property owners’ investments and promote
public health, safety and welfare of the community; and where violations occur, work with our citizens to
achieve compliance through efficient and fair processes.
Department at a Glance
The Code Compliance Department is responsible for executing the enforcement of City ordinances in an
effort to foster a healthy and attractive City. Due to the reorganization of the Development Services
Division, the 2016-2017 budget for Code Compliance will establish a benchmark for future budgets. The
Code Compliance Department includes a supervisor, two officers, one administrator and one coordinator.
Key Goals and Objectives
Goal 1
Engage in proactive, positive community education in order to achieve voluntary compliance with all
applicable City codes and ordinances.
Objectives:
Conduct a property maintenance survey in order to assess property conditions throughout the
City.
Identify focus areas and display them in the City’s geographic information system.
Focus efforts on those areas before they become issues the public brings to the department’s
attention.
Goal 2
Administer a comprehensive code compliance program–one that involves City Council, staff and the
residents of this community.
Objectives:
Work with the City Council’s code compliance subcommittee to establish clear expectations,
receive guidance and re-evaluate existing ordinances.
Work in concert with City staff including, but not limited to, Planning, Building Inspections and
Public Safety to discuss issues that impact the community and provide recommendations to City
Council which may aid them in the creation and/or modification of City codes and ordinances.
Engage in a public education campaign which reaches out to members of the community,
improves communication and achieves voluntary compliance with City codes and ordinances
when possible.
Goal 3
Assist with the mitigation of code violations through the implementation of a City-wide volunteer
program.
Objectives:
Identify code violations which may require voluntary assistance in order to achieve compliance.
Put charitable organizations in touch with property owners that need assistance, as well as
assisting in the creation and administration of community cleanup efforts.

222
Performance Objectives
Improve external and internal customer service.
Improve documentation of enforcement and inspection actions.
Measurable Outcomes:
Reduce the number of citations written by better enforcement.
All initial inspections will be completed within 48 hours.
Reduce the number of citizen complaints.
Actual Actual Budget Budget
Code Compliance 2013/2014 2014/2015 2015/2016 2016/2017
Demand
Substandard Structures Identified 16 34 26 50
Workload
Total Code Compliance Complaints 1,220 987 1,860 3,000
Productivity
Substandard/Dangerous Structures Removed 1 1 2 5
Substandard/Prop. Maint. Structures brought to Code 15 29 24 300
Forced Mows 87 54 80 100
Signs Removed 2,532 7,458 4,000 2,000
Effectiveness
Substandard/Prop. Maint. Structures brought to Code 15 29 24 300
Substandard/Dangerous Structures Removed 1 1 2 5
Development Services Actual Budget Budget % Change
Code Compliance 2014-2015 2015-2016 2016-2017 2016-2017
Personnel Services -$ -$ 478,441$
Capital - - -
Operations - - 94,600
Total -$ -$ 573,041$
Code Compliance 2014/2015 2015/2016 2016/2017 2016/2017
Full Time Equivilent Positions Budget Budget Budget Additions
Code Compliance Supervisor 1 1 1
Code Compliance Admin 1 1 1
Code Enforcement Officers 2 2 2
Volunteer Coordinator 1 1 1
Total 5 5 5 0

223
COMMUNITY SERVICES
DIVISION
Parks & Recreation
Provides maintenance services
to the City Park System
Public Grounds
Provides mowing and
maintenance of City
right of ways
Library
Provides library services to
both adult and youth
patrons
Senior Citizens
Provides senior citizen
programs and services
Public Information
Provides information to the
citizens and media
Produces the City Annual
Report
Maintains the City website
Cultural Arts
Coordinates special
events for the City of
Mansfield
Community Services Division Highlights
14 parks in the City Park System.
31 acres of City facilities maintained.
91 acres of City-owned property maintained. 86 Right of Way miles maintained.
230 median mows per month.
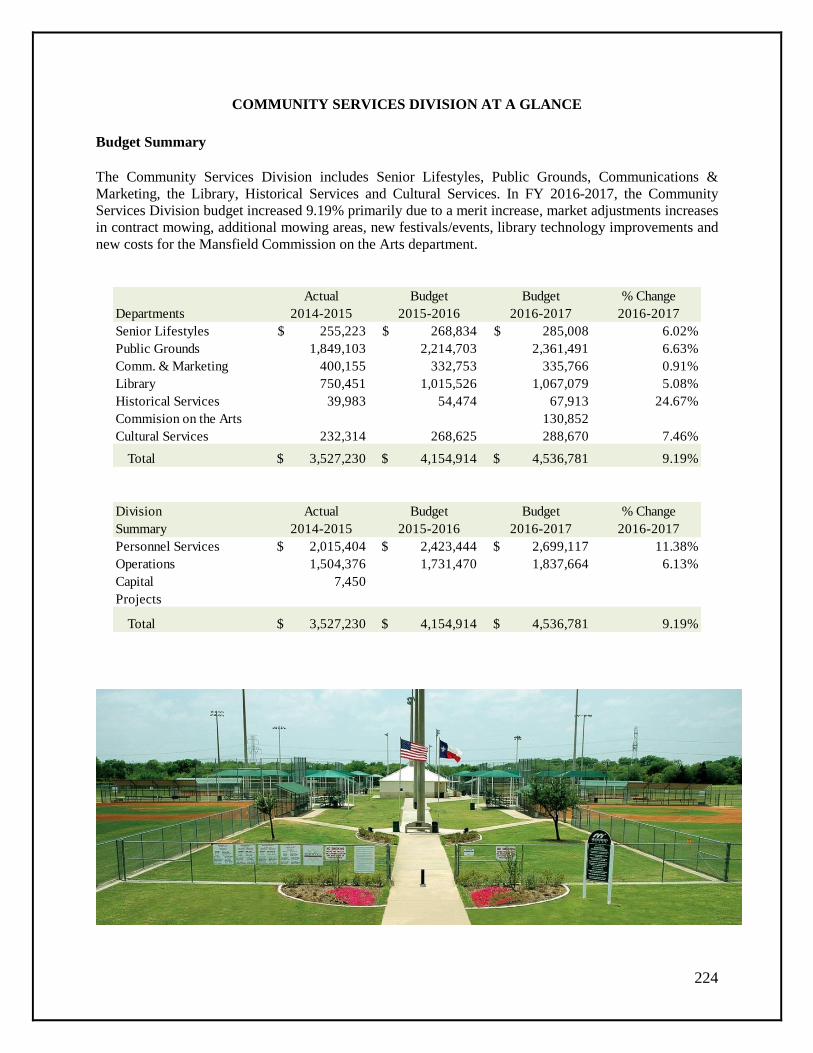
224
COMMUNITY SERVICES DIVISION AT A GLANCE
Budget Summary
The Community Services Division includes Senior Lifestyles, Public Grounds, Communications &
Marketing, the Library, Historical Services and Cultural Services. In FY 2016-2017, the Community
Services Division budget increased 9.19% primarily due to a merit increase, market adjustments increases
in contract mowing, additional mowing areas, new festivals/events, library technology improvements and
new costs for the Mansfield Commission on the Arts department.
Actual Budget Budget % Change
Departments 2014-2015 2015-2016 2016-2017 2016-2017
Senior Lifestyles 255,223$ 268,834$ 285,008$ 6.02%
Public Grounds 1,849,103 2,214,703 2,361,491 6.63%
Comm. & Marketing 400,155 332,753 335,766 0.91%
Library 750,451 1,015,526 1,067,079 5.08%
Historical Services 39,983 54,474 67,913 24.67%
Commision on the Arts 130,852
Cultural Services 232,314 268,625 288,670 7.46%
Total 3,527,230$ 4,154,914$ 4,536,781$ 9.19%
Division Actual Budget Budget % Change
Summary 2014-2015 2015-2016 2016-2017 2016-2017
Personnel Services 2,015,404$ 2,423,444$ 2,699,117$ 11.38%
Operations 1,504,376 1,731,470 1,837,664 6.13%
Capital 7,450
Projects
Total 3,527,230$ 4,154,914$ 4,536,781$ 9.19%

225
SENIOR LIFESTYLES PROGRAM
MISSION STATEMENT:
The mission of the Senior Lifestyles Program is to provide a multifaceted service and referral program
tailored to meet the needs of adults 55 years of age and older; to enhance the lives of seniors 55+ while
supporting their wellness and independence and encourage their community involvement; and to provide
the seniors in the community with the opportunity to experience an optimal quality of life.
Department at a Glance
The Senior Lifestyles budget includes the Senior Citizen Coordinator, one Senior Activities Specialist,
three part-time bus drivers and one part-time clerk. The Senior Lifestyles budget increased 6.02% in FY
2016-2017 due to a 3% merit increase, expansion of a part-time bus driver position and increase in
building maintenance requirements.
Key Goals and Objectives
Goal 1
To enhance and enrich the quality of life for senior citizens by promoting health, wellness, and
independence through recreation, creative activities, support services and information.
Objectives:
Continue to develop and implement programs and special events while increasing day trips by
10%.
Continue to increase awareness of program offerings within the community.
Continue to distribute, collect and evaluate participant surveys to determine success of programs.
Goal 2
Increase revenue through low-cost fee based program offerings.
Objectives:
Distribute and evaluate participant surveys to determine new program opportunities.
Increase awareness of program offerings within the community.
Goal 3
To provide an array of resources that encompasses all considerations necessary for aging well.
Objectives:
Continue to provide programs that promote healthy nutrition and active lifestyles.
Provide more speakers from the community concerning financial, legal and practical
considerations.
Keep focused on programs that enable older adults to continue being an integral part of their
community.
Performance Objectives
Increase fitness and wellness programs geared toward older adults
Increase revenue through low-cost fee based program offerings.
Schedule sponsors/speakers to sponsor events and/or educate seniors on topics of interest.
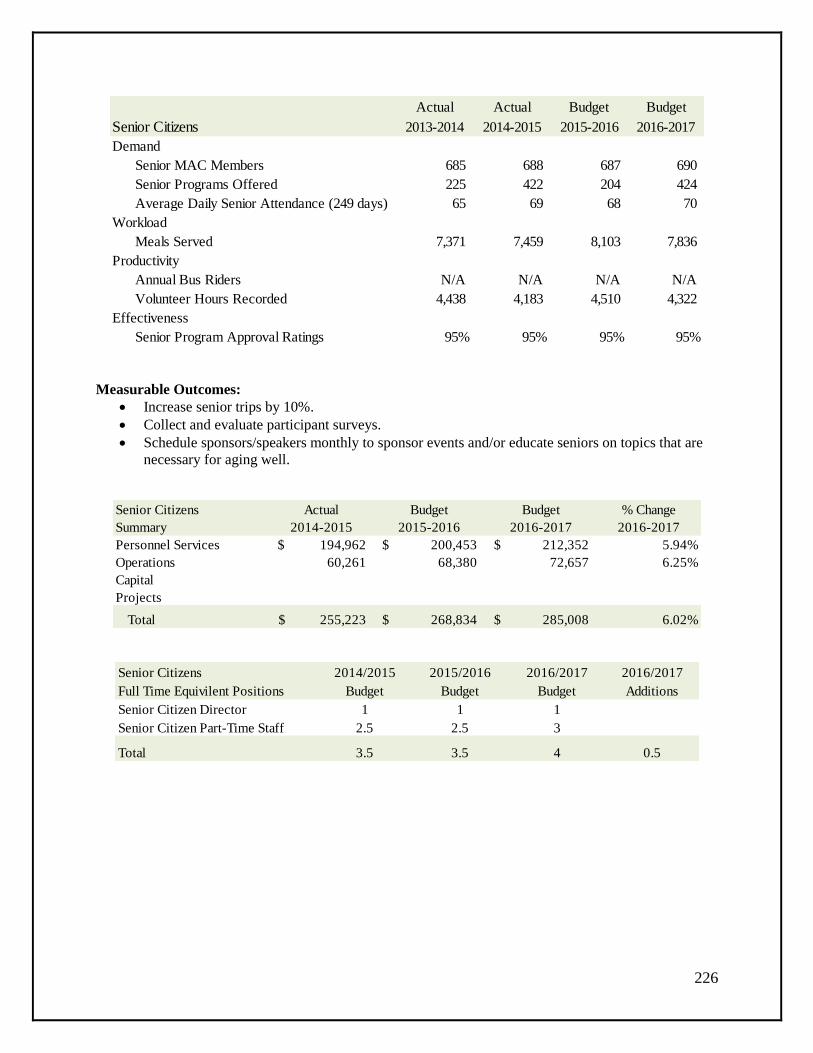
226
Measurable Outcomes:
Increase senior trips by 10%.
Collect and evaluate participant surveys.
Schedule sponsors/speakers monthly to sponsor events and/or educate seniors on topics that are
necessary for aging well.
Actual Actual Budget Budget
Senior Citizens 2013-2014 2014-2015 2015-2016 2016-2017
Demand
Senior MAC Members 685 688 687 690
Senior Programs Offered 225 422 204 424
Average Daily Senior Attendance (249 days) 65 69 68 70
Workload
Meals Served 7,371 7,459 8,103 7,836
Productivity
Annual Bus Riders N/A N/A N/A N/A
Volunteer Hours Recorded 4,438 4,183 4,510 4,322
Effectiveness
Senior Program Approval Ratings 95% 95% 95% 95%
Senior Citizens Actual Budget Budget % Change
Summary 2014-2015 2015-2016 2016-2017 2016-2017
Personnel Services 194,962$ 200,453$ 212,352$ 5.94%
Operations 60,261 68,380 72,657 6.25%
Capital
Projects
Total 255,223$ 268,834$ 285,008$ 6.02%
Senior Citizens 2014/2015 2015/2016 2016/2017 2016/2017
Full Time Equivilent Positions Budget Budget Budget Additions
Senior Citizen Director 1 1 1
Senior Citizen Part-Time Staff 2.5 2.5 3
Total 3.5 3.5 4 0.5

227
PUBLIC GROUNDS DEPARTMENT
MISSION STATEMENT:
The mission of the Public Grounds Department is to enhance the quality of life for citizens and visitors of
Mansfield, maintain City-owned properties, medians and right-of-ways and promote the benefits of public
open space throughout the City.
Department at a Glance
The Department includes the Parks superintendent, operations supervisor, and fourteen and one half staff
members. The department continues to utilize contract services to provide mowing for parks, public
grounds, non-irrigated medians and cleaning of public buildings in local parks and recreation venues. In
FY 2016-2017, the public grounds budget increased by 6.63% due to a merit increase, market adjustments
increases in contract service costs and additional service areas.
Key Goals and Objectives
Goal 1
Maintain the level of service provided to citizens and visitors of Mansfield as we continue to acquire
additional properties, acres and right-of-ways.
Objectives:
Maintain efficient daily, weekly and monthly tasks performed on City-owned properties, medians
and right-of-ways to present a professionally manicured landscape.
Monitor and implement current mowing cycles utilizing contractual mowing agreements and
staff.
Practice environmentally sound horticultural practices on a regularly scheduled basis to improve
quality throughout public grounds.
Goal 2
Improve maintenance on 86 miles of right-of-ways and medians and 91 acres of City-owned property.
Objectives:
Provide continuing education opportunities for all staff in turf, landscape, horticultural practices,
pesticide application, irrigation and maintenance.
Monitor and sustain botanical beds and ornamental plantings with environmentally sound
horticultural practices.
Perform weekly routine maintenance of irrigated and non-irrigated medians utilizing both City
staff and contact services.
Goal 3
Maintain public grounds to ensure the safety and welfare of citizens and visitors of Mansfield while
collaborating with other City departments and operational field staff.
Objectives:
Respond to and mitigate hazardous tree conditions on public grounds, medians and right-of-ways.
Coordinate with Code Enforcement and additional City departments to address line of sight,
hazardous tree conditions, illegal dumping and tall grass complaints on public grounds and right-
of-ways in a timely manner.

228
Inspect and respond to irrigation concerns occurring on public grounds and right-of-ways through
the use of City staff and the latest irrigation technology.
Performance Objectives
Maintain the level of service provided to citizens and visitors of Mansfield as we continue to
acquire additional properties, acres and right-of-ways.
Improve maintenance on 86 miles of right-of-ways and medians and 91 acres of City-owned
property.
Maintain Public Grounds to ensure the health, safety and welfare of citizens and visitors of
Mansfield and coordinate with other departments to achieve this goal.
Measurable Outcomes:
Maintain the level of service provided to citizens and visitors of Mansfield as we continue to
acquire additional properties, acres and right-of-ways.
Improve maintenance on 86 miles of right of ways and medians and 91 acres of City-owned
property.
Maintain Public Grounds to ensure the health, safety and welfare of citizens and visitors of
Mansfield and coordinate with other departments to achieve this goal.
Actual Actual Budget Budget
Public Grounds 2013-2014 2014-2015 2015-2016 2016-2017
Demand
Number of Right of Way Mowed 56 59 61 61
Right of Ways Maintained (Miles) 74 76 80 86
City Facilities Maintained (Acres) 31 31 31 31
City Owned Property Maintained (Acres) 21 83 86 91
Medians Maintained (Irrigated Miles) 11 12 17 17
Medians Maintained (Non-irrigated Miles) 9 15 11 11
Medians Mowed per Month 176 207 230 230
Workload
Projects (NEW) 3
Median Irrigation Heads 5207 5207 6037 6037
Flower Beds Maintained (NEW) 348
Median Tree Bubblers 1250 2508 2600 2600
Median Irrigation Valves 370 439 477 477
Median Irrigation Controllers 38 74 76 76
Municipal Buildings Irrigation Heads 1671 1659 1880 1880
Municipal Buildings Tree Bubblers 84 84 196 196
Municipal Buildings Valves 104 101 125 125
Municipal Buildings Controllers 11 10 12 12
Productivity
Number of Right of Way Mowed 56 59 61 61
Flower Beds Maintained (NEW) 348
Average Park Crews per Day 6 7 7 7
Effectiveness
Landscaped Entrances 5 5 5 5
Medians Mowed per Month 176 207 230 230

229
Public Grounds Actual Budget Budget % Change
Summary 2014-2015 2015-2016 2016-2017 2016-2017
Personnel Services 993,093$ 1,099,882$ 1,224,628$ 11.34%
Operations 845,129 1,114,821 1,136,863 1.98%
Capital
Projects
Total 1,838,222$ 2,214,703$ 2,361,491$ 6.63%
Public Grounds 2014/2015 2015/2016 2016/2017 2016/2017
Full Time Equivilent Positions Budget Budget Budget Additions
Parks Superintendent 0.5 0.5 0.5
Administrative Assistant 1.2 1.2 1.2
Operations Supervisor 0.3 0.3 0.3
Staff 14.5 14.5 14.5
Total 16.5 16.5 16.5 0

230
CULTURAL ARTS/SPECIAL EVENTS DEPARTMENT
MISSION STATEMENT:
To provide family friendly events, cultural activities and special events for all ages that will enhance the
quality of life for participants and meet the needs of the community.
Department at a Glance
The Cultural Arts Department budget increased 7.46% in FY 2016-2017 due to a merit increase and new
operating costs for the annual Rockin’ 4th of July celebration. The Special Events include Rockin’ 4
th of
July, Winter Walk, Hometown Holidays, Wurstfest and various other community events.
Key Goals and Objectives
Goal 1
Increase sponsorship opportunities.
Objectives:
Network through the regional Chamber of Commerce and Women’s Division affiliations.
Solicit sponsorships to add additional opportunities for entertainment and programs throughout
the park system.
Goal 2
Increase attendance at special events to over 125,000 patrons.
Objectives:
Cross-market with the Mansfield Chamber of Commerce to increase exposure.
Increase social media exposure of events.
Develop new and creative ways to advertise events.
Goal 3
Continue to provide quality community-wide special events.
Objectives:
Continue to evaluate and improve current popular events such as Rockin’ 4th of July, Winter
Walk, Night on the Town and Hometown Holidays.
Continue to assist local organizations with their events held throughout the year.
Continue to monitor state and national trends by being active in professional organizations such
as TFEA and IFEA.
Performance Objectives
Increase sponsorship opportunities.
Increase attendance at special events to over 125,000 patrons.
Continue to provide quality community-wide special events.

231
Measurable Outcomes:
Maintain at least 20 Parks and Recreation sponsors for the value of sponsor contributions.
Explore new marketing and advertising opportunities.
Actual Actual Budget Budget
Cultural Arts 2013-2014 2014-2015 2015-2016 2016-2017
Demand
Population 59,230 62,246 63,248 68,786
Workload
Number of Special Events 13 16 15 16
Number of New Special Events 3 2 2 2
Number of Sponsors 22 22 25 22
Number of New Sponsors 4 4 4 5
Productivity
Monetary Total from Sponsors 24,500$ 21,000$ 20,000$ 30,000$
In-kind Total from Sponsors 32,000$ 38,000$ 30,000$ 35,000$
Effectiveness
Event Attendance 32,500 35,000 35,000 35,000
Event Approval Rating 95% 95% 95% 95%
Cultural Services Actual Budget Budget % Change
Summary 2014-2015 2015-2016 2016-2017 2016-2017
Personnel Services 62,480$ 84,306$ 88,362$ 4.81%
Operations 169,834 184,319 200,309 8.68%
Capital
Projects
Total 232,314$ 268,625$ 288,670$ 7.46%
Cultural Arts 2014/2015 2015/2016 2016/2017 2016/2017
Full Time Equivilent Positions Budget Budget Budget Additions
Coordinator 1 1 1
Total 1 1 1 0

232
PUBLIC LIBRARY DEPARTMENT
MISSION STATEMENT:
The Mansfield Public Library provides free and equal access to a broad range of informational resources,
creating opportunities for education, recreation and the pursuit of life-long learning.
Department at a Glance
The Library Department includes the City Librarian, Adult Services Librarian, Library Assistant, Youth
Services Librarian, Technical Services and Systems Librarian, Administrative Assistant, Library
Technical Assistant and four part-time clerical staff. The Library budget increased 5.08% in FY 2016-
2017 due to a merit increase and additional technology and library book upgrades. The Library is open six
days per week and operates from a 17,000 square foot facility.
Key Goals and Objectives
Goal 1
Maintain full accreditation with the Texas State Library System.
Objectives:
Broaden acquisition of library resources in print and electronic form to fit the needs of Mansfield
library users.
As staffing permits, adjust hours of operation in the mornings and evenings to fit the needs of
library users.
Increase number and scope of adult, youth, and children’s program activities.
Goal 2
Increase citizen awareness of the library and continue to improve access to the library’s program of
resources and services.
Objectives:
Promote and facilitate cultural and informational programs in the library.
Take advantage of available social media outlets to inform citizens and promote library
programming.
Continue to broaden library programming through cooperative efforts with neighboring libraries
and local partnerships.
Goal 3
Continue to improve library technology to meet the changing needs of Mansfield citizens.
Objectives:
As staffing permits, offer personalized instruction on various types of online programs and
services.
Increase functionality of the library website to allow better communication between library users
and staff.
Provide technology that will better serve the special needs of library users.
Performance Objectives
Maintain accreditation with the Texas State Library System.

233
Make citizens of Mansfield aware of the library and continue to develop access to the library’s
program of resources and services.
Continue to improve library technology to meet the changing needs of Mansfield citizens.
Measurable Outcomes:
Door count – visits to the library and attendance at library programs and activities.
Circulation of library print and electronic resources.
Measures obtained from the library’s electronic integrated library system.
Actual Actual Budget Budget
Library 2013/2014 2014/2015 2015/2016 2016/2017
Demand
Annual Library Visits 140,922 127,772 131,861 137,000
Library Resources Used 317,754 327,530 338,011 348,000
Public Computer Users 35,018 33,158 34,219 35,000
Public Computer Use (hours) 20,738 20,618 21,278 2,200
Library Cards on File 42,853 45,673 48,678 50,000
Meeting Room Users 11,843 10,129 10,453 11,000
Program Attendance 7,021 6,964 7,187 7,400
Hits On Library Web Page 128,838 85,796 88,541 91,000
Electronic Resource Use 45,793 43,636 44,945 46,000
Workload
Square Footage Maintained 15,332 15,332 15,332 15,332
Materials Collection Items 74,373 73,898 76,263 77,000
Volunteer Hours 1,685 1,606 1,646 1,700
Average Monthly Visits 11,744 10,648 10,989 11,417
Productivity
Square Footage Maintained 15,332 15,332 15,332 15,332
Material Collection Items 74,373 73,898 76,263 79,000
Public Access Computers 24 24 32 32
Volunteer Hours 1,685 1,606 1,646 1,700
Average Monthly Visits 11,744 10,648 10,989 11,417
Effectiveness
Annual Percent Increase of Library Use 11.0% 3.2% 3.2% 3.2%
Annual Library Visits 140,922 127,772 131,861 136,081
Library Materials and Resources Used 317,754 327,530 338,011 348,828
Library Actual Budget Budget % Change
Summary 2014-2015 2015-2016 2016-2017 2016-2017
Personnel Services 501,191$ 752,125$ 779,853$ 3.69%
Operations 241,809 263,401 287,226 9.04%
Capital 7,450
Projects
Total 750,451$ 1,015,526$ 1,067,079$ 5.08%

234
Library 2014/2015 2015/2016 2016/2017 2016/2017
Full Time Equivilent Positions Budget Budget Budget Additions
City Librarian 1 1 1
Adult Services Librarian 1 1 1
Administrative Assistant 1 1 1
Library Assistant 1 1 1
Youth Services Librarian 1 1 1
Library Systems Manager 1 1 1
Librarian 1 1 1
Part-Time Staff 4 4 4
Total 11 11 11 0

235
COMMUNICATIONS AND MARKETING DEPARTMENT
MISSION STATEMENT:
The mission of the Communications and Marketing Department is to be the citizen, staff and media link
to the City of Mansfield, enabling each to access information on City news and special events,
understand local and regional issues that impact Mansfield and participate in ongoing, City-wide dialogue
to build consensus and community support. The department’s mission is accomplished through the
implementation of the directives outlined in the Strategic Communications & Marketing Plan.
Department at a Glance
The Communications and Marketing Department includes the Communications Director and one Graphic
Artist. The Communications and Marketing budget increased less than 1% due in FY 2016-2017.
Key Goals and Objectives
Goal 1
Provide resources for citizens, staff and media to get access to community news and learn more about
community issues.
Objectives:
Improve information distribution to residents by expanding on the City’s Strategic Digital
Communications Plan, to include online reports and interactive media. Tactic: add new social
media platforms and grow the social media team.
Continue to work with the IT Department on maintenance of the new City website,
implementation of a new content management system and development of other online and
mobile communication tools. Tactic: audit website and make changes to improve navigation and
design; work to expand use of video through the City’s PEG channel.
Develop print and digital materials for new and existing residents that focus on City services and
information. Tactic: add new brochures for departments.
Goal 2
Promote and market the City through promotional materials, advertising and marketing campaigns.
Objectives:
Expand the reach of the City’s brand strategy and increase the City’s profile on a local and
national level through advertising and media relations. Tactic: design new advertising for use in
statewide publications that focuses on Money Magazine ranking.
Work with departments such as Tourism, Economic Development, Water, Parks and Recreation
and Environmental Services to market information and activities. Tactic: expand national
observances to local promotional materials.
Work with City departments to develop a branded and comprehensive signage program
throughout the City directing residents and visitors to facilities and specific areas of Mansfield
including Historic Downtown. Tactic: expand banner program across the City and develop a
brand for Historic Downtown Mansfield.
Goal 3
Improve interdepartmental communications.

236
Objectives:
Assist the Human Resources and IT departments in the development of internal communication
tools. Tactic: develop content for City-wide Intranet.
Develop multimedia program for the annual awards banquet. Tactic: develop a banquet video
theme.
Performance Measures
Provide resources for citizens, staff and media to get access to community news and learn more
about community issues.
Promote and market the City through promotional materials, advertising and marketing
campaigns.
Improve interdepartmental communications.
Measurable Outcomes:
Add new social media platforms, new brochures for departments, and grow social media team.
Design new advertising and expand the banner program.
Develop content for the City Intranet; develop theme for banquet video.
Actual Actual Budget Budget
Commnications & Marketing 2013/2014 2014/2015 2015/2016 2016/2017
Demand
Meetings 30 42 42 42
City Staff 511 528 532 532
Hits to City Website (annually) 612,500 655,000 675,000 687,000
Workload
Annual Reports Printed 300 200 200 150
Social Media Posts (monthly) NEW - - - 100
Annual Reports Distributed 300 200 200 150
Productivity
Resident & Visitors Guides 10,000 15,000 15,000 15,000
Annual Reports Printed 300 200 200 150
Water Quality Reports Printed NEW - - - 22,000
Effectiveness
Social Media Reach (avg monthly) NEW - - - 3,600
City Website Usage (monthly) 51,042 60,021 64,900 62,000
Social Media New Likes (monthly) NEW - - - 375
Comm. & Marketing Actual Budget Budget % Change
Summary 2014-2015 2015-2016 2016-2017 2016-2017
Personnel Services 227,794$ 236,114$ 250,379$ 6.04%
Operations 172,361 96,639 85,388 -11.64%
Capital
Projects
Total 400,155$ 332,753$ 335,766$ 0.91%
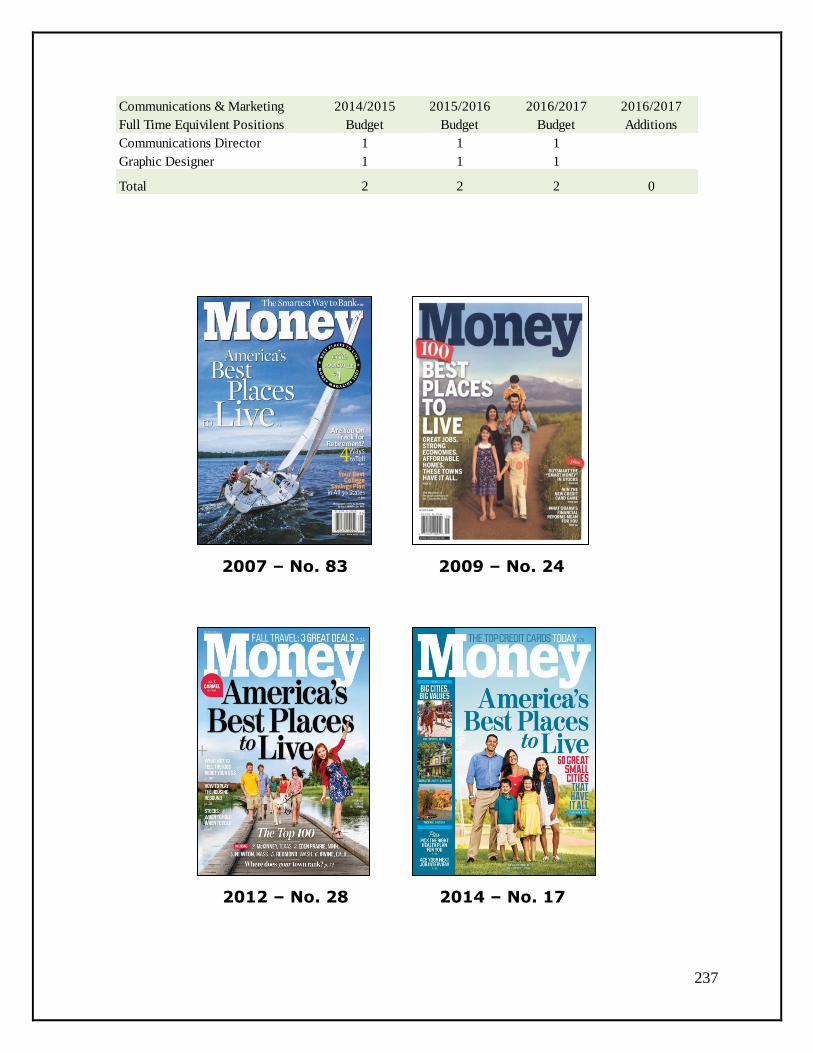
237
Communications & Marketing 2014/2015 2015/2016 2016/2017 2016/2017
Full Time Equivilent Positions Budget Budget Budget Additions
Communications Director 1 1 1
Graphic Designer 1 1 1
Total 2 2 2 0
2007 – No. 83 2009 – No. 24
2012 – No. 28 2014 – No. 17

238
HISTORICAL SERVICES DEPARTMENT
MISSION STATEMENT:
The mission of the Historical Services Department is to preserve the historical building and history of
Mansfield, to provide access to the community with our research materials, genealogy access, and provide
tours to elementary school children, civic groups, Boy and Girl Scout groups and other groups interested
in the City of Mansfield’s history.
Department at a Glance
The Historical Services Department includes the City Museum Specialist. The department was created in
the General Fund in FY 2013-2014 and is managed by the City Librarian. Previously, the entire budget
for this department was included in the City’s annual hotel/motel allocation.
Historical Services Actual Budget Budget % Change
Summary 2014-2015 2015-2016 2016-2017 2016-2017
Personnel Services 35,883$ 50,564$ 64,003$ 26.58%
Operations 4,100 3,910 3,910 0.00%
Capital
Projects
Total 39,983$ 54,474$ 67,913$ 24.67%
Historical Services 2014/2015 2015/2016 2016/2017 2016/2017
Full Time Equivilent Positions Budget Budget Budget Additions
Museum Specialist 1 1 1
Total 1 1 1 0

239
PUBLIC WORKS DIVISION
Street
Maintenance
Repair streets as needed
Schedule work order
requests
Schedule contract
services as needed
Conduct preventive
maintenance programs
Traffic
Control
Provide traffic control
monitoring
Conduct street light
inventories
Engineering
Review and approve
street and utility projects
Conduct plan reviews
Recommend capital
improvement plans
Schedule construction
projects
Ensure compliance with
construction standards
Environmental
Services
(Special Revenue
Fund)
Public Works Division Highlights
An estimated 75 projects are “in-progress” in FY 2016-2017.
The Street Maintenance Department maintains 450 lane miles of
streets.

240
PUBLIC WORKS DIVISION AT A GLANCE
Budget Summary
The Public Works Division includes the Engineering Department, Street Maintenance Department and the
Traffic Control Department which was created to service the ever-growing number of traffic signals
within the City. The division is also responsible for all street construction, utility construction and
drainage construction within the City. The Full Time Equivalent (FTE) budgeted positions in this fund are
also budgeted on an allocation basis in the Street, Utility and Drainage funds. The Public Works Division
budget increased 4.70% due to a merit increase and increased costs for maintenance of the streets, traffic
lights and signals.
Actual Budget Budget % Change
Departments 2014-2015 2015-2016 2016-2017 2016-2017
Engineering 445,988$ 418,760$ 418,812$ 0.01%
Street Maintenance 2,675,453 3,189,159 3,300,332 3.49%
Traffic Control 1,073,196 1,129,884 1,241,325 9.86%
Total 4,194,636$ 4,737,803$ 4,960,469$ 4.70%
Actual Budget Budget % Change
Departments 2014-2015 2015-2016 2016-2017 2016-2017
Personnel Services 1,462,908$ 1,606,216$ 1,725,172$ 7.41%
Operations 2,529,257 3,131,587 3,235,298 3.31%
Capital 202,472
Projects
Total 4,194,636$ 4,737,803$ 4,960,469$ 4.70%

241
ENGINEERING DEPARTMENT
MISSION STATEMENT:
The mission of the Engineering Department is to oversee the design and construction of all street, traffic,
drainage, and water & sewer improvements within the City of Mansfield. The Engineering Department is
also responsible for establishing and updating master plans for these systems and design and construction
standards.
Department at a Glance
The Engineering Department monitors all street, utility and drainage projects from the conceptual stage
through the preparation of construction plans, contract documents, completion and final acceptance of
construction projects. The Engineering Department includes the Director of Public Works, City Engineer,
five engineers, five inspectors, one technician and one secretary. A portion of the salary and benefits are
allocated to the Street, Utility and Drainage funds. The Engineering budget increased less than 1% in FY
2016-2017.
Key Goals and Objectives
Goal 1
Improve selected streets and utility infrastructure.
Objectives:
Continue the design and construction of the projects in the Street Bond Program.
Continue the design and construction of water and sanitary sewer projects identified in the Utility
Master Plans.
Identify infrastructure needs for 2017.
Goal 2
Review, revise and implement updated design and construction standards.
Objectives:
Review, revise and implement updates to Standard Construction Guidelines.
Revise and implement the Roadway & Access Management Design Criteria Manual.
Review, revise and implement the Storm Water Management Design Manual.
Goal 3
Update the City of Mansfield Thoroughfare Plan and Roadway Impact Fee Study.
Objectives:
Establish and oversee the contract for traffic consultant updating efforts to update traffic
modeling and proposed thoroughfare plan changes.
Develop and oversee contract with transportation consultant to update the Roadway Impact Fee
Study.
Process the approval of the Thoroughfare Plan and Impact Fee Study through the Planning and
Zoning Commission and City Council by November of 2017.
Performance Objectives
Improve selected streets and utility infrastructure.

242
Review, revise and implement updated design and construction standards.
Update the City of Mansfield Thoroughfare Plan and Roadway Impact Fee Study.
Measurable Outcomes:
Improve selected streets and utility infrastructure.
Review, revise and implement updated design and construction standards.
Update the City of Mansfield Thoroughfare Plan and Roadway Impact Fee Study.
Actual Actual Budget BudgetEngineering 2013/2014 2014/2015 2015/2016 2016/2017
Demand
Departments Supervised 5 5 5 5
Capital Funds monitored 4 4 4 4
Capital Budgets Monitored (millions) 22.7M 55.5M 43.8M 52.8M
Service Area 36.69 36.69 36.69 36.69
Miles of Water & Sewer Mains 577 538 540 585
On-going Projects 81 58 80 75
Workload
Projects in Progress 81 58 80 75
Departmental Staffing 12 13 13 15
Contractors Monitored 225 220 225 230
Effectiveness
Projects Completed 13 8 10 8
Street Improvements (Miles) 7 3 2 4
Utility Improvements (Miles) 3 4 2 4
Drainage Improvements (Miles) 5 1 1 2
Engineering Actual Budget Budget % Change
Departments 2014-2015 2015-2016 2016-2017 2016-2017
Personnel Services 375,173$ 344,148$ 349,432$ 1.54%
Operations 46,496 74,613 69,380 -7.01%
Capital 24,319
Projects
Total 445,988$ 418,760$ 418,812$ 0.01%
Engineering 2014-2015 2015-2016 2016-2017 2016-2017
Full Time Equivilent Positions Budget Budget Budget Additions
Public Works Director 1 1 1
Secretary 1 1 1
City Engineer 1 1 1
Engineer 4 4 4
Inspectors 5 5 5
Technician 1 1 1
Part time Administrative Assistant 0 0.5 0.5
Total 13 13.5 13.5 0

243
Do You Know?
The City maintains 585 miles of water and sewer mains, 450 miles of streets
and 45 traffic signals.

244
STREET MAINTENANCE DEPARTMENT
MISSION STATEMENT:
The mission of the Street Maintenance Department is to sustain and optimize the structural life of the
City’s streets in the most cost effective manner and provide preventive maintenance to existing concrete
and asphalt streets.
Department at a Glance
The Street Maintenance Department includes the Street Maintenance Supervisor and thirteen maintenance
staff. The Street Maintenance budget increased 3.49% due to a merit increase and increased costs for
street maintenance and repairs.
Key Goals and Objectives
Goal 1
Continue to increase the productivity of the department by utilizing existing staff as they become more
proficient in street, curb, gutter and roadway maintenance and repair.
Objectives:
Use maintenance staff to perform pothole repair and other minor street repairs as needed.
Reduce the need for outsourcing by increased employee skill sets internally. Develop a congruent
training environment by introducing quantifiable programs.
Reduce the cost of materials by utilizing existing purchasing agreements in place with Tarrant
County and other entities.
Goal 2
Continue an aggressive yearly program of preventative maintenance to lengthen the service life of streets
that are in relatively good condition, therefore reducing future maintenance costs.
Objectives:
Utilize crack sealing processes on asphalt and concrete repairs.
Utilize Public Works Management software to inventory maintenance records, assisting in long
term maintenance decisions.
Develop preventative programs targeting not only aging streets, curbs and gutters but also more
recently constructed streets, in order to optimize street life.
Goal 3
Expand the use parameters and life of aging heavy equipment.
Objectives:
Train current employees to increase staff’s comprehension of fleet services and develop best
practices and maintenance methods.
Develop a preventive maintenance system to enhance productive hours for heavy equipment.
Orchestrate projects requiring a specific piece of heavy equipment in order to reduce the staging
hours required for each specified project.

245
Performance Objectives
Continue to increase the productivity of the department by utilizing existing staff as they become
more proficient in street, curb, gutter and roadway maintenance and repair.
Continue an aggressive yearly program of preventative maintenance to lengthen the service life of
streets that are in relatively good condition therefore reducing future maintenance costs.
Expand the use parameters and life of aging heavy equipment.
Measurable Outcomes:
Continue to increase the productivity of the department by utilizing existing staff as they become
more proficient in street, curb, gutter and roadway maintenance and repair.
Continue an aggressive yearly program of preventative maintenance to lengthen the service life of
streets that are in relatively good condition therefore reducing future maintenance costs.
Actual Actual Budget BudgetStreet Maintenance 2013/2014 2014/2015 2015/2016 2016/2017
Demand
Calls for Service 4,525 4,456 4,500 4,550
Service Area (square miles) 36.69 36.69 36.69 36.69
Workload
Work Orders Processed 3,685 3,745 3,750 3,760
Streets Maintained (Lane Miles) 242 408 410 450
Streets Maintained-Unpaved 5 5 5 5
Streets Maintained-Surface Treatment 53.50 53.50 53.50 53.50
Productivity
Asphalt Overlays (square feet) 42,971 42,960 42,000 44,805
Street Segments Repaired 2,550 3,040 2,700 2,855
Curb & Gutter Repairs (linear feet) 4,161 4,110 4,200 4,260
Effectiveness
Avg Repair Time-Days 2 2 4 4
Cost per Mile-Paving Repairs 12.50$ 14.90$ 15.50$ 15.80$
Street Maintenance Actual Budget Budget % Change
Summary 2014-2015 2015-2016 2016-2017 2016-2017
Personnel Services 894,408$ 985,734$ 1,067,215$ 8.27%
Operations 1,612,892 2,203,424 2,233,117 1.35%
Capital 168,153
Projects
Total 2,675,453$ 3,189,159$ 3,300,332$ 3.49%
Street Maintenance 2014-2015 2015-2016 2016-2017 2016-2017
Full Time Equivilent Positions Budget Budget Budget Additions
Street Supervisor 1 1 1
Administrative Assistant 1 1 1
Traffic Control Supervisor 1 1 1
Repair Technician 0 0 0
Street Maintenance Staff 10 11 11
Total 13 14 14 0

246
TRAFFIC CONTROL DEPARTMENT
MISSION STATEMENT:
The mission of the Traffic Control Department is to safely and efficiently operate, maintain and repair all
signals, signs, pavement markings and streetlights within the City of Mansfield.
Department at a Glance
The Traffic Department budget increased 9.86% due to the increased costs of signal, signage, street lights,
contract service agreements and a merit increase. The Traffic Control Department consists of one traffic
signal supervisor, one traffic technician and one staff member.
Key Goals and Objectives
Goal 1
Ensure all signals, signs, markings and street lights are maintained in good workable condition.
Objectives:
Utilize on-call staff to repair hazardous situations.
Monitor timing of signals to ensure efficient and safe traffic flow.
Ensure work orders are processed in a timely manner.
Be proactive in replacement of faded/damaged signs.
Goal 2
Continue an aggressive semi-annual program of traffic signal preventative maintenance to lengthen the
service life of signals that are in relatively good condition, therefore reducing future maintenance costs.
Objectives:
Utilize new technology to reduce operating cost and improve traffic flow efficiency.
Utilize Public Works Management software to inventory maintenance records, street light outages
and schedule long term maintenance decisions.
Develop and implement preventative programs targeting not only aging signals but also newer
signals.
Goal 3
Apply for grant opportunities when available.
Objectives:
Monitor the Council of Governments for grant opportunities.
Monitor the State and Federal websites for grant opportunities.
Performance Objectives
Maintain signals and street lights within the City of Mansfield.
Monitor and apply for grants whenever possible.
Repair signals and street lights in a timely manner.

247
Measurable Outcomes:
The Traffic Control department will answer 100% of calls within 24 hours.
Over 1,050 repair calls are answered in 1 day.
Actual Actual Budget Budget
Traffic Control 2013/2014 2014/2015 2015/2016 2016/2017
Demand
Calls for Service 1,825 1,089 1,100 1,050
Traffic Signals Calls 33 218 230 300
Service Area 36.69 36.69 36.69 36.69
Workload
Calls for Service 1,825 1,089 1,100 1,050
Street Signals Maintained 33 42 45 45
Street Light Flashers 68 68 70 70
Productivity
Traffic Signal Calls 218 230 300
School Flasher Calls 32 35 40
Streetlight Calls 393 400 375
Guardrail Repair 8 5 5
LOS Calls (loss of services) 6 5 19
Graffitti 5 5 6
Traffic Signs 410 400 360
PD Calls 192 200 216
Service Calls answered within 24 hours 100% 100% 100% 100%
Grants
Effectiveness
Service Calls answered within 24 hours 100% 100% 100% 100%
Avg Repair Time-Days 2 1 1 1
Line of Sight/Calls for Service 23 20 16
Traffic Control Actual Budget Budget % Change
Summary 2014-2015 2015-2016 2016-2017 2016-2017
Personnel Services 193,327$ 276,334$ 308,525$ 11.65%
Operations 869,869 853,550 932,800 9.28%
Capital 10,000
Projects
Total 1,073,196$ 1,129,884$ 1,241,325$ 9.86%
Traffic Control 2014-2015 2015-2016 2016-2017 2016-2017
Full Time Equivilent Positions Budget Budget Budget Additions
Traffic Signal Supervisor 1 1 1
Maintenance Staff 2 2 2
Total 3 3 3 0

249
ENTERPRISE FUNDS
The Enterprise Funds are used for operations that are financed and operated in a manner
similar to private business enterprises where the costs (expenses, including depreciation) of
providing goods and services to the general public on a continuing basis are financed through
user charges. The City’s Enterprise Funds are comprised of the Environmental Services Fund,
Water & Sewer Fund, and the Law Enforcement Center Fund.

250
ENVIRONMENTAL SERVICES FUND
MISSION STATEMENT:
The mission of Environmental Services is to oversee and implement the City’s Municipal Separate Storm
Water Sewer System (MS4) permit, develop drainage capital improvement projects and schedule drainage
improvement maintenance activities.
Department at a Glance
The Environmental Services Fund is managed by one department within the Public Works Division. The
Environmental Services Department is funded through fees assessed to residential and commercial
customers. In FY 2015-2016, a fee increase was adopted by the City Council to fund ongoing projects
and future capital expenditures. The fund includes the Storm Water Manager, one Storm Water Inspector,
a Hazardous Waste Coordinator, and one Education Specialist, as well as partial allocations of salary and
benefits of the Street Supervisor, Public Works Director and Inspector. The Environmental Services
Department budget increased 88.77% due to the addition of the Hazardous Waste Coordinator and
Education Specialist, overtime and contract services.
Key Goals and Objectives
Goal 1:
Fully implement all measures submitted to the TCEQ through the Storm Water Management Plan
developed for the City of Mansfield.
Objectives:
Implement measures contained in the new Storm Water Management Program necessary to meet
permit requirements.
Continue to evaluate the effectiveness of control measures to improve surface water quality.
Cease ineffective control measures and replace with more effective control measures as needed.
Goal 2:
Identify drainage capital improvement needs and address as appropriate. Assess capital position and post
new funds when appropriate.
Objectives:
Complete existing identified drainage CIP projects.
Evaluate drainage CIP needs to create projects as funding is available.
Identify potential new drainage CIP projects and reprioritize the CIP list as needed.
Evaluate current needs versus current funds. Post additional bonds when appropriate.
Goal 3:
Conduct regular drainage infrastructure maintenance in a timely manner.
Objectives:
Ensure drainage channels and other areas are maintained to provide adequate capacity and reduce
the risk of flooding to adjacent structures.
Ensure the vegetation of drainage channels and other areas are maintained to provide adequate
fire protection.
Identify drainage infrastructure in need of repair, replacement of reconstruction.

251
Performance Objectives
Maintain 13 miles of channel and ditch areas.
Ensure all vegetation is managed to allow proper drainage.
Measurable Outcomes:
13 miles of ditch and channel areas are cleaned annually to provide adequate drainage flow.
56 acres of vegetation are cleaned and mowed annually.
Actual Actual Budget BudgetEnvironmental Services 2013/2014 2014/2015 2015/2016 2016/2017
Demand
Calls for Service 310 300 300 350
Workload
Calls for Service 310 300 300 350
Vegetation Control (acres) 56 56 56 56
Ditch & channel Maintenance (miles) 13 13 13 2.29
Box Culverts (feet) 10,072 10,500 10,500 40,715
Open Channels (feet) 59,165 60,000 60,000 73,974
Storm Pipe Channels (feet) 42,500 43,000 43,000 538,387
Productivity
Bar Ditch Regrade (feet) 2150 2150 2000
Bridge & Cucert Clearing/Repair (ea.) 10 10 15
Outfall Repairs (ea.) 4 4 8
Channel Regrade (feet) 2,500 2,500 4,000
Headwall Repair 1 1 5
Misc. Drainage Repair (ea.) 12 12 15
Inlets Cleared (ea.) 13 13 10
Effectiveness
Master Drainage Studies Completed 1 1
Master Drainage Projects Completed 1 2
Environmental Services Actual Budget Budget % Change
Summary 2014-2015 2015-2016 2016-2017 2016-2017
Personnel Services 292,993$ 270,587$ 434,754$ 60.67%
Operations 464,780 260,600 594,200 128.01%
Reserve 780,624
Bond Coverage 131,792
Capital Projects 500,698$ 777,284 3,220,000 314.26%
Total 1,258,471$ 1,308,471$ 5,161,370$ 294.46%
Environmental Services 2014-2015 2015-2016 2016-2017 2016-2017
Full Time Equivilent Positions Budget Budget Budget Additions
Storm Water Manager 1 1 1
Storm Water Inspector 1 1 1
Hazardous Waste Coordinator 0 0 1 1
Education Specialist 0 0 1 1
Total 2 2 4 2

252
Capital Projects Proposed for FY 2016-2017*
* Pending Bond Issuance
Drainage Improvements
Description Estimated Cost
Hogpen Study Update 350,000
Brookfield Hogpen Erosion Repair 480,000
Day Miar Channel Plans & Construction 700,000
Low Branch@ Main Culvert (Design & Construction) 750,000
Watson Branch H&H Study Update 60,000
Garden Heights Channel 300,000
Kimberly Ct. Flume & Improvements 180,000
Misc. Improvements 400,000
Totals 3,220,000$

253
WATER & SEWER FUND
(UTILITY SERVICES DIVISION)
Administration
Administers the Utility
Fund program.
Provides GIS services
City-wide.
Meter Services
Provides timely and
accurate meter
readings for all
City accounts using
the latest technology.
Billing & Collections
Provides billing and
collection services to
the citizens.
Coordinates new
account information
with City departments.
Wastewater
Collection
Maintains the sewer
pipeline system.
Water Distribution
Maintains the water
pipeline distribution
system.
Water Treatment
and Quality Control
Provides treated
water to the citizens
of Mansfield.
Water Demand
Management
Utility Services Division Highlights
The City can pump up to 57 million gallons per day.
Estimated ground storage capacity is 4.75 million gallons.
The City has a 100% water accountability rating.
The City’s water system has been rated “Superior.”
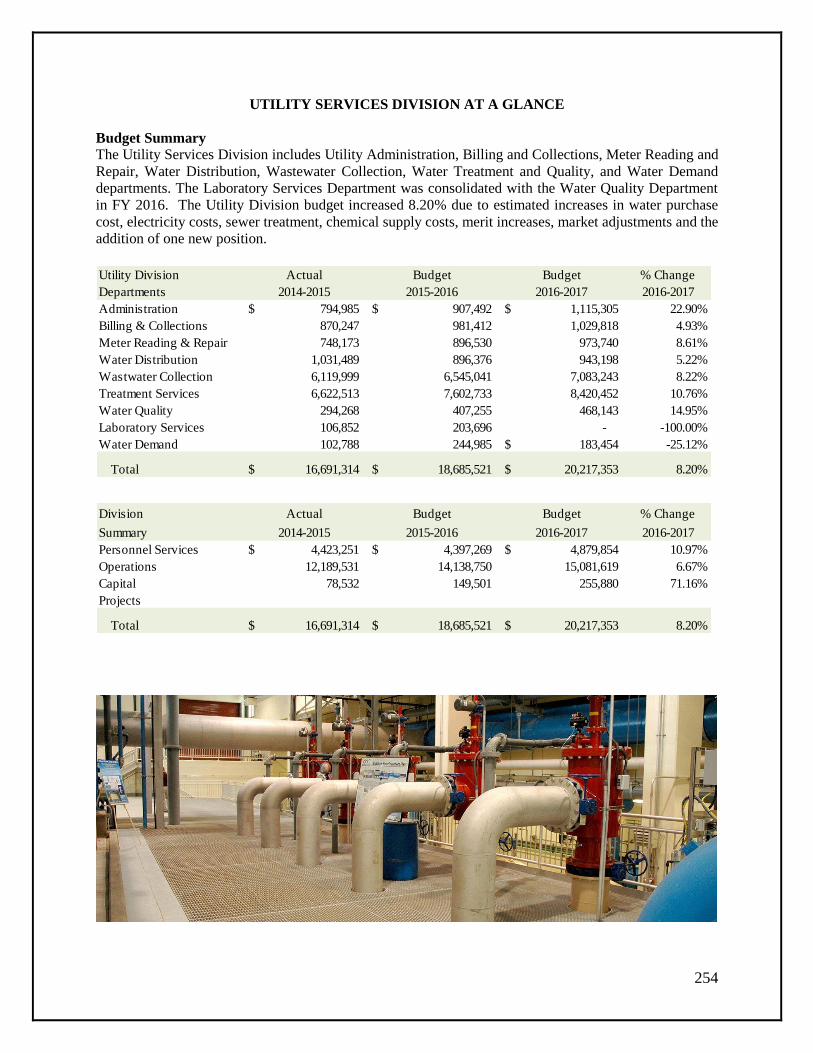
254
UTILITY SERVICES DIVISION AT A GLANCE
Budget Summary
The Utility Services Division includes Utility Administration, Billing and Collections, Meter Reading and
Repair, Water Distribution, Wastewater Collection, Water Treatment and Quality, and Water Demand
departments. The Laboratory Services Department was consolidated with the Water Quality Department
in FY 2016. The Utility Division budget increased 8.20% due to estimated increases in water purchase
cost, electricity costs, sewer treatment, chemical supply costs, merit increases, market adjustments and the
addition of one new position.
Utility Division Actual Budget Budget % Change
Departments 2014-2015 2015-2016 2016-2017 2016-2017
Administration 794,985$ 907,492$ 1,115,305$ 22.90%
Billing & Collections 870,247 981,412 1,029,818 4.93%
Meter Reading & Repair 748,173 896,530 973,740 8.61%
Water Distribution 1,031,489 896,376 943,198 5.22%
Wastwater Collection 6,119,999 6,545,041 7,083,243 8.22%
Treatment Services 6,622,513 7,602,733 8,420,452 10.76%
Water Quality 294,268 407,255 468,143 14.95%
Laboratory Services 106,852 203,696 - -100.00%
Water Demand 102,788 244,985 183,454$ -25.12%
Total 16,691,314$ 18,685,521$ 20,217,353$ 8.20%
Division Actual Budget Budget % Change
Summary 2014-2015 2015-2016 2016-2017 2016-2017
Personnel Services 4,423,251$ 4,397,269$ 4,879,854$ 10.97%
Operations 12,189,531 14,138,750 15,081,619 6.67%
Capital 78,532 149,501 255,880 71.16%
Projects
Total 16,691,314$ 18,685,521$ 20,217,353$ 8.20%

255
UTILITIES ADMINISTRATION
MISSION STATEMENT:
The mission of Utilities Administration is to direct the operations of the Utilities Division by maximizing
the use of all available equipment, staff and assets to provide the citizens with “Superior” utility service.
Department at a Glance
Utilities Administration is comprised of the Administration Office, Billing and Collections, and Meter
Reading and Repairs departments. The Administration Office includes the Director of Water and Sewer
Operations, Assistant Director of Utilities, Budget Administrator, GIS Coordinator and one GIS
Technician. The Administration budget increased 22.90% due to a merit increase, market adjustments and
the addition of the Budget Administrator. Billing and Collections consists of a Billing Supervisor, Senior
Billing Clerk, Billing Clerk, Customer Service Representative, two Cashiers and a Receptionist. The
Billing and Collections budget increased 4.93% due to merit increase and increases in supply costs,
contract services and postage. The Meter Reading and Repair Department includes the Meter Crew
Leader, Meter Reading Supervisor, two Meter Technicians, two Meter Readers and a Data Entry Clerk.
The Meter Reading and Repairs budget increased 8.61% due to a merit increase, overtime costs and the
purchase of new 4G meters to continue technology upgrades City-wide.
Key Goals and Objectives
Goal 1
Implement customer interface software to enhance customer and utility interaction.
Objectives:
Select a software platform with the capabilities desired to integrate all meter reading platforms.
Provide customer and employee training for the new platform.
Construct a public outreach program to deliver the new interface to our customers.
Goal 2
Improve operational efficiency with the continued implementation of a 4G Fixed-Base Meter Reading
System.
Objectives:
Install 4G fixed-base meters in all new construction in order to minimize the impact of system
expansion on the current staffing level.
Install 4G fixed-base meters at locations where the existing meter has reached the end of its
useful life.
Utilize Harmony Systems data analytics to provide customers with their most current water
consumption trends.
Goal 3
Focus in on proactive, external communications with residents and customers with regards to
consumption and billing awareness.
Objectives:
Create an action plan for addressing high water concerns by utilizing existing communication
tools.

256
Create and implement customer service survey.
Increase voice on social media.
Performance Objectives
Implement customer interface software to enhance Utilities Division’s level of customer service.
Improve operational efficiency by installing 4G Fixed-Base Meter Reading System.
Place greater emphasis and efforts on improving external communication with residents and
customers.
Actual Actual Budget Budget
Administration 2013/2014 2014/2015 2015/2016 2016/2017
Demand
Service Departments Supervised 6 6 8 7
Workload
Utility Division Projects 9 11 10 10
Productivity
Ground Storage Capacity (million gal.) 4.75 4.75 4.75 4.75
Elevated Storage Capacity (million gal.) 4 4 4 4
Pumping Capacity (daily million gal.) 57 57 57 57
Department Meetings 14 12 14 14
Effectiveness
Public Water System Rating Superior Superior Superior Superior
Percent Meeting Monthly Standards 100% 100% 100% 100%
Treatment Capacity (million gal.) 45 45 45 45
GIS Integration of Systems 100% 100% 100% 100%
Actual Actual Budget Budget
Billing & Collections 2013/2014 2014/2015 2015/2016 2016/2017
Demand
Population (3.24 residents per account) 59,230 62,246 63,248 68,786
Active Meter Accounts 19,919 20,404 20,889 21,373
Workload
Payments Processed 242,422 248,325 254,227 260,118
Walk In Customers (monthly) 2,074 1,875 1,664 1,441
New Utility Accounts (annually)* 2,644 2,600 2,412 2,550
Receptionist Calls Monthly 2,249 2,180 2,107 2,157
Productivity
Staffing 7 7 7 7
Payments Per FTE 34,632 35,475 36,318 37,160
FTE per Capita 8,461 8,892 9,035 9,827
Effectiveness
Billing Accuracy 99.5% 99.7% 99.8% 99.9%
*Includes residential, commercial, irrigation locations, etc.

257
Measurable Outcomes:
Implementation and saturation of 50% of customers.
Replace 5% of existing meters with 4G, while installing only 4G on new customer connections.
Customer service survey results; 50% increase in media postings.
Actual Actual Budget Budget
Meter Reading & Repairs 2013/2014 2014/2015 2015/2016 2016/2017
Demand
Active Meter Reads Monthly 20,203 20,660 21,078 21,637
Workload
Avg. Manual Meters Read Monthly (per reader) 6,734 6472 5,672 4,672
Avg AMI/AMR Meters Read Monthly 13,513 14,188 14,628 15,156
Meter Re-Reads (annually) 3,508 2,989 3,005 3,222
Meter Sets (monthly) 28 37 36 44
Customer Service Requests (annually) 12,337 13,046 13,788 13,210
Cut Offs (annually) 4,376 3,842 3,900 4,085
Productivity
Staffing 8 8 7 7
Meters per FTE 2,531 2,951 3,525 3,606
Service Calls per FTE 1,542 1,864 2,185 2,236
Effectiveness
Percent of Meters Read Monthly 100% 100% 100% 100%
Meter Reading Accuracy 98.6% 98.8% 98.8% 98.8%
Administration Actual Budget Budget % Change
Summary 2014-2015 2015-2016 2016-2017 2016-2017
Personnel Services 614,096$ 706,451$ 874,013$ 23.72%
Operations 180,889 201,042 241,292 20.02%
Capital 100.00%
Projects
Total 794,985$ 907,492$ 1,115,305$ 22.90%
Billing & Collections Actual Budget Budget % Change
Summary 2014-2015 2015-2016 2016-2017 2016-2017
Personnel Services 554,578$ 576,745$ 615,998$ 6.81%
Operations 315,669 404,667 413,820 2.26%
Capital
Projects
Total 870,247$ 981,412$ 1,029,818$ 4.93%
Meter Reading & Repair Actual Budget Budget % Change
Summary 2014-2015 2015-2016 2016-2017 2016-2017
Personnel Services 571,574$ 480,577$ 521,594$ 8.53%
Operations 118,231 405,952 347,485 -14.40%
Capital 58,368 10,000 104,662 946.62%
Projects
Total 748,173$ 896,530$ 973,740$ 8.61%

258
Administration 2014-2015 2015-2016 2016-2017 2016-2017
Full Time Equivilent Positions Budget Budget Budget Additions
Director of Utility Operations 1 1 1
Assistant Director of Utilities 1 1 1
Budget Administrator 0 1 1
Administrative Assistant 0 0 1 1
GIS Coordinator 1 1 1
GIS Technician 1 1 1
Total 4 5 6 1
Billing & Collections 2014-2015 2015-2016 2016-2017 2016-2017
Full Time Equivilent Positions Budget Budget Budget Additions
Billing Supervisor 1 1 1
Senior Billing Clerk 1 1 1
Billing Clerk 1 1 1
Customer Service Representative 2 2 2
Cashier 1 1 1
Receptionist 1 1 1
Total 7 7 7 0
Meter Reading 2014-2015 2015-2016 2016-2017 2016-2017
Full Time Equivilent Positions Budget Budget Budget Additions
Meter Crew Leader 1 1 1
Meter Techncian 2 2 2
Meter Reader 3 2 2
Data Entry Clerk 1 1 1
Administrative Assistant 1 1 1
Total 8 7 7 0

259
UTILITIES OPERATIONS
MISSION STATEMENT:
The mission of Utilities Operations is to provide a reliable system for the delivery and removal of water
while maintaining a professional level of customer service.
Department at a Glance
Utilities Operations includes the Water Distribution and Wastewater Collection departments. Water
Distribution consists of the Field Operations Manager, four Crew Leaders, one Inventory Clerk and three
Tradesmen. The Water Distribution budget increased 5.22% due to a merit increase and increases in
supply and equipment costs. Wastewater Collection includes the Field Supervisor, two Crew Leaders, two
Utility Technicians and two Tradesmen. The Wastewater Collection budget increased 8.22% due to a
merit increase, increased costs of sewer treatment and the addition of one new Utility Technician.
Key Goals and Objectives
Goal 1
Prioritize work orders and allocate resources in a manner that provides the greatest benefit to our
customers.
Objectives:
Categorize daily work orders by level of urgency and prioritize activities accordingly.
Continuously evaluate detailed cost data associated with each work order and work toward
improving efficiency.
Maintain accountability of City-issued equipment in order to shorten response times.
Goal 2
Maintain a proactive training and safety program that increases job performance and decreases accidents.
Objectives:
Administer a training curriculum which coincides with everyday job duties.
Conduct weekly safety meetings in order to properly train employees on the hazards of the work
place.
Utilize OSHA rules to administer regular safety meetings.
Goal 3
Identify and make corrections to areas with inflow and infiltration in the sanitary sewer system.
Objectives:
Use data collected from 100M and SCADA systems to locate areas with inflow and infiltration.
Monitor off-site, new construction for exposed or broken sewer mains and connections.
Identify and prioritize line repairs based on data collected from video inspections and smoke
testing of sewer mains and service lines.
Performance Objectives
Prioritize work orders to improve efficiency and customer service.
Increase job performance through training and safety programs.
Monitor and make necessary corrections to areas with inflow and infiltration.

260
Measurable Outcomes:
10% decrease in work order response time.
Maintain 0 loss time injuries.
Reduction of inflow by 50% during rain events.
Actual Actual Budget Budget
Water Distribution 2013/2014 2014/2015 2015/2016 2016/2017
Demand
Water Pipeline System (miles) 292 301 325 330
Calls for Service (monthly) 131 157 120 146
Workload
Minor Leaks Repaired (annually) 136 152 145 143
Main Leaks Repaired (annually) 48 51 40 55
Fire Hydrant Maintained (annually) 120 63 70 81
Productivity
Valves Exercised (annually) 293 431 320 434
Water Taps (annually) 11 7 10 11
Utility Inspection (annually) 488 1046 1,100 874
Test Double Check or RPZ (annually) 6 48 55 48
Water Camera (annually) 227 369 350 227
Flush Hydrants (annually) 595 286 800 601
Effectiveness
Calls Answered within 4 hours 100% 100% 100% 100%
Percent Meeting Monthly Standards 100% 100% 100% 100%
Actual Actual Budget Budget
Wastewater Collection 2013/2014 2014/2015 2015/2016 2016/2017
Demand
Sewer Lines (miles) 278 266 307 314
Sewer Customers 17,727 18,100 17,953 18,600
Calls for Service (monthly) 264 309 335 237
Workload
Sewer Line Video Inspections (annually) 57 60 65 64
Lift Station Maintenance (annually) 443 508 515 741
Average Daily Sewer Flow (gallons) 5,622,000 5,706,330 5,782,667 5,898,320
Productivity
Sewer Lines Repaired (annually) 26 18 25 17
Manholes Cleaned (annually) 234 527 540 500
Sewer Taps (annually) 9 6 15 6
Effectiveness
Service Requests Answered within 4 hours 100% 100% 100% 100%
Grease Trap Inspections (annually) 131 50 80 108
Waste Hauler Inspections (annually) 60 44 38 46
Water Distribution Actual Budget Budget % Change
Summary 2014-2015 2015-2016 2016-2017 2016-2017
Personnel Services 831,514$ 678,085$ 734,543$ 8.33%
Operations 179,829 193,790 184,154 -4.97%
Capital 20,146 24,501 24,501 0.00%
Projects
Total 1,031,489$ 896,376$ 943,198$ 5.22%

261
Wastewater Collection Actual Budget Budget % Change
Summary 2014-2015 2015-2016 2016-2017 2016-2017
Personnel Services 511,947$ 491,329$ 588,998$ 19.88%
Operations 5,608,035 6,007,712 6,459,374 7.52%
Capital 18 46,000 34,871 -24.19%
Projects
Total 6,119,999$ 6,545,041$ 7,083,243$ 8.22%
Water Distribution 2014-2015 2015-2016 2016-2017 2016-2017
Full Time Equivilent Positions Budget Budget Budget Additions
Field Operations Manager 1 1 1
Crew Leaders 4 4 4
Inventory Clerk 1 1 1
Tradesman 3 3 3
Total 9 9 9 0
Wastewater Collection 2014-2015 2015-2016 2016-2017 2016-2017
Full Time Equivilent Positions Budget Budget Budget Additions
Field Supervisor 1 1 1
Crew Leader (Sewer) 3 2 2
Utility Technician (Sewer) 1 1 2 1
Tradesman (Sewer) 4 2 2
Total 9 6 7 1

262
WATER TREATMENT SERVICES
MISSION STATEMENT:
The mission of Water Treatment Services is to provide citizens with a superior drinking water source
which meets or exceeds all state and federal requirements regarding quality, monitoring and reporting
practices. This is to be accomplished in the most cost-efficient means possible.
Department at a Glance
Water Treatment Services includes the Water Treatment, Water Quality and Water Demand departments.
The Laboratory Services Department was consolidated with the Water Treatment Department in FY
2016-2017. Water Treatment is comprised of the Plant Manager, one Supervisor, one part-time and five
full-time Operators, three Instrument Technicians and one Chief Operator. The Water Treatment budget
increased 10.76% due to the increased cost of water from the Trinity River Authority, a merit increase,
market adjustments and realignment of positions within the division. Water Quality includes one Pre-
Treatment Coordinator and three Tradesmen. The Water Quality budget increased 14.95% due to a merit
increase and additional equipment costs. Water Demand includes one Education Specialist. The Water
Demand budget decreased 25.12% due to the realignment of positions in the Utility Division.
Key Goals and Objectives
Goal 1:
Maintain the “Superior” Drinking Water System classification issued by the TCEQ.
Objectives:
Modify existing treatment methods and system operations as state and federal regulations are
revised.
Evaluate and modify monitoring and reporting practices to meet new regulations.
Provide continuing education and training to operators and staff.
Goal 2:
Improve electrical performance across all treatment plant meters.
Objectives:
Utilize pump performance matrix when selecting which pumps to use in a given scenario.
Monitor changes in pump performance with the predictive maintenance program.
Use real time electrical consumption data to decrease peak electrical usage.
Goal 3:
Maintain stable chemical costs through corrective and preventative maintenance procedures.
Objectives:
Repair and/or replace leaking chemical piping with higher grade, product specific materials.
Add brine and bleach tanks to chlorine generation system.
Evaluation and modification to standard operating procedures.
Performance Objectives
Maintain the Superior Public Drinking Water System ranking issued by the Texas Natural
Resources Conservation Commission.

263
Optimize electrical performance of all pumps stations.
Maintain chemical costs at current MGD cost.
Measurable Outcomes:
Maintain “Superior” Drinking Water System classification.
Reduce peak load factor by 50%.
No increase in chemical costs.
Water Treatment/Water Quality Actual Actual Budget Budget
and Water Demand 2013/2014 2014/2015 2015/2016 2016/2017
Demand
Average Monthly Water Flow (million gal.) 291 328 358 358
Water Customers 19,919 20,404 20,889 21,373
Bacteriological Samples 805 920 920 1,100
Workload
Annual Purchased Drinking Water (million gal.) 0.331 0.395 0.395 0.395
Annual Raw water Purchased (million gal.) 3,902 4,065 4,147 4,295
Annual Plant Production (million gal.) 3,483 3,941 3,982 4,079
State of Texas Compliance Samples 30 60 70 70
Irrigation Systems 11,958 12,222 12,486 12,750
Water Conservation Intiatives 21 23 24 26
Productivity
Ground Storage Capacity (million gal.) 4.25 4.25 4.25 4.25
Elevated Storage Capacity (million gal.) 4.00 4.00 4.00 4.00
Pumping Capacity Daily (million gal.) 57 57 57 57
Treatment Capacity (million gal.) 45 45 45 45
Irrigation Plans reviewed within 24 Hours 100% 100% 100% 100%
Effectiveness
Public Water System Rating Superior Superior Superior Superior
Accountability (water billed) 95% 95% 95% 95%
Postive Total Coliform/Fecal Bacteria Samples 2 None None None
Citizen Participation in Conservation 3,290 3,290 3,389 3,490
Compliance with EPA Pretreatment Regulations 100% 100% 100% 100%
Water Treatment Actual Budget Budget % Change
Summary 2014-2015 2015-2016 2016-2017 2016-2017
Personnel Services 920,136$ 815,018$ 1,106,447$ 35.76%
Operations 5,702,377 6,718,714 7,222,159 7.49%
Capital 69,000 91,845 33.11%
Projects
Total 6,622,513$ 7,602,733$ 8,420,452$ 10.76%
Water Quality Actual Budget Budget % Change
Summary 2014-2015 2015-2016 2016-2017 2016-2017
Personnel Services 243,500$ 309,008$ 338,288$ 9.48%
Operations 50,768 98,247 129,855 32.17%
Capital
Projects
Total 294,268$ 407,255$ 468,143$ 14.95%
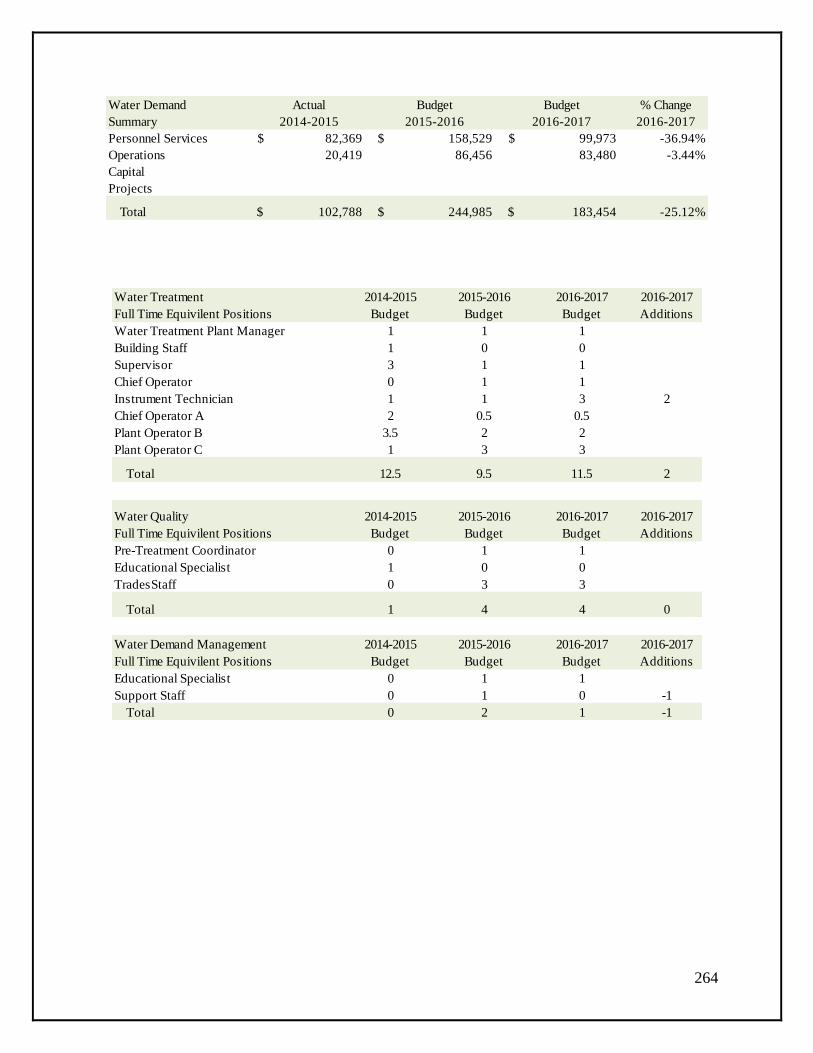
264
Water Demand Actual Budget Budget % Change
Summary 2014-2015 2015-2016 2016-2017 2016-2017
Personnel Services 82,369$ 158,529$ 99,973$ -36.94%
Operations 20,419 86,456 83,480 -3.44%
Capital
Projects
Total 102,788$ 244,985$ 183,454$ -25.12%
Water Treatment 2014-2015 2015-2016 2016-2017 2016-2017
Full Time Equivilent Positions Budget Budget Budget Additions
Water Treatment Plant Manager 1 1 1
Building Staff 1 0 0
Supervisor 3 1 1
Chief Operator 0 1 1
Instrument Technician 1 1 3 2
Chief Operator A 2 0.5 0.5
Plant Operator B 3.5 2 2
Plant Operator C 1 3 3
Total 12.5 9.5 11.5 2
Water Quality 2014-2015 2015-2016 2016-2017 2016-2017
Full Time Equivilent Positions Budget Budget Budget Additions
Pre-Treatment Coordinator 0 1 1
Educational Specialist 1 0 0
TradesStaff 0 3 3
Total 1 4 4 0
Water Demand Management 2014-2015 2015-2016 2016-2017 2016-2017
Full Time Equivilent Positions Budget Budget Budget Additions
Educational Specialist 0 1 1
Support Staff 0 1 0 -1
Total 0 2 1 -1

265
LAW ENFORCEMENT CENTER
FUND
Jail Administration
Provides supervision and
support of all jail operations
Jail Support
Provides building
maintenance, procurement and
related services
Jail Operations
Provides direct supervision
and transportation of jail
inmates
Support Services
(City Marshal)
Provides transportation
and warrant services
Kitchen Services
Provides jail food services
POLICE DIVISION
Medical Services
Provides jail medical services
Law Enforcement Center Highlights
The Jail has contracts with the Federal Government, the City of Fort Worth,
the City of Burleson, and the City of Kennedale to house prisoners.
The average daily inmate population in FY 2016-2017 is estimated to be 400
prisoners.
The jail is estimated to receive $10.9 million in housing revenue in FY 2016-
2017.

266
LAW ENFORCEMENT CENTER FUND AT A GLANCE
Budget Summary
The Law Enforcement Center includes the Administration, Operations, City Marshal, Support, Kitchen
and Medical departments. The Law Enforcement Center budget increased 2.52% due to a 3% merit
increase and minimal operational increases.
Actual Budget Budget % Change
Departments 2014-2015 2015-2016 2016-2017 2016-2017
Administration 301,378$ 294,420$ 309,867$ 5.25%
Operations 5,800,324 5,846,732 6,442,059 10.18%
City Marshal 1,735,692 1,866,053 1,946,311 4.30%
Support 969,080 1,041,045 1,061,507 1.97%
Food Service 491,128 499,298 498,568 -0.15%
Medical 533,223 591,491 703,902 19.00%
Total 9,830,826$ 10,139,039$ 10,962,213$ 8.12%
Division Actual Budget Budget % Change
Summary 2014-2015 2015-2016 2016-2017 2016-2017
Personnel Services 8,475,841$ 8,664,516$ 9,567,871$ 10.43%
Operations 1,354,985 1,435,239 1,394,342 -2.85%
Capital - 39,284 -
Projects -
Total 9,830,826$ 10,139,039$ 10,962,213$ 8.12%
267
ADMINISTRATION DEPARTMENT
MISSION STATEMENT:
The mission of the Administration Department is to provide the highest level of service, in partnership
with the community, to foster a safe atmosphere promoting the highest quality of life for all people.
Department at a Glance
The Administration Department budget increased 5.25% due to a merit increase and market adjustments.
Key Goals and Objectives
Goal 1:
Obtain Chief Best Practices (CBP) Certification.
Objectives:
Complete all policy and procedure revisions to be CBP compliant.
Conduct weekly training to ensure the staff is educated on CBP changes.
Goal 2:
Improve budget efficiency.
Objectives:
Improve tracking measures for line items in the budget.
Improve monthly supervisor training for budget review.
Goal 3:
Prepare for Prison Rape Elimination Act (PREA) compliance certification.
Objectives:
Schedule and complete an internal PREA audit of the jail facility.
Complete all improvements and policy changes to gain compliance certification.
Performance Objectives
Chief Best Practices certification.
Budget efficiency.
PREA certification.

268
Measurable Outcomes:
Successful Chief Best Practice inspection and certification.
Front line supervisor better understanding of the budget process.
Successful certification by PREA Compliance Auditor.
Actual Actual Budget Budget
Administration 2013/2014 2014/2015 2015/2016 2016/2017
Demand
Service Departments 6 6 6 6
Division Staff budgeted 111 111 111 111
Division Budget 9,774,111$ 9,576,770$ 10,139,039$ 10,962,213$
Workload
Staff supervised 111 111 111 111
Average Daily Inmate Population 400 481 378 400
Intergovernmental Agreements 4 4 7 7
Productivity
Percent of Jail Beds Occupied 96% 87% 90% 90%
Staffing Levels Required 111 111 111 111
Effectiveness
Housing Revenue 9,399,965$ 9,247,216$ 9,480,843$ 10,235,016$
Telephone Revenue 200,687$ 201,514$ 175,000$ 200,000$
Average Cost per Inmate per Day 66.94$ 66.94$ 73.48$ 75.08$
Number of Agencies Using Facility 6 7 7 7
Administration Actual Budget Budget % Change
Summary 2014-2015 2015-2016 2016-2017 2016-2017
Personnel Services 266,556$ 249,877$ 265,204$ 6.13%
Operations 34,822 44,544 44,662 0.27%
Capital
Projects
Total 301,378$ 294,420$ 309,867$ 5.25%
Administration 2014-2015 2015-2016 2016-2017 2016-2017
Full Time Equivalent Positions Budget Budget Budget Additions
Assistant Police Chief 1 1 1
Secretary 1 1 1
Total 2 2 2 0

269
OPERATIONS DEPARTMENT
MISSION STATEMENT:
The mission of the Operations Department is to provide the highest level of service, in partnership with
the community, to foster a safe atmosphere promoting the highest quality of life for all people.
Department at a Glance
The Operations Department budget increased 10.18% due to a merit increase, market adjustments and
overtime.
Key Goals and Objectives
Goal 1:
Increase inmate safety and welfare checks.
Objectives:
Incorporate random inspections of facility by senior management to ensure inmate checks are
frequent and exceed standards.
Senior management to monitor and audit a 20% sample of all intake forms and door sheets
weekly.
Goal 2:
Improve cleanliness of inmate and common areas without additional cost.
Objectives:
Use inmate worker programs to increase the frequency of cleaning of all areas.
Monitor via documented audits of officer cleaning activity as well as all inmate worker cleaning.
Goal 3:
Increase officer preparedness and knowledge through non-traditional training.
Objectives:
Increase and optimize use of in-house training equipment including simulators and electronic
training delivery systems
Increase and develop more realistic major event training to prepare officers for escapes, storms,
fire, and medical emergencies.
Performance Objectives
Increased inmate safety.
Improved cleanliness of facility.
Increased officer training.

270
Measurable Outcomes:
Successful random inspections of cell check logs and inmate intake screening.
Increased number of documented inmate cleaning sessions via audit.
Increased number of documented trainings via the Power DMS System.
Actual Actual Budget Budget
Operations 2013/2014 2014/2015 2015/2016 2016/2017
Demand
Operations Staff 77 77 77 77
Average Daily Inmate Population 410 481 378 400
Workload
Inmates Transported Daily 120 120 125 120
Average Daily Inmates Booked 130 95 170 90
Average Daily Inmates Released 130 95 170 90
Housing Units Supervised 15 15 16 16
Productivity
Average Processing Time (minutes) 30 30 30 30
Minimum Staffing-8 Hour Shift 26 26 27 26
Effectiveness
Turnover Rate 15% 15% 12% 15%
Mandatory Training Provided 100% 100% 100% 100%
Operations Actual Budget Budget % Change
Summary 2014-2015 2015-2016 2016-2017 2016-2017
Personnel Services 5,656,180$ 5,666,576$ 6,265,145$ 10.56%
Operations 144,144 180,155 176,914 -1.80%
Capital
Projects
Total 5,800,324$ 5,846,732$ 6,442,059$ 10.18%
Operations 2014-2015 2015-2016 2016-2017 2016-2017
Full Time Equivalent Positions Budget Budget Budget Additions
Lieutenant 3 3 3
Sergeant Operations 4 4 4
Corporal 6 6 6
Record Manager 1 1 1
Correctional Officer 63 63 63
Total 77 77 77 0

271
MARSHALS DEPARTMENT
MISSION STATEMENT:
The mission of the Support Services/Marshals Department is to provide the highest level of service, in
partnership with the community, to foster a safe atmosphere promoting the highest quality of life for all
people.
Department at a Glance
The Marshals Department budget increased 4.30% due to a merit increase, equity adjustments and
additional tactical supply requirements.
Key Goals and Objectives
Goal 1
Maintain a highly focused initiative of warrant clearance through a minimum of 3,500 contacts with
individuals with warrants and those that may know their whereabouts.
Objectives:
Weekly warrant service initiatives using deployment of at least two members of the division
physically attempting to locate wanted persons. At least 20% of the 3,500 contacts will be
accomplished using this method.
Continued daily workday phone contact attempts with wanted persons and those who may know
their whereabouts.
Goal 2:
Increased field readiness training using monthly in-house capabilities and opportunities.
Objectives:
Each member of the division will complete simulator training with in-house training members at
least quarterly.
Each member of the division will complete firearms scenario training at our tactical training
facility each month that it is offered.
Goal 3:
Improve transport efficiency.
Objectives:
Use electronically shared documents of persons to be transported.
Install mobile computers in the transport units to allow tracking and reduction of radio traffic.
Performance Objectives
Increase warrant clearance rate.
Enhance Support Services training.
Improve efficiency of the transport unit.
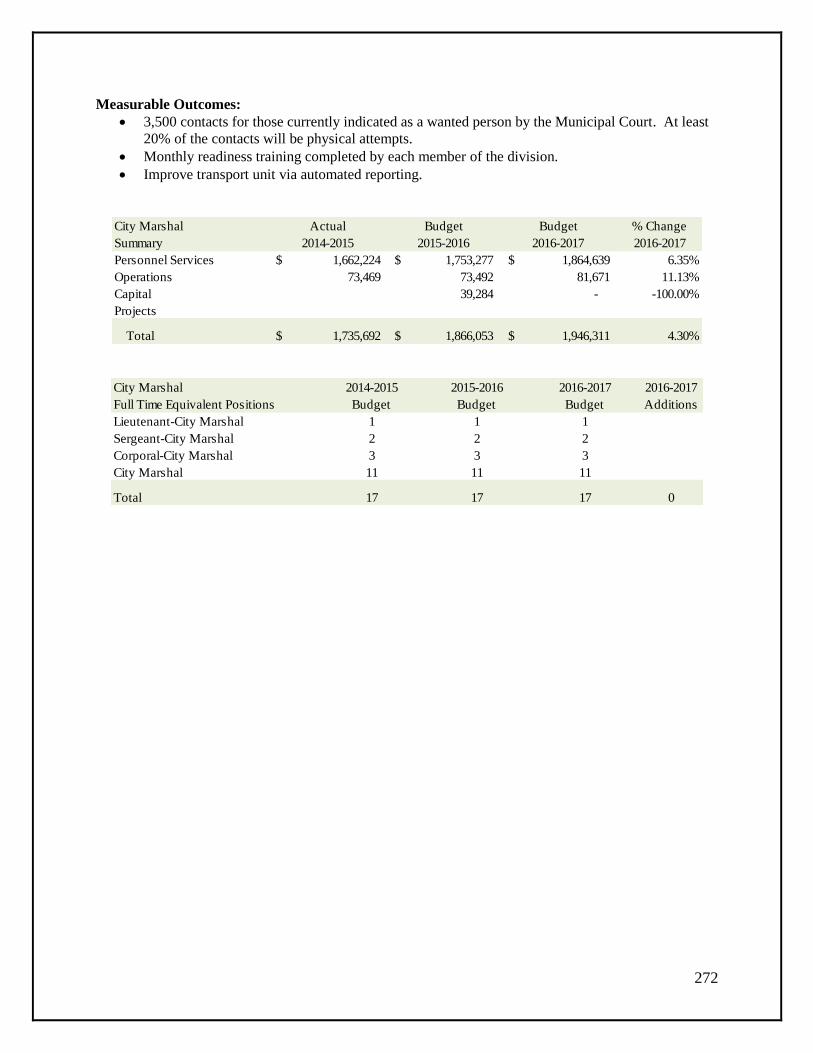
272
Measurable Outcomes:
3,500 contacts for those currently indicated as a wanted person by the Municipal Court. At least
20% of the contacts will be physical attempts.
Monthly readiness training completed by each member of the division.
Improve transport unit via automated reporting.
City Marshal Actual Budget Budget % Change
Summary 2014-2015 2015-2016 2016-2017 2016-2017
Personnel Services 1,662,224$ 1,753,277$ 1,864,639$ 6.35%
Operations 73,469 73,492 81,671 11.13%
Capital 39,284 - -100.00%
Projects
Total 1,735,692$ 1,866,053$ 1,946,311$ 4.30%
City Marshal 2014-2015 2015-2016 2016-2017 2016-2017
Full Time Equivalent Positions Budget Budget Budget Additions
Lieutenant-City Marshal 1 1 1
Sergeant-City Marshal 2 2 2
Corporal-City Marshal 3 3 3
City Marshal 11 11 11
Total 17 17 17 0
273
SUPPORT DEPARTMENT
MISSION STATEMENT:
The mission of the Jail Support Department is to provide the highest level of service, in partnership with
the community, to foster a safe atmosphere promoting the highest quality of life for all people.
Department at a Glance
The Support Department budget increased 1.97% due to a merit increase. Operational costs decreased by
3.20%
Key Goals and Objectives
Goal 1:
Increase facility preparedness and cleanliness via preventative maintenance logs and cleaning program.
Objectives:
Preventative maintenance log created and maintained to monitor maintenance schedule.
Improve deep cleaning based on population.
Goal 2:
Improve and broaden the training delivery systems.
Objectives:
Incorporated outside trainers into our training program to bring about a broader understanding of
techniques and trends.
Have outside agencies attend training with LEC staff and, in turn, LEC staff will receive training
from other agencies.
Goal 3:
Improve cross-training.
Objectives:
Completion of documented cross-training of both case managers to perform duties in both city
and federal case management.
Completion of documented training of three additional LEC staff in the duties of case
management.
Performance Objectives
Enhance maintenance initiatives.
Improved training program to include outside agencies.
Incorporate case management cross-training into the training program.

274
Measurable Outcomes:
Decrease in the amount of calls for outside repairs of essential equipment.
Complete on-site training utilizing expert trainers and the attendance of training by LEC
personnel at other facilities.
Complete cross-training of at least four staff members for case management.
Actual Actual Budget Budget
Support 2013/2014 2014/2015 2015/2016 2016/2017
Demand
Computer Systems 30 38 52 38
Square Footage 42,816 42,816 42,816 42,816
Workload
Work Orders Processed 1,480 1,480 1,300 1,716
Housing Units 16 15 15 16
Productivity
Cooperative Purchasing Agreements 4 4 4 4
Effectiveness
Staffing Level 6 6 6 6
Support Actual Budget Budget % Change
Summary 2014-2015 2015-2016 2016-2017 2016-2017
Personnel Services 646,850$ 698,422$ 729,855$ 4.50%
Operations 322,231 342,624 331,652 -3.20%
Capital
Projects
Total 969,080$ 1,041,045$ 1,061,507$ 1.97%
Support 2014-2015 2015-2016 2016-2017 2016-2017
Full Time Equivalent Positions Budget Budget Budget Additions
Maintenance Technician 1 1 1
Support Staff 3 3 3
Bond Clerks 6 6 6
Total 10 10 10 0

275
FOOD SERVICES DEPARTMENT
MISSION STATEMENT:
The mission of the Food Services Department is to provide the highest level of service, in partnership
with the community, to foster a safe atmosphere promoting the highest quality of life for all people.
Department at a Glance
The Food Service Department budget decreased slightly due to estimated reduced inmate meals per day.
Food Services are provided via a contract, therefore, there are no full-time equivalent employees in this
department.
Key Goals and Objectives
Goal 1:
Continue to improve food service and quality through monitoring.
Objectives:
Institute food service surveys with inmates to anticipate needs.
Increase food sampling by jail management to ensure quality.
Goal 2:
Increase facility cleanliness.
Objectives:
Monthly, documented, and detailed cleaning of assigned, rotating areas of the kitchen.
Monthly maintenance schedule of rotating kitchen equipment.
Goal 3:
Audit and assess all kitchen equipment and systems for replacement needs or requirements.
Objectives:
Conduct a documented inspection of each piece of kitchen equipment.
Conduct a complete safety assessment of kitchen procedures and systems.
Performance Objectives
Increased levels of food service and food quality.
Improved cleanliness of the kitchen.
Complete assessment of kitchen equipment for safety and identification of equipment needs.

276
Measurable Outcomes:
Increased food sampling to include food sampling on every weekly Jail inspection.
Inspection and cleaning report for each month showing item maintenance and areas cleaned.
Actual Actual Budget Budget
Food Service 2013/2014 2014/2015 2015/2016 2016/2017
Demand
Average Daily Inmate Population 400 400 378 400
Average Daily Meals Served 1200 1,200 1,134 1,200
Workload
Average Daily Meals Served 1200 1,200 1,134 1,200
Daily Meals 3 3 3 3
Hot Meals served Daily 2 2 2 2
Productivity
Average Daily Calorie Count 2,800 2,800 2,800 2,800
Average Daily Meals Served 1200 1200 1134 1176
Hot Meals served Daily 2 2 2 2
Effectiveness
Staffing Level 7 7 7 7
Cost per Inmate per day 1.97$ 1.12$ 1.98$ 1.16$
Food Service Actual Budget Budget % Change
Summary 2014-2015 2015-2016 2016-2017 2016-2017
Personnel Services 13,560$ -$
Operations 477,568 499,298 498,568 -0.15%
Capital
Projects
Total 491,128$ 499,298$ 498,568$ -0.15%

277
MEDICAL SERVICES DEPARTMENT
MISSION STATEMENT:
The mission of the Medical Services Department is to provide the highest level of service, in partnership
with the community, to foster a safe atmosphere promoting the highest quality of life for all people.
Department at a Glance
The Medical Services Department’s budget increased 19% in FY 2016-2017 due to unfreezing all
positions in this department.
Key Goals and Objectives
Goal 1:
Improve mental health awareness throughout the facility and with all staff.
Objectives:
Have at least one nurse certified as an instructor in “Excited Delirium” training.
Have medical staff establish connection and communication with additional area mental health
agencies.
Goal 2:
Upgrade medical equipment to increase effectiveness.
Objectives:
Evaluate, inspect and review all equipment for worthiness.
Conduct a complete audit of equipment needs for future acquisitions.
Goal 3:
Improve inmate diet and help ensure healthy food choices.
Objectives:
Provide training to kitchen management on medical and dietary needs of the inmates.
Partner with the LEC Commissary staff to add healthy choices for inmates.
Performance Objectives
Increase mental health awareness.
Improve effectiveness of medical equipment.

278
Measurable Outcomes:
Identification of inmates with mental health issues that can be addressed by outside agencies.
Replacement or repair of items and equipment to be used in medical, with a complete,
documented assessment.
Actual Actual Budget Budget
Medical 2013/2014 2014/2015 2015/2016 2016/2017
Demand
Average Daily Inmate Population 400 400 378 328
Average Daily New Arrivals 130 130 170 90
Average Daily Nursing Assessments 130 130 170 165
Workload
Sick Calls per Week 390 400 372 354
Doctor Called 50 50 52 52
Medications Dispensed (annual) 119,000 119,000 125,000 118,000
Productivity
Staffing Level 3 1 4 3
In Custody Death 1 1 - -
Effectiveness
In Custody Death 1 1 - 0
Medication Dispensed 119,000 119,000 125,000 118,000
Medical Actual Budget Budget % Change
Summary 2014-2015 2015-2016 2016-2017 2016-2017
Personnel Services 230,473$ 296,365$ 443,027$ 49.49%
Operations 302,751 295,126 260,875 -11.61%
Capital
Projects
Total 533,223$ 591,491$ 703,902$ 19.00%
Medical 2014-2015 2015-2016 2016-2017 2016-2017
Full Time Equivalent Positions Budget Budget Budget Additions
Nurse 5 5 5
Total 5 5 5 0

279
SPECIAL REVENUE FUNDS
The Special Revenue Funds are used to account for proceeds of specific revenue
resources (other than major capital projects) that are legally restricted to expenditures
for specified purposes. These funds include Hotel/Motel Tax Fund, Mansfield Park
Facilities Development Corporation (MPFDC) Fund, Mansfield Economic Development
Corporation (MEDC) Fund and the Tree Mitigation Fund.
The City of Mansfield’s Convention and Visitors Bureau is funded from the Hotel/Motel
Tax Fund through an annual appropriation approved by City Council during adoption
of the budget.
En
terp
rise Fu
nd
s

280
HOTEL/MOTEL TAX FUND
MISSION STATEMENT:
The mission of the Hotel/Motel Tax Fund is to promote programs related to tourism, advertising,
promotions and programs advancing the arts and historical preservation within the City of Mansfield.
Department at a Glance
The Hotel/Motel Tax Fund is used to account for Hotel/Motel tax revenues. Section 351.101 of the Texas
Tax Code, Use of Tax Revenue, states that revenue from the municipal hotel occupancy tax may be used
to promote tourism and the convention/hotel industry. The Hotel/Motel Tax is used to fund various
organizations that promote tourism, art and historical preservation. In FY 2016-2017, $713,300 in
estimated revenue will be available for tourism, arts and historical programs as directed by City Council.
Key Goals and Objectives
Goal 1
Advertise and conduct solicitations and promotional programs to attract tourists and convention delegates
or registrants to the City of Mansfield or its vicinity.
Objectives:
Dedicate resources to advertising and conducting solicitations and promotional programs to
attract tourists and convention delegates or registrants to the municipality or local vicinity.
Encourage advertising in various magazines, websites and local organizations to promote the City
of Mansfield’s hotels.
Assist local organizations in the promotion of Mansfield as a tourist destination.
Goal 2
Encourage, promote, improve and provide application of the arts, including instrumental and vocal music,
dance, drama, folk art, creative writing, architecture, design and allied fields, painting, photography,
graphic and craft arts, motion pictures, radio, television, tape and sound recording and other art,
performance, execution and exhibition of these major art forms.
Objectives:
Provide through the City Council and Hotel/Motel subcommittee funding to promote the arts
during the City’s annual budget process.
Provide staff support as requested by the various organizations who request assistance.
Encourage events that promote the arts and assist in the marketing mediums to increase public
awareness for these events.
Goal 3
Support historical restoration and preservation projects or activities, advertising and conduct solicitations
and promotional programs to encourage tourists and convention delegates to visit historical sites and
museums.
Objectives:
Provide, through the City Council and Hotel/Motel Subcommittee, funding to promote historical
restoration and preservation projects and activities.
Provide staff support as requested by the various organizations who request assistance.

281
Encourage events that promote and assist in the marketing mediums to increase public awareness
of historical preservation and promotional program
Performance Objectives
Allocate Hotel/Motel occupancy revenue to City organizations that generate hotel/motel stays
within the City and comply with state and local requirements.
Promote the City of Mansfield as a tourism destination.
Measurable Outcomes
Provide shuttle services from the seven hotels/motels to the Dallas Cowboy stadium and other
events to provide additional services therefore promoting local hotels/motels.
Provide funding to events that promote local tourism, historical preservation and the arts.
Promote the City of Mansfield as a tourism destination.
Actual Actual Budget Budget
Hotel/Motel Tax 2013/2014 2014/2015 2015/2016 2016/2017
Demand
Funding Organizations 13 9 13
Workload
Hotels & Motels subject to Tax 7 7 7
Productivity
Occupancy Tax Revenue 651,225$ 717,284$ 641,425$ 713,300$
Hotel & Motel Beds (Estimated) 504 504 504 504
Effectiveness
Discover Historic Mansfield 47,084$ 2,025$
Rockin 4th 34,500$ 15,596$
Historical Society 28,649$ 26,364$ 30,000$ 34,680$
Pickled Mansfield Society 30,320$ 26,000$ 30,000$ 25,000$
Mainstage Theatre 8,000$ 5,000$ 7,000$
Farr Best Theatre 13,000$ 13,000$
Mansfield Theatre 5,000$
Kiwanis Classic 2,500$ 2,500$
Mansfield Rotary-Boys & Girls Basketball 25,000$ 28,500$ 33,000$ 37,000$
Wind Symphony
Painted Pianos 1,500$ 1,000$
Shop, Stroll & Dine 3,500$ 5,000$
Mansfield Juneteenth Celebration 2,000$
Futures of Mansfield Tennis 18,000$ 19,000$ 25,000$
Arts Commission 25,000$
Historic Mansfield Business Association
Sunrise Rotary Volleyball 23,000$ 19,681$ 21,000$ 15,000$
Electronic Sign 15,000$
Explorer Post 11,000$
Mansfield 125 12,500$
The LOT 85,000$
City of Mansfield Tourism 210,092$ 221,488$ 323,000$ 358,000$
Reserve 217,080$ 174,425$ 94,620$

282
MANSFIELD CONVENTION & VISITORS BUREAU
MISSION STATEMENT:
The mission of the Mansfield Convention & Visitors Bureau (CVB) is to enhance the local tourism
industry in Mansfield through marketing, promoting and developing opportunities for business and leisure
travel, while coordinating with local partners, businesses and entertainment venues to enhance the
visitor’s experience.
Department at a Glance
The CVB is funded by appropriations from the City of Mansfield Hotel/Motel Tax Fund. The CVB
includes one Tourism Manager and one Tourism Coordinator.
Key Goals and Objectives
Goal 1
Advertise and market to outside sports groups that will bring “heads in beds” to Mansfield Hotels.
Objectives:
Tourism Manager to attend NASC Connect sports trade show to continue to enhance Mansfield
as a SMERF destination site.
Tourism Manager is working with Dallas Baptist on future NCAA bid packages for 2019/2020.
Tourism Manager will be working with Matt Wilson from the Arlington CVB to work together
on various packages throughout the year.
Goal 2
Coordinate with local hotels, restaurants, businesses and entertainment venues to create “Tourism
Package Deals” for business visitors.
Objectives:
Work with Texas Historical Commission to solicit larger Historical events to the region.
Tourism Coordinator to work with DFWATC marketing committee to provide Mansfield travel
deals and promotions with regional FAM tours, media blitz and press releases.
Tourism Manager working on CO-OP radio promotions and tourism packages to neighboring
states and the Texas market.
Goal 3
Create a state and national marketing campaign for local sports, entertainment and leisure opportunities in
Mansfield.
Objectives:
Tourism Manager is unveiling the VisitMansfieldTexas.com web page.
Tourism Coordinator will establish a social media presence and a digital marketing strategy.
Tourism Manager will work with TCCC hospitality department and special events programming
to utilize students to help with the tourism efforts and start an internship Co-Op program.
Performance Measures
Performance Measures for the CVB are the same as those listed on the previous page for Hotel/Motel
Tax.

283
Measurable Outcomes
Track how many BIDs/RFP requests we receive from each trade show in FY 2016/2017.
Track the web numbers from the social media summer campaign.
Track service items distribution through our partners program and HOT applicants.
Do You Know?
The CVB is directly involved with local entities, including but not limited to, Big League
Dreams, Hawaiian Falls, the Mansfield Independent School District, local civic groups, golf
courses and local hotels to promote events that bring tourism dollars to the City of Mansfield.
The Live Outdoor Theater (LOT) in Historic Downtown Mansfield
Hotel/Motel Actual Budget Budget % Change
Tax Fund 2014-2015 2015-2016 2016-2017 2016-2017
Expenditures 391,654$ 641,425$ 713,300$ 11.21%
Total 391,654$ 641,425$ 713,300$ 11.21%
Convention & Visitors Bureau 2014/2015 2015/2016 2016/2017 2016/2017
Full Time Equivalent Positions Budget Budget Budget Additions
Tourism Manager 1 1 1
Tourism Coordinator 1 1
Total 1 2 2 0

284
MANSFIELD PARK FACILITIES DEVELOPMENT CORPORATION FUND
MISSION STATEMENT:
The mission of the Mansfield Park Facilities Development Corporation is to provide quality parks,
recreation, open space and trails to enhance the quality of life for the citizens and visitors of Mansfield.
Department at a Glance
The Mansfield Park Facilities Development Corporation (MPFDC) is funded by a ½ cent sales tax
approved by the citizens. The tax became effective on July 1, 1992. The MPFDC works in conjunction
with the Community Services Division in the General Fund to provide maintenance and operations
services to the Parks System. The MPFDC Board is comprised of seven members. Funds available for
projects have increased due to additional revenues in lease payments from partnerships and projected
increases in sales tax revenue. The MPFDC budget increased 5.54% in FY 2016-2017 due to the addition
of three part-time positions and a merit adjustment.
Key Goals and Objectives
Goal 1
Continue to implement the Parks, Recreation, Open Space and Trails Master Plan.
Objectives:
Improve quality of life for residents and visitors of the City by continuing to build on the park
system by adding new open space, bike lanes, trails and additional park facilities.
Provide a variety of recreation facilities and programs to continue to meet the needs of citizens
and visitors of Mansfield as our population continues to grow.
Preserve and enhance Mansfield’s recreational, historical, cultural and natural resources through
the continued expansion of the park system.
Goal 2
Continue to implement the updated Strategic Business Plan as adopted annually by the MPFDC Board.
Objectives:
Continue to make improvements to the MPFDC facilities, acquire new park land, and develop
new park and recreation facilities.
Determine funding availability and priorities for facility improvements, land purchases and
development of future projects and programs.
Identify future funding opportunities including grants, park land dedication opportunities,
donations and partnerships.
Goal 3
Maintain and improve existing facilities and programs to provide quality service and ensure the health
and safety of citizens.
Objectives:
Maintain and improve high quality maintenance standards for all parks, facilities, trails, open
spaces and bike lanes.
Continue to allocate funding for improvements to existing parks and recreation facilities,
including the operations and maintenance for each.

285
Increase recreational programs offered, enhance customer service, and continue to improve the
marketing program.
Performance Objectives
Continue to improve the level of service provided to citizens and visitors of Mansfield as we
acquire additional properties and acreage and build new facilities.
Maintain our Parks System in such a way that enhances our patrons’ quality of life.
Actual Actual Budget Budget
MPFDC 2013-2014 2014-2015 2015-2016 2016-2017
Demand
Sports Association Participants Youth 7,639 7,183 7,500 7,500
Sports Association Participants Adults 454 381 450 450
Annual Visits to the MAC 75,000 187,469 190,000 190,000
Average Daily MAC Visitors (356 days) 210 525 530 530
Workload
Acres of Park Land 830 830 858 883
Parks Maintained 14 14 14 16
Mileage of Trails 5 9
Total # of Dedicated Bike Routes in City 21 21
# of Shared Road Signs (35mph and over) 84 84
# of Bike Route Signs 38 38
Total Bike Route Mileage TBD
Weekly Park Open Hours (March - October) 126 126 244 276
Weekly Park Open Hours (November - February) 239 273
MPFDC Improvement Projects 12 12 21 21
Sports Associations 4 4 4 4
MPFDC Meetings 12 12 12 12
Total Annual Public Athletic Field Rentals 350 233 300 300
Total Annual Pavilion Rentals 375 358 375 375
Athletic Fields Maintained 30 30 34 34
Playgrounds Maintained 10 10 14 14
Yearly Playground Inspections 120 120 120 168
Ponds/Lakes 13
Pavilions Maintained 15 15 15 23
Restrooms 24 24
Picnic Acreas 14 81
Picnic Tables 121 121
Amphitheatres 2 3
Sand Volleyball Courts 4 4
Tennis Courts 3 5
Shade Structures 47 52
Gazebos 1
Horseshoe Pits 12 12
Exercise Stations 6
Splash Parks 1
Skate Plazas 1
Full Basketball Courts 5 5
Half Basketball Courts 2 2

286
Measurable Outcomes:
An overall 95% “good” or better satisfaction rating from citizens and visitors.
Successful completion of Chandler Park and Linear Trail improvements.
Grand opening of Fieldhouse U.S.A. in FY 2016-2017; Dallas Stars Center in FY 2017-2018.
Actual Actual Budget Budget
MPFDC 2013-2014 2014-2015 2015-2016 2016-2017
Basketball Goals 16 16
Benches 223 210
Bleachers 66 66
Grills 34 43
Trash Cans 328 321
Water Fountains 11 11
Productivity
Programs Offered (Athletic, Rec and Events) 859 706 750 750
Percent of Programs Completed 65% 65% 65% 65%
MAC Members 4,533 3,967 4,200 4,200
Day Passes Issued 1,296 917 1,100 1,100
MAC Annual Rentals 821 596 650 650
Volunteer Hours Recorded 300 200 250 250
Effectiveness
MAC Rental Approval Ratings 95% 95% 95% 95%
Program Approval Ratings 95% 95% 95% 95%
Actual Actual Budget Budget
Nature Education 2013-2014 2014-2015 2015-2016 2016-2017
Demand
Population 59,831 59,831 59,831 59,831
Workload
Number of Programs Offered 115 141 125 140
Number of Field Trip Days 22 31 22 25
Total Number of Participants of Public Programs and Field Trips8,102 7,892 8,000 8,000
Number of Outreach Events 23 43 23 30
Productivity
Revenue Generated from Programs 1,793$ 1,149$ 1,184$ 1,494$
Revenue Generated from Field Trips 3,140$ 5,699$ 4,060$ 6,240$
Effectiveness
Program/Field Trip Approval Rating 95% 95% 95% 95%
Division Actual Budget Budget % Change
Summary 2014-2015 2015-2016 2016-2017 2016-2017
Personnel Services 1,594,352$ 2,188,974$ 2,354,855$ 7.58%
Operations 1,130,218 1,106,554 1,200,052 8.45%
Capital 6,258 - 148,496
Projects 1,648,079 1,482,367 876,559 -40.87%
Total 4,378,908$ 4,777,895$ 4,579,962$ -4.14%

287
Actual Budget Budget % Change
Departments 2014-2015 2015-2016 2016-2017 2016-2017
Administration 993,816$ 1,196,241$ 1,389,913$ 16.19%
Sports Complex 369,566 360,897 383,418 6.24%
Rose Park/Town Park 351,536 373,762 399,909 7.00%
Mansfield Activity Center 599,066 763,057 761,810 -0.16%
Oliver Nature Park 410,587 601,570 619,858 3.04%
Capital 6,258 148,496
Projects 1,648,079 1,482,367 876,559 -40.87%
Total 4,378,908$ 4,777,895$ 4,579,962$ -4.14%
MPFDC 2014/2015 2015/2016 2016/2017 2016/2017
Full Time Equivalent Positions Budget Budget Budget Additions
Community Services Director 1 1 1
Assistant Parks & Recreation Director 0 1 1
Senior Park Planner 1 1 1
Assistant Park Planner 1 1 1
Park Superintendent 0.5 0.5 0.5
Secretary 0.8 0.8 0.8
Marketing & Communications Manager 1 1 1
Crew Supervisor 1.8 1.8 1.8
Crew Leader 2.4 2.4 2.4
Tradesman 5 5 6 1
Nature Education Specialist 1 1 1
Equipment Mechanic 1 1 1
Recreation Superintendent 1 1 1
Custodian 1 1 1
Athletic Coordinator 1 1 1
Activity Center Supervisor 1 1 1
Recreation Coordinator 1 1 1
Part-Time Staff 5.5 5.5 6 0.5
Total 27 28 29.5 1.5

288
Do You Know?
The Mansfield Parks & Recreation staff maintains over 858 acres of park land,
34 athletic fields and oversees 5 Public/Private Partnerships.
Mansfield Parks Board Members

289
MANSFIELD ECONOMIC DEVELOPMENT CORPORATION FUND
MISSION STATEMENT:
The mission of the Mansfield Economic Development Corporation is to attract desirable industries and
commercial developments to the City of Mansfield while retaining and assisting in the expansion of
existing businesses.
Department at a Glance
The Mansfield Economic Development Corporation (MEDC) is funded by a ½ cent sales tax approved by
the citizens. The tax was effective on July 1, 1997. The MEDC Board consists of seven members
appointed by City Council. The MEDC budget decreased 56.82% in FY 2016-2017 due to completion of
several large projects and major projects budgeted in the MEDC Construction Fund. Projects will be
funded subject to approval by the MEDC Board and City Council.
Key Goals and Objectives
Goal 1
Initiate and participate in critical infrastructure improvements.
Objectives:
Construct Antler Drive extension.
Construct Mouser Way extension.
Evaluate other infrastructure improvement opportunities.
Goal 2
Work with landowners/developers to create new industrial space/buildings.
Objectives:
Work with Peyco Southwest and United Cooperative Services to attract large industrial users to
their respective parcels of land.
Work with developers regarding possible construction of spec industrial space.
Continue to market the MEDC property and two new industrial spec buildings on Heritage
Parkway and to potential end users/tenants.
Goal 3
Initiate new retail/commercial construction projects.
Objectives:
Work with Geyer Morris or the next developer to develop the Shops at Broad Street site.
Leverage activity in historic downtown Mansfield to attract additional investment, including new
restaurants.
Leverage activity in the medial sector to attract additional medical office investment.
Performance Objectives
Continue critical infrastructure projects.
Work with landowners/developers to create new industrial properties.
Initiate new retail/commercial projects.

290
Measurable Outcomes:
Completion of Antler Drive and Mouser Way.
Groundbreaking on the Shops at Broad site.
Construction of at least two new restaurants in historic downtown Mansfield.
*Capital Projects may be found in the Capital Project Funds section.
Actual Actual Budget Budget
MEDC 2013/2014 2014/2015 2015/2016 2016/2017
Demand
Value of MEDC projects 36,002,138$ 74,981,506$ 77,230,951$ 79,547,879$
Businesses Retained 97% 98% 97% 98%
Contractual MEDC Commitments 1,575,000$ 2,861,711$ 1,800,000$ 4,089,535$
Workload
Value of MEDC projects 36,002,138$ 74,981,506$ 77,230,951$ 79,547,879$
Businesses Retained 97% 98% 97% 98%
Contractual MEDC Commitments 1,575,000$ 2,861,711$ 1,800,000$ 4,089,535$
New Capital Investment 36,002,138$ 74,981,506$ 77,230,951$ 79,547,879$
Business Expansions 3 4 4 4
Jobs created or retained by activity 284 412 325 400
Productivity
Contracted Projects 5 19 7 12
New Capital Investment 36,002,138$ 74,981,506$ 77,230,951$ 79,547,879$
Average Monthly visits to Industry 16 16 16 16
Jobs created or retained by activity 284 412 325 400
Effectiveness
Value of MEDC projects 36,002,138$ 74,981,506$ 77,230,951$ 79,547,879$
Businesses Retained 97% 98% 98% 98%
Contractual MEDC Commitments 1,575,000$ 2,861,711$ 1,800,000$ 4,089,535$
New Commercial Business 5 5 6 7
Division Actual Budget Budget % Change
Summary 2014-2015 2015-2016 2016-2017 2016-2017
Personnel Services 518,997$ 580,010$ 598,933$ 3.26%
Operations 279,942 353,459 387,888 9.74%
Debt 480,762 1,202,454 1,202,784 0.03%
Projects* 10,611,452 7,826,820 19,944,694 154.82%
Total 11,891,153$ 9,962,743$ 22,134,299$ 122.17%
Actual Budget Budget % Change
Departments 2014-2015 2015-2016 2016-2017 2016-2017
Administration 722,787$ 784,969$ 832,821$ 6.10%
Promotions 61,737 116,500 112,000 -3.86%
Business Retention 10,531 21,000 21,000 0.00%
Work Force Development 3,884 11,000 21,000 90.91%
Debt 480,762 1,202,454 1,202,784 0.03%
Projects* 10,611,452 7,826,820 19,944,694 154.82%
Total 11,891,153$ 9,962,743$ 22,134,299$ 122.17%

291
Do You Know?
$38,194,668 in Taxable Value is Estimated to be Generated in New
Commercial and Industrial Projects in 2016.
MEDC Board Members
Industrial Job Growth:
MEDC Projects from the last 8 years created
MEDC 2014/2015 2015/2016 2016/2017 2016/2017
Full Time Equivalent Positions Budget Budget Budget Additions
Director 1 1 1
Business Development Manager 1 1 1
Business Retention Manager 1 1 1
Marketing Assistant 1 1 1
Administrative Assistant 1 1 1
Total 5 5 5 0
2,387 Jobs

292
TREE MITIGATION FUND
MISSION STATEMENT:
The Tree Mitigation fund is funded by fees levied by the City to preserve, protect and replace trees that
have been damaged by natural causes, development or any other event that causes damage to existing
trees, development of new areas of the City or maintenance of existing medians or public grounds.
Department at a Glance
The Tree Mitigation Department budget is $0 in FY 2016-2017 due to expenditure of all available funds
in prior years. The department includes one landscape administrator and one irrigation technician.
Additional operational costs for contract services have been moved to the General Fund due to lack of
tree mitigation funds. The funding for staff costs in this fund will be determined during the FY 2016-2017
budget year.
Tree Mitigation Actual Budget Budget % Change
Summary 2014-2015 2015-2016 2016-2017 2016-2017
Personnel Services 196,129$ 122,479$ -$ -100.00%
Operations 189,524
Capital
Projects
Total 385,653$ 122,479$ -$ -100.00%
Tree Mitigation 2014/2015 2015/2016 2016/2017 2016/2017
Full Time Equivalent Positions Budget Budget Budget Additions
Landscape Administrator 1 0 0
Landscape Technician 1 1 1
Irrigation Technician 1 1 1
Total 3 2 2 0

293
CAPITAL PROJECTS FUNDS
Capital Projects Funds are used to account for acquisitions of capital facilities financed
from general obligation proceeds, revenue bonds, certificates of obligation proceeds, or
transfers from other funds. The Capital Projects Funds include the Street Construction Fund,
Utility Construction Fund, Building Construction Fund, Parks Construction Fund,
Equipment Replacement Fund and the Economic Development Construction Fund.

294
CAPITAL PROJECTS FUNDS
Street Construction
Fund
Provides financing and
accounting of new street
construction projects
Utility Construction
Fund
Provides construction of
water distribution and
sanitary sewer systems
Building Construction
Fund
Provides for the
construction, financing
and accountability of
City facilities
Equipment
Replacement Fund
Provides for the purchase
and replacement of
equipment
Parks Construction
Fund
Provides financing and
accounting of new
parks construction
projects
Economic
Development
Construction Fund
Provides financing and
accounting of projects
funded by Economic
Development

295
The Phases of Capital Improvements
The Planning Phase
The Planning Phase typically identifies the projected infrastructure need, identifies funding options, incorporates funding into the financial plan and develops a multi-year list of projects to be completed based on projected
growth. Capital projects may require voter approval.
The Design Phase
Once the planning process is complete, design begins on the approved Capital Improvement projects. The Design Phase may and often does occur
over multiple years.
The Construction Phase
Once the planning and design phases are complete, the Construction Phase begins. The Construction Phase may include land acqusition, utility relocation and the bid process for each project. On some projects,
construction may take multiple years. The Citizens of Manfield are notified of any traffic impact or service disruption.
Completion Phase
The Completion Phase includes final inspection of the project and opening of streets, utilities, facilities or parks.

296
CAPITAL PROJECTS FUNDS
On October 28, 2013, City Council adopted the Modified Long Range Financial and Capital Expenditure
Plan. Included in the plan were projected revenues and expenditures for operational costs, staffing costs
and major capital improvements identified by staff and supported by Management and City Council. In
FY 2016-2017, major projects are budgeted in various funds including the Street Construction, Utility
Construction, Building Construction, Parks Construction, Economic Development, Drainage Construction
and Equipment Replacement Funds. Funding for these projects comes from a variety of sources,
including but not limited to, General Obligation Bonds, Revenue Bonds, Certificates of Obligation,
Impact Fees, Contributions, Grants, Fund Reserves and Intergovernmental Transfers. Total estimated
capital expenditures for these projects for FY 2016-2017 is $86,538,239.
Funding Sources
Streets
27%
Parks
24% Utilities
9%
Drainage
4%
MEDC
17%
Building
18%
Equipment
1%
2016-2017 Capital Projects
2016-2017 Utility Street Building Equipment Parks Drainage MEDC
Funding Sources Fund Fund Fund Fund Fund Fund Fund Total
Bonds -$ 18,489,014$ 15,100,000$ 1,250,377$ 9,855,000 3,220,000 15,000,000 62,914,391$
Impact Fees 1,100,000 500,000 1,600,000
Prior Year Funding 6,926,574 4,406,718 10,690,556 22,023,848
Interest
Contributions
Transfers
Expense Recovery
Grants
Sales Tax
Total Sources 8,026,574$ 23,395,732$ 15,100,000$ 1,250,377$ 20,545,556$ 3,220,000$ 15,000,000$ 86,538,239$
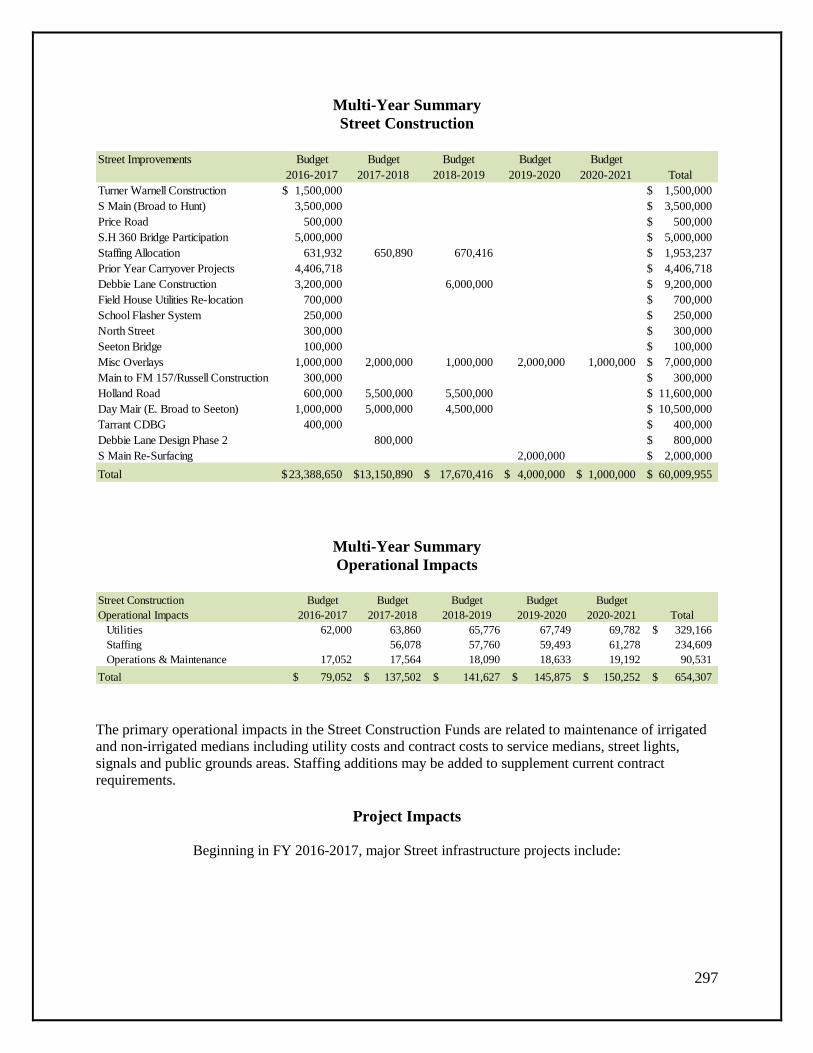
297
Multi-Year Summary
Street Construction
Multi-Year Summary
Operational Impacts
The primary operational impacts in the Street Construction Funds are related to maintenance of irrigated
and non-irrigated medians including utility costs and contract costs to service medians, street lights,
signals and public grounds areas. Staffing additions may be added to supplement current contract
requirements.
Project Impacts
Beginning in FY 2016-2017, major Street infrastructure projects include:
Street Improvements Budget Budget Budget Budget Budget
2016-2017 2017-2018 2018-2019 2019-2020 2020-2021 Total
Turner Warnell Construction 1,500,000$ 1,500,000$
S Main (Broad to Hunt) 3,500,000 3,500,000$
Price Road 500,000 500,000$
S.H 360 Bridge Participation 5,000,000 5,000,000$
Staffing Allocation 631,932 650,890 670,416 1,953,237$
Prior Year Carryover Projects 4,406,718 4,406,718$
Debbie Lane Construction 3,200,000 6,000,000 9,200,000$
Field House Utilities Re-location 700,000 700,000$
School Flasher System 250,000 250,000$
North Street 300,000 300,000$
Seeton Bridge 100,000 100,000$
Misc Overlays 1,000,000 2,000,000 1,000,000 2,000,000 1,000,000 7,000,000$
Main to FM 157/Russell Construction 300,000 300,000$
Holland Road 600,000 5,500,000 5,500,000 11,600,000$
Day Mair (E. Broad to Seeton) 1,000,000 5,000,000 4,500,000 10,500,000$
Tarrant CDBG 400,000 400,000$
Debbie Lane Design Phase 2 800,000 800,000$
S Main Re-Surfacing 2,000,000 2,000,000$
Total 23,388,650$ 13,150,890$ 17,670,416$ 4,000,000$ 1,000,000$ 60,009,955$
Street Construction Budget Budget Budget Budget Budget
Operational Impacts 2016-2017 2017-2018 2018-2019 2019-2020 2020-2021 Total
Utilities 62,000 63,860 65,776 67,749 69,782 329,166$
Staffing 56,078 57,760 59,493 61,278 234,609
Operations & Maintenance 17,052 17,564 18,090 18,633 19,192 90,531
Total 79,052$ 137,502$ 141,627$ 145,875$ 150,252$ 654,307$

298
State Highway 360 Participation
This is the 2nd
half of the City’s total $10M
participation in TxDOT’s overall design-build phase
to construct a 9.7 mile extension of State Highway
360 north/south main lanes from Green Oaks Blvd. in
southern Tarrant County to Highway 287 in
northwestern Ellis County and northeastern Johnson
County. The project includes the improvement of
Mansfield’s four major intersections with the SH-360
state tollway project, which will provide for ultimate
capacity at these intersections consistent with the
City’s Master Thoroughfare Plan. The North Texas
Toll Authority will operate SH-360 as a toll road, and
revenues collected will be used to repay TxDOT for
construction.
Debbie Lane Median/Reconstruction
Debbie Lane (a major east/west arterial) will be
expanded, adding a center raised median. This
section from Business 287/Main Street to F.M.157
also requires upgraded pavement to withstand
additional truck loads, as this will be the preferred
truck route.
S. Main from Broad Street to Hunt Street
Funding for S. Main Street will provide for an urban
complete street in Historic Downtown and
contributes overall to the Downtown redevelopment
efforts. It will offer more public parking with
streetscape aesthetics.

299
Multi-Year Summary
Utility Construction
Project Impacts
Beginning in FY 2016-2017, major Utility infrastructure projects include:
Sodium Hypochlorite Generation
Utility Construction Budget Budget Budget Budget Budget
2016-2017 2017-2018 2018-2019 2019-2020 2020-2021 Total
Prior Year Projects 934,759$ 934,759$
Lift Station Rehab 200,000 200,000
Staffing allocation 583,847 601,362 619,403 637,985 657,125 3,099,723
Lab & Debbie Tower 300,000 300,000
Sodium Hypochlorite Generation 1,500,000 1,500,000
Misc Utilities Roadway Projects 2,007,968 750,000 600,000 600,000 600,000 4,557,968
16" Water Line Crossing Main St 1,000,000 1,000,000
20", 16" & 12" Water Line Main & US 287 1,500,000 1,500,000
Holland Phase 2 Improvements 2,000,000 2,000,000
30" Water Line Matlock/Broad - 1,300,000 1,300,000
Odor Control Holland Lift Station 500,000 500,000
12" Water Line N Main 1,100,000 1,100,000
Clearwell #4 Water Treatment Plant 6,000,000 6,000,000
Final Expansion-Bud Erwin Treaatment Plant 1,000,000 1,000,000
Reaccess Walnut Creek Interceptior 300,000 300,000
24" Water Line Newt Patterson 1,200,000 1,200,000
Total 8,026,574$ 4,651,362$ 8,819,403$ 2,237,985$ 2,757,125$ 26,492,450$
Operational Budget Budget Budget Budget Budget
Impacts 2016-2017 2017-2018 2018-2019 2019-2020 2020-2021 Total
Utilities 0 19,854 100,450 103,463 106,567 330,334
Staffing 61,941 63,799 65,713 67,685 69,715 328,853
Operations & Maintenance 32,000 33,600 84,608 87,146 89,761 327,115
Total 93,941$ 117,253$ 250,771$ 258,294$ 266,043$ 986,302$
Sodium hypochlorite is a low-concentration
of bleach, used as the primary disinfectant
during water treatment. The sodium
hypochlorite system upgrades are much
needed at the Bud Ervin Water Treatment
Plant. The project includes the addition of a
generator capable of processing 1500
pounds per day, as well as increased storage
for future expansion. In addition, the
project involves replacing aging, eroding
pipes with piping made from a material that
is much better suited for the bleach.

300
Misc. Roadway Projects
Multi-Year Summary
Building Construction
Project Impacts
Beginning in FY 2016-2017, major Building infrastructure projects include:
Budget Budget Budget Budget Budget
Facility Improvements 2016-2017 2017-2018 2018-2019 2019-2020 2020-2021 Total
Dallas Stars Center 15,100,000$ 15,100,000$
Fire Station #5 5,100,000 5,100,000
Total 15,100,000$ -$ -$ -$ 5,100,000$ 20,200,000$
Operational Budget Budget Budget Budget Budget
Impacts 2016-2017 2017-2018 2018-2019 2019-2020 2020-2021 Total
Fire-Staffing 261,878$ 269,161$ 831,704$ 856,656$ 2,219,398$
Utilities 38,460 38,460
Supplies 23,524 24,230 74,870 77,116 199,741
Contract Services 8,500 8,755 17,255
Total -$ 285,402$ 293,391$ 915,075$ 980,987$ 2,474,854$
As new residential and commercial projects
are being developed, the Utilities Division
will establish the infrastructure necessary
to service these areas. The majority of
these projects will be in the southern
portion of the City along the State Hwy 360
and U.S. Hwy 287 corridors.

301
Dallas Stars Center
The Dallas Stars Center is a public/private
partnership. Located within the future Shops at
Broad development, the approximately 80,000
square foot indoor recreational facility will have
two ice surfaces for ice hockey, ice dancing and
open skating. It will include programming space
for parties and meetings along with viewing
areas, locker rooms and retail space. This facility
will host local league play, camps, clinics, ice
dancing competitions and other event programs.
The Dallas Stars Center is estimated to have
approximately 327,000 visits annually. It has an
anticipated opening date of September 1, 2017
and will cost $15,100,000.
Fire Station No. 5
Due to the rapid development of Mansfield
and two new, large residential areas now
being constructed in the southern portion of
the City, there is a need for a 5th fire station.
A current drive time analysis for the Fire
Division shows that adding another station
will not only provide service for the residents
of these new developments, but also improve
response times in other outlying areas of the
City. Fire Station No. 5 should be staffed
and fully operational in FY 2020-2021.

302
Multi-Year Summary
Park Construction
Project Impacts
Beginning in FY 2016-2017, major Park infrastructure projects include:
Chandler Park Improvements
The redesign/construction of Chandler Park
includes field, concession, lighting, parking,
tennis courts and other improvements.
Parks Construction Budget Budget Budget Budget Budget
2016-2017 2017-2018 2018-2019 2019-2020 2020-2021 Total
Land Acquisition 500,000 200,000$ 200,000 200,000$ 200,000 1,300,000$
Existing Park Improvements 265,000 250,000 250,000 250,000 250,000 1,265,000
Williams Property Development Phase 1 -
Bike Lanes/MP Trail Improvements 120,000 100,000 100,000 100,000 100,000 520,000
Dog Park 750,000 650,000 1,400,000
Elmer W Oliver Nature Park
Pond Branch 3,000,000 3,000,000
Chandler Park Design& Construction 1,300,000 750,000 2,050,000
McClendon West Improvements 280,000 280,000
Linear Parks Segments
Sports Complex Improvements 350,000 350,000
Priority 1 Segment Improvements 2,190,000 2,190,000
McKnight East Improvements -
McKnight West Improvements 300,000 250,000 550,000
Phillip Thompson Improvements 50,000 300,000 350,000
Parks Administration Office 500,000
Walnut Ridge Baptist Church 750,000 650,000 1,400,000
Walnut Creek Linear Park Phase#2 1,000,000 1,000,000
Field House (Remaining Construction) 10,690,556 10,690,556
Total 20,545,556$ 4,000,000$ 1,200,000$ 550,000$ 550,000$ 26,345,556$
Budget Budget Budget Budget Budget
Operational Impact 2016-2017 2017-2018 2018-2019 2019-2020 2020-2021 Total
Utilities 24,980$ 24,830 10,000$ 10,300$ 70,110$
Staffing 177,000 29,750 29,750 30,643 267,143
Operations & Maintenance 56,800 46,125 15,000 15,450 133,375
Total 258,780$ 100,705$ 54,750$ 56,393$ 470,628$

303
Fieldhouse U.S.A.
Pond Branch Improvements
Linear Trail/Priority I Segment Improvements
Fieldhouse U.S.A. is a public/private
partnership. The 90,000 square foot indoor
facility will include 8 basketball courts that can
be converted into 12 volleyball courts, a bleacher
viewing area, concessions and retail space, as
well as rooms for birthday parties, meetings, etc.
The facility can also host special events such as
job fairs or provide exhibit hall booth space. The
Fieldhouse will host local league play, regional
and national basketball/volleyball tournaments,
as well as host camps, clinics, martial arts,
wrestling and cheerleading events. The
Fieldhouse is anticipated to have approximately
one million visits annually. It is currently under
construction with an estimated opening date
of December 1, 2016.
This project is a ¾ mile trail through Historic
Downtown Mansfield. The purpose is to
improve Downtown walking trails to provide
easy access to this developing area.
The 2009 Parks, Recreation, Trails and Open
Spaces Master Plan included a spine trail
phasing and prioritization plan. The first
priority on this plan is trail segment “I” which
is 2.75 miles from Oliver Nature Park,
through the Philip Thompson Soccer
Complex, and continuing to Lloyd Park on
Joe Pool Lake. This project is a continuation
of the existing Walnut Creek Linear Trail and
will ultimately link all of the City’s parks.

304
Multi-Year Summary
Equipment Replacement Fund
The Equipment Replacement Fund is funded through transfers from the General Fund. Typically,
$500,000-$600,000 in new and replacement equipment is funded on an annual basis from a combination
of excess revenues or expenditure savings. In FY 2016-2017, eight public safety vehicles, one ambulance,
one Opticom system and related equipment, a computerized dispatch map, four cardiac monitors, and
cameras and New-Line Touch Displays for the Information Technology Department will be funded with a
bond issuance of approximately $1,250,377. Vehicles and equipment in public safety are given top
priority as funding becomes available. The City will auction obsolete equipment or vehicles that are fully
depreciated, or as the maintenance costs become prohibitive.
The primary operational impacts in the Equipment Replacement Fund are related to the reduction in
repair costs and proceeds from the sale of vehicles and equipment that is being replaced. In FY 2016-
2017, technology enhancements, public safety vehicles, equipment and facility improvements will be
purchased through the issuance of certificates of obligation to fund the replacement program.
Project Impacts
Public Safety vehicles and equipment – annual replacement of vehicles and equipment basis
reduces down time and repair costs and provides Police and Fire the best available resources to
respond to emergencies.
Repair Savings - reduces down time and enables staff to provide more proactive police patrols;
reduces major fire apparatus down time.
Auction Proceeds - offsets borrowing costs by redirecting proceeds for the purchase of new
equipment.
Project Description Budget Budget Budget Budget Budget
2016-2017 2017-2018 2018-2019 2019-2020 2020-2021 Total
Sources:
Prior Year Proceeds
Bond Proceeds 1,250,377 1,250,377
Sale of City Property
Transfers 600,000 600,000 600,000 600,000 2,400,000
Misc Revenue
Interest
Uses:
Capital Purchases (1,250,377) (600,000) (600,000) (600,000) (600,000) (3,650,377)
Estimated Repair Savings -
Grant Proceeds
Total 0 0 0 0 0 0

305
Mansfield Economic Development Fund
The Economic Development Fund is used to provide economic incentives for businesses to relocate to the
City of Mansfield. It also provides direct funding for infrastructure improvements, reimbursements for
construction costs and business retention incentives. In FY 2016-2017, the primary construction projects
include the expansion of Broad Street and the extension of Regency Parkway south to Heritage Parkway.
As commercial and industrial companies relocate to Mansfield, the fund is used to provide
reimbursements for utility, roadway and facility improvements provided certain benchmarks are met such
as property valuations, employees and future development plans.
E. Broad /Regency Parkway
The Broad Street project will expand one of
Mansfield’s main east/west routes from 4 lanes to 6
lanes, starting at Highway 287 and extending to
Cannon Drive. It includes adding traffic signals at
the intersection of Broad and Regency Parkway and
extending Regency Parkway to its planned terminus
at Heritage Parkway. The result will be reduced
congestion on Broad Street. It will allow for growth
of traffic volume, as this area is not only a centralized
medical district, but also the future site of major
sporting and retail establishments (Shops at Broad).
The extension of Regency Parkway provides
alternate north/south connectivity to the industrial
and new residential areas and supports Mansfield’s
Economic Development. The MEDC will fund
$6,000,000 of this project in FY 2016-2017.
MEDC Fund Budget Budget Budget Budget Budget
2016-2017 2017-2018 2018-2019 2019-2020 2020-2021 Total
Shops at Broad Drainage 82,120 238,450$ 238,450$ 238,450$ 238,450$ 1,035,920$
Klein Infrastructure 634,000 634,000
Klein Incentive 500,000 500,000 500,000 500,000 500,000 2,500,000
Klein Impact Fees 172,626 172,626 172,626 517,878
Southern Champion Tray 260,000 130,000 390,000
The Backyard 143,000 143,000
John T Evans 215,000 215,000
Downtown Parking Lot-Lease 17,205 17,205 17,205 17,205 17,205 86,025
Hightower Salons 50,000 50,000
AMC Warehouse 400,000 650,000 1,050,000
New 4A Projects 490,122 490,122
Antler Drive 1,500,000 1,500,000
Nationwide 150,000 150,000
Regency Pkwy 6,000,000 102,000 102,000 102,000 102,000 6,408,000
Other Projects 9,000,000 9,000,000
Sprouts/Mansfield Market Place 43,247 77,700 77,700 198,647
Mouser Way 325,000 325,000
American National Bank 60,000 60,000
Cam Tech/PCX 50,000 50,000
BWAY Expansion 220,000 220,000
FTI 300,000 300,000
NT Window 422,500 422,500 845,000
Broad Street 306,000 306,000 306,000 306,000 1,224,000
Geyer Morris 612,000 612,000 612,000 612,000 2,448,000
Total 19,869,694$ 3,798,481$ 2,448,481$ 1,948,281$ 1,775,655$ 29,840,592$


307
Historical Analysis
Tax Rate
New Construction
Fiscal General Tax Rate General Obligation Tax Rate Total
Year Operating Percentage I & S Fund Percentage Tax Rate
2007-2008 0.4103 0.5947 0.2796 0.4053 0.69
2008-2009 0.4859 0.6843 0.2241 0.3157 0.71
2009-2010 0.4437 0.6249 0.2663 0.3751 0.71
2010-2011 0.4569 0.6435 0.2531 0.3565 0.71
2011-2012 0.4543 0.6399 0.2557 0.3601 0.71
2012-2013 0.4541 0.6254 0.2589 0.3646 0.71
2013-2014 0.4625 0.6514 0.2475 0.3486 0.71
2014-2015 0.4710 0.6633 0.2390 0.3367 0.71
2015-2016 0.4683 0.6596 0.2417 0.3404 0.71
2016-2017 0.4707 0.6630 0.2392 0.3369 0.71
Tax Fiscal Commercial Property Residential Property Total Taxable
Year Year Permits Value Permits Value Permits Value
2007 2007-2008 22 32,763,780$ 447 128,134,634$ 469 160,898,414$
2008 2008-2009 43 74,503,759 711 92,670,080 754 167,173,839
2009 2009-2010 58 98,228,409 444 61,865,101 502 160,093,510
2010 2010-2011 28 23,733,603 338 37,390,200 366 61,123,803
2011 2011-2012 24 41,826,069 366 48,674,699 390 90,500,768
2012 2012-2013 36 32,723,310 342 38,635,335 378 71,358,645
2013 2013-2014 75 48,859,504 335 42,901,609 410 91,761,113
2014 2014-2015 41 63,650,575 347 99,914,164 388 163,564,739
2015 2015-2016 6 38,438,945 253 71,080,696 259 109,519,641
2016 2016-2017 15 61,189,311 336 86,501,025 351 147,690,336
10 Year Total 348 515,917,265$ 3919 707,767,543$ 4267 1,223,684,808$
0
50
100
150
200
250
300
350
400
2013 2014 2015 2016 2017
Residential Commercial

308
TOP EMPLOYERS*
*Information provided by the Mansfield Economic Development Corporation
Number of
Company Product Line Employees Mouser Electronics Distribution of Electronics Parts 1,300
Methodist Mansfield Medical Center Full Service Hospital 1,207
SJ Louis Construction of TX. Utility Contractor 450
Wal-Mart Super Center Superstore 400
Klein Tools Manufacturer of Hand Tool Products 395 Kroger Grocery Stores(2) 320
Pier 1 Distibution Center Home Goods 300
Hoffman Cabinets Cabinet Manufacturer 260 Super Target Super center 250
BCB Transport Transportation Provider 214 Lifetime Fitness Fitness Center 200
Walnut Creek Country Club Country Club 190
Best Buy Electronics Store 180
Intermedix Medical Billing 180
Kindred Hospital Treatment Center 155
Sam's Club Warehouse Store 150
Ramtech Building Systems Manufacturer of Modular Office Buildings 150
Lowe's Home Improvement Store 146
Home Depot Home Improvement Store 145
Conveyors, Inc. Manufacturer Conveyor Equipment 130
On The Border Mexican Restaurant 125
B-Way Packaging Producer of Injection Molded Plastic Buckets 124
Gamma Engineering CNC Machining 119
Skyline Industries RV Manufacturer 103
Trinity Forge Drop Forger 90
Southern Champion Tray Manufacturer of Paperboard Folding Cartons 90
LyondellBasell/Equistar Chemicals Manufacturer of Plastic Polymers used in Auto Industry 85
Old Castle Precast Manufacturer of Concrete Utility Products 80 Parker Hanifan Manufacturer of Thermoplastic and Fluoropolymer Fluid 62
Tyco Manufacturer of Fire Fighting Suppression Products 60

309
ACRONYMS
ADA Americans with Disabilities Act
ACH Automated Clearing House
CAD Computer Aided Dispatch
CAFR Comprehensive Annual Financial Report
CID Criminal Investigation Division
CIP Capital Improvement Program
CDBG Community Development Block Grants
CRO Community Resource Officer
CVB Convention and Visitors Bureau
DA District Attorney
DRC Development Review Committee
DWI Driving While Intoxicated
EAP Employee Assistance Program
EEOC Equal Employment Opportunity Commission
EMS Emergency Medical Services
EMT Emergency Medical Technician
EOC Emergency Operations Center
FTE Full Time Equivalent Positions
GAAP Generally Accepted Accounting Principles
GASB Governmental Accounting Standards Board
GFOA Government Finance Officers Association
GIS Geographic Information System
GO General Obligation (debt)
HVAC Heating and Air Conditioning Units
K-9 Canine Unit
LAN Local Area Network
LEC Law Enforcement Center
LLEBG Local Law Enforcement Block Grants
MAC Mansfield Activity Center
MEDC Mansfield Economic Development Corporation
MISD Mansfield Independent School District
MPFDC Mansfield Park Facilities Development Corporation
OPEB Other Post-Employment Benefits
PID Public Improvement District
SEC Securities and Exchange Commission
TAD Tarrant County Appraisal District
TIF Tax Increment Funding
TIRZ
TCC Tax Increment Reinvestment Zone
Tarrant County College TMRS Texas Municipals Retirement System
WAN Wide Area Network

310
BUDGET GLOSSARY
The Annual Budget contains specialized terminology that is unique to public finance and budgeting. To
assist the reader of the Annual Budget document in understanding these terms, a budget glossary has been
included.
Accrual Accounting A basis of accounting in which debits and credits are recorded at
the time they are incurred as opposed to when cash is actually
received or spent. For example, in accrual accounting, revenue
which was earned between April 1 and June 30, but for which
payment was not received until July 10, is recorded as being
received on June 30 rather than on July 10. Appropriations An authorization made by the City Council which permits the
City to incur obligations and to make expenditures of resources. Appropriation Ordinance The official enactment by the City Council to establish legal
authority for City officials to obligate and expend resources. Arbitrage The reinvestment of the proceeds of tax-exempt securities in
materially higher yielding taxable securities.
Assessed Valuation A value that is established for real or personal property for use
as a basis for levying property taxes. (Note: property values are
established by the Tarrant Appraisal District.) Audit A comprehensive investigation of the manner in which the
government's resources were actually utilized. A financial audit
is a review of the accounting system and financial information to
determine how government funds were spent and whether
expenditures are in compliance with the legislative body's
appropriations. A performance audit consists of a review of
how well the government met its stated goals. Balanced Budget Current appropriations in all funds are limited to the sum of
available unencumbered cash balances and revenues estimated
to be received in the current budget period.
Balance Sheet A financial statement that discloses the assets, liabilities,
reserves and balances of a specific governmental fund as of a
specific date. Bond A written promise to pay a sum of money on a specific date at a
specified interest rate. The interest payments and the repayment
of the principal are detailed in a bond ordinance. The most
common types of bonds are general obligation and revenue
bonds. These are most frequently used for construction of large
capital projects, such as buildings, streets and bridges. Budget A financial plan for a specified period of time (fiscal year) that

311
matches all planned revenues and expenditures with various
municipal services.
Budget Basis A basis of budgeting general government type funds prepared on
a modified accrual basis. The obligations of the City are
budgeted as expenditures, but revenues are recognized only
when they are measurable and available.
Budget Amendment A legal procedure utilized by the City staff and City Council to
revise a budget appropriation. The City of Mansfield's Charter
requires City Council approval through the adoption of a
supplemental appropriation ordinance (which specifies both the
source of revenue and the appropriate expenditures account) for
any inter-fund adjustments. City staff has the prerogative to
adjust expenditures within a departmental budget. Budget Calendar The schedule of key dates or milestones which the City
departments follow in the preparation, adoption, and
administration of the budget.
Budget Document The instrument used by the budget-making authority to present a
comprehensive financial program to the City Council.
Budgeted Funds Funds that are planned for certain uses but have not been
formally or legally appropriated by the legislative body. The
budget document that is submitted for City Council approval is
composed of budgeted funds.
Budget Message The opening section of the budget which provides the City
Council and the public with a general summary of the most
important aspects of the budget, changes from the current and
previous fiscal years, and the views and recommendations of the
City Manager.
Budgetary Control The control of management of a governmental unit or enterprise
in accordance with an approved budget for the purpose of
keeping expenditures within the limitations of available
appropriations and available revenues.
Capital Relatively expensive improvements that are non-recurring, have
a multi-year useful life and that result in fixed assets. Capital
may include equipment, streets, utilities, land and buildings.

312
Capital Equipment Budget The portion of the annual operating budget that appropriates
funds for the purchase of capital equipment items. These
expenditures are often separated from regular operating items,
such as salaries, utilities and office supplies. The Capital
Equipment Budget includes funds for capital equipment
purchases, such as typewriters, vehicles, furniture, machinery,
building improvements, microcomputers and special tools,
which are usually distinguished from operating items according
to their value and projected useful life. The dollar varies
according to the policy established by each jurisdiction.
Capital Improvement
Program A plan for capital expenditures to provide long-lasting physical
improvements to be incurred over a fixed period of several
future years.
Capital Improvement
Program Budget A Capital Improvement Program (CIP) Budget is a separate
budget from the operating budget. Items in the CIP are usually
construction projects designed to improve the value of the
government assets. Examples of capital improvement projects
include new roads, sewer lines, buildings, recreational facilities
and large scale remodeling. The City Council receives a
separate document that details the CIP costs for the upcoming
fiscal year.
Capital Leases A contract by which the City purchases equipment for a
specified term for a specified rent.
Cash Accounting A basis of accounting in which transactions are recorded when
cash is either received or expended for goods and services.
Cash Management The management of cash necessary to pay for government
services while investing temporary cash excesses in order to
earn interest revenue. Cash management refers to the activities
of forecasting the inflows and outflows of cash, mobilizing cash
to improve its availability for investment, establishing and
maintaining banking relationships, and investing funds in order
to achieve the highest interest and return available for temporary
cash balances.
Comprehensive Annual
Financial Report (CAFR) The official financial report of the City that includes an audit
opinion as well as basic financial statements and supporting
schedules necessary to demonstrate compliance with financial
related legal and contractual provisions.
Current Taxes Taxes that are levied and due within one year.
Debt Services The City’s obligation to pay the principal and interest of all
bonds and other debt instruments to a pre-determined payment
schedule.

313
Delinquent Taxes Taxes that remains unpaid on and after the date on which a
penalty for non-payment is attached.
Department Purpose The primary reason for the existence of a specific department is
explained through the departmental purpose statement.
Department Purpose The primary reason for the existence of a specific department is
explained through the departmental purpose statement.
Depreciation The process of estimating and recording the lost usefulness,
expired useful life or diminution of service from a fixed asset
that cannot or will not be restored by repair and will be replaced.
The cost of the fixed asset’s lost usefulness is the depreciation or
the cost to reserve in order to replace the item at the end of its
useful life.
Development Fees Fees charged by the City to developers or individuals to recover
the cost of services provided by the City.
Disbursement Payment for goods and services in cash or by check.
Donations A gift to the City that may be either monetary or non-monetary.
Effective Tax Rate The tax rate that would impose the same total taxes as the
previous year on properties taxed in both years. In other words,
the effective tax rate gives the taxing unit approximately the
same amount of money to spend as it had the year before.
EFFECTIVE TAX RATE = (Last Year’s Levy – Lost Property Levy)
(Current Total Value – New Property Value)
Encumbrance The commitment of appropriated funds to purchase an item or
service. To encumber funds means to set aside or commit funds
for future expenditures.
Enterprise Fund A governmental accounting fund in which the services provided
are financed and operated similarly to those of a private
business. The rate schedules for these services are established to
insure that revenues are adequate to meet all necessary
expenditures. An enterprise fund in Mansfield is established for
water and sewer services.
Estimated Revenue The amount of projected revenue to be collected during the
fiscal year. The amount of revenue appropriated is the amount
approved by City Council.
314
Expenditure This term refers to the outflow of funds paid for an asset
obtained or goods and services obtained regardless of when the
expense is actually paid. This term applies to all funds.
Note: An encumbrance is not expenditure. An encumbrance
reserves funds to be expended.
Expense Object Class A basis for distinguishing types of expenditures. The five major
expense object classes used by the City of Mansfield are: 8000
series-personnel services, 8100 series-supplies, 8200-8400
series-maintenance, 8500-8900 series-other operating, and 9000
series-capital outlay.
Expenses Charges incurred (whether paid immediately or unpaid) for
operation, maintenance, interest and other charges.
Fiscal Year The time period designated by the City signifying the beginning
and ending period for recording financial transactions. The City
of Mansfield has specified October 1st to September 30
th as its
fiscal year.
Fixed Assets Assets of long-term character which are intended to continue to
be held or used, such as land, buildings, machinery, furniture
and other equipment.
Full Time Equivalent
Positions (FTE) The amount of time a position has been budgeted on an annual
basis. A Full-Time Employee (FTE) normally works 2,080
hours on an annual basis while a part-time FTE would work
1,080 hours annually.
Fund An accounting entity that has a set of self-balancing accounts
and that records all financial transactions for specific activities
or government functions. Eight commonly used funds in public
accounting are: general fund, special revenue funds, debt service
funds, capital project funds, enterprise funds, trust and agency
funds, internal service funds, and special assessment funds.
Fund Balance Fund balance is the excess of assets over liabilities and is
therefore also known as surplus funds.
Full Faith and Credit A pledge of the general taxing power of a government to a
government to repay debt obligations (typically used in
reference to bonds).
Function A group of related programs crossing organizational
(departmental) boundaries and aimed at accomplishing a broad
goal or accomplishing a major service.

315
GASB 34 Basic financial statements and management’s discussion and
analysis for State and Local governments. GASB 34 requires
state and local governments to produce financial statements on
an accrual basis in much the same manner as a private sector
entity. The objective is to enhance the understanding and
usefulness of the financial reports of state and local governments
to the public, legislative and oversight bodies as well as
investors and creditors.
General Fund The largest fund within the City, the General Fund accounts for
most of the financial resources of the government. General
Fund revenues include property taxes, licenses and permits,
local taxes, service charges, and other types of revenue. This
fund usually includes most of the basic operating services, such
as fire and police protection, finance, data processing, park and
recreation, libraries, public works and general administration.
General Ledger A file that contains a listing of the various accounts necessary to
reflect the financial position of the government.
General Obligation Bonds Bonds that finance a variety of public projects such as streets,
buildings, and improvements; the repayment of these bonds is
usually made from the General Fund, and these bonds are
backed by the full faith and credit of the issuing government.
Governmental Fund Funds used to account for essentially the same functions
reported as governmental activities in the government-wide
financial statements.
Grant A contribution by a government or other organization to support
a particular function. Grants may be classified as either
categorical or block depending upon the amount of discretion
allowed the grantee.
Impact Fee A fee charged at the time of building permit issuance for
roadway and utility infrastructure costs in various quadrants of
the City.
Inter-fund Transfers Amounts transferred from one fund to another.
Intergovernmental Revenue Revenue received from another government for a specified
purpose. In Mansfield, these funds are from the State of Texas
and the Federal Government.
Internal Service Fund Funds used to account for the financing of goods or services
provided by one department to another department on a cost
reimbursement basis.

316
Infrastructure The underlying foundation or basic framework of the City
including land, buildings, streets and utilities, that tends to be
permanent or have a multi-year life.
Inventory A detailed listing of property currently held by the government.
Invoice A bill requesting payment for goods or services by a vendor or
other governmental unit.
Levy To impose taxes, special assessments, or service charges for the
support of City activities.
Line-Item Budget A budget that lists each expenditure category separately (salary,
materials, telephone service, travel, etc.), along with the dollar
amount budgeted for each specified category.
Major Funds All funds including General, Enterprise, Special Revenue, and
Capital Funds.
Merit Incentive A salary or benefit adjustment based on an employee’s overall
job performance that would warrant a salary or benefit increase.
Modified Accrual
Accounting A basis of accounting in which expenditures are accrued but
revenues are accounted for a cash basis. This accounting
technique is a combination of cash and accrual accounting since
expenditures are immediately incurred as a liability while
revenues are not recorded until they are actually received or are
"measurable" and "available for expenditure." Since this type of
accounting basis is a conservative financial approach, it is
recommended as the standard for most governmental funds.
Object Code An expenditure category, such as salaries, supplies, or vehicles.
Operating Budget The portion of the budget that pertains to daily operations that
provides basic governmental services. The operating budget
contains appropriations for such expenditures as personnel,
supplies, utilities, materials, travel and fuel.
Operating Fund A fund restricted to a fiscal budget year.
Performance Budget A budget that focuses upon activities rather than line items.
Work load and unit cost data are collected in order to assess the
efficiency of services. Typical data collected might include
miles of streets paved per year, cost of paved streets per mile,
tons of garbage collected per man hour, or cost per man hour of
garbage collection.
Performance Measures Specific quantitative and qualitative measures of work
performed as an objective of the department.
317
Program Budget A budget that focuses upon the goals and objectives of an
agency or jurisdiction rather than upon its organizational budget
classes of expenditure.
Project Something that is contemplated or planned, a large or major
undertaking, especially one involving considerable money,
personnel, and equipment.
Propose To offer for consideration, acceptance, or action.
Property Tax Property taxes are levied on both real and personal property
according to the property's valuation and the tax rate.
Proprietary Fund Funds to provide the same type of information as the
government-wide fund statements, except in more detail.
Reconciliation A detailed summary of increases and decreases in departmental
expenditures from one budget year to another.
Revenue Funds that the government receives as income. It includes such
items as tax payments, fees from specific services, receipts from
other governments, fines, forfeitures, grants, shared revenues
and interest income.
Revenue Bonds Bonds usually sold for constructing a project that will produce
revenue for the government. The revenue is used to pay the
principal and interest of the bond.
Requisition A written request from a department to the Budget/Accounting
office for specific goods or services. This action precedes the
authorization of a purchase order.
Reserve An account used to indicate that a portion of a fund's balance is
legally restricted for a specific purpose and is, therefore, not
available for general appropriation.
Risk Management An organized attempt to protect a government's assets against
accidental loss in the most economical method.
Source of Revenue Revenues are classified according to their source or point of
origin.
Strategic Plan A multi-year financial, operational and capital plan designed to
serve as a guide to future capital improvements, staffing and
operational requirements, as well as projected funding sources
over a specified time frame. The Strategic Plan is updated on an
annual basis.

318
Tax Duplicate
A listing of all taxable properties (real and personal) located
within the City's boundaries and the assessed valuation of each
parcel as determined by the Tarrant County Appraisal District.
This is another term for tax roll.
TIF A public financing method that is used as a subsidy for
redevelopment, infrastructure, and other community-
improvement projects.
TIRZ A political subdivision of a municipality or county in the state of
Texas created to implement tax increment financing. They may
be initiated by the city or county or by petition of owners whose
total holdings in the zone consist of a majority of the appraised
property value.
Unencumbered Balance The amount of an appropriation that is neither expended nor
encumbered. It is essentially the amount of money still
available for future purchases.
Working Capital The amount of funds available for use in the form of cash or
other assets after deductions for liabilities.
Voucher A document indicating that a transaction has occurred. It
usually contains the accounts related to the transaction.

319
2016 PROPERTY TAX RATES
In the CITY OF MANSFIELD
This notice concerns 2016 property tax rates for CITY OF MANSFIELD. It presents information about three tax rates. Last
year’s tax rate is the actual rate the taxing unit used to determine property taxes last year. This year’s effective tax rate would
impose the same total taxes as last year if you compare properties taxed in both years. This year’s rollback tax rate is the highest
tax rate the taxing unit can set before taxpayers start rollback procedures. In each case these rates are found by dividing the total
amount of taxes by the tax base (the total value of taxable property) with adjustments as required by state law. The rates are
given per $100 of property value.
Last year’s rate:
Last year’s operating taxes $23,210,925
Last year’s debt taxes $11,977,794
Last year’s total taxes $35,188,719
Last year’s base tax $4,956,157,606
Last year’s total tax rate 0.710000/$100
This year’s effective tax rate:
Last year’s adjusted taxes
(after subtracting taxes on lost property)
$34,545,879
This year’s adjusted tax base
(after subtracting value of new property
$5,181,378,189
= This year’s effective tax rate
(Maximum rate unless unit publishes notices and holds hearings)
0.666731/$100
This year’s rollback tax rate:
Last year’s adjusted operating taxes
(after subtracting taxes on lost property and adjusting for any transferred function, tax
increment financing, state criminal justice mandate, and/or enhanced indigent health care
expenditures)
$22,636,053
÷ This year’s adjusted tax base $5,181,378,189
= This year’s effective operating rate 0.436873/$100
x 1.08 – this year’s maximum operating rate 0.471822/$100
+ This year’s debt rate 0.239223/$100
- This year’s rollback rate 0.711045/$100
Statement of Increase/Decrease
If the City of Mansfield adopts a 2016 tax rate equal to the effective tax rate of $0.666731 per $100 of value, taxes would
increase compared to 2015 taxes by $455,736.
Schedule A
Unencumbered Fund Balance
The following estimated balances will be left in the unit’s property tax accounts at the end of the fiscal year. These balances are
not encumbered by a corresponding debt obligation.
Type of Property Tax Fund Balance
Debt Service $426,176

320
Schedule B – 2016 Debt Service
The unit plans to pay the following amounts for long-term debts that are secured by property taxes. These amounts will be paid
from property tax revenues (or additional sales tax revenues, if applicable).
Principal or
Contract Payment Interest to be Other
To be Paid from Paid from Amounts Total
Description of Debt Property Taxes Property Taxes to be Paid Payment
This notice contains a summary of actual effective and rollback tax rates’ calculations.
You can inspect a copy of the full calculations at 100 E. Weatherford Street, Fort Worth, Texas 76102.
Name of person preparing this notice: Ron Wright
Title: Tarrant County Tax Assessor-Collector
Date prepared: August 08, 2016
Combination Tax and General Obligation Bonds $35,000 $1,129 $0 $36,129
General Obligation Bonds, Series 2007B $245,000 $4,900 $0 $249,900
General Obligation Bonds 2007B $55,000 $1,100 $0 $56,100
Series 2007A Combination Tax and Cert. of Obligation $215,000 $6,337 $0 $221,337
Certificates of Obligation Series 2007A $535,000 $41,375 $0 $576,375
Taxable Series 2008 General Obligation Bonds $130,000 $10,000 $0 $140,000
General Obligation Bonds, Series 2008 $890,000 $179,025 $0 $1,069,025
Refunding 2009 Combination Tax and Cert. of Obligation $125,000 $105,719 $0 $230,719
Series 2011 General Obligation Refunding Bonds $895,000 $144,756 $0 $1,039,756
2011 Combination Tax and Certificates of Obligation $120,000 $113,190 $0 $233,190
Series 2012A Combination Tax and Revenue Cert. of Obligation $135,000 $100,273 $0 $235,273
2012 General Obligation Refunding Series $35,000 $180,434 $0 $215,434
2012 Combination Tax and Revenue Cert. of Obligation $215,000 $150,650 $0 $365,650
General Obligation Refunding Series 2013 Bonds $265,000 $111,300 $0 $376,300
Refunding Bonds 2013 General Obligation Refunding Tax Bonds $265,000 $60,400 $0 $325,400
General Obligation Refunding Bonds Series 2013 $1,305,000 $43,600 $0 $1,348,600
Combination Tax and Revenue Cert. of Obligation 2014 $645,000 $593,050 $0 $1,238,050
Combination Tax and Certificates of Obligation 2014 $50,000 $43,381 $0 $93,381
Series 2014 Combination Tax and Revenue Cert. of Obligation $590,000 $683,450 $0 $1,273,450
General Obligation Refunding Bonds, Series 2015 $1,525,000 $504,775 $0 $2,029,775
2015 Capital Obligation Bonds for Capital and Equipment
General Obligation Refund and Imp. Bonds Series 2016
Combination Tax and Revenue Cert. of Obligation 2016
Series 2016 General Obligation Bonds
$189,160
$60,000
$450,000
$80,000
$51,993
$665,962
$615,800
$124,008
$0
$0
$0
$0
$241,153
$725,962
$1,065,800
$204,008
Total required for 2016 debt service $13,590,767
-Amount (if any) paid from funds listed in Schedule A $426,176
-Amount (if any) paid from other resources $375,316
-Excess collections last year $0
=Total to be paid from taxes in 2016 $12,789,275
+ Amount added in anticipation that the unit will collect only
100.00% of its taxes in 2016
$0
$0
=Total debt levy $12,789,275

321

322

323

324

325
