building height estimation from high resolution sar ...jpier.org/pierm/pierm41/02.14073001.pdf ·...
TRANSCRIPT

Progress In Electromagnetics Research M, Vol. 41, 11–24, 2015
Building Height Estimation from High Resolution SAR Imageryvia Model-Based Geometrical Structure Prediction
Zhuang Wang1, Libing Jiang1, *, Lin Lei1, and Wenxian Yu2
Abstract—Height extraction by radar remote sensing is an attractive issue for the building detectionand recognition. According to the analysis on the building geometrical properties in the SAR imagery, anovel height estimation algorithm is proposed following a model-based geometrical structure predictionand matching strategy. The range Doppler equation is introduced and simplified for the building 2Dgeometrical structure prediction in the slant image plane. An evaluation function implementing theratio of exponentially weighted averages (ROEWA) is also established for the matching between thepredicted structure and the observed SAR image. By incorporating the genetic algorithm (GA), theevaluation function is maximized to get the optimal height parameter. The experimental results withthe simulated and real airborne and spaceborne SAR images show that the proposed method couldefficiently estimate building height from single SAR imagery, and achieve better performance than twopopular algorithms with the partial occlusion case.
1. INTRODUCTION
Building detection and reconstruction by remote sensing is a fundamental task in urban monitoring,planning and controlling [1]. Particularly, in the domain of rapid situation assessment after naturaldisasters (e.g., earthquakes and tsunamis), building height estimation is a key issue in post-emergencyevent information retrieval, which is crucial for initiating effective emergency response actions.
Although a lot of methods for building height extraction from optical remote sensing images havebeen presented [2–5], the usefulness of the optical images highly depends on sun illumination and cloud-free weather, which is not always available in some conditions (e.g., Wenchuan earthquake [6]). Onthe contrary, the synthetic aperture radar (SAR), as an active remote sensing technique, is capableof providing images independent from daytime and weather conditions. With the recent advances inmetric and sub-metric resolution SAR sensors (e.g., TerraSAR-X and Cosmo-SkyMed), anthropogenicstructures such as individual buildings can be identified from high resolution (HR) SAR images andthus accurate building height retrieval is becoming feasible.
Quite often, there is only one or a few HR SAR images available immediately after the disaster.Consequently, the problem of building height estimation from single HR SAR imagery has to beinvestigated particularly. The most difficult challenge is to accurately delineate the building boundaries,which are distorted by speckle noise and may be occluded by adjacent structures, such as in the classicalmonoscopy [7, 8] and radargrammetry [9, 10] methods. Recently, model-based [11–17] approaches havebeen proposed, which can explicitly incorporates knowledge of the SAR imaging and electromagnetictheory. For example, Guida et al. [11] and Franceschetti et al. [17] calculated the building heightanalytically through the deterministic electromagnetic equation, in which extensive prior informationof the building (e.g., the dielectric constants and the roughness parameters) as well as the surrounding
Received 30 July 2014, Accepted 17 November 2014, Scheduled 26 January 2015* Corresponding author: Libing Jiang ([email protected]).1 School of Electronic Science and Engineering, National University of Defense Technology, Changsha 410073, China. 2 School ofElectronic, Information and Electrical Engineering, Shanghai Jiao Tong University, Shanghai 200240, China.

12 Wang et al.
terrains are needed explicitly. Brunner [12] iteratively simulated the building images by ray tracing andmatched them with the real SAR image. In contrast, Wang [13] introduced the mapping and projectionalgorithm (MPA) for the building image simulation. Nevertheless, the image simulation procedure isusually of highly computational cost and heavy resource demanding. Zhao [14] instead extracted thelayover and shadow from the real SAR imagery and correlated them with the simulated image. Similarto the monoscopy, its usefulness depends on the correct delineation of the building features, which maydeteriorate by the speckle noise. Sportouche et al. [15] took advantage of the SAR formation equationsas well as the image statistical characteristics and proposed a projection based approach. However,precise backscattering modeling for the urban areas in the HR SAR images is quite difficult, as isdiscussed by Gao et al. [18].
Furthermore, most of the existing methods have focused on isolated buildings but paid rareattention to partially occluded building cases. In fact, in urban and semi-urban areas, the interferencebetween adjacent buildings usually leads to partial occlusions. The appearance of the occluded buildingsin the SAR image is different from the isolated ones, which complicates the height estimation problem.
In this paper, we propose a building height estimation approach by means of model-basedbuilding geometrical structure prediction and matching, which requires no assumptions on the HRSAR backscattering distribution or the image simulation. Furthermore, unlike the most existing heightestimation methods, the proposed method is capable of extracting the height for both the isolated andpartially occluded buildings. The proposed approach is implemented in an iterative manner, which canbe decomposed into three phases: 1) height hypothesis generation, 2) building geometrical structureprediction, and 3) geometrical structure matching. Firstly, a series of building height hypothesesare generated randomly. In the following, the building geometrical structures corresponding to theheight parameters in the slant image plane are precisely predicted according to the basic range Dopplerequation. Finally, the predicted building structure is masked onto the observed SAR image and matchedby the evaluation function, which is maximized to find the optimal height hypothesis.
The reminder of this paper is organized as follows. In Section 2, the dominating backscatteringmechanisms as well as the building properties in the SAR images are analyzed. In Section 3, a generalform for the model-based building height estimation is formulated, and the flowchart of the proposedapproach is presented. In Section 4, the proposed height estimation approach is introduced in detail.The experimental results employing the simulated data as well as the real SAR imagery are presentedin Section 5, and the conclusions are drawn in Section 6.
2. BUILDING BACKSCATTERING CHARACTERISTICS IN SAR IMAGERY
SAR sensor is characterized by its active side looking illumination and ranging geometry. The projectionof the three dimensional building into the two-dimensional slant image plane produces effects such aslayover, shadow and foreshortening that distort the appearance of the building in the SAR imagery.Besides, a small incidence angle also leads to the specular reflection. Dense alignment of the buildingsalong the radar look of sight (RLOS) also causes the multi-path reflection effects [19], as is brieflydepicted in Figure 1.
The geometry of the radar collection and the shape of the building influence the appearance of the
II
I III
IVβ
flat roof
gable roof
Figure 1. Scattering mechanism on the buildings in the urban area. I. Single bounce reflection.II. Double bounce reflection. III. Multi-path reflection. IV. Specular reflection.

Progress In Electromagnetics Research M, Vol. 41, 2015 13
building in the slant image plane. To understand the relationship between building and its shape inthe SAR imagery, the range profiles of two common building types are analyzed: the flat roof and thegable roof building. Example of the isolated flat roof building is shown in Figure 2. The layover area ais generated by the single bounce reflections from the front wall, ground and roof, which share the samerange resolution cell. The line b is formed by the dihedral corner that arises from the double bouncereflection between the building vertical wall and its front terrain. The area c indicates the single bouncereflections from the front wall, ground or roof. The area d is the shadow where no reflection happens.The relation between the layover and shadow dimension and the building height parameter is as follows
h ={
sr × cos β if β < tan−1(w/h)lr/ cos β if β > tan−1(w/h) (1)
where β is the depression angle, and lr and sr are the length of layover and shadow, respectively.The range profile of the isolated gable roof building is a little different from the flat roof case, as
shown in Figure 3. A second bright scattering area arises closer to the sensor than the double bounceline, which is mainly caused by the inclined roof e directly against the radar. In the specific case β = γ,the single bounce reflections from e are assembled in a single range resolution cell, which result in abright line at the near range. Besides, the alignment of the layover and shadow also varies with differentgeometrical attributes, as shown in Figures 3(a)–(d). The relationship between the dimension of thelayover, shadow and the height parameter is intricate compared to Eq. (1), depending not only on thedepression angle β and tan−1w/h but also on the roof inclined angle γ, as shown in Eq. (2).
h ={
lr/ cos β if β > γsr × sinβ if β < γ and β < tan−1w/h (2)
B
a b
c
dh
w
RLOS
slant range profile
Sr
III
I lr
a bc
d
h
w
RLOS
slant range profile
Sr
lr
III
I
B
β β
(a) (b)
Figure 2. Slant range profile of isolated flat roof building. (a) β < tan−1(w/h). (b) β > tan−1(w/h).
III
III
Iw
h
a+e b
d
slant rangeprofile
lr
sr
a
I
II
III
Ih
a+e
b
d
slant rangeprofile
sr
lr
w
lr
sr
I II
III
I
wh
bd
slant rangeprofile
I
a+e
a
III
III
Iw
h
a+e
bd
slant rangeprofile
lr
sr
aI
e
ββ
β β
(a) (b)
(c) (d)
γ
γ
γ
γ
Figure 3. Slant range profile of isolated gable roof building. (a) β > tan−1(w/h) and β > γ.(b) β < tan−1(w/h) and β > γ. (c) β > tan−1(w/h) and β < γ. (d) β < tan−1(w/h) and β < γ.

14 Wang et al.
h3
h2
h1
RLOS
h0B1 B0
Δ
slant range profileβ
Figure 4. Slant range profile of buildings with occlusion.
Especially, for the case β > tan−1w/h and β < γ in Figure 3(c), there is no direct relationshipbetween h and lr since contributions originated from different building parts (e.g., the front wall, ground,and the inclined roof) are mixed into the layover, which have comparable influence and are hard todistinguish.
Furthermore, in urban or sub-urban areas, the buildings are usually densely aligned to each other,which may cause occlusion and makes their structures quite different from the isolated cases. Anexample of two neighbored buildings is shown in Figure 4. For the building B0 and B1 with height h0
and h1 respectively, since the distance between B0 and B1 is large enough, their range profile are thesame as isolated cases. As the height of B1 gradually increase to h2, partial occlusion happens on B0,which results in a subdivided layover and a weakened double bounce line for B0, as well as a shortenedshadow for B1. This effect is intensified as B1 becomes higher. As a result, the double bounce line ofB0 vanishes when the height of B1 grows to h3 because its “front wall-ground” double bounce reflectiondisappears. In this case, the Eq. (1) and Eq. (2) no longer works.
The minimum distance [12] Δmin required between buildings without occlusion is
Δmin = h1 tan(β) + h0 cot(β) (3)
where h1 and h0 is the height of the building at the near and far range of the SAR sensor respectively(see Figure 4).
The examples from Figures 2–4 indicate that the building geometrical structure in the SAR imagecontains information about the building parameters, which is the fundament of the building heightestimation. Figure 4 further illustrates that the geometrical structure in the slant image plane isdetermined not only by the building’s own geometry, but is also interfered by its surrounding buildings.Thus different building cases should be distinguished in advance and treated differently. For the isolatedbuilding case, its building structure is solely determined by its own geometry, thus its height parametercan be estimated separately one by one. For the partial occluded building case, its height should beestimated by concerning its own geometry as well as the neighbor buildings simultaneously.
3. PROBLEM STATEMENT OF THE BUILDING HEIGHT ESTIMATION
Canonical building can be explicitly designated by its geometric parameters. Hence we denote a buildingB as B = (l, w, h, α, γ, C), where l is the length, w is the width, h is the height, α is the aspect angle,γ is the roof inclination angle and C = (x, y, z) is the center of the building footprint. We also denoteH and β as the height and the depression angle of the SAR sensor. As is discussed in Refs. [11–13, 15–17], the building footprint and the SAR sensor parameters are usually regarded as known prior in theproblem of building height retrieval. For the simplicity, these prior parameters are denoted in the vectorform as θ = (l, w, α, γ, C) and ϕ = (H,β).
From a model-based point of view, the problem of image interpretation can be regarded as searchingfor the parameter that best matches with the observed SAR image. Thus, the general form of the

Progress In Electromagnetics Research M, Vol. 41, 2015 15
building height estimation problem can be formulated as the following maximization function
h = arg maxh,−→S
L{I ′(B(h, θ)|ϕ), I} (4)
where I is the observed SAR imagery and I ′(B(h, θ)|ϕ) the simulated image or features correspondingto the hypothesis B(h, θ) under sensor parameter ϕ. L{·} is the evaluation function which measures theconsistency between I ′(B(h, θ)|ϕ) and I. S = (dm, dn)T is the translation between I ′(B(h, θ)|ϕ) and I.
Considering the fact that the heights of the adjacent buildings should be estimated simultaneouslyfor the partially occluded building case, the formula in Eq. (4) is rewritten as
h = arg maxh,−→S
L{I ′(B(h, θ)|ϕ), I} (5)
where h = (h1, h2, . . . , hnner )T is the height vector of all the neighbor buildings {B(hi, q), i =1, . . . , nner}. For nner = 1, it is the case of the isolated building, and for nner > 1 it is the caseof the occluded building.
As illustrated in Section 2, it is not the entire building image but the shapes of building regionsthat are straightforwardly related to its geometric parameters. So in this paper, we do not simulatethe SAR images. Instead, the geometrical structure of the building in the slant image plane (e.g., thelayover, shadow, single reflection area and double bounce line), are predicted according to the buildingmodel. Besides, considering the influence of speckle, we neither extract the building contours, butdirectly mask the predicted structure onto the observed SAR image. Hence, the matching between thepredicted building geometrical structure I ′(h) and the observed SAR image I in Eq. (5) can be matchedby the evaluation function.
The proposed height estimation algorithm can be summarized as follows: Starting from the buildingmodel composed of the prior 2D footprints and the height hypothesis, firstly, the isolated and thepartially occluded building cases are discriminated according to Eq. (3). For the isolated building case,its geometrical structure is directly calculated through the mapping function. For the partially occludedbuilding case, its visible facets are identified in advance through the “sensor-building” illuminationgeometry and then the corresponding geometrical structure is also calculated by the mapping function.Subsequently, this predicted structure is projected onto the observed SAR image. Finally, an evaluationfunction is constructed and maximized by the genetic algorithm (GA), which leads to the solution forthe height parameter. The flowchart of the proposed approach is shown in Figure 5.
Matching
Prediction
Prior knowledge
Hypothesis
Maximum?
Y
N Observed SAR image
3D buildingmodel
N
Y
Isolated building geometrical
structure prediction
Matching
Occluded buildinggeometrical
structure prediction
SAR imaging parameters
Buildingfootprints
Height estimation h
Heighthypothesis h
^
Occlusion discrimination
Figure 5. Flowchart of the proposed method.
4. PROPOSED HEIGHT ESTIMATION APPROACH
4.1. Height Hypothesis Generation
During the height estimation process described by Figure 5, only the height parameter h and translationparameter S are variable. The building prior parameters θ = (l, w, α, γ,C) can be derived from
16 Wang et al.
cadastral maps, optical remote sensing images or single high-resolution SAR imageries. The sensorprior parameters ϕ = (H,β) are defined by the flight height of the airplane as well as the depressionangle of the SAR imaging system. During the maximization for Eq. (5), the height parameter hypothesesare uniformly drawn from a predefined height interval [hmin,hmax]. Initial height parameter hypothesiscan also be provided by the monoscopy method. The translation parameter S is also generated randomlyfrom a predefined translation range.
4.2. Building Geometrical Structure Prediction
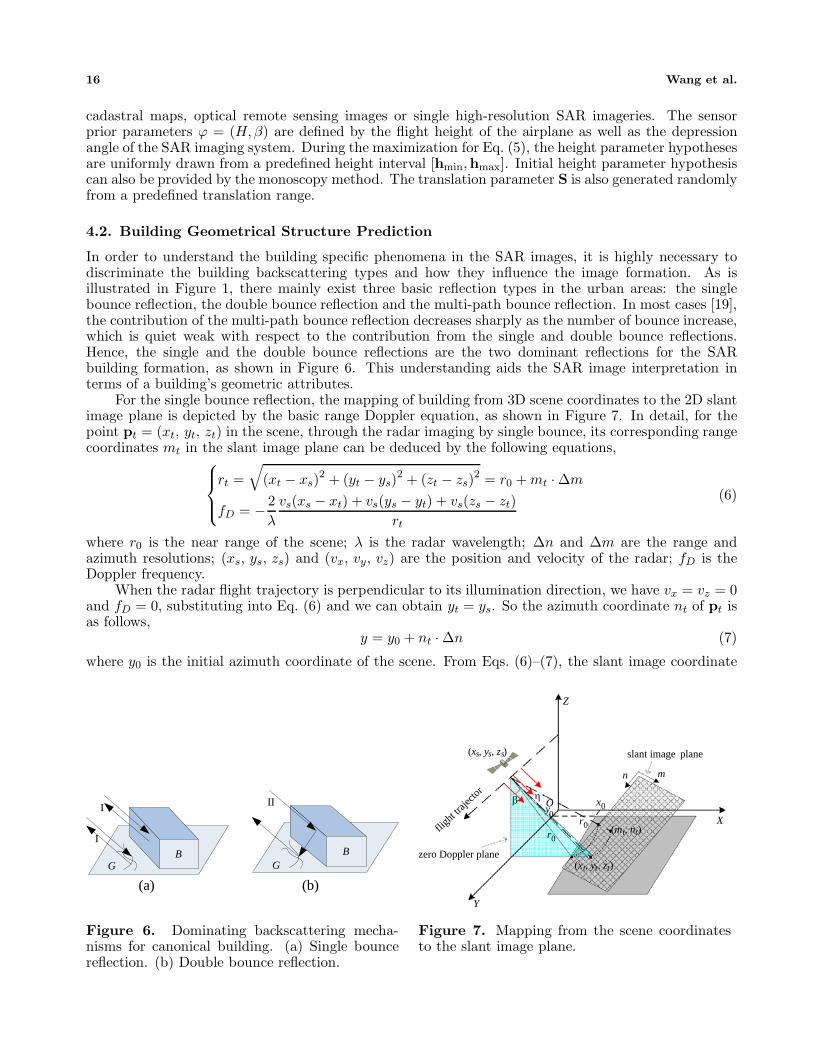
In order to understand the building specific phenomena in the SAR images, it is highly necessary todiscriminate the building backscattering types and how they influence the image formation. As isillustrated in Figure 1, there mainly exist three basic reflection types in the urban areas: the singlebounce reflection, the double bounce reflection and the multi-path bounce reflection. In most cases [19],the contribution of the multi-path bounce reflection decreases sharply as the number of bounce increase,which is quiet weak with respect to the contribution from the single and double bounce reflections.Hence, the single and the double bounce reflections are the two dominant reflections for the SARbuilding formation, as shown in Figure 6. This understanding aids the SAR image interpretation interms of a building’s geometric attributes.
For the single bounce reflection, the mapping of building from 3D scene coordinates to the 2D slantimage plane is depicted by the basic range Doppler equation, as shown in Figure 7. In detail, for thepoint pt = (xt, yt, zt) in the scene, through the radar imaging by single bounce, its corresponding rangecoordinates mt in the slant image plane can be deduced by the following equations,⎧⎪⎨
⎪⎩rt =
√(xt − xs)
2 + (yt − ys)2 + (zt − zs)
2 = r0 + mt · Δm
fD = − 2λ
vs(xs − xt) + vs(ys − yt) + vs(zs − zt)rt
(6)
where r0 is the near range of the scene; λ is the radar wavelength; Δn and Δm are the range andazimuth resolutions; (xs, ys, zs) and (vx, vy, vz) are the position and velocity of the radar; fD is theDoppler frequency.
When the radar flight trajectory is perpendicular to its illumination direction, we have vx = vz = 0and fD = 0, substituting into Eq. (6) and we can obtain yt = ys. So the azimuth coordinate nt of pt isas follows,
y = y0 + nt · Δn (7)
where y0 is the initial azimuth coordinate of the scene. From Eqs. (6)–(7), the slant image coordinate
G B
I
I
GB
II
G
(a) (b)
Figure 6. Dominating backscattering mecha-nisms for canonical building. (a) Single bouncereflection. (b) Double bounce reflection.
O
X
Y
Z
slant image plane
fligh
t traje
ctor
(x , y , z )s s s
zero Doppler plane
(m , n )t tr0
y0
(x , y , z )t t t
x0
r0
mn
β η
Figure 7. Mapping from the scene coordinatesto the slant image plane.

Progress In Electromagnetics Research M, Vol. 41, 2015 17
(mt, nt) of the point pt = (xt, yt, zt) can be calculated,⎧⎪⎪⎨⎪⎪⎩
mt =
√(xt − xs)
2 + (yt − ys)2 + (zt − zs)
2 − r0
Δm
nt =y − y0
Δn
(8)
The double bounce reflection originates from radar signals following the path “radar-building wall-ground-radar” or vice versa, as shown in Figure 6(b), whose contribution is a highlight line superposedon the near range footprint of the building. Since this double bounce line shares the same resolutioncell with the single bounce reflection happened on the building footprint, its coordinate could also becalculated by mapping the near range building footprint to the slant image plane through Eq. (8).So based on the above analysis, the mapping of the building from 3D scene to the 2D slant imagecoordinates is given by Eq. (8).
Based on the analysis above, the building regions (such as layover, shadow, double bounce line,etc.) in the slant image plane can be calculated by the Eq. (8). Moreover, combining the Eq. (8) withthe specific backscattering model such as Lambertian or specular reflection model, the correspondingsimulated SAR image can be obtained, as is illustrated in Refs. [12, 13, 16]. However, as is discussed inSection 3, it is not the entire SAR image data but the shape of the building that is straightforwardlyrelated to its geometric parameters. Therefore, in this paper we concentrate on the prediction of thebuilding geometrical structure in the slant image plane from 3D scene coordinates.
An example of mapping is shown in Figure 8. The rectangles of the building facets such as roofand walls are distorted and superimposed, which become parallelograms with corners that are notright angles. The visible facets form the layover and the double bounce line, while the invisible facetsdetermine the shadow, as shown in Figure 8(b). Furthermore, all these points labeled in the slant imageplane of Figure 8(c) can be explicitly calculated by the building parameters and the radar illuminationgeometry. Therefore, the first task for the building structure prediction is to decompose the buildinginto discrete points and identify its visibility along the RLOS.
A building can be decomposed into a series of facets,
B �{fB
i , i = 1, 2, . . . , NBf
}(9)
where NBf is the number of the facets. Each facet fB
i can further be decomposed into a series of discretepoints,
fBi �
{pB
ij , j = 1, 2, . . . , Ci
}(10)
where pBij = (x, y, z)Bij is the j th discrete point on facet fB
i , and Ci is the total point number.
010
20
0
10
20
0
10
20
z
xy
P3
P2
P1
P4
flight trajectory
P7
P6
P5
P8
(a) (b) (c)
Figure 8. Mapping of the building to the slant image plane. (a) Building in the 3D coordinates.(b) Visible and invisible facets in the scene. (c) Corresponding geometrical structure in the slant imageplane.

18 Wang et al.
o
X
Z
Yinp
0neriB B
RLOS
Gnerijp
Bijp
Gi Oi
Figure 9. Visible facets identification.
The visible facets along the RLOS can be easily discriminated by the following formula,{fi is visible if R · ni < 0fi is invisible otherwise
(11)
where “·” is the inner product operator, R the unit vector along the RLOS, and ni the norm vector ofthe facet fi. The ground facets {fG
i } which also have contribution surrounding the building B can beidentified by the facets {fB
i } through the following linear equation,
pGij = pB
ij T (12)
where pGij = (xyz)Gij is the point corresponding to pB
ij in fGi , T is the transform matrix,
T =
⎧⎪⎪⎪⎪⎪⎪⎪⎨⎪⎪⎪⎪⎪⎪⎪⎩
⎡⎣1 0 0
0 1 00 − cot β 0
⎤⎦ if R · ni < 0
⎡⎣1 0 0
0 1 00 tan β 0
⎤⎦ otherwise
(13)
For the isolated building, by substituting these building points into Eq. (8), the correspondinggeometrical structure can be obtained. However, for the partially occluded building, the visible facets{fB
i } and {fGi } will not remain intact due to the partial occlusion caused by its adjacent buildings
and thus the exact visible points should be further re-identified before mapping by Eq. (8). Denoting{Bner
i , i = 1, . . . , NBner} as the adjacent buildings of the building B which do not meet the minimum
distance condition in Eq. (3), then the invisible parts of B occluded by the ith neighbor building Bneri
can be identified through the sensor illumination geometry, as illustrated in Figure 9,{pB
ij = pnerij + (0, sin β × t,− cos β × t)
nBi · (pB
ij − pB0 ) = 0
(14)
where pnerij = (x, y, z)ner
ij ∈ Bneri , nB
i = (u, v, k) is the norm vector of fBi ∈ B, pB
ij the invisible pointoccluded by pner
ij , and pB0 = (xo, yo, zo) ∈ fB
i the arbitrary known point on fBi . Accordingly, the exact
visible facet f ′Bi of fB
i after occlusion by the adjacent buildings {Bneri } is
f ′Bi = fB
i \Nner∪i=1
Ci∪j=1
{pBij } (15)
where “\” and “∪” are the set difference and union operator respectively. The exact visible parts of theground facet for the partially occluded building can also be identified in a similar way by Eqs. (14)–(15),whose unit vector ni � (0, 0, 1).

Progress In Electromagnetics Research M, Vol. 41, 2015 19
Based on the above analysis, the prediction of the building geometrical structure can be summa-rized as follows:
Step 1: Discriminate the isolated buildings from the partially occluded buildings through Eq. (3).Step 2: Decompose the building into discrete points by Eq. (9)–Eq. (11). For the isolated building,
directly calculate the interrelated points on the ground according to Eq. (12). For the partially occludedbuilding, refine its visible points in advance by Eq. (14)–Eq. (15) and then identify the interrelatedground points by Eq. (12).
Step 3: Map the points obtained from Step 2 onto the image plane through Eq. (8). Forconvenience, the mapped area on the slant image plane is denoted as a label image, which characterizesthe building shape.
4.3. Evaluation Function
As discussed in Section 2, the contours of the building behave as salient edges in the SAR image, thuswe design the evaluation function based on the edge strength along the building contours. Denote LB
as the label image which characterizes the geometrical structure of building B, and then by masking LB
onto the observed SAR image I, an image chip PI(LB) containing the building contours is obtained.
PI(LB) ={
pLBi , i = 1 . . . M
}(16)
where pLBi ∈ I is the ith pixel along the building contours and M the total pixel number.
Considering the influence of speckle noise, the ratio of exponentially weighted averages(ROEWA) [20] is introduced for the edge strength calculation. Therefore, the evaluation functionL{·} for Eq. (5) is formulated as the sum of ROEWA edge strength along contours of the predictedbuilding geometrical structure in the following Eq. (17), where R(·) is the ROEWA operator.
L{I ′(h), I
}=
M∑i=1
R(pLB
i
)(17)
4.4. Maximization
In order to get the optimal height parameter h, the evaluation function L{·} in Eq. (17) should bejointly maximized for h and translation parameter S. However, due to the lack of concave-convexproperty of L{·}, the usefulness of the deterministic optimization techniques are limited. Therefore, thegenetic algorithm is adopted here, which is specialized in finding a global maximum among several localmaximums through a stochastic way. The fitness of the genetic algorithm is the evaluation function inEq. (17). Other related parameters for the genetic algorithm are listed in Table 1.
Table 1. Parameter configuration for the genetic algorithm.
Population type Selection Crossover Mutation Stopping CriteriaDouble vector Stochastic uniform Arithmetic Non-uniform Maximum generation
5. EXPERIMENTAL RESULTS AND DISCUSSION
5.1. Evaluation by the Simulated Image
Aiming at the quantitative performance assessment for the proposed method, a dataset containing 176simulated SAR images with azimuth and range resolution 0.2m × 0.2 m is constructed according tothe Lambertian reflection model, which characterizes the salient relationship between the scatteringintensity and the incident angle. Different acquisitions and geometry attributes for the isolated and

20 Wang et al.
(a) (b) (c) (d)
(e) (f) (g) (h)
Figure 10. Examples of the simulated image data set. (a), (c) are isolated flat roof buildings withaspect angle at 0◦, 60◦ and 90◦. (d), (f) are isolated gable roof building with aspect angle at 0◦, 60◦and 90◦. (g), (h) are partially occluded buildings containing two adjacent buildings with aspect angleat 0◦, 90◦ and distance 8m.
50o
10 m
20 m
20 m
5 km
45o
(a) (b) (c)
Figure 11. Example of the gable roof building height estimation. (a) 3D building in the scene.(b) Predicted building geometrical structure corresponding to h0. (c) Surface of evaluation functionL(h).
partially occluded building cases are taken into account. For the isolated building cases, two commonbuilding types — the flat and the gable roof buildings, are considered. Their aspect angles vary at0◦, 20◦, 30◦, 45◦, 60◦, 80◦ and 90◦, while the SAR depression angles are chosen at 30◦ and 51◦. Forthe partially occluded building cases, a scene containing two adjacent flat roof buildings is consideredfor simplicity. Their aspect angles vary equally from 0◦ to 90◦ by step 10◦. The distance between thebuildings are set as 6 m, 8 m and 10 m respectively, while the SAR depression angles are chosen at 40◦and 50◦. The speckle effect is also considered. A multiplicative noise with variances of 0.1 and 0.2are added to the whole dataset, which leads to their equivalent number of looks (ENL) as 3 and 1respectively. Examples of the simulated images in the dataset are shown in Figure 10.
An example of the isolated gable roof building with geometric model (20 m, (20 m, 10 m, 0◦, 45◦))is shown in Figure 11(a). The corresponding simulated image with multiplicative noise variance 0.2 isshown in Figure 10(d). The predicted building geometrical structure corresponding to the initial heightparameter hypothesis h0 = 16.0 m is shown as a label image in Figure 11(b). The “prediction-matching”process convergences after about 20 iterations by the genetic algorithm, where a maximum evaluationfunction value = 29.68 is found at = 20.0 m, as is shown in Figure 11(c).
The proposed algorithm is tested over the simulated image dataset. For comparison, the existingimage simulation based algorithm [12, 16] and the projection based algorithm [15] have also been

Progress In Electromagnetics Research M, Vol. 41, 2015 21
0 10 20 30 40 50 60 70 80 90Aspect Angle ( )o
image simulation based,ENL=1image simulation based,ENL=3projection based,ENL=1projection based,ENL=3proposed,ENL=1proposed,ENL=3
0 10 20 30 40 50 60 70 80 90
image simulation based,ENL=1image simulation based,ENL=3projection based,ENL=1projection based,ENL=3proposed,ENL=1proposed,ENL=3
0 10 20 30 40 50 60 70 80 90
image simulation based,h1
image simulation based,h2
projection based,h 1
projection based,h 2
proposed,h1
proposed,h2
0
0.5
1
1.5
2
2.5
3A
bsol
ute
Mea
n E
rror
( m
)
Aspect Angle ( )o Aspect Angle ( )o
0
2
4
6
8
10
12
14
16
18
20
Abs
olut
e M
ean
Err
or (
m)
0
0.5
1
1.5
2
2.5
3
Abs
olut
e M
ean
Err
or (
m)
(a) (b) (c)
Figure 12. Comparison of height estimation results. (a) Isolated flat roof building. (b) Isolated gableroof building. (c) Adjacent two flat roof buildings.
investigated. Due to the fact that the coherent SAR images simulation techniques (such as PO, GO,ray tracing) usually entail complex electromagnetic computation, therefore, a non-coherent simulationtechnique [14] is adopted here for image simulation, which has a comparatively low computation costand is prone to implement.
The absolute mean error (AME) of the above-mentioned algorithms with various aspect anglesand noise variances are shown in Figure 12. Figure 12(a) is the result for isolated flat building caseand Figure 12(b) is the isolated gable roof building case. From Figures 12(a)–12(b) we can see thatboth three algorithms can estimate the isolated building height parameter with good precision and theirAME curves are comparatively low. For the image simulation based algorithm, a maximum AME of0.5 m for isolated flat roof building and 0.8 m for the gable roof building is obtained. Similar resultshave been attained for the projection based algorithm and the proposed algorithm, which have a slightlyhigh maximum AME of 1.5 m for isolated flat building and 2.1 m for the isolated gable roof building.Besides, their AME curves are also comparatively stable as the aspect angle varies, which means thattheir performances are not sensitive to the building aspect angle parameter.
Figure 12(c) refers to the result of the partially occluded building height estimation over the dataset,in which h1 represents the building height at the near sensor range and h2 is the building height at thefar sensor range. For both the image simulation based and the proposed algorithm, their AME curvesmaintain low and smooth, with an average error of 1.6 m and a maximum error of 3.8 m. However, forthe projection based method, the estimation error of h2 becomes large, with an average error of 9.0 mand a maximum error of 14.0 m at the aspect angle 0◦. The AME curves in Figure 12(c) indicates thatthe performance of the projection based algorithm deteriorates as the occlusion becoming worse, whilethe image simulated based algorithm and the proposed algorithm maintain effective.
The computation times of the above three algorithms during an individual “prediction-matching”procedure are also enumerated, as listed in Table 2. From Table 2 we can see that the image simulationbased algorithm takes the longest computation time during the rendering phase, while the projection-based algorithm consumes the shortest time. Actually, both the projection based algorithm and theproposed algorithm use the range Doppler equation for the building mapping. However, the elapsedtimes of the projection-based algorithm are about 5 times shorter than the proposed algorithm for thepartially occluded case, because only the ridges of the building are taken into account.
5.2. Evaluation by Airborne SAR Data
The X-band airborne SAR data with a spatial resolution of 1 m in both azimuth and range is usedin the experiment, which is provided by East China Research Institute of Electronic Engineering.Figure 13(a) shows an image chip acquired over Hefei city in China, which contains a flat roof building.The corresponding optical image from the same area is shown in Figure 13(b). The ground truth ofthe building parameter in the image chip is (10.5 m, (13.1 m, 51.0 m, 40.4◦)). The final geometricalstructure obtained by the proposed algorithm corresponding to the optimal height estimation = 9.8 mis visually enhanced in gray line and superimposed onto the airborne SAR image chip in Figure 13(c),which is close to the ground truth.

22 Wang et al.
Table 2. Computation time of an individual “prediction-matching” procedure.
Eclipsed time
Algorithms
Prediction (sec) Matching (sec) Total (sec)
isolated partially
occluded isolated
partially
occluded isolated
partially
occluded
image simulation
based algorithm 1.032 3.661 0.012 0.012 1.044 3.673
projection-based
algorithm 0.004 0.152 0.022 0.035 0.026 0.187
proposed algorithm 0.013 1.012 0.031 0.042 0.044 1.054
(a) (b) (c)
Figure 13. Airborne SAR data experiment. (a) Airborne SAR image chip. (b) Optical image ( c©GoogleEarth). (c) Overlaid with the predicted building geometrical structure.
(a) (b) (c)
Figure 14. Spaceborne SAR data experiment. (a) TerraSAR-X image chip ( c©Infoterra GmbH).(b) Optical image ( c©Google Earth). (c) Overlaid with the predicted building geometrical structure.
5.3. Evaluation by TerraSAR-X Data
As reported, TerraSAR-X was successfully launched in June 2007, which is capable of acquiring meterand sub-meter resolution SAR images. The HH-polarization SAR image acquired over Nordlingen,Germany from ascending orbit is used, which contains three neighbor buildings, as shown in Figure 14(a).The optical image of the same district is shown in Figure 14(b).
Due to the constraints of field inspection, the ground truth of the building footprint is obtainedby manual inspection over the optical image from Google Earth with a resolution of 0.6 m, whichare (40.2 m, 24.2 m, 90◦), (97.7 m, 40.2 m, 0◦) and (97.7 m, 13.4 m, 0◦) for buildings from top left tobottom right respectively. Although the actual building heights are unknown, the experiment results

Progress In Electromagnetics Research M, Vol. 41, 2015 23
on the simulated images in Section 5.1 suggest that the accuracy of the height estimation is closelycorrelated with the coherence degree between the predicted geometrical structure and the buildingareas. Thus, the estimated geometrical structure is overlaid on the origin image chip for an indirect andqualitative analysis, as shown in Figure 14(c), which is quiet in accordance with the building areas. Theexperimental results on the TerraSAR-X SAR data demonstrate the validity of the proposed method.
6. CONCLUSIONS
In this paper, a new building height estimation method is proposed, which is capable of retrieving thebuilding even with partial occlusion from single VHR SAR images. The backscattering characteristicsof two typical buildings are analyzed in detail. Base on that, the range Doppler equation is employed forthe prediction of the building structure in the slant range plane. Then, the predicted building structureis masked onto the real SAR image for evaluation by the matching function. Finally, by maximizingthe matching function through the genetic algorithm, the building height is retrieved. Experimentswith the simulated and real SAR data show that the proposed method has a comparable performancewith existing two algorithms for the isolated building case, and yields better results for the partiallyoccluded building case. Further work for more complicate shaped man-made structures interpretationis currently in progress.
ACKNOWLEDGMENT
The authors would like to thank the anonymous reviewers for their excellent comments. This study issupported by the National Natural Science Foundation of China (No. 61105031).
REFERENCES
1. Soergel, U., Radar Remote Sensing of Urban Areas, 1st edition, Springer, Berlin, 2010.2. Ok, A. O., C. Senaras, and B. Yuksel, “Automated detection of arbitrarily shaped
buildings in complex environments from monocular VHR optical satellite imagery,” IEEETrans. Geosci. Remote Sens., Vol. 51, No. 3, 1701–1717, 2013.
3. Izadi, M. and P. Saeedi, “Three-dimensional polygonal building model estimation from singlesatellite images,” IEEE Trans. Geosci. Remote Sens., Vol. 50, No. 6, 2254–2272, 2012.
4. Stankov, K. and D. He, “Building detection in very high spatial resolution multispectral imagesusing the hit-or-miss transform,” IEEE Geosci. Remote Sens. Lett., Vol. 10, No. 1, 86–90, 2013.
5. Elbakary, M. I. and K. M. Iftekharuddin, “Shadow detection of manmade buildings in high-resolution panchromatic satellite images,” IEEE Trans. Geosci. Remote Sens., Vol. 52, No. 9,5374–5386, 2014.
6. Balz, T., D. Perissinb, U. Soergel, L. Zhang, and M. S. Liao, “Post-seismic infrastructure damageassessment using high-resolution SAR satellite data,” Proceeding of 2nd International Conferenceon Earth Observation for Global Change, 180–191, Chengdu, China, 2009.
7. Blacknell, D., R. D. Hill, and C. P. Moate, “Estimating building dimensions from synthetic apertureradar image sequences,” IET Radar, Sonar and Navigation, Vol. 2, No. 3, 189–199, 2008.
8. Tupin, F., “Extraction of 3D information using overlay detection on SAR images,” The 2ndGRSS/ISPRS Joint Workshop on Remote Sensing and Data Fusion over Urban Areas, 72–76,Berlin, Germany, 2003.
9. Meric, S., F. Fayard, and E. Pottier, “A multi-window approach for radargrammetricimprovements,” IEEE Trans. Geosci. Remote Sens., Vol. 49, No. 10, 3803–3810, 2011.
10. Simonetto, E., H. Oriot, and R. Garello, “Rectangular building extraction from stereoscopicairborne radar images,” IEEE Trans. Geosci. Remote Sens., Vol. 43, No. 10, 2386–2395, 2005.
11. Guida, R., A. Iodice, and D. Riccio, “Height retrieval of isolated buildings from single high-resolution SAR images,” IEEE Trans. Geosci. Remote Sens., Vol. 48, No. 7, 2967–2979, 2010.

24 Wang et al.
12. Brunner, D., G. Lemoine, L. Bruzzone, and H. Greidanus, “Building height retrieval from VHR SARimagery based on an iterative simulation and matching technique,” IEEE Trans. Geosci. RemoteSens., Vol. 48, No. 3, 1487–1504, 2010.
13. Wang, T. L. and Y. Q. Jin, “Postearthquake building damage assessment using multi-mutualinformation from pre-event optical image and post-event SAR image,” IEEE Geosci. Remote Sens.Lett., Vol. 9, No. 3, 452–456, 2012.
14. Zhao, L. J., Building Extraction from High Resolution SAR Imagery, National University of DefenseTechnology, Changsha, China, 2009.
15. Sportouche, H., F. Tupin, and L. Denise, “Extraction and three-dimensional reconstruction ofisolated buildings in urban scenes from high-resolution optical and SAR spaceborne images,” IEEETrans. Geosci. Remote Sens., Vol. 49, No. 9, 3932–3946, 2011.
16. Matzner, S. A., Model-based Information Extraction from Synthetic Aperture Radar Signals,Portland State University, Portland, USA, 2011.
17. Franceschetti, G., R. Guida, A. Iodice, D. Riccio, G. Ruello, and U. Stilla, “Building featureextraction via a deterministic approach: Application to real high resolution SAR images,”Proceedings of IEEE International Geoscience and Remote Sensing Symposium, 2681–2684,Barcelona, Spain, 2007.
18. Gao, G., X. X. Qin, and S. L. Zhou, “Modeling SAR images based on a generalized gammadistribution for texture component,” Progress In Electromagnetics Research, Vol. 137, 669–685,2013.
19. Ferro, A., D. Brunner, L. Bruzzone, and G. Lemoine, “On the relationship between double bounceand the orientation of buildings in VHR SAR images,” IEEE Geosci. Remote Sens. Lett., Vol. 8,No. 4, 612–616, 2011.
20. Fjortoft, R., A. Lopes, P. Marthon, and E. Cubero-Castan, “An optimal multiedge detector forSAR image segmentation,” IEEE Trans. Geosci. Remote Sens., Vol. 36, No. 3, 793–802, 1998.