building and end-to-end system for long term soil monitoring katalin szlávecz, alex szalay, andreas...
TRANSCRIPT

Building and End-to-end System for Long Term Soil Monitoring
Katalin Szlávecz, Alex Szalay, Andreas Terzis, Razvan Musaloiu-E., Sam Small, Josh Cogan,
Randal Burns
The Johns Hopkins University
Jim Gray, Stuart Ozer
Microsoft Research

Motivation for Building a Sensor Network
Monitoring: background data, trends =>
• Soil animal activity/metabolic processes depend on moisture, temperature
• Frequent visits disturb the sites
• Soil respiration, trace gas fluxes
• Better input for terrestrial hydrology models
• CS: Build and learn from a deployed system

Spatio-temporal Heterogeneity of the Soil Ecosystem

Heterogeneity
• Sampling problem
• Scaling problem
• Large scale estimates?

Capturing Heterogeneity at Mesoscale: Wireless Sensor Networks
• Small computers with radio transmitter
• Each connected to multiple sensors (moisture, air and soil temperature, light)
• Automatic data upload

Architecture

Network Design
• Ten mote network
• Each mote
– samples every min
– data stored in FLASH
– status every 2 min, wait for data request
• Single hop network
– Gateway connected to campus network 2m
8m
2m

From Raw Data to Useful Quantities
Temperature SensorCalibration
Temperature SensorCalibration
SoilTemperature
SoilTemperature
Water ContentVolumetric
Water ContentVolumetric
Soil Water Potential->Volumetric ConversionSoil Water Potential->Volumetric Conversion
VoltageVoltage
VoltageVoltage
VoltageVoltage
Moisture sensorA/D units
Moisture sensorA/D units
Reference voltageA/D units
Reference voltageA/D units
Temperature sensorA/D units
Temperature sensorA/D units
CPU clockCPU clock
Air TemperatureA/D units
Air TemperatureA/D units
Light IntensityA/D units
Light IntensityA/D units
TemperatureConversion
TemperatureConversion
Air TemperatureCelsius
Air TemperatureCelsiusUTC DateTimeUTC DateTime
ResistanceResistance
ResistanceResistance
Mote Resistor Calibration
Mote Resistor Calibration
Moisture SensorCalibration
Moisture SensorCalibration
Water PotentialWater Potential
Calibrationsin the Lab
Calibrationsin the Lab

Current Status Olin Deployment
• Operating since Sep 2005
• Over 8M data points
• Winding down

Database/Datacube
• SQL Server 2005 database
• Rich metadata stored in DB
• Adopted from astronomy: NVO
• Data access through web services
• Graphical interface
• DataCube under construction(multidimensional summary of data)

Online Data Access

Measurement
sensor hour
day
week
season
year
all
tenMinute
depth
categoryall
all
all Hour of Day
Day of Season
Week of Season
Season of Year
Patch
Site
all
Sensor Datacube Dimension Model


Lessons Learned: Wireless Sensor Networks
• Network lifetime is predictable • Nodes continue operate despite large
environmental fluctuations – Waterproofing is still an issue
Bathtub test

Lessons Learned: Wireless Sensor Networks II
• Single-hop network: transmission range is considerably shorter than in lab due to foliage– Relay node helps
• Low level programming is still required • Importance of sensor uniformity is essential
– Switch to Echo sensors

Lessons Learned: Data Systems
• We got real data, end-to-end ! • Sensors respond to environmental changes • Database from off-the-shelf components • Getting high level summaries : DataCube
• We need a fully automated pipeline: the current two manual steps are still too labor intensive
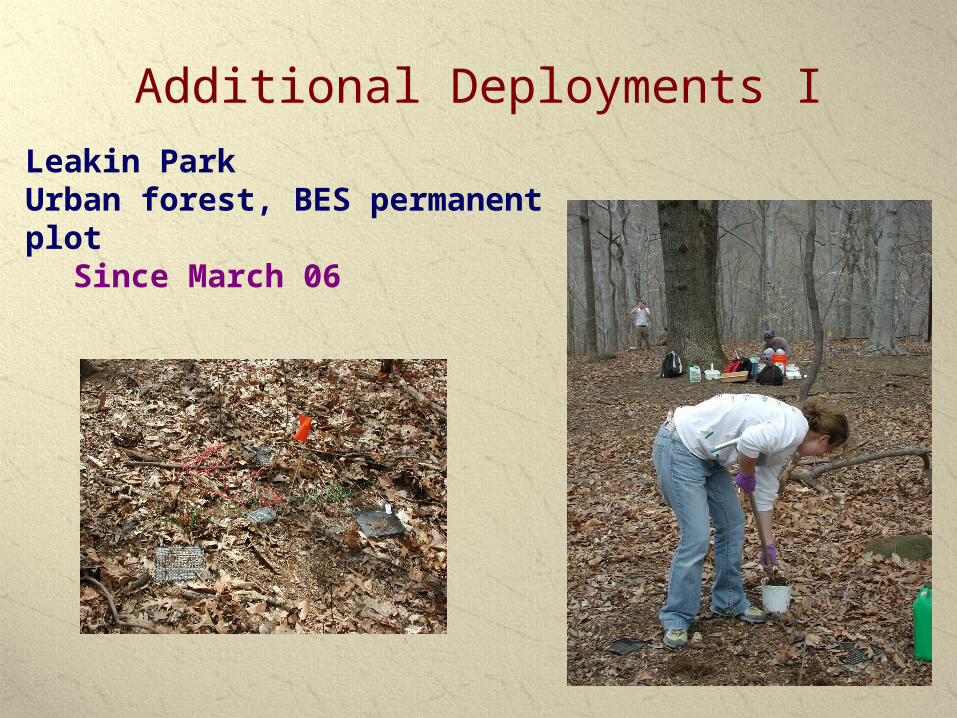
Additional Deployments ILeakin Park Urban forest, BES permanent plot
Since March 06

Additional Deployments II
Baltimore Polytechnic High SchoolTwo days ago

Integration of Sensor Data into Baltimore Ecosystem Study Projects
• Urban-rural gradient studies• Water and Carbon Cycling
– 200 node network at Cub Hill • Ecology of invasive species
– Less fluctuating? More refuges?– Light composition – onset of
reproduction• Spatio-temporal patterns of soil C and
N cycling– Attachment of additional gas sensors

Neighborhood Scale Heterogeneity: Cub Hill
• Many different land use /land management types
• Different soil conditions, soil communities
• Plan: to deploy 200 motes in summer 06
Maps by E. Ellis and D. Cilento, Dept. of Geography, UMBC
CO2 Flux tower

• Microsoft Research
• The Gordon and Betty Moore Foundation
• Seaver Foundation
• Gordon Bell
• Allison Smykel, Katy Juhaszova
Acknowledgement