building a resilient power sector - world business council ...€¦ · building a resilient power...
TRANSCRIPT

Building a Resilient Power Sector

Building a Resilient Power Sector 2
Contents
Interactive map of business cases 3
From the CEOs 4
Introduction 6
1 How can we forecast climate impacts? 12
Weather forecasting 13
Seasonal prediction 15
Climate projections 16
A need to upgrade forecasting capabilities 16
2 What are the climate risks we face? 23
Climate change and demand for electricity 25
3 How should we respond? 26
Two types of risk, two types of response 27
Managing extreme events 29
Longer-term adaptation 41
4 How should we prioritize? 49
Risk cost benefit (RCB) analysis 50
Long-term infrastructure planning 53
Upgrading regulatory frameworks 53
5 What are the lessons learned? 58
Glossary 62 Framework for climate change adaptation in the power sector
Click on each pie of the wheel to read the relevant chapter
How can we forecast climate impacts?
What are the climate risks we face?
How should we respond?
How should we prioritize?
What are the lessons learned?
What are the lessons learned?
How should we prioritize?
What are the climate riskswe face?
How should we respond?
How can weforecast climate impacts?

Building a Resilient Power Sector 3
Interactive map of business casesClick on each icon in the map to read the relevant business case in the report
Technology responsesClick on each icon to go to the relevant table in the report
Transmission and Distribution
Thermal Generation
BiomassNewYork
NewYork
Solar NewYork
Wind NewYork
Hydropower

Building a Resilient Power Sector From the CEOs 4
The evidence of human-induced climate change grows stronger with every scientific report. While action to mitigate rising temperatures becomes increasingly urgent, it is also essential to consider how to adapt to the consequences of global warming. The long-term investment horizons in the electricity industry require an early risk assessment of our assets. We must prepare to maintain supplies in the face of different weather patterns and more frequent extreme weather events, as confirmed by
the Intergovernmental Panel on Climate Change’s Fifth Assessment Report. As members of the World Business Council on Sustainable Development (WBCSD) electric utilities project, we produced this report to share our learning and our understanding of best practice in increasing the resilience of the power sector.
This report analyzes climate impacts on power systems and recognizes that water is central to the industry and to the risks we
face. The interdependencies between water and electricity are growing more complex because most electricity generation requires water, while pumping, moving and treating water requires electricity.
With ongoing climate change, the competition between the different water uses and users will increase.
We are convinced that all utilities need to develop adaptation strategies. The necessary measures depend on the local circumstances of each asset and utility. Assessing a risk-mitigating portfolio of options includes understanding the level of risk, the cost of adaptation measures and the internal and external benefits they provide.
“We must prepare to maintain supplies in the face of different weather patterns and more frequent extreme weather events.”
From the CEOs
Electric utilities must become resilient to climate change

Building a Resilient Power Sector From the CEOs 5
The risks we face are complex – ranging from socioeconomic characteristics of the market to climatic and geographical conditions. While uncertainty is inescapable, a better understanding of the risks is essential if we are to improve risk management and identify the most efficient and cost-effective solutions.
Working together in this project demonstrates our belief that electric utilities and our stakeholders can benefit from pooling our learning, exchanging best practices, sharing resources and encouraging mutual aid. These will be key to developing new business models, climate modeling, technology developments and
pricing and managing risk. It also applies to our cooperation with public authorities and other stakeholders, helping them to plan for improved resilience and adaptation in their businesses and communities. Pooling their technical expertise will also help to assess the risks, costs and benefits to our customers and communities.
Cost efficient adaptation also requires a supportive regulatory framework. Better cooperation with public authorities would
contribute to more functional frameworks. This is especially important to enhance external benefits across sectors as well as appropriate to local circumstances.
Our industry is vital to increasing resilience to devastating events, such as the recent storms in the U.S. and the Philippines. It is imperative that we learn the lessons and work together to develop the kind of robust responses and strategies outlined in this report.
Henri ProglioChairman and Chief Executive OfficerEDF Group
Christian Rynning-TønnesenChief Executive OfficerStatkraft AS
Brian Dames (Eskom)Chief Executive OfficerEskom Holdings
Richard Kendall Lancaster Chief Executive Officer CLP Holdings Limited
Hiroaki Nakanishi Chairman and Chief Executive OfficerHitachi
Henrik O. MadsenPresident and Chief Executive OfficerDNV GL Group
“Electric utilities and our stakeholders can benefit from pooling our learning, exchanging best practices, sharing resources and encouraging mutual aid.”

Introduction

Building a Resilient Power Sector Introduction 7
Climate change is happening and is presenting greater risks for the electricity industry. The IPCC 5th Assessment Working Group 1 report,1 published in September 2013, concluded with more than 95% confidence that human influence has been the dominant cause of the observed warming since the mid-20th century. The atmosphere and oceans have warmed, the amount of snow and ice has diminished, sea levels have risen, and greenhouse gas concentrations have increased.
Along with global warming, there have been a growing number of extreme weather events in the last 30 years, with more heat waves in Europe, Asia and Australia, and more heavy rain in North America and Europe (Figures 1 and 2). Droughts, heat waves and heavy rains are likely to continue becoming more common in many regions.
1 Available at: http://www.ipcc.ch/publications_and_data/ar4/wg1/en/spmsspm-projections-of.html
The Intergovernmental Panel on Climate Change (IPCC) bases its authoritative projections on the most recent scientific literature published, using state-of-the art climate model data.
The fifth Assessment Report published several projections of global climatic changes, based on future concentrations of greenhouse gases in the atmosphere. Global surface temperature change for the end of the 21st century is likely to exceed 1.5°C relative to preindustrial levels for all the IPCC scenarios except one, with projected future warming ranging from 0.3°C to 4.8°C by the end of this century. The expected warming is not uniform across the globe – warming over land and at northern latitudes is expected to be higher than in most other areas. The rise in sea level is expected to accelerate, reaching 0.26m to 0.82m by 2100. Due to higher vapor
content in the atmosphere, heavy precipitation events are expected to become more frequent. Geographical patterns of precipitation are also expected to be affected by changes in high-pressure systems. Increased average precipitation is expected at high latitudes, whereas decreases are projected in subtropical regions. A general drying tendency is foreseen for Northern Africa and the Mediterranean basin, Southern Africa and Central America, whereas higher precipitation is expected for Northern Europe, the northern part of North America (Canada, Alaska) and most of the Asiatic continent.
IPCC, 2013: Summary for Policymakers. In: Climate Change 2013, The Physical Science Basis, Working Group I Contribution to the Fifth Assessment Report of the Intergovernmental Panel on Climate Change.
IPPC climate projections

Building a Resilient Power Sector Introduction 8
Between 1980 and 2012 more than 21,000 natural catastrophes occurred, of which 87% were weather-related. These catastrophes brought 2.3 million fatalities, $3,800 billion USD of overall losses and $970 billion USD of insured losses.2 Most of the increase in economic losses from weather-related disasters over the past two decades can be attributed to socio-economic factors. As populations and economies continue to grow, the total value and human life at risk will increase.
In 2012 alone, natural catastrophes caused $160 billion USD in overall losses and $65 billion in insured losses worldwide, of which 67% were attributable to the US. The highest insured loss was caused by Hurricane Sandy, with an estimated insurance cost of $25 billion USD.
Each disaster has a unique and distressing impact on those it afflicts, but the social and economic effects are often most damaging in developing countries. The UK’s Overseas Development Institute has estimated that economic losses from natural disasters in low-income countries are 14 times higher than in high-income countries as a share of GDP.
2 Munich Re, 2012 Natural Catastrophe Year in Review.
Natural catastrophesFigure 1 Worldwide Natural Catastrophes 1980-2012
Number
1200
1000
800
600
400
200
1980 1982 1984 1986 1988 1990 1992 1994 1996 1998 2000 2002 2004 2006 2008 2010 2012
Geophysical events(Earthquake, tsunami, volcanic eruption)
Meteorological events (Storm)
Hydrological events (Flood, mass movement)
Climatological events (Extreme temperature, drought, forest fire)
Source: Münchener Rückversicherungs-Gelleschaft (2013).

Building a Resilient Power Sector Introduction 9
Typhoon Bopha Philippines, 4-5 December
Typhoon Haikui China, 8-9 August
Floods, flash floods Australia, Jan-Feb
Floods, flash floods Australia, Feb-March
Floods, hailstormsSouth Africa, 20-21 October
FloodsPakistan, 3-27 September
EarthquakeIran, 11 August
FloodsNigeria, July-Oct
EarthquakesItaly, 20-29 May
Hurricane IsaacUSA, Caribbean24-31 August
Hurricane SandyUSA, Caribbean24-31 October
FloodsColumbia, March- June
EarthquakeMexico, 20 March
Severe storms,tornadoesUSA, 2-4 March
DroughtUSA, summer
Hailstorms, severe stormsCanada, 12-14 August
Severe stormsUSA, 28-29 April
Severe stormsUSA, 28 June-2 July
FloodsUnited Kingdom, 21-27 November
Winter Storm AndreaEurope, 5-6 January
Cold waveEastern Europe, Jan-Feb
Flash floodsRussia, 6-8 July
Floods China, 21-24 July
Cold waveAfghanistan, Jan-March
Geophysical events(earthquake, tsunami, volcanic activity)
Meteorological events (storm)
Selection of significant natural catastrophes
Natural catastrophes Hydrological events (flood, mass movement)
Climatological events (extreme temperature, drought, wildfire)
Figure 2 Natural Catastrophes in 2012
The IPCC report re-confirms the urgency of addressing climate change. Businesses will continue to pursue mitigation actions, but also increasingly need to consider adaptation measures in response to the ongoing expected climate impacts.
The experiences of the electricity industry in the last decade highlight the vulnerability of the sector to extreme events. It is necessary to revise current assumptions about weather risk and to develop strategies centered on building climate resilience in the sector and in the countries where the industry operates.
Identification and management of risks that could be detrimental to the achievement of strategic goals and exploitation of business opportunities are fundamental to business. These activities are vital management tasks and their outcomes are important for investors to make holistic and informed investment decisions. Over the past 30 years, there have been growing regulatory obligations on businesses to disclose the risks they face. As such, listed businesses are required to disclose their risk management processes and risks in their annual report.3
3 For example, in Form 10K per the requirements of the SEC in the US and in the semi-annual and annual reports of EU-listed businesses per the EU Transparency Directive.

Building a Resilient Power Sector Introduction 10
Investment decisions in the power sector have long timeframes as the lifetime of the assets varies between 20 to 100 years. Making investment decisions involves anticipating the long-term environment, the needs and constraints under which utilities will operate. This carries large uncertainties; for example, from demographic and economic projections. Decision-makers are used to managing such uncertainty. But climate change is bringing another level of uncertainty that complicates decision-making.
Accurately assessing climate risks is difficult because of the uncertainty in predicting the level, impacts and timing of climate threats. Climate change uncertainties come from three sources:
> Economic and policy uncertainty. It is not clear how emissions of greenhouse gases (GHG) will be affected by demographic and socio-economic trends, technologies and the political commitments.
> Scientific uncertainty. The understanding of the functioning of the complex climate system is still developing. While the link between GHG emissions and global temperatures is quite clear, the impacts at regional levels and the reaction of affected systems (e.g., lakes, glaciers, etc.) are more difficult to predict.
> Natural variability. Given the complexity and interlinked nature of the climate system, climate models can provide statistical information and causal relationships but not a deterministic prediction.
In addition to these uncertainties, rapid urbanisation can exacerbate climate change impact. Indeed, some of the world’s biggest and fastest growing urban conurbations are located on coastal areas, which are now low-lying areas exposed to flooding and storm surges. Their growth is coupled with increasing energy demand, thus increasing pressures on capacity and reducing redundancies in power generation to riskier level. An extreme weather event (or greater frequency thereof) will impact more people and the resulting costs (through lost business, damage to homes, infrastructure and goods) will be higher. Many of those mega cities are located in emerging markets, but others such as New York and London are also exposed, in different ways, and both are cities with ageing infrastructure requiring billions of investment to maintain, let alone upgrade to improve their resilience through adaptive measures.
While uncertainty caused by climate change is unavoidable, electric utilities can manage risks by considering different climate scenarios and potential impacts on their assets, the investments options available and the robustness of the proposed options.
This publication describes the risks and vulnerabilities for the power sector from more frequent extreme weather and progressive climate change, and the measures the sector can take to build resiliency in its operations. The aim is to be proactive and strategic in the face of climate change, becoming more flexible and resilient to the changing environment.
We provide answers to the following questions (see Figure 4):
> How can we improve understanding of weather and climate risks? (Chapter 1)
> Where and from what is the electricity industry at risk? (Chapter 2)
> How will climate change increase the risks in the power sector? (Chapter 2)
> How should the industry respond? (Chapter 3)
> How should the industry prioritize when building resiliency? (Chapter 4)
> What are the lessons learned and future implications? (Chapter 5)

Building a Resilient Power Sector Introduction 11
> Climate change presents growing risks for the electricity industry, with rising temperatures and sea levels, the possibility of more strong winds, heat waves, heavy rain and drought.
> The changes in climate will not be uniform across the globe, varying from region to region. The impacts on the electricity system will be very local.
> Assessing and managing the risks is essential but difficult because of the political, economic, scientific and natural uncertainties in predicting the impacts of climate change.
> Rapid urbanisation in low-lying areas, can exacerbate climate change impacts and increase pressures on the power systems.
> The sector needs to build resilience to extreme events and adapt to the long-term consequences of climate change.
Summary

1 How can we forecast climate impacts?
How can we forecast climate impacts?
What are the climate risks we face?
How should we respond?
How should we prioritize?
What are the lessons learned?

Building a Resilient Power Sector How can we forecast climate impacts? 13
As electricity cannot be stored on a large scale, supply and demand need to be constantly balanced. Both will be affected by climate change, possibly in opposing directions, posing serious forecasting challenges.
Improved climate projections will help utilities to adjust the choice, dimension, design and location of new electricity infrastructure to meet the expected changes in the short, medium and long term.
Three main aspects of prediction are covered in this chapter: weather forecasting, seasonal prediction and climate projections.
Weather forecasting and its implications for the power sector
The large scale development of observation networks, in particular by satellite remote sensing, in the last 20 years, has allowed improvement in forecast quality. Forecast quality has not only improved through more observations, but also by better data assimilation techniques to use the observations, improvements in model representation of physical processes and enhanced computing power. But the atmosphere, and the climate system as a
whole, are by nature chaotic, meaning that there is uncertainty due to the non-linear nature of the underlying relationships. Therefore, while good knowledge of initial conditions is fundamental to begin a forecast, there will still be uncertainty in simulations of how weather will develop.
Electric utilities use weather data and forecasts for several important operational aspects of generation plant, transmission and distribution networks, overall system operation and maintenance across the electricity supply chain. Weather forecasts are also essential for demand forecasting and renewable generation forecasting.
There are challenges in using relatively short historical data series in statistical models. For example, in the case of the Fukushima event, statistical models did not integrate a 16th century tsunami that had the same waves as the event in 2011. Taking account of such long timescales may require models to incorporate data from unconventional sources such as the history of previous centuries. They may even require us to consider the possibility of events that exceed previous limits. This presents a challenge in collecting and interpreting data reliably.
FactThe words “weather” and “climate” are often thought of as almost synonymous but it is important to understand the distinction, which concerns the relevant time scales. Weather refers to the state of the atmosphere at a certain point in time. Weather forecasts aim to predict the state of the atmosphere, usually over a period of just a few days to weeks. Climate describes the results of many weather events over a longer period, from seasons to years. Both terms refer to several variables: temperature, humidity, precipitation, cloud cover, visibility, wind, etc.

Building a Resilient Power Sector How can we forecast climate impacts? 14
Are historical data reliable for risk assessment?In the context of severe weather, risk assessment is usually based on historic experience with the frequency and severity of storms, e.g., the 100-year precipitation event at a specific location, or the maximum level at which equipment has been exposed to flooding. Figure 4 demonstrates that relying only on historical data when planning for resilience can result in misunderstanding risk levels, particularly when the frequency and intensity of events is changing. In 2012, Super Storm Sandy resulted in the flood height at Battery Park in New York City several feet above the highest levels experienced in the previous century. Based on
historical records, infrastructure planners did not establish, and logically would not have established, a design basis for infrastructure protection that included the possibility of such an event. While Sandy was clearly outside previous experience, it is difficult to estimate the likelihood of such a storm occurring in the future. This uncertainty—which is magnified by climate change—is at the heart of the dilemma facing decision-makers.
Figure 3 Super Storm Sandy created flood heights several feet above historic highs

Building a Resilient Power Sector How can we forecast climate impacts? 15
Forecast accuracy naturally decreases with the length of the forecast. Detailed forecasts cover periods of just a few hours up to 4 days. Medium-term forecasts range from 3-4 days to 10-15 days. Longer-range forecasts (from a month to a season) are also available but they are generally less reliable. The predictive skills varies in time – under certain atmospheric flow regimes, the predictive ability is higher than average (e.g., blocking high pressure systems).
Weather forecasting is important for routine operations, optimizing production in response to expected energy demand. But it becomes essential during an extreme climate event such as a hurricane, flood, heavy snowfall, heat or cold wave. Better warning of such severe events will make it possible to better manage the demand and supply, including mobilizing recovery teams in advance and turning off network components such as transformers in case of flooding.
Managing demand requires an understanding of the different needs for power (such as heating, cooling, communications). But it is also necessary to
understand the contribution of electricity in the management of the crisis and the potential speed of recovery following any breakdown – events such as floods can take some time to dissipate. All this requires short-term forecasts with very high resolution, especially around critical locations such as power plants, rivers and towns. There is significant potential for electricity utilities to collaborate with national meteorological and hydrological services, to pool learning and exchange best practices to improve crisis management using weather forecasting.
Seasonal prediction
Seasonal predictions aim to capture the average characteristics of weather for periods of a few months, typically at the regional scale (e.g., Western Europe, Central America). Seasonal predictability depends on both initial conditions of the atmosphere, land and oceans, as well as how these components of the Earth system interact over time at their boundaries. The accuracy of these predictions depends in particular on the ability to reproduce and predict air-sea interactions.
Seasonal predictions are now made routinely at a number of meteorological centers around the world, using comprehensive models of the atmosphere, oceans and land surface. The non-linear nature of the climate system makes these forecasts sensitive to uncertainty in both the initial state and the model used for their formulation, which is unable to simulate every single aspect of the climate system. Models also struggle to incorporate physical processes that are active at smaller scales (e.g., convection, cloud physics, mixing). These aspects must be included using relationships based partly on actual observed patterns.4
Huge efforts have led to improved seasonal forecasting, but the predictability of the climate season one season ahead remains moderate, especially in mid-latitudes, including the North Atlantic and Europe. Recent studies have shown some potential improvements in predictability, in particular with variables linked to the water cycle, such as river flow and soil humidity.
4 Van der Linden P., and J.F.B. Mitchell, 2009: ENSEMBLES: Climate Change and its Impacts.

Building a Resilient Power Sector How can we forecast climate impacts? 16
Climate projections
The long-term effects of climate change are important for the design and retrofitting of long-lasting infrastructure. Climate projections provide estimates of these effects by modeling future weather events over long time periods, taking account of changes in climate. A typical period for simulations is 100 or several hundred years.
Because the atmospheric concentration of greenhouse gases has reached levels never observed over the past 800,000 years, modeling future climate is moving from the use of historical data to simulating the behavior of the Earth system under various conditions. State-of-the art Coupled General Circulation Models (GCMs) provide projections of future climate based on various potential emissions scenarios and can be “downscaled” to produce local assessments of climate.
Unlike weather forecasting, the accuracy of climate projections does not strictly depend on the initial conditions used. Instead, climate projections mostly depend on climate forcing trends: the interaction of the atmospheric, terrestrial and ocean carbon sinks, clouds and various feedback mechanisms. These are boundary conditions that act on the atmosphere, such as solar radiation, ocean temperature, volcanic eruptions, concentration of greenhouse gases, plus all the energy and biological exchange processes taking place between the different components of the Earth system. GCMs or Coupled Earth System Models have evolved into a more complete representation of the Earth system, incorporating climate feedbacks among different components of the environment and carbon cycle processes.
A need to upgrade forecasting capabilities
Long-term forecasts are important because investments in the power sector are long term – power plants and grids often have life-spans of more than 40 years.
The evolution of climate change substantially increases the complexity and risk involved in long-term investment decisions, making it necessary to revisit meteorological modeling with higher resolution – both temporal and spatial – to support relevant business decision-making.
Utilities need improvements in forecast quality and reliability to reduce the gaps between predicted and observed weather patterns. This is particularly important for air temperature, given its impact on demand, and for rainfall, which influences hydropower production and water resources for cooling. The strong development of renewable generation in many countries increases the dependence of power systems on weather variability, making accurate weather forecasts even more important.

Building a Resilient Power Sector How can we forecast climate impacts? 17
To develop more reliable forecasts, utilities need access to climate data and hydrological information such as soil moisture, groundwater, runoff and evaporation. They also need to develop the skills to interpret the information and understand how the uncertainty associated with climate change affects their operations. Very local forecasts are needed for time periods short enough to be relevant to business decision-making. Dedicated portals that give access, in a business-friendly format, to weather data, climate change science and research would help utilities and businesses understand and be better prepared to implement measures.
Modern GCMs are comprehensive models of the climate system that combine atmosphere, ocean and land models to account for the interactions taking place in the environment. Sub-models describing vegetation, carbon cycle or sea ice dynamics are also commonly incorporated in the models. The atmosphere and the oceans are divided into grid cells with a typical size of 150 to 300 square kilometers, equivalent to nearly two degrees in latitude and longitude. Other important atmospheric processes occurring at lower scales than the grid cells size, such as moisture convection and cloud formation, are incorporated into the GCM as additional equations. Such complex modeling requires approximations, which in turn introduce uncertainties in the projections.
The low spatial resolution in these models means that they cannot take into account local climatic features that drive local impacts, such as topography, land-sea boundaries, vegetation cover, cloud formation and local precipitation. As a result, GCMs are not very useful directly in local impact assessments. The most common alternative is “downscaling”, which increases the resolution to include local effects. International downscaling efforts aiming to generate worldwide downscaled climate datasets for large areas of the world are currently coordinated within the CORDEX program (Coordinated Regional climate Downscaling Experiment).
Global Climate Models (GCMs) and downscaling

Building a Resilient Power Sector How can we forecast climate impacts? 18
Climate and energy are intrinsically entwined. The climate drives our need for energy for many purposes including, but not restricted to, heating and cooling, transport, agriculture and production. Also, especially with respect to renewable energy, climate plays a major role
in determining the availability and amounts of energy that can be generated. For other parts of the energy sector, climate is also important in the design and operation of infrastructure that supports the energy industry – for example, transmission lines, nuclear power plants, and dams in support of hydro-power generation and others. Availability of energy is arguably one of the key factors in our future sustainable development.
The World Meteorological Organization has created the Global Framework for Climate Services (GFCS) to enable society to better manage the risks and opportunities arising from climate variability and change, especially for those who are most vulnerable to such risks. This will be done through development and incorporation of science-based climate information and prediction into planning, policy and practice. The greatest value of the GFCS will occur incrementally through the delivery of a multitude of climate services at national or local levels. The GFCS comprises the following components:
> User Interface Platform – to provide ways for climate service users and providers to interact and improve the effectiveness of the Framework and its climate services
> Climate Services Information System – to produce and distribute climate data and information according to the needs of users and to agreed standards
> Observations and Monitoring – to develop agreements and standards for generating necessary climate data
> Research, Modeling and Prediction – to harness science capabilities and results to meet the needs of climate services
> Capacity Building – to support the systematic development of the institutions, infrastructure and human resources needed for effective climate services
Source: World Meteorological Organization.
Global Framework for Climate Services
Users
Capacity development
User interface platform
Climate Services Information System
Observations and monitoring
Research, modeling and applications

Building a Resilient Power Sector How can we forecast climate impacts? 19
Business case 1
Adapting weather forecasting to climate changeStatkraft uses weather forecasting for operational decisions and long-term planning. In operations, the company has used historic data going back to 1931. However, at the end of the 1990s, analysts recognized a systemic change in climatic conditions which made earlier data less relevant. The seasonal profile of rain and snow in Norway is changing, with lower spring floods and more winter precipitation. This is now incorporated in Statkraft models. The length of historic data series was adjusted to reflect the changes and to be more appropriate for forecasting future precipitation. The Norwegian authorities recognized the value of this approach and recommended basing projections on the period 1980-2010 instead of 1960-1990. For long-term planning purposes, Statkraft uses the historical data, but in conjunction with global emission scenarios and global climate changes. The models typically run to 2100 for estimating precipitation and the life of an asset.
EDF has measured the temperature of the river Rhone and its tributaries since 1977 and this historical data has enabled modeling of future scenarios. The water temperature has increased significantly since the 1970s – by an average 1 to 2˚C, with higher increases downstream and in spring and summer, except on sites subject to glacial or snowy inflows.
EDF has modeled hydrological and thermal systems of the Rhone river basin to 2030, 2050 and 2085. This includes stratification of Lake Léman (commonly known as Lake Geneva), water resources in Switzerland, the operation of nuclear facilities and regional climate simulations over the next century.
The simulations highlight the sensitivity of systems to the rise in temperature. Changes in thermal systems could increase the mean water temperature by up to 1 degree by 2030, and up to 3°C by the end of the century. Expected reductions in the snow level and the timing of snow cover will reduce electricity output (thermal and hydro) by half in summer and by 10% in fall by 2030 and by 40% in fall by 2085. Production will increase in winter, but the extent is uncertain. By the end of the century, the total flow could decrease by 10%.
Business case 2
Climate projections in the Rhone River

Building a Resilient Power Sector How can we forecast climate impacts? 20
Statkraft has cooperated with the Norwegian meteorological institute since 2009 to better understand the effects of climate change on precipitation and temperature in the Nordic countries. Various global and regional meteorological models have been tested and the downscaling methods have been improved to translate the global climate change effects to a more appropriate scale for basin scale studies. In the Nordic countries the changes in climate will have a significant effect on the snow conditions in the mountain basins. This will strongly
influence the operations of the high mountain hydro plants and will also cause changes in the seasonal pattern of runoff. Statkraft has worked with the Norwegian Water Authority on methodologies for forecasting changes in temperature and precipitation to understand the consequences of climate change for stream flow and runoff. The company has studied the consequences of climate change for the inflow to reservoirs since the 1990s and has adjusted simulations and planning of operations as well as long-term price forecasts.
Business Case 3
Understanding climate change in Nordic countries
A weather monitoring and modeling tool called Geriko enables ERDF, EDF’s distribution networks subsidiary, to evaluate the weather risks for the network two or three days in advance (storms, winds, wet snow, ice, etc.). For instance, Geriko warned about Storm Joachim in December 2011, allowing ERDF to put staff on stand-by. The storm left 700,000 customers without power but the advance warning meant that 95% had service restored within 24 hours.
Business Case 4
The weather with Geriko

Building a Resilient Power Sector How can we forecast climate impacts? 21
Electricity companies are working with National Meteorological and Hydrological Services (NMHSs) and scientists to improve their understanding of how weather and climate affect their facilities. Partnership and collaboration between providers and users of weather and climate services is necessary to develop and tailor the specific products useful to the electricity sector.
EDF has been working closely with Météo-France and other institutions for more than 30 years, and this collaborative model has led to many improvements in operational applications. Several initiatives are developing the link between energy and meteorology. Among them, the International Conference, Energy & Meteorology (www.icem2013.org) supported by CSIRO and EDF among others, aims to:
> promote interaction between experts and service providers engaged in weather and climate research and product development for the energy industry;
> discuss frameworks for managing weather and climate risk, including in the face of projected climate change;
> improve approaches to sharing information on best practice in energy, weather, and climate risk management processes, especially between developed and developing countries.
Statkraft has also been cooperating with the national Norwegian meteorological institute for several years to improve the short-term forecasts and benefit the company’s high mountain hydro plant operations. One of the institute’s meteorologists works in Statkraft’s forecasting center every morning, preparing data and making special forecasts to support the company’s planning. To make hydrological forecasting models more reliable and timely, Statkraft has established more than 120 hydro-meteorological observation stations in the mountain basin, transmitting data to the forecasting center every hour.
Business case 5
A collaborative approach

Building a Resilient Power Sector How can we forecast climate impacts? 22
> Improved climate projections and weather predictions are necessary to help utilities understand the climate impacts at local levels and adapt infrastructure to meet expected changes in climate and extreme weather events.
> Weather forecasting is important for routine operations, balancing production and demand, and is essential to provide warning of an extreme event such as a hurricane, making it possible to better manage demand and supply, prepare a response and thus accelerate recovery times.
> Climate projections provide estimates of the long-term effects of climate changes for periods up to 100 years and are typically at a regional rather than local level.
> Utilities need improved models that downscale global information to the local level. They also need tools and skills to interpret the information and understand how the meteorological uncertainty affects their current and future operations.
Summary

2 What are the climate risks we face?
How can we forecast climate impacts?
What are the climate risks we face?
How should we respond?
How should we prioritize?
What are the lessons learned?

Building a Resilient Power Sector What are the climate risks we face? 24
As the world faces the deep climate uncertainty described in the introduction, electric utilities and decision-makers must determine the potential impacts, evaluate the investment options available, and select the most cost-efficient solutions that will make the power system more resilient.
The power sector has always been affected by the physical impacts of climate, including extreme events. But the sector faces new and enhanced risks. The past two decades have seen greater scale and frequency of extreme events and the last three decades have been successively warmer at the Earth’s surface than any preceding decade since 1850.
While the general effects are global, the specific impacts will be local and affect each technology and asset class differently (see table 1). They may also be unpredictable, especially if, for example, two or more disturbance factors interact, creating compound effects that lead to unforeseen phenomena.
The evidence suggests that the long-term consequences of climate change for the electricity industry may be substantial in some regions. Just 1°C of warming by 2040 will reduce available electricity-generating capacity in summer by up to 19% in Europe and 16% in the U.S. because of cooling constraints.5 This will either require additional capacity or a greater demand-side response at peak times. Both would have implications for the transmission and distribution system, requiring investment for extensions or for upgrading equipment.
Electricity grids will also be affected by strong winds, freezing rain and ice storms, which are all projected to occur with greater frequency and intensity. The extent of potential impacts can be seen from experience in the North American winter storm of 1998, when about 130 transmission towers and 30,000 utility poles collapsed due to ice and wind.6 Weather-related disturbances to the electricity network in the U.S. have increased ten-fold since 1992 and, while weather events accounted for about 20% of all disruptions in the early 1990s, they now account for 65%.7
While individual weather events cannot be linked directly with climate change, the frequency and extent of extreme events is a clear consequence. The impacts on the electricity industry and the uncertainty are the most problematic aspects of climate change for electricity utilities. It seems clear that some risks previously considered as being once in a 100 years event need to be upgraded because the probability is increasing. An added dimension is that any event may be very different from previous experience.
These developments emphasize that utilities need to change the way they design and manage power infrastructure to make it more resilient, as well as improving management of specific weather-related risks and crises.
5 The availability of cooling water and the limits on water discharge as a consequence of maximum river temperatures (WEO, 2013)6 Nuclear Technology Review, IAEA, Vienna, 2009, available at: http://www.iaea.org/Publications/Reports/ntr2009.pdf7 WEO, 2013

Building a Resilient Power Sector What are the climate risks we face? 25
Climate change and demand for electricity
The electricity industry will need to cope with changes in demand as well as the direct impacts of climate change on supply. More variable weather patterns will result in greater volatility in demand, increasing peak loads and capacity requirements. The geography of demand will also change if climate change leads to substantial migration of people. Flooding of low-lying areas and reduced availability of water in others may result in large-scale population movements, adding to increased power needs in some areas but making infrastructure redundant in others.
Electricity users will also be affected by extreme events, and will experience the consequences of system vulnerabilities. Their ability to return to normal life will impact the demand for energy after a supply disruption.
8Modeling the impacts of climate change on the energy sector: a Swiss perspective, C. Gonseth and M. Vielle, EPFL and Swiss Climate Research Working Paper, 30 May 20129Climate Cost, the Full Cost of Climate Change, FP7 project, http://www.climatecost.cc/10WEO2013
Fact International Energy Agency (IEA) projections10 suggest that an average global temperature increase of 2°C by 2050 compared to preindustrial levels will change demand for cooling and heating enormously. Demand for cooling could increase by 170% between 2010 and 2035 (compared to a 145% projection without considering climate change) and 220% by 2050 (compared to 175%). The largest change in cooling demand as a result of climate change would be in China, followed by the United States, Middle East and India. The increased need for air-cooling would be felt in rising demand for electricity, which would pose particular challenges for power system stability during heat waves.
Fact Overall changes in temperature and water volumes resulting from climate change will hit output by reducing average generation and transmission efficiencies. A study focusing on Switzerland8 indicated the potential scale, estimating that thermal power plants will lose 4.4% of capacity by 2050 because increased river temperatures will reduce generating efficiency, while 2.2% of hydroelectricity production will be lost due to reduced runoffs. A European Union study of nuclear generation9 found that climate change would result in aggregated output losses of up to 5% by 2100, representing a loss of up to 150 TWh.

3 How should we respond?
How can we forecast climate impacts?
What are the climate risks we face?
How should we respond?
How should we prioritize?
What are the lessons learned?

Building a Resilient Power Sector How should we respond? 27
Two types of risk, two types of response
It is essential to recognize that climate change presents long-term as well as short-term risks, each of which requires different responses.
Table 1Risks and responses
Extreme events will create storm surges, heavy downpours, heat waves and high winds. Storm surges could be the greatest of these hazards for power infrastructure, much of which is close to the sea and faces increasing flood risks. Heat waves represent a major risk for infrastructure, water temperature and availability, and will increase cooling demand as customers respond to higher temperatures.
Longer-term impacts. Gradual changes in climate will raise sea levels and average temperatures, and affect precipitation volumes, with consequences for all links in the value chain (see Figure 5). Higher temperatures will be particularly significant because they will reduce operating efficiency.
Crisis planning focusing on daily operations, including maintenance, operating parameters, damage limitation and operations management. It covers advance preparation and rehearsal of emergency plans, including lessons learned from reviews of previous crises.
Long-term planning to identify changing system requirements resulting from potential impacts and scenarios. Risk and cost assessment to prioritize action. This includes decisions about the remaining lifetime for existing assets, whether retrofitting or refurbishment is necessary, and about new or enhanced specifications and locations for new capacity.
Risks Responses
Long-term adaptation
Click on the text above to go to the relevant chapter in the report
Click on the text above to go to the relevant chapter in the report
Resilience

Building a Resilient Power Sector How should we respond? 28
Table 2 provides an indicative summary of potential impacts of climate hazards on the electricity supply chain. Some of these impacts can cover a broad geographic area (e.g., changes in temperature), others might be highly site specific (e.g., changes in wind speed or water availability).
The magnitude of impact will vary by location and by event. The relationship among the risks is not linear. For example, there are feedback loops between consumer demand and capacity on the supply side. If the public infrastructure is not resilient it may not be possible for critical staff to reach stations for repairs during an extreme weather event.
Air temperature
Water temperature
Water availability
Wind speed
Sea level
Floods
Heat waves
Drought
Storms
Table 2 Potential climate impacts per asset class
Thermal Hydro Wind/PV Biomass Lines Stations
CustomersGeneration T&D
Source: Adapted from Asian Development Bank (2012).
Impacts

Building a Resilient Power Sector How should we respond? 29
Figure 4 Response to extreme events
Managing extreme events
Appropriate responses to the risks of extreme events will be part of planning for longer-term climate change. In both cases, utilities’ responses will be based on risk assessments incorporating the best available information about the expected impacts in different regions. (See chapter 4: Risk Cost Benefit Analysis)
Each electric utility will develop a specific approach to managing extreme events, based on five common elements. Response
to extreme events
Inform stakeholdersRespond
PlanRecover
Anticipate
Click on the circles in Figure 4 to go to see the detail of eachs element

Building a Resilient Power Sector How should we respond? 30
AnticipateAnticipate events – requiring improved forecasting and modeling tools (see chapter 2) to assess which assets are at risk, the nature of the hazards, and appropriate solutions.
Steps
> Decide which IPCCC scenarios use, downscaling models to local conditions and analyze potential impacts for the company assets and operations
> Optimize data exchange networks to improve modeling
> Create in company systems to ensure consistency
> Establish and improve crisis management plans
> Create information channels with stakeholders
During the heatwaves that affected France in 2003 and 2006, nuclear power plants continued to comply with safety and operating rules. However, due to high air temperatures over long periods, the increased temperatures of the river water used for cooling resulted in decreased power, and even shutdown to comply with the temperature limits in French regulations. Lost generation amounted to approximately 5.5 TWh in 2003 and 2.5 TWh in 2006.
Following this experience, and with the prospect of more such extreme events due to climate change, EDF initiated the “heatwave project” in 2008. This project incorporates a review every 5 years of climate changes (air and water temperatures) and their consequences for structures, systems and components. Modifications designed to strengthen plant robustness have been identified, relating to both nuclear and conventional safety, mainly to increase effective cooling.
Business case 6
Adapting nuclear plants to higher temperatures

Building a Resilient Power Sector How should we respond? 31
DNV GL, a worldwide firm specializing in assessment and management of risk in the energy sector, is developing a framework for evaluating risks associated with climate change and the optimal allocation of financial resources to enhance power system resilience. The framework takes a risk management approach, addressing the following questions:
> What storm hazards should we plan for?
> How will a changing climate alter the frequency, intensity, and location of extreme weather events?
> How could the electric grid be impacted?
> What are the consequences of those impacts?
> What can we do to prevent damage to the grid?
> How can we minimize consequences of electric grid failure?
> What are the investments with the greatest return?
In 2013, DNV GL made a case study of the Long Island, NY, power system, which was severely impacted by Superstorm Sandy. The case study is evaluating scenarios of future climate hazards on Long Island, and how a variety of adaptation measures could reduce losses from those hazards. DNV GL is working with the U.S. National Center for Atmospheric Research to provide projections of potential hazards associated with climate change, based on state-of-the-art climate modeling. Advanced risk analysis methods are used to provide robust, transparent, scenario-based analysis of risks and adaptation options.
Climate modeling results show that the impacts of a Sandy-like storm system occurring in a warmer world would be different in several ways.
Significantly, the storm would take a more northerly track, with landfall occurring closer to or directly on Long Island. The resulting storm surge on Long Island would be greater than with Sandy, exposing more assets and infrastructure to potential damage. Precipitation would also be greater and wind speeds after landfall would be higher.
Transmission lines on Long Island are not expected to be significantly damaged, as current equipment should be able to withstand the additional wind speeds. But substations would see substantially increased exposure. There would be higher water levels at 12 substations that were flooded during Sandy, and several additional substations would be flooded.
The risk of outages due to flooding can be mitigated by raising the level of equipment in the substations. The analysis identified substations at risk in the future Sandy scenarios, as well as the level of flooding at each substation, allowing analysts to determine the most effective storm-hardening strategy for each substation. Raising the level of equipment at some substations would be sufficient, while others should be relocated to less vulnerable locations.
Business case 7
Climate risk analysis and adaptation planning

Building a Resilient Power Sector How should we respond? 32
Eskom reviewed its recent experience to assess vulnerable areas and weather-related risks to its infrastructure and processes. The investigation into the impact of historical weather events initially covered two power stations, the North East Transmission Grid and Eastern Region Distribution. It aimed to identify thresholds beyond which the system would fail, measures in place to cope with the impact of extreme weather, the costs of adaptation and the risks of more frequent events or different kinds of extreme weather.
A wide range of weather events was identified (see table 3). Eskom concluded that regular reporting of such events is necessary, particularly at the most vulnerable and high-risk areas of the business, to inform future design and planning for weather risks.
Business case 9
Investigating impacts and responding to vulnerabilities
Statkraft is considering constructing a hydropower plant on the Devoll River in Albania. The river is important for irrigation downstream and Statkraft is investigating how new dams can help adaptation to predicted reductions in precipitation due to climate change. The river flow is highly variable and cannot always meet irrigation needs, while occasional floods erode arable land. Albania is predicted to become drier, possibly further affecting agriculture downstream. Statkraft is working with the agricultural authorities to investigate how the reservoir can help downstream agriculture by creating more stable flows and better flood control.
Business case 8
Using hydropower to help agriculture
Fact The Medupi and Kusile power stations in South Africa will be the largest dry-cooled coal-fired power stations in the world (4.8GW each). In Flamanville, France, a desalination plant replaced freshwater sources with seawater.

Building a Resilient Power Sector How should we respond? 33
Impacts
> Wet coal causing blockages and lower output> Overflowing dams
Increased condenser and vacuum temperatures resulting in lower plant efficiency
Damage to stack pollution monitors
Shortage of water from 3 dams
> Vegetation growth interfering with the lines and possibly resulting in fires
> Corrosion of towers submerged in water for longer periods
Flashovers on the substation transformers, resulting in tripping
Conductor sagging, possibly causing fires
> Substations and lines damaged > Foundations of towers compromised
> Clashing conductors often result in fires> Poles and towers collapse
Traction substations that supply railway lines are impacted
Table 3 Risks, impacts and adaptation in South Africa
Current adaptation measures
> Alter coal usage> Increase capacity, improve pipes and liners, re-use more water
> Use more coal to get the same MW output> Apply for license waiver for high emissions
Use lightning arrestors
Use water from reservoirs pumped from Vaal River, requiring cleaning
> Cut grass more frequently > Improve foundations and use stainless steel material to reduce
corrosion
> Coat insulators with silicone > Use water repellent composite polymer insulators > Increase insulators sheds spacing> Install shed extenders
> Increase the height of the tower > Reduce the spans > Increase the tension of the conductors > Use steel instead of wood poles
> Increase the elevation of the substations> Improve foundations
> Increase the tension of conductors > Use steel instead of wood poles
> Increase the distance between the coast and the substations/lines
Weather risk
Heavy rain
High temperatures
Lightning
Drought
Heavy rain
Ice and mist
High temperatures
Floods
Storms
Sea swells
Transmission and Distribution
Distribution
Generation
Building a Resilient Power Sector How should we respond? 34
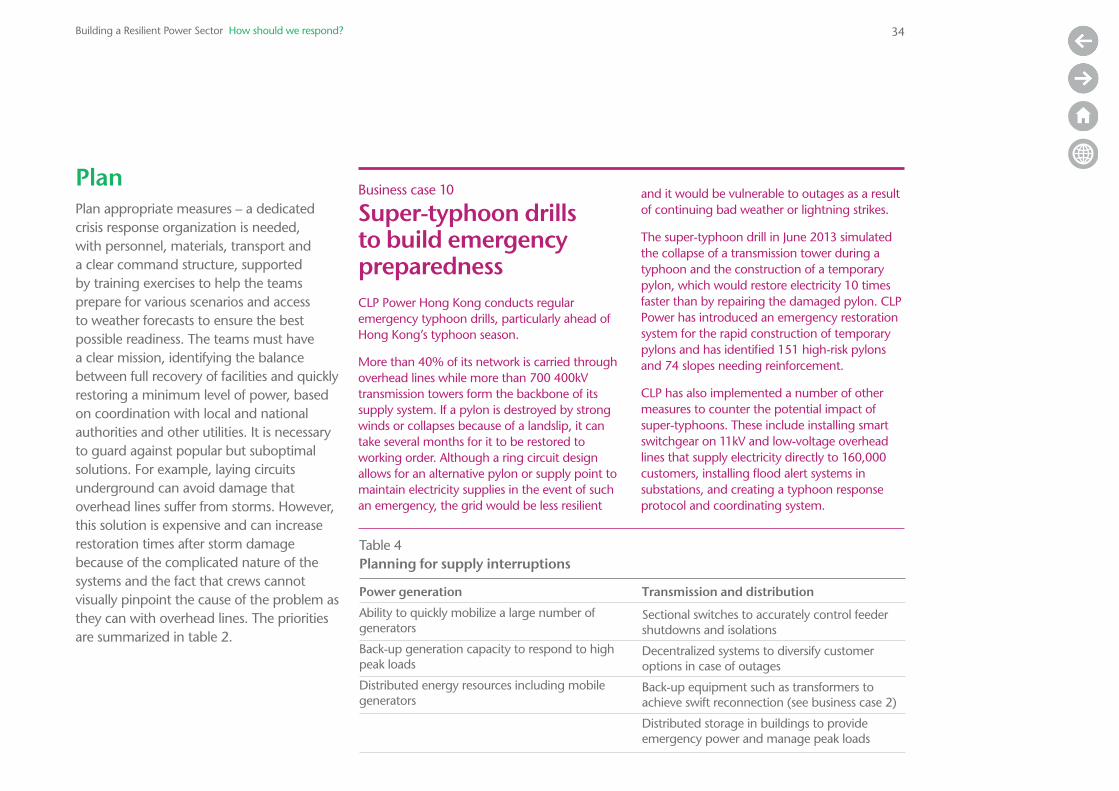
Plan
Plan appropriate measures – a dedicated crisis response organization is needed, with personnel, materials, transport and a clear command structure, supported by training exercises to help the teams prepare for various scenarios and access to weather forecasts to ensure the best possible readiness. The teams must have a clear mission, identifying the balance between full recovery of facilities and quickly restoring a minimum level of power, based on coordination with local and national authorities and other utilities. It is necessary to guard against popular but suboptimal solutions. For example, laying circuits underground can avoid damage that overhead lines suffer from storms. However, this solution is expensive and can increase restoration times after storm damage because of the complicated nature of the systems and the fact that crews cannot visually pinpoint the cause of the problem as they can with overhead lines. The priorities are summarized in table 2.
Transmission and distribution
Sectional switches to accurately control feeder shutdowns and isolations
Decentralized systems to diversify customer options in case of outages
Back-up equipment such as transformers to achieve swift reconnection (see business case 2)
Distributed storage in buildings to provide emergency power and manage peak loads
Power generation Ability to quickly mobilize a large number of generators
Back-up generation capacity to respond to high peak loads
Distributed energy resources including mobile generators
Table 4Planning for supply interruptions
CLP Power Hong Kong conducts regular emergency typhoon drills, particularly ahead of Hong Kong’s typhoon season.
More than 40% of its network is carried through overhead lines while more than 700 400kV transmission towers form the backbone of its supply system. If a pylon is destroyed by strong winds or collapses because of a landslip, it can take several months for it to be restored to working order. Although a ring circuit design allows for an alternative pylon or supply point to maintain electricity supplies in the event of such an emergency, the grid would be less resilient
and it would be vulnerable to outages as a result of continuing bad weather or lightning strikes.
The super-typhoon drill in June 2013 simulated the collapse of a transmission tower during a typhoon and the construction of a temporary pylon, which would restore electricity 10 times faster than by repairing the damaged pylon. CLP Power has introduced an emergency restoration system for the rapid construction of temporary pylons and has identified 151 high-risk pylons and 74 slopes needing reinforcement.
CLP has also implemented a number of other measures to counter the potential impact of super-typhoons. These include installing smart switchgear on 11kV and low-voltage overhead lines that supply electricity directly to 160,000 customers, installing flood alert systems in substations, and creating a typhoon response protocol and coordinating system.
Business case 10
Super-typhoon drills to build emergency preparedness

Building a Resilient Power Sector How should we respond? 35
A public-private consortium in the U.S. has developed a Rapid Recovery Transformer, or RecX, that can be up and running in less than a week, drastically reducing the recovery time after a transformer has been damaged.
High-voltage transformers, which are the most vulnerable components in the grid, can take months to replace if they are built from scratch. They generally weigh hundreds of tons and are usually too large to transport by road. The RecX consortium – ABB, the U.S. Department of Homeland Security, the Electric Power Research Institute and CenterPoint Energy – built a modular transformer that is transportable and quick to install without diminishing performance and reliability.
The first prototype “spare tire” transformers were built by ABB in its St. Louis factory and installed at a CenterPoint Energy substation in Texas in 2012. During six days in March, an emergency drill successfully disassembled, loaded onto flatbed trucks, moved, deployed and energized three single-phase, fast-recovery transformers. This included re-assembling the cooling systems, conservers and bushings and connecting to the grid.
A year’s testing followed, during which the units functioned well and demonstrated that the RecX design is a suitable replacement in an emergency for more than 90% of the transformers in its voltage class.
CenterPoint Energy received a Technology Transfer award for its work with this project from the Electric Power Research Institute (EPRI).
Business case 11
Rapid Recovery Transformers in the United States
Business case 12
Improving the resilience of renewable generationJapanese government concerns about climate change and the risks to public infrastructure from climate-related disasters. Hitachi has developed new technology to prevent large scale blackouts, aiming to maximize the total capability of the existing transmission lines, optimizing transmission and distribution (T&D) investment and using automatic controls to prevent wide area system failure. If a transmission line in a power grid with substantial renewable energy is cut off because of a natural disaster, the diversion of power route may cause overloads in other transmission lines. As a result, blackouts may occur over a wide area.
Hitachi considers IT and T&D systems will play an important role in the resilience of the power transmission sector. Hitachi is participating in various demonstration projects in Japan and countries including the U.S. to provide solutions by combining IT and T&D systems.

Building a Resilient Power Sector How should we respond? 36
InformInform stakeholders – the relationship between customer and utility can play an important role in developing response plans. Dialogue with electricity consumers, businesses and local authorities is necessary to explain how they will be affected by climate change and the choices for addressing those impacts, to identify local needs and priorities and to capture the interactions and linkages to build resilient communities.
Steps
> Raise awareness on risks and energy demand management solutions to individuals, local authorities and company staff.
> Explain the rationale for selective power cuts and remind of regulation for backup generating system, especially for hospitals
> Create a list with the local authorities of priority users
In the southern U.S., Entergy partnered with Americas Wetland Foundation (AWF) creating Blue Ribbon Resilient Community Leadership Forums (BRRC). They worked with local universities to hold technical conferences with customers to discuss vulnerabilities and develop appropriate responses, taking account of customers’ resiliency efforts.
The objective was to create awareness, identify vulnerabilities, and plan for ways to build more resilient Gulf Coast communities. The goal was to engage the communities and establish consensus on economically sensible approaches to minimize service interruptions.
The Forums in 11 communities created dialogue with a total of more than 1,000 community leaders. Discussions covered local coastal issues and specific vulnerabilities, and educated the participants on risk mitigation options. Before each Forum, AWF used a focus group and interviews to understand each community’s values, to learn where they felt vulnerable, what they have done to become more resilient, what they expect from
their utility and to generate a resiliency index for each community. Entergy contributed the results of a study quantifying the economic value of what is at stake for each community, establishing the magnitude of the risk.
An important outcome of this initiative was community empowerment. The Forums mobilized the energy, expertise and dedication of the region to protect its heritage and secure its future.
The conferences considered how to manage risks and any joint action that would make the communities safer and more prosperous. This engagement established a consensus on economically sensible approaches to minimize service interruptions. Insights from stakeholders helped to generate dozens of recommendations that influenced state and federal policies as well as the utility’s plans.
More information at: www.futureofthegulfcoast.org/
Business case 13
Blue Ribbon Resilient Community Leadership Forums

Building a Resilient Power Sector How should we respond? 37
RespondRespond to the crisis – teams must be ready to improvise around planned responses, as the specific circumstances may not have been anticipated by the local and national government emergency plans. Flexibility is essential to adjust priorities and action as the situation changes, probably quite rapidly. Good communications are essential, so that leaders know what is happening from moment to moment and where key personnel are.
Steps
> Extended mutual assistance
> Enhanced communications
> Improve coordination with local authorities
> Organize managed rotating blackouts avoiding network collapse risk
During the major storms in the winter of 1999, EDF had to face an unprecedented level of network destruction. It took over two weeks for network repair operations to reconnect the 2.2 million customers affected. To avoid a repetition, the authorities set an objective for distributors to “ensure the delivery of power to at least 90% of customers within five days of the occurrence, including in the case of an exceptional weather event of similar amplitude to the one of December 1999.”
To respond to this challenge, EDF’s distribution networks subsidiary EDRF created FIRE (Rapid Intervention Force), which currently has 2,500 intervention technicians trained for crisis situations and deployable at any time all over France. It is led by an EDRF crisis unit in co-operation with regional units and in close
collaboration with the public authorities. FIRE holds everything necessary for its activities. It includes 11 storage platforms distributed across the country that enable the fast deployment of 2,000 generators as well as emergency materials kits. Autonomous teams are organized according to competence and deployed with their own generators and tools in affected areas immediately when they are needed.
The latest major extreme weather events – Joaquim in December 2011 and Kirk in December 2013 – have shown the value of this system. The average annual time without electricity per customer decreased from 119 minutes in 2010 to 73 minutes in 2011.
Business case 14
Rapid Intervention Force in France

Building a Resilient Power Sector How should we respond? 38
Hurricane Isaac struck Louisiana in the evening of August 28, 2012 and moved very slowly through the region. It brought sustained winds of 80 mph, and heavy rain. Winds of 40 mph or more continued for more than four days in the New Orleans area and there was widespread flooding, delaying assessment of damage and restoration activity.
The storm damaged 95 lines and 144 substations, 13 of which were flooded. More than 4,000 poles, nearly 900 miles of conductor and 2,000 transformers were damaged. Nearly 800,000 customers were affected.
Despite Isaac being the fourth worst storm Entergy has ever suffered, recovery was speedier than ever before (see chart). By September 4, virtually every customer had electricity again.
Mutual assistance was one of the reasons for swift recovery. Strong planning and preparedness were the other key factors. Entergy’s planning includes weather monitoring and a timeline for activating command centers, and recruiting response personnel. The company runs an annual storm simulation drill each spring.
The company began monitoring what would become Hurricane Isaac on August 18, and updating relevant employees a few days later when the scale of the emergency was clear.
Mutual assistance calls with other utilities began on August 22 and the System Command Center was fully activated on the day before the storm landed.
Assistance came from 21 other utilities and 138 contractors representing 25 states. Because response teams were in place more than 16,000 personnel were restoring service by September 1, three days after the hurricane hit the coast.
In addition to the physical challenge of restoring service, Isaac presented unprecedented demand for interaction with customers and social media was an important tool for the first time. Entergy communicated with more than 32,000 customers through social media. Customers made more than 1 million hits to the company’s website. Traditional coms were also heavily used: more than 1 million calls from customers; more than 2 million outbound calls and almost 1.4 million texts to customers during the storm.
Business case 15
Planning and mutual aid speed recovery in Louisiana
Cumulative percent customers restoredper day vs peak1, Isaac through 9/6/12 at 4pm
Ike (2008)705k
Gustav (2008)964k
Rita (2005)800k
Katrina2 (2005)1100k
Isaac3 (2012)787k
100%
90%
80%
70%
60%
50%
40%
30%
20%
10%
1 2 3 4 5 6 7 8 9 10 11 12 13 14 15 16 17 18 19
Restoration days1Based on non-coincedent system peak2Excludes extended restoration customers; Rita 800K start is net of continued Katrina restorations in progress3Excludes 1,649 customers projected to be unable to receive service (as of September 6)

Building a Resilient Power Sector How should we respond? 39
RecoverRecover from the crisis – pool learning, exchange best practice and share resources to respond more effectively to extreme events. For example, during Hurricane Sandy, utilities from around the country sent “mutual assistance crews” to help the restoration effort – nearly 3,400 overhead line workers (as well as over 400 underground workers) from as far away as California. Not only did they help to restore service to the majority of customers within a week, but these workers took back valuable experience of crisis management. Electric utilities can also be highly effective propagators, applying lessons learned across their global operations and supporting supply chain partners on emergency planning and crisis management. Their knowledge can also benefit poorer countries that experience some of the most extreme weather events and have limited resources.
Steps
> Replace damaged assets with stronger components
> Relocate vulnerable equipment
> Compile lessons learnt
In Southeast Asia (SE Asia), coal storage domes at a CLP power plant were destroyed by typhoons, while floods disrupted operations in India. In 2009, CLP began a program to assess the cost of this damage and how to adapt.
In India, a gas fired power station is vulnerable to flooding and adaptation measures already implemented include:
> raising the floor level of buildings housing critical infrastructure
> building flood levees around low-lying parts of the site
> increasing drainage capacity and diverting cooling water pipes to access fresh water in case of saline intrusion.
A SE Asia power station is vulnerable to high wind speeds and erosion. Coal storage domes and the coal conveyor were designed to withstand wind speeds during typhoons of up to 60 m/s for up to three seconds. The strongest gust ever recorded at the time of design was 56m/s but speeds have exceeded this threshold several times, damaging all three coal domes
and disrupting supply. High winds associated with typhoons also caused power outages on four occasions between 2005 and 2008. During typhoon Jangmi in September 2009, wind damage to transmission lines caused 17 days of power cuts. Recent research suggests worse is to come, with tropical cyclones intensifying by 2-11 % by 2100, which could result in gust speeds of 100m/s.
A pilot study identified several adaptation options:
> Commission a wave action study to estimate maximum wave height during typhoons
> Inspect and reinforce base of towers on or close to erosion/landslide risk slope
> Strengthen towers and transmission line sections to withstand strong gusts
> Investigate emergency coal delivery by rail
> Reinforce coal conveyor cladding
> Protect domes from water ingress
> Reinforce fresh water pipeline/secure alternate sources
Business case 16
Learning from the past to plan for the future

Building a Resilient Power Sector How should we respond? 40
On October 29, 2012, Hurricane Sandy brought extreme weather conditions to New York, which resulted in unprecedented disruption to electricity supplies. One third of the city’s generating capacity was temporarily lost, five major transmission substations in the city flooded and shut down and more than two million New Yorkers were without power – for weeks, in some cases. The city’s life and work were disrupted for days.
Even before the storm arrived, customers lost power as companies shut down networks to prevent catastrophic flood damage to underground distribution equipment. Utilities also responded to weather warnings with action to protect equipment, but the storm overwhelmed their efforts and caused serious
damage to generation, transmission and distribution systems, as well as to customers’ equipment.
The most significant impact was when the storm surge came into contact with key substations. Critical control equipment was submerged in saltwater, making substations inoperable and knocking out power in several areas. The knock-on effect created stress in the city’s bulk transmission system, causing further power outages after the storm had left.
Sandy’s wind gusts reached 145 kilometers per hour, causing localized losses in the overhead distribution system as falling trees hit the power lines. This damaged 225 miles of overhead lines, 1,000 poles, and 900 transformers.
Within heavily flooded areas, approximately 55,000 customers lost power because of damage to electrical equipment in their buildings. This included three hospitals which suffered basement flooding and were forced to evacuate patients because they could not use backup power systems. Flooding required utilities to pump out hundreds of underground vaults and replace damaged components.
Total damages of $65 billion were attributed to this storm, making it the most costly ever.
Extracted from: A stronger, more resilient New York, City of New York 2013.
Hurricane Sandy, New York 2012

Building a Resilient Power Sector How can we forecast climate impacts? 41
Figure 5Medium term impacts on the power sector value chain from climate
Disruption of supply due to climate impacts
Disruption of transport networks
Disruption to supplies and reduced efficiency due to extreme temperatures, very high winds, drought and floods
Changes in demand; ability to recover from extreme events
Longer-term adaptation
In general, hazards must be reconsidered and safety margins reassessed in the light of likely increased frequency and intensity of events. But the nature of climate change means there can be no certainty about the stresses the system will face. A useful approach to this uncertainty is to accept that disruption may happen and prepare for it – in design as well as management plans – rather than assuming design criteria are sufficient to withstand any eventuality.
Specific adaptation measures depend on the assets and technologies (see tables 4-9) but there are several general responses to climate change risks:
> Deal with greater uncertainty by being more flexible than the traditional hardening approach. A utility can choose in advance the risks it is willing to take and which equipment it wants to be more or less resistant. The company chooses the vulnerabilities of the system to minimize overall disruption. For example, if a company knows that sea levels might rise at certain points in the year, an option might be to water proof a vulnerable substation for a short period instead of making it water proofed all year. R&D activities might then be redirected to introduce more flexibility in the power infrastructure.
> Consider infrastructure beyond individual utilities or even countries. When the weather results in demand surges, the widest interconnection between power markets gives the greatest scope for flexibility in redirecting power flows and balancing supply and demand. Collaboration between the public and private sectors can achieve optimum siting of equipment and high voltage lines.
> Apply research and development to meet climate change vulnerabilities in new infrastructure. Predictive grid management, using tools based on Wide Area Monitoring Systems, can be particularly useful. These systems use sub-second snapshots of the grid’s operational status to reveal how extreme weather events can affect grids, helping to identify effective responses to the vulnerabilities.
> Recognize the increased tension between energy and water resources. Many of the likely impacts shown below involve water resources and their availability for cooling in power stations. At the same time, climate change will affect water resources in many locations.
The tables below show adaptation measures per asset class.
Resources (fuel, employees, equipment)
Transport Generation Transmission Distribution Customers

Building a Resilient Power Sector How should we respond? 42
Table 5 Adaptation: Thermal generation
Appropriate responses
> Design production facilities less sensitive to air and water temperature.
> Build new plant in locations with lower temperatures.> Decentralize generation.> Avoid refueling nuclear plant and plant maintenance
during summer.
> Build a “helper” cooling tower, if space is available.> Redesign the cooling system to increase the pumping
capacity and achieve a higher cooling flow rate.
> Increase water efficiency, using recirculation, dry (air-cooled) or hybrid cooling – offsetting increased consumption by improving overall generation efficiency.
> Use lower-quality water resources
> Build new or modified intake pipes. > Lower the intake pipe, which will improve the efficiency
of the plant by reducing the temperature of the cooling water, but risks mud, sand and other debris clogging pipes.
Coastal sites remain preferable because seawater temperature is more stable, but any development design will need to raise the level of structures, include flood defenses, improved drainage and protection for fuel storage.
> Apply higher structural standards, anticipating gradual sea level rise, more storm events, and associated tidal surges.
> Improve protection for fuel storage.
Likely impacts
The reduced gap between internal and external temperatures will permanently hit generating efficiency in warmer regions. High humidity will also reduce the efficiency of thermal plants in some locations.
Output may be affected by regulatory limits on the temperature of discharged cooling water, which may require scaling back production to achieve adequate cooling.
Reduced flow resulting from droughts or higher temperatures will decrease cooling capacity and, eventually, reduce generating efficiency.
Intake pipes for pumps supplying thermal plants with cooling or service water require minimum water levels. Inadequate water levels will disrupt the supply of water to the plant and require at least a partial shutdown.Disruption to water transport of fuels to power plants.
Damage to coastal infrastructure. Disruption to cooling systems if seawater enters the system. (Examples include the 2002 floods of the Oder and Elbe rivers in central Europe and the 1999 event at Blayais, which suffered from a combination of high tide and a storm surge.)
Damage to infrastructure.Impaired fuel quality, such as excessive moisture.
Climate change effect
Higher temperatures
Inadequate water supplies for cooling
Lower water levels in rivers and lakes
Raised sea levels and flooding
Other extreme weather events

Building a Resilient Power Sector How should we respond? 43
Table 6 Adaptation: Hydropower
Appropriate responses
> Changes to the management of the plant and redesigns for certain elements (see Fact on Les Bois)
> Increase dam height and/or build small dams upstream if flow is expected to increase
> Modify number and type of turbines more suited to expected water flow rates
> Modify canals or tunnels to handle expected changes in water flows
Build or augment water storage reservoirs Modify spillway capacities to flush silted reservoirsUpgrade or adapt turbine runners to increase silt resilience and ability to operate in lower capacity conditions.
Design more robust dams and infrastructure for heavier flooding and extreme eventsEncourage forestation around the reservoirs
Build or augment reservoirs
Likely impacts
Changes in the location and patterns of precipitation will decrease hydro production in some dams and increase it in others. Run-off from rivers in areas dominated by snow melt may occur earlier in the year and with increased seasonal precipitation cycles. Even relatively minor variations may make hydropower output more difficult to forecast in the long term.
Inadequate water volumes and the risk of damage from silt, which has already happened to many turbines in India.
Hydro infrastructure may incur physical damage – the flood from the Dig Tsho glacial lake outburst in Nepal in 1985 destroyed 14 bridges and damaged a hydropower plant.
Increased surface evaporation, reducing water storage and power output.
Climate change effect
Changes in precipitation and snow melt
Drought
Landslips and other land effects
Higher air temperature, wind speeds and humidity
Adaptation: Renewable generation
Renewable sources are, by their nature, dependent on natural conditions. While this makes them particularly robust, a couple of adaptation measures can further improve their level of resilience. In most cases, project design and location choices will be the key elements.

Building a Resilient Power Sector How should we respond? 44
Likely impacts
Lower output due to less sunlight.
Reduced cell efficiency and lower capacity of underground conductors.
Lower output due to less sunlight and snow accumulating on panels – less rain not washing off dust, reducing efficiency.
Damage to mirrors, concentrators and tracking systems.
Table 8 Adaptation: Solar
Appropriate responses
Use distributed systems rather than feeding into a single part of the grid.
Design cells and structures for high temperature peaks and improve airflow beneath structures.
Design cabling and components suitable for high moisture content. Ensure panels and mountings allow snow to slide off.
Use more robust structures and avoid strong cyclone locations.
Climate change effect
Greater cloud cover
Higher temperatures
Altered precipitation and floods
High wind/storms
Table 7 Adaptation: Wind
Appropriate responses
> R&D to improve the performance of wind turbines with varying wind speed conditions.
> Review location and size of planned infrastructure. > Consider developing vertical axis wind turbines that can
operate in a wider range of wind speeds.
Select turbine and blade designs suitable for extreme temperatures.
Design turbines to withstand storms.
Likely impacts
Extreme wind speeds and storms may require stopping the turbines more often.Lower wind speeds will reduce output.
Turbine blade icing reduces output.
Damage to offshore and onshore installations.
Climate change effect
Changed seasonal wind patterns, including lower average speeds but more extreme speeds
Extreme temperatures
Storm surges
NewYork
NewYork

Building a Resilient Power Sector How should we respond? 45
Likely impacts
Possible land degradation and soil erosion.
Increase or decrease in output depending on feedstock productivity.Increased moisture could lower energy content.
Possible damage to fuel supplies.
Table 9 Adaptation: Biomass
Appropriate responses
> Improve water harvesting and soil management, including use of trees and shrubs.
> Improve flood protection.
> Review location and biomass production patterns.> Improve water management including irrigation.
Plan for emergency harvesting. Crop insurance.
Climate change effect
Floods and increased precipitation
Changing temperature and rainfall patterns
Extreme weather events such as storms and drought
NewYork

Building a Resilient Power Sector How should we respond? 46
Likely impacts
Infrastructure damage
Buckling of metal structures
Damage to lines from falling trees Damage to towers and poles
Reduced efficiency of transmission and distribution systems, sagging power lines Overheating underground distribution equipment, which can result in equipment failures and fires
Flooded transformers and substations are subject to short circuits, leading to destruction if not shut down in advance. Heavy rains and flooding can undermine tower structures through erosion.
Table 10 Adaptation: Transmission and Distribution
Appropriate responses
> Predictive maintenance, based on performance data collected using advanced sensors, to identify weaknesses and remedy them before failure.
> Grid modernization to provide data automatically and communicate with customers, facilitating priorities for directing repair crews based on clear customer prioritization.
> Storage technologies such as using electric vehicles (EV) as an energy source, requiring the EV infrastructure being built today accommodating two-way power flow.
> Increase decentralized energy generation> Allow increased rerouting during times of disruption.> Include lightning protection in the distribution network.> Design redundancy into ICT systems.
> Relocate lines to reduce vulnerability.> Strengthen remaining lines, manage trees.> Consider underground distribution systems. > Upgrade towers and poles.
> Strengthen overhead lines and/or install underground cables.> Use more effective cooling for substations and transformers.> Demand management measures, including smart grids
and improved levels of energy efficiency.
> Install equipment that is submersible and not affected by salt water.
> Elevate substations or protect perimeters.> Protect masts, antennae, switch boxes, aerials, overhead
wires, and cables from precipitation.
Climate change effect
Storms, freezing rain
Extreme heat
High winds
Higher temperatures
Rising sea levels, increased precipitation and floods

Building a Resilient Power Sector How should we respond? 47
Business Case 17
Improving climate-resilience of power plants – step by step CLP Group has experienced some asset damage and operational disruption across its Asia Pacific portfolio due to extreme weather events. In 2009, the Group began a program to assess the cost of some of this damage and interruption and how to adapt. The first phase identified some “low hanging fruit” and the cost-effectiveness of building resilience into the siting and design of infrastructure. The second phase explored the vulnerabilities of fossil fuel assets and potential adaptation measures to protect them from extreme weather. In 2013, CLP began looking at renewable energy projects – two wind farms in India and a hydro project in China – to identify how vulnerable they were and if other renewable energy projects had demonstrated effective adaptation measures.
Fact Les Bois hydropower plant (40MW) in the French Alps uses water from the subglacial torrent of La Mer de Glace, the largest French glacier, with 90% of the annual production between April and October. In 2006, EDF redesigned its sub-glacial water intake approximately 800m upstream under the glacier, in response to the accelerated glacier retreat that lost more than 80m (thickness) of ice in less than 20 years. If the retreat of the glacier follows the same trend, an additional change would be required in 25 years.

Building a Resilient Power Sector How should we respond? 48
> Climate change will have significant impacts on generation, transmission and distribution, as well as upstream and downstream links in the value chain.
> Utilities need to change the way they design and manage power infrastructure in response to three kinds of risk:
– Extreme events – measures to increase resilience include: anticipation of events, planning response measures, discussion with stakeholders, implement measures, and recover
– Longer-term climate impacts – measures should include responses to the increased tension between energy and water (in thermal generation and renewables) and the modernization of transmission and distribution grids.
– Changing demand patterns - weather patterns will result in greater volatility in demand, increasing peak loads and capacity requirements, and may alter the location of demand.
> Technologies have different vulnerabilities, so diversity of sources of power supply and adequate back-up facilities are vital.
> The first line of defense consists of low-cost, “no-regrets” measures such as good vegetation management, waterproofing, servicing and maintenance.
> Climate risks will vary at local level and during the lifetime of assets.
> Risk assessments and understanding potential adaptation measures will be the basis for action specific to each technology and asset location.
Summary

4How should we prioritize?
How can we forecast climate impacts?
What are the climate risks we face?
How should we respond?
How should we prioritize?
What are the lessons learned?

Building a Resilient Power Sector How should we prioritize? 50
Electric utilities supply the energy that is the backbone of everyday life and commerce, and loss of power can lead to serious human suffering and economic loss. There is an expectation that power should always be available regardless of the forces of nature and that investments must be made to ensure supply all the time, even in the face of extreme storms, sustained heat waves or droughts.
In practice, it is unrealistic to guarantee that electricity supply will never be interrupted. Infrastructure can always be made more resilient but there will be a cost. Strengthening improvements must be considered in light of the costs, benefits and risks. There may be “low-hanging fruit,” either not costly or offset by benefits such as improving day-to-day reliability of the power system. Such measures can be justified without much regard to uncertainty. But other investments to increase resilience will carry costs that can be quite substantial – such as undergrounding distribution lines. The costs and benefits are often not distributed symmetrically. Costs may be carried by utilities, while several stakeholders reap the benefits. Incurring such heavy costs will only be justifiable if the risks and benefits are commensurate, measurable and accessible to support the investment.
Before taking action, companies will normally evaluate different alternatives using several criteria, starting with the risk assessment and cost benefit analysis of the available solutions. Other evaluation criteria include customer service, risk appetite, timing for implementation, funding options and aspects specific to the company and location, such as industry, health, social or ecosystem impacts. This analysis is complemented with specific implementation criteria for each company, which includes the budget situation, the regulatory environment or the technical and institutional capacity.
Figure 7Factors influencing decision-making
Risk cost benefit (RCB) analysis
Together with climate risk assessment, RCB analysis can be used to assess adaptation options to different climate change scenarios.
RCB analysis produces a cost-benefit curve based on:
> Quantitative estimates of risk, expressed as potential losses. Risk is calculated in three steps: the magnitude of the hazard, the value of the asset at risk from the hazard, and the vulnerability of those assets to the hazard.
> Costs of adaptation measures, including capital and operating expenses.
Risk assessment
Evaluation criteria Implementation constraints
Budgetconstraints
Leadershipwillpower
Cost-Benefitanalysis
Regulatoryframeworks
Institutional capability
Timing Technical skills required

Building a Resilient Power Sector How should we prioritize? 51
> Benefits, which may include potential additional revenues and losses averted as direct consequences of an adverse event (e.g., the cost of repairing power system infrastructure damaged by a severe storm) and possibly indirect consequences (e.g., the losses experienced by electricity consumers due to prolonged electricity outages).
The detailed estimates underlying the cost-benefit curve allow decision-makers to gauge the financial resources needed to address the risks under each climate scenario, as well as a rough indication of where resources may be allocated most effectively from a purely economic perspective. These measures can be assembled in a cost-effective portfolio, where the costs are less than the economic benefits. This is not to say that adaptation is free: the measures identified would require major upfront investment, and there may be non-economic costs, such as social and environmental losses, which the cost curve does not account for.11
It is impossible to assess an optimal level of investment in resiliency upgrades without appropriate understanding of risks and benefits. The cost-benefit curve introduces a rational approach to adaptation decision-making. It provides a sense of priority and scale, bearing in mind the increased future climate risk and the resulting increase in the penetration rate of certain measures. It includes future hazards that assets may be exposed and vulnerable to, not only known hazards based on past experience.
The RCB analysis creates a valuable base for decision-making but must be combined with the criteria described in Figure 7. RCB is limited because:
> It is a complex exercise given the level of uncertainties over the frequency, duration and intensity of extreme events, the tolerable level of risk, the acceptable level of cost and how to balance the certain, near-term costs to electricity consumers with the uncertain, longer-term risks from severe weather events.
> It represents discrete adaptation options rather than the full spectrum of options and a static view based on a number of assumptions about cost and averted losses.
> The lengthy time scale of climate change extends beyond some assets’ lifetime, but the consequences depend on the nature of replacement assets.
> External costs, meaning costs that fall beyond the boundary of the analysis, may be significant. Excluding them distorts the relative costs of different measures, hampering investment in certain technologies that can be advantageous.
> The longevity of assets such as hydropower is difficult to incorporate in existing models. Comparing assets with a long lifetime to others with shorter lifetimes can distort the analysis and deter investment in short-life assets.
> It does not capture the fact that costs may be paid by some actors, while the benefits may be enjoyed by others who are not incurring any costs.
11 Economics of Adaptation, 2008

Building a Resilient Power Sector How should we prioritize? 52
Figure 8 shows a real example of an adaptation cost benefit curve for a 77-county/parish study area in Texas, Louisiana, Mississippi and Alabama along the U.S. Gulf coast. The cost curve depicts a set of potential measures that could be included in an adaptation strategy. It does not determine which measures ought to be implemented to address climate risk. Instead, it quantifies the economics of the measures for a given scenario and time period. It therefore helps answer practical questions such as: what kind of measures are available, how much do they cost, how much will they reduce the climate risk?
The width of each bar in the cost curve represents the total potential of that measure to reduce expected annual losses by 2030 for a given scenario. The height of each bar represents the ratio between costs and benefits for that measure – the higher the bar, the greater the cost-per-dollar benefit. The cost curve shows the range of measures from most (at the left) to least cost-efficient.
The results can be used to start discussions on the different measures and the opportunity to avert expected losses. In this case, investments with a cost benefit ratio of less than two were considered favorable
and are those shown underneath the dotted line. The work identified a set of potentially favorable investments that can reduce approximately $7 billion per year in annual expected loss to 2030.
Figure 8Cost benefit curve between 2012 and 2030 for the U.S. Gulf Coast
Source: Building a resilient Energy Gulf Coast, 2012
Building a Resilient Energy Gulf Coast: Executive Report
9
This work has identified a set of potentially attractive measures that can address almost all of this increase in loss going forward. There are measures that can address ~$7 billion per year in annual expected loss in the 2030 timeframe.
These measures include those with a cost to benefit (C/B) ratio of less than 2 (Exhibit 5). The reason we have chosen a C/B ratio of less than 2 (rather than 1) in order to identify a potentially attractive set – is that several measures (e.g., wetlands protection or levees) have strong co-benefits that are not captured in the analysis (which focuses primarily on averted loss). These co-benefits include aspects such as biodiversity protection, ecosystem services or second order economic effects (e.g., risk aversion that encourages economic growth).
Assessing the potential loss aversion is particularly uncertain, even for measures for which extensive research exists – for example, for building codes to fix roofs against hurricane winds. On the cost side, we have minimized uncertainties in the test cases by evaluating only measures already developed and tested. However, while we verified costs locally using bottom-up estimates, the cost figures for the test cases are just that – estimates – and incorporates a set of assumptions. Finally, these estimated costs are societal costs/benefits. They do not consider taxes or other private actor costs, so the analysis developed here cannot be used to determine individual economics.
Measures are compared on an overall cost curve (Exhibit 5). The width of each bar in a cost curve represents the total potential of that measure to reduce expected loss up to 2030 for a given scenario. The height of each bar represents the ratio between costs and benefits for that measure.
0.17
2.5
5
32.58
10
09.59.08.58.04.0 7.57.06.56.05.55.00.5 3.53.0
Cost/benefit
4.5
1.66
0.34 0.44 0.640.69
0.69 0.80 1.26 1.64
6.765.192.703.31
15.15
3.82
6.18
0.44 2
10.01.0 10.51.5 11.02.00
1.791.95
15
35
2.30
0
2030 Loss averted$ bn
Resilience, new distribution
Incremental increase in loss under average change $7.3 billion
Sandbags
Refineries levees
Roof cover, retrofits
Levees, petrochemical plants, high risk
Roof wall, new builds
Beach nourishment
Higher design specifications
for offshore production
Disconnec-table FPSO
Replace semisubs
w/ Drill ShipsRoof shape
Home elevation, new builds, high risk
Local levees, high risk
Roof wall, retrofits, high risk
Resilience, retrofit distribution, low risk
Wetlands restoration
Levees
Opening protection, new builds
Barrier island restoration
Roof wall, retrofits, low risk
Opening protection, retrofits
Home elevation, retrofits, low risk
Average annual loss in 2030 is $21.5 bn
A range of attractive measures can address the increase in annual loss between today and 2030 and keep the risk profile of the region constant
5

Building a Resilient Power Sector How should we prioritize? 53
Long-term infrastructure planning
The United Nations expects 6.3 billion people or 68% of the world’s population to be living in urban areas by 2050. Many of these cities are located on the coast and are threatened by floods, storms, earthquakes and other natural hazards. Cities are tightly woven into the global risk landscape because they are highly interconnected and integrated in a global digitised economy. Governments, at local and national level, are under pressure to provide services that not only make urban communities function more smoothly but also make them more resilient when a disaster strikes (Mind the Risk 2014). In this context, the electric utilities have an important role to play, as cities are highly dependent on electricity supply.
Also, electric utilities will also have to manage climate related risks associated with public infrastructure. The companies will implement adaptation measures to become more resilient, but will also depend on the public and private investment covering wider landscape management issues such as dams and flood plain management or keeping critical transport arteries open at times of emergency.
Indeed utilities should work with the public sector to map and model risk at the national and local level, understanding the links with critical infrastructure such as sewage, ICT and coastal and inland flood management.
The private sector, including the power utilities, should work with the Governments to establish a more comprehensive view of the risk, response and resilience strategies that governments at national and local level have in place – and to improve them if possible.
Risk modelling, analysis and resilience planning of utilities will be stronger if there is a comprehensive view of the infrastructure “hinterland”, such as how much public spending is planned for climate resilience, in which areas and what are the cross-linkages.
Upgrading regulatory frameworks
Electricity is central to local and national economies and therefore the subject of government regulation. It is also a “social good,” so electric utilities need to meet community needs in order to retain the “license to operate.” Regulations may need adapting to the potential impacts and uncertainty of climate change and utilities may need to adapt to retain public support and their “license to operate.”
For many years policy makers have looked at and focused on the potential to decarbonize electricity production, but recent extreme climate events are turning the attention to the need to increase the resiliency of the sector.
In many cases, policymakers are beginning to consider how to reduce the number and length of electricity outages resulting from changes in climate and extreme events. Some, especially in the U.S., are working towards a regulatory framework that acknowledges the social, economic and environmental importance and vulnerability of the electricity sector and recognizes the limits of utilities’ responsibilities.

Building a Resilient Power Sector How should we prioritize? 54
Regulatory structures differ from country to country, with varying levels of public and private ownership, as well as integration of generation with transmission and distribution. In general, liberalized structures, with multiple utilities, and interconnections between power systems provide a more resilient system with greater back-up in the event of supply interruption.
The regulatory framework has an important influence on investment decisions. Utilities will find it hard to justify investment in upgrades if the regulated tariff structure does not allow them to recoup the investment. In a less regulated environment, the need to retain customers will influence investment and pricing decisions. Uncertainty about regulation will add to the existing uncertainties about the impacts of climate change and may prevent desirable investments going ahead.
Regulation also needs to support a viable business model, including incentives to utilities to invest in adaptation. These could include market signals and regional regulatory structures appropriate to local circumstances. In particular, regulations in the design and operation of power plants
(e.g., system specification and equipment standards) should be adjusted to recognize the high-impact risks faced today and the likelihood of increasing frequency in future.
Regulations on resilience should also be adjusted as they determine how utilities build infrastructure. New requirements to ensure resilient communities will impact on these limits, with an impact in cost, insurance and responsibility. Hence, the evolution of climate and the need to make more resilient infrastructure will require more flexibility in regulations. For example, protection of biodiversity means that, for thermal plants, the maximum authorized temperature for water release in the river is 28° C, but what will happen if the temperature of the river is above this limit?
Governments’ response to the threat of climate change should include encouraging mutual aid between utilities when a crisis occurs and taking responsibility for recovery of communities affected by extreme events. Utilities should be required to collaborate and share best practices in emergency planning and be prepared to offer mutual aid when necessary.
Public mission contract for the distribution network in FranceIn 2005, the French Authorities created a public mission contract for the distribution network operator, which included obligations in relation to climate hazards.
The Distribution Network Operator commits to:
> Identify sensitive areas of the network, in relation to four aspects of climate risk: storm, flood, heavy snow and heat waves. This study will be updated annually, taking into account weather impacts during the year.
> Develop an appropriate program for areas of weakness, including a methodology for prioritizing work and combining removal, disposal, replacement works and pruning.
> Ensure that, by 2015, re-supply occurs within 12 hours after any significant failure due to climate hazard, for sites accessible to the public. These sites will be identified in close cooperation with local authorities.
> Implement a plan for the re-supply of sensitive facilities.
> Pursue pruning programs on low and medium voltage networks.
> Coordinate the repair of bare wires.

Building a Resilient Power Sector How should we prioritize? 55
Reliability expectations are sometimes set by regulators and govern the design and operation of the electric system. In the generation and transmission system in New York, for example, the reliability standards require that the bulk power and transmission system are designed so as to have an unplanned outage only once in 10 years. The utilities then design and operate their electric system so that the portion of the system that serves the city’s more densely populated areas is able to withstand the loss of two components within a distribution network and still maintain service. In less densely populated areas, the system is designed to withstand the loss of one component.
Climate change and its associated risks are not considered with respect to virtually any aspect of the regulatory framework applicable to New York’s energy system. For example, the models that the NY authority runs to test whether the electric system will be able to meet future standards factor in the possibility of future heat waves, but do not yet consider the fact that in the future, heat waves are likely to be more frequent, more intense, and longer lasting than
today, impacting electric demand. Similarly, when the utilities design their equipment, they tend to do so with a certain level of storm surge in mind. The regulators, however, do not yet require these utilities to consider a full range of present and future storm surge risks. When it comes to measuring performance, the metrics used for the electric system actually exclude outages that are caused by major weather events.
After Sandy, there have been requests to redesign regulatory frameworks to support resilience to:
> Address climate risks with a cost-effective system upgrade plan. The current guidelines to ensure adequate energy supply in the event of failures in the system require a system design that considers what is known and measurable, but does not include low-probability but high-impact events such as Sandy. Regulations need to be adjusted and to withstand the high-impact risks they face today but also with an increasing frequency in the future. These resiliency-related investments should be considered in the rate-making process so that utilities recover those investments.
> Reflect climate risks in system design and equipment standards. To date, the system planning approaches and design standards used by New York’s utilities and regulators have ensured highly reliable systems. However, they have not been established with the goal of optimizing system resiliency. Ultimately, the city’s systems should be capable not only of reliable day-to-day operation, but also of remaining operational during extreme weather events (such as hurricanes, tropical storms, and heat waves), and recovering quickly when parts of the system fail. This can be achieved in part by considering climate change impacts in system planning decisions.
Source: A stronger, more resilient New York, 2013
Regulations on reliability

Building a Resilient Power Sector How should we prioritize? 56
Entergy serves 2.8 million customers in the Gulf Coast states of Louisiana, Mississippi, Texas and Arkansas. Following devastating hurricanes in 2005 and 2008, the company realized the need to focus not only on business continuity, but on prosperity and resilience for the whole community. The company’s $1.5 billion loss as a result of Hurricanes Katrina and Rita in 2005 paled in comparison to the $150 billion loss communities suffered from Katrina alone.
A study identified costs and benefits relating to wind damage, sea level rise and storm surge. It covered assets in 23 different classes (commercial, residential, industrial and infrastructure) and included a detailed assessment of more than 500,000 miles of electric transmission / distribution assets and approximately 300 generation facilities. Three scenarios were considered for 2030 and 2050, representing low, average and extreme climate change.
The results showed that the area faces $14 billion in average annual asset losses from today’s climate, increasing to $23 billion with the high scenario. Cumulative losses over the next 20 years will likely exceed $350 billion, representing 2-3% of the region’s GDP. Extreme loss years may get worse and occur more frequently.
Fifty different adaptation measures were evaluated to determine their applicability, cost
and the estimated asset loss that could be avoided (Figure 9). This work identified a set of potentially attractive measures that can address almost all of this increase in loss: approximately $7 billion per year in annual expected loss avoided to 2030.
These measures translate to nine broad efforts to reduce risk across all sectors, shown in Figure 9.12 Public funding of $44 billion will be required over the next 20 years for key infrastructure projects, including wetlands and levees. Some $76 billion in private funding will also be required.
Business case 18
Study of hurricanes on the Gulf of Mexico coast
12 Note that the average annual loss averted in the graphic is shown in year 2030 and does not reflect the sum-averted loss over the 20-year period. The total avoided loss over the 20-year period is approximately the CapEx divided by the average C/B ratio.
Figure 9Costs and benefits in the Gulf of Mexico
Building a Resilient Energy Gulf Coast: Executive Report
10
The assembled cost curve shows – from left to right – the range of measures from least to most cost-efficient. The results of the cost curve can be used to start discussions on the different measures and the opportunity to avert expected losses.
There are a set of particularly low cost measures on the left hand side of the curve, that typically include low cost measures, such as new building codes for industries (e.g., resilience measures for new distribution lines) or buildings (e.g., roof cover measures).
These measures translate to nine broad efforts to reduce risk across all sectors: residential/commercial, infrastructure/environmental, oil and gas and electric utility (Exhibit 6). On the whole, approximately $ 44 billion of public funding will be required over the next 20 years to fund key infrastructure projects (including wetlands and levees). Some $76 billion in private funding will be required. However policy makers may need to support and incent some private capital investment e.g., by subsidizing homes in low-income areas built to higher building codes
After these 9 efforts are put in place, there is still ~$14 billion in annual expected loss remaining in residual risk. For tail-risk (extreme events), insurance or risk transfer measures are more cost-efficient than physical measures in providing coverage. Existing insurance penetration in the Gulf Coast can help cover approximately half of the $14 bn in residual loss.
Residential/ commercial
1 Improved building codes
Oil and gas
6 Floating production systems
7 Replacing semi-subs with drill ships
8 Levees for refineries and petrochemical plants
Infrastructure/ Environmental 3 Wetlands restoration1
2 Beach nourishment
4 Levee systems1
Electric utility 9 Improving resilience of electric utility systems
1.7
0.3
0.4
0.1
1.4
0.7
0.5
1.1
1.3
7.5
Loss averted, 2030$ Billions
▪ The government may need to support or incentivize some private capital investment, e.g., by subsidizing homes in low-income areas built to higher building codes
1 Included despite high C/B ratios due to strong co-benefits, risk aversion2 Total capital investment, non-discounted, across 20 years
5 Improved standards for offshore platforms
Total
Average C/B ratioX
0.7
1.3
1.6
0.7
0.5
3.3
0.7
3.8
0.9
CapExrequired2
$ Billions Public funding
Private funding
121
16
18
44 76
15
5
11
18
1
25
12
Measures can translate into broad near-term actions to protect our region – that are cost effective and will help our economy and our environment
6

Building a Resilient Power Sector How should we prioritize? 57
> When selecting adaptation measures, risk cost benefit analysis provides a quantification of potential measures in terms of impact and cost. Customer service, the regulatory environment, capital availability and technical and institutional capacity are other important criteria to be considered.
> Risk cost benefit analysis shows that in some areas (e.g., the U.S. Gulf Coast) there are potentially attractive measures that can address almost all of the estimated increase in losses up to 2030.
> Collective, community-wide action is necessary to build resilient communities and identify the cost-effective measures that will best manage the community risks.
> Resilience long term planning of utilities will be more robust if there is a comprehensive view of the infrastructure “hinterland”, public investments in climate resilience and cross-linkages.
> Electricity regulatory frameworks should be redesigned to acknowledge the changes to utility operations in the case of extreme events, introducing flexibility in certain regulations to minimize operational impacts and assign responsibilities to the different players, up to the return to normal conditions.
> Asymmetry between those incurring costs and those receiving the benefits can inhibit desirable investments and may require governments to provide specific incentives.
Summary

5What are the lessons learned?
How can we forecast climate impacts?
What are the climate risks we face?
How should we respond?
How should we prioritize?
What are the lessons learned?

Building a Resilient Power Sector What are the lessons learned? 59
Climate change is already happening, requiring action now to increase the resilience of the power sector and the communities it serves. Strengthening electricity infrastructure is fundamental to energy security, and a key concern for governments all over the world, as well as being central to the power sector’s social responsibilities.
Climate change will have significant impacts on generation, transmission and distribution, as well as upstream and downstream links in the value chain. The risks stem from the long-term rise in temperatures and sea levels, as well as the increased incidence of extreme weather that climate change will bring. Events which have previously been expected only once every 100 years are becoming much more common. They are also likely to be more severe in many places.
While specific assets are vulnerable, the consequences of climate change go beyond the physical infrastructure. In addition to supply implications, it is also necessary to engage the communities that electric utilities serve, especially on the most fundamental issues about how
climate change will affect their demand for electricity, the implications for supply and the trade-offs that may be necessary.
Climate change may also increase tensions between the energy and water sectors, between electricity security and water security. The power sector will need increasing supplies of water as a result of higher temperatures, as well as increased demand for electricity. At the same time, demand for water will also be growing for agriculture, industry and domestic supply, putting severe pressure on water sources. Hydropower can play an important role at the nexus of energy and water management.
The impacts of climate change will vary by asset class, although all generating technologies will be affected. The most significant threats are from rising sea levels, floods, storms and water shortages, but rising temperatures will reduce the efficiency of thermal generation and heat waves will significantly increase peak demand. Adaptation measures include physical protection of assets, improving the designs of specific assets and the electricity system as a whole.
The nature of the different risks and the variation from place to place and from time to time during the lifetime of assets increases the importance of fully understanding the risks and potential adaptation measures.
Assessing and managing these risks is difficult because of the political, economic, scientific and natural uncertainties in predicting the impacts, especially as the effects are very local and will vary widely from region to region.
Utilities also need improved weather predictions and climate projections to help adapt infrastructure to meet the expected risks. Accurate weather forecasting provides warning of an extreme event such as a hurricane, making it possible to manage demand and supply better and accelerate recovery from any supply interruption. Seasonal forecasting can provide early warning of weather up to a few months ahead, although these predictions are only moderately successful. For longer-term planning, climate projections can provide useful estimates for up to 30 years ahead at a regional level, although natural variability will remain significant for this timescale.

Building a Resilient Power Sector What are the lessons learned? 60
Better forecasts will help planning. Utilities also need enhanced skills to interpret the information and understand how the meteorological uncertainty will affect their operations. In particular it is essential to avoid over-reliance on historical data. The nature of climate change means that the scale of extreme weather such as storm surges may exceed past experience.
Electric utilities must cope with uncertainties about climate, technology and regulation. While it is necessary to strengthen infrastructure, it is also desirable to design in flexibility to enable more effective responses to unexpected events.
Risk cost benefit analysis is a useful tool for quantifying the impact and cost of potential adaptation measures. It can show that in some areas there are financially attractive measures to address almost all of the estimated increase in losses up to 2030. But utilities need to engage with communities and consider risks beyond their own assets to identify cost-effective measures that will best manage the community risks and build resilient communities.
Rapid urbanisation will exacerbate climate change impact, especially as the world’s biggest and fastest growing urban conurbations located on coastal areas exposed to flooding and storm surges. Resilience planning of utilities will be more robust if they work with local and national Governments to establish a comprehensive view of the risk, response and resilience strategies, as well as an understating of public investments in building resilience.
Regulatory frameworks may also need to be redesigned in the most vulnerable areas to support a system upgrade plan, system design and equipment standards that will meet the threats from climate change. Appropriate price signals will encourage investment and may be needed to ensure that necessary investment can earn a suitable return. Financing adaptation measures will be constrained if benefits do not accrue to the companies making the investment.
The insurance can play an important role in creating incentives, or at least pricing risk, to encourage resilience in the power sector, but also in public infrastructure and building environment.
The lessons learned from the companies involved in this study show that climate change is leading to the emergence of new business models in the power sector that incorporate new ways of approaching risks and uncertainty. Utilities will face additional pressure from insurance and the financial sector to improve their understanding and management of climate risks and to build, design or retrofit their assets accordingly. In some countries, regulations (such as property rights, insurance, planning) currently block the emergence of these new business models. Policies and regulations need to be adjusted or created to incentivize investments that increase resilience in operations, in power systems and in local communities.

Building a Resilient Power Sector What are the lessons learned? 61
Recommendations
Recommendations for policymakers
> Consider market signals and regional regulatory structures appropriate to local circumstances that can mitigate some of the risks.
> Support a business model that is viable in the context of climate change, including incentives for utilities to invest in adaptation.
> Adjust regulations to recognize the high-impact risks faced today and the likelihood of increasing frequency in future.
> Reflect climate risks in system specification and equipment standards.
Recommendations for public-private collaboration
> Organize cross-sector collaboration for long-term infrastructure planning and organize mutual aid for crisis response.
> Organize effective pooling of technical expertise, risk assessment and understanding of socioeconomic costs and develop new business models to price and manage risk.
> Develop more useful, local forecasts over time periods short enough to be relevant to business decision-making by giving utilities access to climate data and hydrological information.
> Improve public-private collaboration to share information, especially on a local scale, to improve community resilience.
Recommendations for the industry
> Build expertise in analyzing climate information to better understand risks, especially downscaling global climate models to a more local level.
> Use risk management and risk-cost benefit analysis when developing adaptation strategies to determine which solutions are efficient and cost-effective.
> Continue investing in R&D to develop effective upgrades to major infrastructure elements, broadening the range of options and reducing costs over time.
> Pool learning, exchange best practice and share resources to respond more effectively to extreme events.

Building a Resilient Power Sector 62
Adaptation
In human systems, the process of adjustment to actual or expected climate and its effects, in order to moderate harm or exploit beneficial opportunities. In natural systems, the process of adjustment to actual climate and its effects; human intervention may facilitate adjustment to expected climate.
Climate
Climate in a narrow sense is usually defined as the average weather, or more rigorously, as the statistical description in terms of the mean and variability of relevant quantities over a period of time ranging from months to thousands or millions of years. The classical period for averaging these variables is 30 years, as defined by the World Meteorological Organization. The relevant quantities are most often surface variables such as temperature, precipitation, and wind. Climate in a wider sense is the state, including a statistical description, of the climate system.
Climate Change
A change in the state of the climate that can be identified (e.g., by using statistical tests) by changes in the mean and/or the variability of its properties and that persists for an extended period, typically decades or longer. Climate change may be due to natural internal processes or external forcings, or to persistent anthropogenic changes in the composition of the atmosphere or in land use.
Exposure
The presence of people; livelihoods; environmental services and resources; infrastructure; or economic, social, or cultural assets in places that could be adversely affected.
Hazard
The potential occurrence of a natural or human-induced physical event that may cause loss of life, injury, or other health impacts, as well as damage and loss to property, infrastructure, livelihoods, service provision, and environmental resources.
Resilience
The ability of a system and its component parts to anticipate, absorb, accommodate, or recover from the effects of a hazardous event in a timely and efficient manner, including through ensuring the preservation, restoration, or improvement of its essential basic structures and functions.
Vulnerability
The propensity or predisposition to be adversely affected.
Glossary13
13 Intergovernmental Panel on Climate Change, 2012: Glossary of terms. In: Managing the Risks of Extreme Events and Disasters to Advance Climate Change Adaptation.

Building a Resilient Power Sector 63
About the World Business Council for Sustainable Development (WBCSD)
The World Business Council for Sustainable Development (WBCSD) is a CEO-led organization of forward-thinking companies that galvanizes the global business community to create a sustainable future for business, society and the environment. Together with its members, the council applies its respected thought leadership and effective advocacy to generate constructive solutions and take shared action. Leveraging its strong relationships with stakeholders as the leading advocate for business, the council helps drive debate and policy change in favor of sustainable development solutions.
The WBCSD provides a forum for its 200 member companies – which represent all business sectors, all continents and a combined revenue of more than $7 trillion – to share best practices on sustainable development issues and to develop innovative tools that change the status quo. The Council also benefits from a network of 60 national and regional business councils and partner organizations, a majority of which are based in developing countries.
AcknowledgementsThe following people have contributed to the preparation of this document: Claude Nahon (EDF), Philippe Joubert (WBCSD), Anne Bolle (Statkraft), Sarah Eastabrook (Alstom), Jeanne NG (CLP), Mandy Rambharos (ESKOM), Chuck D. Barlow (Entergy), Jeffrey L. Williams (Entergy), Brent Dorsey (Entergy), Bente Pretlove (DNV GL), Adrienne Williams (ABB), Carole Ory (EDF), Jean-Yves Caneill (EDF), Laurent Dubus (EDF), Laurent Bellet (EDF), Clotilde Nicolas (EDF), Celine Salon (EDF), Dick Bratchter (DNV GL), Luca Garre (DNV GL) and Paul Loeffelman (AEP).
Roger Cowe and Maria Mendiluce (WBCSD) managed the writing of this document.
ContactMaría Mendiluce, Director Electric Utilities ProjectE-mail: [email protected]
DisclaimerThis report is a result of collaborative work among executives from eleven member companies of the WBCSD Electric Utilities Project. This work was convened and supported by the WBCSD Secretariat. All member companies of the project have thoroughly reviewed drafts of the report. However, this does not mean that every member company necessarily agrees with every statement in the report.
Copyright © WBCSD, April 2014
WBCSD electric utilities project members

http://www.wbcsd.org/resilience.aspxWorld Business Council for Sustainable DevelopmentMaison de la PaixChemin Eugène-Rigot 2CP 246 1211 Geneva 21