buffet characterization and - onera aerospacelab … · buffet characterization: ... a chord length...
TRANSCRIPT
Issue 6 - June 2013 - Buffet Characterization and Control for Turbulent Wings AL06-01 1
Flow Control: the Renewal of Aerodynamics?
J. Dandois, P. Molton,A. Lepage, A. Geeraert, V. Brunet, J.-B. Dor E. Coustols(Onera)
E-mail: [email protected]
Buffet Characterization and Control for Turbulent Wings
The objective of this paper is to present an overview of the work performed at Onera over the last decade on the characterization and control of the buffet phenomenon.
This aerodynamic instability induces strong wall pressure fluctuations and as such lim-its aircraft envelope, consequently it is interesting to understand the origin of this insta-bility and to try to delay its onset, in order to improve aircraft performance, but also to provide more flexibility during the design phase. First, results from wind tunnel tests on 2D airfoils are presented to explain the 2D buffet phenomenon and since it is used as validation test case for numerical simulations. Then, results from several wind tunnel tests on a 3D configuration are presented. The 3D buffet phenomenon is characterized using steady and unsteady wall pressure measurements and LDV. Then, several types of flow control have been investigated, either passive (mechanical vortex generators) or active (fluidic VGs, fluidic trailing-edge device (TED)). It is shown than mechanical and fluidic VGs are able to delay buffet onset in the angle-of-attack domain by suppressing the separation downstream of the shock. The effect of the fluidic TED is different, the separation is not suppressed but the rear wing loading is increased and consequently the buffet onset is not delayed in the angle-of-attack domain, but only in the lift domain. Closed-loop control of the fluidic VGs is also investigated, to adapt the mass flow rate to the aerodynamic conditions.
Introduction The shock-wave/boundary layer interaction on the upper side of a wing at high Mach number and/or high angle of attack induces a mas-sive flow separation, which can lead to instability. This phenomenon is a global flow instability known as "buffet" and can further lead to structural vibrations (“buffeting”). Buffet results in lift and drag varia-tions that greatly affect the aircraft aerodynamics and, as such, limit the aircraft flight envelope, since a margin of 30% on the lift coef-ficient at cruising conditions must be respected by design standards.
For the last twenty-five years or so, a structured multi-disciplinary re-search program has been defined at Onera for addressing buffet char-acterization and control on, firstly turbulent airfoils, and then wings. This research program had comprised very detailed complementary experimental and numerical studies.
Two complementary devices/technologies had been developed for buffet control: • either a "VG-type" (Vortex Generator) actuator, the effect ofwhich is to add momentum and kinetic energy to the turbulent bound-ary layer which develops upstream of the shock and the induced separation, in order to suppress, or at least to delay, the appearance
of separated unsteady flows, which is at the origin of the buffet phe-nomenon; •ora"TED-type"(TrailingEdgeDevice/Deflector)actuator,whichbehaves as a trailing edge, or cambered trailing edge, by increasing the rear loading of an aerofoil and then postponing the buffet onset at a higher lift coefficient.
Thus, several reports and publications have been made for 2D rigid airfoils ([1]-[3] [7]-[8], [11]-[12], [15]-[17]). In particular, the ef-ficiency of a closed-loop approach using mechanical “TEDs” was shown, the control laws being extracted from a semi-empirical model [8]. Furthermore, very few studies were made for 2.5D ([2], [15] or [17]) or 3D transonic wings [5]; early attempts of control via me-chanical TEDs in open-loop have not been very successful for a 3D wing [8], as yet. These aforementioned studies referred mainly to mechanical devices.
Therefore, a new joint Onera research project was launched at the beginning of 2007, aimed at addressing buffet studies on 3D turbulent wings [9]. The focus was to investigate buffet control via the use of fluidic devices, which should be easier to handle than “mechanical TEDs for closed-loop” control applications. In parallel to this research project, the EU-funded AVERT “Aerodynamic Validation of Emission Reducing Technologies” project, coordinated by Airbus Operations
Issue 6 - June 2013 - Buffet Characterization and Control for Turbulent Wings AL06-01 2
Ltd, was launched in January 2007. For high speed technologies, demonstration tests were focused on buffet control and were per-formed on a 3D half wing/fuselage body at the Onera S2MA facility, in March 2010 [10]. Thus, the efficiency of delaying the buffet onset was shown using an open loop approach, with either fluidic VG or fluidic TED, at constant flow rate. The main characteristics of fluidic VGs and TED were defined by Onera and LEA Poitiers, respectively.Later on, Onera pursued buffet investigations on a 3D wing, the geometry of which being similar to that of the model tested at the Onera S2MA wind tunnel, but adapted to fit in the test section of the “research-type” Onera S3Ch wind tunnel [6], [14]. Flow topologies on both wings – either at the S3Ch or at the S2MA wind tunnel – were very consistent at the buffet onset and beyond. Blowing at rather large values of constant flow rates was applied for different angles of at-tack, at a Mach number close to 0.815; furthermore, various pulsed flow rates (duty cycle = 0.5) at frequencies in the range 100 to 500 Hz, were investigated for strong buffet conditions.
Later on, within the framework of the Clean Sky SFWA-ITD (Smart Fixed Wing Aircraft – Integrated Technology Demonstrator), comple-mentary high-speed tests were carried out on the 3D turbulent wing at the Onera S3Ch wind tunnel, using fluidic devices at continuous and pulsed flow rates. First of all, the open loop approach was applied at relatively low values of constant flow rates, for several fluidic VGs conditions. Then, a closed loop approach was applied by establishing a feedback between the fluidic VG opening and: •Eitherther.m.s.valueofanunsteadypressuresensorclosetothe trailing edge; •Or,theaveragevalueoftheshockposition,estimatedfrom10unsteady pressure sensors that were monitored continuously, in or-der to estimate the shock location in real time.
Last, but not least, within the framework of the Onera joint research project [9], closed loop control using fluidic VGs or fluidic TEDs was applied rather recently, at the beginning of 2012, on the 3D half wing/fuselage body at the Onera S2MA wind tunnel. The results are cur-rently under analysis and are not mentioned in this review paper.
There is a huge amount of literature on the control of the shock/boundary layer interaction. The control methods can be gathered into two main categories. In the first category, the objective is to weak-en the shock by splitting it to have a bifurcated λ shock structure. Several studies over the last decade have examined passive control devices to bring about the modified shock pattern: a cavity covered with a perforated plate [20], grooves and stream-wise slots [21]-[22] underneath the shock foot. These various concepts have led to moderate success, the reduction in wave drag being sometimes outweighed by viscous penalties [23]. This can be alleviated by us-ing active devices, such as boundary layer suction through a slot, but these devices require auxiliary equipment, which offsets any drag reduction benefits [24]-[25]. A promising method to lower the total pressure loss through the shock system is the control by a bump. In the beginning, 2D-shape bumps were investigated and led to signifi-cant wave drag reductions with moderate viscous penalties, but were found to perform very badly under off-design conditions [25]-[26]. More recent studies were performed with 3D bumps, which have a limited spanwise extent, to enhance the off-design performance [27]-[29]. The λ shock structure has been found to propagate between the bumps, giving total pressure decreases across the span. More-over, streamwise vortices developed along the bump sidewalls have a
beneficial effect on the downstream boundary layer behavior, render-ing this passive control device as a promising concept.
The second category is aimed at energizing the boundary layer up-stream of the shock, making it more resistant to the adverse pressure gradient and consequently less likely to separate downstream of the shock. Mechanical vortex generators [30]-[36], fluidic vortex gen-erators and synthetic jet fall in this category. Previous studies done at Onera [37] have shown that mechanical VGs are able to delay the buffet onset to higher angles of attack. However, even though they have shown their efficiency for buffet onset delay, mechanical vor-tex generators have the drawback of increasing drag under nominal cruising conditions. This is the reason why fluidic VGs, which can be turned off, are also investigated. Moreover, they can be used in a closed-loop strategy to optimize the flow control and consequently to reduce auxiliary equipment for actuation, which is an important constraint for aircraft manufacturers. Concerning these fluidic VGs, they have mostly been studied to control the shock/boundary layer in internal flows [38]-[41], but there are also few papers on 2D airfoils [42]-[44].
This review papers is aimed at providing the main outcomes from all these experimental tests, as well as from the computational investiga-tions performed from the high-quality database generated through all of these afore-mentioned testing campaigns.
Buffet Characterization: Experiments and Simulations
2D Turbulent Airfoil
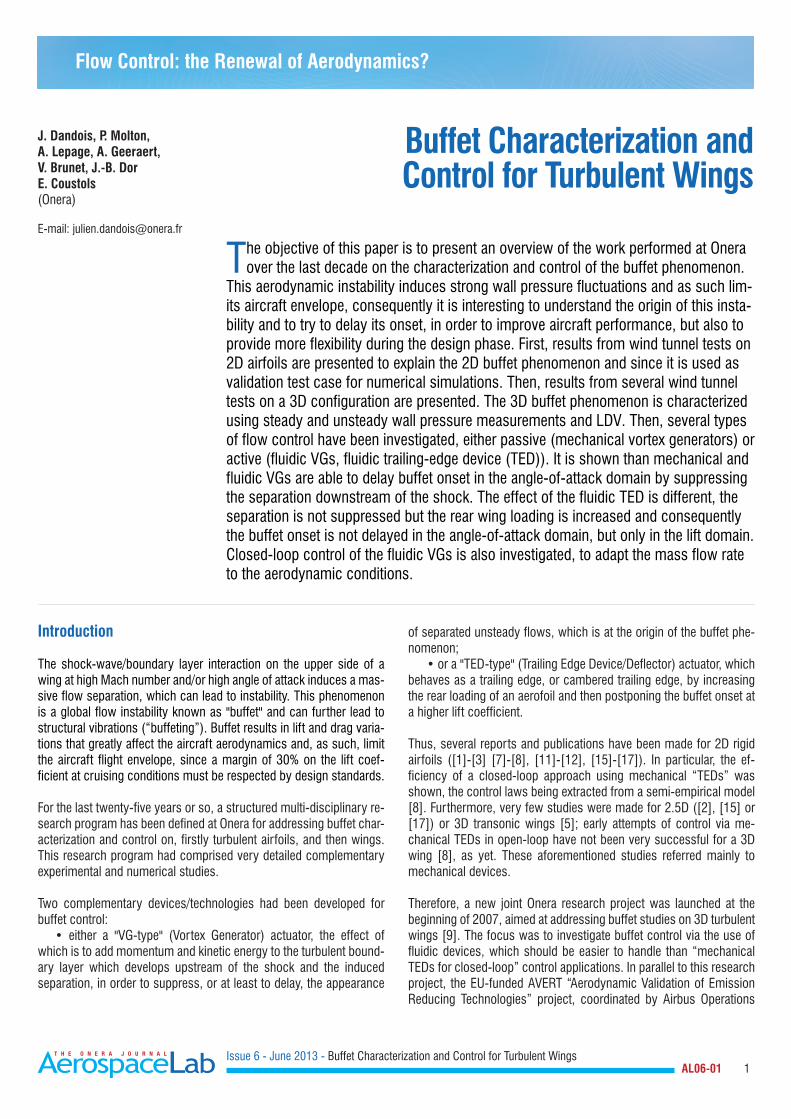
First, the buffet phenomenon has been investigated on a 2D airfoil. The study was carried out in the continuous closed-circuit transonic S3Ch wind tunnel of the Onera Meudon Center. This facility has a test section size of 0.78 × 0.78 × 2.2 m. The upper and lower walls are flexible, so as to reduce wall interferences near the model, the adapta-tion technique being based on a steady flow hypothesis [14]. The side walls are equipped with Schlieren quality windows. The experimental arrangement is shown in figure 1. The model is an OAT15A profile with a relative thickness of 12.3%, a chord length c = 230 mm, a span of 780 mm (which gives an aspect ratio of 3.4) and a thick trail-ing edge of 0.5% of the chord length. The central region of the profile is equipped with 68 static pressure orifices and 36 unsteady Kulite pressure transducers.
Figure 1 - OAT15A supercritical profile in the S3Ch transonic wind tunnel
Issue 6 - June 2013 - Buffet Characterization and Control for Turbulent Wings AL06-01 3
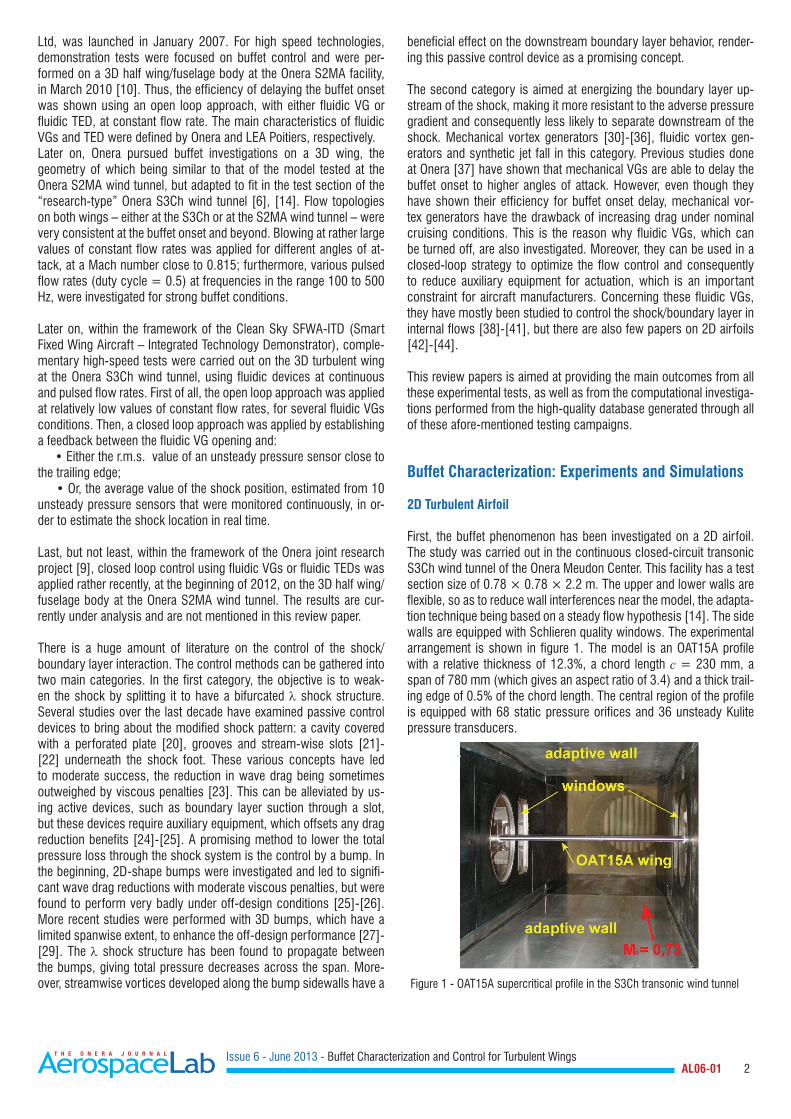
Schlieren films were recorded using a high-speed camera allowing acquisitions of 1000 frames per second, which means 14 images per period since the shock oscillation frequency is 70 Hz (see figure 5). The exposure time is set equal to 1.9 10-6 s or 1.3 10-4 the oscillation period. Examples of pictures obtained for M0 = 0.73 and a = 3.5° are shown in figure 2 (these conditions are those of the other inves-tigations presented next). The two pictures correspond to the most upstream (red upward pointing arrow) and downstream locations (green upward pointing arrow) of the shock during its oscillation for these conditions. The wave observed upstream of the field is due to the transition triggering strip. Its apparent importance is amplified by the spanwise integration of light deviation, which tends to magnify the image contrast. In reality, surface pressure measurements showed that the variations of the flow conditions across this wave were negli-gible. The picture in figure 2a reveals a lambda-shaped region typical of the transonic shock wave/boundary-layer interaction with a shear layer (in white), which develops along the slip line originating from the lambda structure triple point. The separated boundary layer above the profile, behind the shock (in black), is also visible. When the shock wave moves upstream, the separation size increases, as well as the corner flow separation on each side wall. Deformations of the shock surface associated with these corner flows are visible in figure 2a, when the shock is at its most upstream location.
b) Shock most downstream location
Figure 2 - Instantaneous Schlieren pictures for a =3.5°, M =0.73(a) Shock most upstream location, (b) Shock most downstream location
The oil flow visualization in figure 3 reveals that the time-averaged shock remains parallel to the leading edge on nearly 80% of the wing. Flow deviations are apparent in the lateral wall region. These cor-ner flow separations, which are due to interactions with the side wall boundary layers, remain confined to nearly 10% of the profile span at each end.
a) Shock most upstream location
Figure 3 - Oil flow visualization of the upper surface of the wing for a =3.5 °, M=0.73, viewed from downstream: a) left side, b) right side. The center region of the airfoil is free from oil flow.
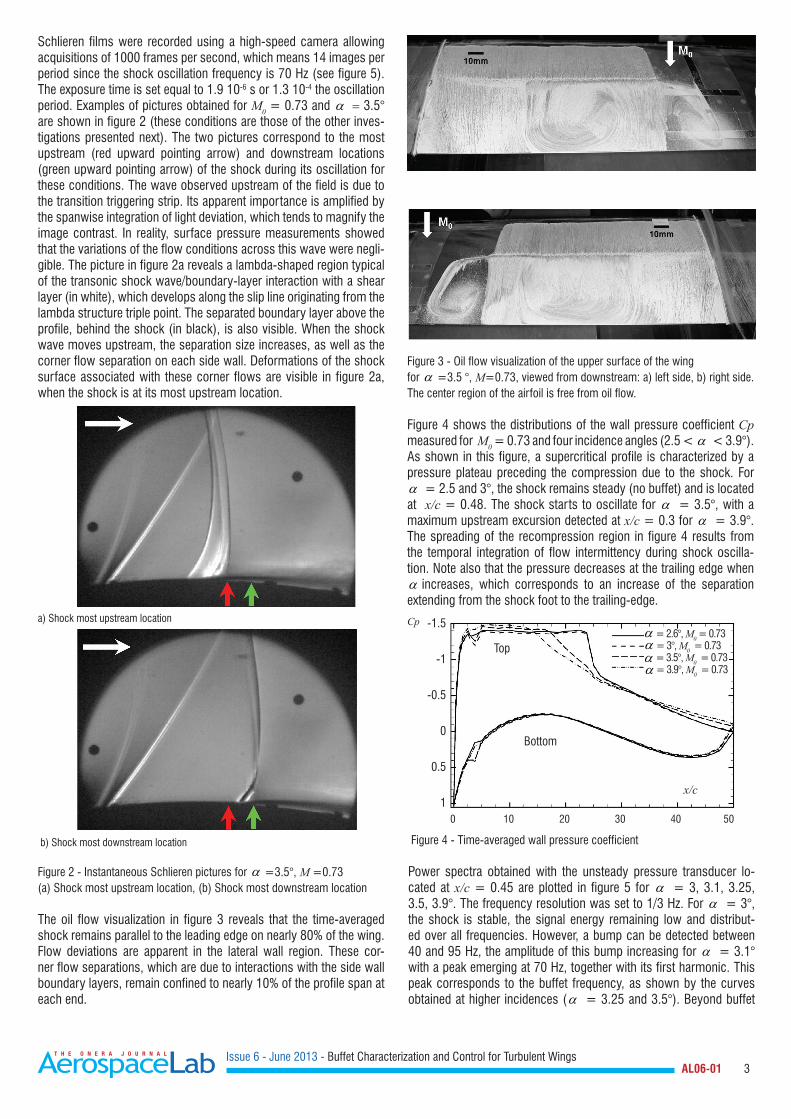
Figure 4 shows the distributions of the wall pressure coefficient Cp measured for M0 = 0.73 and four incidence angles (2.5 < a < 3.9°). As shown in this figure, a supercritical profile is characterized by a pressure plateau preceding the compression due to the shock. For a = 2.5 and 3°, the shock remains steady (no buffet) and is located at x/c = 0.48. The shock starts to oscillate for a = 3.5°, with a maximum upstream excursion detected at x/c = 0.3 for a = 3.9°. The spreading of the recompression region in figure 4 results from the temporal integration of flow intermittency during shock oscilla-tion. Note also that the pressure decreases at the trailing edge when a increases, which corresponds to an increase of the separation extending from the shock foot to the trailing-edge.
Figure 4 - Time-averaged wall pressure coefficient
Power spectra obtained with the unsteady pressure transducer lo-cated at x/c = 0.45 are plotted in figure 5 for a = 3, 3.1, 3.25, 3.5, 3.9°. The frequency resolution was set to 1/3 Hz. For a = 3°, the shock is stable, the signal energy remaining low and distribut-ed over all frequencies. However, a bump can be detected between 40 and 95 Hz, the amplitude of this bump increasing for a = 3.1° with a peak emerging at 70 Hz, together with its first harmonic. This peak corresponds to the buffet frequency, as shown by the curves obtained at higher incidences (a = 3.25 and 3.5°). Beyond buffet
0 10 20 30 40 50
-1.5
-1
-0.5
0
0.5
1
Top
Bottom
x/c
a = 2.6°, M0 = 0.73a = 3°, M0 = 0.73a = 3.5°, M0 = 0.73a = 3.9°, M0 = 0.73
Cp
Issue 6 - June 2013 - Buffet Characterization and Control for Turbulent Wings AL06-01 4
onset, the spectra are marked by high harmonics and by background turbulence. One can note that the energy background overshoots for a = 3.25° before settling down to a lower level for higher incidences.
0 1 2 3 4
0 1 2 3 4
1011
109
107
105
103
101
100 101 102 103
a =3.00a =3.10a =3.25a =3.50 a=3.90
0 1 2 3 4
25
20
15
10
5
0
-0.3
-0.25
-0.2
-0.15
-0.1
-0.05
0
0.05
600
400
200
0
Buffet2.9° to 3.1°
a)
b)
c)
RMS
acc.
(kul
ite)
Cp s
ucct
ion
side
- th
ick
trailin
g ed
geRM
S p’
(Kul
ite)
a (°)
Figure 5 - Influence of the incidence on the pressure power spectrum at x/c = 0.45 (M = 0.73)
This experimental test case has been computed by several numeri-cists at Onera with various levels of turbulence modeling: in URANS by Deck [11] and Brunet [1][3], in ZDES by Deck [11] and Brunet et al. [4] and in LES by Garnier & Deck [12].
3D Turbulent Wings
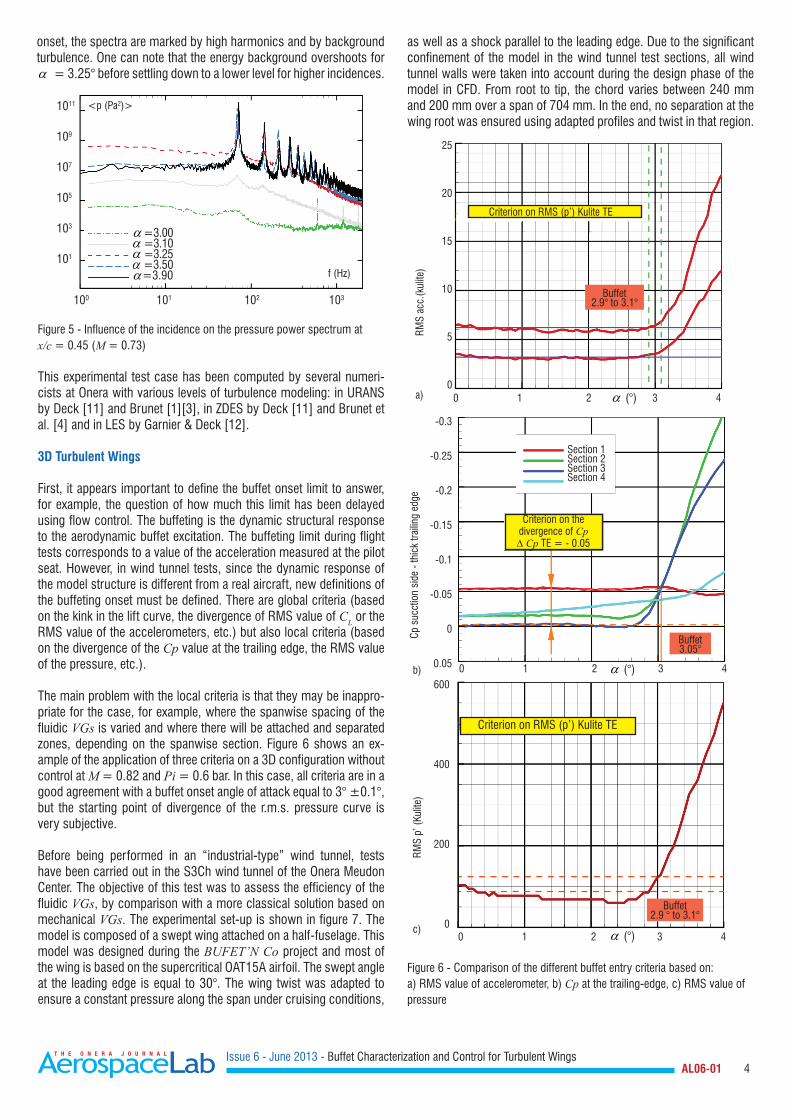
First, it appears important to define the buffet onset limit to answer, for example, the question of how much this limit has been delayed using flow control. The buffeting is the dynamic structural response to the aerodynamic buffet excitation. The buffeting limit during flight tests corresponds to a value of the acceleration measured at the pilot seat. However, in wind tunnel tests, since the dynamic response of the model structure is different from a real aircraft, new definitions of the buffeting onset must be defined. There are global criteria (based on the kink in the lift curve, the divergence of RMS value of CL or the RMS value of the accelerometers, etc.) but also local criteria (based on the divergence of the Cp value at the trailing edge, the RMS value of the pressure, etc.).
The main problem with the local criteria is that they may be inappro-priate for the case, for example, where the spanwise spacing of the fluidic VGs is varied and where there will be attached and separated zones, depending on the spanwise section. Figure 6 shows an ex-ample of the application of three criteria on a 3D configuration without control at M = 0.82 and Pi = 0.6 bar. In this case, all criteria are in a good agreement with a buffet onset angle of attack equal to 3° ±0.1°, but the starting point of divergence of the r.m.s. pressure curve is very subjective.
Before being performed in an “industrial-type” wind tunnel, tests have been carried out in the S3Ch wind tunnel of the Onera Meudon Center. The objective of this test was to assess the efficiency of the fluidic VGs, by comparison with a more classical solution based on mechanical VGs. The experimental set-up is shown in figure 7. The model is composed of a swept wing attached on a half-fuselage. This model was designed during the BUFET’N Co project and most of the wing is based on the supercritical OAT15A airfoil. The swept angle at the leading edge is equal to 30°. The wing twist was adapted to ensure a constant pressure along the span under cruising conditions,
Figure 6 - Comparison of the different buffet entry criteria based on: a) RMS value of accelerometer, b) Cp at the trailing-edge, c) RMS value of pressure
as well as a shock parallel to the leading edge. Due to the significant confinement of the model in the wind tunnel test sections, all wind tunnel walls were taken into account during the design phase of the model in CFD. From root to tip, the chord varies between 240 mm and 200 mm over a span of 704 mm. In the end, no separation at the wing root was ensured using adapted profiles and twist in that region.
Section 1Section 2Section 3Section 4
f (Hz)
<p (Pa2)>
Criterion on RMS (p’) Kulite TE
Criterion on thedivergence of CpD Cp TE = - 0.05
Buffet3.05°
Buffet2.9 ° to 3.1°
Criterion on RMS (p’) Kulite TE
a (°)
a (°)
Issue 6 - June 2013 - Buffet Characterization and Control for Turbulent Wings AL06-01 5
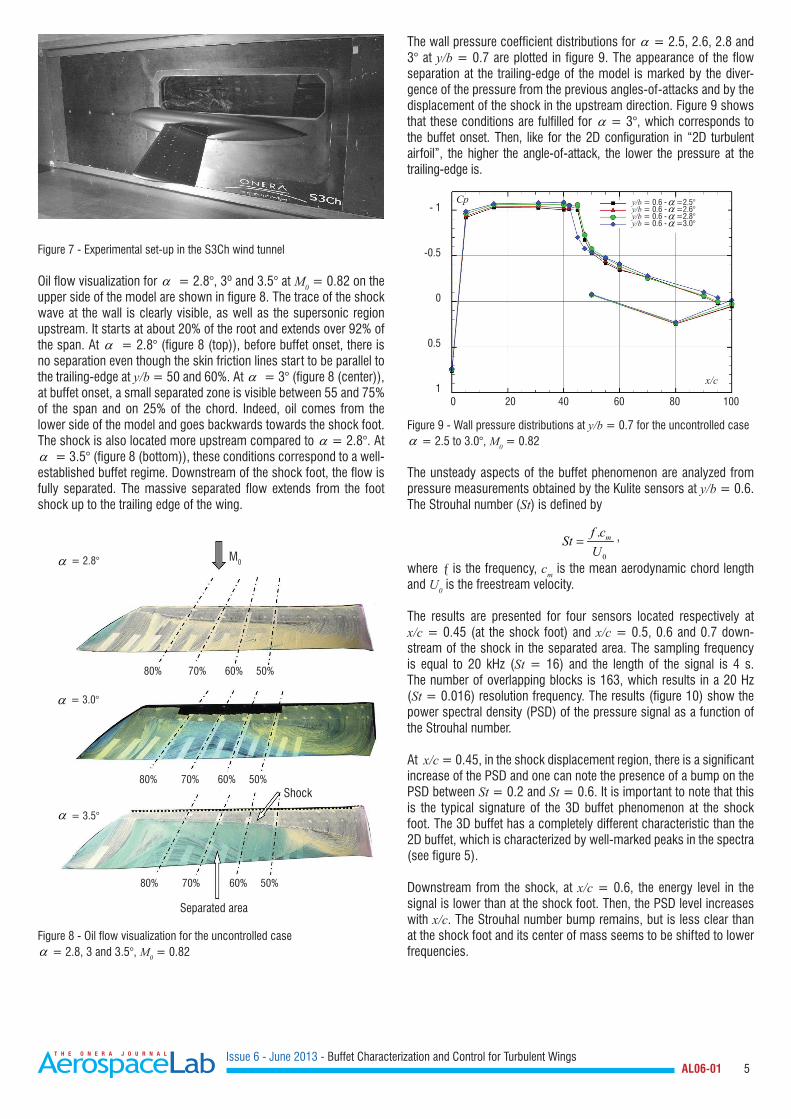
Figure 7 - Experimental set-up in the S3Ch wind tunnel
Oil flow visualization for a = 2.8°, 3º and 3.5° at M0 = 0.82 on the upper side of the model are shown in figure 8. The trace of the shock wave at the wall is clearly visible, as well as the supersonic region upstream. It starts at about 20% of the root and extends over 92% of the span. At a = 2.8° (figure 8 (top)), before buffet onset, there is no separation even though the skin friction lines start to be parallel to the trailing-edge at y/b = 50 and 60%. At a = 3° (figure 8 (center)), at buffet onset, a small separated zone is visible between 55 and 75% of the span and on 25% of the chord. Indeed, oil comes from the lower side of the model and goes backwards towards the shock foot. The shock is also located more upstream compared to a = 2.8°. At a = 3.5° (figure 8 (bottom)), these conditions correspond to a well-established buffet regime. Downstream of the shock foot, the flow is fully separated. The massive separated flow extends from the foot shock up to the trailing edge of the wing.
a = 2.8°
a = 3.0°
80% 70% 60% 50%
80% 70% 60% 50%
80% 70% 60% 50%
Separated area
M0
The wall pressure coefficient distributions for a = 2.5, 2.6, 2.8 and 3° at y/b = 0.7 are plotted in figure 9. The appearance of the flow separation at the trailing-edge of the model is marked by the diver-gence of the pressure from the previous angles-of-attacks and by the displacement of the shock in the upstream direction. Figure 9 shows that these conditions are fulfilled for a = 3°, which corresponds to the buffet onset. Then, like for the 2D configuration in “2D turbulent airfoil”, the higher the angle-of-attack, the lower the pressure at the trailing-edge is.
0 20 40 60 80 100
- 1
-0.5
0
0.5
1
Figure 8 - Oil flow visualization for the uncontrolled case a = 2.8, 3 and 3.5°, M0 = 0.82
Shock
Figure 9 - Wall pressure distributions at y/b = 0.7 for the uncontrolled case a = 2.5 to 3.0°, M0 = 0.82
The unsteady aspects of the buffet phenomenon are analyzed from pressure measurements obtained by the Kulite sensors at y/b = 0.6. The Strouhal number (St) is defined by
0
. mf cSt
U= ,
where ƒ is the frequency, cm is the mean aerodynamic chord length and U0 is the freestream velocity.
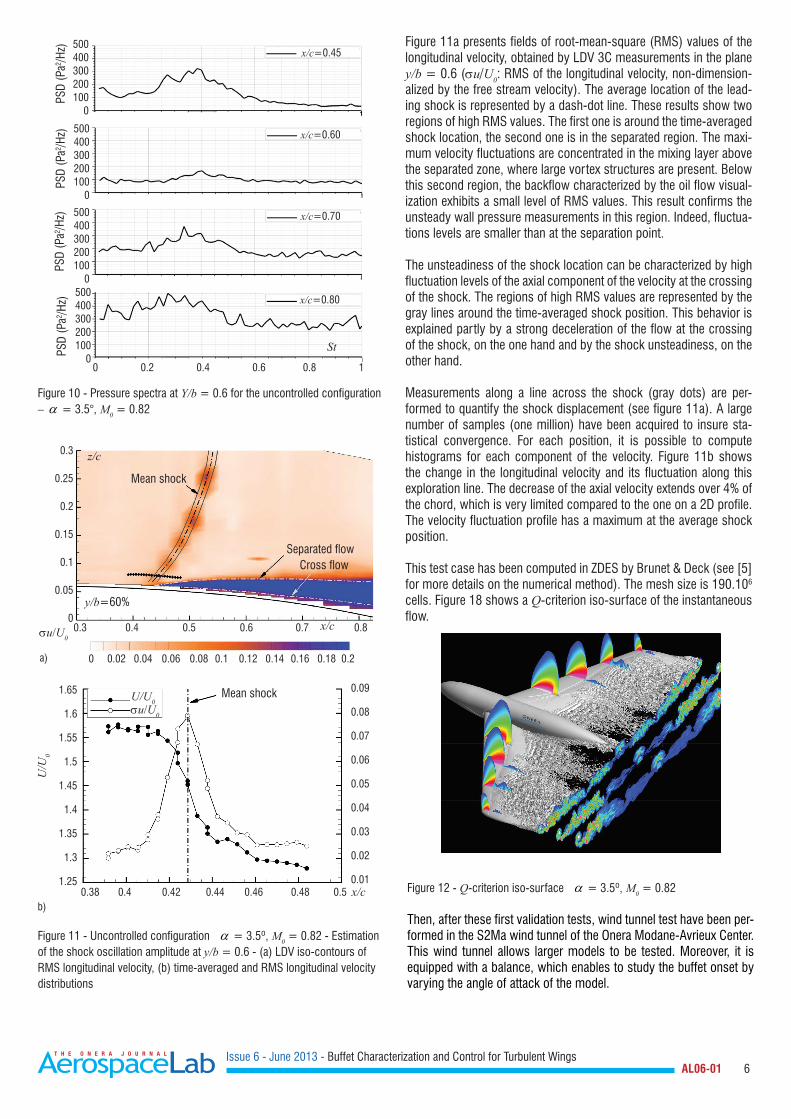
The results are presented for four sensors located respectively at x/c = 0.45 (at the shock foot) and x/c = 0.5, 0.6 and 0.7 down-stream of the shock in the separated area. The sampling frequency is equal to 20 kHz (St = 16) and the length of the signal is 4 s. The number of overlapping blocks is 163, which results in a 20 Hz (St = 0.016) resolution frequency. The results (figure 10) show the power spectral density (PSD) of the pressure signal as a function of the Strouhal number.
At x/c = 0.45, in the shock displacement region, there is a significant increase of the PSD and one can note the presence of a bump on the PSD between St = 0.2 and St = 0.6. It is important to note that this is the typical signature of the 3D buffet phenomenon at the shock foot. The 3D buffet has a completely different characteristic than the 2D buffet, which is characterized by well-marked peaks in the spectra (see figure 5).
Downstream from the shock, at x/c = 0.6, the energy level in the signal is lower than at the shock foot. Then, the PSD level increases with x/c. The Strouhal number bump remains, but is less clear than at the shock foot and its center of mass seems to be shifted to lower frequencies.
y/b = 0.6 - a =2.5°y/b = 0.6 - a =2.6°y/b = 0.6 - a =2.8°y/b = 0.6 - a =3.0°
x/c
Cp
a = 3.5°
Issue 6 - June 2013 - Buffet Characterization and Control for Turbulent Wings AL06-01 6
500400300200100
0
500400300200100
0
500400300200100
0500400300200100
00 0.2 0.4 0.6 0.8 1
St
x/c=0.45
x/c=0.60
x/c=0.70
x/c=0.80
Figure 10 - Pressure spectra at Y/b = 0.6 for the uncontrolled configuration - a = 3.5°, M0 = 0.82
PSD
(Pa2 /H
z)PS
D (P
a2 /Hz)
PSD
(Pa2 /H
z)PS
D (P
a2 /Hz)
0.38 0.4 0.42 0.44 0.46 0.48 0.5
0.3
0.25
0.2
0.15
0.1
0.05
00.3 0.4 0.5 0.6 0.7 0.8
1.65
1.6
1.55
1.5
1.45
1.4
1.35
1.3
1.25
0.09
0.08
0.07
0.06
0.05
0.04
0.03
0.02
0.01
Mean shock
Mean shock
Separated flowCross flow
y/b=60%
z/c
U/U0su/U0
U/U
0
x/c
x/c
a)
su/U0
0 0.02 0.04 0.06 0.08 0.1 0.12 0.14 0.16 0.18 0.2
Figure 11a presents fields of root-mean-square (RMS) values of the longitudinal velocity, obtained by LDV 3C measurements in the plane y/b = 0.6 (su/U0: RMS of the longitudinal velocity, non-dimension-alized by the free stream velocity). The average location of the lead-ing shock is represented by a dash-dot line. These results show two regions of high RMS values. The first one is around the time-averaged shock location, the second one is in the separated region. The maxi-mum velocity fluctuations are concentrated in the mixing layer above the separated zone, where large vortex structures are present. Below this second region, the backflow characterized by the oil flow visual-ization exhibits a small level of RMS values. This result confirms the unsteady wall pressure measurements in this region. Indeed, fluctua-tions levels are smaller than at the separation point.
The unsteadiness of the shock location can be characterized by high fluctuation levels of the axial component of the velocity at the crossing of the shock. The regions of high RMS values are represented by the gray lines around the time-averaged shock position. This behavior is explained partly by a strong deceleration of the flow at the crossing of the shock, on the one hand and by the shock unsteadiness, on the other hand.
Measurements along a line across the shock (gray dots) are per-formed to quantify the shock displacement (see figure 11a). A large number of samples (one million) have been acquired to insure sta-tistical convergence. For each position, it is possible to compute histograms for each component of the velocity. Figure 11b shows the change in the longitudinal velocity and its fluctuation along this exploration line. The decrease of the axial velocity extends over 4% of the chord, which is very limited compared to the one on a 2D profile. The velocity fluctuation profile has a maximum at the average shock position.
This test case has been computed in ZDES by Brunet & Deck (see [5] for more details on the numerical method). The mesh size is 190.106
cells. Figure 18 shows a Q-criterion iso-surface of the instantaneous flow.
b)
Figure 11 - Uncontrolled configuration a = 3.5º, M0 = 0.82 - Estimation of the shock oscillation amplitude at y/b = 0.6 - (a) LDV iso-contours of RMS longitudinal velocity, (b) time-averaged and RMS longitudinal velocity distributions
Figure 12 - Q-criterion iso-surface a = 3.5º, M0 = 0.82
Then, after these first validation tests, wind tunnel test have been per-formed in the S2Ma wind tunnel of the Onera Modane-Avrieux Center. This wind tunnel allows larger models to be tested. Moreover, it is equipped with a balance, which enables to study the buffet onset by varying the angle of attack of the model.
Issue 6 - June 2013 - Buffet Characterization and Control for Turbulent Wings AL06-01 7
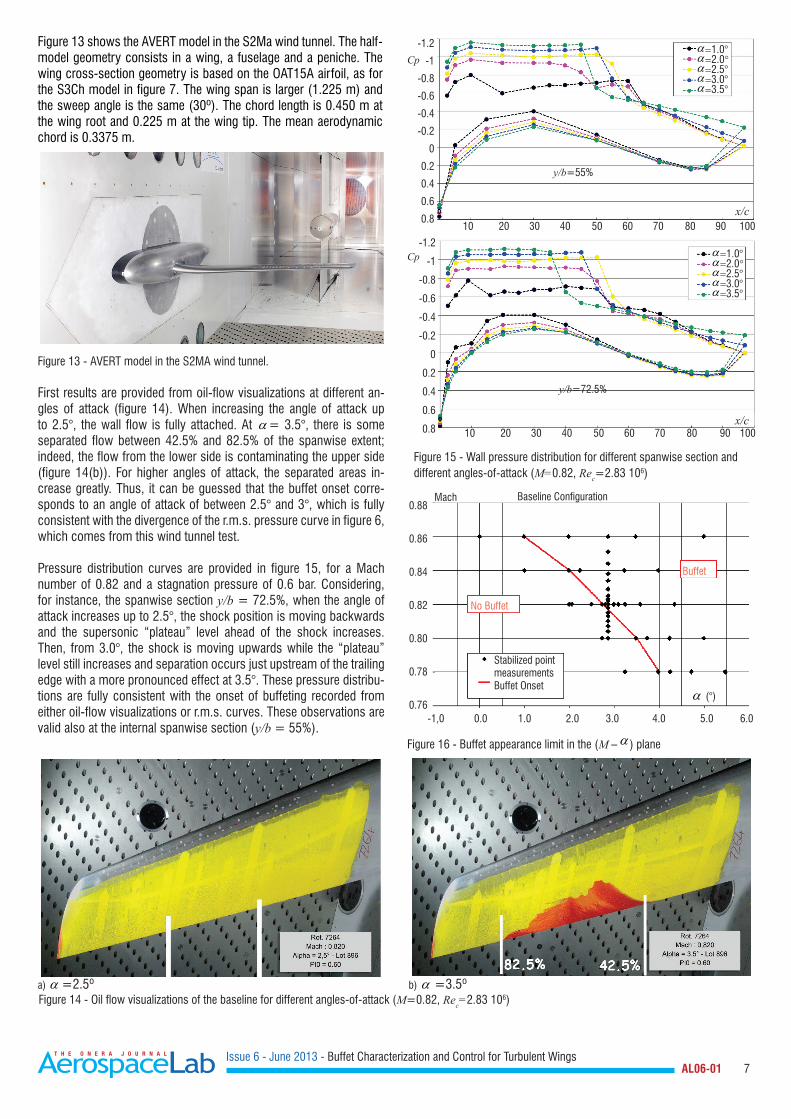
Figure 13 - AVERT model in the S2MA wind tunnel.
First results are provided from oil-flow visualizations at different an-gles of attack (figure 14). When increasing the angle of attack up to 2.5°, the wall flow is fully attached. At a = 3.5°, there is some separated flow between 42.5% and 82.5% of the spanwise extent; indeed, the flow from the lower side is contaminating the upper side (figure 14(b)). For higher angles of attack, the separated areas in-crease greatly. Thus, it can be guessed that the buffet onset corre-sponds to an angle of attack of between 2.5° and 3°, which is fully consistent with the divergence of the r.m.s. pressure curve in figure 6, which comes from this wind tunnel test.
Pressure distribution curves are provided in figure 15, for a Mach number of 0.82 and a stagnation pressure of 0.6 bar. Considering, for instance, the spanwise section y/b = 72.5%, when the angle of attack increases up to 2.5°, the shock position is moving backwards and the supersonic “plateau” level ahead of the shock increases. Then, from 3.0°, the shock is moving upwards while the “plateau” level still increases and separation occurs just upstream of the trailing edge with a more pronounced effect at 3.5°. These pressure distribu-tions are fully consistent with the onset of buffeting recorded from either oil-flow visualizations or r.m.s. curves. These observations are valid also at the internal spanwise section (y/b = 55%).
Figure 13 shows the AVERT model in the S2Ma wind tunnel. The half-model geometry consists in a wing, a fuselage and a peniche. The wing cross-section geometry is based on the OAT15A airfoil, as for the S3Ch model in figure 7. The wing span is larger (1.225 m) and the sweep angle is the same (30º). The chord length is 0.450 m at the wing root and 0.225 m at the wing tip. The mean aerodynamic chord is 0.3375 m.
Figure 15 - Wall pressure distribution for different spanwise section and different angles-of-attack (M=0.82, Rec=2.83 106)
-1.2
-1
-0.8
-0.6
-0.4
-0.2
0
0.2
0.4
0.6
0.8
10 20 30 40 50 60 70 80 90 100
10 20 30 40 50 60 70 80 90 100
a=1.0°a=2.0°a=2.5°a=3.0°a=3.5°
a=1.0°a=2.0°a=2.5°a=3.0°a=3.5°
x/c
x/c
Figure 14 - Oil flow visualizations of the baseline for different angles-of-attack (M=0.82, Rec=2.83 106)
0.88
0.86
0.84
0.82
0.80
0.78
0.76-1,0 0.0 1.0 2.0 3.0 4.0 5.0 6.0
Buffet
No Buffet
Mach
Stabilized pointmeasurementsBuffet Onset
a (°)
Figure 16 - Buffet appearance limit in the (M – a ) plane
Baseline Configuration
y/b=55%
y/b=72.5%
-1.2
-1
-0.8
-0.6
-0.4
-0.2
0
0.2
0.4
0.6
0.8
Cp
Cp
b) a =3.5ºa) a =2.5º
Issue 6 - June 2013 - Buffet Characterization and Control for Turbulent Wings AL06-01 8
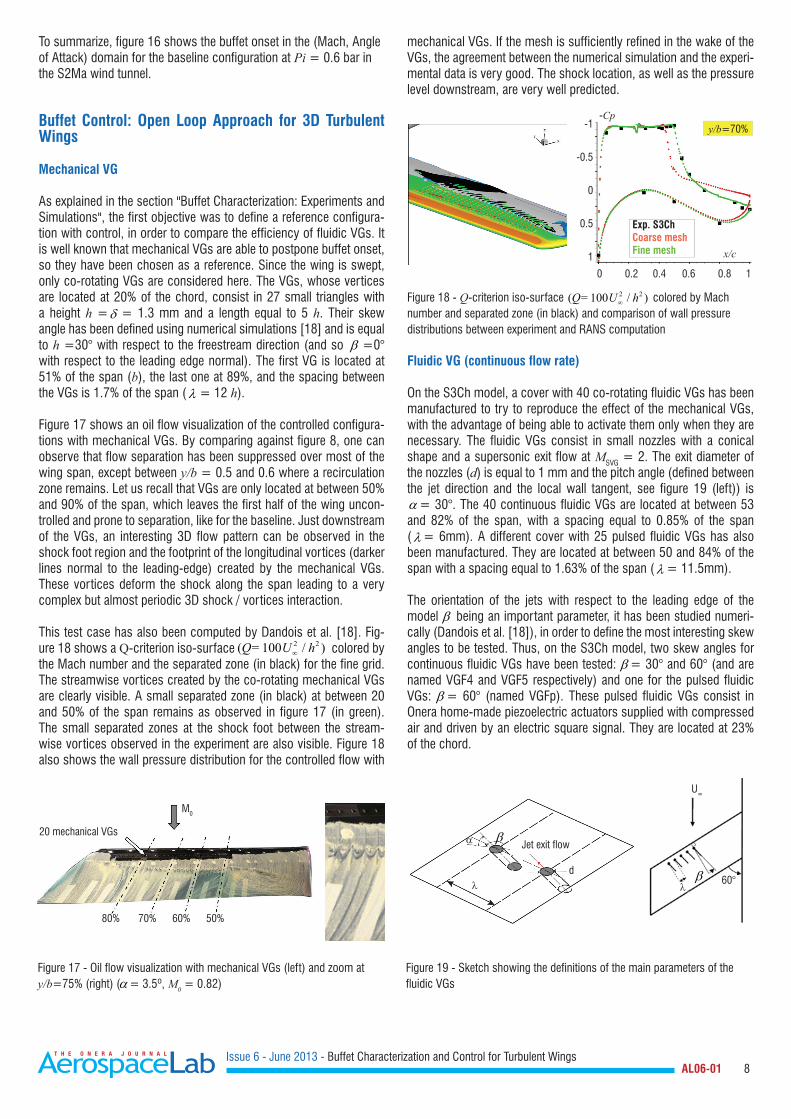
mechanical VGs. If the mesh is sufficiently refined in the wake of the VGs, the agreement between the numerical simulation and the experi-mental data is very good. The shock location, as well as the pressure level downstream, are very well predicted.
To summarize, figure 16 shows the buffet onset in the (Mach, Angle of Attack) domain for the baseline configuration at Pi = 0.6 bar in the S2Ma wind tunnel.
Buffet Control: Open Loop Approach for 3D Turbulent Wings
Mechanical VG
As explained in the section "Buffet Characterization: Experiments and Simulations", the first objective was to define a reference configura-tion with control, in order to compare the efficiency of fluidic VGs. It is well known that mechanical VGs are able to postpone buffet onset, so they have been chosen as a reference. Since the wing is swept, only co-rotating VGs are considered here. The VGs, whose vertices are located at 20% of the chord, consist in 27 small triangles with a height h =δ = 1.3 mm and a length equal to 5 h. Their skew angle has been defined using numerical simulations [18] and is equal to h =30° with respect to the freestream direction (and so β =0° with respect to the leading edge normal). The first VG is located at 51% of the span (b), the last one at 89%, and the spacing between the VGs is 1.7% of the span ( λ = 12 h).
Figure 17 shows an oil flow visualization of the controlled configura-tions with mechanical VGs. By comparing against figure 8, one can observe that flow separation has been suppressed over most of the wing span, except between y/b = 0.5 and 0.6 where a recirculation zone remains. Let us recall that VGs are only located at between 50% and 90% of the span, which leaves the first half of the wing uncon-trolled and prone to separation, like for the baseline. Just downstream of the VGs, an interesting 3D flow pattern can be observed in the shock foot region and the footprint of the longitudinal vortices (darker lines normal to the leading-edge) created by the mechanical VGs. These vortices deform the shock along the span leading to a very complex but almost periodic 3D shock / vortices interaction.
This test case has also been computed by Dandois et al. [18]. Fig-ure 18 shows a Q-criterion iso-surface 2 2 ( = 100 / )Q U h∞ colored by the Mach number and the separated zone (in black) for the fine grid. The streamwise vortices created by the co-rotating mechanical VGs are clearly visible. A small separated zone (in black) at between 20 and 50% of the span remains as observed in figure 17 (in green). The small separated zones at the shock foot between the stream-wise vortices observed in the experiment are also visible. Figure 18 also shows the wall pressure distribution for the controlled flow with
Figure 17 - Oil flow visualization with mechanical VGs (left) and zoom at y/b=75% (right) (a = 3.5º, M0 = 0.82)
80% 70% 60% 50%
M0
20 mechanical VGs
0 0.2 0.4 0.6 0.8 1
-1
-0.5
0
0.5
1
y/b=70%
Exp. S3ChCoarse meshFine mesh x/c
-Cp
Figure 18 - Q-criterion iso-surface 2 2 ( = 100 / )Q U h∞ colored by Mach number and separated zone (in black) and comparison of wall pressure distributions between experiment and RANS computation
Fluidic VG (continuous flow rate)
On the S3Ch model, a cover with 40 co-rotating fluidic VGs has been manufactured to try to reproduce the effect of the mechanical VGs, with the advantage of being able to activate them only when they are necessary. The fluidic VGs consist in small nozzles with a conical shape and a supersonic exit flow at MSVG = 2. The exit diameter of the nozzles (d) is equal to 1 mm and the pitch angle (defined between the jet direction and the local wall tangent, see figure 19 (left)) is a = 30°. The 40 continuous fluidic VGs are located at between 53 and 82% of the span, with a spacing equal to 0.85% of the span ( λ = 6mm). A different cover with 25 pulsed fluidic VGs has also been manufactured. They are located at between 50 and 84% of the span with a spacing equal to 1.63% of the span ( λ = 11.5mm).
The orientation of the jets with respect to the leading edge of the model β being an important parameter, it has been studied numeri-cally (Dandois et al. [18]), in order to define the most interesting skew angles to be tested. Thus, on the S3Ch model, two skew angles for continuous fluidic VGs have been tested: β = 30° and 60° (and are named VGF4 and VGF5 respectively) and one for the pulsed fluidic VGs: β = 60° (named VGFp). These pulsed fluidic VGs consist in Onera home-made piezoelectric actuators supplied with compressed air and driven by an electric square signal. They are located at 23% of the chord.
a βJet exit flow
dλ
U∞
λ60°
Figure 19 - Sketch showing the definitions of the main parameters of the fluidic VGs
β

Issue 6 - June 2013 - Buffet Characterization and Control for Turbulent Wings AL06-01 9
For the fluidic VGs, the momentum coefficient Cμ is defined by:2
2 20 0 0 0
1 12 2
j j j m jS U q UC
SU SUµ
ρ
ρ ρ= =
where jρ and Uj are respectively the density and velocity of the jets (time-averaged in the pulsed blowing case), Sj the sum of all of the orifice surface area based on the hole diameter (not the projected sur-face) and qm is the mass flow rate (time-averaged in the pulsed blow-ing case). When the flow at the exit of the nozzles is supersonic, the Mach number (M = 2) and thus Uj are fixed and only the mass flow rate continues to increase with the air supply stagnation pressure. The variables oρ and U0 are, respectively, the freestream density and velocity of the main flow, the wing area corresponding to a half span being denoted by S.
Figure 20 shows a comparison of the Cp distributions at y/b = 0.7 between the baseline, mechanical and fluidic VGs configurations. This spanwise section is representative of the most separated region on the upper wing. The results show that the control effect on the pressure plateau level upstream of the shock is negligible. The shock location has been shifted more downstream on the wing, at around x/c = 0.55, because of the separation alleviation for all controlled
-1
-0.5
0
0.5
0 20 40 60 80 100
Clean Conf. 1 (VGm)Conf. 2 (VGF4) - Cμ=0.0009Conf. 3 (VGF5) - Cμ=0.0009
VGs
Cp
x/c
0.05
0.04
0.03
0.02
0.01
00 20 40 60 80 100
Clea
n : S
hock
pos
ition
Clean Conf. 1 (VGm)Conf. 2 (VGF4)Conf. 3 (VGF5)
p rms/Q
0
x/c
cases. The shock seems to be located more downstream in the fluidic VGs case than for the mechanical VGs. For this value of the momen-tum coefficient Cµ,, which corresponds to a saturated effect of the fluidic VGs, the skew angle β seems to have no effect on the wall pressure distribution.
The RMS pressure chordwise distributions at y/b = 0.6 (only section equipped with Kulite sensors) of the clean and controlled configura-tions are compared in figure 21. The RMS values are computed on a signal length of 4s. For the three controlled configurations, the maxi-mum level corresponding to the crossing of the shock is located at about x/c = 0.55. More downstream, the pressure fluctuation levels are lower in all controlled configurations than for the baseline. This confirms that unsteadiness in the separated region has been damped with either passive or active control. One can also note that the low-est levels are obtained by fluidic VGs. However, pressure fluctuation levels at the shock location are greater in the controlled cases than for the baseline, because the shock is located between two sensors for the baseline (see the shock position in figure 21) and consequently the peak is not visible in the figure. As for the Cp distribution, there is no significant effect of the skew angle of the fluidic VGs on the RMS pressure distributions.
Figure 20 - Effect of the fluidic VGs mass flow rate on Cp distributions at y/b = 0.7 - a = 3.5°, M0 = 0.82
Figure 21 - Comparison of RMS pressure distributions at y/b = 0.6 a = 3.5°, M0 = 0.82
Figure 22 - Q-criterion iso-surface 2 2 ( = 100 / )Q U h∞ colored by the Mach number and separated zone (in black) showing the streamwise vortices created by the co-rotating fluidic VGs
Issue 6 - June 2013 - Buffet Characterization and Control for Turbulent Wings AL06-01 10
This test case has also been computed by Dandois et al. [18]. Figure 22 displays a Q-criterion iso-surface 2 2 ( = 100 / )Q U h∞ colored by the Mach number and the iso-surface Vx = 0 (streamwise velocity = 0, in black) for the fine overset grid. The streamwise vortices created by the co-rotating fluidic VGs are clearly visible. As observed in the experiment, there remains a small sepa-rated zone between 50 and 60% of the span.
For the S2MA model, like for the S3Ch model, micro-nozzles with a throat diameter of 0.8 mm and an exit diameter d = 1 mm have been used. Since the model is larger than the S3Ch model, there are 50 fluidic VGs instead of 40. They are also located closer to the leading edge at 15% of the chord, in order to be outside the fuel tank region on a real aircraft. They are located between 46% and 89% of the wing span. The spacing between each hole is λ =14.4 d. Like for the S3Ch model, the pitch angle a is fixed equal to 30°. Since on the S3Ch model no difference was observed between the two test-ed skew angles, only β =60° (taken from the normal to the leading edge line) has been tested on this model. The maximum mass flow is 0.5 g.s-1 per hole and the fluidic VGs can operate in continuous blow-ing mode, or in pulsed blowing mode (between 0 and 700 Hz) using piezoelectric actuators inside the model.
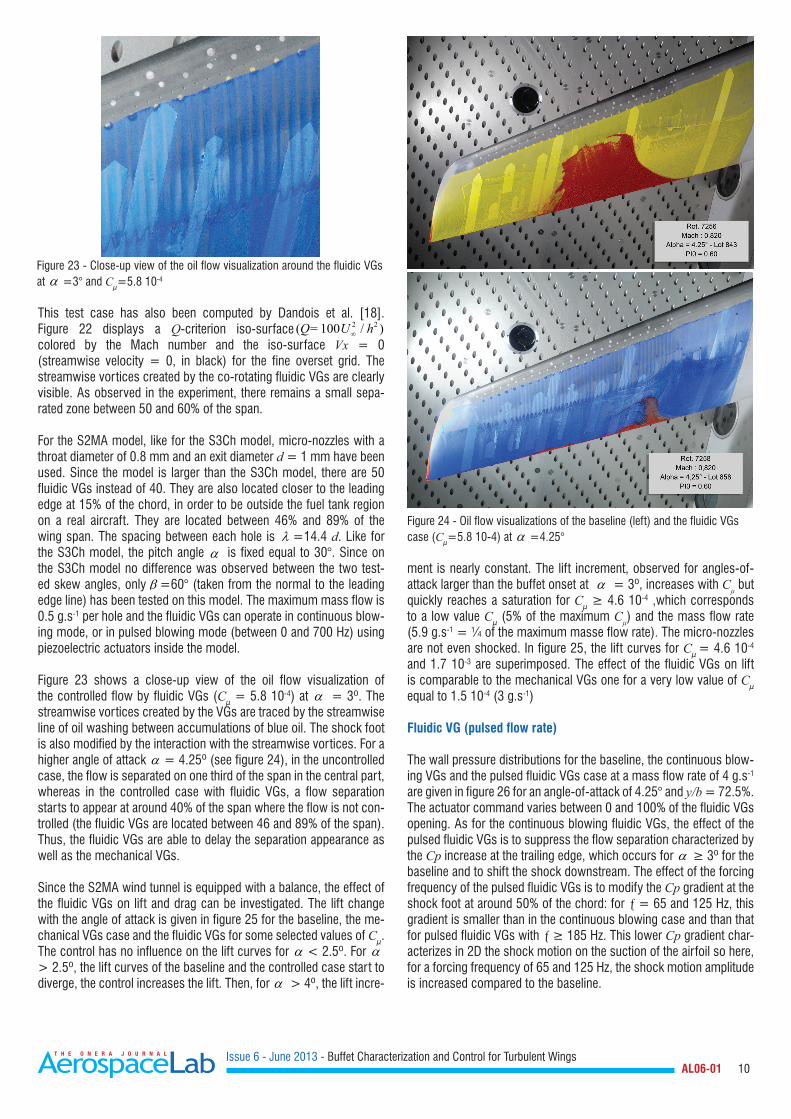
Figure 23 shows a close-up view of the oil flow visualization of the controlled flow by fluidic VGs (Cμ = 5.8 10-4) at a = 3º. The streamwise vortices created by the VGs are traced by the streamwise line of oil washing between accumulations of blue oil. The shock foot is also modified by the interaction with the streamwise vortices. For a higher angle of attack a = 4.25º (see figure 24), in the uncontrolled case, the flow is separated on one third of the span in the central part, whereas in the controlled case with fluidic VGs, a flow separation starts to appear at around 40% of the span where the flow is not con-trolled (the fluidic VGs are located between 46 and 89% of the span). Thus, the fluidic VGs are able to delay the separation appearance as well as the mechanical VGs.
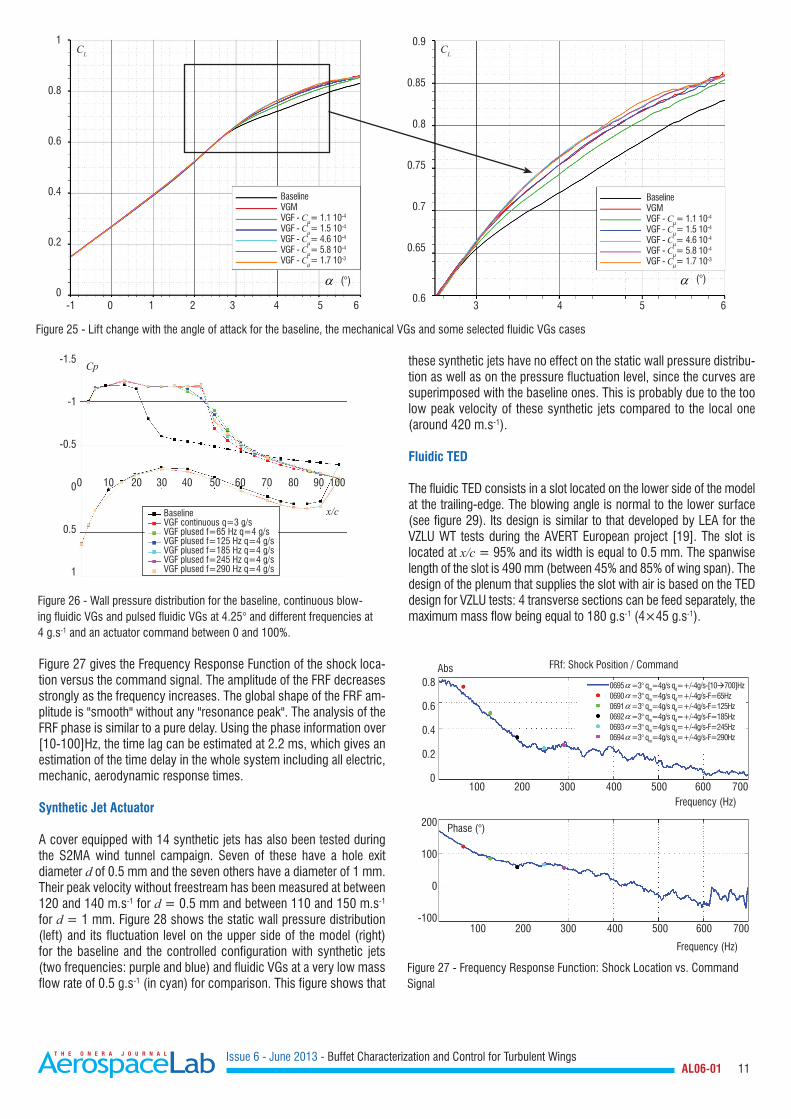
Since the S2MA wind tunnel is equipped with a balance, the effect of the fluidic VGs on lift and drag can be investigated. The lift change with the angle of attack is given in figure 25 for the baseline, the me-chanical VGs case and the fluidic VGs for some selected values of Cμ. The control has no influence on the lift curves for a < 2.5º. For a > 2.5º, the lift curves of the baseline and the controlled case start to diverge, the control increases the lift. Then, for a > 4º, the lift incre-
Figure 23 - Close-up view of the oil flow visualization around the fluidic VGs at a =3° and Cμ=5.8 10-4
Figure 24 - Oil flow visualizations of the baseline (left) and the fluidic VGs case (Cμ=5.8 10-4) at a =4.25°
ment is nearly constant. The lift increment, observed for angles-of-attack larger than the buffet onset at a = 3º, increases with Cμ but quickly reaches a saturation for Cμ≥4.610
-4 ,which corresponds to a low value Cμ (5% of the maximum Cμ) and the mass flow rate (5.9 g.s-1 = ¼ of the maximum masse flow rate). The micro-nozzles are not even shocked. In figure 25, the lift curves for Cμ = 4.6 10-4
and 1.7 10-3 are superimposed. The effect of the fluidic VGs on lift is comparable to the mechanical VGs one for a very low value of Cμ equal to 1.5 10-4 (3 g.s-1)
Fluidic VG (pulsed flow rate)
The wall pressure distributions for the baseline, the continuous blow-ing VGs and the pulsed fluidic VGs case at a mass flow rate of 4 g.s-1 are given in figure 26 for an angle-of-attack of 4.25° and y/b = 72.5%. The actuator command varies between 0 and 100% of the fluidic VGs opening. As for the continuous blowing fluidic VGs, the effect of the pulsed fluidic VGs is to suppress the flow separation characterized by the Cp increase at the trailing edge, which occurs for a ≥3ºforthebaseline and to shift the shock downstream. The effect of the forcing frequency of the pulsed fluidic VGs is to modify the Cp gradient at the shock foot at around 50% of the chord: for ƒ = 65 and 125 Hz, this gradient is smaller than in the continuous blowing case and than that for pulsed fluidic VGs with ƒ≥185Hz.ThislowerCp gradient char-acterizes in 2D the shock motion on the suction of the airfoil so here, for a forcing frequency of 65 and 125 Hz, the shock motion amplitude is increased compared to the baseline.
Issue 6 - June 2013 - Buffet Characterization and Control for Turbulent Wings AL06-01 11
0.8
0.6
0.4
0.2
0100 200 300 400 500 600 700
100 200 300 400 500 600 700
200
100
0
-100
Phase (°)
Abs
Frequency (Hz)
Frequency (Hz)
FRf: Shock Position / Command
0695 a=3° qm=4g/s qd=+/-4g/s-[10700]Hz0690 a=3° qm=4g/s qd=+/-4g/s-F=65Hz0691 a=3° qm=4g/s qd=+/-4g/s-F=125Hz0692 a=3° qm=4g/s qd=+/-4g/s-F=185Hz0693 a=3° qm=4g/s qd=+/-4g/s-F=245Hz0694 a=3° qm=4g/s qd=+/-4g/s-F=290Hz
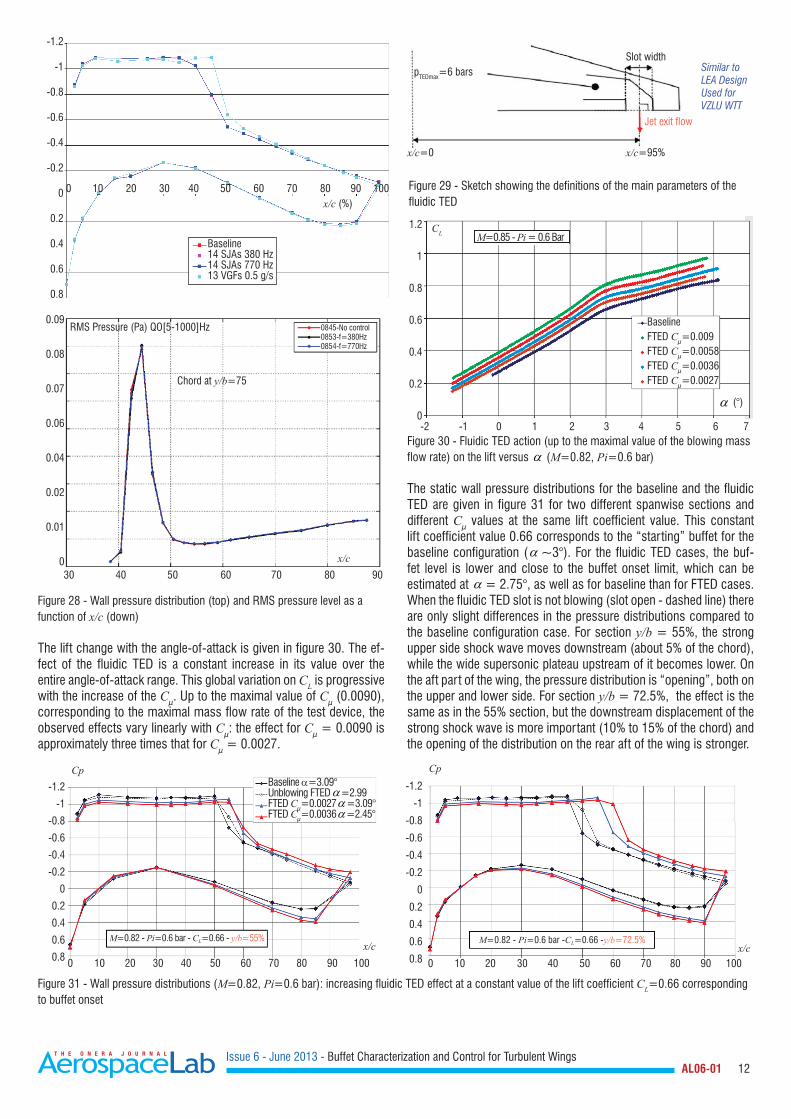
these synthetic jets have no effect on the static wall pressure distribu-tion as well as on the pressure fluctuation level, since the curves are superimposed with the baseline ones. This is probably due to the too low peak velocity of these synthetic jets compared to the local one (around 420 m.s-1). Fluidic TED
The fluidic TED consists in a slot located on the lower side of the model at the trailing-edge. The blowing angle is normal to the lower surface (see figure 29). Its design is similar to that developed by LEA for the VZLU WT tests during the AVERT European project [19]. The slot is located at x/c = 95% and its width is equal to 0.5 mm. The spanwise length of the slot is 490 mm (between 45% and 85% of wing span). The design of the plenum that supplies the slot with air is based on the TED design for VZLU tests: 4 transverse sections can be feed separately, the maximum mass flow being equal to 180 g.s-1 (4×45 g.s-1).
-1.5
-1
-0.5
0
0.5
1
0 10 20 30 40 50 60 70 80 90 100
x/c
Cp
BaselineVGF continuous q=3 g/sVGF plused f=65 Hz q=4 g/sVGF plused f=125 Hz q=4 g/sVGF plused f=185 Hz q=4 g/sVGF plused f=245 Hz q=4 g/sVGF plused f=290 Hz q=4 g/s
Figure 27 gives the Frequency Response Function of the shock loca-tion versus the command signal. The amplitude of the FRF decreases strongly as the frequency increases. The global shape of the FRF am-plitude is "smooth" without any "resonance peak". The analysis of the FRF phase is similar to a pure delay. Using the phase information over [10-100]Hz, the time lag can be estimated at 2.2 ms, which gives an estimation of the time delay in the whole system including all electric, mechanic, aerodynamic response times.
Synthetic Jet Actuator
A cover equipped with 14 synthetic jets has also been tested during the S2MA wind tunnel campaign. Seven of these have a hole exit diameter d of 0.5 mm and the seven others have a diameter of 1 mm. Their peak velocity without freestream has been measured at between 120 and 140 m.s-1 for d = 0.5 mm and between 110 and 150 m.s-1 for d = 1 mm. Figure 28 shows the static wall pressure distribution (left) and its fluctuation level on the upper side of the model (right) for the baseline and the controlled configuration with synthetic jets (two frequencies: purple and blue) and fluidic VGs at a very low mass flow rate of 0.5 g.s-1 (in cyan) for comparison. This figure shows that
Figure 26 - Wall pressure distribution for the baseline, continuous blow-ing fluidic VGs and pulsed fluidic VGs at 4.25° and different frequencies at 4 g.s-1 and an actuator command between 0 and 100%.
-1 0 1 2 3 4 5 6 3 4 5 6
1
0.8
0.6
0.4
0.2
0
0.9
0.85
0.8
0.75
0.7
0.65
0.6
Baseline VGM VGF - Cμ= 1.1 10-4
VGF - Cμ= 1.5 10-4
VGF - Cμ= 4.6 10-4
VGF - Cμ= 5.8 10-4
VGF - Cμ= 1.7 10-3
Baseline VGM VGF - Cμ= 1.1 10-4
VGF - Cμ= 1.5 10-4
VGF - Cμ= 4.6 10-4
VGF - Cμ= 5.8 10-4
VGF - Cμ= 1.7 10-3
Figure 25 - Lift change with the angle of attack for the baseline, the mechanical VGs and some selected fluidic VGs cases
CL
a (°)
Figure 27 - Frequency Response Function: Shock Location vs. Command Signal
CL
a (°)
Issue 6 - June 2013 - Buffet Characterization and Control for Turbulent Wings AL06-01 12
Slot widthpTEDmax=6 bars
Jet exit flow
x/c=0 x/c=95%
Similar to LEA DesignUsed forVZLU WTT
Figure 31 - Wall pressure distributions (M=0.82, Pi=0.6 bar): increasing fluidic TED effect at a constant value of the lift coefficient CL=0.66 corresponding to buffet onset
-1.2
-1
-0.8
-0.6
-0.4
-0.2
0
0.2
0.4
0.6
0.8
-1.2
-1
-0.8
-0.6
-0.4
-0.2
0
0.2
0.4
0.6
0.8
Baseline a=3.09°Unblowing FTED a=2.99FTED Cμ=0.0027 a=3.09°FTED Cμ=0.0036 a=2.45°
0 10 20 30 40 50 60 70 80 90 1000 10 20 30 40 50 60 70 80 90 100
M=0.82 - Pi=0.6 bar - CL=0.66 - y/b=55% M=0.82 - Pi=0.6 bar -CL=0.66 -y/b=72.5%
Cp
x/cx/c
Cp
0845-No control0853-f=380Hz0854-f=770Hz
30 40 50 60 70 80 90
RMS Pressure (Pa) QO[5-1000]Hz
x/c
1.2
1
0.8
0.6
0.4
0.2
0-2 -1 0 1 2 3 4 5 6 7
BaselineFTED Cμ=0.009FTED Cμ=0.0058FTED Cμ=0.0036FTED Cμ=0.0027
a (°)
CL M=0.85 - Pi = 0.6 Bar
0 10 20 30 40 50 60 70 80 90 100
Baseline14 SJAs 380 Hz14 SJAs 770 Hz13 VGFs 0.5 g/s
x/c (%)
Chord at y/b=75
-1.2
-1
-0.8
-0.6
-0.4
-0.2
0
0.2
0.4
0.6
0.8
0.09
0.08
0.07
0.06
0.04
0.02
0.01
0
Figure 28 - Wall pressure distribution (top) and RMS pressure level as a function of x/c (down)
The lift change with the angle-of-attack is given in figure 30. The ef-fect of the fluidic TED is a constant increase in its value over the entire angle-of-attack range. This global variation on CL is progressive with the increase of the Cμ. Up to the maximal value of Cμ (0.0090), corresponding to the maximal mass flow rate of the test device, the observed effects vary linearly with Cμ: the effect for Cμ = 0.0090 is approximately three times that for Cμ = 0.0027.
Figure 30 - Fluidic TED action (up to the maximal value of the blowing mass flow rate) on the lift versus a (M=0.82, Pi=0.6 bar)
The static wall pressure distributions for the baseline and the fluidic TED are given in figure 31 for two different spanwise sections and different Cμ values at the same lift coefficient value. This constant lift coefficient value 0.66 corresponds to the “starting” buffet for the baseline configuration (a ~3°). For the fluidic TED cases, the buf-fet level is lower and close to the buffet onset limit, which can be estimated at a = 2.75°, as well as for baseline than for FTED cases.When the fluidic TED slot is not blowing (slot open - dashed line) there are only slight differences in the pressure distributions compared to the baseline configuration case. For section y/b = 55%, the strong upper side shock wave moves downstream (about 5% of the chord), while the wide supersonic plateau upstream of it becomes lower. On the aft part of the wing, the pressure distribution is “opening”, both on the upper and lower side. For section y/b = 72.5%, the effect is the same as in the 55% section, but the downstream displacement of the strong shock wave is more important (10% to 15% of the chord) and the opening of the distribution on the rear aft of the wing is stronger.
Figure 29 - Sketch showing the definitions of the main parameters of the fluidic TED
Issue 6 - June 2013 - Buffet Characterization and Control for Turbulent Wings AL06-01 13
Open Loop Result Summary
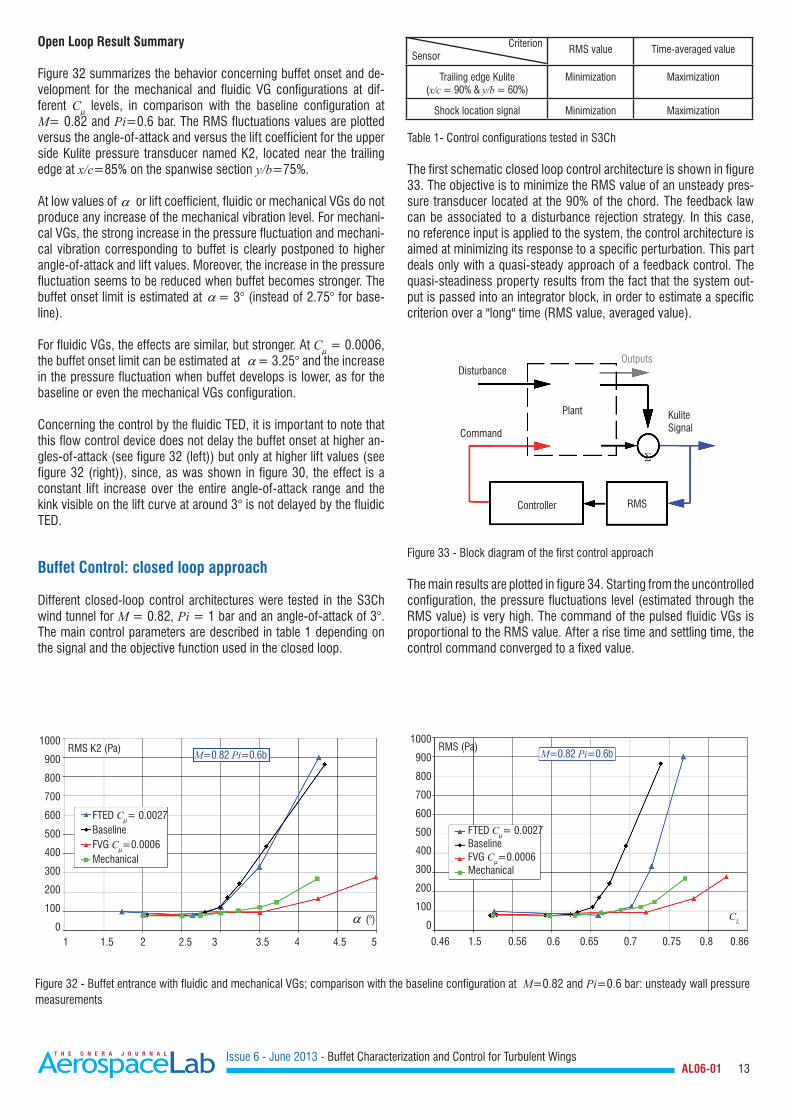
Figure 32 summarizes the behavior concerning buffet onset and de-velopment for the mechanical and fluidic VG configurations at dif-ferent Cμ levels, in comparison with the baseline configuration at M= 0.82 and Pi=0.6 bar. The RMS fluctuations values are plotted versus the angle-of-attack and versus the lift coefficient for the upper side Kulite pressure transducer named K2, located near the trailing edge at x/c=85% on the spanwise section y/b=75%.
At low values of a or lift coefficient, fluidic or mechanical VGs do not produce any increase of the mechanical vibration level. For mechani-cal VGs, the strong increase in the pressure fluctuation and mechani-cal vibration corresponding to buffet is clearly postponed to higher angle-of-attack and lift values. Moreover, the increase in the pressure fluctuation seems to be reduced when buffet becomes stronger. The buffet onset limit is estimated at a = 3° (instead of 2.75° for base-line).
For fluidic VGs, the effects are similar, but stronger. At Cμ = 0.0006, the buffet onset limit can be estimated at a = 3.25° and the increase in the pressure fluctuation when buffet develops is lower, as for the baseline or even the mechanical VGs configuration.
Concerning the control by the fluidic TED, it is important to note that this flow control device does not delay the buffet onset at higher an-gles-of-attack (see figure 32 (left)) but only at higher lift values (see figure 32 (right)), since, as was shown in figure 30, the effect is a constant lift increase over the entire angle-of-attack range and the kink visible on the lift curve at around 3° is not delayed by the fluidic TED.
Buffet Control: closed loop approach
Different closed-loop control architectures were tested in the S3Ch wind tunnel for M = 0.82, Pi = 1 bar and an angle-of-attack of 3°. The main control parameters are described in table 1 depending on the signal and the objective function used in the closed loop.
1000
900
800
700
600
500
400
300
200
100
01 1.5 2 2.5 3 3.5 4 4.5 5
FTED Cμ= 0.0027BaselineFVG Cμ=0.0006Mechanical
M=0.82 Pi=0.6b M=0.82 Pi=0.6b1000
900
800
700
600
500
400
300
200
100
0
0.46 1.5 0.56 0.6 0.65 0.7 0.75 0.8 0.86
FTED Cμ= 0.0027BaselineFVG Cμ=0.0006Mechanical
RMS K2 (Pa) RMS (Pa)
CLa (°)
CriterionSensor
RMS value Time-averaged value
Trailing edge Kulite(x/c = 90% & y/b = 60%)
Minimization Maximization
Shock location signal Minimization Maximization
DisturbanceOutputs
KuliteSignal
RMSController
Command
Plant
Σ
Figure 32 - Buffet entrance with fluidic and mechanical VGs; comparison with the baseline configuration at M=0.82 and Pi=0.6 bar: unsteady wall pressure measurements
Table 1- Control configurations tested in S3Ch
The first schematic closed loop control architecture is shown in figure 33. The objective is to minimize the RMS value of an unsteady pres-sure transducer located at the 90% of the chord. The feedback law can be associated to a disturbance rejection strategy. In this case, no reference input is applied to the system, the control architecture is aimed at minimizing its response to a specific perturbation. This part deals only with a quasi-steady approach of a feedback control. The quasi-steadiness property results from the fact that the system out-put is passed into an integrator block, in order to estimate a specific criterion over a "long" time (RMS value, averaged value).
Figure 33 - Block diagram of the first control approach
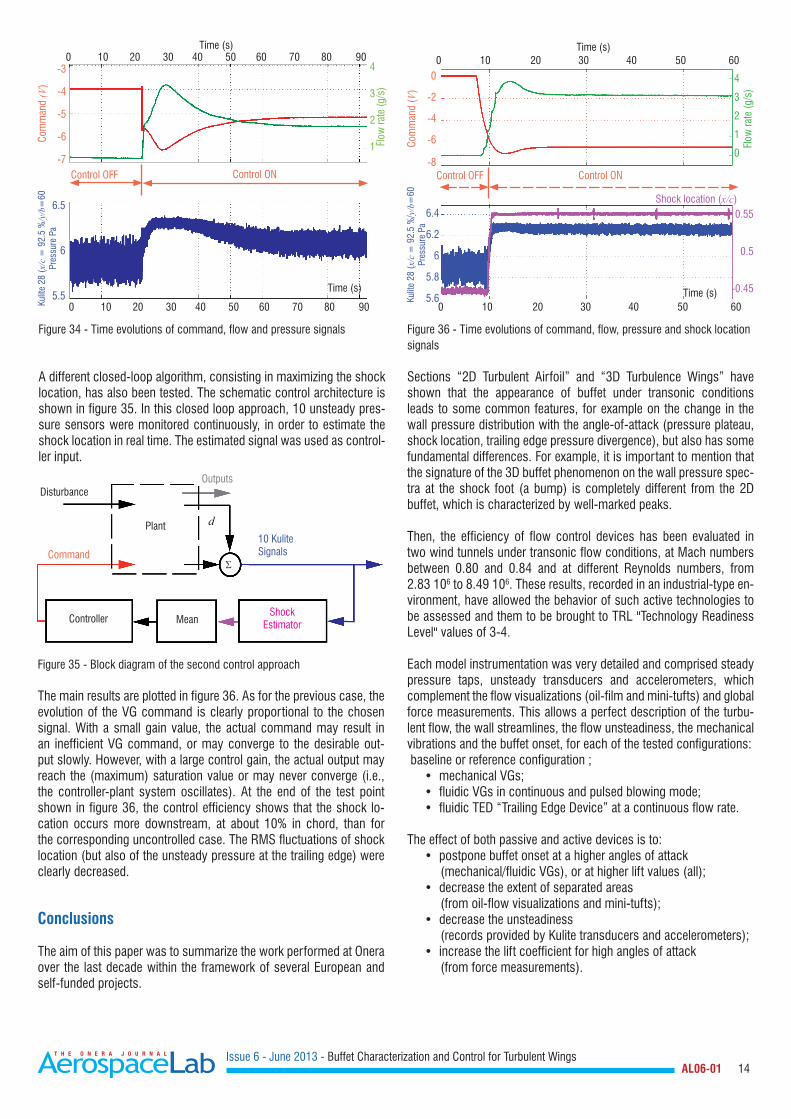
The main results are plotted in figure 34. Starting from the uncontrolled configuration, the pressure fluctuations level (estimated through the RMS value) is very high. The command of the pulsed fluidic VGs is proportional to the RMS value. After a rise time and settling time, the control command converged to a fixed value.
Issue 6 - June 2013 - Buffet Characterization and Control for Turbulent Wings AL06-01 14
0 10 20 30 40 50 60
Control ON
0
-2
-4
-6
-8
6.4
6.2
6
5.8
5.6
4
3
2
1
0
Kulit
e 28
(x/c
= 9
2.5
%/y
/b=
60
Pres
sure
Pa
Com
man
d (V
)
Flow
rate
(g/s
)
Control OFF
0 10 20 30 40 50 60Time (s)
Time (s)
0.55
0.5
-0.45
Shock location (x/c)
Figure 34 - Time evolutions of command, flow and pressure signals
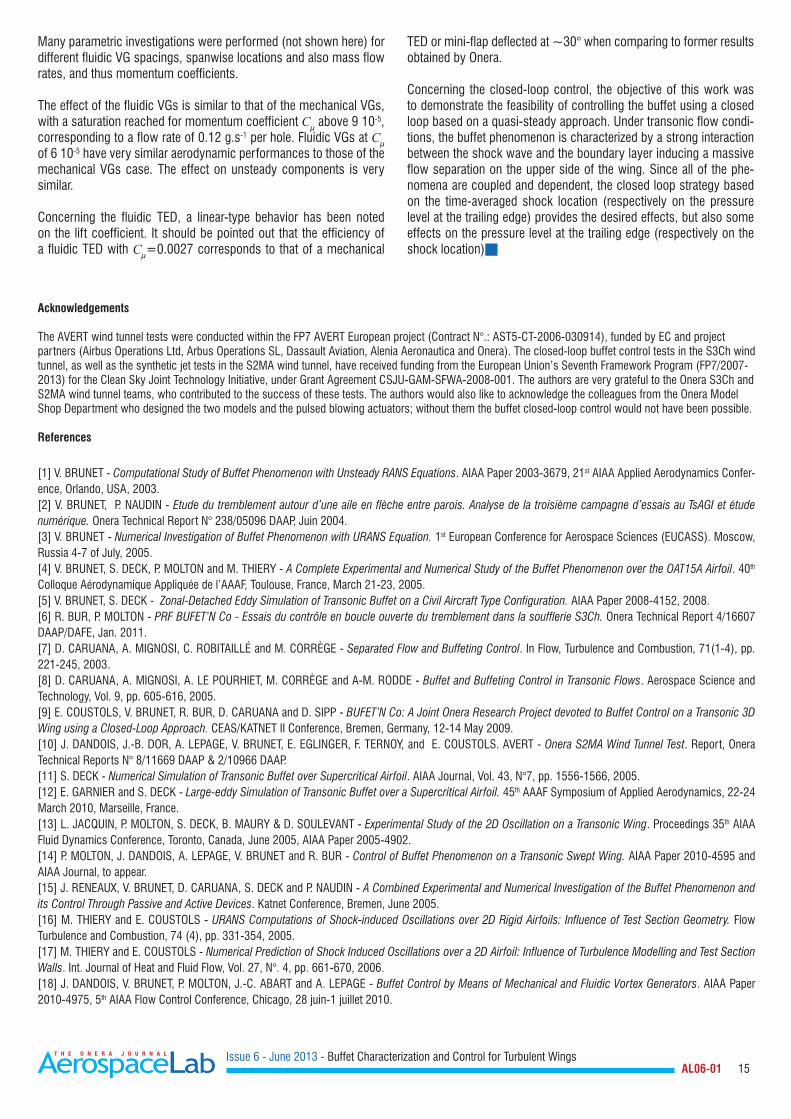
A different closed-loop algorithm, consisting in maximizing the shock location, has also been tested. The schematic control architecture is shown in figure 35. In this closed loop approach, 10 unsteady pres-sure sensors were monitored continuously, in order to estimate the shock location in real time. The estimated signal was used as control-ler input.
Figure 35 - Block diagram of the second control approach
The main results are plotted in figure 36. As for the previous case, the evolution of the VG command is clearly proportional to the chosen signal. With a small gain value, the actual command may result in an inefficient VG command, or may converge to the desirable out-put slowly. However, with a large control gain, the actual output may reach the (maximum) saturation value or may never converge (i.e., the controller-plant system oscillates). At the end of the test point shown in figure 36, the control efficiency shows that the shock lo-cation occurs more downstream, at about 10% in chord, than for the corresponding uncontrolled case. The RMS fluctuations of shock location (but also of the unsteady pressure at the trailing edge) were clearly decreased.
Conclusions
The aim of this paper was to summarize the work performed at Onera over the last decade within the framework of several European and self-funded projects.
0 10 20 30 40 50 60 70 80 90
0 10 20 30 40 50 60 70 80 90
Control ONControl OFF
-3
-4
-5
-6
-7
6.5
6
5.5
4
3
2
1
Time (s)
Time (s)Ku
lite
28 (x
/c =
92.
5 %
/y/b
=60
Pr
essu
re P
aCo
mm
and
(V)
Flow
rate
(g/s
)
Disturbance
Controller MeanShock
Estimator
Outputs
dPlant
ΣCommand
10 KuliteSignals
Sections “2D Turbulent Airfoil” and “3D Turbulence Wings” have shown that the appearance of buffet under transonic conditions leads to some common features, for example on the change in the wall pressure distribution with the angle-of-attack (pressure plateau, shock location, trailing edge pressure divergence), but also has some fundamental differences. For example, it is important to mention that the signature of the 3D buffet phenomenon on the wall pressure spec-tra at the shock foot (a bump) is completely different from the 2D buffet, which is characterized by well-marked peaks.
Then, the efficiency of flow control devices has been evaluated in two wind tunnels under transonic flow conditions, at Mach numbers between 0.80 and 0.84 and at different Reynolds numbers, from 2.83 106 to 8.49 106. These results, recorded in an industrial-type en-vironment, have allowed the behavior of such active technologies to be assessed and them to be brought to TRL "Technology Readiness Level" values of 3-4.
Each model instrumentation was very detailed and comprised steady pressure taps, unsteady transducers and accelerometers, which complement the flow visualizations (oil-film and mini-tufts) and global force measurements. This allows a perfect description of the turbu-lent flow, the wall streamlines, the flow unsteadiness, the mechanical vibrations and the buffet onset, for each of the tested configurations: baseline or reference configuration ;• mechanical VGs;• fluidic VGs in continuous and pulsed blowing mode;• fluidic TED “Trailing Edge Device” at a continuous flow rate.
The effect of both passive and active devices is to:• postpone buffet onset at a higher angles of attack
(mechanical/fluidic VGs), or at higher lift values (all);• decrease the extent of separated areas
(from oil-flow visualizations and mini-tufts);• decrease the unsteadiness
(records provided by Kulite transducers and accelerometers);• increase the lift coefficient for high angles of attack
(from force measurements).
Figure 36 - Time evolutions of command, flow, pressure and shock location signals
Issue 6 - June 2013 - Buffet Characterization and Control for Turbulent Wings AL06-01 15
Many parametric investigations were performed (not shown here) for different fluidic VG spacings, spanwise locations and also mass flow rates, and thus momentum coefficients.
The effect of the fluidic VGs is similar to that of the mechanical VGs, with a saturation reached for momentum coefficient Cμ above 9 10-5, corresponding to a flow rate of 0.12 g.s-1 per hole. Fluidic VGs at Cμ of 6 10-5 have very similar aerodynamic performances to those of the mechanical VGs case. The effect on unsteady components is very similar.
Concerning the fluidic TED, a linear-type behavior has been noted on the lift coefficient. It should be pointed out that the efficiency of a fluidic TED with Cμ=0.0027 corresponds to that of a mechanical
TED or mini-flap deflected at ~30° when comparing to former results obtained by Onera.
Concerning the closed-loop control, the objective of this work was to demonstrate the feasibility of controlling the buffet using a closed loop based on a quasi-steady approach. Under transonic flow condi-tions, the buffet phenomenon is characterized by a strong interaction between the shock wave and the boundary layer inducing a massive flow separation on the upper side of the wing. Since all of the phe-nomena are coupled and dependent, the closed loop strategy based on the time-averaged shock location (respectively on the pressure level at the trailing edge) provides the desired effects, but also some effects on the pressure level at the trailing edge (respectively on the shock location)
Acknowledgements
The AVERT wind tunnel tests were conducted within the FP7 AVERT European project (Contract N°.: AST5-CT-2006-030914), funded by EC and project partners (Airbus Operations Ltd, Arbus Operations SL, Dassault Aviation, Alenia Aeronautica and Onera). The closed-loop buffet control tests in the S3Ch wind tunnel, as well as the synthetic jet tests in the S2MA wind tunnel, have received funding from the European Union’s Seventh Framework Program (FP7/2007-2013) for the Clean Sky Joint Technology Initiative, under Grant Agreement CSJU-GAM-SFWA-2008-001. The authors are very grateful to the Onera S3Ch and S2MA wind tunnel teams, who contributed to the success of these tests. The authors would also like to acknowledge the colleagues from the Onera Model Shop Department who designed the two models and the pulsed blowing actuators; without them the buffet closed-loop control would not have been possible.
References
[1] V. BRUNET - Computational Study of Buffet Phenomenon with Unsteady RANS Equations. AIAA Paper 2003-3679, 21st AIAA Applied Aerodynamics Confer-ence, Orlando, USA, 2003.[2] V. BRUNET, P. NAUDIN - Etude du tremblement autour d’une aile en flèche entre parois. Analyse de la troisième campagne d’essais au TsAGI et étude numérique. Onera Technical Report N° 238/05096 DAAP, Juin 2004.[3] V. BRUNET - Numerical Investigation of Buffet Phenomenon with URANS Equation. 1st European Conference for Aerospace Sciences (EUCASS). Moscow, Russia 4-7 of July, 2005.[4] V. BRUNET, S. DECK, P. MOLTON and M. THIERY - A Complete Experimental and Numerical Study of the Buffet Phenomenon over the OAT15A Airfoil. 40th Colloque Aérodynamique Appliquée de l’AAAF, Toulouse, France, March 21-23, 2005.[5] V. BRUNET, S. DECK - Zonal-Detached Eddy Simulation of Transonic Buffet on a Civil Aircraft Type Configuration. AIAA Paper 2008-4152, 2008.[6] R. BUR, P. MOLTON - PRF BUFET’N Co - Essais du contrôle en boucle ouverte du tremblement dans la soufflerie S3Ch. Onera Technical Report 4/16607 DAAP/DAFE, Jan. 2011.[7] D. CARUANA, A. MIGNOSI, C. ROBITAILLÉ and M. CORRÈGE - Separated Flow and Buffeting Control. In Flow, Turbulence and Combustion, 71(1-4), pp. 221-245, 2003.[8] D. CARUANA, A. MIGNOSI, A. LE POURHIET, M. CORRÈGE and A-M. RODDE - Buffet and Buffeting Control in Transonic Flows. Aerospace Science and Technology, Vol. 9, pp. 605-616, 2005.[9] E. COUSTOLS, V. BRUNET, R. BUR, D. CARUANA and D. SIPP - BUFET’N Co: A Joint Onera Research Project devoted to Buffet Control on a Transonic 3D Wing using a Closed-Loop Approach. CEAS/KATNET II Conference, Bremen, Germany, 12-14 May 2009.[10] J. DANDOIS, J.-B. DOR, A. LEPAGE, V. BRUNET, E. EGLINGER, F. TERNOY, and E. COUSTOLS. AVERT - Onera S2MA Wind Tunnel Test. Report, Onera Technical Reports N° 8/11669 DAAP & 2/10966 DAAP.[11] S. DECK - Numerical Simulation of Transonic Buffet over Supercritical Airfoil. AIAA Journal, Vol. 43, N°7, pp. 1556-1566, 2005.[12] E. GARNIER and S. DECK - Large-eddy Simulation of Transonic Buffet over a Supercritical Airfoil. 45th AAAF Symposium of Applied Aerodynamics, 22-24 March 2010, Marseille, France.[13] L. JACQUIN, P. MOLTON, S. DECK, B. MAURY & D. SOULEVANT - Experimental Study of the 2D Oscillation on a Transonic Wing. Proceedings 35th AIAA Fluid Dynamics Conference, Toronto, Canada, June 2005, AIAA Paper 2005-4902.[14] P. MOLTON, J. DANDOIS, A. LEPAGE, V. BRUNET and R. BUR - Control of Buffet Phenomenon on a Transonic Swept Wing. AIAA Paper 2010-4595 and AIAA Journal, to appear.[15] J. RENEAUX, V. BRUNET, D. CARUANA, S. DECK and P. NAUDIN - A Combined Experimental and Numerical Investigation of the Buffet Phenomenon and its Control Through Passive and Active Devices. Katnet Conference, Bremen, June 2005.[16] M. THIERY and E. COUSTOLS - URANS Computations of Shock-induced Oscillations over 2D Rigid Airfoils: Influence of Test Section Geometry. Flow Turbulence and Combustion, 74 (4), pp. 331-354, 2005.[17] M. THIERY and E. COUSTOLS - Numerical Prediction of Shock Induced Oscillations over a 2D Airfoil: Influence of Turbulence Modelling and Test Section Walls. Int. Journal of Heat and Fluid Flow, Vol. 27, N°. 4, pp. 661-670, 2006.[18] J. DANDOIS, V. BRUNET, P. MOLTON, J.-C. ABART and A. LEPAGE - Buffet Control by Means of Mechanical and Fluidic Vortex Generators. AIAA Paper 2010-4975, 5th AIAA Flow Control Conference, Chicago, 28 juin-1 juillet 2010.

Issue 6 - June 2013 - Buffet Characterization and Control for Turbulent Wings AL06-01 16
[19] J. DANDOIS, C. GLEYZES, J.-B. DOR, F. TERNOY and E. COUSTOLS - Report on the VZLU Wind Tunnel Test Analysis & report on the 3D RANS and URANS Computations of Mechanical/Fluidic VGs and Fluidic TEDs. AVERT deliverables D1.3-3 & D1.3-8, June 2010.[20] R. BUR, B. CORBEL AND J. DÉLERY - Study of Passive Control in a Transonic Shock Wave / Boundary Layer Interaction. AIAA Journal, Vol. 36, N°. 3, pp. 394-400, 1998.[21] A.N. SMITH, H.A. HOLDEN, H. BABINSKY, J.L. FULKER and P.R. ASHILL - Normal Shock-Wave/Turbulent Boundary Layer Interactions in the Presence of Streamwise Slots and Grooves. Aeronautical Journal, Vol. 106, pp. 493-500, 2003.[22] H.A. HOLDEN and H. BABINSKY - Separated Shock-Boundary-Layer Interaction Control Using Streamwise Slots. Journal of Aircraft, Vol. 42, N°. 1, pp. 166-17, 2005.[23] E. STANEWSKY, J. DÉLERY, J.L. FULKER AND W. GEISSLER - Synopsis of the Project EUROSHOCK. Notes on Numerical Fluid Mechanics: Drag Reduction by Passive Shock Control - Results of the Project EUROSHOCK, Vol. 56, Vieweg Ed., Wiesbaden (Germany), pp. 1-81, 1997.[24] J. DÉLERY and R. BUR - The Physics of Shock Wave / Boundary Layer Interaction Control: Last Lessons Learned. Proceedings of the ECCOMAS 2000 Congress, Barcelona (Spain), Sept. 11-14, 2000.[25] E. STANEWSKY, J. DÉLERY, J.L. FULKER and P. DE MATTEIS - Synopsis of the Project EUROSHOCK II. Notes on Numerical Fluid Mechanics and Multidis-ciplinary Design: Drag Reduction by Shock and Boundary Layer Control - Results of the Project EUROSHOCK II, Vol. 80, Springer Ed., Berlin (Germany), pp. 1-124, 2002.[26] J. BIRKEMEYER, H. ROSEMANN and E. STANEWSKY - Shock Control on a Swept Wing. Aerospace Science and Technology, Vol. 4, pp. 147-156, 2000.[27] W.S. WONG, N. QIN, N. SELLARS, H.A. HOLDEN and H. BABINSKY - A Combined Experimental and Numerical Study of Flow Structures over Three-Dimensional Shock Control Bumps. Aerospace Science and Technology, Vol. 12, pp. 436-447, 2008.[28] H. OGAWA, H. BABINSKY, M. PÄTZOLD and T. LUTZ - Shock-Wave / Boundary-Layer Interaction Control Using Three-Dimensional Bumps for Transonic Wings. AIAA Journal, Vol. 46, N°. 6, pp. 1442-1452, 2008.[29] S.P. COLLISS, H. BABINSKY, P.J.K. BRUCE, K. NÜBLER and T. LUTZ - An Experimental Investigation of Three-Dimensional Shock Control Bumps Applied to Transonic Airfoils. AIAA Paper 2012-0043, 50th Aerospace Sciences Meeting, Nashville, Tennessee, Jan. 9-12, 2012.[30] J.C. LIN - Exploratory Study of Vortex-generating Devices for Turbulent Flow Separation Control. AIAA Paper 91-0042, 29th Aerospace Sciences Meeting and Exhibit, Reno, NV, Jan. 7-10, 1991.[31] J.S. MOUNTS and T. J. BARBER - Numerical Analysis of Shock-Induced Separation Alleviation Using Vortex Generators. AIAA Paper 92-0751, 1992.[32] D.C. McCORMICK - Shock-Boundary Layer Interaction with Low Profile Vortex Generators and Passive Cavity. AIAA Journal, Vol. 31, N°. 1, p. 96, 1993.[33] G. GODARD and M. STANISLAS - Control of a Decelerating Boundary Layer. Part 1: Optimization of Passive Vortex Generators. Aerospace Science and Technology, Vol. 10, pp. 181-191, 2006.[34] H.A. HOLDEN AND H. BABINSKY - Effect of Microvortex Generators on Separated Normal Shock / Boundary Layer Interactions. Journal of Aircraft, Vol. 44, N°. 1, pp. 170-174, 2007.[35] R. BUR, D. COPONET and Y. CARPELS - Separation Control by Vortex Generator Devices in a Transonic Channel Flow. Shock Waves Journal, Vol. 19, N°. 6, pp. 521-530 - 2009.[36] M. RYBALKO, H. BABINSKY and E. LOTH - Vortex Generators for a Normal Shock / Boundary Layer Interaction with a Downstream Diffuser. Journal of Propulsion and Power. Vol. 28, N°. 1, pp. 71-82, 2012.[37] D. CARUANA, A. MIGNOSI, C. ROBITAILLE and M. CORREGE - Separated Flow and Buffeting Control. Flow, Turbulence and Combustion, Vol. 71, pp. 221-245, 2003.[38] R.A. WALLIS and C.M. STUART - On the Control of Shock-Induced Boundary-Layer Separation with Discrete Air Jets. Aeronautical Research Council C.P. N°. 595, 1962.[39] M.K. RAO - An Experimental Investigation of the Use of Air Jet Vortex Generators to Control Shock Induced Boundary Layer Separation. PhD Dissertation, City University, 1998.[40] H.H. PEARCEY, K. RAO and D.M. SYKES - Inclined Air-Jets Used as Vortex Generators to Suppress Shock-Induced Separation. Paper N°. 40 in AGARD CP-534, Fluid Dynamics Panel Symposium on Computational and Experimental Assessment of Jets in Crossflow, Winchester (UK), 1993.[41] R. SZWABA - Comparison of the Influence of Different Air-Jet Vortex Generators on the Separation Region. Aerospace Science & Technology, Vol. 15, N°. 1, pp. 45-52, 2011.[42] A. SEIFERT and LaTUNIA G. PACK - Oscillatory Control of Shock-Induced Separation. Journal of Aircraft, Vol. 38, N°. 3, 2001.[43] A.A. HASSAN, B. OSBORNE, S. SCHWIMLEY and G. BILLMAN - Control of Shock-Boundary Layer Interactions (SBLIs) Using An Oscillatory Jet. AIAA Paper 2007-0476, 45th Aerospace Sciences Meeting and Exhibit, Reno, NV, 2007.[44] C.P. TILMANN - Enhancement of Transonic Airfoil Performance Using Pulsed Jets for Separation Control. AIAA Paper 2001-0731, 39th Aerospace Sciences Meeting and Exhibit, Reno, NV, 2001.
Nomenclature
x streamwise coordinate (m)y spanwise coordinate (m)z vertical coordinate (m)c local chord (m)Cp wall pressure coefficientM0 freestream Mach numbera angle of attack (°)CL lift coefficientPi freestream stagnation pressure (Pa)St Strouhal number
f frequency (Hz)cm mean aerodynamic chord length (m)U0 freestream velocity (m.s-1)Rec Reynolds number based on mean aerodynamic chordh mechanical vortex generator height (m)δ boundary layer local thickness (m)λ mechanical vortex generator spanwise spacing (m)β mechanical or fluidic vortex generator skew angle (°)d fluidic vortex generator hole diameter (m)Cμ momentum coefficient
Issue 6 - June 2013 - Buffet Characterization and Control for Turbulent Wings AL06-01 17
Acronyms
LDV 3C (Three Component Laser Doppler Anemometry)VG (Vortex Generator)TED (Trailing Edge Device/Deflector)PSD (power spectral density, (Pa2/Hz))RMS (root mean squared value)ZDES (Zonal Detached Eddy Simulation)AVERT (Aviation Emission Reduction Technologies (FP6 EC funded project))
AUTHORS
Julien Dandois graduated from the Ecole Nationale Supérieure d’Arts et Métiers (ENSAM) in 2003 and received a PhD in Fluid Mechanics from Paris 6 University in 2007. Since that time, he has worked in the Civil Aircraft Unit of the Applied Aerodyna-mics Department, in the fields of high-lift, separation control, buffet control, closed-loop control and aeroacoustics.
Pascal Molton received a DUT in Thermal Engineering and Energetics from the Ville d’Avray University in 1982. Since then, he has been a research engineer at Onera in the Funda-mental and Experimental Aerodynamics Department. He works in the fields of subsonic/transonic/supersonic flows, jets, vor-tex flows and flow control.
Arnaud Lepage graduated from the National Engineering Insti-tute in Mechanics (ENSMM) of Besançon in 1998 and received a PhD degree from the University of Franche-Comté for a the-sis on experimental modal analysis in 2002. Then, he joined the aeroelasticity department of Onera as a research engineer, where he initially worked on the active vibration control. Since 2006, his fields of interest have been the experimental inves-tigation and control of fixed wing aeroelasticity and unsteady aerodynamics.
Arnaud Geeraert graduated from the Ecole Nationale Supé-rieure d’Arts et Métiers (ENSAM) in 1999, and worked for 7 years in industry as a structural engineer. Finally, he joined the Onera aeroelasticity department in 2007, as an experimental research engineer, where most of his activities deal with fixed wing aeroelasticity and unsteady aerodynamics.
Vincent Brunet received his Master’s Degree and Engineering Diploma from the CORIA / INSA Rouen School of Engineering in 2000. Then, he became a research engineer at Onera, first in the Numerical and Aeroacoustics Department (DSNA) and then in the Applied Aerodynamics Department (DAAP). In the Civil Aircraft team, he is in charge of unsteady and control fields.
Jean-Bernard Dor graduated in 1977 from the SupAéro En-gineering School. He has been a research engineer at Onera since 1979. Since then, he has mainly been involved in ex-perimental aerodynamics and wind tunnel testing, generally under transonic conditions and particularly on high Reynolds cryogenic flows (at the former T2 wind tunnel), buffet studies or drag reduction research.
Eric Coustols graduated from ENSEEIHT Toulouse in 1979. He received a Master of Sciences Degree from the University of California San Diego in 1980 and a PhD thesis from the ENSAE (Supaéro) in 1983. He has been working at Onera in the Department of Modelling for Aerodynamics and Energetics since 1983, in various research fields aimed at improving civil aircraft performances. For the last fifteen years or so, he has
been coordinating the involvement of several Onera teams in EU-funded pro-jects; more recently, he led the Onera research project BUFET’N Co related to Buffet Control on a 3D transonic wing.