budget workshop #2 budgeting for outcomes - dallas · budgeting for outcomes january 16, ... have...
TRANSCRIPT
1
Budget Workshop #2Strategic Planning Session &Budgeting for Outcomes
January 16, 2008

2
Purpose of this Budget Workshop
To set a strategic direction for Dallas City government for FY08-09 by:
• By combining the Strategic Planning and Budgeting for Outcomes processes in order to define the goals and objectives that the City will support with its future budget decisions
• Reviewing Council’s objectives established during first workshop in October 2007, and
• Reviewing and agreeing upon strategies that support Council goals and objectives based on KFA Team presentations and Council Working Group discussions

3
Purpose of this Approach
• Aligns future funding decisions with Council’s long-term goals
• Makes clear what citizens can expect from City government
• Keeps staff focused on what is most important in day-to-day decision-making
• Brings together multiple planning efforts under one citywide strategic plan
• Positions the City to learn what is working well or to identify areas that could work better
4
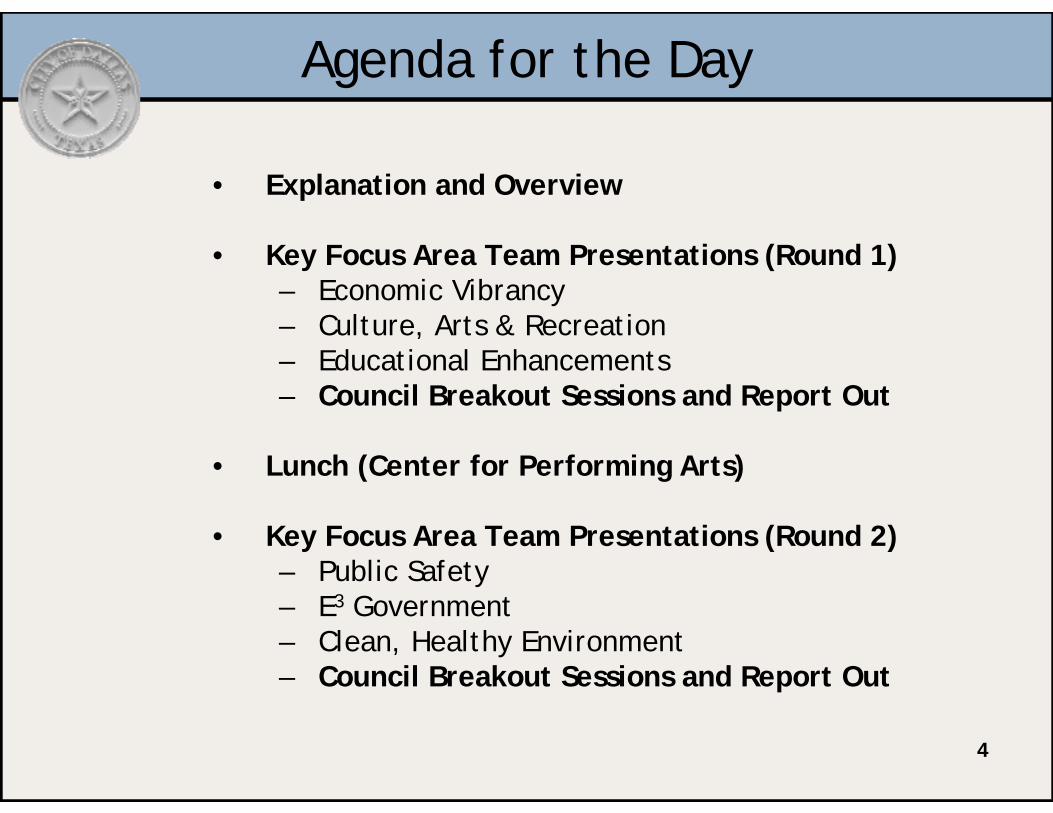
Agenda for the Day
• Explanation and Overview
• Key Focus Area Team Presentations (Round 1)– Economic Vibrancy – Culture, Arts & Recreation– Educational Enhancements– Council Breakout Sessions and Report Out
• Lunch (Center for Performing Arts)
• Key Focus Area Team Presentations (Round 2)– Public Safety– E3 Government– Clean, Healthy Environment– Council Breakout Sessions and Report Out
5
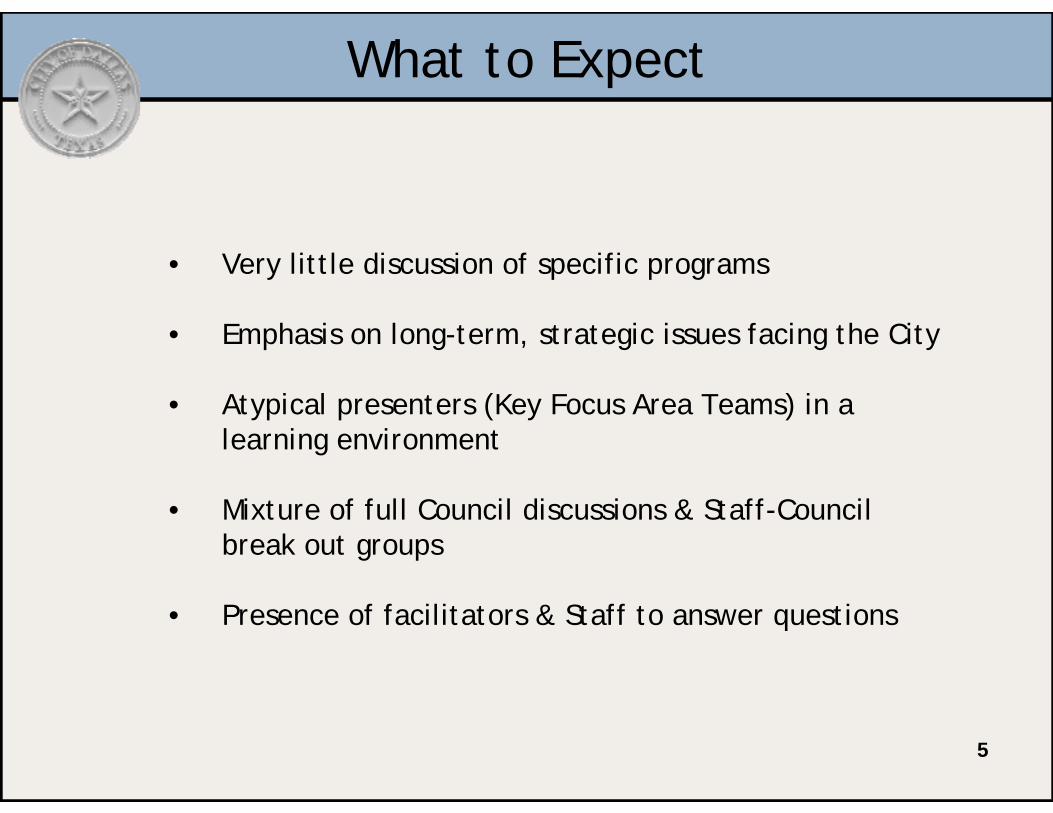
What to Expect
• Very little discussion of specific programs
• Emphasis on long-term, strategic issues facing the City
• Atypical presenters (Key Focus Area Teams) in a learning environment
• Mixture of full Council discussions & Staff-Council break out groups
• Presence of facilitators & Staff to answer questions

6
Background
A brief review of the Strategic Planning and Budgeting for Outcomes processes
7
Strategic Planning

8
Strategic Planning
Purpose
• Active management tool– Becomes operational through the citywide Action Plan,
performance measures system, benchmarking initiative, process improvement initiative, etc.
• Continuous improvement process:– Provides consistent reporting and opportunities for review– Establishes the long-term direction for the organization
based on the best available data, but– Provides the organization with flexibility to change course
when events warrant in the short-term
9
Strategic Planning
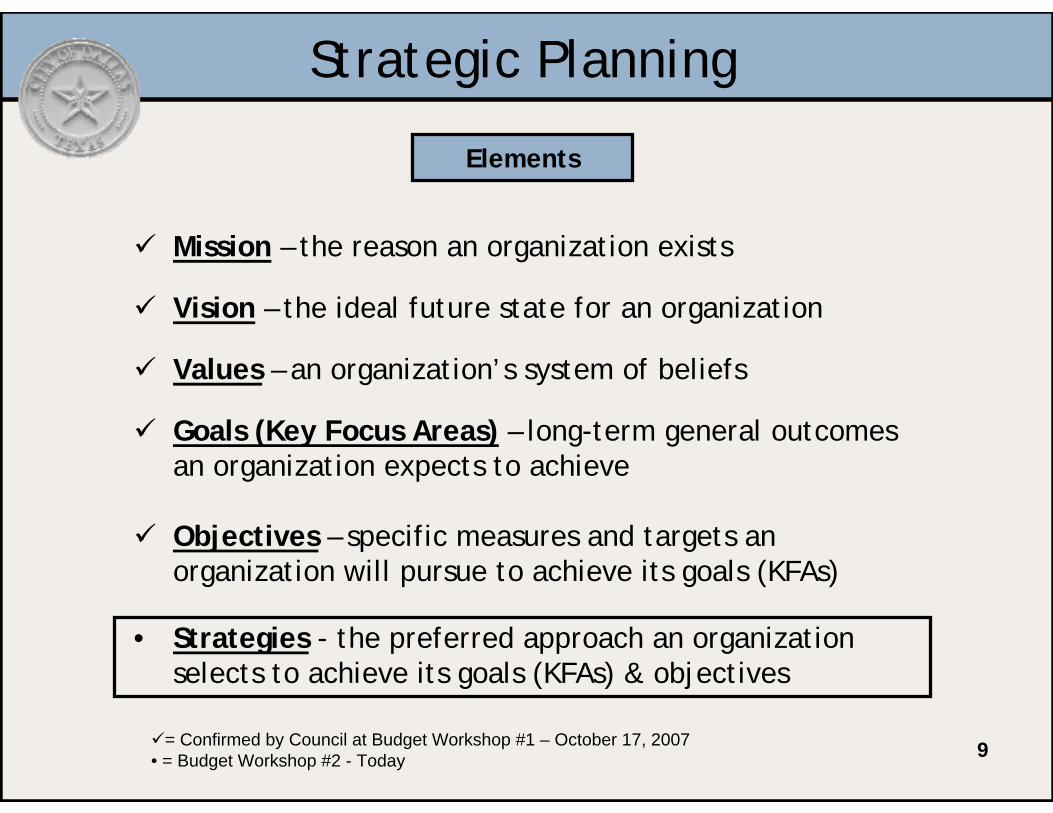
Elements
Mission – the reason an organization exists
Vision – the ideal future state for an organization
Values – an organization’s system of beliefs
Goals (Key Focus Areas) – long-term general outcomes an organization expects to achieve
Objectives – specific measures and targets an organization will pursue to achieve its goals (KFAs)
• Strategies - the preferred approach an organization selects to achieve its goals (KFAs) & objectives
= Confirmed by Council at Budget Workshop #1 – October 17, 2007• = Budget Workshop #2 - Today

10
To enhance the vitality and quality of life for all in the Dallas community
The City That Works:Diverse, Vibrant, Progressive
Mission:
Vision:
City of Dallas Mission & Vision
11
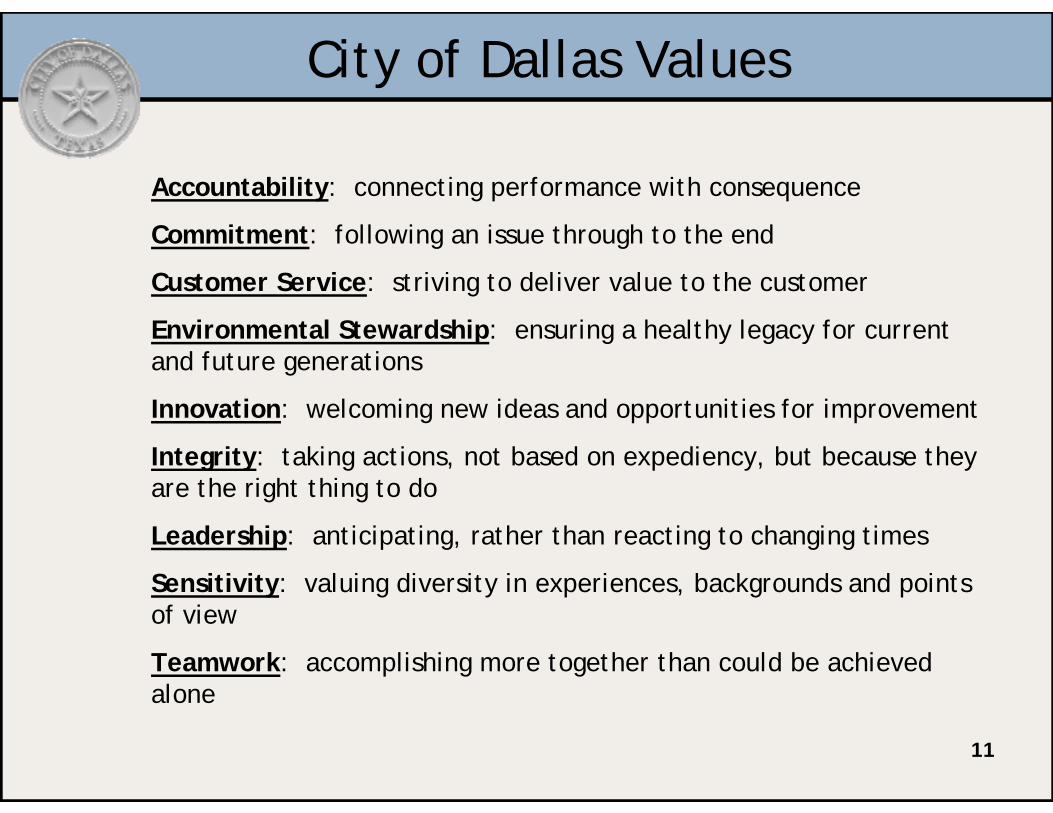
Accountability: connecting performance with consequence
Commitment: following an issue through to the end
Customer Service: striving to deliver value to the customer
Environmental Stewardship: ensuring a healthy legacy for current and future generations
Innovation: welcoming new ideas and opportunities for improvement
Integrity: taking actions, not based on expediency, but because they are the right thing to do
Leadership: anticipating, rather than reacting to changing times
Sensitivity: valuing diversity in experiences, backgrounds and points of view
Teamwork: accomplishing more together than could be achieved alone
City of Dallas Values

12
Public Safety 4 Objectives
Economic Vibrancy 6 Objectives
Clean, Healthy Environment 5 Objectives
Culture, Arts and Recreation 7 Objectives
Efficient, Effective, Economical 5 Objectives(E3) Government
Educational Enhancements 19 Objectives
City of Dallas KFAs & Objectives

13
City of Dallas Strategies
The KFA Team presentations you are about to see contain a number of strategies for your consideration as an approach for achieving Council’s goals and objectives. Characteristics of the Teams include:
• Composed of staff from across the city
• No department directors
• Diverse mix of subject-matter experts and good strategic thinkers
• Began their work in October
• Focused on understanding their respective KFA and proposing strategies they believe will help Dallas succeed
• Paid close attention to past and current planning efforts, such as Forward Dallas, Strategic Engagement, and Customer Service Initiative
14
City of Dallas Strategies
What you can expect to see in each of the presentations:
• An ‘envisioned future’ goal statement
• A recap of the City’s objectives established by Council in October 2007 with supporting data (suggested targets will be shown in red)
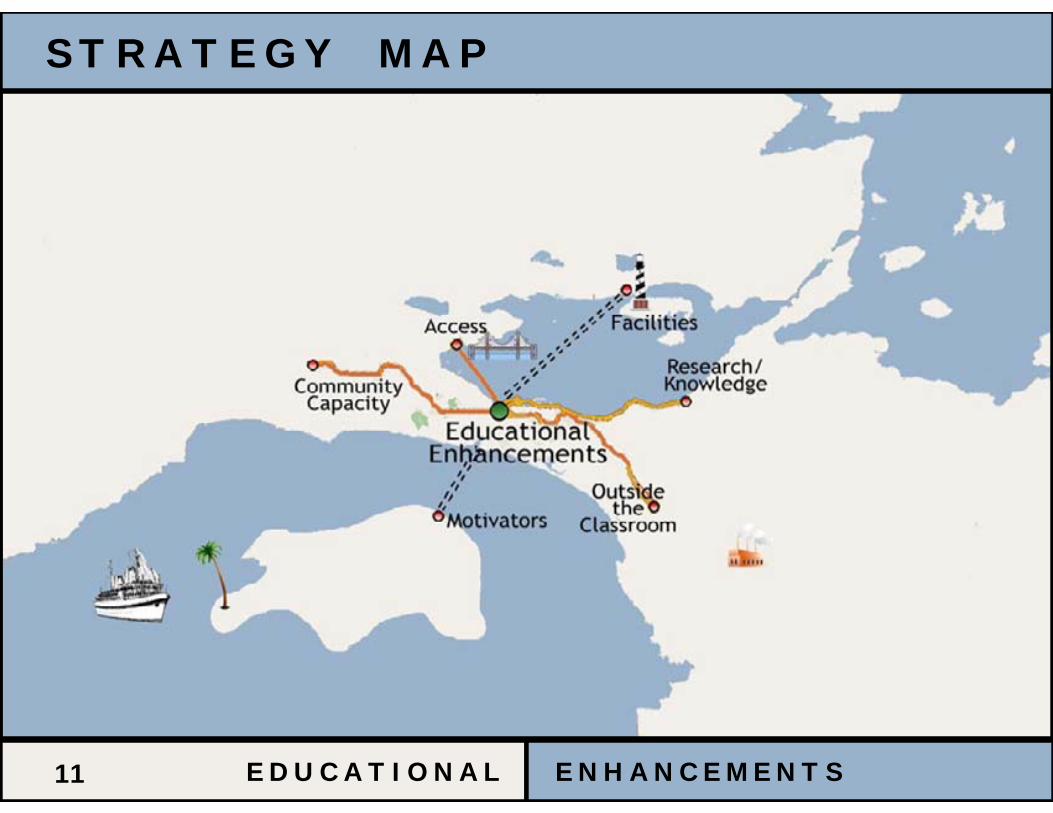
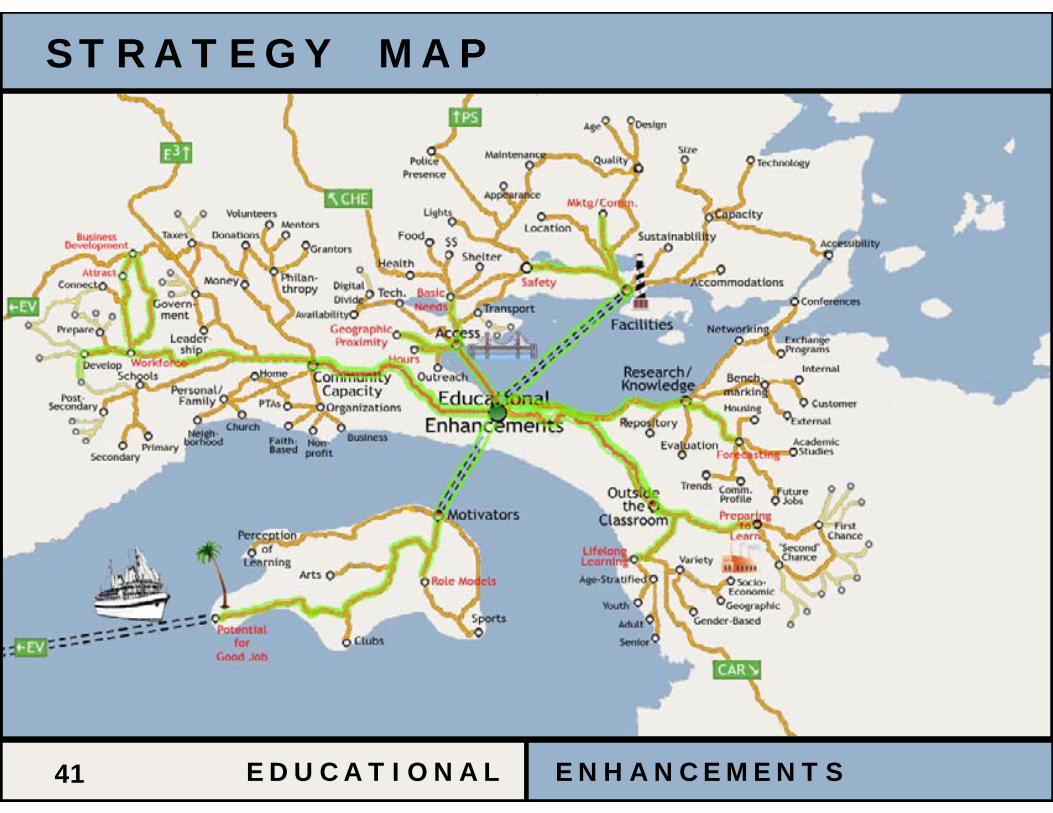
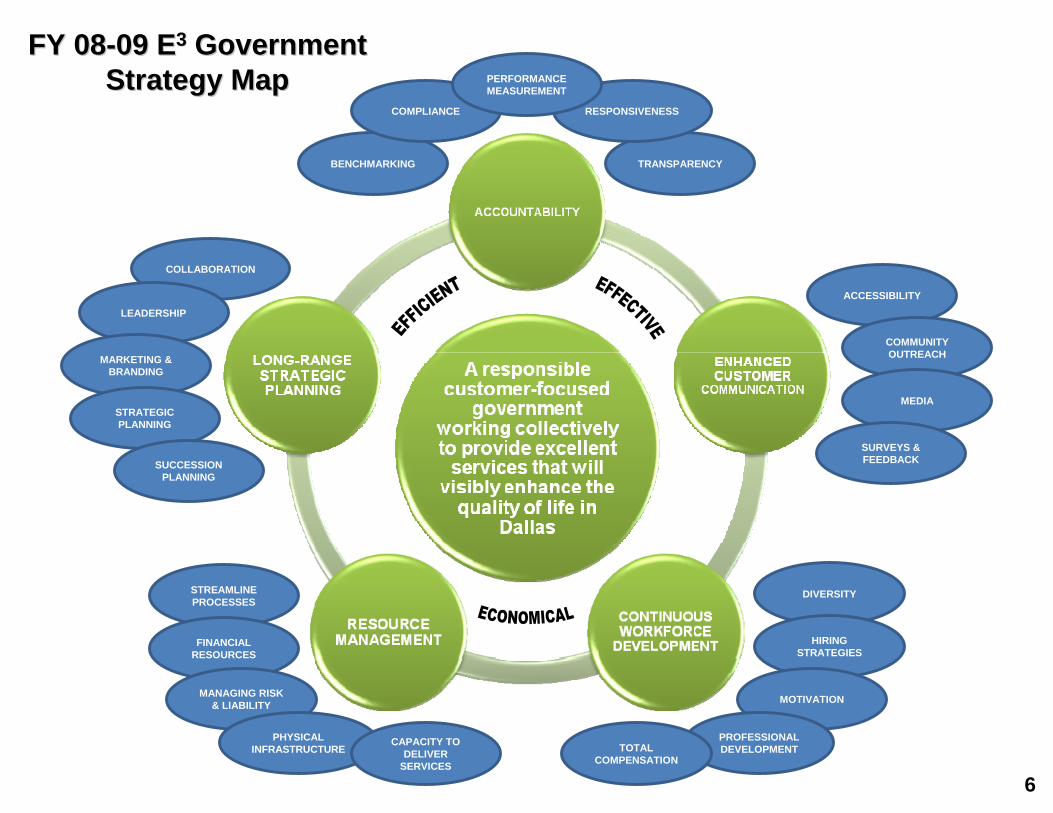
• A strategy map showcasing what the Teams believe influences their KFA
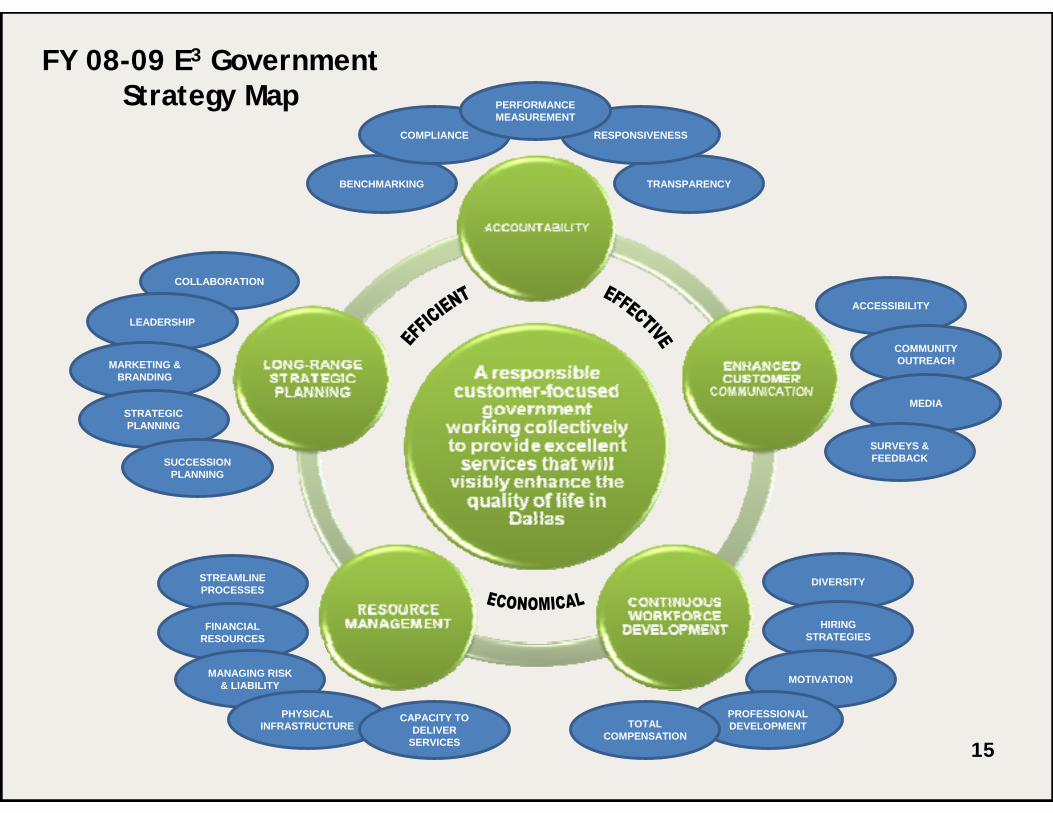
15
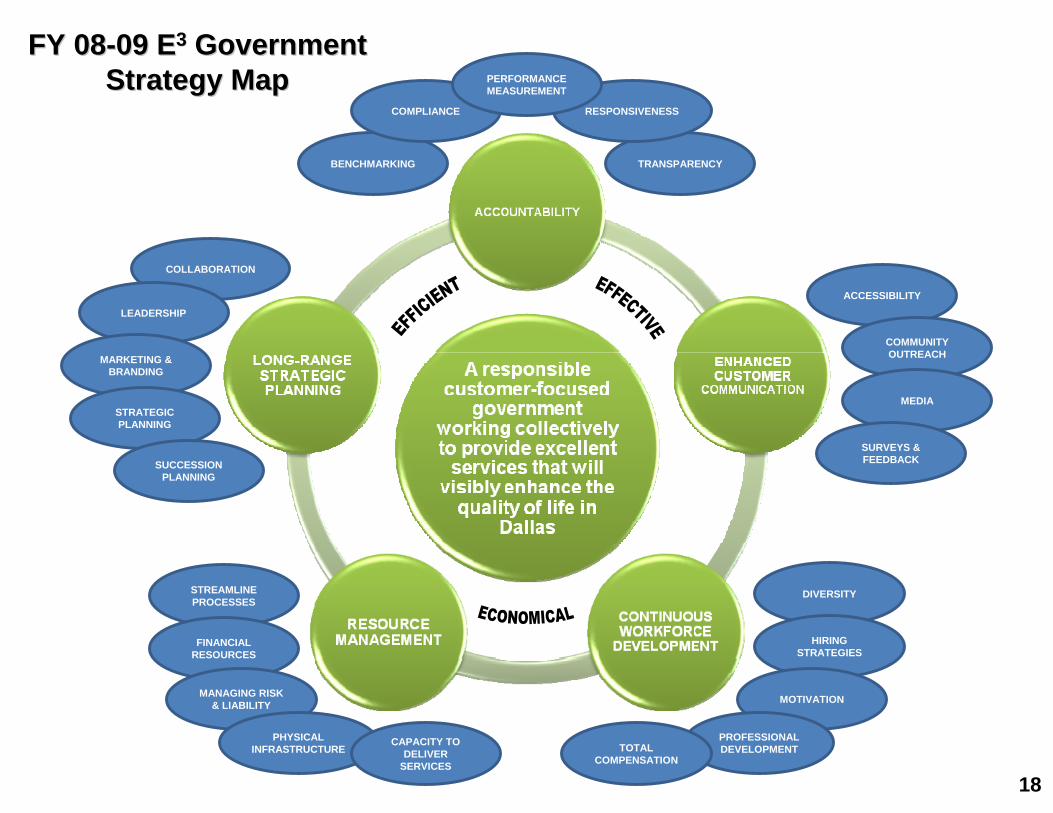
FY 08-09 E3 Government Strategy Map
STREAMLINE PROCESSES
BENCHMARKING TRANSPARENCY
RESPONSIVENESSCOMPLIANCE
COLLABORATION
LEADERSHIPACCESSIBILITY
COMMUNITY OUTREACH
DIVERSITY
HIRING STRATEGIES
FINANCIAL RESOURCES
PERFORMANCE MEASUREMENT
MEDIA
SURVEYS & FEEDBACK
MARKETING & BRANDING
STRATEGIC PLANNING
SUCCESSION PLANNING
MANAGING RISK & LIABILITY
PHYSICAL INFRASTRUCTURE
MOTIVATION
PROFESSIONAL DEVELOPMENTTOTAL
COMPENSATION
CAPACITY TO DELIVER
SERVICES

16
City of Dallas Strategies
• Key information on the City’s current performance as well as external data that guided the Teams in strategy development
• Proposed strategies for advancing the Council’s goals and objectives
• Linkages among the various KFAs (e.g. green buildings is one link between Clean, Healthy Environment and Economic Vibrancy)
What you can expect to see in each of the presentations:
17
City of Dallas Strategies
Then, we want your feedback:
• Are the proposed strategies the best ones to achieve the Council’s goals and objectives?
• Objectives and Strategies should be kept to a manageable number – are there too many in the Educational Enhancements KFA?
• Are the proposed targets appropriate to achieve the objectives?
18
Budgeting for Outcomes
19
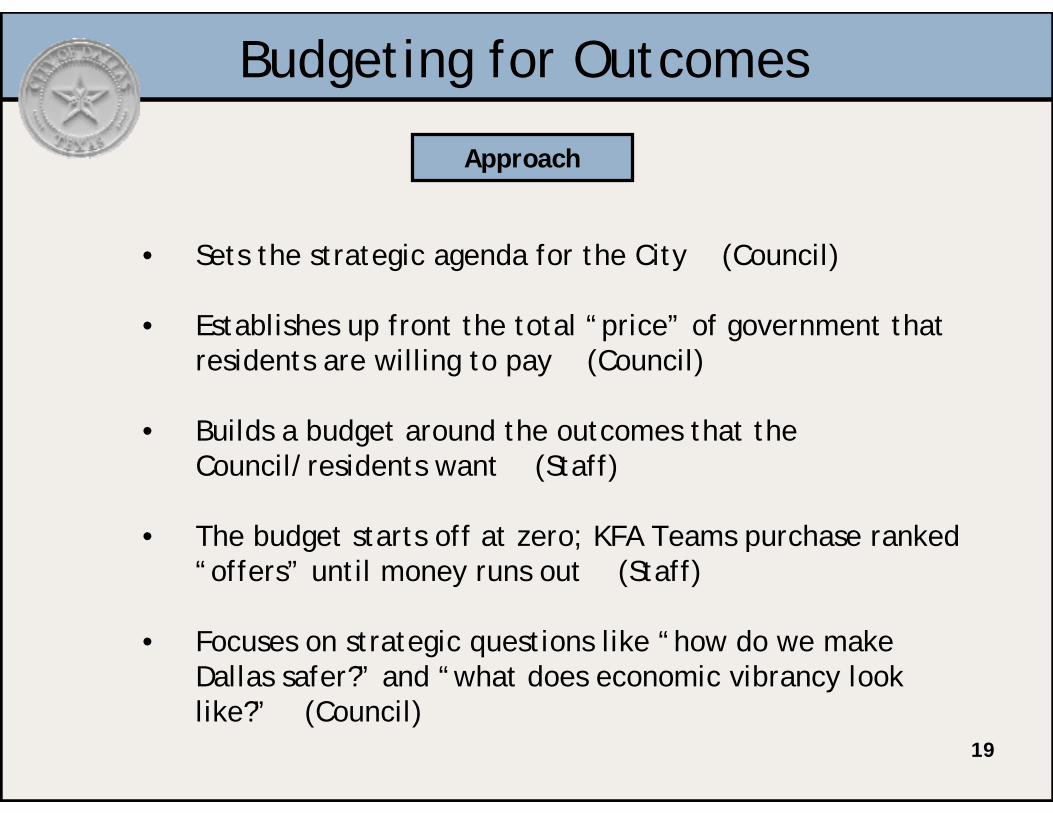
Budgeting for Outcomes
• Sets the strategic agenda for the City (Council)
• Establishes up front the total “price” of government that residents are willing to pay (Council)
• Builds a budget around the outcomes that the Council/residents want (Staff)
• The budget starts off at zero; KFA Teams purchase ranked “offers” until money runs out (Staff)
• Focuses on strategic questions like “how do we make Dallas safer?” and “what does economic vibrancy look like?” (Council)
Approach

20
Budgeting for Outcomes
Oct 17: Establish citywide goals & objectives (Council)
• Jan 16: Set strategic direction for FY08-09 (Council)
• Jan 17 – 28: KFA Teams develop “Requests for Offers”(Staff)
• Jan 29: Create “Request for Outcomes”; Invite departments to make offers (Staff)
• Feb 6: Total Compensation Review – Council Briefing
• Feb 20: Set overall “price” of Dallas government (Council)
• Feb 20: Allocate “price” to each Key Focus Area (Council)
Steps

21
Budgeting for Outcomes
• March 28: Offers due from departments (Staff)
• April-May: Council Committees review preliminary budget offers by KFA (Council Committees)
• April-May: Evaluate & prioritize offers in each KFA; Buy down the list of offers until the funding runs out, or “draw the line” (Staff)
• May 5–16: KFA Teams present rankings to CMO (Staff)
• May 21: Council Briefing on preliminary rankings (Staff)
• June 18: Council Briefing – City Managers’ Proposed Budget Preview (Staff)
Steps

22
Budgeting for Outcomes
• Aug 11: Present City Manager’s proposed budget to Council (Staff)
• Aug-Sep: Review, amend, and approve final budget (Council)
Steps
ECONOMIC VIBRANCY
Council Planning
PresentationJanuary 16th, 2008

- 1 - ECONOMIC VIBRANCY
Team
4 Peer Chacko (Lead, Development Services)
4 Anna Holmes (Co-Lead, Intergovernmental Services)
4 Dennis Gakunga (Facilitator, City Manager’s Office)
4 Lauren Anderson (Strategic Customer Service)
4 Earnest Lloyd (Economic Development)
4 Mike Mikeska (Dallas Water Utilities)
4 Mandy Shreve (Office of Financial Services)
4 Raj Thomas (Aviation)
4 Malachy Udoh (Housing)

- 2 - ECONOMIC VIBRANCY
Roadmap
4 Envisioned Future
4 Council Objectives
4 Overarching Considerations
4 Strategy Map
4 Strategies and Data
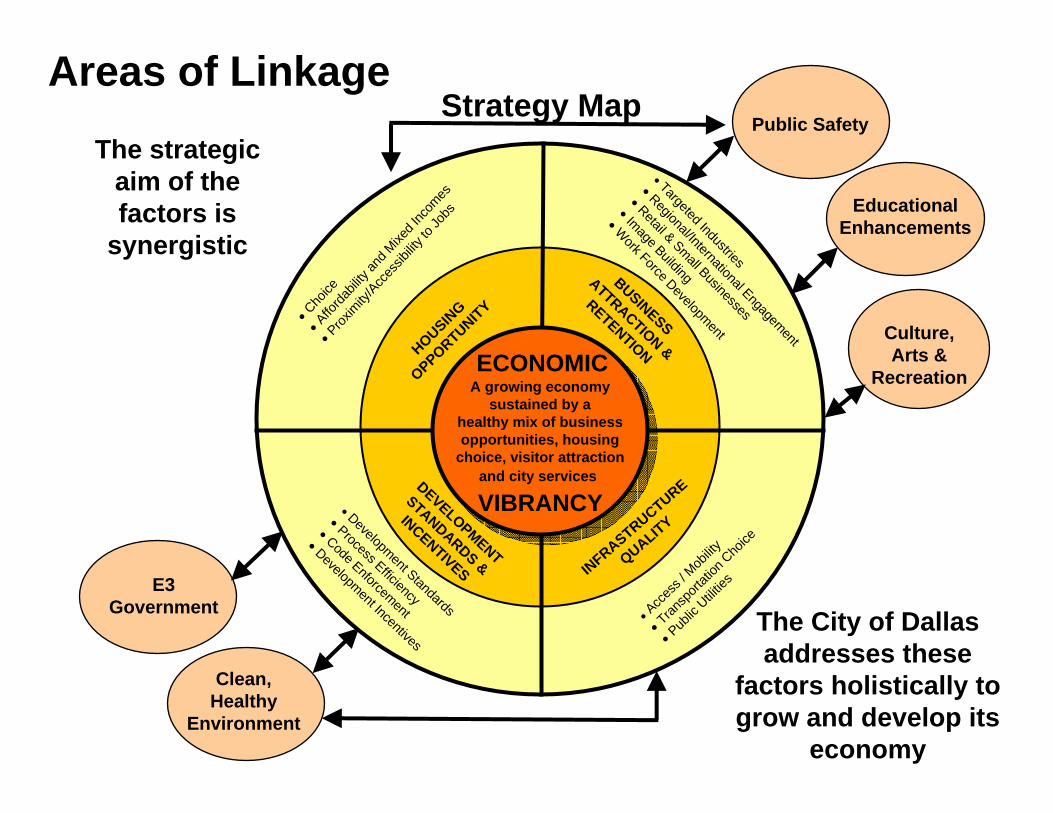
4 Areas of Linkage

- 3 - ECONOMIC VIBRANCY
Envisioned Future
A growing economy sustained by a healthy mix of local and international business opportunities, housing choice, visitor attraction and city services
- 4 - ECONOMIC VIBRANCY
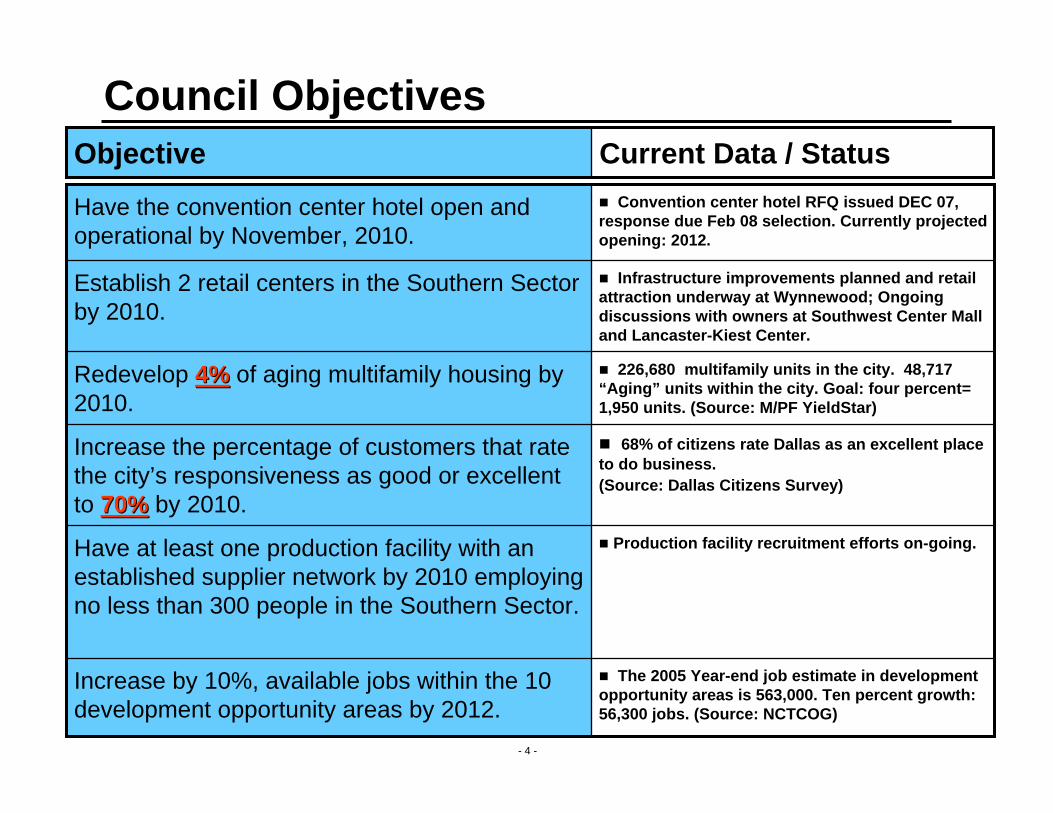
Council Objectives
The 2005 Year-end job estimate in development opportunity areas is 563,000. Ten percent growth: 56,300 jobs. (Source: NCTCOG)
Increase by 10%, available jobs within the 10 development opportunity areas by 2012.
Production facility recruitment efforts on-going. Have at least one production facility with an established supplier network by 2010 employing no less than 300 people in the Southern Sector.
68% of citizens rate Dallas as an excellent place to do business. (Source: Dallas Citizens Survey)
Increase the percentage of customers that rate the city’s responsiveness as good or excellent to 70%70% by 2010.
226,680 multifamily units in the city. 48,717 “Aging” units within the city. Goal: four percent= 1,950 units. (Source: M/PF YieldStar)
Redevelop 4%4% of aging multifamily housing by 2010.
Infrastructure improvements planned and retail attraction underway at Wynnewood; Ongoing discussions with owners at Southwest Center Mall and Lancaster-Kiest Center.
Establish 2 retail centers in the Southern Sector by 2010.
Convention center hotel RFQ issued DEC 07, response due Feb 08 selection. Currently projected opening: 2012.
Have the convention center hotel open and operational by November, 2010.
Current Data / StatusObjective

- 5 - ECONOMIC VIBRANCY
Overarching Considerations
Consistency with Long Range Development Plans
• forwardDallas! Plan (Long Range Planning)
• Strategic Engagement Plan (Economic Development)
• Balanced Vision Plan (Trinity River Corridor)
• Long Range Water Master Plan (Dallas Water Utilities)
• Bond Programs (Public Works)
- 6 - ECONOMIC VIBRANCY
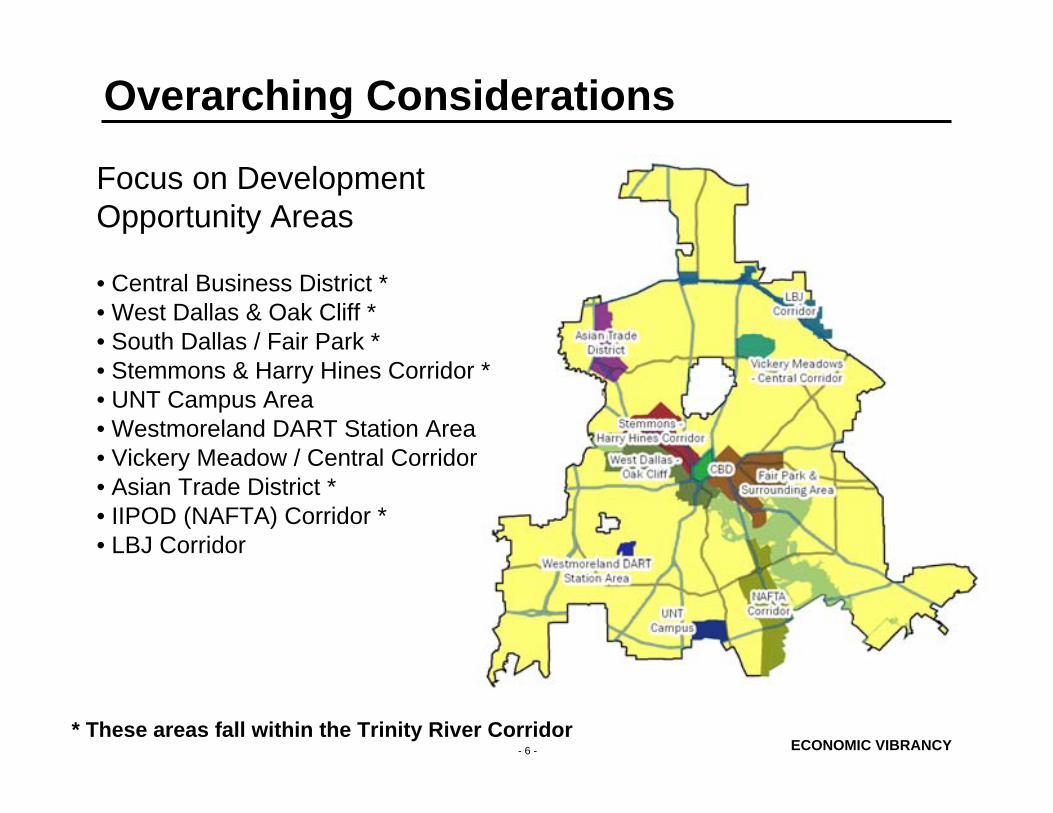
Overarching Considerations
Focus on Development Opportunity Areas
• Central Business District *• West Dallas & Oak Cliff *• South Dallas / Fair Park *• Stemmons & Harry Hines Corridor *• UNT Campus Area• Westmoreland DART Station Area• Vickery Meadow / Central Corridor• Asian Trade District *• IIPOD (NAFTA) Corridor *• LBJ Corridor
* These areas fall within the Trinity River Corridor

INFRASTRUCTURE
QUALITY
A growing economysustained by a
healthy mix of businessopportunities, housing
choice, visitor attractionand city services
A growing economysustained by a
healthy mix of businessopportunities, housing
choice, visitor attractionand city servicesDEVELOPMENT
STANDARDS &
INCENTIVES
HOUSING
OPPORTUNITYBUSINESS
ATTRACTION &
RETENTION• Targeted Industries
• Regional/International Engagement
• Retail & Small Businesses
• Image Building
•Work Force Development
• Development Standards
• Process Efficiency
• Code Enforcement
• Development Incentives
ECONOMIC
VIBRANCY
• Acces
s / M
obility
• Transp
ortati
on C
hoice
• Public
Utilities
• Choice
• Afforda
bility
and M
ixed I
ncom
es
• Proxim
ity/A
cces
sibilit
y to J
obs
Strategy Map
- 8 - ECONOMIC VIBRANCY
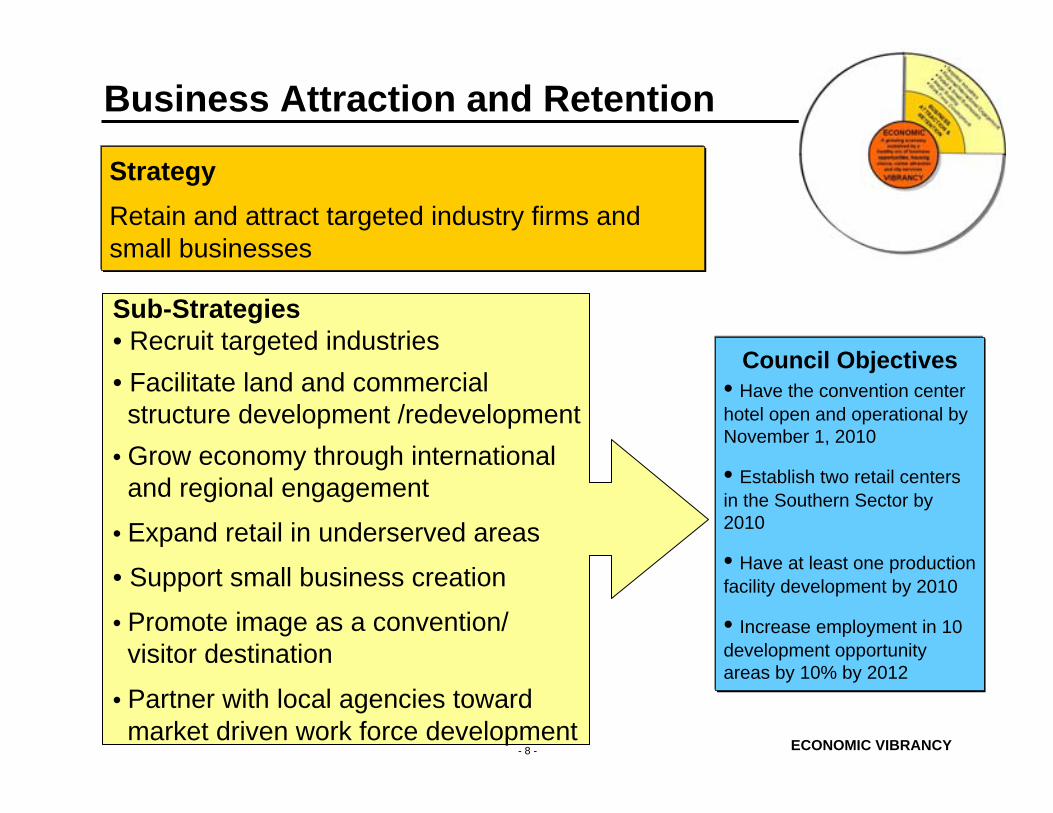
Business Attraction and Retention
Sub-Strategies• Recruit targeted industries• Facilitate land and commercial structure development /redevelopment
• Grow economy through internationaland regional engagement
• Expand retail in underserved areas
• Support small business creation
• Promote image as a convention/visitor destination
• Partner with local agencies toward market driven work force development
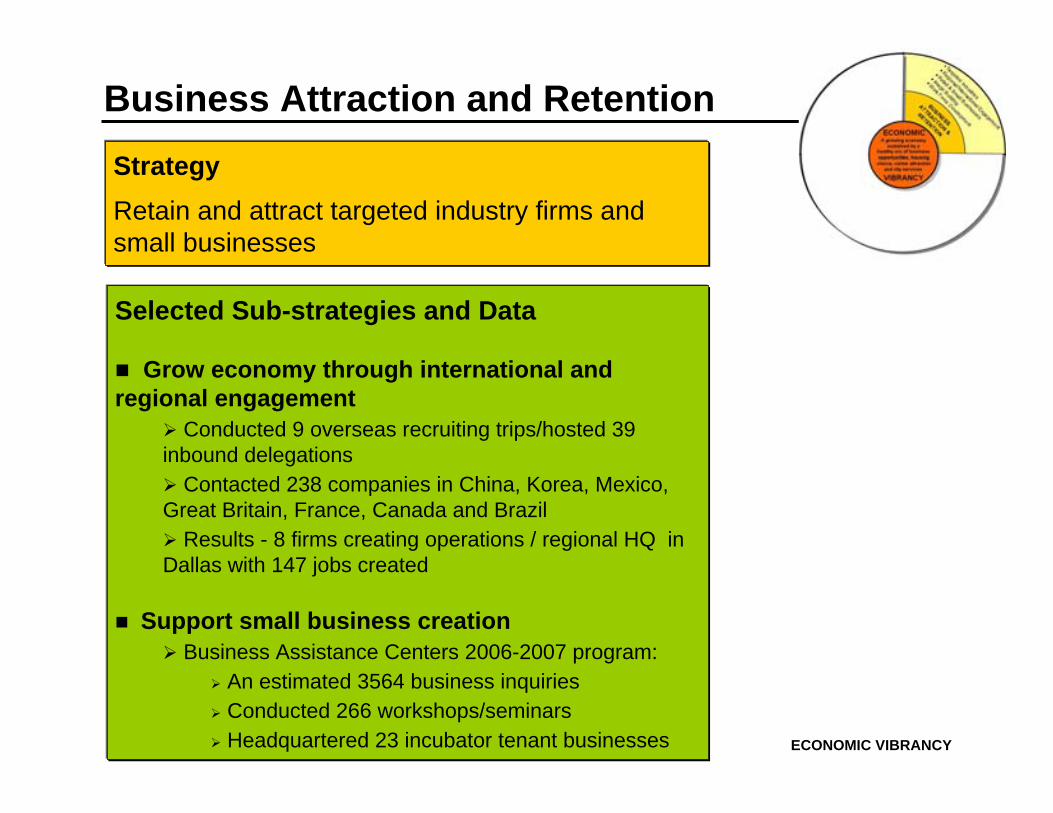
StrategyRetain and attract targeted industry firms and small businesses
Council Objectives• Have the convention center hotel open and operational by November 1, 2010
• Establish two retail centers in the Southern Sector by 2010
• Have at least one production facility development by 2010
• Increase employment in 10 development opportunity areas by 10% by 2012
- 9 - ECONOMIC VIBRANCY
Business Attraction and RetentionStrategyRetain and attract targeted industry firms and small businesses
Selected Sub-strategies and Data
Grow economy through international and regional engagement
Conducted 9 overseas recruiting trips/hosted 39 inbound delegations
Contacted 238 companies in China, Korea, Mexico, Great Britain, France, Canada and Brazil
Results - 8 firms creating operations / regional HQ in Dallas with 147 jobs created
Support small business creationBusiness Assistance Centers 2006-2007 program:
An estimated 3564 business inquiries Conducted 266 workshops/seminars Headquartered 23 incubator tenant businesses
- 10 - ECONOMIC VIBRANCY
Housing Opportunity
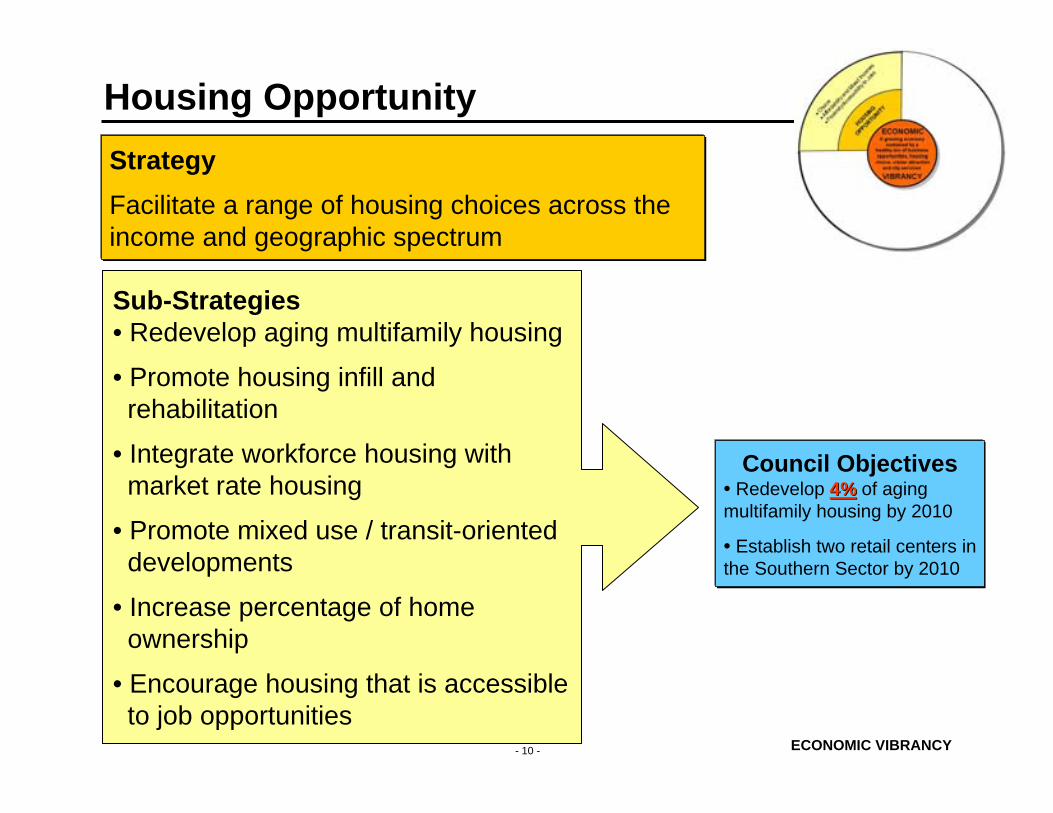
Sub-Strategies• Redevelop aging multifamily housing
• Promote housing infill andrehabilitation
• Integrate workforce housing with market rate housing
• Promote mixed use / transit-oriented developments
• Increase percentage of homeownership
• Encourage housing that is accessibleto job opportunities
StrategyFacilitate a range of housing choices across the income and geographic spectrum
Council Objectives• Redevelop 4%4% of aging multifamily housing by 2010
• Establish two retail centers in the Southern Sector by 2010
- 11 - ECONOMIC VIBRANCY
Housing Opportunity
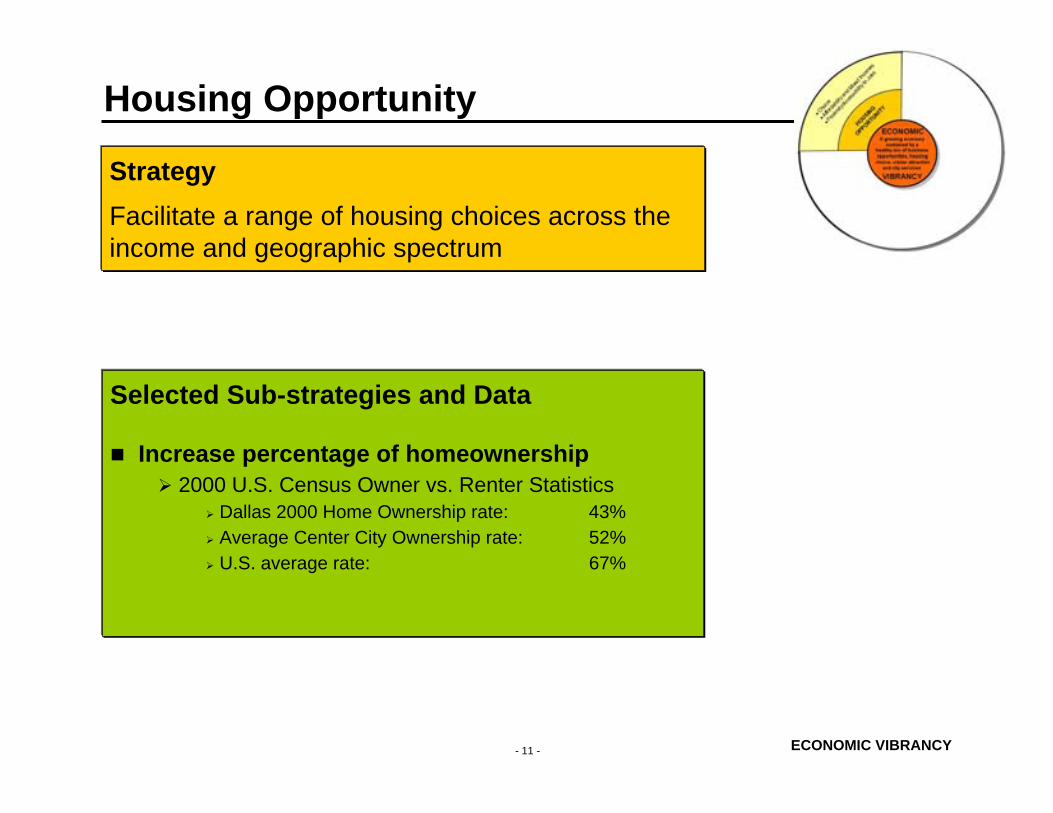
StrategyFacilitate a range of housing choices across the income and geographic spectrum
Selected Sub-strategies and Data
Increase percentage of homeownership2000 U.S. Census Owner vs. Renter Statistics
Dallas 2000 Home Ownership rate: 43%Average Center City Ownership rate: 52%U.S. average rate: 67%

- 12 - ECONOMIC VIBRANCY
Infrastructure Quality
Sub-Strategies• Promote access and mobility
• Expand transportation choices andconnectivity between alternative modes
• Plan, manage and maintain publicinfrastructure to support economicgrowth
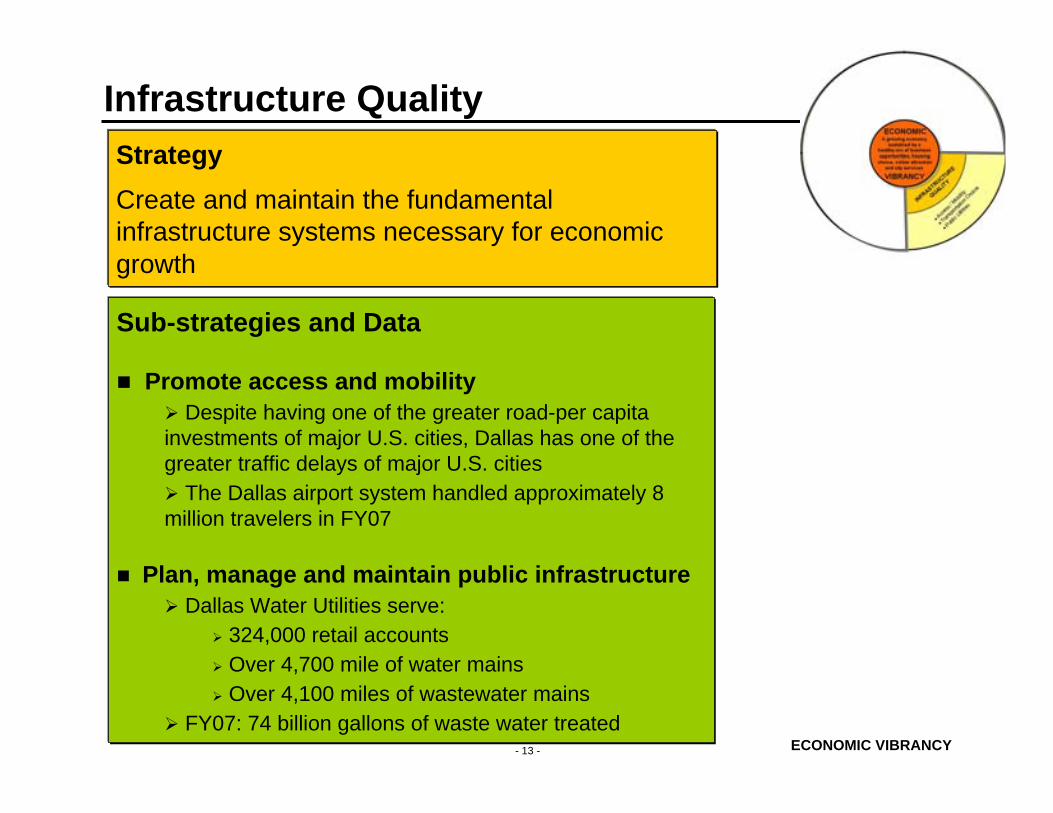
StrategyCreate and maintain the fundamental infrastructure systems necessary for economic growth
Council Objectives• Have at least one production facility development by 2010
• Have the convention center hotel open and operational by November 1, 2010
• Establish two retail centers in the Southern Sector by 2010
• Increase employment in 10 development opportunity areas by 10% by 2012
- 13 - ECONOMIC VIBRANCY
Infrastructure Quality
Sub-strategies and Data
Promote access and mobilityDespite having one of the greater road-per capita
investments of major U.S. cities, Dallas has one of the greater traffic delays of major U.S. cities
The Dallas airport system handled approximately 8 million travelers in FY07
Plan, manage and maintain public infrastructureDallas Water Utilities serve:
324,000 retail accountsOver 4,700 mile of water mainsOver 4,100 miles of wastewater mains
FY07: 74 billion gallons of waste water treated
StrategyCreate and maintain the fundamental infrastructure systems necessary for economic growth
- 14 - ECONOMIC VIBRANCY
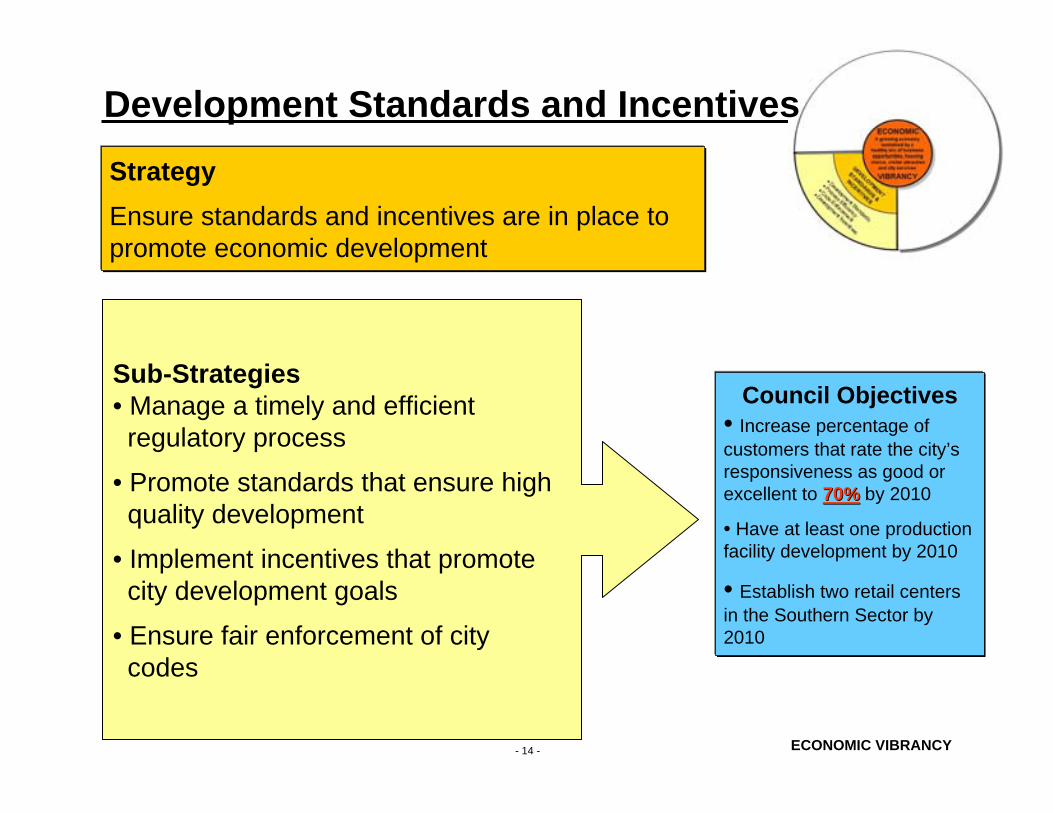
Sub-Strategies• Manage a timely and efficientregulatory process
• Promote standards that ensure highquality development
• Implement incentives that promotecity development goals
• Ensure fair enforcement of citycodes
StrategyEnsure standards and incentives are in place to promote economic development
Council Objectives• Increase percentage of customers that rate the city’s responsiveness as good or excellent to 70%70% by 2010
• Have at least one production facility development by 2010
• Establish two retail centers in the Southern Sector by 2010
Development Standards and Incentives

- 15 - ECONOMIC VIBRANCY
StrategyEnsure standards and incentives are in place to promote economic development
Sub-strategies and Data
Promote standards that ensure high quality development
Dallas is currently amending the development code to create new zoning to promote high quality urban mixed use development and has initiated efforts to proactively apply new zoning in 7 areas
(Trinity Design District, Los Altos / La Bajada Area, Cedars West Area, Trinity Industrial / Mixmaster Area, Oak Cliff Gateway , UNT Campus Area, Stemmons Business Corridor/Southwestern Medical District)
Development Standards and Incentives
INFRASTRUCTURE
QUALITY
A growing economysustained by a
healthy mix of businessopportunities, housing
choice, visitor attractionand city services
A growing economysustained by a
healthy mix of businessopportunities, housing
choice, visitor attractionand city servicesDEVELOPMENT
STANDARDS &
INCENTIVES
HOUSING
OPPORTUNITY
BUSINESS
ATTRACTION &
RETENTION
• Targeted Industries
• Regional/International Engagement
• Retail & Small Businesses
• Image Building
•Work Force Development
• Development Standards
• Process Efficiency
• Code Enforcement
• Development Incentives
ECONOMIC
VIBRANCY
• Acces
s / M
obility
• Transp
ortati
on C
hoice
• Public
Utilities
• Choice
• Afforda
bility
and M
ixed I
ncom
es
• Proxim
ity/A
cces
sibilit
y to J
obs
Areas of LinkageThe strategic
aim of the factors is
synergistic
The City of Dallas addresses these
factors holistically to grow and develop its
economy
Strategy Map
Educational Enhancements
Clean, Healthy
Environment
Culture, Arts &
Recreation
E3 Government
Public Safety
- 17 - ECONOMIC VIBRANCY
APPENDIX
ECONOMIC VIBRANCY STATISTICS
- 18 - ECONOMIC VIBRANCY
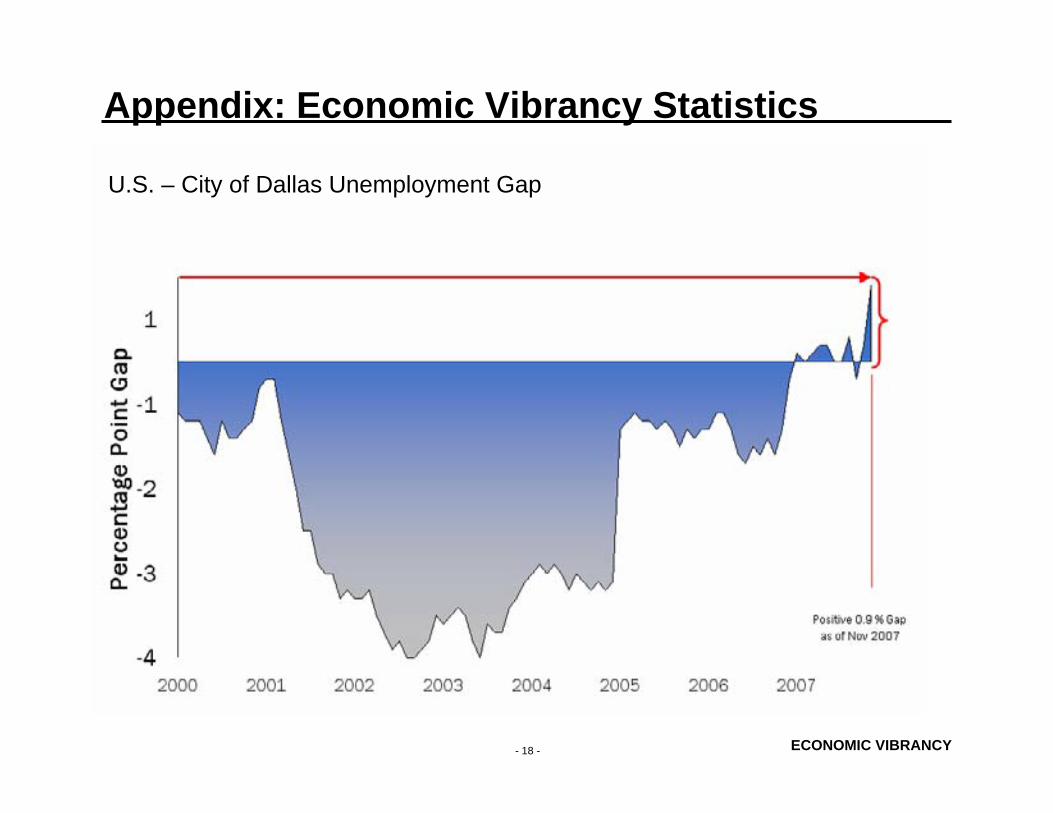
Appendix: Economic Vibrancy Statistics
U.S. – City of Dallas Unemployment Gap

- 19 - ECONOMIC VIBRANCY
COD Household Employment - Labor Force Data
Appendix: Economic Vibrancy Statistics
SOURCE: TEXAS WORKFORCE COMMISSION, U.S. BUREAU OF LABOR STATISTICS, VALUES NOT SEASONALLY ADJUSTED. * PREVIOUS MONTH’S VALUES REVISED** LARGEST U.S. CITIES EXCLUDING DALLAS ARE: NEW YORK, LOS ANGELES, CHICAGO, HOUSTON, PHILADELPHIA, SAN ANTONIO, SAN DIEGO, SAN JOSE, AND DETROIT.
5.9Largest U.S. Cities Avg.**
0.0-13.0% Change
0.14.44.5U.S.
-168-3,315Change0.23.94.1Texas
611,18625,4562007 Oct0.23.84.0DFW MSA
611,01822,1412007 Nov
-0.64.23.6City of Dallas
Labor ForceUnemployedPointChange
2007 Oct
2007 Nov
Table 2.CITY OF DALLAS LABOR FORCE(PERSONS)
Table 1.ANNUAL UNEMPLOYMENT RATES
- 20 - ECONOMIC VIBRANCY
Appendix: Economic Vibrancy Statistics
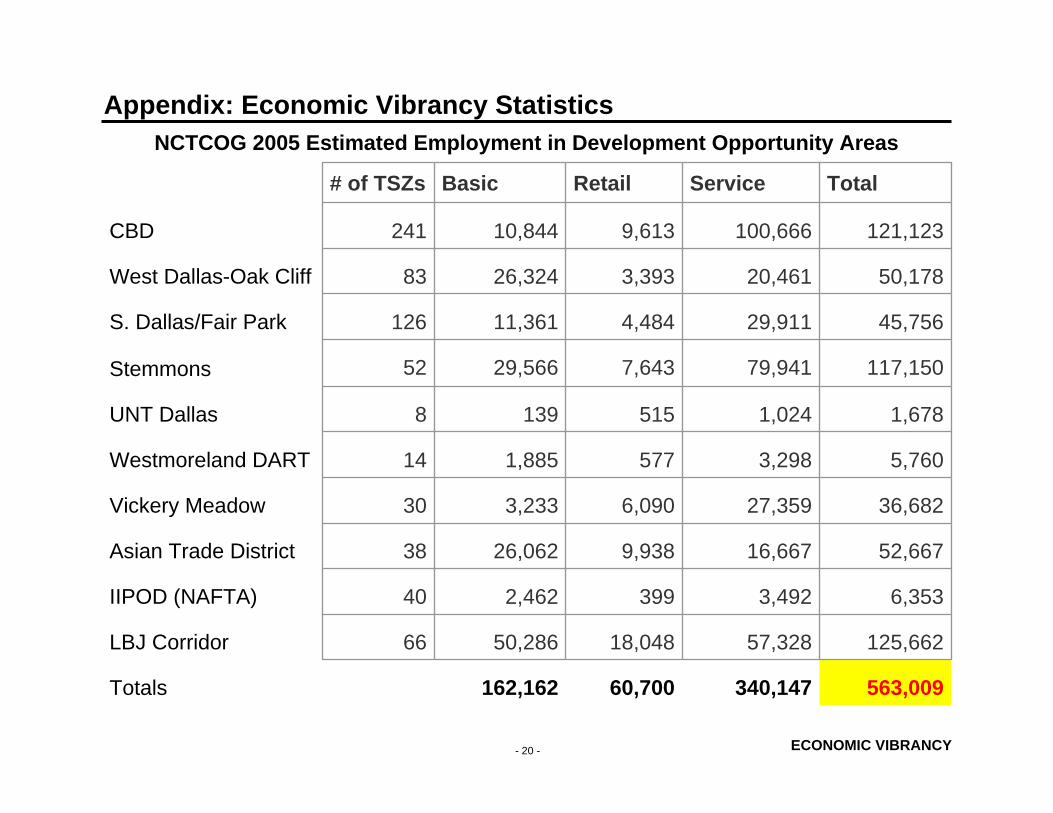
563,009 340,147 60,700 162,162 Totals
125,662 57,328 18,048 50,286 66 LBJ Corridor
6,353 3,492 399 2,462 40 IIPOD (NAFTA)
52,667 16,667 9,938 26,062 38 Asian Trade District
36,682 27,359 6,090 3,233 30 Vickery Meadow
5,760 3,298 577 1,885 14 Westmoreland DART
1,678 1,024 515 139 8 UNT Dallas
117,150 79,941 7,643 29,566 52 Stemmons
45,756 29,911 4,484 11,361 126 S. Dallas/Fair Park
50,178 20,461 3,393 26,324 83 West Dallas-Oak Cliff
121,123 100,666 9,613 10,844 241 CBD
TotalServiceRetailBasic# of TSZs
NCTCOG 2005 Estimated Employment in Development Opportunity Areas
- 21 - ECONOMIC VIBRANCY
Appendix: Economic Vibrancy Statistics
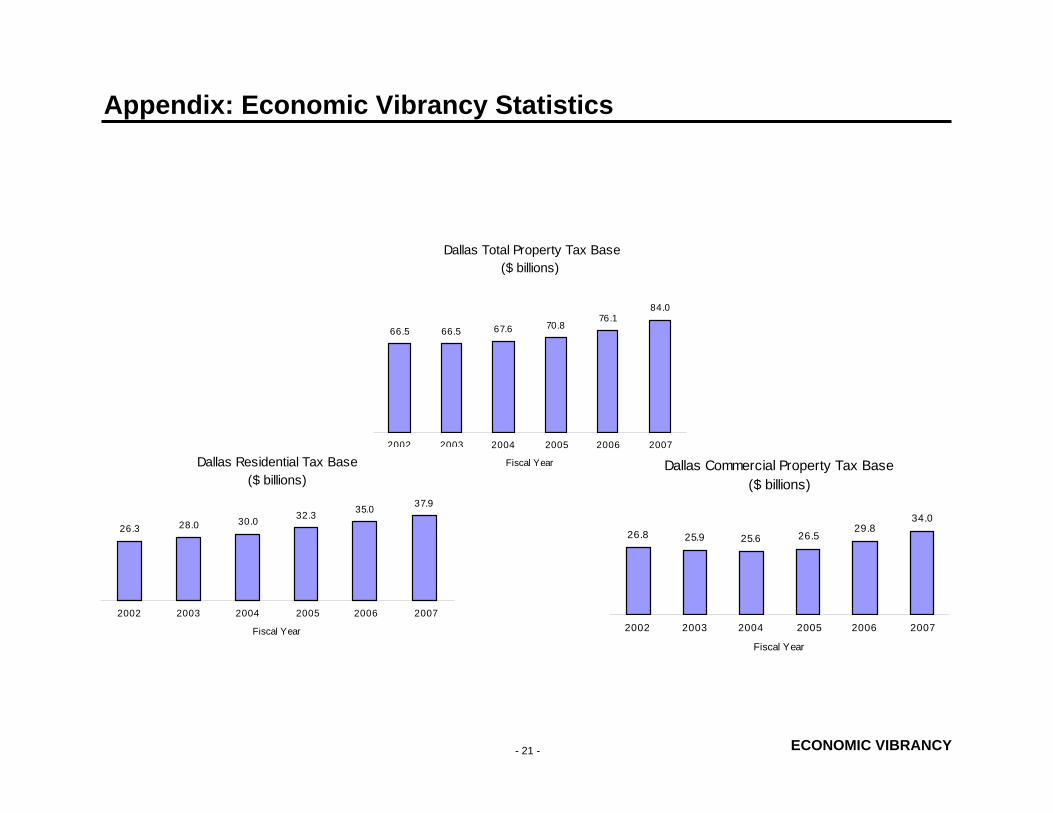
Dallas Total Property Tax Base ($ billions)
66.5 66.5 67.6 70.876.1
84.0
2002 2003 2004 2005 2006 2007
Fiscal YearDallas Residential Tax Base ($ billions)
26.3 28.0 30.0 32.3 35.0 37.9
2002 2003 2004 2005 2006 2007
Fiscal Year
Dallas Commercial Property Tax Base ($ billions)
26.8 25.9 25.6 26.529.8
34.0
2002 2003 2004 2005 2006 2007
Fiscal Year

- 22 - ECONOMIC VIBRANCY
COD Payroll Employment Estimates (Job within the City) 2007 Q3
Calendar Year
SOURCE: CITY OF DALLAS, OFFICE OF ECONMIC DEVELOPMENT, SEASONALLY ADJUSTED.
Appendix: Economic Vibrancy Statistics

- 23 - ECONOMIC VIBRANCY
Appendix: Economic Vibrancy Statistics
Multifamily Redevelopment Map

- 24 - ECONOMIC VIBRANCY
Appendix: Economic Vibrancy StatisticsDespite additional road space, Dallas travel time increases
Council Planning SessionJanuary 16, 2008
Culture, Arts & RecreationKey Focus Area Team

2
Team Members
Richard Abernethy City Manager’s OfficeDee Castillo Convention CenterElva Rodríguez Curl City Manager’s OfficeDavid Fisher Office of Cultural AffairsZarin Gracey Office of Financial ServicesReggie Hurd Park and RecreationBree Meadows City Manager’s OfficeHeather Sherlock Human ResourcesShahrzad Tavana Dallas Water Utilities

3
Roadmap
Envisioned FutureCouncil ObjectivesStrategy MapFactors, Strategies & DataLinks to other KFAs
4
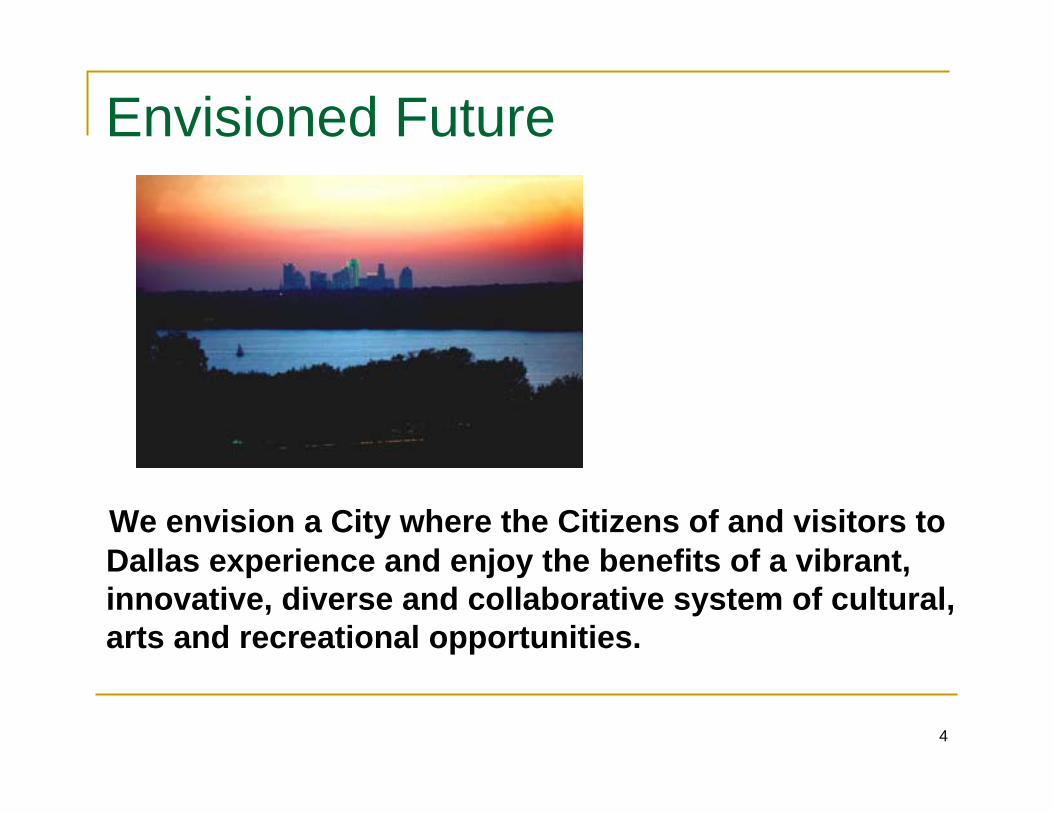
Envisioned Future
We envision a City where the Citizens of and visitors to Dallas experience and enjoy the benefits of a vibrant, innovative, diverse and collaborative system of cultural, arts and recreational opportunities.
5
Envisioned Future
In short, a city where:People ENJOY where they live, work and play.People are ENRICHED…People feel CONNECTED…People feel FULFILLED…People LOVE living, working and playing in Dallas.

6
The plan was approved in 2001 and $101.7M has been approved in bond funding. Full implementation is targeted for 2012.
3. Complete the implementation of the Library master plan by 2012
2006-07 attendance grew by over 8% - the second best year on record – with plans to grow annual attendance to 1 million within 5 years. Bond projects and other exhibits will raise zoo’s stature.
2. Be in the top tier for Zoos in 5 years
Fair Park is in the midst of a capital improvement program to encourage additional year-round use. Overall attendance for FY 07 was up by 3% from FY 06 while museum attendance increased by 62%. New DART rail station is scheduled to open in fall of 2009 and Cotton Bowl improvements will increase seating capacity to 90,000. Management is in discussions with other universities, the US Soccer League and concert promoters to attract additional major sporting and entertainment events.
1. Develop Fair Park as a successful, year round venue by the end of 2008: increasing non-State Fair attendance and bringing at least 2 additional sporting events to the Cotton Bowl.
Most Current Data AvailableObjective
Council Objectives
7
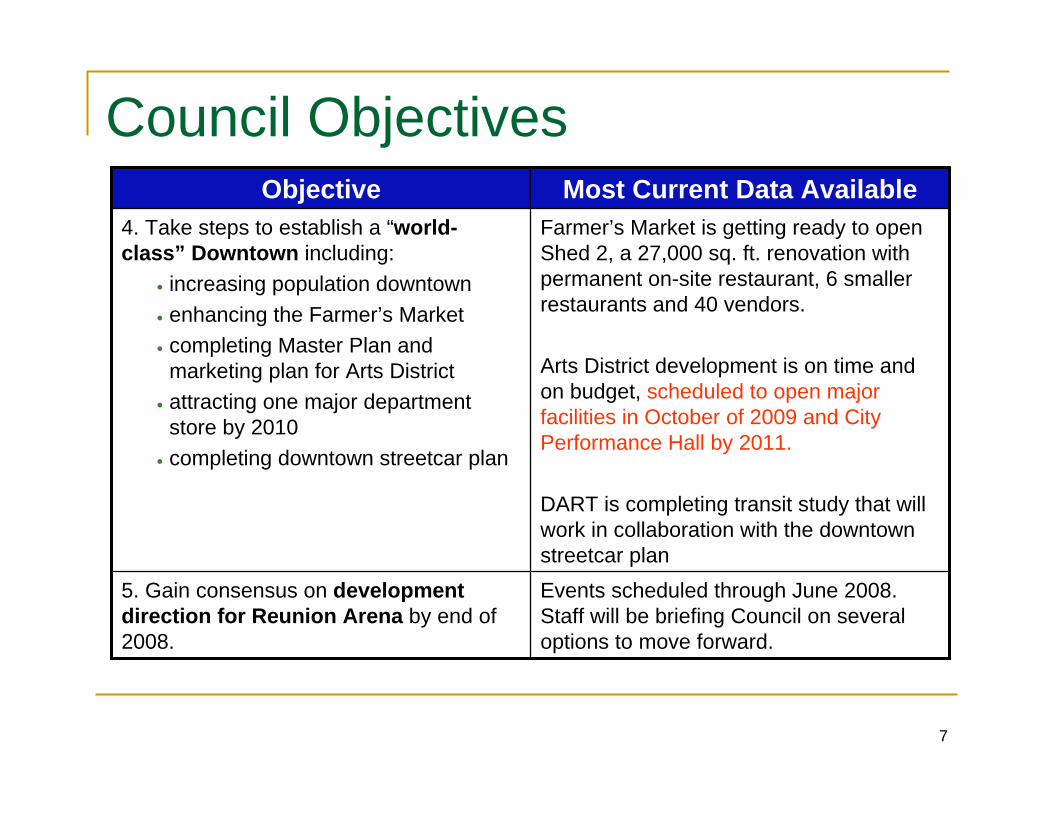
Events scheduled through June 2008. Staff will be briefing Council on several options to move forward.
5. Gain consensus on development direction for Reunion Arena by end of 2008.
Farmer’s Market is getting ready to open Shed 2, a 27,000 sq. ft. renovation with permanent on-site restaurant, 6 smaller restaurants and 40 vendors.
Arts District development is on time and on budget, scheduled to open major facilities in October of 2009 and City Performance Hall by 2011.
DART is completing transit study that will work in collaboration with the downtown streetcar plan
4. Take steps to establish a “world-class” Downtown including:
• increasing population downtown• enhancing the Farmer’s Market• completing Master Plan and marketing plan for Arts District
• attracting one major department store by 2010
• completing downtown streetcar plan
Most Current Data AvailableObjective
Council Objectives

8
Design phase of parkway began Oct. 2006. Environmental Impact Study due in 2009.In the 2007 Citizen Survey, 55% of citizens rated parks as “good” or above. Target is 65% by 2010.
7. Implement Trinity project including:• parkway to relieve traffic congestion and improve air quality• improve citizen impression of parks by 2010
Each department & division has been marketing their services independently.
Departments are presently working in collaboration with PIO to develop a City-wide strategic marketing plan.
6. Develop marketing plan for City’s major cultural and recreational aspects by 2010.
Most Current Data AvailableObjective
Council Objectives

9
Key Factors
DestinationsPrograms
Marketing & Public Engagement
DiversitySustainability
Innovation

10

11
DESTINATIONSObjectives & Strategies
Enhance/develop Fair Park, Dallas Zoo, Library System, “Downtown”, Farmer’s Market, Arts District,
Reunion Arena, Trinity River
COUNCIL OBJECTIVESCOUNCIL OBJECTIVES
Support the Programs in/at the Destination5
Foster collaborations and partnershipsReflect the City’s and/or neighborhoods’ needs and demographicsUtilize resources effectively and efficiently (technology, equipment, staff)
Be appealing, accessible, and safe
SUBSUB--STRATEGIESSTRATEGIES
432
1
Create, support, operate and/or improve the destinationswhere people encounter, enjoy, or participate in cultural,
arts, and recreational activities.
STRATEGY STRATEGY
12
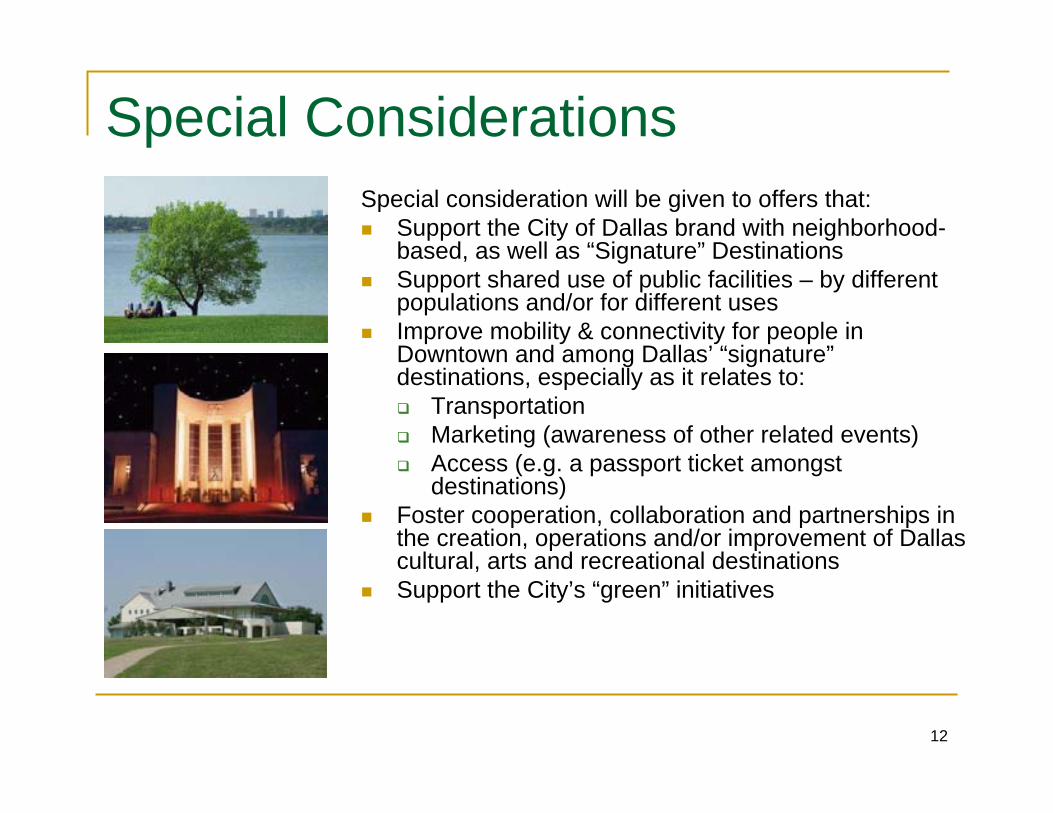
Special ConsiderationsSpecial consideration will be given to offers that:
Support the City of Dallas brand with neighborhood-based, as well as “Signature” DestinationsSupport shared use of public facilities – by different populations and/or for different usesImprove mobility & connectivity for people in Downtown and among Dallas’ “signature”destinations, especially as it relates to:
TransportationMarketing (awareness of other related events)Access (e.g. a passport ticket amongst destinations)
Foster cooperation, collaboration and partnerships in the creation, operations and/or improvement of Dallas cultural, arts and recreational destinationsSupport the City’s “green” initiatives
13
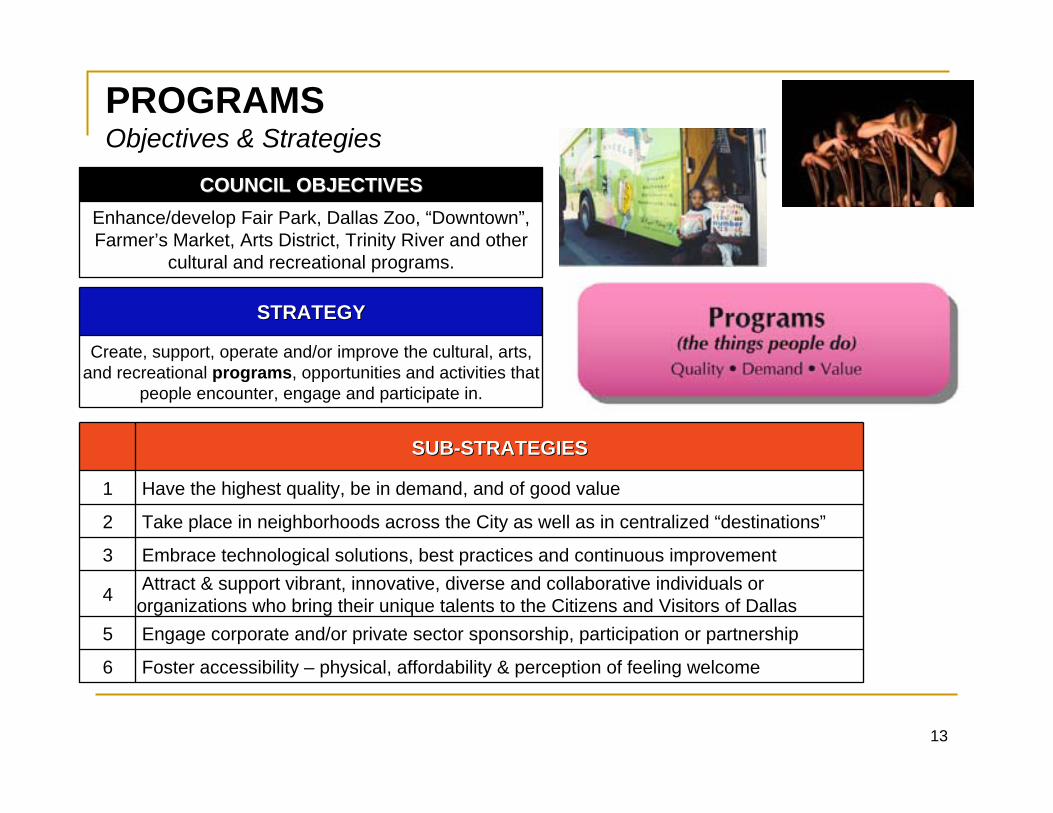
PROGRAMSObjectives & Strategies
Enhance/develop Fair Park, Dallas Zoo, “Downtown”, Farmer’s Market, Arts District, Trinity River and other
cultural and recreational programs.
COUNCIL OBJECTIVESCOUNCIL OBJECTIVES
Take place in neighborhoods across the City as well as in centralized “destinations”2
Foster accessibility – physical, affordability & perception of feeling welcome6
Engage corporate and/or private sector sponsorship, participation or partnership
Attract & support vibrant, innovative, diverse and collaborative individuals or organizations who bring their unique talents to the Citizens and Visitors of Dallas
Embrace technological solutions, best practices and continuous improvement
Have the highest quality, be in demand, and of good value
SUBSUB--STRATEGIESSTRATEGIES
5
4
3
1
Create, support, operate and/or improve the cultural, arts, and recreational programs, opportunities and activities that
people encounter, engage and participate in.
STRATEGY STRATEGY
14
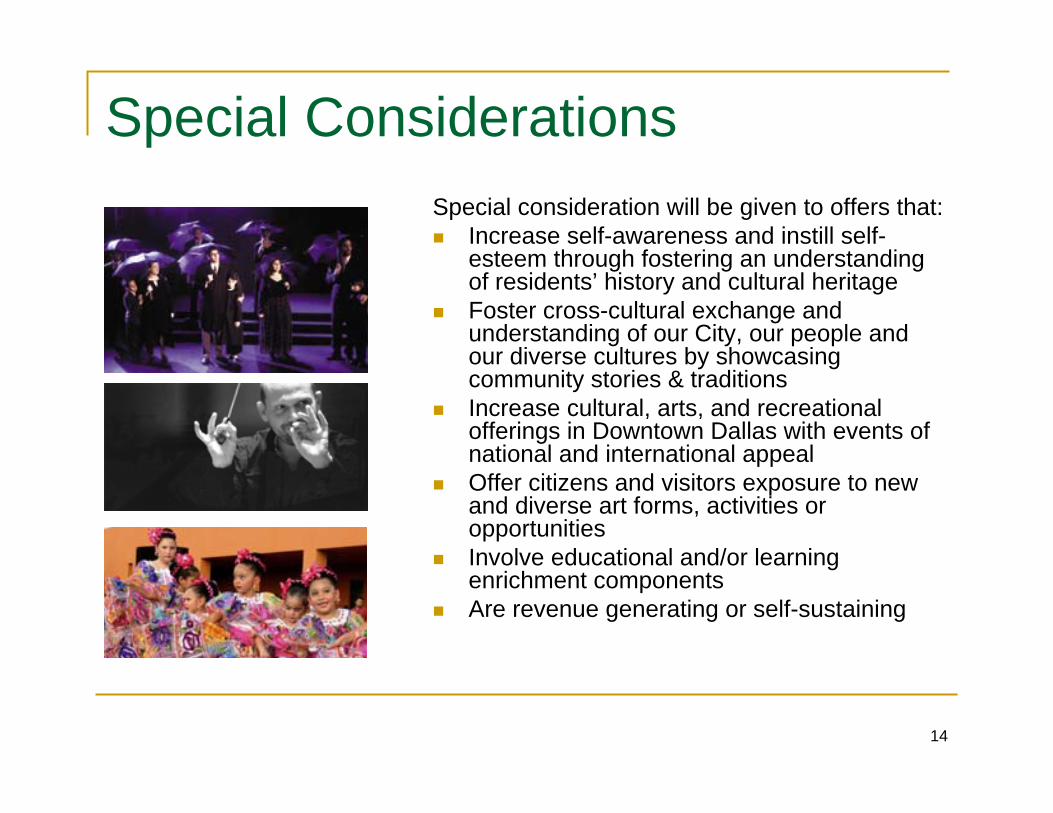
Special ConsiderationsSpecial consideration will be given to offers that:
Increase self-awareness and instill self-esteem through fostering an understanding of residents’ history and cultural heritageFoster cross-cultural exchange and understanding of our City, our people and our diverse cultures by showcasing community stories & traditionsIncrease cultural, arts, and recreational offerings in Downtown Dallas with events of national and international appealOffer citizens and visitors exposure to new and diverse art forms, activities or opportunitiesInvolve educational and/or learning enrichment componentsAre revenue generating or self-sustaining
15
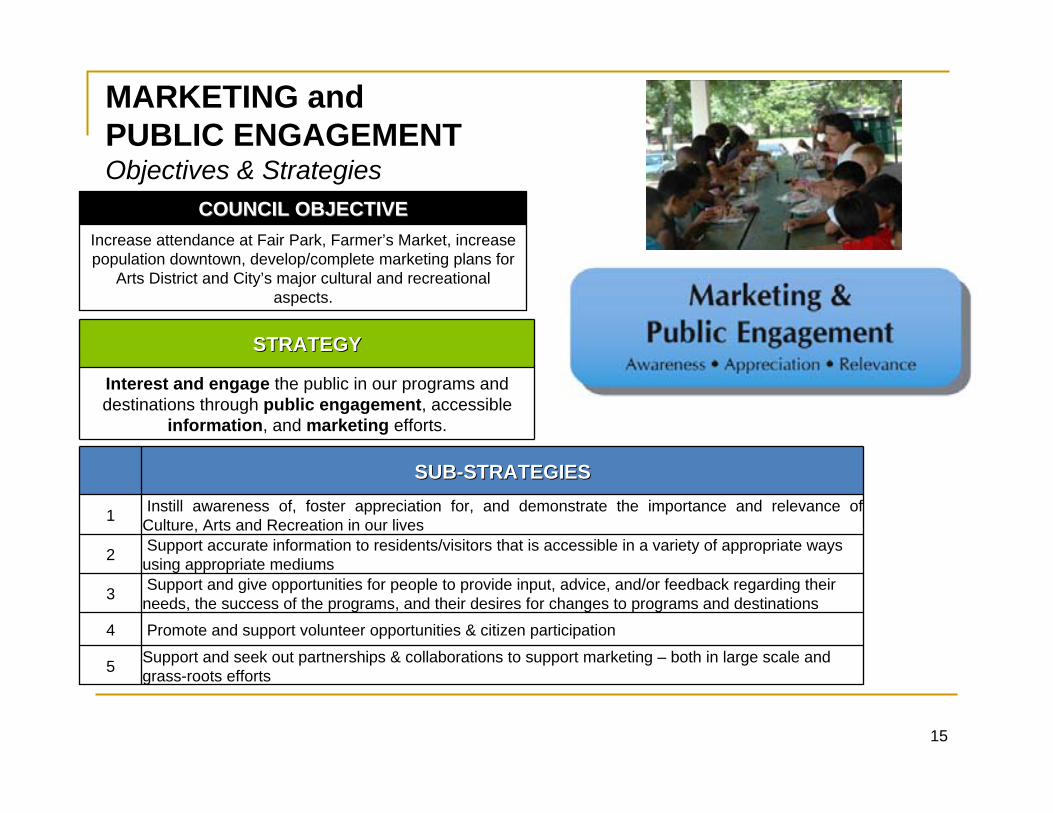
MARKETING and PUBLIC ENGAGEMENT Objectives & Strategies
Increase attendance at Fair Park, Farmer’s Market, increase population downtown, develop/complete marketing plans for
Arts District and City’s major cultural and recreational aspects.
COUNCIL OBJECTIVECOUNCIL OBJECTIVE
Support and seek out partnerships & collaborations to support marketing – both in large scale and grass-roots efforts
Promote and support volunteer opportunities & citizen participation
Support and give opportunities for people to provide input, advice, and/or feedback regarding their needs, the success of the programs, and their desires for changes to programs and destinations
Support accurate information to residents/visitors that is accessible in a variety of appropriate ways using appropriate mediums
Instill awareness of, foster appreciation for, and demonstrate the importance and relevance of Culture, Arts and Recreation in our lives
SUBSUB--STRATEGIESSTRATEGIES
5
4
3
2
1
Interest and engage the public in our programs and destinations through public engagement, accessible
information, and marketing efforts.
STRATEGY STRATEGY
16
Special Consideration – Marketing and Public Engagement
Increase awareness of programs/services that are associated with/promote the City of Dallas brandSupport new technologies and techniques of Marketing and EngagementSupport the shared use of resources, technology and distribution channelsIncrease or support tourism efforts
Special consideration will be given to offers that:
17
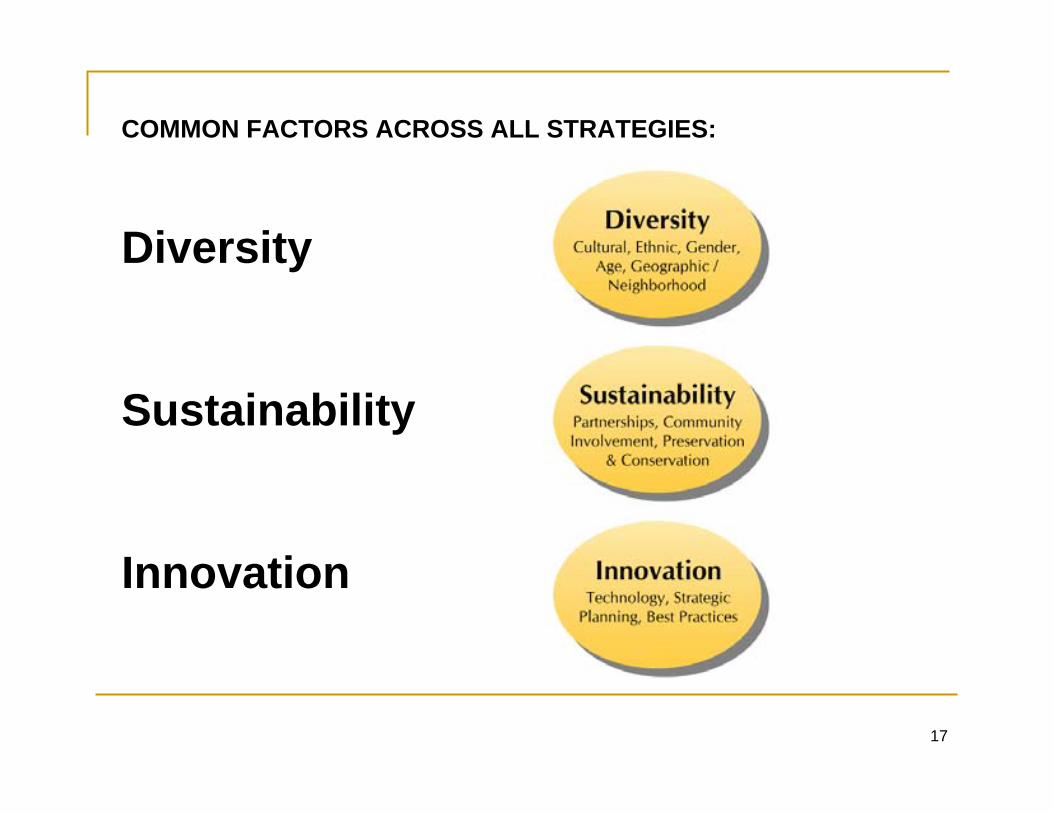
COMMON FACTORS ACROSS ALL STRATEGIES:
Diversity
Sustainability
Innovation

18
19
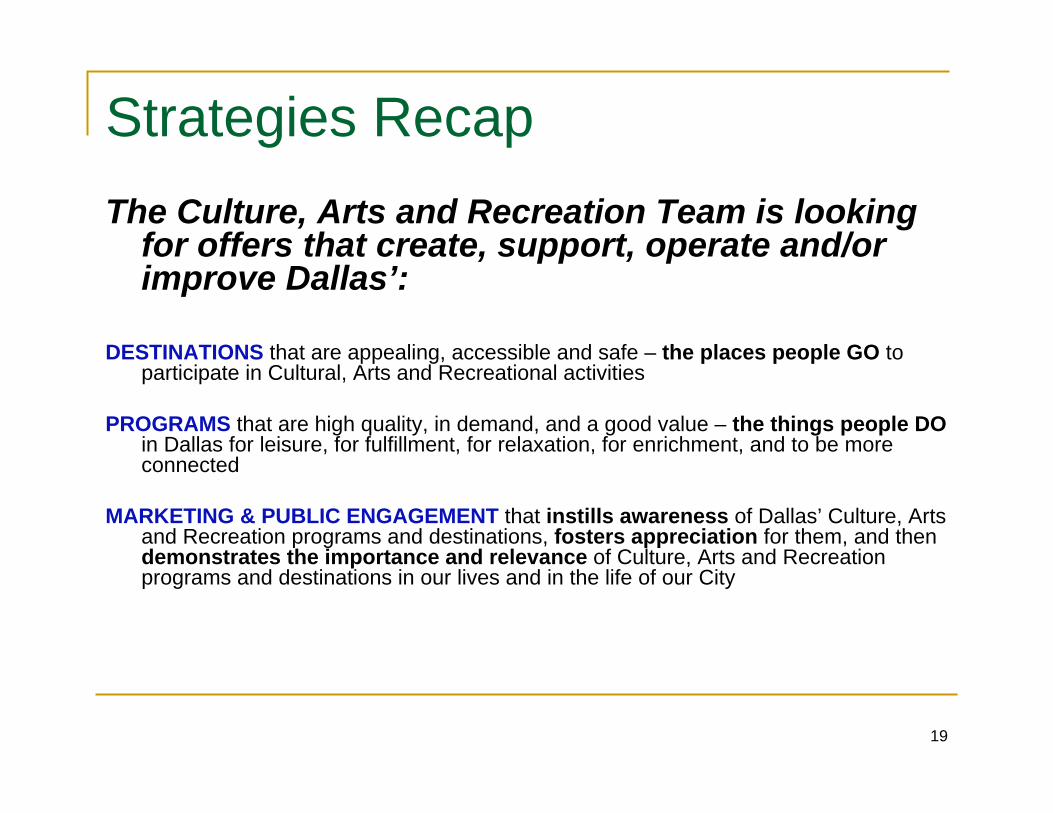
Strategies RecapThe Culture, Arts and Recreation Team is looking
for offers that create, support, operate and/or improve Dallas’:
DESTINATIONS that are appealing, accessible and safe – the places people GO to participate in Cultural, Arts and Recreational activities
PROGRAMS that are high quality, in demand, and a good value – the things people DOin Dallas for leisure, for fulfillment, for relaxation, for enrichment, and to be more connected
MARKETING & PUBLIC ENGAGEMENT that instills awareness of Dallas’ Culture, Arts and Recreation programs and destinations, fosters appreciation for them, and then demonstrates the importance and relevance of Culture, Arts and Recreation programs and destinations in our lives and in the life of our City
20
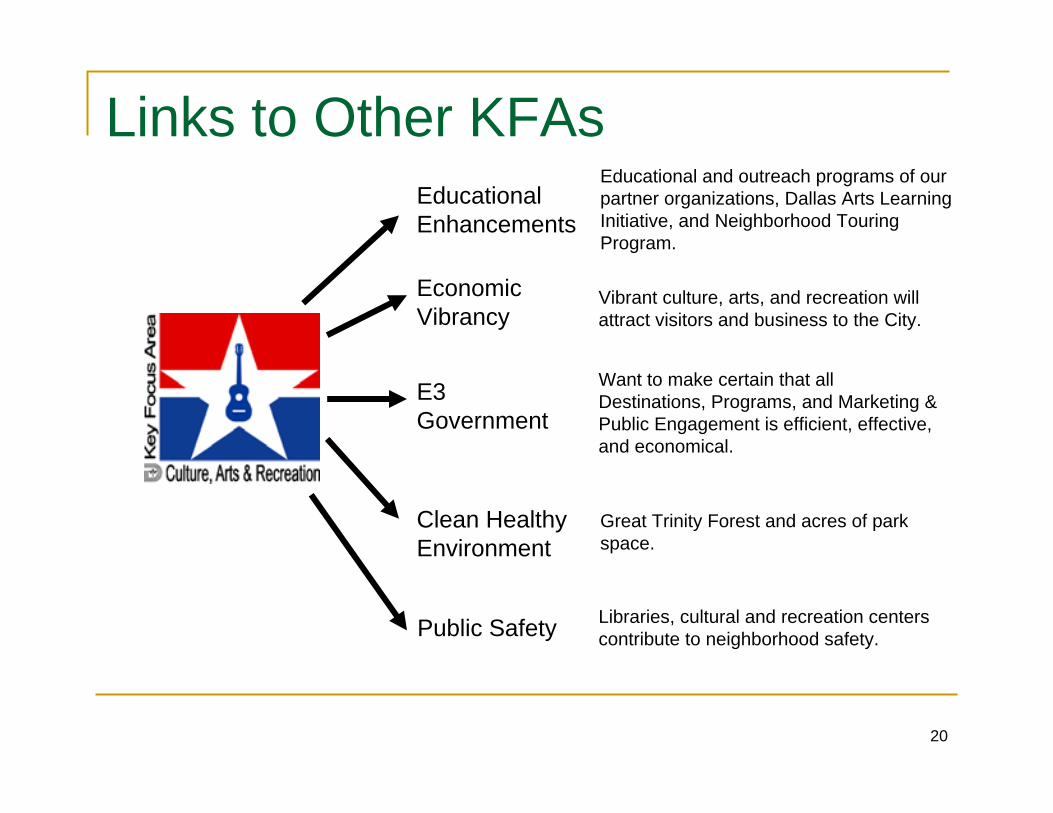
Links to Other KFAsEducationalEnhancements
EconomicVibrancy
Clean HealthyEnvironment
Public Safety
E3Government
Great Trinity Forest and acres of park space.
Educational and outreach programs of our partner organizations, Dallas Arts Learning Initiative, and Neighborhood Touring Program.
Libraries, cultural and recreation centers contribute to neighborhood safety.
Want to make certain that all Destinations, Programs, and Marketing & Public Engagement is efficient, effective, and economical.
Vibrant culture, arts, and recreation will attract visitors and business to the City.

21
Envisioned Future Recap
The citizens of and visitors to Dallas experience and
enjoy the benefits of a vibrant,
innovative, diverse and collaborative system of cultural,
arts and recreational
opportunities.
People LOVE living, working and playing in
Dallas.
E D U C A T I O N A L E N H A N C E M E N T S1
E D U C A T I O N A LE N H A N C E M E N T SK e y F o c u s A r e a T e a m
Council Planning SessionJanuary 16, 2008
E D U C A T I O N A L E N H A N C E M E N T S2
Dr. Cynthia Bennett Park & Recreation
Eric Griffin Strategic Customer Services
LaToya Jackson Intergovernmental Services
Adam Jochelson (Lead) Sanitation Services
Rebecca Mathews Dallas Fire-Rescue
Katie Nkana Environmental & Health Services
David Rathvon Dallas Public Library
Trina Stokes Office of Financial Services
T E A M M E M B E R S

E D U C A T I O N A L E N H A N C E M E N T S3
∞ Envisioned Future
R O A D M A P
∞ Links – Other KFAs
∞ Strategies & Data
∞ Strategy Map
∞ Council Objectives
E D U C A T I O N A L E N H A N C E M E N T S4
E N V I S I O N E D F U T U R E
Recognizing that education is the foundation
for achieving prosperity, health and well-
being, the City of Dallas supports lifelong
learning opportunities through partnerships
with agencies throughout the Dallas
community and beyond...

E D U C A T I O N A L E N H A N C E M E N T S5
C O U N C I L O B J E C T I V E S
Graduation Rate1:Class DISD Rate2006 68.8%2005 77.8%2004 80.8%2003 81.3%
Achievement Tests1:2007 Test State DistrictReading 89% 77%Math 82% 71%All Tests 78% 64%
Improve Student Performance
• Graduation rate: Through early development programs and graduation incentives, bring the high school graduation rate to 85% by 2010
• Achievement tests: Improve lower-grade students performance on standardized tests (match DISD objective of 90% pass rate by 2010)
MOST RECENT DATAOBJECTIVE

E D U C A T I O N A L E N H A N C E M E N T S6
C O U N C I L O B J E C T I V E S
2006 Dallas pop.>5 years of age (est.) Percent3
•Foreign born 26.9%•Speak no English at home 43.4%•Speak English less than
‘very well’ 24.7%
Promote Bilingualism
After spending 18 months with a Big Brother/Big Sister, participants were2:• 46% less likely to begin using illegal drugs • 27% less likely to begin using alcohol • 52% less likely to skip school • 37% less likely to skip a class
Encourage Mentorship
• General: Increase number of youth in mentoring programs by 5% per year through 2011
• City: Increase employee participation in mentoring programs by 5% per year through 2011
• Private Sector: Establish a mechanism to encourage developers & businesses to mentor and promote higher education (expose students to science, math & tech careers)
MOST RECENT DATAOBJECTIVE
E D U C A T I O N A L E N H A N C E M E N T S7
C O U N C I L O B J E C T I V E S
2006 Students TX Grad Rate5
Female 72%Male 65%
African Am. Males 53%Asian/Pacific Islander 82%Hispanic Males 53%White Males 72%
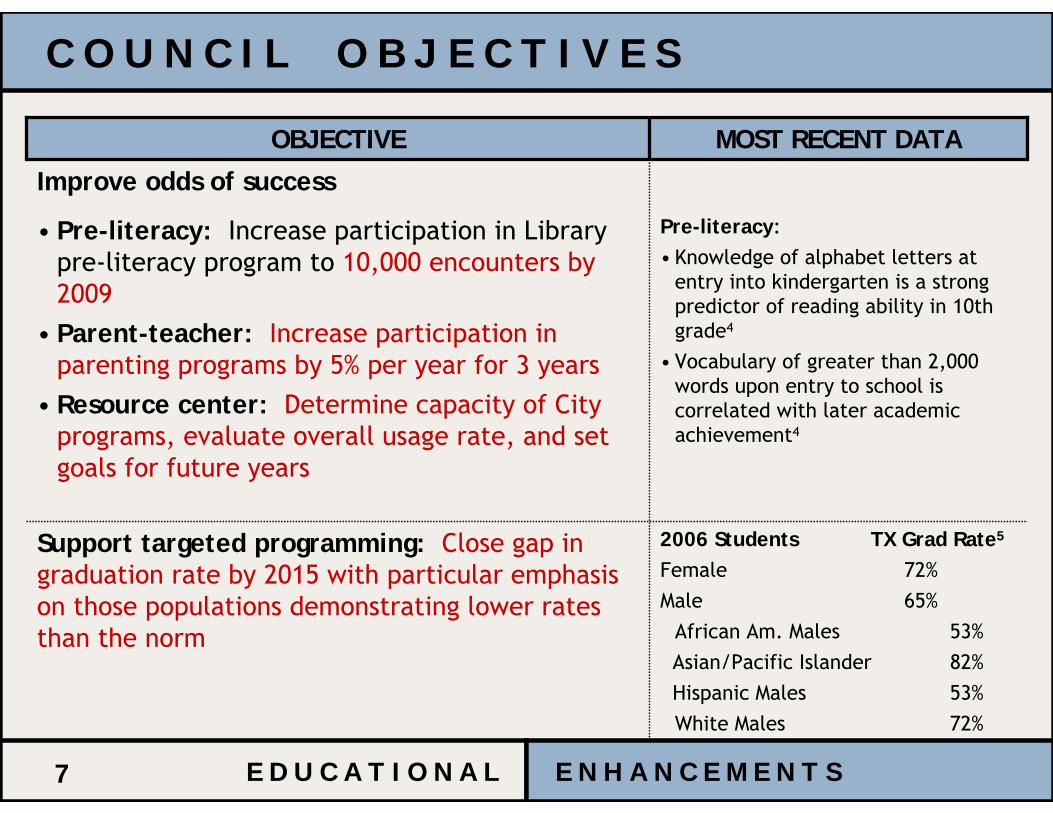
Support targeted programming: Close gap in graduation rate by 2015 with particular emphasis on those populations demonstrating lower rates than the norm
Pre-literacy:• Knowledge of alphabet letters at
entry into kindergarten is a strong predictor of reading ability in 10th grade4
• Vocabulary of greater than 2,000 words upon entry to school is correlated with later academic achievement4
Improve odds of success
• Pre-literacy: Increase participation in Library pre-literacy program to 10,000 encounters by 2009
• Parent-teacher: Increase participation in parenting programs by 5% per year for 3 years
• Resource center: Determine capacity of City programs, evaluate overall usage rate, and set goals for future years
MOST RECENT DATAOBJECTIVE
E D U C A T I O N A L E N H A N C E M E N T S8
C O U N C I L O B J E C T I V E S
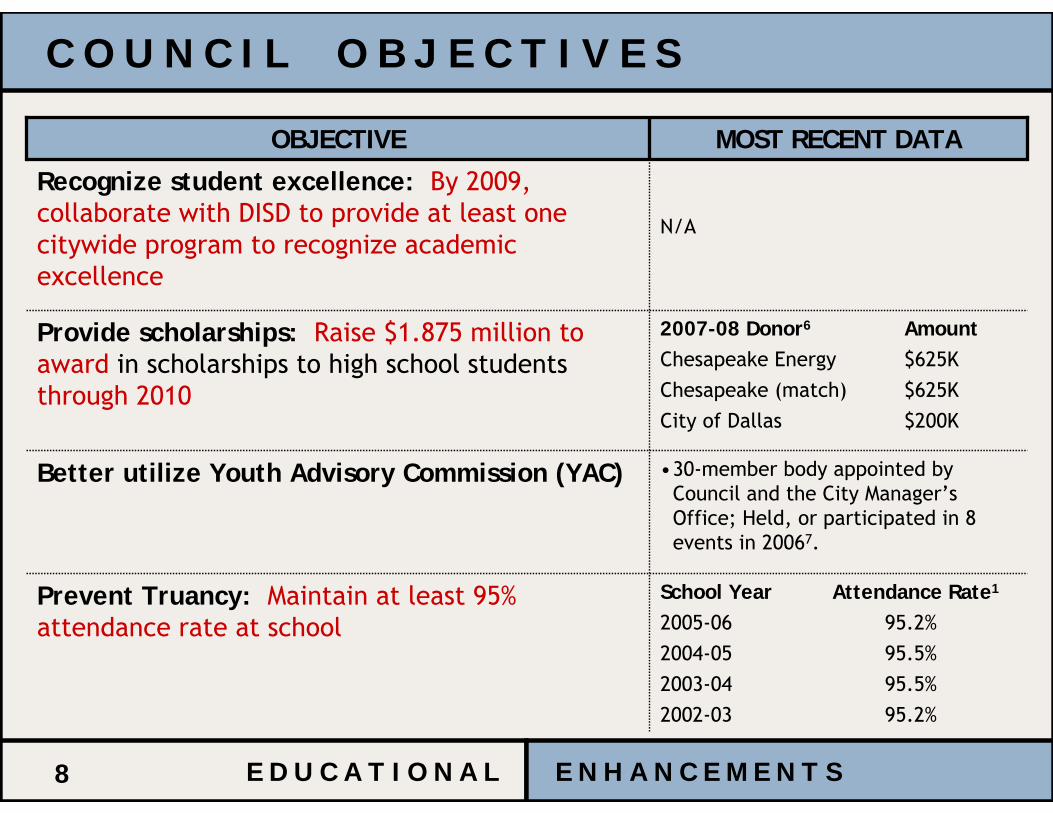
2007-08 Donor6 AmountChesapeake Energy $625KChesapeake (match) $625KCity of Dallas $200K
Provide scholarships: Raise $1.875 million to award in scholarships to high school students through 2010
•30-member body appointed by Council and the City Manager’s Office; Held, or participated in 8 events in 20067.
Better utilize Youth Advisory Commission (YAC)
School Year Attendance Rate1
2005-06 95.2%2004-05 95.5%2003-04 95.5%2002-03 95.2%
Prevent Truancy: Maintain at least 95% attendance rate at school
N/A
Recognize student excellence: By 2009, collaborate with DISD to provide at least one citywide program to recognize academic excellence
MOST RECENT DATAOBJECTIVE
E D U C A T I O N A L E N H A N C E M E N T S9
C O U N C I L O B J E C T I V E S
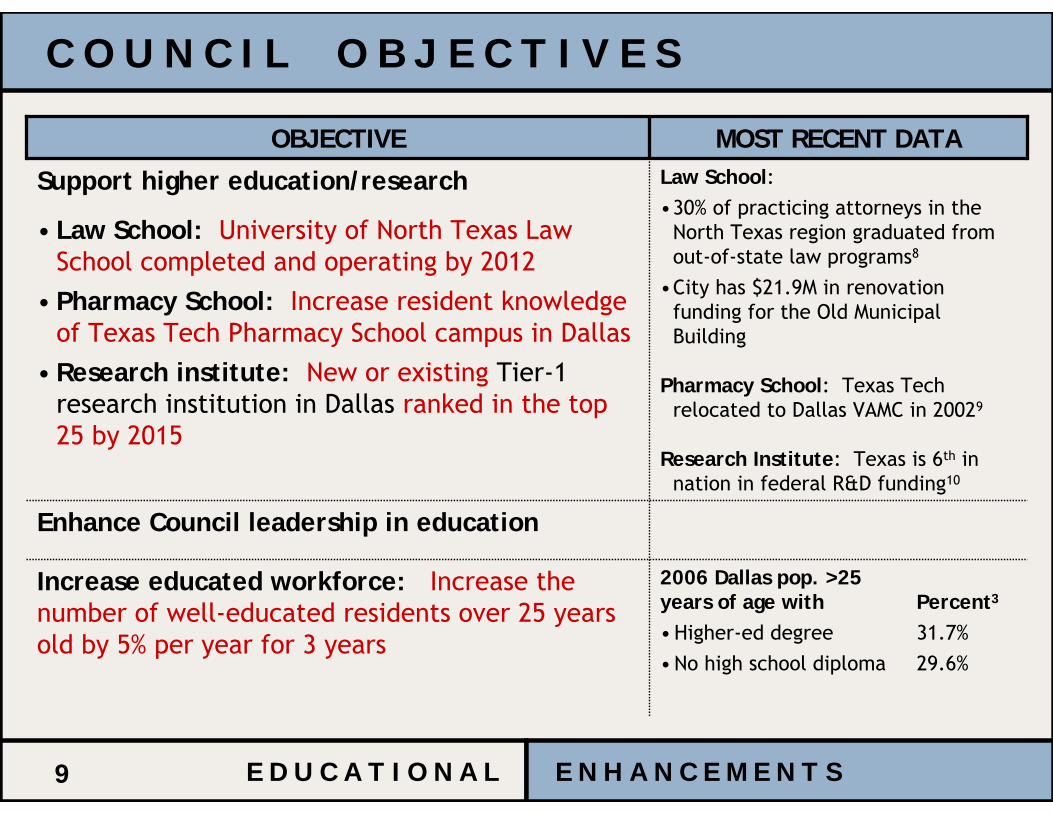
Enhance Council leadership in education
2006 Dallas pop. >25years of age with Percent3
• Higher-ed degree 31.7%• No high school diploma 29.6%
Increase educated workforce: Increase the number of well-educated residents over 25 years old by 5% per year for 3 years
Law School:•30% of practicing attorneys in the
North Texas region graduated from out-of-state law programs8
•City has $21.9M in renovation funding for the Old Municipal Building
Pharmacy School: Texas Tech relocated to Dallas VAMC in 20029
Research Institute: Texas is 6th in nation in federal R&D funding10
Support higher education/research
• Law School: University of North Texas Law School completed and operating by 2012
• Pharmacy School: Increase resident knowledge of Texas Tech Pharmacy School campus in Dallas
• Research institute: New or existing Tier-1 research institution in Dallas ranked in the top 25 by 2015
MOST RECENT DATAOBJECTIVE
E D U C A T I O N A L E N H A N C E M E N T S10
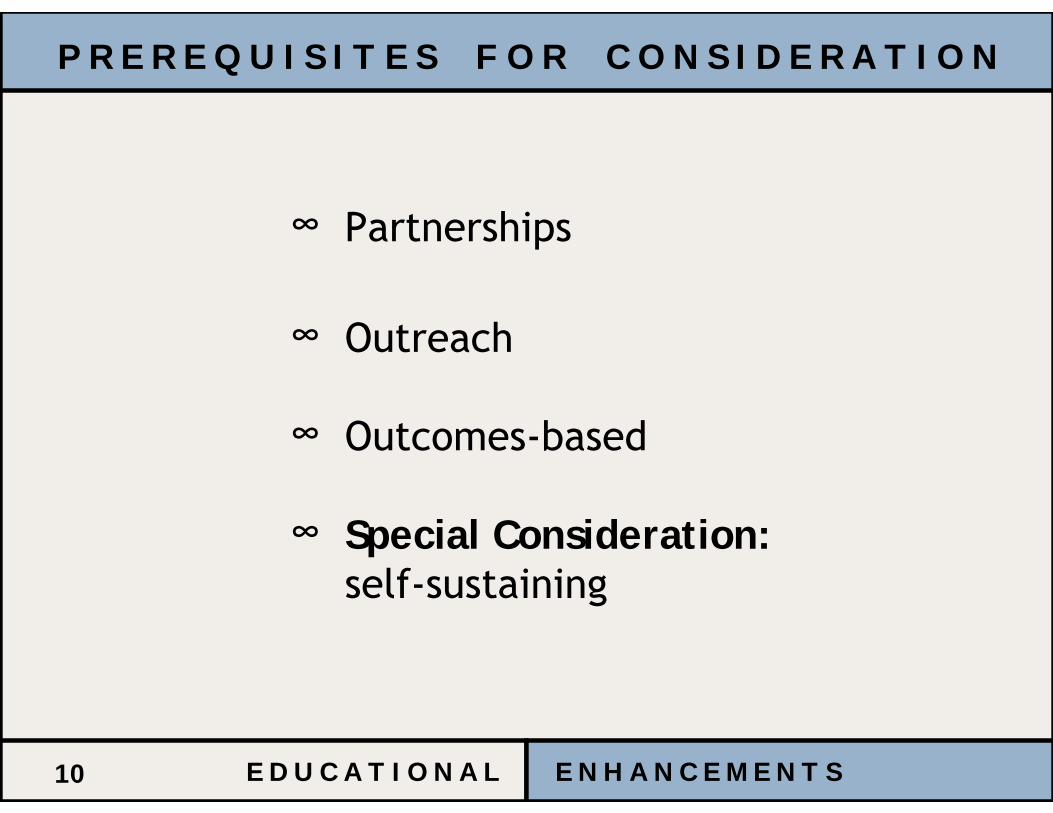
P R E R E Q U I S I T E S F O R C O N S I D E R A T I O N
∞ Partnerships
∞ Outreach
∞ Outcomes-based
∞ Special Consideration:self-sustaining
E D U C A T I O N A L E N H A N C E M E N T S11
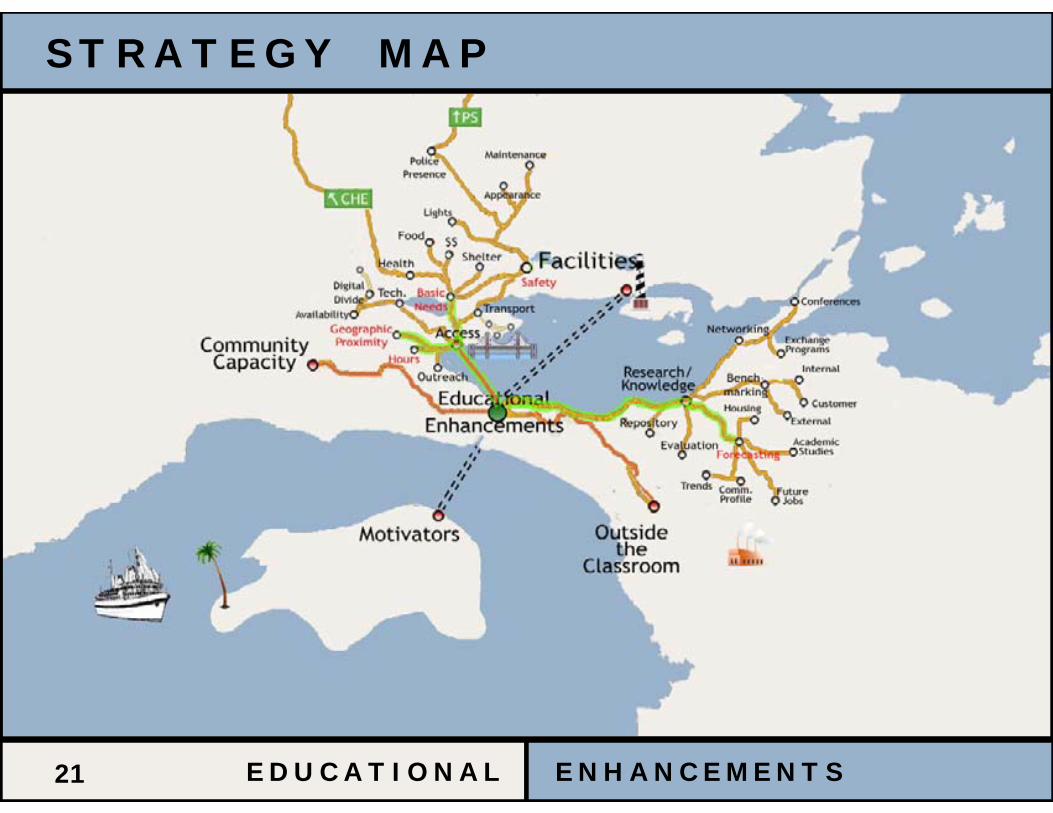
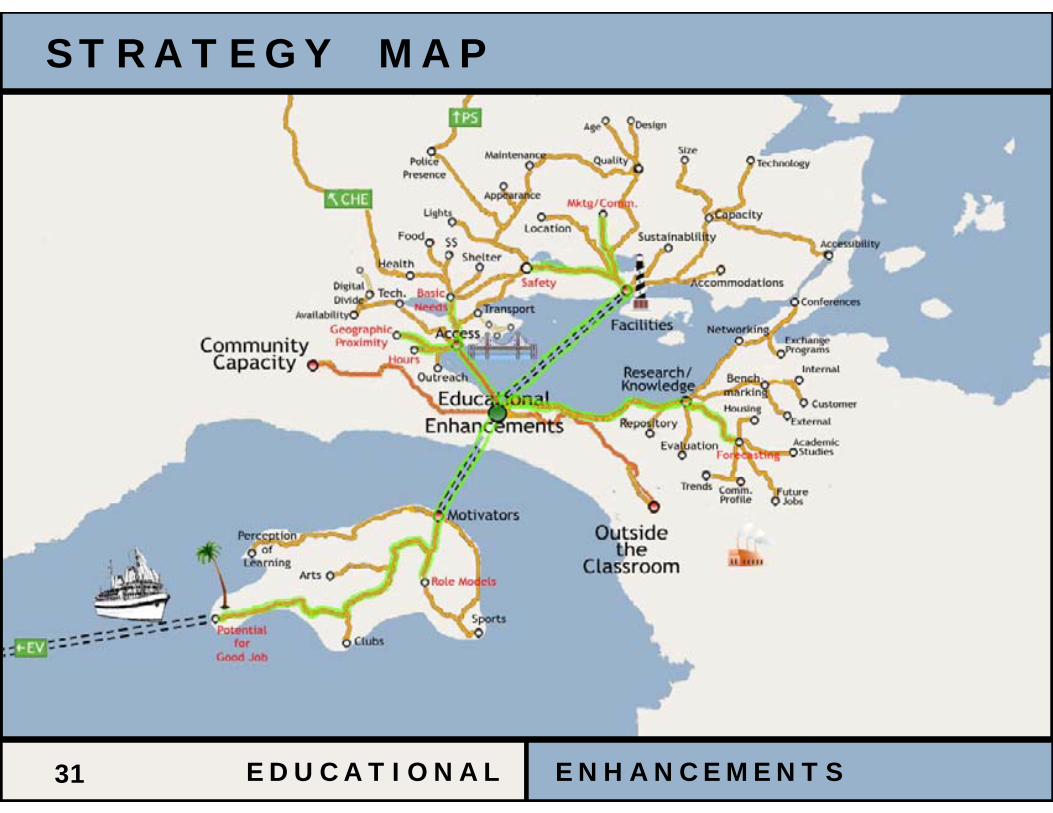
S T R A T E G Y M A P
E D U C A T I O N A L E N H A N C E M E N T S12
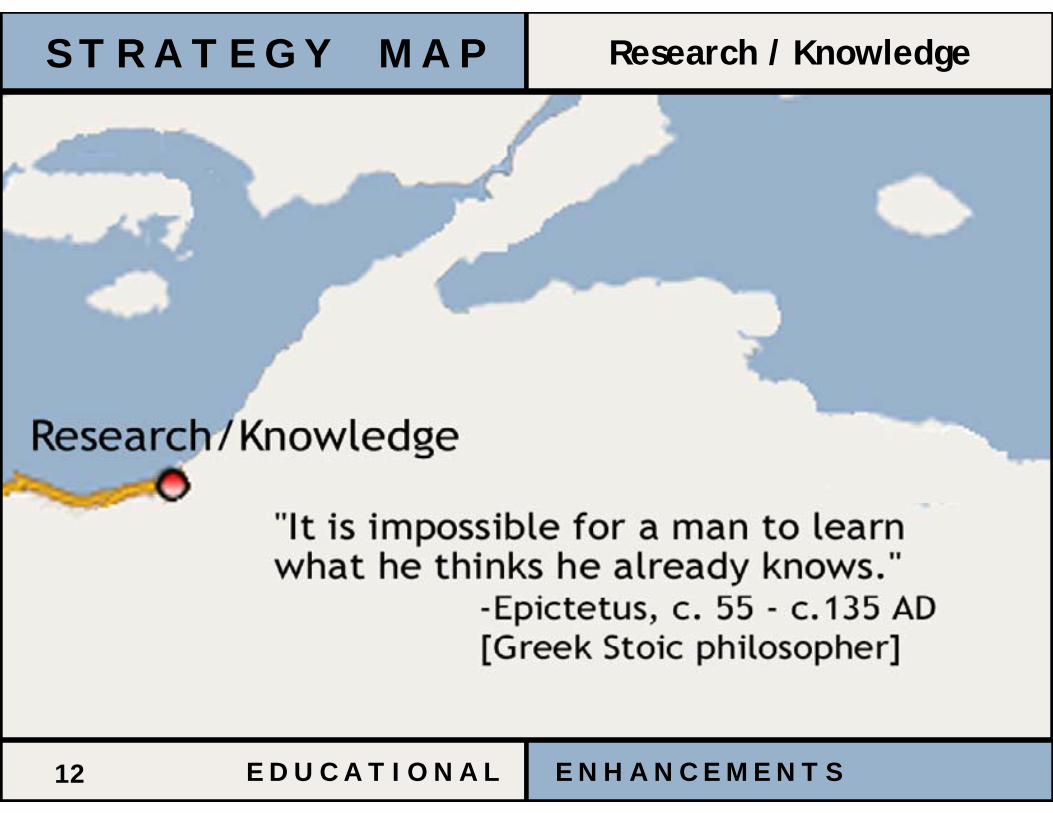
S T R A T E G Y M A P Research / Knowledge
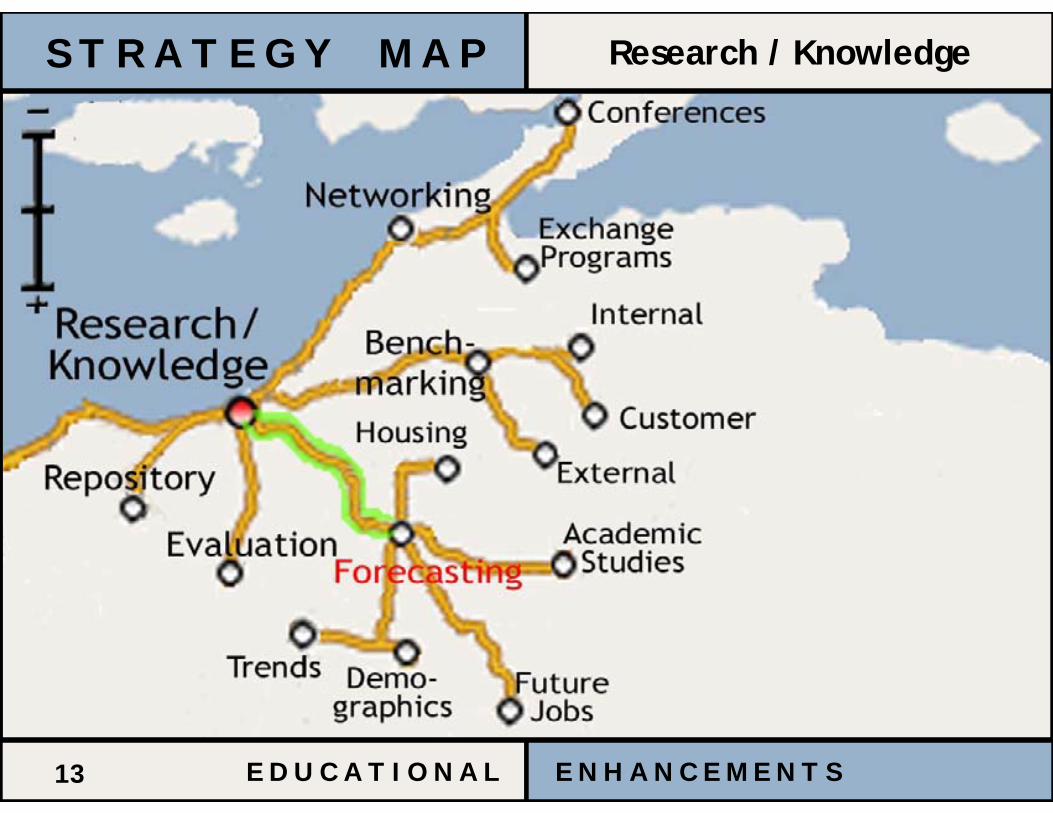
E D U C A T I O N A L E N H A N C E M E N T S13
S T R A T E G Y M A P Research / Knowledge

E D U C A T I O N A L E N H A N C E M E N T S14
Encourage data collection and analysis across agencies (such as forecasting, benchmarking, identifying best practices and cross-functional networking). This might include:
S T R A T E G Y M A P
Strategy #1
1 Gathering and using data to make decisions around policy, resource provision and programming;
2 Developing a repository for research data from new/existing projects, programs, studies, and/or other efforts; and
3 Addressing the impact of developing the built environment on local communities (i.e. on the learning environment, neighborhood quality and stability, tax-base implications, etc.).
Research / Knowledge
Sub-strategies
Council Objectives:
Bilingualism
Research institute
E D U C A T I O N A L E N H A N C E M E N T S15
S T R A T E G Y M A P
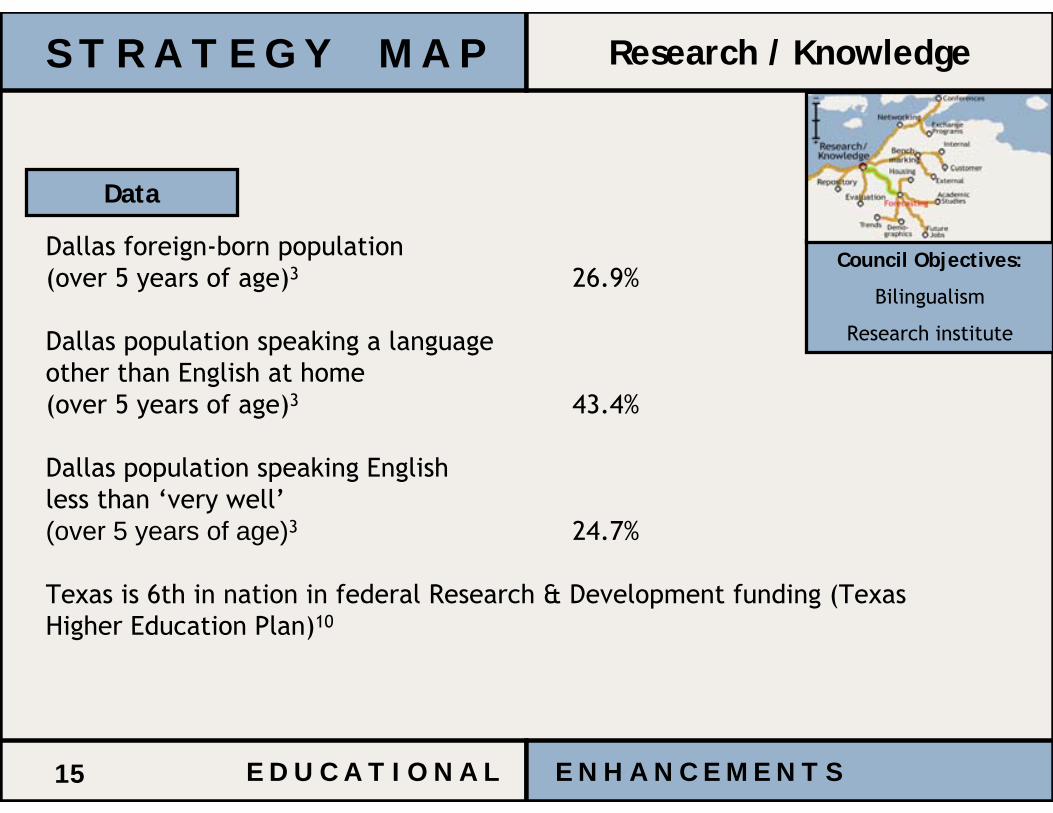
Dallas foreign-born population(over 5 years of age)3 26.9%
Dallas population speaking a languageother than English at home(over 5 years of age)3 43.4%
Dallas population speaking Englishless than ‘very well’(over 5 years of age)3 24.7%
Texas is 6th in nation in federal Research & Development funding (Texas Higher Education Plan)10
Research / Knowledge
Data
Council Objectives:
Bilingualism
Research institute
E D U C A T I O N A L E N H A N C E M E N T S16
S T R A T E G Y M A P

E D U C A T I O N A L E N H A N C E M E N T S17
S T R A T E G Y M A P Access
E D U C A T I O N A L E N H A N C E M E N T S18
S T R A T E G Y M A P Access

E D U C A T I O N A L E N H A N C E M E N T S19
Promote access to information and learning opportunities, addressing variables such as convenience, affordability, non-traditional hours, proximity and appropriateness. This might include:
S T R A T E G Y M A P
Strategy #2
1 Utilizing existing facilities for easy access and proximity (supplement to and partnership with neighborhood organizations and communitycenters to enhance continuous learning);
2 Enhancing residents’ capability to use technology to access educational opportunities; and
3 Promoting alternative forms of transportation to allow increased physical access to educational facilities.
Access
Sub-strategies
Council Objectives:
Resource Center
E D U C A T I O N A L E N H A N C E M E N T S20
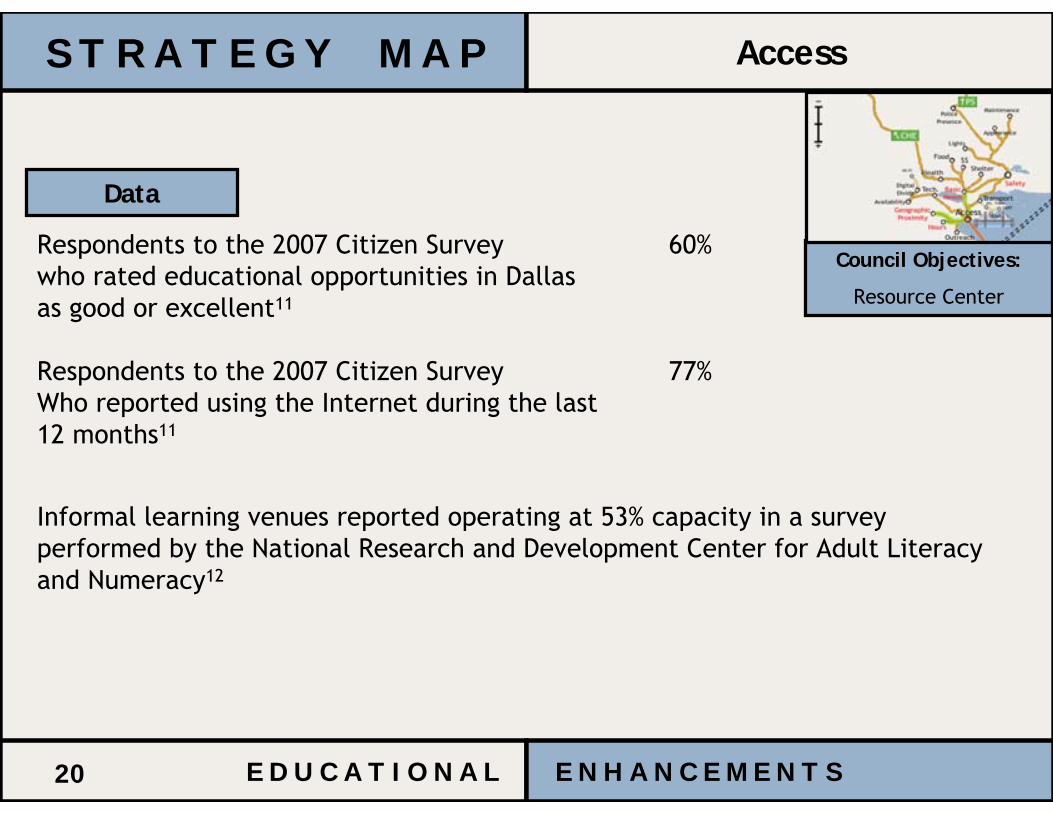
S T R A T E G Y M A P Access
Respondents to the 2007 Citizen Survey 60%who rated educational opportunities in Dallasas good or excellent11
Respondents to the 2007 Citizen Survey 77%Who reported using the Internet during the last12 months11
Informal learning venues reported operating at 53% capacity in a survey performed by the National Research and Development Center for Adult Literacy and Numeracy12
Council Objectives:
Resource Center
Data
E D U C A T I O N A L E N H A N C E M E N T S21
S T R A T E G Y M A P
E D U C A T I O N A L E N H A N C E M E N T S22
S T R A T E G Y M A P Facilities

E D U C A T I O N A L E N H A N C E M E N T S23
S T R A T E G Y M A P Facilities
E D U C A T I O N A L E N H A N C E M E N T S24
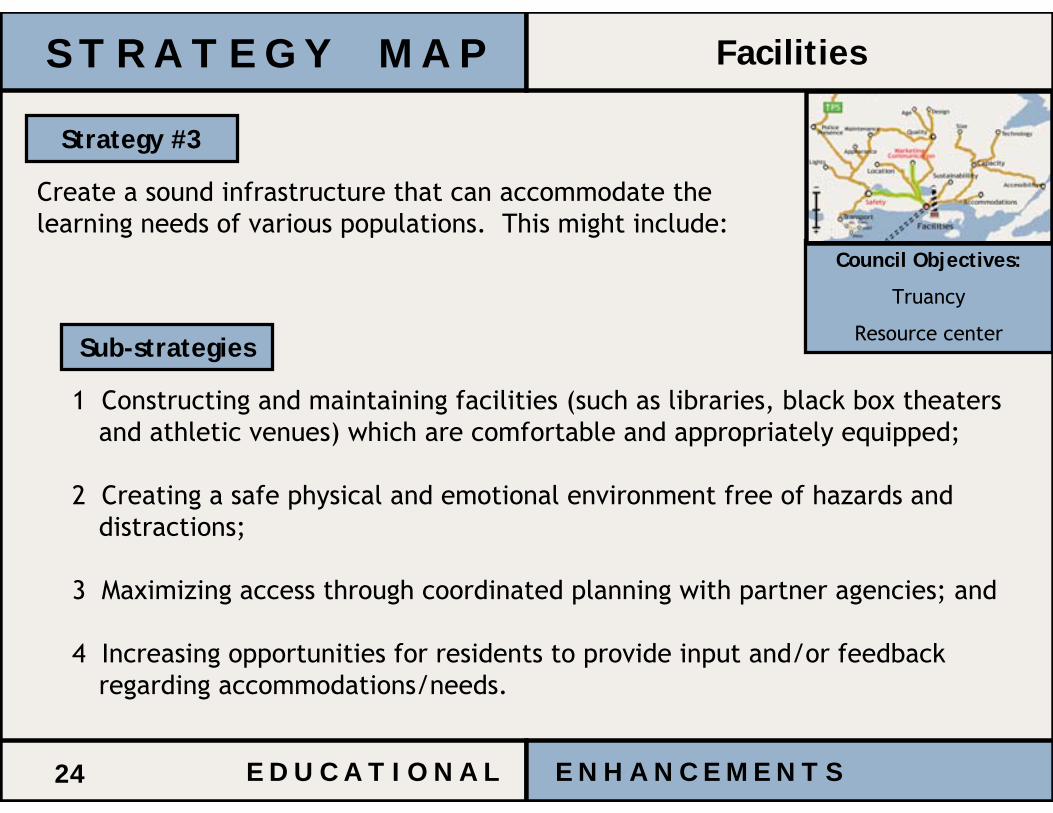
Create a sound infrastructure that can accommodate the learning needs of various populations. This might include:
Strategy #3
1 Constructing and maintaining facilities (such as libraries, black box theaters and athletic venues) which are comfortable and appropriately equipped;
2 Creating a safe physical and emotional environment free of hazards and distractions;
3 Maximizing access through coordinated planning with partner agencies; and
4 Increasing opportunities for residents to provide input and/or feedback regarding accommodations/needs.
Sub-strategies
S T R A T E G Y M A P Facilities
Council Objectives:
Truancy
Resource center
E D U C A T I O N A L E N H A N C E M E N T S25
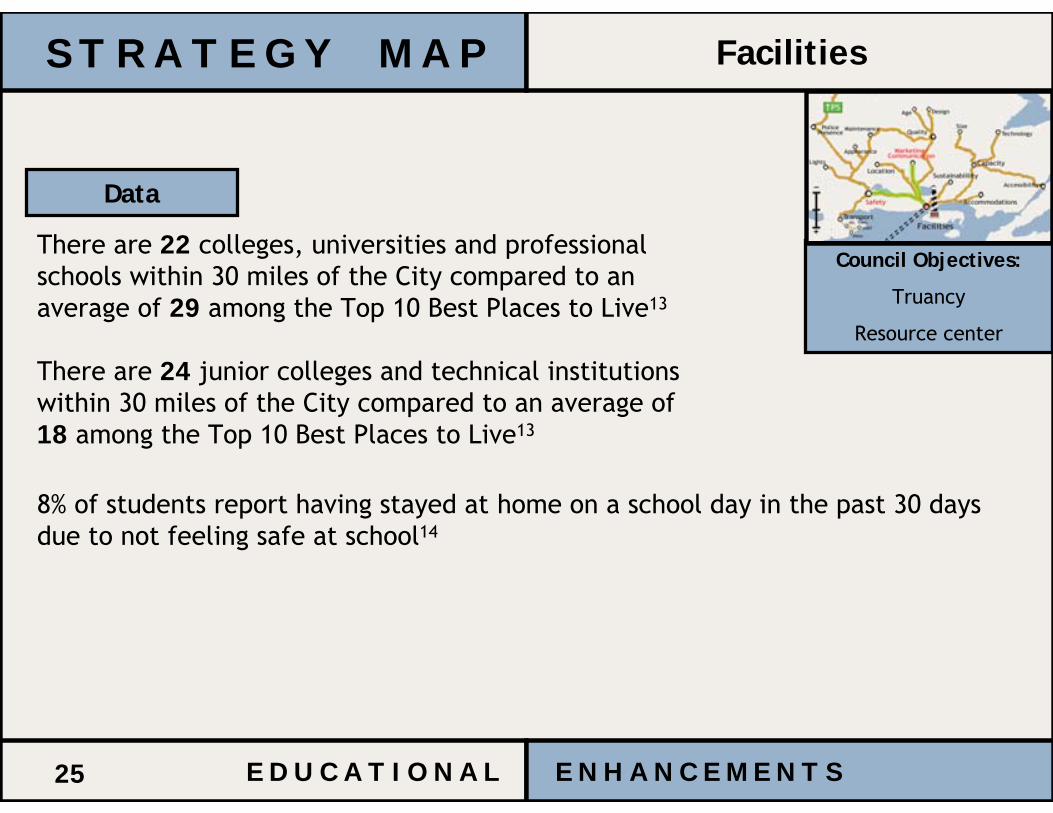
S T R A T E G Y M A P Facilities
There are 22 colleges, universities and professional schools within 30 miles of the City compared to an average of 29 among the Top 10 Best Places to Live13
There are 24 junior colleges and technical institutions within 30 miles of the City compared to an average of 18 among the Top 10 Best Places to Live13
Council Objectives:
Truancy
Resource center
Data
8% of students report having stayed at home on a school day in the past 30 days due to not feeling safe at school14
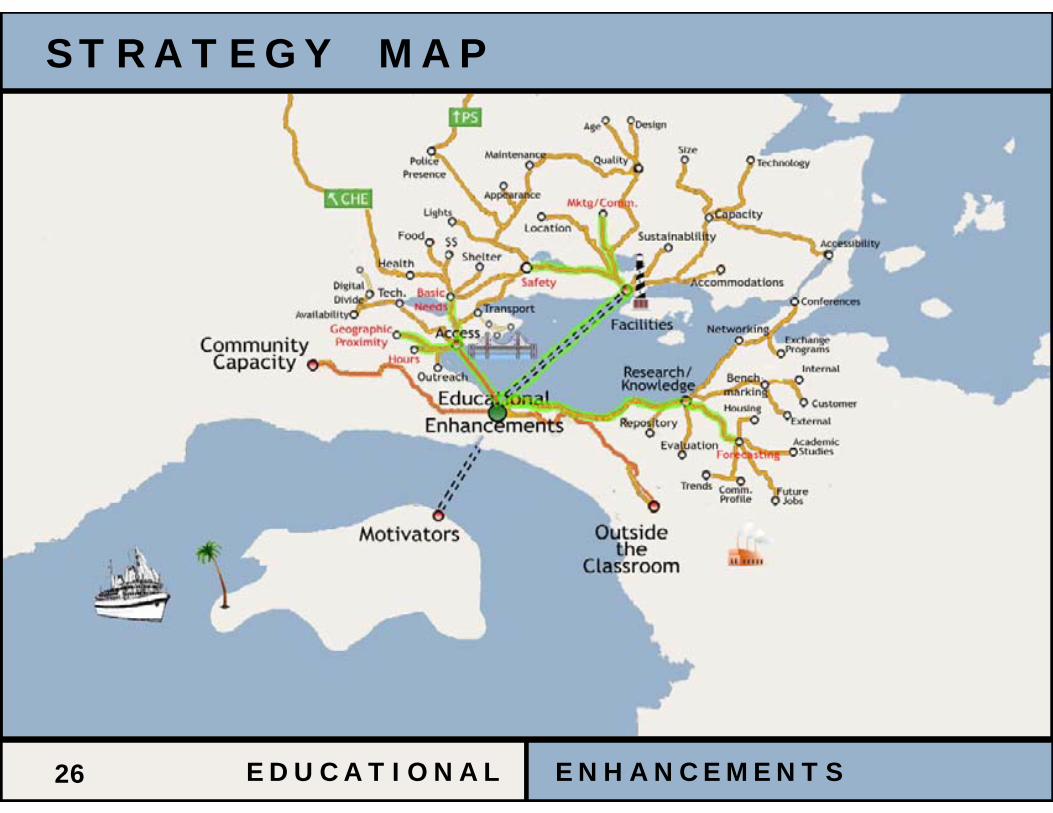
E D U C A T I O N A L E N H A N C E M E N T S26
S T R A T E G Y M A P
E D U C A T I O N A L E N H A N C E M E N T S27
S T R A T E G Y M A P Motivators
“The purpose of learning is growth, and our minds, unlike our bodies, can continue growing as we continue to live.”
-Mortimer J. Adler, 1902-2001[Aristotelian philosopher & author]
E D U C A T I O N A L E N H A N C E M E N T S28
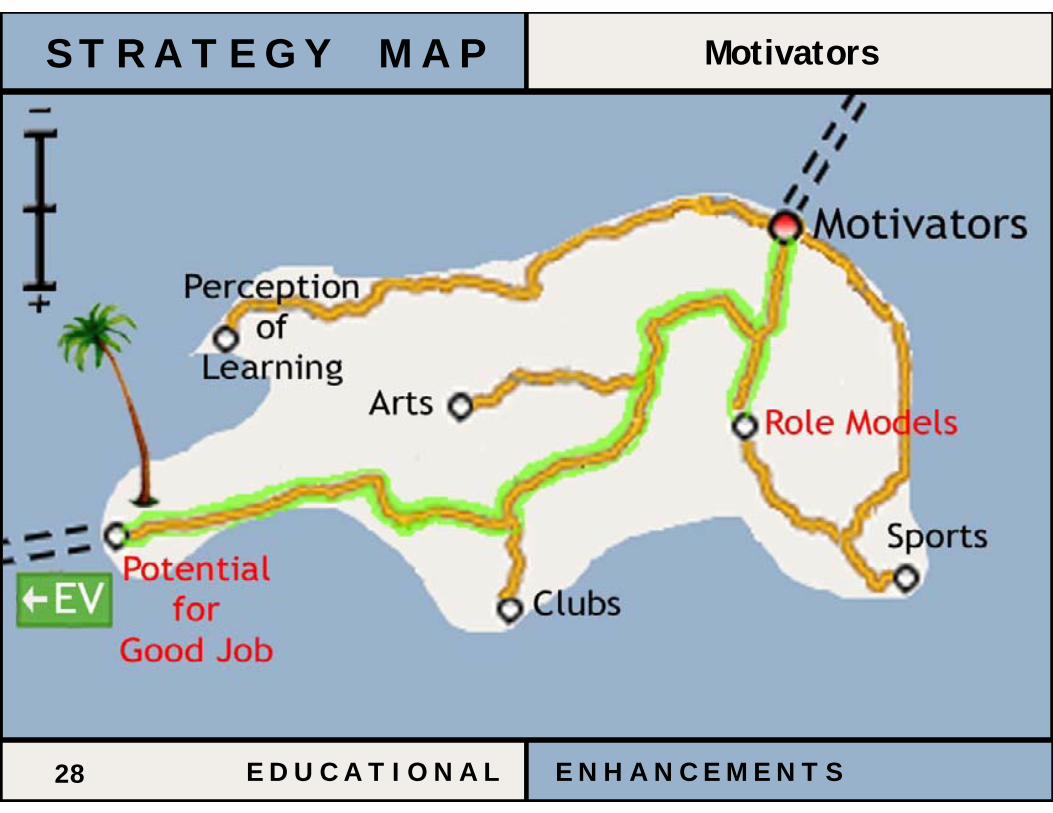
S T R A T E G Y M A P Motivators
E D U C A T I O N A L E N H A N C E M E N T S29
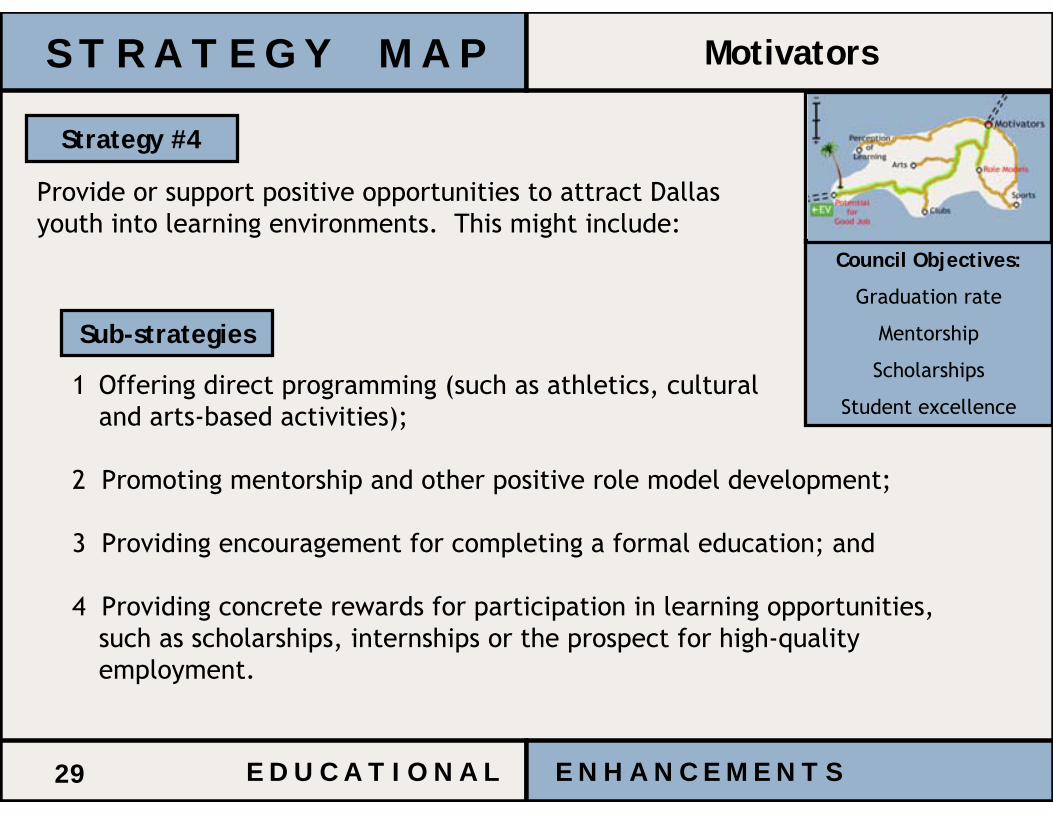
Provide or support positive opportunities to attract Dallas youth into learning environments. This might include:
Strategy #4
1 Offering direct programming (such as athletics, cultural and arts-based activities);
2 Promoting mentorship and other positive role model development;
3 Providing encouragement for completing a formal education; and
4 Providing concrete rewards for participation in learning opportunities, such as scholarships, internships or the prospect for high-quality employment.
Sub-strategies
S T R A T E G Y M A P Motivators
Council Objectives:
Graduation rate
Mentorship
Scholarships
Student excellence
E D U C A T I O N A L E N H A N C E M E N T S30
S T R A T E G Y M A P Motivators
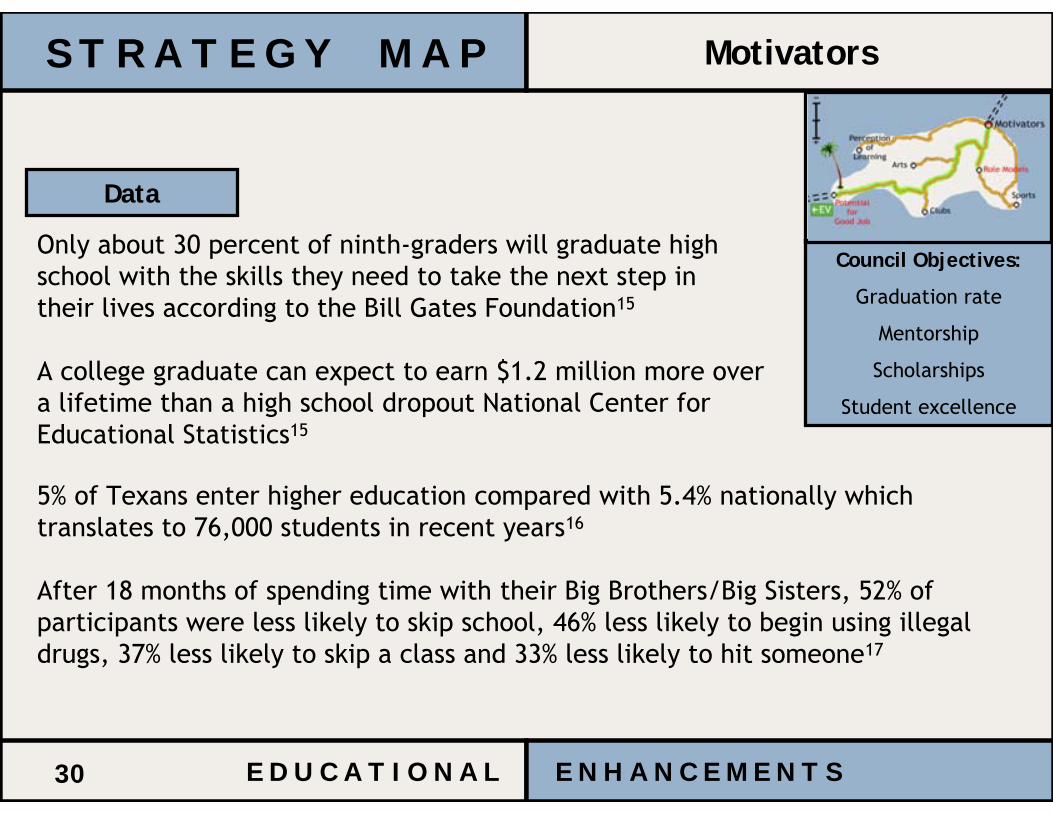
Only about 30 percent of ninth-graders will graduate highschool with the skills they need to take the next step intheir lives according to the Bill Gates Foundation15
A college graduate can expect to earn $1.2 million more overa lifetime than a high school dropout National Center for Educational Statistics15
Council Objectives:
Graduation rate
Mentorship
Scholarships
Student excellence
5% of Texans enter higher education compared with 5.4% nationally which translates to 76,000 students in recent years16
After 18 months of spending time with their Big Brothers/Big Sisters, 52% of participants were less likely to skip school, 46% less likely to begin using illegal drugs, 37% less likely to skip a class and 33% less likely to hit someone17
Data
E D U C A T I O N A L E N H A N C E M E N T S31
S T R A T E G Y M A P
E D U C A T I O N A L E N H A N C E M E N T S32
S T R A T E G Y M A P Community Capacity

E D U C A T I O N A L E N H A N C E M E N T S33
S T R A T E G Y M A P Community Capacity
E D U C A T I O N A L E N H A N C E M E N T S34
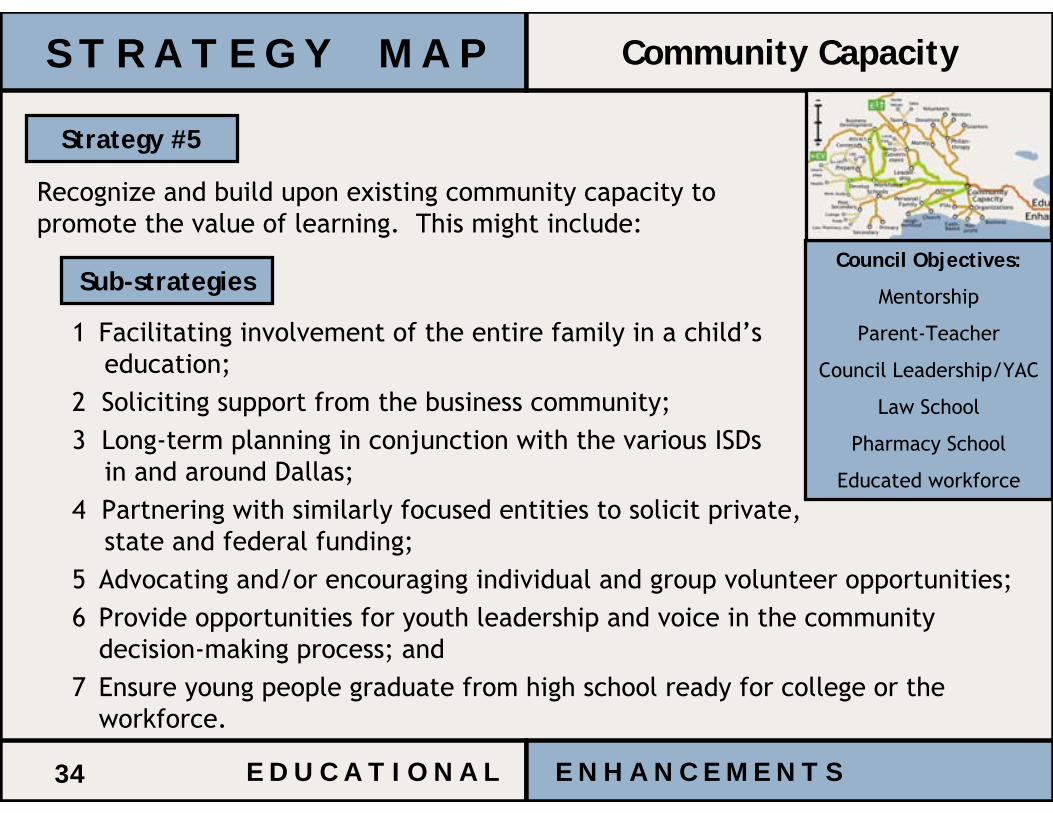
Recognize and build upon existing community capacity to promote the value of learning. This might include:
Strategy #5
1 Facilitating involvement of the entire family in a child’seducation;
2 Soliciting support from the business community;3 Long-term planning in conjunction with the various ISDs
in and around Dallas; 4 Partnering with similarly focused entities to solicit private,
state and federal funding;5 Advocating and/or encouraging individual and group volunteer opportunities;6 Provide opportunities for youth leadership and voice in the community
decision-making process; and7 Ensure young people graduate from high school ready for college or the
workforce.
Sub-strategies
S T R A T E G Y M A P Community Capacity
Council Objectives:
Mentorship
Parent-Teacher
Council Leadership/YAC
Law School
Pharmacy School
Educated workforce
E D U C A T I O N A L E N H A N C E M E N T S35
S T R A T E G Y M A P Community Capacity
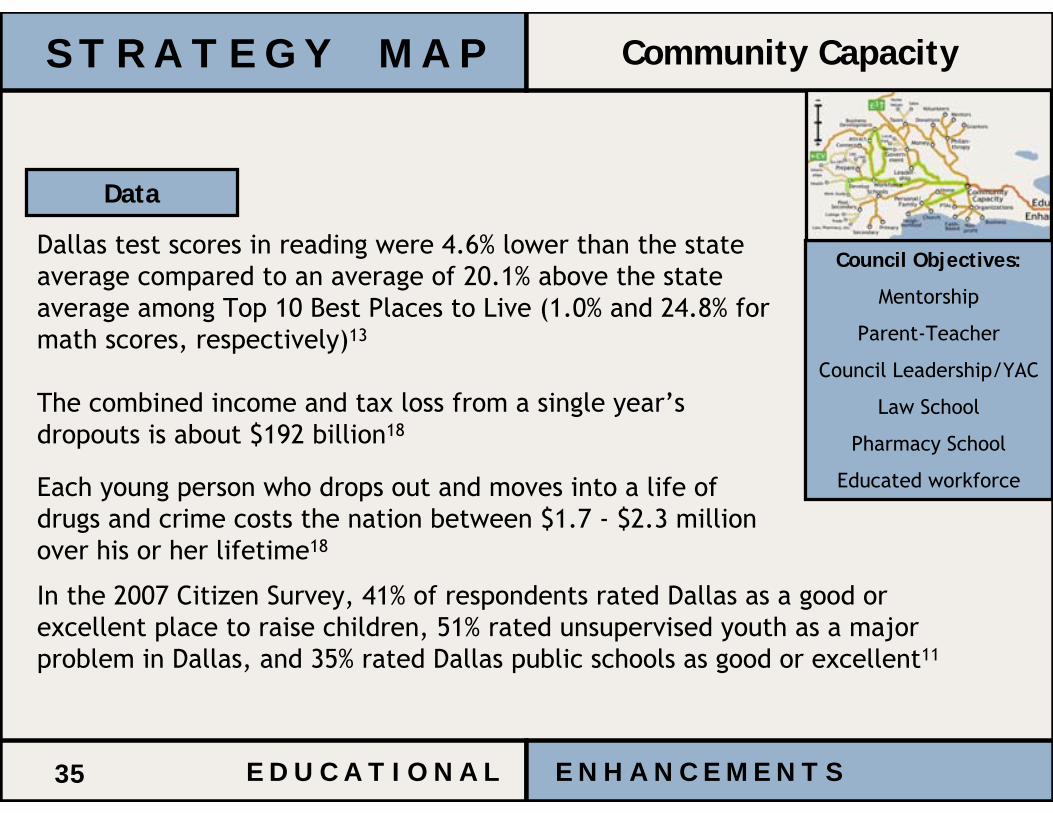
Dallas test scores in reading were 4.6% lower than the state average compared to an average of 20.1% above the state average among Top 10 Best Places to Live (1.0% and 24.8% for math scores, respectively)13
The combined income and tax loss from a single year’s dropouts is about $192 billion18
Each young person who drops out and moves into a life of drugs and crime costs the nation between $1.7 - $2.3 million over his or her lifetime18
Council Objectives:
Mentorship
Parent-Teacher
Council Leadership/YAC
Law School
Pharmacy School
Educated workforce
Data
In the 2007 Citizen Survey, 41% of respondents rated Dallas as a good or excellent place to raise children, 51% rated unsupervised youth as a major problem in Dallas, and 35% rated Dallas public schools as good or excellent11
E D U C A T I O N A L E N H A N C E M E N T S36
S T R A T E G Y M A P
E D U C A T I O N A L E N H A N C E M E N T S37
S T R A T E G Y M A P Outside the Classroom

E D U C A T I O N A L E N H A N C E M E N T S38
S T R A T E G Y M A P Outside the Classroom
E D U C A T I O N A L E N H A N C E M E N T S39
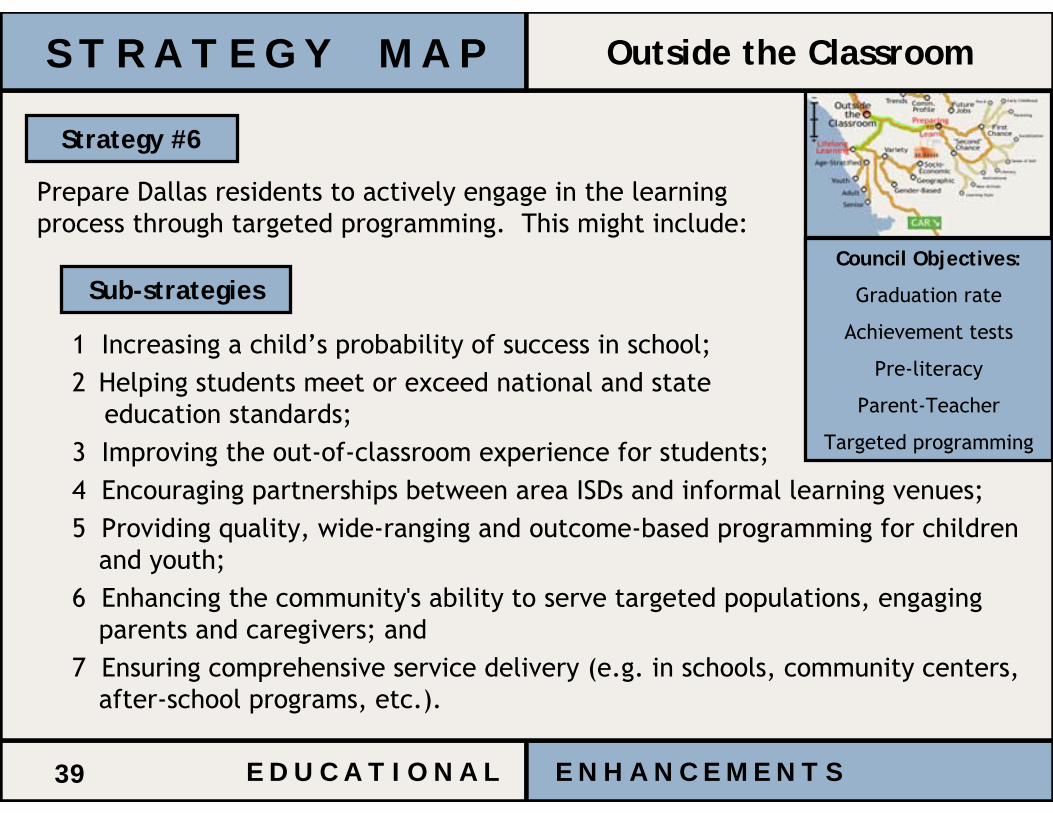
Prepare Dallas residents to actively engage in the learning process through targeted programming. This might include:
Strategy #6
1 Increasing a child’s probability of success in school;2 Helping students meet or exceed national and state
education standards;3 Improving the out-of-classroom experience for students;4 Encouraging partnerships between area ISDs and informal learning venues;5 Providing quality, wide-ranging and outcome-based programming for children
and youth;6 Enhancing the community's ability to serve targeted populations, engaging
parents and caregivers; and7 Ensuring comprehensive service delivery (e.g. in schools, community centers,
after-school programs, etc.).
Sub-strategies
S T R A T E G Y M A P Outside the Classroom
Objectives Addressed:Council Objectives:
Graduation rate
Achievement tests
Pre-literacy
Parent-Teacher
Targeted programming

E D U C A T I O N A L E N H A N C E M E N T S40
S T R A T E G Y M A P Outside the Classroom
According to UNESCO’s Institute for Education, 92% of all learning occurs outside the classroom19
Knowledge of alphabet letters at entry into kindergarten is a strong predictor of reading ability in 10th grade4
Roughly 35% of children in the U.S. enter school without the skills necessary for learning to read20
Council Objectives:
Graduation rate
Achievement tests
Pre-literacy
Parent-Teacher
Targeted programming
Data
Estimates indicate that for every $1 spent on early education up to $7 in other social service costs are saved over a lifetime21
E D U C A T I O N A L E N H A N C E M E N T S41
S T R A T E G Y M A P
E D U C A T I O N A L E N H A N C E M E N T S42
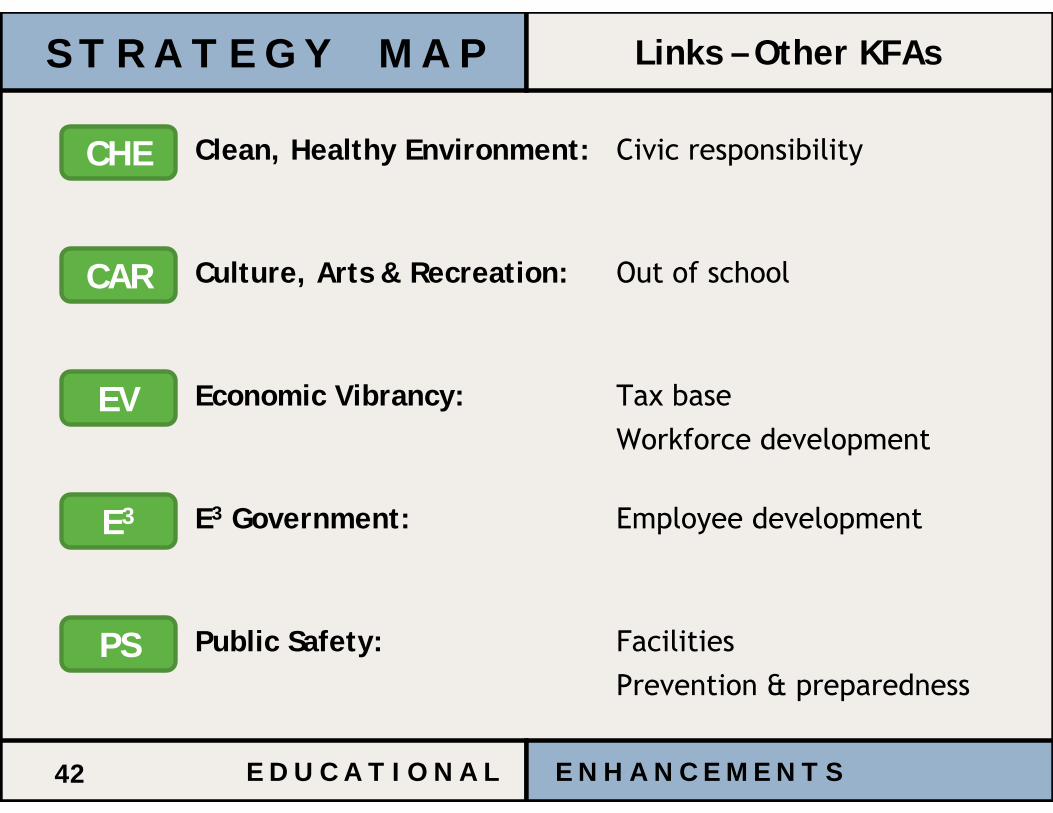
Links – Other KFAs
Clean, Healthy Environment: Civic responsibility
Culture, Arts & Recreation: Out of school
Public Safety: FacilitiesPrevention & preparedness
E3 Government: Employee development
Economic Vibrancy: Tax baseWorkforce development
CHE
CAR
EV
E3
PS
S T R A T E G Y M A P

E D U C A T I O N A L E N H A N C E M E N T S43
S T R A T E G Y M A P

E D U C A T I O N A L E N H A N C E M E N T S44
E N V I S I O N E D F U T U R E
Recognizing that education is the foundation
for achieving prosperity, health and well-
being, the City of Dallas supports lifelong
learning opportunities through partnerships
with agencies throughout the Dallas
community and beyond...

E D U C A T I O N A L E N H A N C E M E N T S45
S O U R C E S
1. Graduation rate / Achievement tests (p. 5), Prevent Truancy (p. 8): Academic Excellence Indicator System, 2006-07, 2004-052. Mentorship (p. 6): Thierny, et. al. (1995), Big Brothers/Big Sisters3. Promote bilingualism (p. 6), Educated workforce (p. 9): 2006 American Community Survey, U.S. Census Bureau4. Odds of Success (p.7): Duncan, et. al. School Readiness and Later Achievement. Developmental Psychology. (2007)5. Targeted Programming (p.7): Schott Foundation for Public Education. Public education and Black Male Students: the 2006
state report card.6. Provide Scholarships (p. 8): “Dallas mayor to donate most of salary to scholarship fund,” Dallas Morning News. Nov 29, 2007.7. Youth Advisory Commission (p. 8): March 28, 2007 Park and Recreation Briefing: Youth Commission and Entrepreneur
Programs Update8. Law School (p. 9): Texas Higher Education Coordinating Board Study, 2005 9. Pharmacy School (p. 9): US Department of Veteran’s Affairs, Facility Locator and Directory, website:
http://www1.va.gov/directory/guide/facility.asp?id=3510. Research/Knowledge - Research Institution (p. 15): Closing the Gaps: The Texas Higher Education Plan, 200311. Access – survey responses (p. 20); Community Capacity – survey responses (p. 35): 2007 Dallas Citizen Survey12. Access – informal learning (p. 20): National Research and Development Center for Adult Literacy and Numeracy13. Facilities - College Comparisons (p. 25); Community Capacity – Test Scores (p. 30): Top 10 Best Places to Live.
CNNMoney.com, 2007.14. Facilities Student absences (p.25): National Centers for Disease Control and Prevention, National Center for Chronic Disease
Prevention and Health Promotion, Healthy Youth!, 2005.15. Motivators – 9th graders; earning loss over lifetime (p. 30); Outside the Classroom – reading ability (p.40): The Challenge, Bill
and Melinda Gates Foundation, 200716. Motivators – 5% enrollment rate (p.30): Closing the Gaps: The Texas higher Education Plan, 200317. Motivators – Big Brother/big Sister data (p. 30): Tierney, J.P., Grossman, J.B., and Resch, N.L. (1995) Making a Difference:
An Impact Study of Big Brothers Big Sisters. Philadelphia: Public/Private Ventures18. Community Capacity – Income and Tax loss; Drop-out rate and crime (p. 35): Committee for Economic Development. A New
Framework for Assessing the Benefits of Early Education: A working paper. 2004.19. Outside the Classroom – lifelong learning (p. 40): United Nations Educational, Scientific and Cultural Organization’s
(UNESCO) Institute for Education, 2001.20. Outside the Classroom – early spending (p. 40): Center for Urban Development

Public Safety TeamPublic Safety TeamCouncil Planning SessionCouncil Planning SessionJanuary 16, 2008January 16, 2008
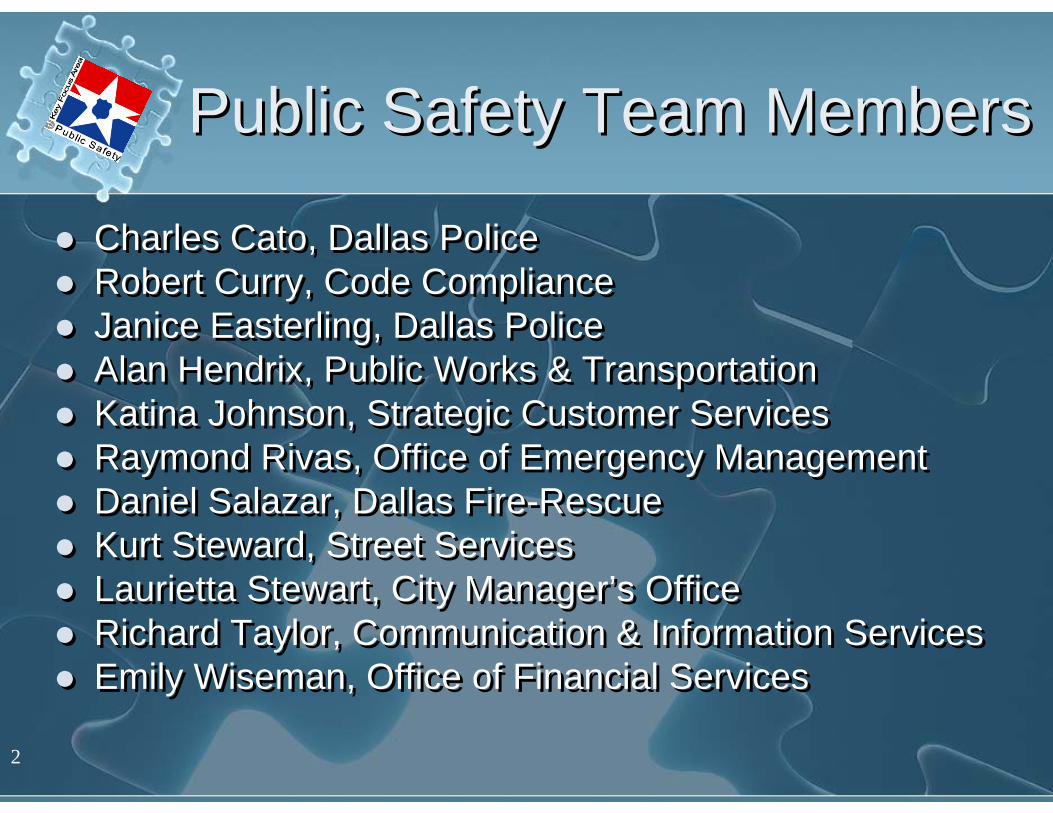
Charles Cato, Dallas PoliceRobert Curry, Code ComplianceJanice Easterling, Dallas PoliceAlan Hendrix, Public Works & TransportationKatina Johnson, Strategic Customer ServicesRaymond Rivas, Office of Emergency ManagementDaniel Salazar, Dallas Fire-RescueKurt Steward, Street Services Laurietta Stewart, City Manager’s OfficeRichard Taylor, Communication & Information ServicesEmily Wiseman, Office of Financial Services
Charles Cato, Dallas PoliceRobert Curry, Code ComplianceJanice Easterling, Dallas PoliceAlan Hendrix, Public Works & TransportationKatina Johnson, Strategic Customer ServicesRaymond Rivas, Office of Emergency ManagementDaniel Salazar, Dallas Fire-RescueKurt Steward, Street Services Laurietta Stewart, City Manager’s OfficeRichard Taylor, Communication & Information ServicesEmily Wiseman, Office of Financial Services
Public Safety Team MembersPublic Safety Team Members
2

KFA RoadmapKFA Roadmap
3

Envisioned FutureEnvisioned Future
4
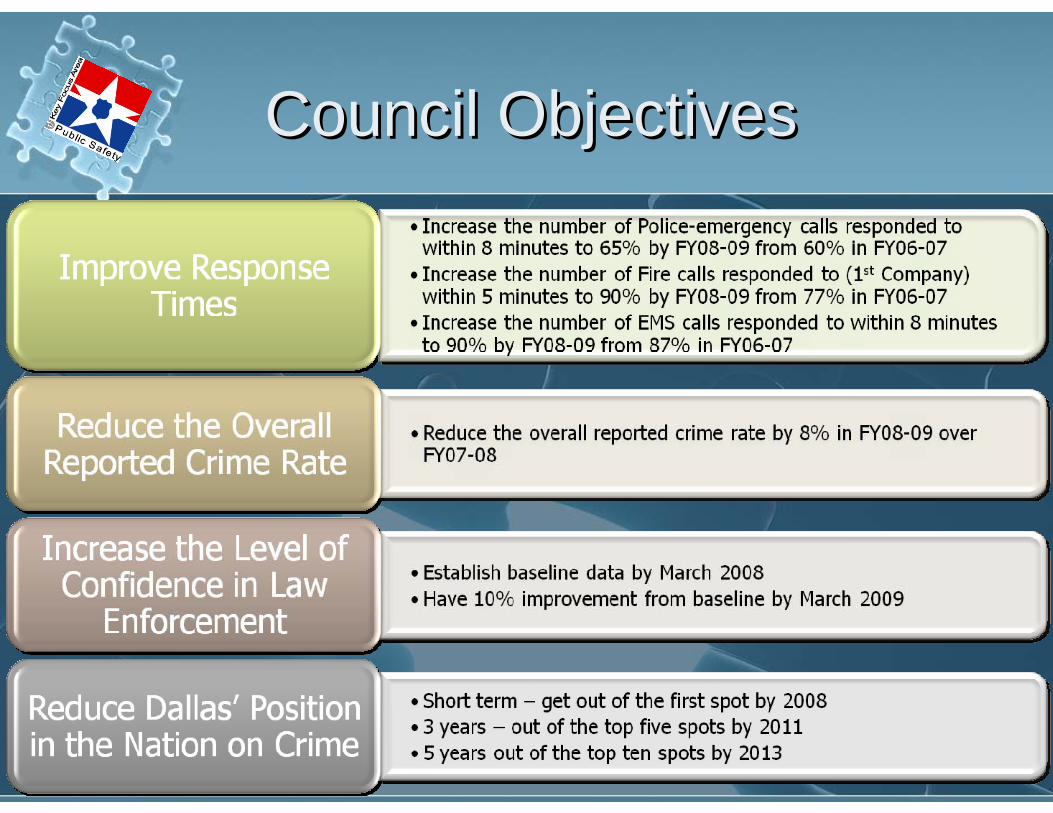
Council ObjectivesCouncil Objectives
5
6
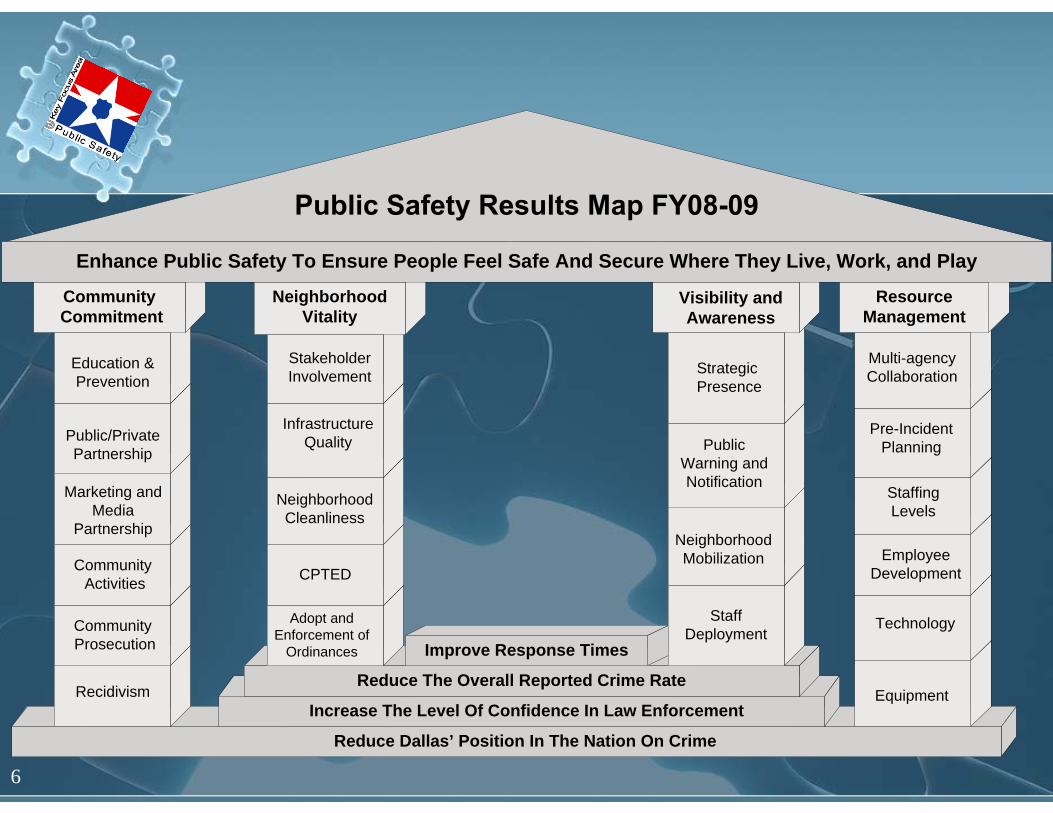
Reduce Dallas’ Position In The Nation On Crime
Reduce The Overall Reported Crime Rate
Improve Response Times
Increase The Level Of Confidence In Law EnforcementEquipment
ResourceManagement
Multi-agencyCollaboration
Pre-IncidentPlanning
Staffing Levels
Employee Development
Technology
Visibility and Awareness
Strategic Presence
Public Warning and Notification
NeighborhoodMobilization
Staff Deployment
Adopt and Enforcement of
Ordinances
Education &Prevention
Public/PrivatePartnership
Marketing and Media
Partnership
Community Activities
Community Prosecution
Recidivism
Community Commitment
CPTED
NeighborhoodCleanliness
InfrastructureQuality
NeighborhoodVitality
StakeholderInvolvement
Enhance Public Safety To Ensure People Feel Safe And Secure Where They Live, Work, and Play

Community CommitmentCommunity Commitment
7
SUB-STRATEGIES1 Expand education and prevention program availability 2 Promote public/private partnerships and community activities
3 Promote marketing and media relations to better educate the community on public safety programs
4 Provide fair and effective community prosecution 5 Reduce recidivism through education or re-entry programs
COUNCIL OBJECTIVESCOUNCIL OBJECTIVESReduce the Overall Reported Crime Rate
Increase Level of Confidence in Law Enforcement
Education &Prevention
Public/PrivatePartnership
Marketing and Media
Partnership
Community Activities
Community Prosecution
Recidivism
Community Commitment

Community CommitmentCommunity Commitment
8
Smoke Detector Installations
FY06-07: 5,442 (3,346 installed detectors were purchased with CDC grant funds)
Fire Prevention Education FY06-07: 5,750 Fire Education Programs
Students Impacted Law Enforcement Teaching Students (LETS) educated 21,462 students during the 06/07 school year.
50,088 Students attended fire prevention and education programs during the 2005 through 2007 school year.
Supporting StatisticsSupporting Statistics

Neighborhood VitalityNeighborhood Vitality
9
SUB-STRATEGIES1 Engage stakeholders to cultivate community involvement2 Enhance infrastructure quality to facilitate quicker response times
3 Foster cleanliness by partnering with neighborhood groups 4 Encourage Crime Prevention Through Environmental Design (CPTED)
5 Promote the adoption and enforcement of ordinances
COUNCIL OBJECTIVESCOUNCIL OBJECTIVESImprove Response Times
Reduce the Overall Reported Crime Rate
Adopt and Enforcement of
Ordinances
CPTED
NeighborhoodCleanliness
InfrastructureQuality
NeighborhoodVitality
StakeholderInvolvement
Neighborhood VitalityNeighborhood Vitality
10
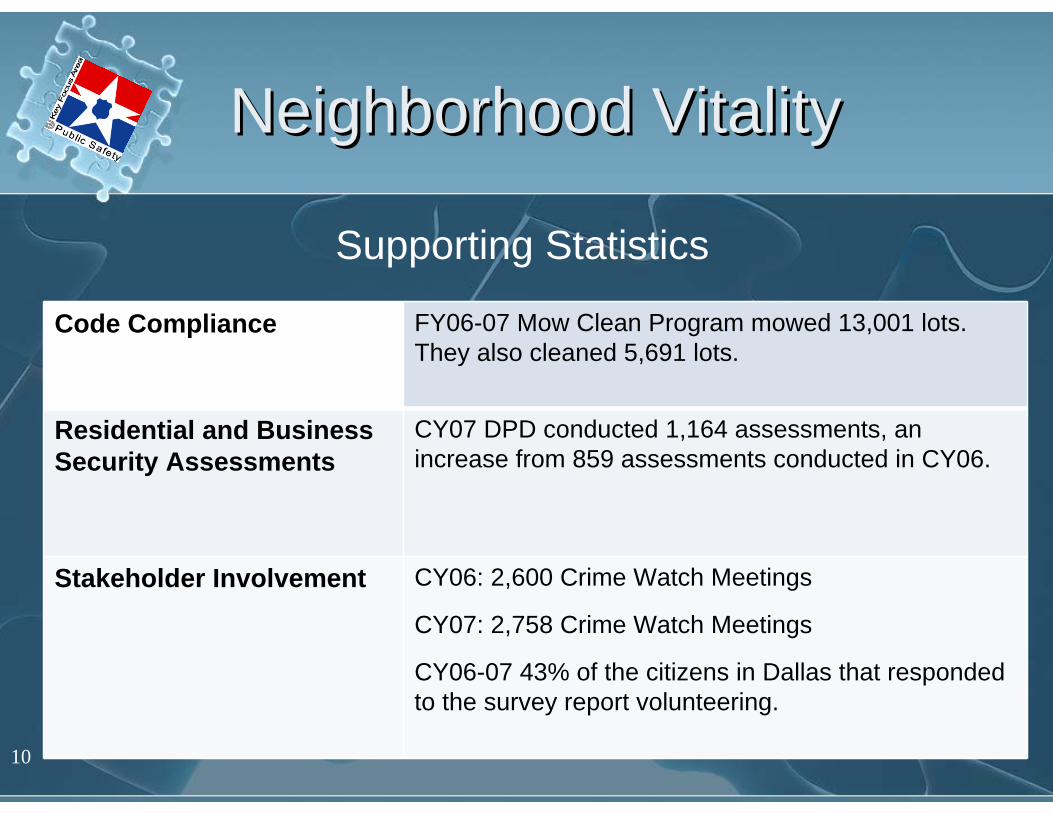
Code Compliance FY06-07 Mow Clean Program mowed 13,001 lots. They also cleaned 5,691 lots.
Residential and Business Security Assessments
CY07 DPD conducted 1,164 assessments, an increase from 859 assessments conducted in CY06.
Stakeholder Involvement CY06: 2,600 Crime Watch Meetings
CY07: 2,758 Crime Watch Meetings
CY06-07 43% of the citizens in Dallas that responded to the survey report volunteering.
Supporting Statistics
Visibility and AwarenessVisibility and Awareness
11
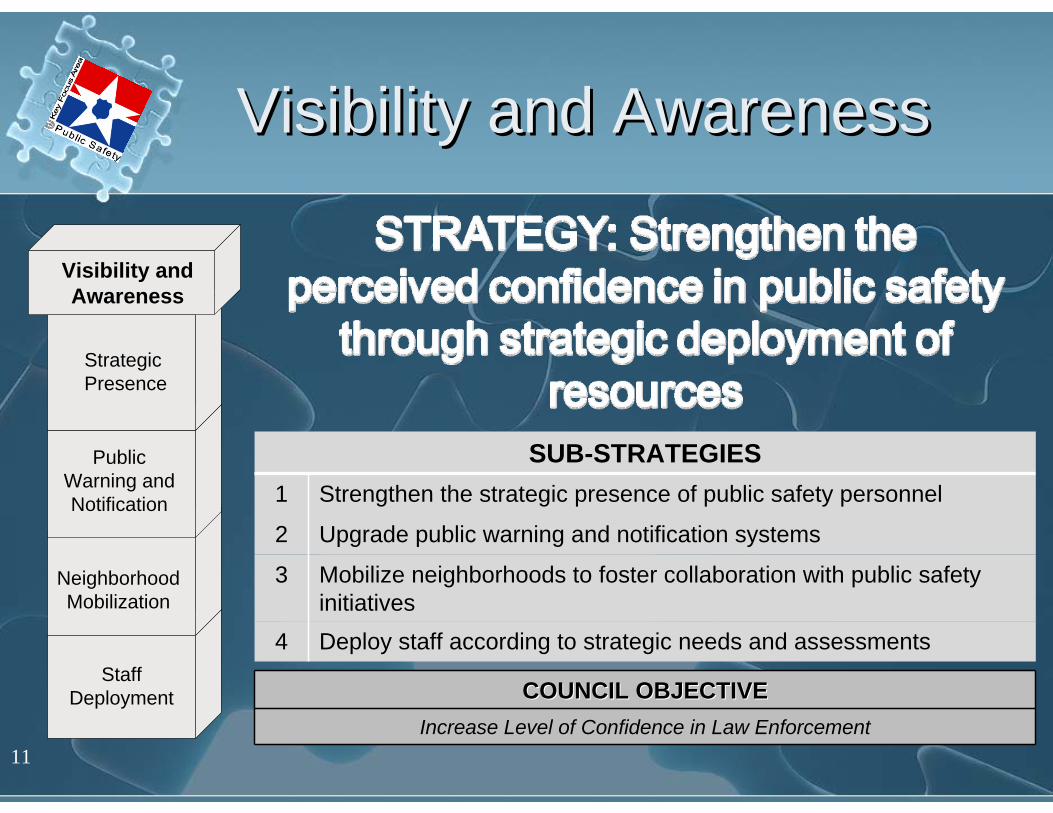
SUB-STRATEGIES1 Strengthen the strategic presence of public safety personnel
2 Upgrade public warning and notification systems
3 Mobilize neighborhoods to foster collaboration with public safety initiatives
4 Deploy staff according to strategic needs and assessments
COUNCIL OBJECTIVECOUNCIL OBJECTIVEIncrease Level of Confidence in Law Enforcement
Visibility and Awareness
Strategic Presence
Public Warning and Notification
NeighborhoodMobilization
Staff Deployment

Visibility and AwarenessVisibility and Awareness
Supporting StatisticsSupporting StatisticsSupporting StatisticsOfficers per 1000 residents Current – 2.49 officers per 1000 residents
Goal – 3.00 officers per 1000 residents
Response Times Police Emergency: 60% – within 8 minutesFire (1st company): 57% – within 5 minutesEMS: 79% – within 8 minutes
Community Programs Volunteers in Patrol (VIP) - 108 Groups (2061 Volunteers) as of 2008
Community Emergency Response Teams (CERT)- 8 Teams (117 total)
Citizen Fire Academy (CFA)- 2 Classes per year (20 Students per Class)
Dallas Emergency Response Team (DERT)- 163 Members
12
Resource ManagementResource Management
13
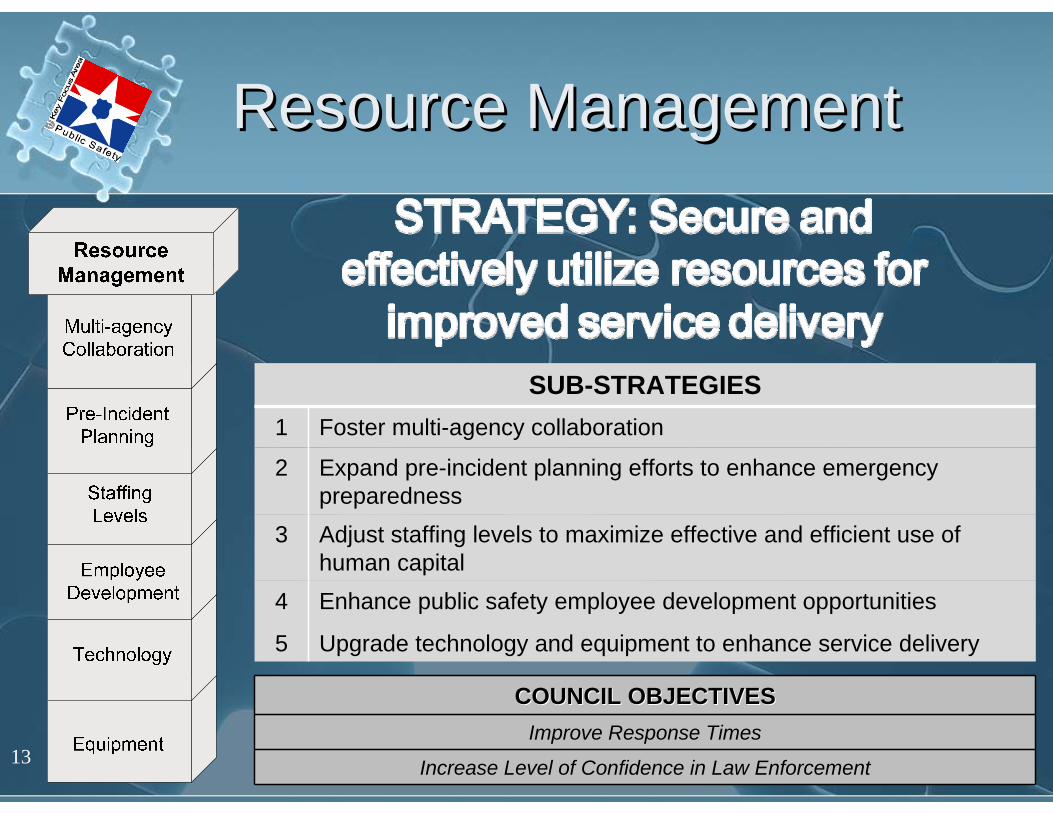
COUNCIL OBJECTIVESCOUNCIL OBJECTIVESImprove Response Times
Increase Level of Confidence in Law Enforcement
SUB-STRATEGIES1 Foster multi-agency collaboration
2 Expand pre-incident planning efforts to enhance emergency preparedness
3 Adjust staffing levels to maximize effective and efficient use of human capital
4
5
Enhance public safety employee development opportunities
Upgrade technology and equipment to enhance service delivery
Resource ManagementResource Management
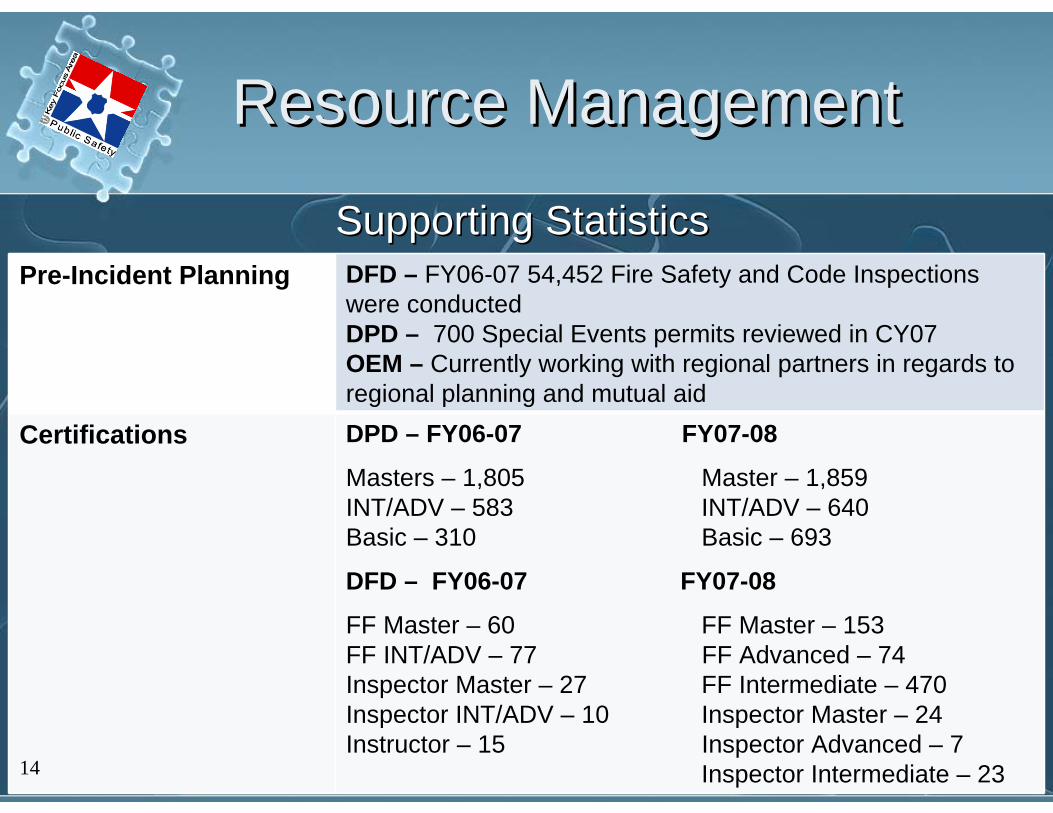
Pre-Incident Planning DFD – FY06-07 54,452 Fire Safety and Code Inspections were conductedDPD – 700 Special Events permits reviewed in CY07OEM – Currently working with regional partners in regards to regional planning and mutual aid
Certifications DPD – FY06-07 FY07-08
Masters – 1,805 Master – 1,859INT/ADV – 583 INT/ADV – 640Basic – 310 Basic – 693
DFD – FY06-07 FY07-08
FF Master – 60 FF Master – 153FF INT/ADV – 77 FF Advanced – 74Inspector Master – 27 FF Intermediate – 470Inspector INT/ADV – 10 Inspector Master – 24Instructor – 15 Inspector Advanced – 7
Inspector Intermediate – 23
Supporting StatisticsSupporting Statistics
14

15
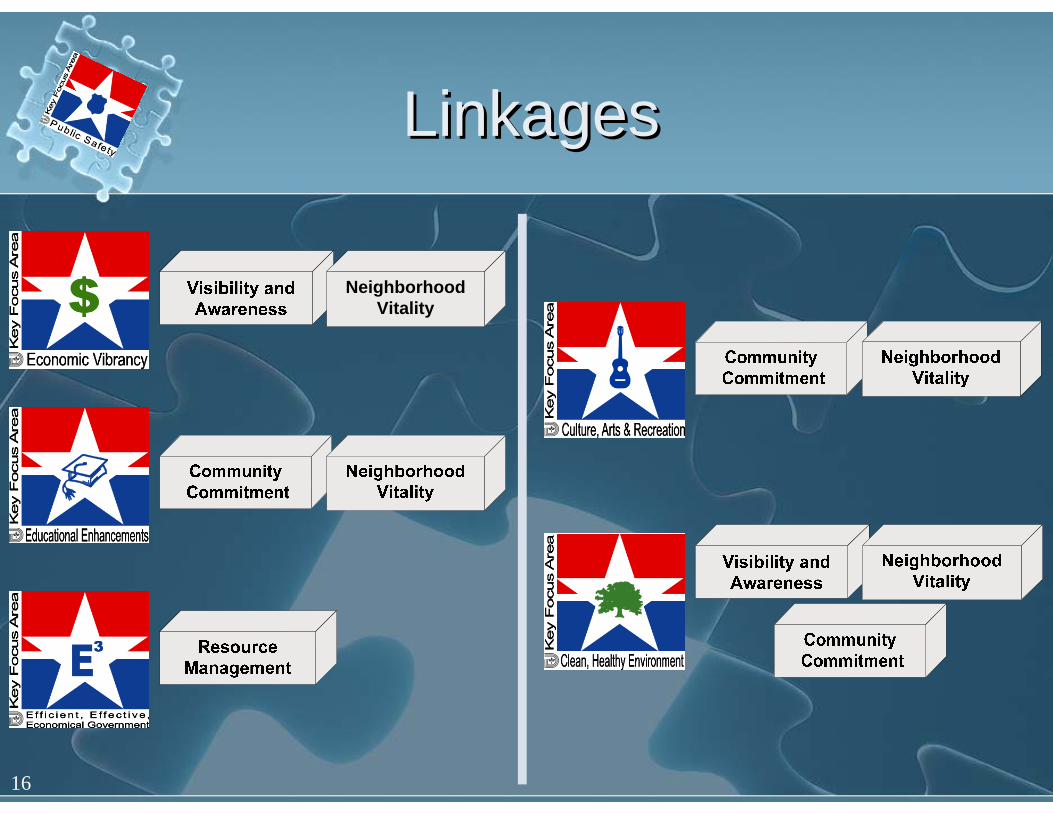
LinkagesLinkages
16
NeighborhoodVitality

SourcesSources1. National Research Center, Inc. The National Citizen Survey Report of Results for the City of
Dallas, Texas. (CO: NCS, 2006 and 2007).2. City of Dallas, Texas. Council Objectives. (October 2007).3. City of Dallas, Texas. Police & Fire Communications. Dispatch Times (December 2007).
Note that these time are based on when a citizen makes a call and when the police or fire units show up on scene. Currently Fire, Police and CIS are working on a methodology to fine tune the collection of these times.
1. National Research Center, Inc. The National Citizen Survey Report of Results for the City of Dallas, Texas. (CO: NCS, 2006 and 2007).
2. City of Dallas, Texas. Council Objectives. (October 2007).3. City of Dallas, Texas. Police & Fire Communications. Dispatch Times (December 2007).
Note that these time are based on when a citizen makes a call and when the police or fire units show up on scene. Currently Fire, Police and CIS are working on a methodology to fine tune the collection of these times.
17
1
EE33 GOVERNMENT GOVERNMENT KEY FOCUS AREA TEAMKEY FOCUS AREA TEAM
Council Planning SessionJanuary 16, 2008
2
EE33 Government Team MembersGovernment Team Members
• Mario Alvarado – Team Lead – Business Development and Procurement Services
• Kathleen Cervenka – City Manager’s Office • Candi Chamber – Fair Housing Office• Derrick Chance – Streets Services• Jackie Culton – Dallas Water Utilities• Jeff Glover – Equipment and Building Services• Floyd Harris – Court and Detention Services• Norman Herrera – Office of Financial Services• Raymond Lee – Human Resources• Mick McCord – Strategic Customer Services• Eboni Mitchell – Public Information Office• Janice Moss – Team Lead – City Attorney’s Office• Janice Peters – Sanitation Services• Juanita Tovar – City Manager’s Office

3
RoadmapRoadmap

4

5
Council ObjectivesCouncil ObjectivesOBJECTIVE CURRENT DATA
VALUE FOR TAX DOLLARS1
Increase the percent of residents stating they somewhat to strongly agree that they receive good value for their City tax dollars from 39% in 2007 to 75% by 2010.
In the 2007 Citizen Survey, 39% of citizens somewhat to strongly agree that they receive good value for their tax dollars.
DISPARITY OF LEVEL OF SERVICE2
Reduce the citizen’s perception of the disparity of the level of service among the Council Districts from 17 points in 2007 to 9 points in 2010.
In the 2007 Citizen Survey, data shows a 17 point disparity in level of service among council districts.
CITIZEN SATISFACTION1
Increase the percent of residents rating the overall quality of City services (and responsiveness) as good or excellent from 43% in 2006 to 75% by 2010.
In the 2007 Citizen Survey, 48% of citizens rate the quality of services provided by the City as Good to Excellent.
BUSINESS CUSTOMER SATISFACTION3
Increase the percent of business customers who rate the City good to excellent by 20% above the baseline by 2010.
The City does not currently track data for this objective. A contract is expected to be presented to Council in February for the National Research Center (Citizen Survey) to conduct a Business Climate Survey for the City to establish baseline data.
BOND RATING4
Maintain the City’s financial position of Aa1 in 2007 through 2010 (Aa1 Moody’s & AA+ Standard & Poor’s).
The Current GO bond for the City is Aa1 (Moody’s) and AA+ (Standard and Poor’s).
6
STREAMLINE PROCESSES
BENCHMARKING TRANSPARENCY
RESPONSIVENESSCOMPLIANCE
COLLABORATION
LEADERSHIPACCESSIBILITY
COMMUNITY OUTREACH
DIVERSITY
HIRING STRATEGIES
FINANCIAL RESOURCES
PERFORMANCE MEASUREMENT
MEDIA
SURVEYS & FEEDBACK
MARKETING & BRANDING
STRATEGIC PLANNING
SUCCESSION PLANNING
MANAGING RISK & LIABILITY
PHYSICAL INFRASTRUCTURE
MOTIVATION
PROFESSIONAL DEVELOPMENTTOTAL
COMPENSATION
CAPACITY TO DELIVER
SERVICES
FY 08FY 08--09 E09 E33 Government Government Strategy MapStrategy Map

7
AccountabilityAccountability
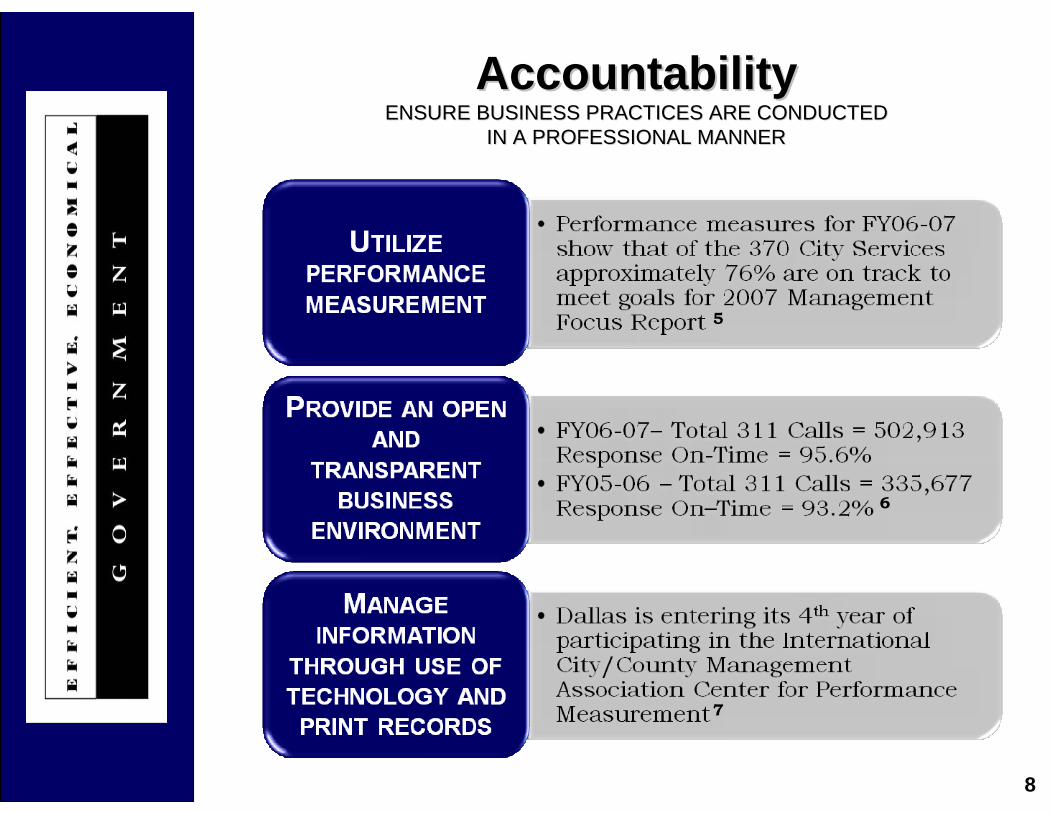
8
AccountabilityAccountabilityENSURE BUSINESS PRACTICES ARE CONDUCTED ENSURE BUSINESS PRACTICES ARE CONDUCTED
IN A PROFESSIONAL MANNERIN A PROFESSIONAL MANNER
5
6
7
9
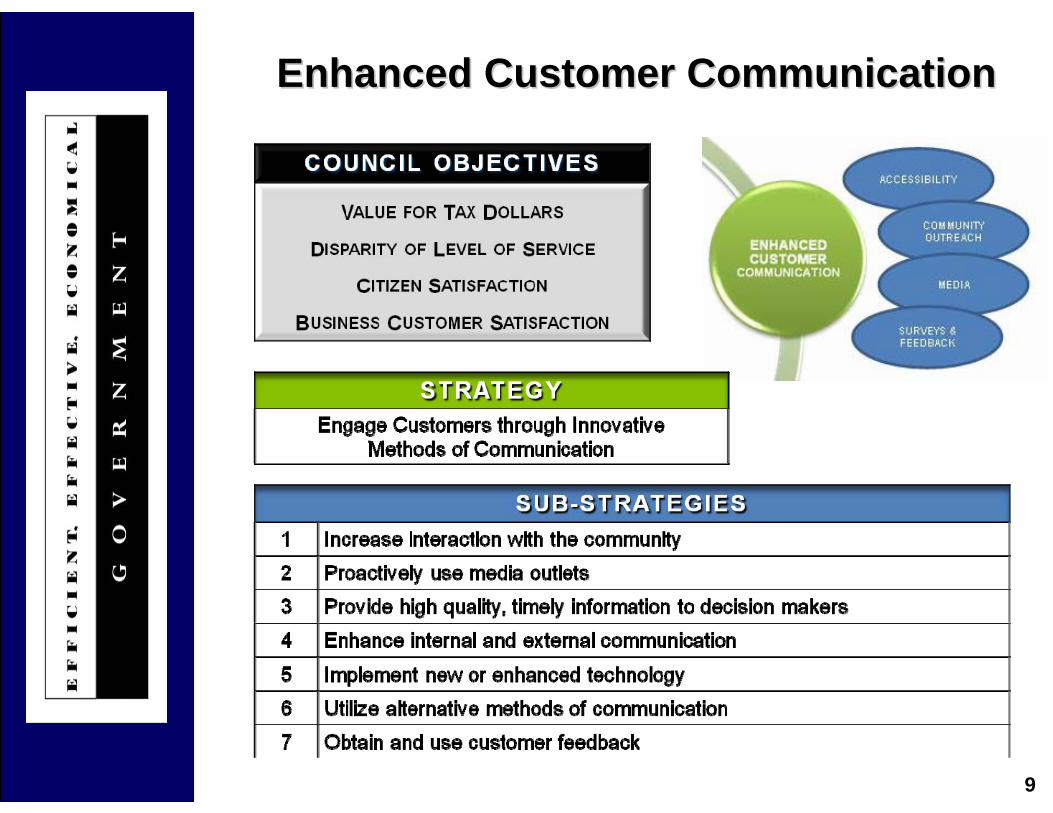
Enhanced Customer CommunicationEnhanced Customer Communication
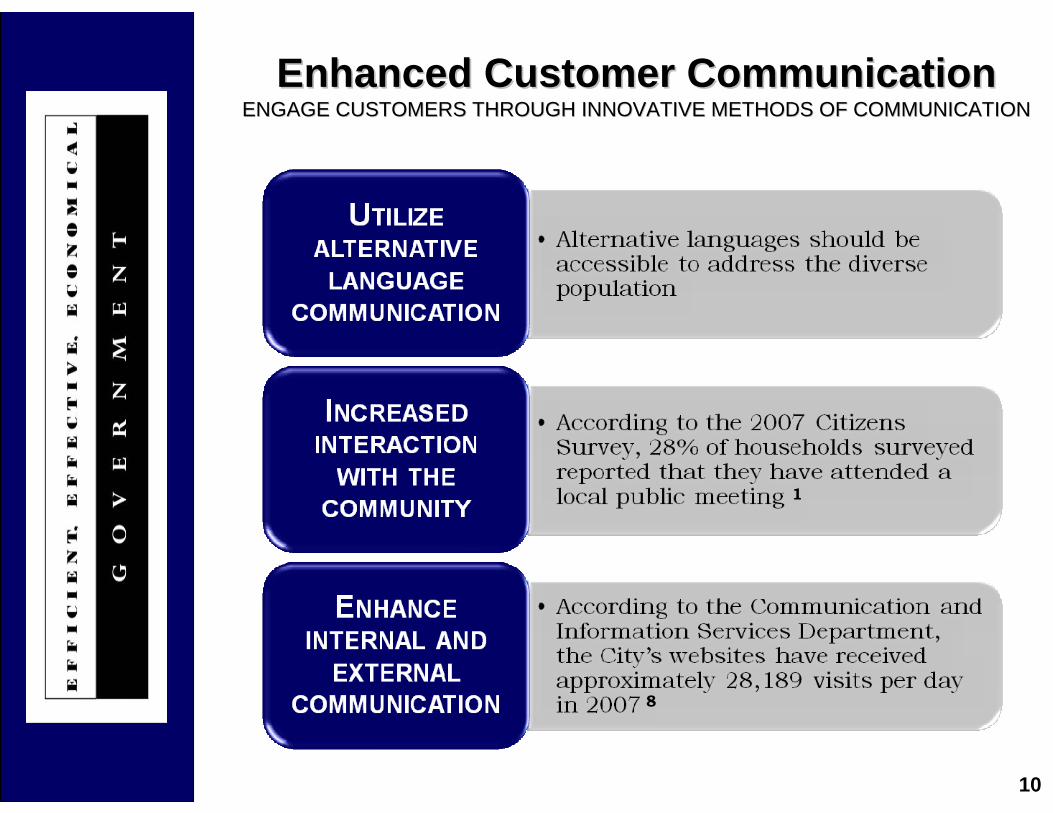
10
Enhanced Customer CommunicationEnhanced Customer CommunicationENGAGE CUSTOMERS THROUGH INNOVATIVE METHODS OF COMMUNICATIONENGAGE CUSTOMERS THROUGH INNOVATIVE METHODS OF COMMUNICATION
8
1

11
Continuous Workforce DevelopmentContinuous Workforce Development

12
Continuous Workforce DevelopmentContinuous Workforce DevelopmentPROVIDE A KNOWLEDGEABLE AND CUSTOMERPROVIDE A KNOWLEDGEABLE AND CUSTOMER--FOCUSED WORKFORCE FOCUSED WORKFORCE
THAT REFLECTS THE DIVERSITY OF THE CITYTHAT REFLECTS THE DIVERSITY OF THE CITY
10
9
13
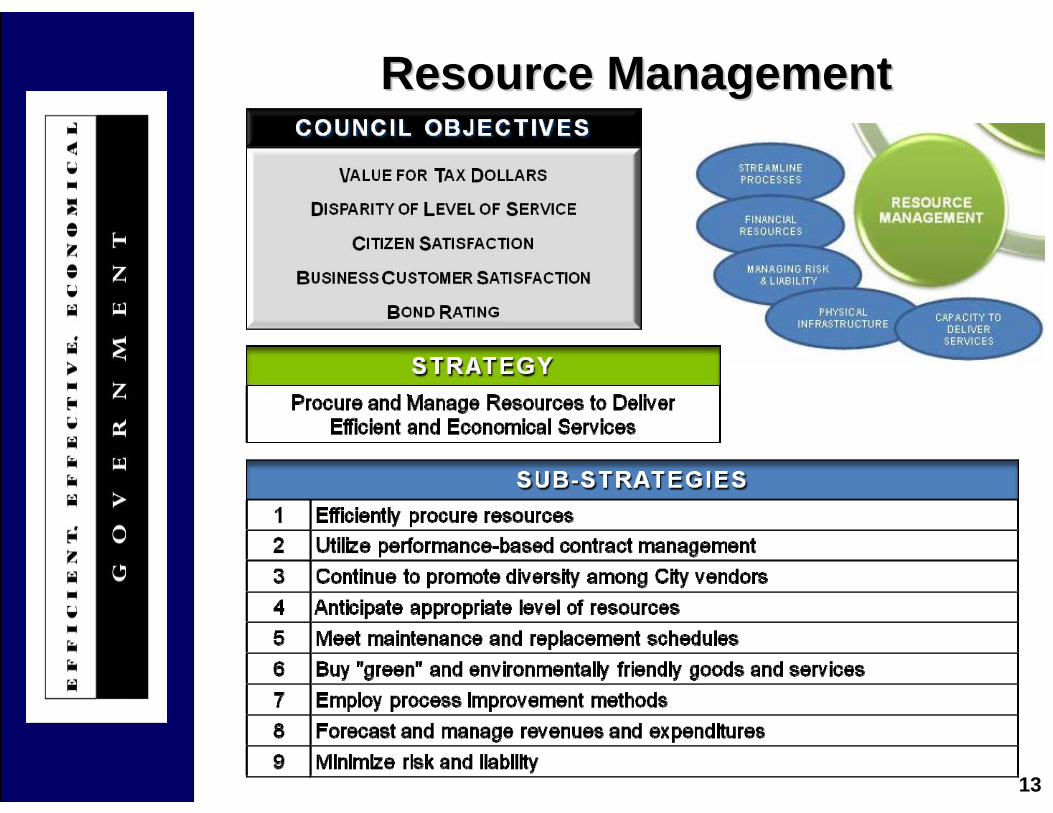
Resource ManagementResource Management
14
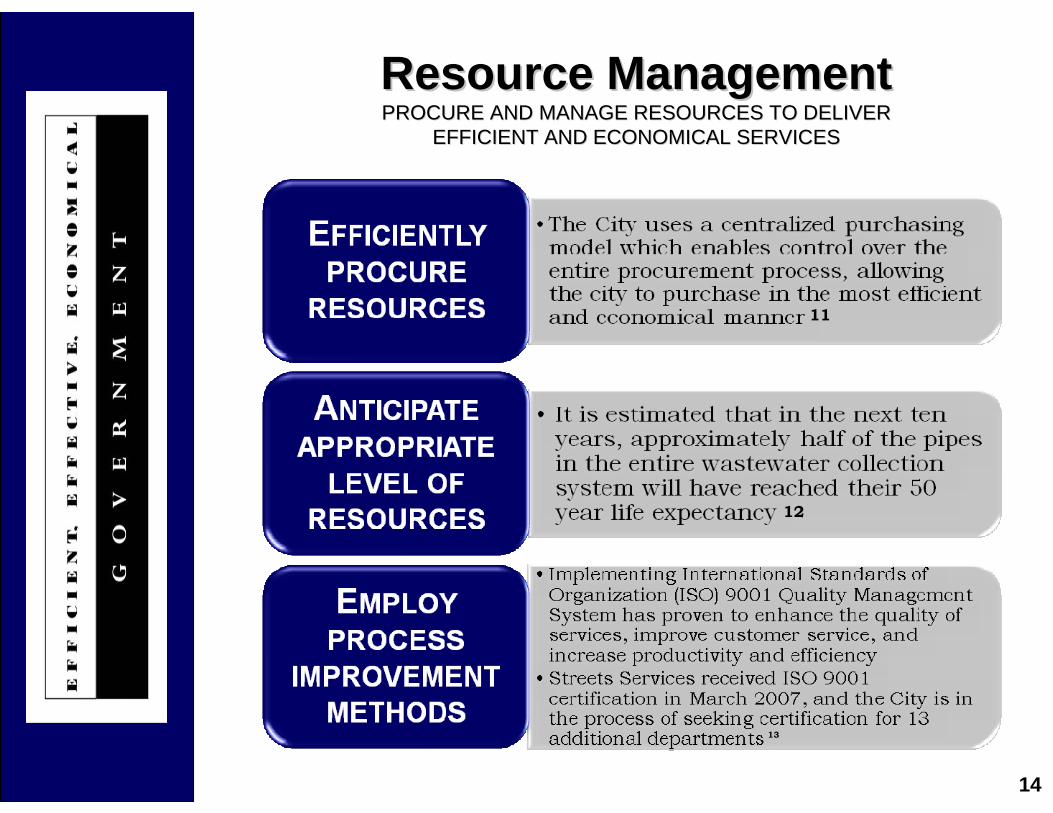
Resource ManagementResource ManagementPROCURE AND MANAGE RESOURCES TO DELIVER PROCURE AND MANAGE RESOURCES TO DELIVER
EFFICIENT AND ECONOMICAL SERVICESEFFICIENT AND ECONOMICAL SERVICES
11
12
13
15
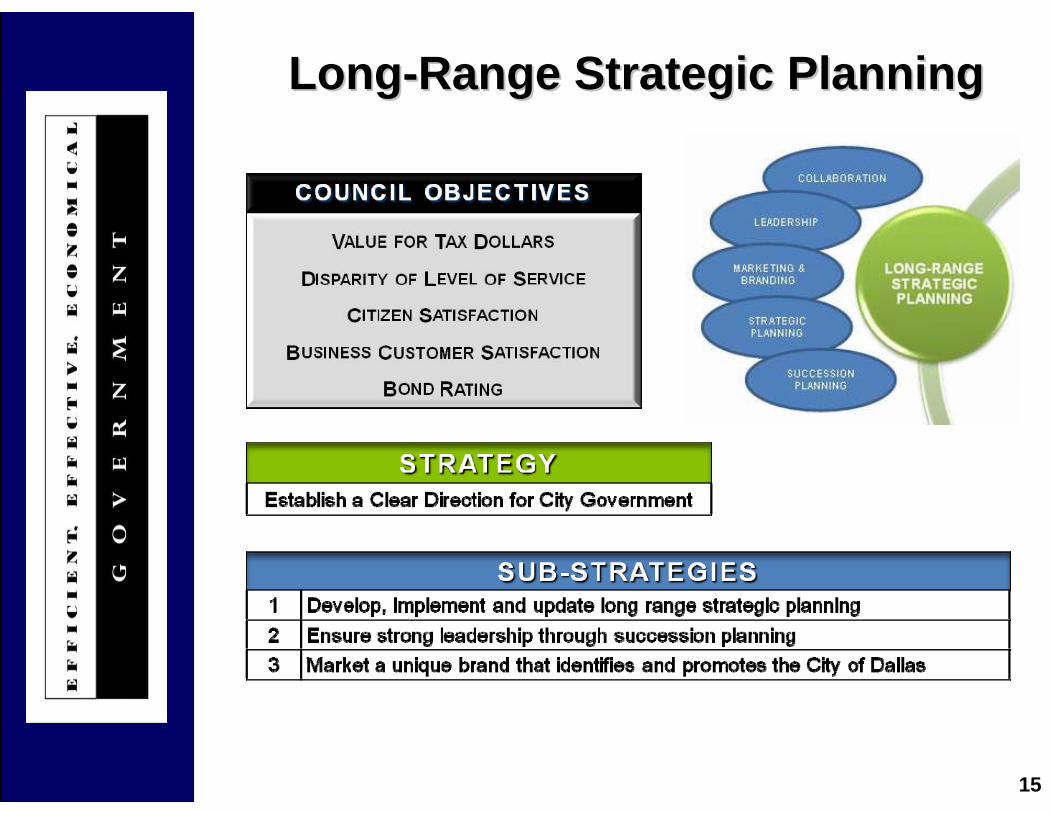
LongLong--Range Strategic PlanningRange Strategic Planning
16
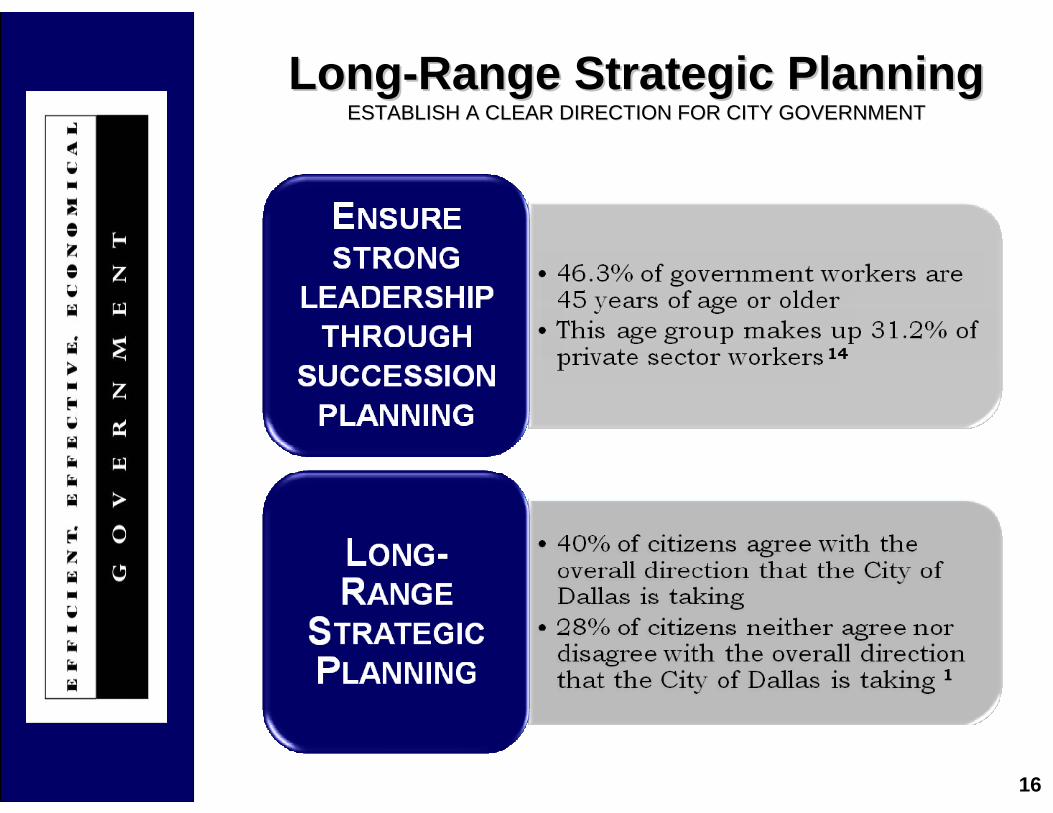
1
14
LongLong--Range Strategic PlanningRange Strategic PlanningESTABLISH A CLEAR DIRECTION FOR CITY GOVERNMENTESTABLISH A CLEAR DIRECTION FOR CITY GOVERNMENT

17
Links to Other Key Focus AreasLinks to Other Key Focus Areas
18
STREAMLINE PROCESSES
BENCHMARKING TRANSPARENCY
RESPONSIVENESSCOMPLIANCE
COLLABORATION
LEADERSHIPACCESSIBILITY
COMMUNITY OUTREACH
DIVERSITY
HIRING STRATEGIES
FINANCIAL RESOURCES
PERFORMANCE MEASUREMENT
MEDIA
SURVEYS & FEEDBACK
MARKETING & BRANDING
STRATEGIC PLANNING
SUCCESSION PLANNING
MANAGING RISK & LIABILITY
PHYSICAL INFRASTRUCTURE
MOTIVATION
PROFESSIONAL DEVELOPMENTTOTAL
COMPENSATION
CAPACITY TO DELIVER
SERVICES
FY 08FY 08--09 E09 E33 Government Government Strategy MapStrategy Map

19

20
APPENDIXAPPENDIX
21
SourcesSources1. National Research Center, Inc. The National Citizen Survey Report of Results for the City
of Dallas, Texas. (CO: NCS, 2006 and 2007).2. National Research Center, Inc. The National Citizen Survey Geographic Comparisons for
the City of Dallas, Texas. (CO: NCS, 2006 and 2007).3. The City does not currently track data for this objective. A contract is expected to be
presented to Council in February for the National Research Center (Citizen Survey) to conduct a Business Climate Survey for the City to address this objective.
4. General Obligation Refunding and Improvement Bonds, Official Financial Statement. (November 28, 2007).
5. City of Dallas, Texas. Management Focus Report. (August 2007).6. City of Dallas, Texas. 311 Customer Service. (December 2007).7. City of Dallas, Texas. Human Resources, Risk Management and Communication and
Information Services briefing to the Finance, Audit & Accountability Committee. ICMA Benchmarking Project FY 2006 Data Report. (November 26, 2007).
8. City of Dallas, Texas. Communication and Information Services. (December 2007).9. City of Dallas, Texas. Human Resource Department. (January 2008).10. City of Dallas, Texas. City Manager’s Office. (January 2008).11. “Chapter 3: Structure for Municipal Purchasing” In Municipal Purchasing: Organization,
Techniques & Strategies for Public Procurement, (CO: Colorado Municipal League, 1996).12. City of Dallas, Texas. Dallas Water Utilities. “Comprehensive Wastewater Collection
System Assessment/Collection System Master Plan.” Executive Summary, p. 4. (October 22, 2007).
13. City of Dallas, Texas. Transportation and Environment Committee. International Organization for Standardization: A City of Dallas ISO Management Systems Update. (October 22, 2007).
14. Craig W. Abbey, Donald J. Boyd. “The Aging Government Workforce.” (New York: Nelson A. Rockefeller Institute of Government, July 2002).
22
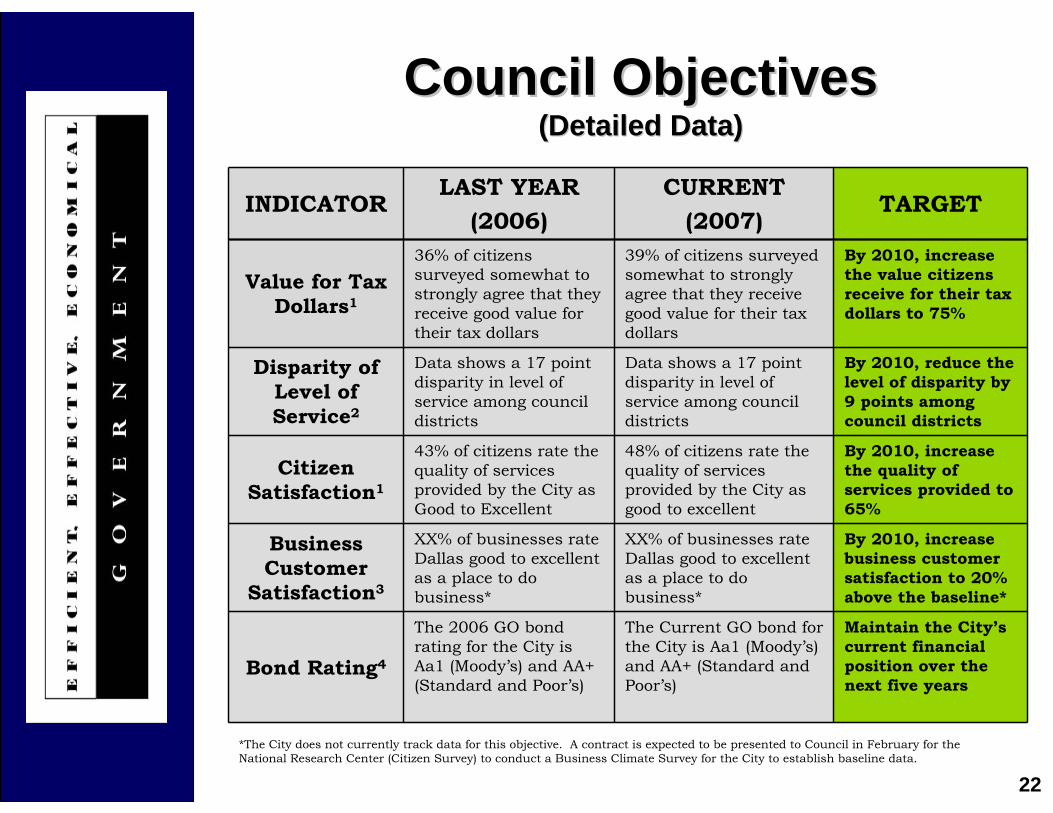
INDICATORLAST YEAR
(2006)CURRENT
(2007) TARGET
Value for Tax Dollars1
36% of citizens surveyed somewhat to strongly agree that they receive good value for their tax dollars
39% of citizens surveyed somewhat to strongly agree that they receive good value for their tax dollars
By 2010, increase the value citizens receive for their tax dollars to 75%
Disparity of Level of Service2
Data shows a 17 point disparity in level of service among council districts
Data shows a 17 point disparity in level of service among council districts
By 2010, reduce the level of disparity by 9 points among council districts
Citizen Satisfaction1
43% of citizens rate the quality of services provided by the City as Good to Excellent
48% of citizens rate the quality of services provided by the City as good to excellent
By 2010, increase the quality of services provided to 65%
Business Customer
Satisfaction3
XX% of businesses rate Dallas good to excellent as a place to do business*
XX% of businesses rate Dallas good to excellent as a place to do business*
By 2010, increase business customer satisfaction to 20% above the baseline*
Bond Rating4
The 2006 GO bond rating for the City is Aa1 (Moody’s) and AA+ (Standard and Poor’s)
The Current GO bond for the City is Aa1 (Moody’s) and AA+ (Standard and Poor’s)
Maintain the City’s current financial position over the next five years
Council Objectives Council Objectives (Detailed Data)(Detailed Data)
*The City does not currently track data for this objective. A contract is expected to be presented to Council in February for the National Research Center (Citizen Survey) to conduct a Business Climate Survey for the City to establish baseline data.

23
• Economic Vibrancy– Resource Management
• Employ process improvement methods– Accountability
• Benchmarking– Long-Range Strategic Planning
• Marketing & Branding
• Culture, Arts & Recreation– Resource Management
• Physical Infrastructure– Enhanced Customer Communication
• Community Outreach
• Educational Enhancements– Resource Management
• Meet maintenance and replacement schedules– Continuous Workforce Development– Enhanced Customer Communication
• Community Outreach
• Public Safety– Continuous Workforce Development
• Hiring Strategies– Resource Management– Enhanced Customer Communication
• Community Outreach
• Clean, Healthy Environment– Resource Management
• Buy "green" and environmentally friendly goods and services
Links to Other Key Focus AreasLinks to Other Key Focus Areas
Council Planning Session
Clean, Healthy Environment
January 16, 2008
2
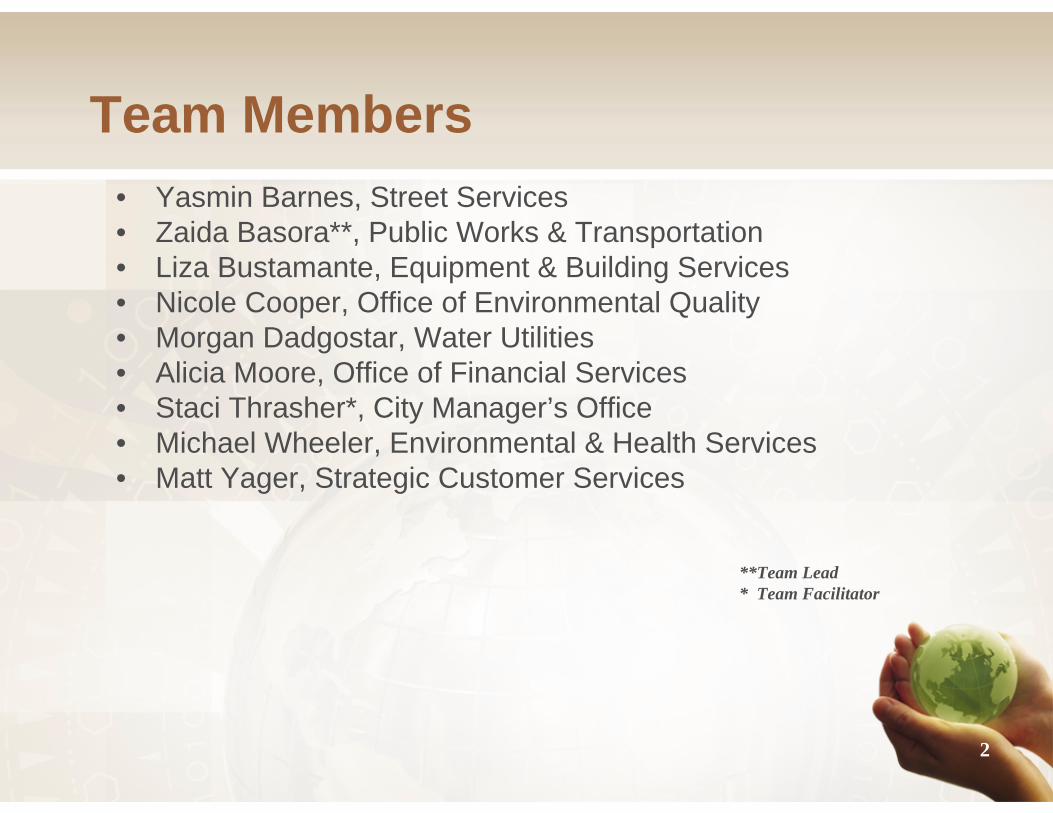
Team Members• Yasmin Barnes, Street Services• Zaida Basora**, Public Works & Transportation• Liza Bustamante, Equipment & Building Services• Nicole Cooper, Office of Environmental Quality• Morgan Dadgostar, Water Utilities• Alicia Moore, Office of Financial Services• Staci Thrasher*, City Manager’s Office• Michael Wheeler, Environmental & Health Services• Matt Yager, Strategic Customer Services
**Team Lead* Team Facilitator
3
Roadmap
• Envisioned Future
• Council Objectives
• Strategy Map
• Strategies & Data
• Links to other KFAs

4
Envisioned Future
• Dallas is a sustainable community with a clean, healthy environment
5
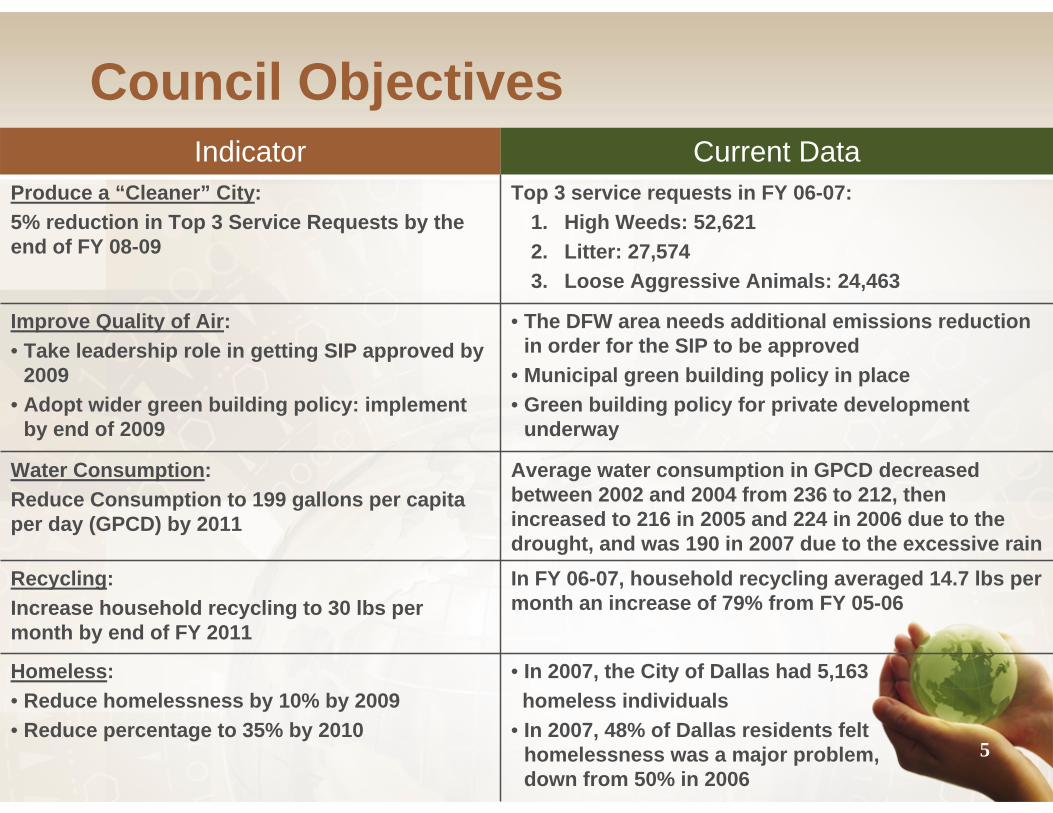
Council Objectives
• In 2007, the City of Dallas had 5,163homeless individuals
• In 2007, 48% of Dallas residents felt homelessness was a major problem, down from 50% in 2006
Homeless:• Reduce homelessness by 10% by 2009• Reduce percentage to 35% by 2010
In FY 06-07, household recycling averaged 14.7 lbs per month an increase of 79% from FY 05-06
Recycling: Increase household recycling to 30 lbs per month by end of FY 2011
Average water consumption in GPCD decreased between 2002 and 2004 from 236 to 212, then increased to 216 in 2005 and 224 in 2006 due to the drought, and was 190 in 2007 due to the excessive rain
Water Consumption: Reduce Consumption to 199 gallons per capita per day (GPCD) by 2011
• The DFW area needs additional emissions reduction in order for the SIP to be approved
• Municipal green building policy in place• Green building policy for private development
underway
Improve Quality of Air: • Take leadership role in getting SIP approved by
2009• Adopt wider green building policy: implement
by end of 2009
Top 3 service requests in FY 06-07: 1. High Weeds: 52,6212. Litter: 27,5743. Loose Aggressive Animals: 24,463
Produce a “Cleaner” City: 5% reduction in Top 3 Service Requests by the end of FY 08-09
Current DataIndicator

6
FY 2008-09 Strategy Map
6
7
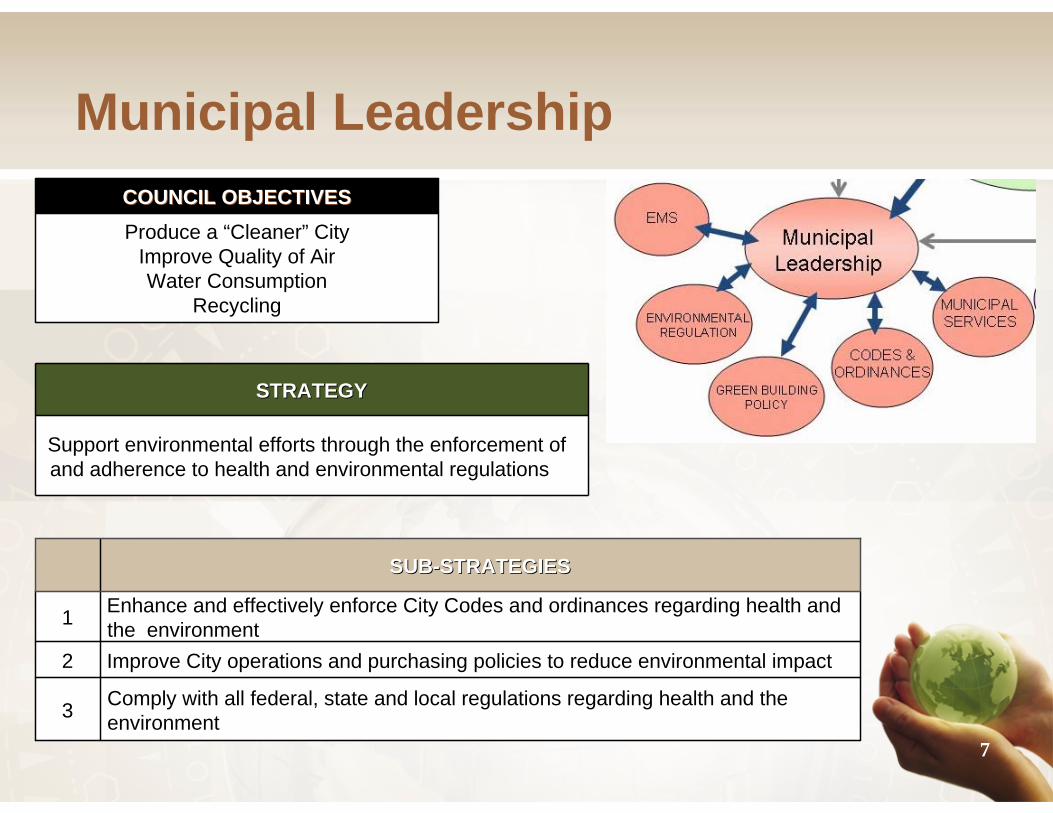
Municipal Leadership
Produce a “Cleaner” CityImprove Quality of AirWater Consumption
Recycling
COUNCIL OBJECTIVESCOUNCIL OBJECTIVES
Comply with all federal, state and local regulations regarding health and the environment
Improve City operations and purchasing policies to reduce environmental impact
Enhance and effectively enforce City Codes and ordinances regarding health and the environment
SUBSUB--STRATEGIESSTRATEGIES
3
2
1
Support environmental efforts through the enforcement of and adherence to health and environmental regulations
STRATEGY STRATEGY
8
Municipal Leadership
• On May 23, 2007, the Dallas City Council passed a City Ordinance prohibiting vehicle operators with gross weight over 14,000 lbs to idle for more than 5 minutes (enforcement begins Ozone season 2008)
• In May 2007, the City changed its cement purchasing strategy to encourage kilns to reduce their contribution to the DFW ozone problem
• On October 24, 2007, the Dallas City Council adopted a resolution outlining their commitment to a policy calling for all new buildings constructed in Dallas to meet “green” standards
9
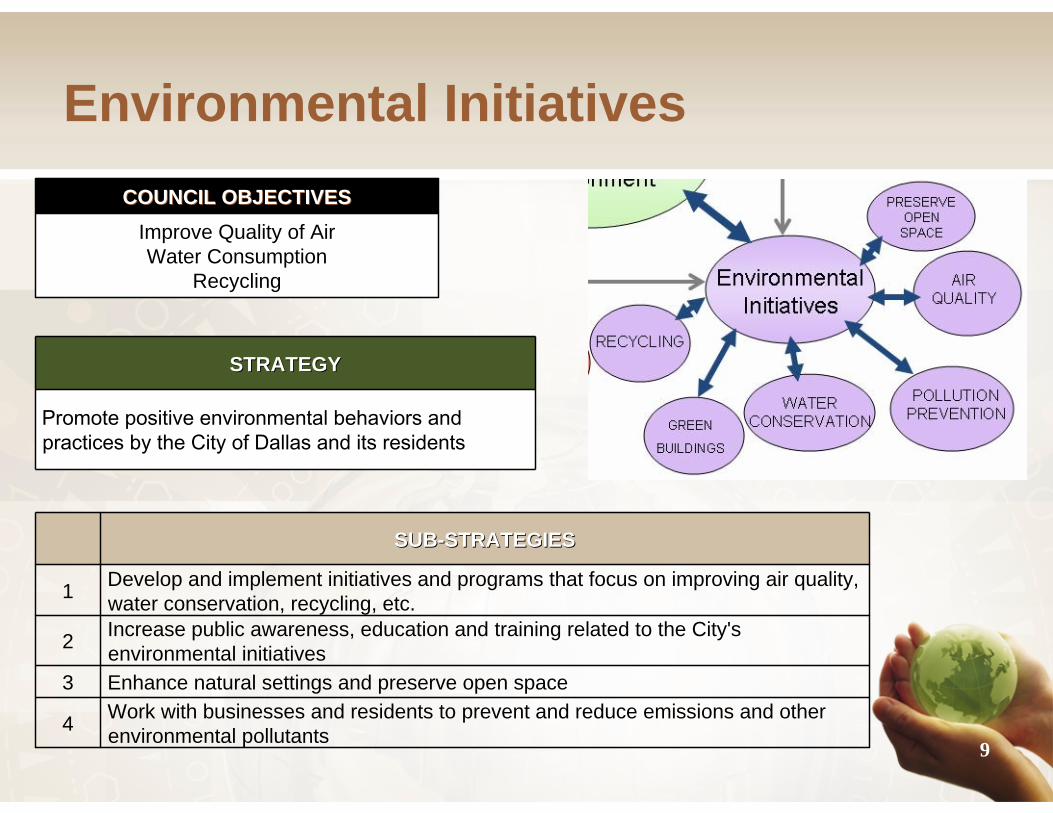
Environmental Initiatives
Improve Quality of AirWater Consumption
Recycling
COUNCIL OBJECTIVESCOUNCIL OBJECTIVES
Work with businesses and residents to prevent and reduce emissions and other environmental pollutants
Enhance natural settings and preserve open space
Increase public awareness, education and training related to the City's environmental initiatives
Develop and implement initiatives and programs that focus on improving air quality, water conservation, recycling, etc.
SUBSUB--STRATEGIESSTRATEGIES
4
3
2
1
Promote positive environmental behaviors and practices by the City of Dallas and its residents
STRATEGYSTRATEGY

10
Environmental Initiatives
• Since the initiation of the DWU Conservation Program in fiscal year 2002, water consumption in gallons per capita per day (GPCD) decreased by nearly 20%, despite a 6% population increase
• There is a growing number of green buildings with Dallas leading the effort. The number of LEED Certified buildings in Dallas is 5, with over 40 registered
• In 2007, 53% of Dallas citizens consider recycling service to be good or excellent, an increase of 17 percentage points from 2006

11
Community Enhancement
Produce a “Cleaner” CityHomeless
COUNCIL OBJECTIVESCOUNCIL OBJECTIVES
Create safe/secure environment for the homeless, including housing opportunities and support services
Implement healthy lifestyle education
Provide preventive health resources
Build a sense of community in neighborhoods
Improve neighborhood cleanliness by promoting citizen involvement in code compliance
SUBSUB--STRATEGIESSTRATEGIES
5
4
3
2
1
Enhance the health and livability of Dallas residents and the quality of their neighborhoods
STRATEGY STRATEGY
12
Community Enhancement
• Service request system provides the community a way to address their concerns and improve neighborhood cleanliness
• In 2007, there were 5,163 persons counted in the Annual Homeless Count, a decrease of 9% from the 2006 number. The new Homeless Assistance Center will open in April 2008

13
Regional Collaboration
Improve Quality of AirWater Consumption
Recycling
COUNCIL OBJECTIVESCOUNCIL OBJECTIVES
Partner and support provision of cost-effective health services by Dallas County and other providers
Enhance current water resource planning with surrounding cities
Provide connectivity among pedestrian, bike, transit and road facilities, and expand transportation modal choices for the Trinity River Development
Take a leadership role in ensuring that DFW SIP approved
Enhance community livability through sustainable transportation solutions
SUBSUB--STRATEGIESSTRATEGIES
5
4
3
2
1
Work with surrounding municipalities and businesses to improve the quality of the environment
STRATEGY STRATEGY
14
Regional Collaboration• Although Dallas has met the EPA 1-hour standard,
the DFW region remains a non-attainment area for the 8-hour standard for ozone
• DART Green Line is under construction with one more line and an extension under design
• Dallas Water Utilities provides treated and untreated water services to 27 communities outside the city limits

15
Links to Other KFAs
Economic Vibrancy
Green Buildings, Housing, Regional Collaboration
Culture, Arts & Recreation
Neighborhood Quality, Preserve Open Space
Public Safety
Codes & Ordinances, Community Enhancement
Educational Enhancements
Community Enhancement, Environmental Initiatives
E3 Government
Municipal Services, Environmental and Health Regulation, EMS
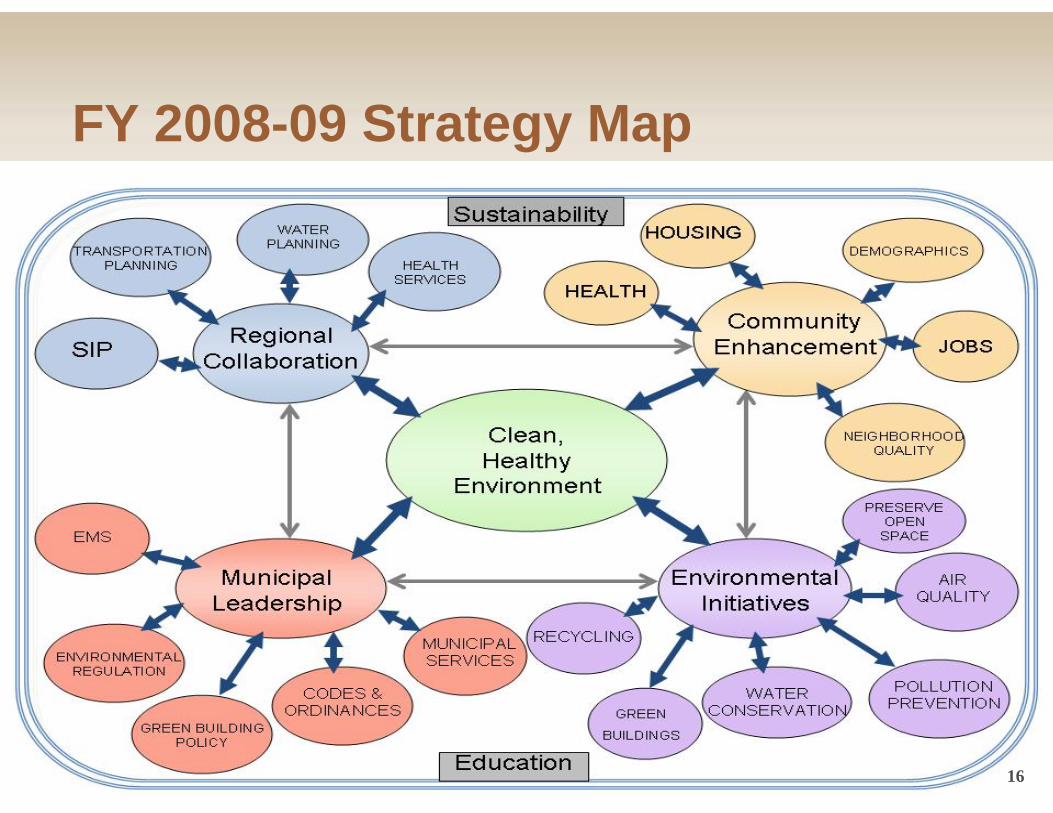
16
FY 2008-09 Strategy Map
16

17
Envisioned Future
• Dallas is a sustainable community with a clean, healthy environment

Appendices
References and Relevant Data

19
References• Metro Dallas Homeless Alliance 2008 Annual “Point in
Time” Homeless Count
• 2007 ICMA Dallas Citizen Survey
• Service Performance Reports FY2006-07
• Dallas Water Utilities website (http://dallascityhall.com/dwu/water_interesting_facts.html)
• DART website (http://www.dart.org/about/expansion/expansionmaps.asp)
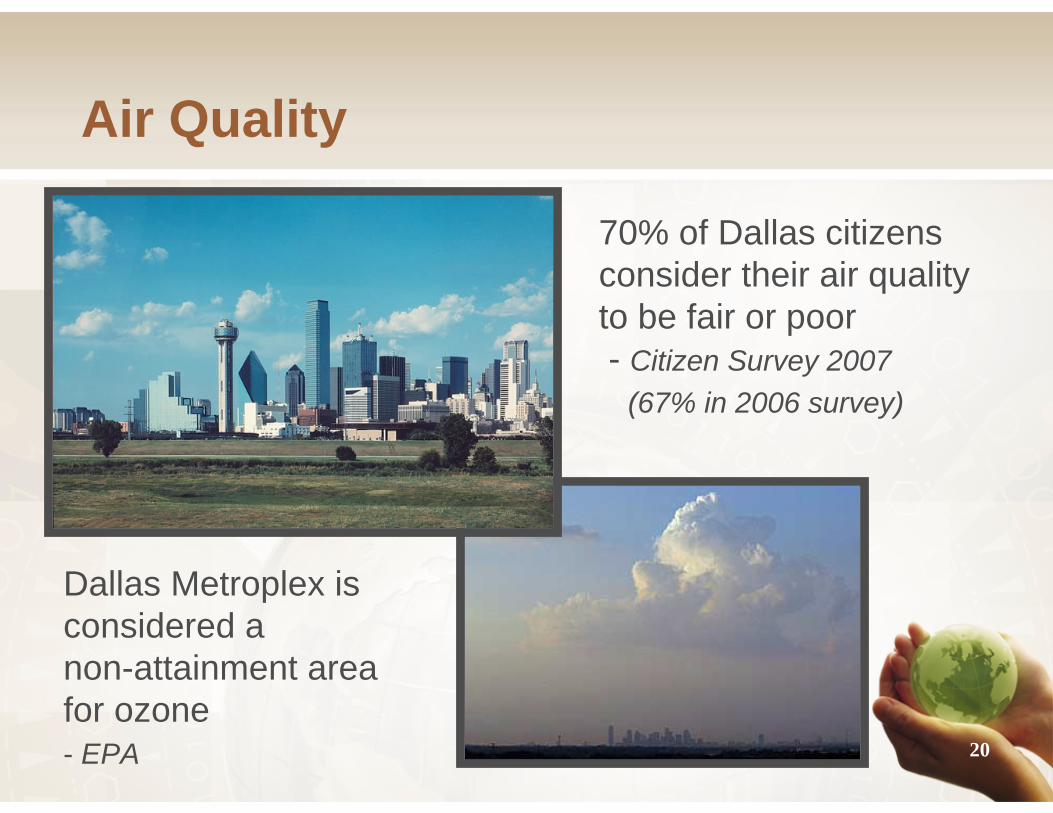
20
Air Quality
70% of Dallas citizens consider their air quality to be fair or poor- Citizen Survey 2007
(67% in 2006 survey)
Dallas Metroplex isconsidered a non-attainment area for ozone- EPA
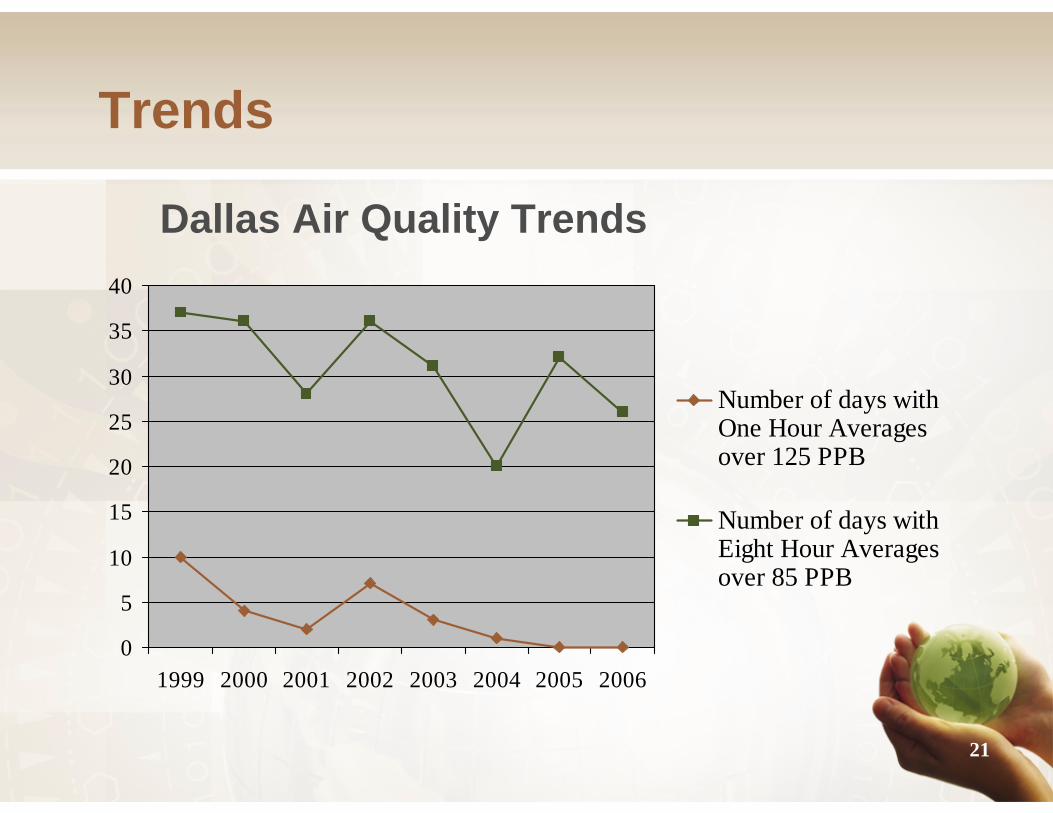
21
0
5
10
15
20
25
30
35
40
1999 2000 2001 2002 2003 2004 2005 2006
Number of days withOne Hour Averagesover 125 PPB
Number of days withEight Hour Averagesover 85 PPB
Dallas Air Quality Trends
Trends

22
Water QualitySince the initiation of the DWUConservation Program in fiscal year 2002, water consumption in gallons per capita per day (GPCD) decreased by nearly 20%, despite a 6% population increase

23
Trends
Annual GPCD and Population
150
175
200
225
250
275
FY96FY97FY98FY99FY00FY01FY02FY03FY04FY05FY06FY 07
Gal
lons
per
Cap
ita p
er D
ay(G
PCD
)
1000
1100
1200
1300
Pop
ulat
ion
(1,0
00s)
GPCDPopulation
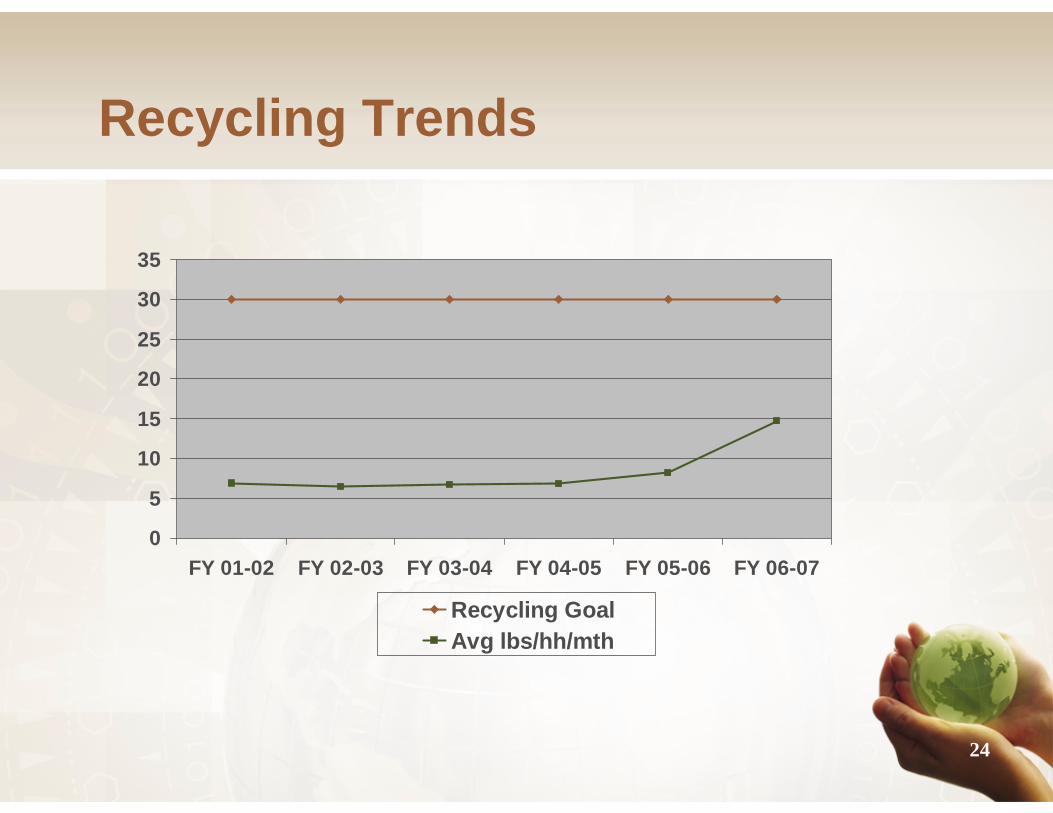
24
Recycling Trends
0
5
10
15
20
25
30
35
FY 01-02 FY 02-03 FY 03-04 FY 04-05 FY 05-06 FY 06-07
Recycling GoalAvg lbs/hh/mth