budget preparation calendar. budget workshop agenda for may 8, 2002
TRANSCRIPT


FUND 01 FUND 01 FUND 01 FUND 41 FUND 42 FUND 45FISCAL General Fund General Fund General Fund Sales Tax Property Tax Capital Project Debt GRANDYEAR Busses Computer Service Energy Mgmt Debt Debt (QZAB) TOTAL
2002 $192,674.40 $48,168.60 $555,567.50 $9,188,263.33 $633,082.50 $54,564.73 $10,672,321.062003 205,106.65 51,276.66 558,705.00 9,555,780.00 638,942.50 218,258.92 $11,228,069.732004 205,106.65 51,276.66 555,517.50 9,558,356.25 638,702.50 218,258.92 $11,227,218.482005 205,106.65 51,276.66 556,212.50 9,557,501.25 641,862.50 218,258.92 $11,230,218.482006 205,106.65 51,276.66 555,507.50 9,551,570.00 643,380.00 218,258.92 $11,225,099.732007 205,106.65 51,276.66 559,007.50 9,550,506.25 647,940.00 218,258.92 $11,232,095.982008 - - 555,575.00 9,549,856.25 650,500.00 218,258.92 $10,974,190.172009 - - 560,637.50 9,553,590.00 651,000.00 218,258.92 $10,983,486.422010 - - 558,620.00 9,559,630.00 - 218,258.92 $10,336,508.922011 - - 0.00 9,557,586.25 - 218,258.92 $9,775,845.172012 - - 0.00 9,561,055.00 - 218,258.91 $9,779,313.912013 - - 0.00 9,569,392.50 - 218,258.88 $9,787,651.382014 - - 0.00 7,611,060.00 - 218,258.88 $7,829,318.882015 - - 0.00 7,617,390.00 - 218,258.88 $7,835,648.882016 - - 0.00 7,234,215.00 - 109,129.44 $7,343,344.442017 - - 0.00 7,236,140.00 - - $7,236,140.002018 - - 0.00 7,238,800.00 - - $7,238,800.002019 - - 0.00 1,842,250.00 - - $1,842,250.002020 - - 0.00 1,009,000.00 - - $1,009,000.002021 - - 0.00 1,013,250.00 - - $1,013,250.00
TOTAL $1,218,207.65 $304,551.90 $5,015,350.00 $155,115,192.08 $5,145,410.00 $3,001,060.00 $169,799,771.63
DEBT SERVICE - ALL FUNDSLafayette Parish School System


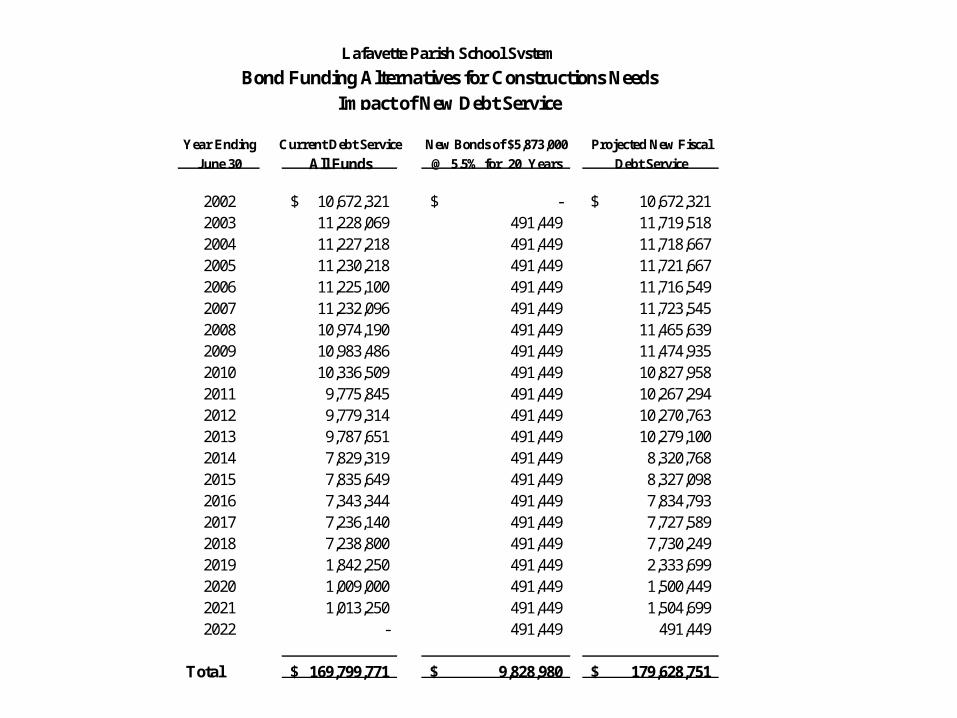
Bond Funding Alternatives for Constructions Needs
Year Ending Current Debt Service New Bonds of $5,873,000 Projected New Fiscal
June 30 All Funds @ 5.5% for 20 Years Debt Service
2002 10,672,321$ -$ 10,672,321$ 2003 11,228,069 491,449 11,719,518 2004 11,227,218 491,449 11,718,667 2005 11,230,218 491,449 11,721,667 2006 11,225,100 491,449 11,716,549 2007 11,232,096 491,449 11,723,545 2008 10,974,190 491,449 11,465,639 2009 10,983,486 491,449 11,474,935 2010 10,336,509 491,449 10,827,958 2011 9,775,845 491,449 10,267,294 2012 9,779,314 491,449 10,270,763 2013 9,787,651 491,449 10,279,100 2014 7,829,319 491,449 8,320,768 2015 7,835,649 491,449 8,327,098 2016 7,343,344 491,449 7,834,793 2017 7,236,140 491,449 7,727,589 2018 7,238,800 491,449 7,730,249 2019 1,842,250 491,449 2,333,699 2020 1,009,000 491,449 1,500,449 2021 1,013,250 491,449 1,504,699 2022 - 491,449 491,449
Total 169,799,771$ 9,828,980$ 179,628,751$
Lafayette Parish School System
Impact of New Debt Service
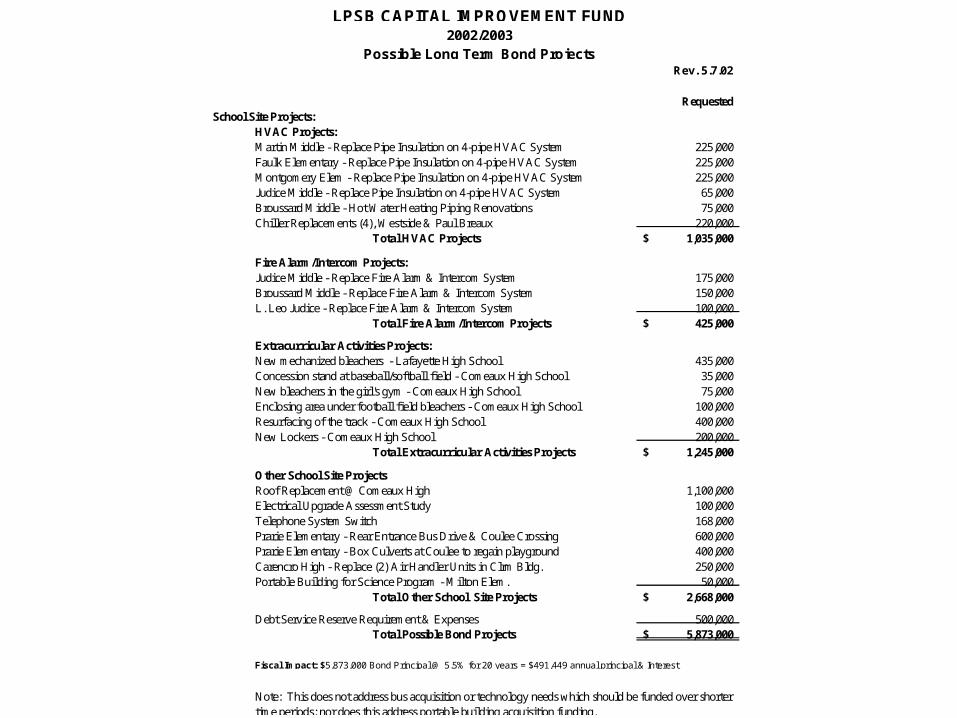
Rev. 5.7.02
Requested School Site Projects:
HVAC Projects:Martin Middle - Replace Pipe Insulation on 4-pipe HVAC System 225,000 Faulk Elementary - Replace Pipe Insulation on 4-pipe HVAC System 225,000 Montgomery Elem - Replace Pipe Insulation on 4-pipe HVAC System 225,000 Judice Middle - Replace Pipe Insulation on 4-pipe HVAC System 65,000 Broussard Middle - Hot Water Heating Piping Renovations 75,000 Chiller Replacements (4), Westside & Paul Breaux 220,000 Total HVAC Projects 1,035,000$
Fire Alarm/Intercom Projects:Judice Middle - Replace Fire Alarm & Intercom System 175,000
Broussard Middle - Replace Fire Alarm & Intercom System 150,000 L. Leo Judice - Replace Fire Alarm & Intercom System 100,000
Total Fire Alarm/Intercom Projects 425,000$
Extracurricular Activities Projects:New mechanized bleachers - Lafayette High School 435,000 Concession stand at baseball/softball field - Comeaux High School 35,000 New bleachers in the girl's gym - Comeaux High School 75,000 Enclosing area under football field bleachers - Comeaux High School 100,000 Resurfacing of the track - Comeaux High School 400,000 New Lockers - Comeaux High School 200,000
Total Extracurricular Activities Projects 1,245,000$
Other School Site ProjectsRoof Replacement @ Comeaux High 1,100,000 Electrical Upgrade Assessment Study 100,000 Telephone System Switch 168,000 Prarie Elementary - Rear Entrance Bus Drive & Coulee Crossing 600,000 Prarie Elementary - Box Culverts at Coulee to regain playground 400,000 Carencro High - Replace (2) Air Handler Units in Clrm Bldg. 250,000 Portable Building for Science Program - Milton Elem. 50,000
Total Other School Site Projects 2,668,000$
Debt Service Reserve Requirement & Expenses 500,000 Total Possible Bond Projects 5,873,000$
Fiscal Impact: $5,873,000 Bond Principal @ 5.5% for 20 years = $491,449 annual principal & Interest
LPSB CAPITAL IMPROVEMENT FUND2002/2003
Possible Long Term Bond Projects
Note: This does not address bus acquisition or technology needs which should be funded over shorter time periods; nor does this address portable building acquisition funding.
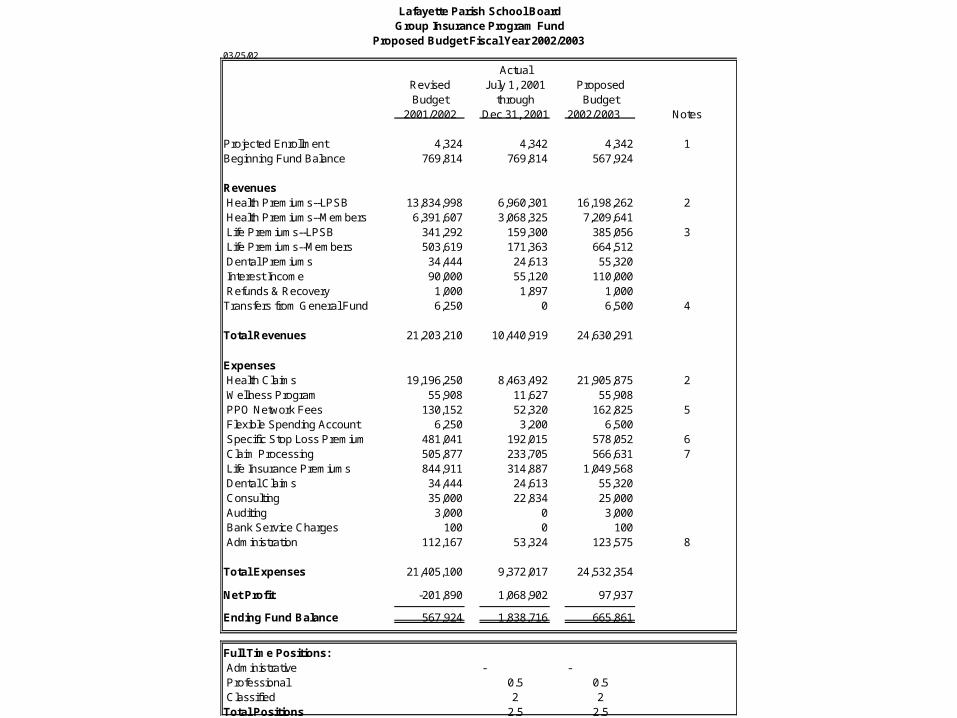
Lafayette Parish School BoardGroup Insurance Program Fund
Proposed Budget Fiscal Year 2002/2003 03/25/02
ActualRevised July 1, 2001 ProposedBudget through Budget
2001/2002 Dec 31, 2001 2002/2003 Notes
Projected Enrollment 4,324 4,342 4,342 1Beginning Fund Balance 769,814 769,814 567,924
Revenues Health Premiums--LPSB 13,834,998 6,960,301 16,198,262 2 Health Premiums--Members 6,391,607 3,068,325 7,209,641 Life Premiums--LPSB 341,292 159,300 385,056 3 Life Premiums--Members 503,619 171,363 664,512 Dental Premiums 34,444 24,613 55,320 Interest Income 90,000 55,120 110,000 Refunds & Recovery 1,000 1,897 1,000Transfers from General Fund 6,250 0 6,500 4
Total Revenues 21,203,210 10,440,919 24,630,291
Expenses Health Claims 19,196,250 8,463,492 21,905,875 2 Wellness Program 55,908 11,627 55,908 PPO Network Fees 130,152 52,320 162,825 5 Flexible Spending Account 6,250 3,200 6,500 Specific Stop Loss Premium 481,041 192,015 578,052 6 Claim Processing 505,877 233,705 566,631 7 Life Insurance Premiums 844,911 314,887 1,049,568 Dental Claims 34,444 24,613 55,320 Consulting 35,000 22,834 25,000 Auditing 3,000 0 3,000 Bank Service Charges 100 0 100 Administration 112,167 53,324 123,575 8
Total Expenses 21,405,100 9,372,017 24,532,354
Net Profit -201,890 1,068,902 97,937
Ending Fund Balance 567,924 1,838,716 665,861
Full Time Positions: Administrative - - Professional 0.5 0.5 Classified 2 2Total Positions 2.5 2.5

GROUP INSURANCE PROGRAM FUND FY 2002/2003
EXPLANATORY NOTES
Note 1. We have arrived at our projected enrollment for 2002/2003 by calculating our average monthly enrollment during Plan Year 2001. The census can be broken down into the following categories: active employees 2,972 retirees 1,380 singles 2,290 COBRAs 90 families 2,052 TOTAL 4,342 TOTAL 4,342 Note 2. In order to determine the revenue needed for the coming fiscal year, we have secured data from several sources on what our projected claims costs will be as well as our plan’s fixed administrative costs. Blue Cross Blue Shield’s actuaries, as well as independent consultants, have examined several factors including our plan members’ utilization patterns; our large claims (those which exceed $50,000); inflation and market trends; negotiated provider contracts; and, plan amendments during the past year. Medical inflation is expected to be from 12% to 15%, while prescription drug costs are expected to rise between 20% and 25%. All factors considered, we anticipate requiring 17% more revenue to operate our Group Health Fund for Fiscal Year 2002/2003. The increased revenue is budgeted strictly in the form of an increase in the premiums paid by both the employees and the employer. The premium increase has been distributed among all of the funding sources: ½-cent sales tax, undedicated general fund/special fund revenues, and employee/retiree contributions. The total cost of the premiums to each revenue source is expected to be ½-cent sales tax $8,321,503 undedicated general fund/special fund revenues $7,876,759 employees/retirees $7,209,641 Although we have not made any assumptions about future benefit changes to the health plan, we are currently investigating the feasibility of implementing the following programs to help us manage claims costs: a disease management program to target and intervene in the management of patients’ treatment for specific diagnoses such as diabetes and cardiovascular disease; and, a three-tiered prescription drug program design. Note 3. Effective January 1, 2002, ReliaStar, the company which provides life insurance to our employees and retirees, introduced a new life insurance program which includes a premium rate schedule based on the age of the person enrolled. This “age-banded” premium structure has become necessary to correct the problem of adverse selection which had occurred with our group over time, leading to a high

loss ratio. Under the new program, the school system provides at no cost to the employee the basic life insurance for all employees and retirees enrolled. Employees and retirees who wish to purchase supplemental coverage do so at their own cost, paying a premium based on both the amount of coverage purchased and based on their age. Note 4. The General Fund reimburses the Group Health Fund for the cost of administering the flexible spending account benefit. Note 5. PPO network access fees are paid to Blue Cross Blue Shield for access to the Preferred Care and Key Physician networks. The fees are $3.00 per member per month for July, 2002, through December, 2002, and $3.25 per member per month for January, 2003, through June, 2003. Note 6. Our current stop-loss insurance rates are $5.39 per month for single plan subscribers and $17.46 per month for each family enrolled in the plan. We have assumed no rate increase at the renewal of our contract on January 1, 2003. Note 7. Our administrative fee paid to Blue Cross Blue Shield for claim processing for the period July through December, 2002, is $10 per member per month. For the period January, 2003, through June, 2003, the rate has been fixed at $11.75 per member per month. Note 8. Administration costs consist of the following: Salaries Professional salary (.5 position) $27,595 Clerical (2 positions) $47,760 Overtime $ 0.00 Employee Benefits Group insurance $ 11,145 Retirement $ 11,303 Other (Medicare, FICA) $ 1,130 Other costs Travel (in-parish) $ 300 Training/Seminars/Conference Fees $ 2,500 Subscriptions and dues $ 6,100 Supplies and materials $ 4,500 Equipment (copier and imaging system) $ 5,242 Printing $ 6,000

Lafayette Parish School System
Health and Life Insurance
Total Premium Contributions by Share
Projected for Fiscal Year 2002-2003
Employee ContributionsHEALTH LIFE
annual % of total annual % of totalcontribution premium contribution premium
General Fund Active Employees 4,938,604 21.0% 383,227 37.40%Special Funds (Active Employees) 317,224 1.3% 22,041 2.10%School Food Service Employees 165,822 0.7% 19,942 1.90%Retirees 1,514,025 6.3% 236,153 22.50%Employees on leave 36,048 .15% 3,149 0.30%COBRA, survivors 237,918 1.0% 0 0
total 7,209,641 664,512
Employer ContributionsHEALTH: 1/2-cent sales tax HEALTH: other GF/Special Funds LIFEannual % of total annual % of total annual % of total
contribution premium contribution premium contribution premiumGeneral Fund Active Employees 5,418,922 23.50% 5,032,699 21.50% 87,114 8.30%Special Funds (Active Employees) 327,711 1.40% 351,118 1.50% 5,248 0.50%School Food Service Employees 257,487 1.10% 234,079 1.00% 5,248 0.50%Retirees 2,270,567 9.70% 2,200,343 9.40% 287,446 26.50%Employees on leave 46,816 0.20% 58,520 0.25% 0 0.00%COBRA, survivors 0 0.00% 0 0.00% 0 0.00%
total 8,321,503 7,876,759 385,056
TOTAL HEALTH PREMIUM: $23,407,903 TOTAL LIFE PREMIUM: $1,049,568Employees' share: 30.45% Employees' share: 64.20%LPSB share from ½-cent sales tax: 35.9% LPSB share: 35.80%LPSB share from other General Fund/Special Funds: 33.65%

Lafayette Parish School System
Health Insurance
Funding of $3,181,298 Projected Premium Increase
Projected for Fiscal Year 2002-2003
Employee ContributionsHEALTH
annual % of totalcontribution premium
General Fund Active Employees 668,073 21.0%Special Funds (Active Employees) 41,357 1.3%School Food Service Employees 22,269 0.7%Retirees 200,422 6.3%Employees on leave 4,772 .15%COBRA, survivors 31,813 1.0%
total 968,706
Employer ContributionsHEALTH: 1/2-cent sales tax HEALTH: other GF/Special Funds
annual % of total annual % of totalcontribution premium contribution premium
General Fund Active Employees 747,605 23.50% 683,979 21.50%Special Funds (Active Employees) 44,538 1.40% 47,719 1.50%School Food Service Employees 34,994 1.10% 31,813 1.00%Retirees 308,586 9.70% 299,042 9.40%Employees on leave 6,363 0.20% 7,953 0.25%COBRA, survivors 0 0.00% 0 0.00%
total 1,142,086 1,070,506

Health Insurance Premiums
– Proposed Funding
Percentages by Share – Projected
for FY 02/03
Lafayette Parish School System
Health Insurance
Proposed Funding Percentages by Share
Projected for Fiscal Year 2002-2003
Percentage of Percentage of Total Premium Total Premium
Coverage Category (Census Count) Paid by EmployeePaid by EmployerActive or Retiree Only (1,761) 18.7% 81.3%Active/ Retiree, plus one dependent (680) 35.8% 64.2%Active/ Retiree, plus one dependent, both LPSS EEs (106) 18.7% 81.3%Active/Retiree, plus family (765) 41.6% 58.4%Active/Retiree, plus family, both LPSS EEs (115) 28.7% 71.3%Retiree Only with Medicare (446) 19.5% 80.5%Retiree w/ Medicare, plus one dependent w/o Medicare (30) 29.8% 70.2%Retiree w/ Medicare, plus one dependent w/o Medicare, both LPSS EEs (17) 18.7% 81.3%Retiree w/o Medicare, plus one dependent w/ Medicare (43) 26.5% 73.5%Retiree w/o Medicare, plus one dependent w/ Medicare, both LPSS EEs (9) 18.7% 81.3%Retiree, plus one dependent, both w/ Medicare (234) 22.2% 77.8%Retiree, plus one dependent, both w/ Medicare, both LPSS EEs (30) 18.7% 81.3%Retiree w/ Medicare, plus family (3) 47.6% 52.4%Retiree w/ Medicare, plus family, both LPSS EEs (2) 33.1% 66.9%Retiree w/o Medicare, plus family; one dependent w/ Medicare (8) 36.4% 63.6%Retiree w/o Medicare, plus family; one dependent w/ Medicare, both LPSS EEs (0) 30.8% 69.2%Retiree w/ Medicare, plus family, including one dependent also on Medicare (1) 46.6% 53.4%Retiree w/ Medicare, plus family, including one dependent also on Medicare, both LPSS EEs (2) 31.0% 69.0%
Total census count = 4,252

Lafayette Parish School System
Health Insurance
Proposed New Premiums
Projected for Fiscal Year 2002-2003
Premium Paid by Employee Premium Paid by Employer Total Premium
Employees' Share New Proposed Amount of New Proposed Amount of New Proposed Amount of
Monthly % Increase Monthly % Increase Monthly Increase
Coverage Category (Census Count) Premium Increase (Monthly) Premium Increase (Monthly) Premium Monthly
Active or Retiree Only (1,761) 61.71 24.1% 11.99 268.51 15.5% 35.99 330.22 47.98
Active/ Retiree, plus one dependent (680) 205.19 16.9% 29.63 367.86 17.1% 53.63 573.05 83.26
Active/ Retiree, plus one dependent, both LPSS EEs (106) 107.08 24.1% 20.81 465.97 15.5% 62.45 573.05 83.26
Active/Retiree, plus family (765) 316.38 15.8% 43.23 443.87 17.8% 67.23 760.25 110.46
Active/Retiree, plus family, both LPSS EEs (115) 218.27 18.7% 34.41 541.98 16.3% 76.05 760.25 110.46
Retiree Only with Medicare (446) 33.51 22.9% 6.25 138.64 15.6% 18.76 172.15 25.01
Retiree w/ Medicare, plus one dependent w/o Medicare (30) 122.02 17.0% 17.73 287.14 17.0% 41.72 409.16 59.45
Retiree w/ Medicare, plus one dependent w/o Medicare, both LPSS EEs (17) 76.46 24.1% 14.86 332.70 15.5% 44.59 409.16 59.45
Retiree w/o Medicare, plus one dependent w/ Medicare (43) 108.35 22.5% 17.73 300.81 16.1% 41.72 409.16 59.45
Retiree w/o Medicare, plus one dependent w/ Medicare, both LPSS EEs (9) 76.46 24.1% 14.86 332.70 15.5% 44.59 409.16 59.45
Retiree, plus one dependent, both w/ Medicare (234) 83.98 22.5% 15.45 293.77 15.5% 39.44 377.75 54.89
Retiree, plus one dependent, both w/ Medicare, both LPSS EEs (30) 70.59 24.1% 13.72 307.16 15.5% 41.17 377.75 54.89
Retiree w/ Medicare, plus family (3) 272.23 14.9% 35.33 300.17 19.0% 47.84 572.40 83.17
Retiree w/ Medicare, plus family, both LPSS EEs (2) 189.16 17.3% 27.86 383.24 16.9% 55.31 572.40 83.17
Retiree w/o Medicare, plus family; one dependent w/ Medicare (8) 208.38 16.5% 29.59 364.02 17.2% 53.58 572.40 83.17
Retiree w/o Medicare, plus family; one dependent w/ Medicare, both LPSS EEs (0) 176.48 17.8% 26.72 395.92 16.6% 56.45 572.40 83.17
Retiree w/ Medicare, plus family, including one dependent also on Medicare (1) 246.96 15.0% 32.23 282.76 18.8% 44.74 529.72 76.97
Retiree w/ Medicare, plus family, including one dependent also on Medicare, both LPSS EEs (2) 163.90 17.8% 24.76 365.82 16.6% 52.21 529.72 76.97
Total census count = 4,252

Group Health Insurance Expenditures - Object Code 210 Plus 270
1999-2000 2000-2001
1 Acadia $3,342,873 $4,162,601 $819,728 24.52% $4,513,500 $350,899 8.43% $4,965,000 $451,500 10.00%
2 Allen $1,557,113 $1,820,461 $263,348 16.91% $2,185,000 $364,539 20.02% $2,405,000 $220,000 10.07%
3 Ascension $6,010,083 $6,685,194 $675,112 11.23% $7,205,924 $520,730 7.79% $8,365,756 $1,159,832 16.10%
4 Assumption $2,045,578 $2,262,555 $216,977 10.61% $2,661,555 $399,000 17.63% $3,361,290 $699,735 26.29%
5 Avoyelles $3,434,223 $3,990,646 $556,423 16.20% $4,652,488 $661,842 16.58% $4,978,162 $325,674 7.00%
6 Beauregard $2,157,966 $2,413,202 $255,236 11.83% $2,676,405 $263,203 10.91% $2,882,027 $205,622 7.68%
7 Bienville $1,572,231 $1,721,866 $149,635 9.52% $2,031,802 $309,936 18.00% $2,397,526 $365,724 18.00%
8 Bossier $13,212,622 $13,295,688 $83,066 0.63% $13,439,466 $143,778 1.08% $15,107,724 $1,668,258 12.41%
9 Caddo $22,863,635 $26,997,708 $4,134,073 18.08% $29,885,100 $2,887,392 10.69% $33,885,500 $4,000,400 13.39%
10 Calcasieu $14,276,763 $10,436,589 ($3,840,174) -26.90% $12,490,288 $2,053,699 19.68% $13,277,114 $786,826 6.30%
11 Caldwell $731,380 $896,848 $165,468 22.62% $1,122,000 $225,152 25.10% $1,363,000 $241,000 21.48%
12 Cameron $842,763 $1,099,751 $256,988 30.49% $1,136,200 $36,449 3.31% $1,340,532 $204,332 17.98%
13 Catahoula $1,003,224 $1,115,605 $112,381 11.20% $1,306,714 $191,109 17.13% $1,502,722 $196,008 15.00%
14 Claiborne $949,069 $1,065,588 $116,519 12.28% $1,284,390 $218,802 20.53% $1,515,807 $231,417 18.02%
15 Concordia $1,769,105 $1,982,803 $213,698 12.08% $2,192,764 $209,961 10.59% $2,488,568 $295,804 13.49%
16 DeSoto $3,722,502 $3,480,503 ($241,999) -6.50% $4,500,000 $1,019,497 29.29% $5,499,000 $999,000 22.20%
17 East Baton Rouge $34,233,803 $40,679,216 $6,445,413 18.83% $44,000,000 $3,320,784 8.16% $49,000,000 $5,000,000 11.36%
18 East Carroll $898,550 $897,225 ($1,325) -0.15% $956,594 $59,369 6.62% $1,000,000 $43,406 4.54%
19 East Feliciana $817,265 $907,164 $89,899 11.00% $932,187 $25,023 2.76% $1,033,760 $101,573 10.90%
20 Evangeline $2,465,779 $2,766,888 $301,109 12.21% $2,933,847 $166,959 6.03% $3,077,924 $144,077 4.91%
21 Franklin $1,759,425 $1,992,997 $233,572 13.28% $2,476,839 $483,842 24.28% $2,623,139 $146,300 5.91%
22 Grant $1,204,828 $1,452,097 $247,269 20.52% $1,850,000 $397,903 27.40% $2,075,000 $225,000 12.16%
23 Iberia $3,900,564 $4,112,696 $212,132 5.44% $4,548,653 $435,957 10.60% $5,003,519 $454,866 10.00%
24 Iberville $3,467,137 $3,278,634 ($188,503) -5.44% $3,724,800 $446,166 13.61% $4,553,500 $828,700 22.25%
25 Jackson $807,394 $901,847 $94,453 11.70% $1,234,000 $332,153 36.83% $1,511,000 $277,000 22.45%
26 Jefferson $20,305,198 $22,151,443 $1,846,245 9.09% $27,124,365 $4,972,922 22.45% $33,091,726 $5,967,361 22.00%
27 Jefferson Davis $2,792,891 $3,077,900 $285,009 10.20% $3,940,492 $862,592 28.03% $4,526,579 $586,087 14.87%
28 Lafayette $11,622,677 $13,786,178 $2,163,501 18.61% $14,308,514 $522,336 3.79% $16,583,318 $2,274,804 15.90%
Estimated 2002-2003
Difference % Change
State of Louisiana - Department of Education
% ChangeEstimated 2001-2002
Difference % ChangeLEA DistrictObject Code 210 Plus Object
Code 270 Difference

29 LaFourche $3,551,955 $4,259,782 $707,827 19.93% $4,702,800 $443,018 10.40% $5,375,600 $672,800 14.31%
30 LaSalle $1,078,770 $1,311,502 $232,732 21.57% $1,600,031 $288,529 22.00% $1,699,032 $99,001 6.19%
31 Lincoln $4,222,293 $3,956,104 ($266,189) -6.30% $4,948,104 $992,000 25.08% $6,191,104 $1,243,000 25.12%
32 Livingston $4,760,242 $4,900,636 $140,394 2.95% $6,600,000 $1,699,364 34.68% $7,920,000 $1,320,000 20.00%
33 Madison $705,832 $789,762 $83,930 11.89% $887,095 $97,333 12.32% $984,348 $97,254 10.96%
34 Morehouse $2,908,041 $3,136,584 $228,543 7.86% $3,928,819 $792,235 25.26% $4,866,292 $937,473 23.86%
35 Natchitoches $2,178,668 $2,563,384 $384,716 17.66% $3,182,000 $618,616 24.13% $3,904,000 $722,000 22.69%
36 Orleans $22,760,341 $26,840,987 $4,080,646 17.93% $29,579,427 $2,738,440 10.20% $32,599,864 $3,020,437 10.21%
37 Ouachita $4,879,044 $5,687,331 $808,287 16.57% $8,900,000 $3,212,669 56.49% $10,057,000 $1,157,000 13.00%
38 Plaquemines $1,374,252 $1,188,402 ($185,850) -13.52% $1,470,000 $281,598 23.70% $1,810,000 $340,000 23.13%
39 Point Coupee $579,006 $634,409 $55,403 9.57% $3,277,328 $2,642,919 416.60% $3,727,528 $450,200 13.74%
40 Rapides $8,725,010 $10,048,328 $1,323,318 15.17% $12,543,113 $2,494,785 24.83% $14,173,717 $1,630,604 13.00%
41 Red River $524,788 $541,164 $16,376 3.12% $663,472 $122,308 22.60% $814,265 $150,793 22.73%
42 Richland $1,599,285 $1,819,940 $220,655 13.80% $2,190,471 $370,531 20.36% $2,774,912 $584,440 26.68%
43 Sabine $1,514,731 $1,729,419 $214,688 14.17% $2,217,080 $487,661 28.20% $2,800,000 $582,920 26.29%
44 St. Bernard $4,754,519 $5,076,628 $322,109 6.77% $6,162,541 $1,085,913 21.39% $7,086,922 $924,381 15.00%
45 St. Charles $5,517,272 $5,375,722 ($141,550) -2.57% $6,294,739 $919,017 17.10% $7,238,950 $944,211 15.00%
46 St. Helena $589,565 $562,463 ($27,102) -4.60% $550,000 ($12,463) -2.22% $590,000 $40,000 7.27%
47 St. James $1,654,456 $2,193,306 $538,850 32.57% $2,203,394 $10,088 0.46% $2,296,755 $93,361 4.24%
48 St. John $3,083,517 $4,126,670 $1,043,153 33.83% $5,173,497 $1,046,827 25.37% $6,925,093 $1,751,596 33.86%
49 St. Landry $5,247,313 $6,704,287 $1,456,974 27.77% $7,500,000 $795,713 11.87% $8,600,000 $1,100,000 14.67%
50 St. Martin $4,115,741 $4,176,895 $61,154 1.49% $4,401,000 $224,105 5.37% $4,873,000 $472,000 10.72%
51 St. Mary $4,124,042 $4,569,810 $445,768 10.81% $4,583,597 $13,787 0.30% $4,950,284 $366,687 8.00%
52 St. Tammany $15,998,464 $19,081,656 $3,083,192 19.27% $24,600,000 $5,518,344 28.92% $32,450,000 $7,850,000 31.91%
53 Tangipahoa $4,671,481 $5,277,649 $606,168 12.98% $7,145,550 $1,867,901 35.39% $9,393,276 $2,247,726 31.46%
54 Tensas $462,194 $528,080 $65,886 14.26% $632,404 $104,324 19.76% $727,265 $94,861 15.00%
55 Terrebonne $11,036,480 $12,356,996 $1,320,516 11.97% $14,381,887 $2,024,891 16.39% $17,258,264 $2,876,377 20.00%
56 Union $1,050,397 $1,176,011 $125,614 11.96% $1,334,638 $158,627 13.49% $1,894,080 $559,442 41.92%
57 Vermillion $2,985,099 $3,021,571 $36,472 1.22% $3,337,000 $315,429 10.44% $3,678,000 $341,000 10.22%
58 Vernon $4,508,459 $3,637,794 ($870,665) -19.31% $4,017,135 $379,341 10.43% $4,600,400 $583,265 14.52%
59 Washington $2,136,343 $2,377,614 $241,271 11.29% $3,147,274 $769,660 32.37% $3,347,394 $200,120 6.36%
60 Webster $2,672,060 $3,141,424 $469,364 17.57% $3,974,812 $833,388 26.53% $4,408,487 $433,675 10.91%
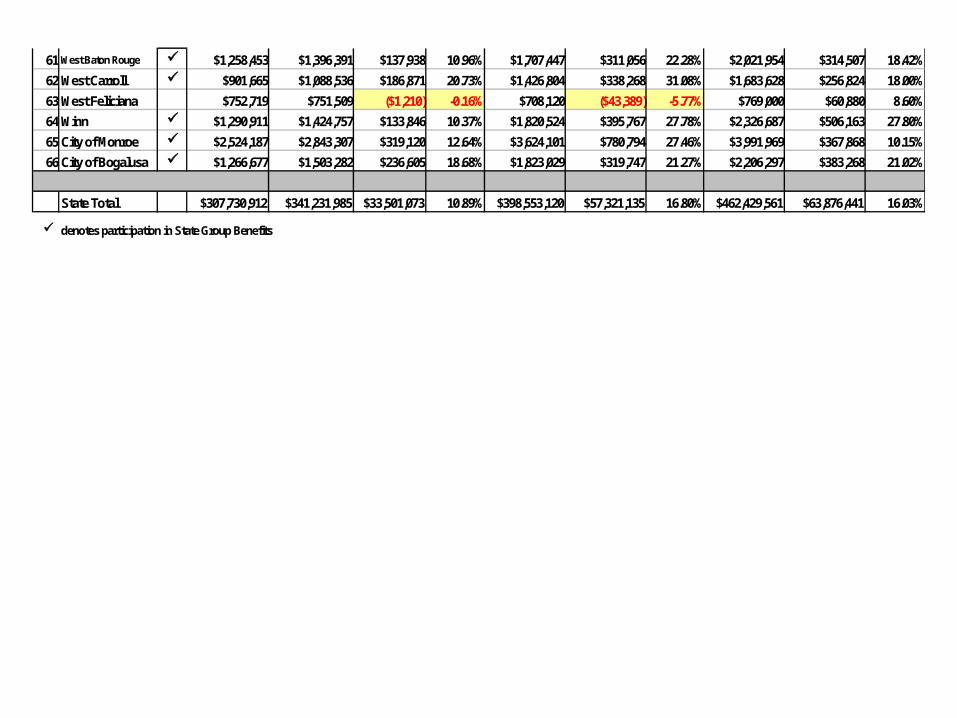
61 West Baton Rouge $1,258,453 $1,396,391 $137,938 10.96% $1,707,447 $311,056 22.28% $2,021,954 $314,507 18.42%
62 West Carroll $901,665 $1,088,536 $186,871 20.73% $1,426,804 $338,268 31.08% $1,683,628 $256,824 18.00%
63 West Feliciana $752,719 $751,509 ($1,210) -0.16% $708,120 ($43,389) -5.77% $769,000 $60,880 8.60%
64 Winn $1,290,911 $1,424,757 $133,846 10.37% $1,820,524 $395,767 27.78% $2,326,687 $506,163 27.80%
65 City of Monroe $2,524,187 $2,843,307 $319,120 12.64% $3,624,101 $780,794 27.46% $3,991,969 $367,868 10.15%
66 City of Bogalusa $1,266,677 $1,503,282 $236,605 18.68% $1,823,029 $319,747 21.27% $2,206,297 $383,268 21.02%
State Total $307,730,912 $341,231,985 $33,501,073 10.89% $398,553,120 $57,321,135 16.80% $462,429,561 $63,876,441 16.03%
denotes participation in State Group Benefits

School Code School Grade Level
# of Sp. Ed. Students
# of Sp. Ed. Teachers
# of Gifted Students
# of Gifted Teachers
28001 Acadian Middle 8-May 69 8 0 028002 Acadiana High 12-Sep 184 18 0 028003 Alleman Middle 8-May 59 8 135 628004 Alice Boucher Elem K-5 104 9 0 028005 Paul Breaux Middle 8-Jun 46 6 360 1728006 Broadmoor Elem K-4 59 3 43 228007 Broussard Middle 8-May 46 7 0 028047 Charles Burke Elem. K-5 110 6 29 228008 Carencro Middle 8-May 112 13 0 028009 Carencro Heights K-4 65 5 8 128010 Carencro High 12-Sep 136 11 0 028011 Comeaux High 12-Sep 129 13 0 028012 K. Drexel Elem K-4 50 5 1 128013 Duson Elem K-5 34 3 1 128040 Evangeline Elem K-4 75 6 7 128014 J.W.Faulk Elem K-5 78 8 0 028048 Ernest Gallet Elem. K-5 117 6 7 128016 Judice Middle 8-Jun 64 6 0 028017 L.Leo Judice Elem K-1 48 3 0 028018 Lafayette Middle 8-Jun 83 11 0 028019 Lafayette High 12-Sep 176 20 404 1628021 G.T.Lindon Elem K-4 79 2 4 128049 Live Oak Elem. K-5 88 6 7 128022 E.Martin Middle 8-May 51 8 0 028023 Milton Elem K-8 68 2 1 128024 S.J.Montgomery El. K-5 121 12 4 128000 Moss ANNEX PCC/SEAS/Homebd 66 32 0 028025 N.P.Moss Middle 8-Jun 101 9 0 028026 Myrtle Place Elem K-5 66 6 56 428027 Northside High 12-Sep 108 13 0 028028 Ossun Elem K-5 62 5 12 128029 Plantation Elem K-5 86 5 104 628030 Prairie Elem K-5 101 6 30 228039 Ridge Elem K-5 65 2 7 128032 Scott Middle 8-May 128 13 0 028033 Truman Elem K-5 49 6 0 028034 Vermilion Elem K-5 37 3 0 028035 W. D. Smith Career Center 12-Sep 2 3 0 028036 Westside Elem 4-Feb 73 4 9 128037 Woodvale Elem K-4 82 5 72 728038 Youngsville Md 8-May 63 5 0 0
Totals 3340 322 1301 74
CODES/SCHOOLS/GRADE LEVEL # of Sp. Ed. Students & Teachers/# of Gifted Students & Teachers
(March 2002)

Draft8-May-02
Revenues1. Sales Tax - 1.5% Increase ('65 & '88 (excluding increase to other funds) 464,616 2. Property Tax - 5% Increase 1,209,569 3. Projected MFP Increase 1,835,298 4. Other Revenues (338,455) 5. Medicaid Administrative Outreach 300,000 6. Adjudicated Property - Property Tax Revenue ?
Total-To-Date: $ 3,171,028
Expenditures1. Health Care Increase 2,120,335 2. State Certificated Raises 1,064,300 3. Two Teacher In-Service Days - Shift from 1988 Tax 825,000 4. Student Remediation - Shift from 1988 Tax 120,000 5. 2:0 FTE Librarians for 4 Schools (Approved on 3/20/02) 100,000 6. Library Books for 4 Schools 116,000 7. James School Admin Staffing ?8. Schools of Choice ?9. Reorganization ?
10. Staff Raises ?11. Staff Compensation - Equity Adjustments ?12. Assistant Principals - 4.0 FTE for 6 Schools 225,000 13. Extra-Curricular Activity Stipends - Increase 96,311 14. New Bus Routes ?15. Transportation - Driver Operational Allowance (20 cents) 331,038 16. Substitute Teacher - Pay Rate Increase ?17. Debt Service on New Facility Bonds 491,449 18. Debt Service on New Busses 200,000
Total-To-Date: 5,689,433$
Changes in Revenues & Expenditures (Preliminary)
Lafayette Parish School System
FY 2002-2003 General Fund Budget Review/Status

Certified Substitute Teachers Question: Are certified substitute teachers eligible for raises for the 2002 sales tax? Answer: The Administrative Plan for the 2002 sales tax was adopted by the School Board on October 24, 2001. The Administrative Plan included the following definition of eligible employees for the raise:
“Equal Percentage Increases in Same” (i.e. classroom teacher salaries) – This category is defined to include the following:
Percentage increases (i.e. raises) for all classroom teachers as defined by the State Department of Education. These raises would include 2144 regular and special education teachers and would include any full-time employee of the parish school board who is engaged to provide instruction directly and regularly to students in any elementary, secondary, or special education school setting including a librarian, an assessment teacher, a speech therapist, and a counselor: one who is not an administrator; and who has successfully completed the Teacher Assistance and Assessment Program or who is not required to participate in the Teacher Assistance and Assessment Program.

Requested NotesRevenue:
Projected Fund Balance @ 6/30/2002 20,604 (1)
Sales Tax Revenue 575,000 Interest Income 70,000 Rent, Leases & Royalties 34,748 Transfer from Debt Service Fund 500,000
Total Revenues 1,200,352$
Expenditures:
See Schedule 1 8,018,908
Total Expenditures 8,018,908$
Projected Fund Balance @ 6/30/2003 (6,650,556)$
Note (1)The proposed budget has been prepared under the assumption that all funds appropriatedthrough 2001/02 will be expended by June 30, 2002. Any carry-over funding will be addressed at a later date once that determination has been made.
LPSB CAPITAL IMPROVEMENT FUND2002/2003
PROPOSED BUDGETRev. May 7, 2002

Revised 5/7/02
RequestedPortable Building Lease Payments 416,000 Other Portable Costs 20,000 Portable Building Relocation 100,000 Adult Ed - (1) Double classroom portable building 23,550 Computer Services
AS/400 - Maintain performance standards 10,240 Hardware Upgrades 33,040 AS/400 - Optical Archival/Retrieval Sub-System 33,651
Maintenance Department Operations Division (See Schedule 2) 826,500 Physical Plant & Grounds Division ( See Schedule 2) 259,500
Transportation Department14 Regular Ed and 10 Special Ed Buses 1,404,000 Communication Devices(cell phones/Radio) for all buses 138,600 Zepco ZTR On-Board Trip recorders (100) 169,993
Band Uniform Replacement, Northside High 70,000 Computer Lab Upgrade, Technology Department 36,877 Vocational Department
Business Application Lab, High School 130,000 Industrial Technology Lab, High School 40,000 Industrial Technology Lab, Middle School 25,000 Family & Consumer Science Programs, Middle School 36,000 Alternative Education Presentation Systems, Middle School 18,000
Finance DepartmentComputer Software/Hardware Updates and Replacements 10,000
Human Resources Embossing Machine for Substitute Cards 7,000 Planning & Facilities, (See Schedule 3) 2,939,000 Replacement of Piano Lab/L.J. Alleman Arts Academy 36,000 Computer Science Lab, Comeaux High 66,440 Physical Education Department Volleyball Net Systems, High School 13,050 Lockers, Girls Athletics - Carencro & Comeaux High School 123,467 Other Requests - (Schedule 4) 1,028,000 Audit Fees 5,000
Total Expenditures 8,018,908$
LPSB CAPITAL IMPROVEMENT FUND2002/2003Schedule 1
All Departments Proposed Budget

Revised 5/7/02 Requested
Operations DivisionSchool-Site Projects:
(1) Metal Storage Building, Myrtle Place Elementary 20,000$
Press Box for Baseball Stadium/NHS 35,000
Stadium Light Rewiring 50,000
Electrical Upgrade Assessment Study 100,000
Chiller Replacements (4), Westside & Paul Breaux 220,000
HVAC Upgrades, Vermillion Elem. 45,000
Drainage Project - G. T. Lindon Elementary 30,000
Fire Alarm Upgrade - Parish Wide 50,000
Water heater replacement, Carencro High 30,000
Auto Bus Fleet Projects:
(3) School Bus Engines 30,000
(2) School Bus Transmissions 9,000
(3) Wheel Chair Lifts 13,500
Maintenance Department Projects:
(1) 3/4 ton 4 X 4 truck, Electrical Department 25,000
(1) 3/4 ton van, Electrical Department 25,000
(1) 1 ton van, Locksmith Department 25,000
(1) 3/4 ton truck, Carpentry Dept. 25,000
(1) 1 ton van, Painting Department 19,000
(1) 3/4 ton truck, HVAC Department 25,000
(1) 1 ton pickup, Plumbing Department 25,000
(1) 3/4 ton 4 X 4 pickup truck, Auto Mechanic 25,000
Total Operations 826,500$
Physical Plant & Grounds Division
(1) 1/2 ton truck - Coordinator 12,832$
(30) Upright Vacuum Cleaners 10,000
(10) 20" Floor Scrubbing Machines 16,500
(10) 20" Floor Burnishers 18,000
(20) Push-Type Mowers 12,000
(5) Zero-Turn Mowers 32,055
(8) 25 Horsepower Kohler Engines 10,600
(8) Gravely Mower Deck Assemblies 11,200
(220) Floor Mats Entrance/Exit 19,333
(4) Lawn Tractors Excel Hustler Type 49,980
(20) Gravely PTO Clutch Assembly 12,000
(1) Tractor/Front End Loader 25,000
(1) PPG/Warehouse Loading Dock 10,000
(1) PPG/Warehouse Storage 20,000
Total Physical Plant & Grounds 259,500$
Grand Total, All Divisions 1,086,000$
LPSB CAPITAL IMPROVEMENT FUND2002/2003Schedule 2
Maintenance/All Divisions, Department Projects
Revised. 5/7/02
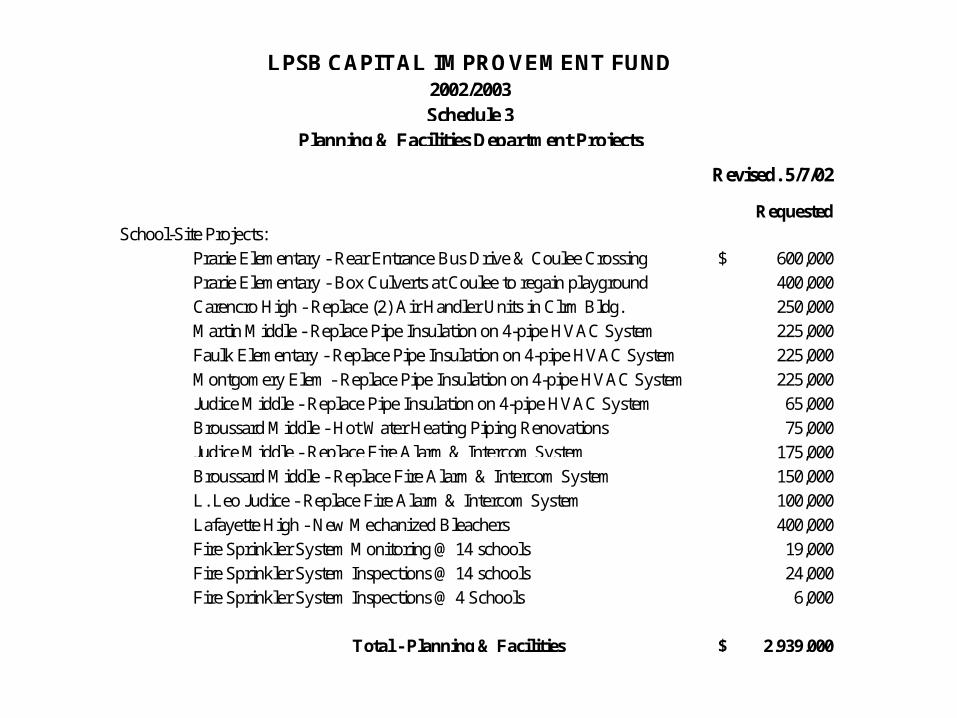
RequestedSchool-Site Projects:
Prarie Elementary - Rear Entrance Bus Drive & Coulee Crossing 600,000$
Prarie Elementary - Box Culverts at Coulee to regain playground 400,000
Carencro High - Replace (2) Air Handler Units in Clrm Bldg. 250,000
Martin Middle - Replace Pipe Insulation on 4-pipe HVAC System 225,000
Faulk Elementary - Replace Pipe Insulation on 4-pipe HVAC System 225,000
Montgomery Elem - Replace Pipe Insulation on 4-pipe HVAC System 225,000
Judice Middle - Replace Pipe Insulation on 4-pipe HVAC System 65,000
Broussard Middle - Hot Water Heating Piping Renovations 75,000
Judice Middle - Replace Fire Alarm & Intercom System 175,000
Broussard Middle - Replace Fire Alarm & Intercom System 150,000
L. Leo Judice - Replace Fire Alarm & Intercom System 100,000
Lafayette High - New Mechanized Bleachers 400,000
Fire Sprinkler System Monitoring @ 14 schools 19,000
Fire Sprinkler System Inspections @ 14 schools 24,000
Fire Sprinkler System Inspections @ 4 Schools 6,000
Total - Planning & Facilities 2,939,000$
LPSB CAPITAL IMPROVEMENT FUND2002/2003Schedule 3
Planning & Facilities Department Projects

LPSB CAPITAL IMPROVEMENT FUND2002/2003
Other RequestsSchedule 4
Revised 5/7/02
Concession stand at baseball/softball field - Comeaux High 35,000$
New bleachers in girls gym - Comeaux High 75,000
Concession stand under football stadium - Comeaux High 100,000
New lockers - Comeaux High 200,000
Resurfacing of track - Comeaux High 400,000
Portable building for science program - Milton Elem. 50,000
Telephone system switch 168,000
1,028,000$