budget highlights fy 15 revised budget - c g a€¦ · budget highlights fy 15 revised budget may...
TRANSCRIPT

BUDGET HIGHLIGHTS
FY 15 Revised Budget
May 7, 2014
OFFICE OF FISCAL ANALYSIS Room 5200, Legislative Office Building
Hartford, CT 06106 ● (860) 240-0200 E-Mail: [email protected] www.cga.ct.gov/ofa
Table of Contents
I. OVERVIEW ............................................................................................................................... 1
II. FINANCIAL SUMMARY....................................................................................................... 3
Fund Balance ............................................................................................................................. 3
Expenditure Summary ............................................................................................................. 3
Spending Growth ..................................................................................................................... 4
Spending Cap ............................................................................................................................ 5
Budget Reserve Fund ............................................................................................................... 6
Other Major Highlights ........................................................................................................... 7
III. MAJOR BUDGET CHANGES ............................................................................................ 10
IV. SIGNIFICANT REVENUE CHANGES ............................................................................ 15
V. MUNICIPAL AID ................................................................................................................. 18
VI. SIGNIFICANT CAPITAL BUDGET CHANGES ............................................................ 21
VII. APPENDIX A: Authorized Position Table ..................................................................... 25
VIII.APPENDIX B: FY 15 Appropriations by Expenditure Type (table and chart) ......... 28
FY 15 Appropriated Funds Revenue (table and chart) ....................... 29
IX.APPENDIX C: All Appropriated Funds Revenue FY 15 Estimates ............................. 30

1
This document is intended to provide highlights of the FY 15 Revised Budget. It is not intended to be all inclusive. OFA will be producing a detailed document (Budget Book) based on the FY 15 Revised Budget (HB 5596, as amended by House A, and HB 5597) that will include a detailed compilation of agency budget changes and financial schedules.
I. OVERVIEW Budget Balance - The original FY 15 budget contained a $3.1 million General Fund balance. The FY 15 Revised Budget reduces that balance to $0.4 million. Budget Growth - Original FY 15 budget appropriations grew over original FY 14 appropriations by 1.8% in the General Fund (2.1% all funds). The Revised Budget has a growth rate of 2.0% in the General Fund (2.5% all funds) when comparing FY 15 revised appropriations to FY 14 estimated expenditures. Spending Cap - The FY 15 Revised Budget is under the spending cap by $25.9 million. Compared to the original FY 15 budget, it reduces room under the spending cap by $9 million in FY 14 and $140.3 million in FY 15. Of the change in FY 15, $106.1 million is due to a reduction in the allowable growth rate.
FY 14 Surplus/Budget Reserve Fund (BRF) - The FY 15 Revised Budget carries forward $6.5 million in FY 14 funding for use in FY 15. Of this amount, $5.2 million reduces the estimated surplus in FY 14 to $41.9 million. The remainder of the surplus, pending any additional carry forwards authorized within OPM’s statutory authority, would be deposited to the Budget Reserve Fund. As a result, the balance in the BRF would increase from $270.7 million to $312.6 million. Revenue - The budget includes various policy changes that yield a net revenue increase of $54.5 million in FY 15. This includes total decreases in taxes of $22.8 million and total increases in taxes of $86.5 million, of which $75 million is related to a tax collection initiative. Also included are reductions in other revenue categories of $45.7 million and increases in other sources of revenue of $36.6 million. Bonding - The original FY 15 capital budget provided $2,026.1 million in General Obligation (GO) bonds and $588.7 million in Special Tax Obligation (STO) bonds. The 2014 revisions to the capital budget provide a net total of $781.4 million in GO bonds (a 39% increase) and $17.6 million in STO bonds (a 3% increase). The revisions move the state closer to the statutory bond cap on GO bonds by 6.5%, from 80.2% to 86.7%.

2
New Positions - The Revised Budget adds 490 positions and approximately $38.8 million (all funds) across various agencies. Town Aid - The FY 15 Revised Budget increases funding for town aid by $56 million over the original FY 15 budget, which includes $21.1 million for property tax relief and $18.7 million for education. Lapse (Bottom-Line) Reductions - The Revised Budget reduces the total amount of lapses by a net $26.4 million. However, it distributes $25 million of the lapses into agency budgets based on prior year distributions resulting in an overall net decrease in lapse related reductions of $1.4 million.

3
II. FINANCIAL SUMMARY The table below compares revenue estimates to expenditures for the FY 15 Revised Budget.
FY 15 Revised Budget Fund Balance1 (in millions)
Fund Revenue $ Appropriations $ Surplus/
(Deficit) $
General 17,458.1 17,457.7 0.4
Transportation 1,328.4 1,321.6 6.8
Other Appropriated 216.2 214.5 1.7
TOTAL 19,002.7 18,993.7 8.9 1Estimates may not appear to add up due to rounding.
The table below compares original FY 15 appropriations to the FY 15 Revised Budget for the nine appropriated funds. The General Fund is $39.9 million below original appropriations and $1.7 million below on an all funds basis.
FY 15 Revised Expenditure Changes
Item Original $ Revised $ Revised - Original $
Gross Appropriations
General Fund 17,656,098,266 17,589,782,390 (66,315,876)
Special Transportation Fund 1,333,312,395 1,332,563,162 (749,233)
Banking Fund 27,845,849 28,791,624 945,775
Insurance Fund 31,968,453 68,344,562 36,376,109
Consumer Counsel and Public Utility Control Fund 25,384,201 25,589,345 205,144
Workers' Compensation Fund 24,789,229 26,157,484 1,368,255
Mashantucket Pequot and Mohegan Fund 61,779,907 61,779,907 -
Regional Market Operation Fund 941,498 1,029,273 87,775
Criminal Injuries Compensation Fund 2,787,016 2,787,016 -
Total Gross Appropriations 19,164,906,814 19,136,824,763 (28,082,051)
General Fund (GF) Lapses
Unallocated Lapse (91,676,192) (91,676,192) -
Unallocated Lapse - Legislative (3,028,105) (3,028,105) -
Unallocated Lapse - Judicial (7,400,672) (7,400,672) -
General Other Expenses Reductions - Legislative (140,000) - 140,000
General Other Expenses Reductions - Executive (3,312,000) - 3,312,000
General Other Expenses Reductions – Judicial (548,000) - 548,000

4
Item Original $ Revised $ Revised - Original $
General Lapse - Executive (13,785,503) (9,678,316) 4,107,187
General Lapse - Judicial (401,946) (282,192) 119,754
General Lapse - Legislative (56,251) (39,492) 16,759
Municipal Opportunities and Regional Efficiencies Program (10,000,000) (10,000,000) -
GAAP Lapse (7,500,000) - 7,500,000
Statewide Hiring Reduction - Executive (16,675,121) (8,060,000) 8,615,121
Statewide Hiring Reduction - Judicial (3,434,330) (1,660,000) 1,774,330
Statewide Hiring Reduction - Legislative (579,285) (280,000) 299,285
Total GF Lapses (158,537,405) (132,104,969) 26,432,436
Transportation Fund (TF) Lapses
Unallocated Lapse (11,000,000) (11,000,000) -
Total TF Lapses (11,000,000) (11,000,000) -
Net Appropriations
General Fund 17,497,560,861 17,457,677,421 (39,883,440)
Special Transportation Fund 1,322,312,395 1,321,563,162 (749,233)
Banking Fund 27,845,849 28,791,624 945,775
Insurance Fund 31,968,453 68,344,562 36,376,109
Consumer Counsel and Public Utility Control Fund 25,384,201 25,589,345 205,144
Workers' Compensation Fund 24,789,229 26,157,484 1,368,255
Mashantucket Pequot and Mohegan Fund 61,779,907 61,779,907 -
Regional Market Operation Fund 941,498 1,029,273 87,775
Criminal Injuries Compensation Fund 2,787,016 2,787,016 -
TOTAL NET APPROPRIATIONS 18,995,369,409 18,993,719,794 (1,649,615)
Growth Rate The FY 15 Revised Budget growth rate for the General Fund is 2% and for all appropriated funds is 2.5% over the FY 14 estimated expenditures. See the table below for details.
Growth Rates of Appropriations (in millions)
Fund FY 14 Estimated Expenditures $
FY 15 Original $
FY 15 Revised $
Change From FY 14 Estimated to FY
15 Revised
General 17,108.1 17,497.6 17,457.7 349.6 2.0%
Transportation 1,243.2 1,322.3 1,321.6 78.4 6.3%
Other Appropriated 174.6 175.5 214.5 39.9 22.8%
TOTAL 18,525.9 18,995.4 18,993.7 467.8 2.5%

5
Spending Cap The FY 15 Revised Budget is under the spending cap by $25.9 million. Compared to the original FY 15 budget, it reduces room under the spending cap by $9 million in FY 14 and $140.3 million in FY 15. Of the change in FY 15, $106.1 million is due to a reduction in the allowable growth rate.
FY 15 Revised Statutory Spending Cap Calculations (in millions)
Item Revised FY 14 $
Revised FY 15 $
All Appropriated Funds - Prior Year 20,685.0 18,606.5
Less Medicaid net appropriation (14)/SSMF (15) - base adjustment 2,225.3 3.2
Extraordinary spending - -
Prior Year Appropriations 18,459.8 18,603.4
Less Prior Year "Non-Capped" Expenditures
Debt Service 2,328.9 2,174.6
Statutory grants to distressed municipalities1 1,550.6 1,527.5
Prior Year "Non-Capped" Expenditures 3,879.6 3,702.1
Total "capped" expenditures 14,580.2 14,901.2
Times the 5-year average growth in personal income 1.8% 1.7%
= Allowable "capped" growth 261.1 258.8
Allowable Capped Expenditures 14,841.3 15,160.0
Plus Current Year "Non-Capped" Expenditures
Debt service 2,174.6 2,261.1
Federal mandates and court orders (new funding) 61.7 20.4
Statutory grants to distressed municipalities 1,529.3 1,578.2
Current Year "Non-Capped" Expenditures 3,765.7 3,859.6
Expenditures Allowed Under the Cap 18,606.9 19,019.6
Appropriation for this year2 18,606.5 18,993.7
TOTAL OVER/(UNDER) THE SPENDING CAP (0.4) (25.9) 1FY 15 is adjusted to reflect new distressed grant percentages.
2FY 14 is adjusted to reflect the deficiency appropriations contained in HB 5596.

6
Budget Reserve Fund The current balance in the Budget Reserve Fund (BRF) is $270.7 million. The budget assumes that the FY 14 surplus of $41.9 million will be deposited into the BRF, bringing the FY 15 beginning BRF balance to a projected $312.6 million. The FY 15 Revised Budget is projected to have a $0.4 million surplus; depositing this into the BRF would result in an estimated FY 15 ending balance of $313.0 million. The table below displays activity and balances in the BRF from FY 00 – FY 13, the estimated BRF deposit for FY 14 and the projected deposit in FY 15.
Budget Reserve Fund Activity and Balance: FY 00 – FY 15 (in millions)
Fiscal Year Beginning Balance $
Deposits/ (Withdrawals) $
Ending Balance $
00 529.1 34.9 564.0
01 564.0 30.7 594.7
02 594.7 (594.7) -
03 - - -
04 - 302.2 302.2
05 302.2 363.8 666.0
06 666.0 446.5 1,112.5
07 1,112.5 269.2 1,381.7
08 1,381.7 - 1,381.7
09 1,381.7 - 1,381.7
10 1,381.7 (1,278.5) 103.2
11 103.2 (103.2) -
12 - 93.5 93.5
13 93.5 177.2 270.7
14 Est. 270.7 41.9 312.6
15 Proj. 312.6 0.4 313.0

7
Other Major Highlights Office of Early Childhood (OEC) The budget contains new funding in the Office of Early Childhood for various initiatives. These include: 1) Expanding Pre-Kindergarten Seats - Funding totaling $11.7 million is provided to
increase Pre-K seats and subsidies as outlined below.
Funding of $2.2 million is provided for existing full-day, full-year school readiness seats at an increased rate of $8,670;
Carry forward funding of $2.3 million is provided for start-up costs for each classroom as well as planning grants;
Funding of $7.2 million is provided for 1,020 new seats and rate increases.
2) Administering the Smart Start Program - Funding of $527,682 is provided to support three staff and related expenses to administer the smart start competitive grant program to establish or expand public Pre-K.
3) Enhancing Licensing and Inspections - Funding of $1.1 million is included for nine
new staff to support background checks and 19 new licensing inspections staff to support increasing the frequency of licensing. Three positions and related funding of $373,196 for youth camp regulation is also transferred from the Department of Public Health.
4) Establishing a Quality Rating & Improvement System - Funding of $2.2 million is provided for six additional staff to support QRIS as well as grant and contract funds.
Position Adds in OEC
Title Number
Smart Start Administration 3
Child Care Licensing 19
Background Checks 9
Transfer of Youth Camp Regulation 3
Quality Rating & Improvement System 6
TOTAL 40

8
Board of Regents for Higher Education - Transform CSCU 2020 The budget includes $42 million ($23 million in General Fund appropriations and a $19 million transfer from the CT Student Loan Foundation) for the Board of Regents for Higher Education to implement Transform CSCU. The table below reflects the funding distribution:
Transform CSCU (in millions)
Item Amount $
Operations & Tuition Support 24.2
Developmental Education 10.8
Go-Back-To-Get-Ahead 6.0
Early College 1.0
TOTAL 42.0
The BOR is composed of the Connecticut State University System, the Regional Community College System and Charter Oak State College. Transform CSCU 2020 is intended to increase enrollments and provide for workforce development. Additionally, the proposal includes an increase of $60 million in capital funding along with a redirection of $20 million of existing capital funds to make system-wide improvements for the BOR. Components of the program include:
Go-Back-to-Get-Ahead - Funding is provided to encourage Connecticut residents who have some college credits, but have not attained either an associate’s or bachelor’s degree, to return to the state universities, community-technical colleges or Charter Oak State College to complete their degrees. These funds will enable the BOR to identify and contact the targeted students and provide resources to give each student a customized road map for degree completion.
Tuition Incentive Program - Students who have been out of school for 18 months would receive up to three free classes at BOR colleges and universities, to match up to three classes for which they pay.
Early College Experience - Provide planning funds for a program to offer community college courses to high school students.
Developmental Education - Funding is provided to continue developmental programs and support to students in continuation of the programs which have existed since 2012.
Transform CSCU - Capital Program The Transform CSCU - Capital Program provides $60 million in capital funding in FY 15 for the following:
Begin to upgrade and consolidate student and financial information systems to provide for unified and simplified admissions, financial aid, registration and financial reporting system,

9
Improve the student learning environment with smart classroom technology,
Develop a system-wide master plan,
Implement deferred maintenance projects across the system’s campuses and
Construct a new Advanced Manufacturing Center at Asnuntuck Community College in Enfield.
In addition, $20 million of previously authorized capital funding for the Community College System for equipment, technology and deferred maintenance is transferred into this capital investment program to allow the BOR to further implement the improvements outlined above.

10
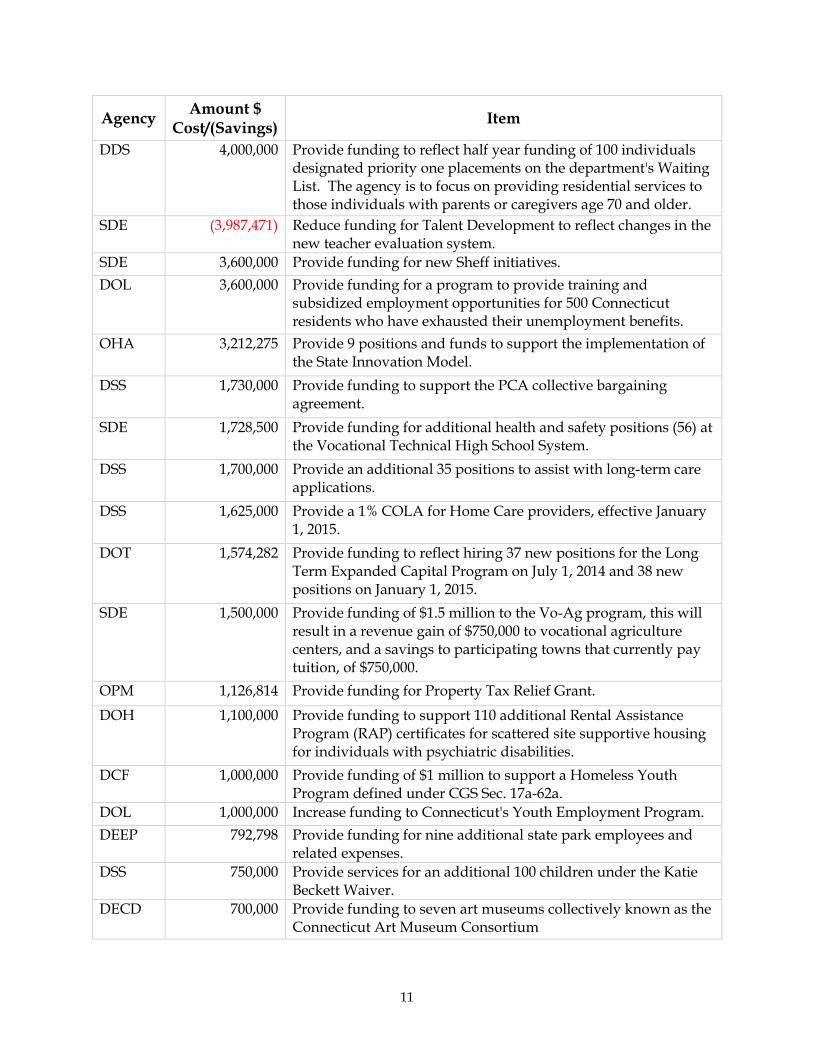
III. MAJOR BUDGET CHANGES The table below are significant changes by agency reflected increase/(decreases) from the original FY 15 budget.
Significant Changes by Agency
Agency Amount $
Cost/(Savings) Item
OTT (32,200,000) Reduce General Fund debt service by $32.2 million, which includes: (1) $20 million due to a $200 million reduction in the General Obligation (GO) bond issuance scheduled for June 2014, (2) $10.5 million for premiums received on the March 2014 GO bond issuance and (3) $1.7 million due to lower than anticipated interest rates received for the April 2014 issuance UConn 2000 bonds.
BOR 23,000,000 Provide funding totaling $42 million for Transform CSCU. This includes $19 million in funds transferred from the Connecticut Student Loan Foundation in addition to the $23 million appropriated funds. Funds will be utilized for operations and tuition support, developmental education and new programming intended to attract additional students.
SDE 13,500,000 Provide funding to roll out the FY 14 deficiency and increase magnet school enrollment. Total FY 15 impact to the Magnet School account is $32.6 million, of which $13.5 million is appropriated; $10.6 million of transfers and other revenue; and $8.5 million in savings from controlling enrollment levels.
DSS 10,000,000 Support reimbursement for primary care providers.
OPM 10,000,000 Provide additional funding for College & Hospital PILOT.
OPM 10,000,000 Provide additional funding for State Property PILOT.
OEC 9,380,719 Provide funding to increase the School Readiness full-day, full-year rate and the number of seats by 1,020.
OEC 8,494,625 Provide funding to support the family child care provider collective bargaining agreement.
SDE 8,253,890 Provide funding for ECS grant.
DOH 6,549,269 Re-open eligibility to the Renters' Rebate Program.
DSS 4,150,000 Provide rate increase for Medicaid mental health providers.
SDE 4,000,000 Provide funding to annualize the Sheff, April, 2013 stipulated agreement.
DESPP (4,000,000) Reduce PS to reflect savings from overtime initiatives in the division of state police.
11
Agency Amount $
Cost/(Savings) Item
DDS 4,000,000 Provide funding to reflect half year funding of 100 individuals designated priority one placements on the department's Waiting List. The agency is to focus on providing residential services to those individuals with parents or caregivers age 70 and older.
SDE (3,987,471) Reduce funding for Talent Development to reflect changes in the new teacher evaluation system.
SDE 3,600,000 Provide funding for new Sheff initiatives.
DOL 3,600,000 Provide funding for a program to provide training and subsidized employment opportunities for 500 Connecticut residents who have exhausted their unemployment benefits.
OHA 3,212,275 Provide 9 positions and funds to support the implementation of the State Innovation Model.
DSS 1,730,000 Provide funding to support the PCA collective bargaining agreement.
SDE 1,728,500 Provide funding for additional health and safety positions (56) at the Vocational Technical High School System.
DSS 1,700,000 Provide an additional 35 positions to assist with long-term care applications.
DSS 1,625,000 Provide a 1% COLA for Home Care providers, effective January 1, 2015.
DOT 1,574,282 Provide funding to reflect hiring 37 new positions for the Long Term Expanded Capital Program on July 1, 2014 and 38 new positions on January 1, 2015.
SDE 1,500,000 Provide funding of $1.5 million to the Vo-Ag program, this will result in a revenue gain of $750,000 to vocational agriculture centers, and a savings to participating towns that currently pay tuition, of $750,000.
OPM 1,126,814 Provide funding for Property Tax Relief Grant.
DOH 1,100,000 Provide funding to support 110 additional Rental Assistance Program (RAP) certificates for scattered site supportive housing for individuals with psychiatric disabilities.
DCF 1,000,000 Provide funding of $1 million to support a Homeless Youth Program defined under CGS Sec. 17a-62a.
DOL 1,000,000 Increase funding to Connecticut's Youth Employment Program.
DEEP 792,798 Provide funding for nine additional state park employees and related expenses.
DSS 750,000 Provide services for an additional 100 children under the Katie Beckett Waiver.
DECD 700,000 Provide funding to seven art museums collectively known as the Connecticut Art Museum Consortium

12
Agency Amount $
Cost/(Savings) Item
DSS 650,000 Provide funding to reduce the Acquired Brain Injury (ABI) Waiver wait list.
DVA 635,000 Provide $635,000 to the American Legion for administrative costs relating to managing the Soldiers', Sailors' and Marines' Fund.
DSS 600,000 Provide funding for an additional 50 slots under the Adults with Disabilities Pilot Program.
DOL 600,000 Provide funding for grants to housing agencies to hire employment specialists and job developers to seek job opportunities for veterans, as well as to support a statewide coordinator for veterans' services.
OLM 500,000 Provide funding for a comprehensive state and local study of Connecticut's tax system.
DEEP 400,000 Provide funding for the Action for Bridgeport Community Development Inc. (ABCD) weatherization program.
CME 340,000 Provide funding to support two full-time forensic pathologists.
DOL 300,000 Fund six new positions to increase enforcement of wage and workplace standards, including investigating complaints and ensuring compliance with wage and labor laws.

13
The table below identifies the 15 General Fund accounts having the most significant changes from the FY 15 original budget.
Significant Changes by Account (in millions)
Agency Account Amount $
OTT Debt Service (66.2)
OSC-Fringe Fringe Benefits (28.8)
DOH Tax Relief For Elderly Renters (24.9)
DCF Board and Care for Children - Residential (16.8)
DSS Medicaid (10.3)
PDS Assigned Counsel - Child Protection (7.4)
OPM Tax Relief For Elderly Renters 28.4
BOR Transform CSCU 23.0
Various Other Expenses 15.0
OEC Child Care Services-TANF/CCDBG 15.2
SDE Magnet Schools 12.5
SDE Sheff Settlement 11.5
OPM PILOT State Property 10.0
OPM PILOT Property 10.0
PDS Assigned Counsel - Criminal 8.9

14
The table below details the FY 15 lapses in the original and the revised budgets. The FY 15 Revised Budget reduced the lapses from the original by $26.4 million. The lapses are identified below with a brief explanation.
FY 15 Budget Lapses
Lapse Original $ Revised $ Difference $ Explanation
General Fund (GF) Lapses
Unallocated Lapse1 (102,104,969) (102,104,969) - This reduction reflects an adjustment to gross appropriation due to an anticipated level of under spending across all General Fund agencies and accounts.
General Other Expenses Reductions
(4,000,000) - 4,000,000 This reduction reflects savings in a manner to be determined by OPM such as the curtailing and delaying of purchase and various other yet undetermined reductions. All General Fund agency Other Expenses accounts could be subject to this reduction.
General Lapse1 (14,243,700) (10,000,000) 4,243,700 This reduction reflects savings in a manner to be determined by OPM. All General Fund agency accounts could be subject to this reduction.
Municipal Opportunities & Regional Efficiencies Program
(10,000,000) (10,000,000) - Savings to be achieved with a reduction in municipal aid as a result of various savings initiatives and efficiencies.
Statewide Hiring Reduction1
(20,688,736) (10,000,000) 10,688,736 Savings anticipated to be achieved by hiring reductions and other savings initiatives in a manner to be determined by OPM. All General Fund agency Personal Services accounts could be subject to this reduction.
GAAP Lapse (7,500,000) - 7,500,000 This reduction reflects adjustments across GAAP Accrual accounts in agencies to reflect a re-estimate of GAAP increases.
Total GF Lapses (158,537,405) (132,104,969) 26,432,436
Transportation Fund (TF) Lapses
Unallocated Lapse (11,000,000) (11,000,000) - This reduction reflects an adjustment to gross appropriation due to an anticipated level of under spending across Transportation Fund agencies and accounts.
Total TF Lapses (11,000,000) (11,000,000) -
TOTAL LAPSES (169,537,405) (143,104,969) 26,432,436 1The amounts shown are totals by category but the budget act contains a distribution of each by branch of government.

15
IV. SIGNIFICANT REVENUE CHANGES
HB 5596 includes various policy changes that yield a net revenue increase of $54.5 million in FY 15. The various policies are identified below. See Appendix C for the revenue estimates adopted by the Finance, Revenue and Bonding Committee on 5/3/14.
FY 15 General Fund Policy Revenue Changes1 (in millions)
Revenue Category Revenue Source Description of Change Budget $
Taxes Personal Income Tax Extend Angel Investor Tax Credit (3.0)
Taxes Sales & Use Tax Restore Sales Tax Exemption for Non-Prescription Drugs
(4.2)
Taxes Sales & Use Tax Delay Restoration of the Sales Tax Exemption on Clothing and Footwear that Costs Less than $50
11.5
Taxes Sales & Use Tax Provide Full FY 13 Payments through the Municipal Revenue Sharing Account
(12.7)
Taxes Sales & Use Tax Exempt “Sole Community Hospitals” (currently limited to Sharon Hospital) from the Sales and Use Tax
(0.6)
Taxes Public Service Tax Increase Funding for the Cable Television Network
(0.7)
Taxes Admissions & Dues Tax
Exempt XL Center in Hartford from the Admissions Tax
(1.0)
Taxes Admissions & Dues Tax
Exempt Webster Arena in Bridgeport from the Admissions Tax
(0.6)
Taxes Miscellaneous Tax Reflect Collection Initiative by the Department of Revenue Services
75.0
Subtotal Taxes 63.7
Other Revenue Transfers-Special Revenue
Repeal Authorization for Keno Gaming (13.5)
Other Revenue Licenses, Permits, Fees
Divert Additional Newborn Screening Fees to Expand the Newborn Screening Program
(0.6)
Other Revenue Licenses, Permits, Fees
Shift the Immunization Program Budget (Supported by Fees on Insurance Companies) from the General Fund to the Insurance Fund
(31.4)
Other Revenue Licenses, Permits, Fees
Provide Two-Day State Park Fee Holiday
(0.2)
Other Revenue Licenses, Permits, Fees
Divert Revenue from Death Certificate Fees to Support Neglected Cemeteries *($31,000)
(0.0)*
Subtotal Other Revenue (45.7)

16
Revenue Category Revenue Source Description of Change Budget $
Other Sources Federal Grants Recognize Federal Reimbursements for Enhanced Psychiatric Care - Solnit Center
3.8
Other Sources Federal Grants Recognize Increased Federal Match for Primary Care Rate Increases under Husky B
0.4
Other Sources Federal Grants Adjust Funding Source for the New Autism Waiver
0.5
Other Sources Federal Grants Recognize Federal Reimbursements for a Portion of Additional State Funding to Process Long-term Care Applications
0.4
Other Sources Federal Grants Recognize Federal Reimbursements for a Potion of Additional State Funding to Reduce Waiting Lists for Community Residential Services
2.2
Other Sources Federal Grants Recognize Federal Reimbursements for a Portion of Additional State Funding to Provide Wage Increases for Personal Care Assistants
0.2
Other Sources Transfer From Tobacco Settlement
Transfer from the 2013 Tobacco Settlement Reserved for a GAAP Adjustment in FY 14
14.0
Other Sources Transfer From Tobacco Settlement
Transfer FY 14 Surplus from the Tobacco Settlement Fund
5.5
Other Sources Transfers (To)/From Other Funds
Transfer from the Biomedical Research Trust Fund
1.0
Other Sources Transfers (To)/From Other Funds
Reflect Third Party Reimbursement for Enhanced Psychiatric Care - Solnit Center
2.0
Other Sources Transfers (To)/From Other Funds
Transfer from the Private Occupational Student Protection Account
0.5
Other Sources Transfers (To)/From Other Funds
Reduce the Scheduled General Fund Transfer to the Special Transportation Fund
2.1
Other Sources Transfers (To)/From Other Funds
Transfer from the Tobacco Health Trust Fund
4.0
Subtotal Other Sources 36.6
TOTAL 54.5 1Estimates may not appear to add up due to rounding.

17
In addition to the revenue items indicated above for FY 15, policy decisions during the 2014 regular session will impact revenue in future years.
PA 14-2, AAC the Connecticut Aerospace Reinvestment Act, established a credit exchange program for unused Research and Development tax credits which is anticipated to result in a cumulative revenue loss of approximately $400 million over the next 14 years beginning in FY 16. The Act limits annual revenue losses to $20 million in the first five years of the program increasing to $33.3 million in the sixth and subsequent years.
HB 5596 exempts a portion of teachers’ pension income from the Personal Income Tax. The exemption begins with Income Year 2015 (FY 16 revenue impact) at 10% of pension income, increases to 25% in Income Year 2016, increases again to 50% in Income Year 2017 and remains at that level thereafter. The annualized revenue loss (impacting FY 18 and beyond) at 50% is estimated to be $28.8 million.
HB 5597 the budget implementer, diverts $10 million annually from the tobacco
settlement fund that would otherwise be deposited into the General Fund. Under the bill, this diversion would occur for ten years beginning in FY 16. These diverted funds would be used to support the establishment or expansion of public preschool programs, as described in SB 25.
HB 5597 the budget implementer, allows pass-through business entities to sell,
assign, or transfer Apprenticeship Training tax credits earned under the manufacturing trades beginning on July 1, 2015. This results in an annual revenue loss of up to $620,000 beginning in FY 16.
HB 5597 the budget implementer, exempts the sales of goods and services to Connecticut credit unions from the sales and use tax, beginning in FY 17. The annual General Fund revenue loss is estimated to be $500,000. This revenue loss would be partially offset (on an all funds basis) by a revenue gain to the Banking Fund to the extent that more credit unions transfer to a state charter as a result of the sales tax exemption and pay the associated fees.

18
V. MUNICIPAL AID The FY 15 Revised Budget increases municipal aid by approximately $56 million over originally appropriated FY 15 levels. The most significant of these changes are an additional:
$12.5 million for Magnet Schools,
$12.7 million in Municipal Revenue Sharing Account funding to reimburse towns for funding they lost inadvertently when the MRSA account was terminated effective June 30, 2013,
$8.3 million for ECS grants,
$10 million for the State Property PILOT grant,
$10 million for the College & Hospital PILOT grant, and
$1.1 million for a Property Tax Relief grant. Of this appropriation, payments of $778,276 are intended to hold harmless any municipalities whose combined total State Property PILOT, College & Hospital PILOT, and Pequot grant payments in FY 15 are lower than in FY 14. Additional payments are also distributed to Montville ($345,327) and Norwich ($3,211).
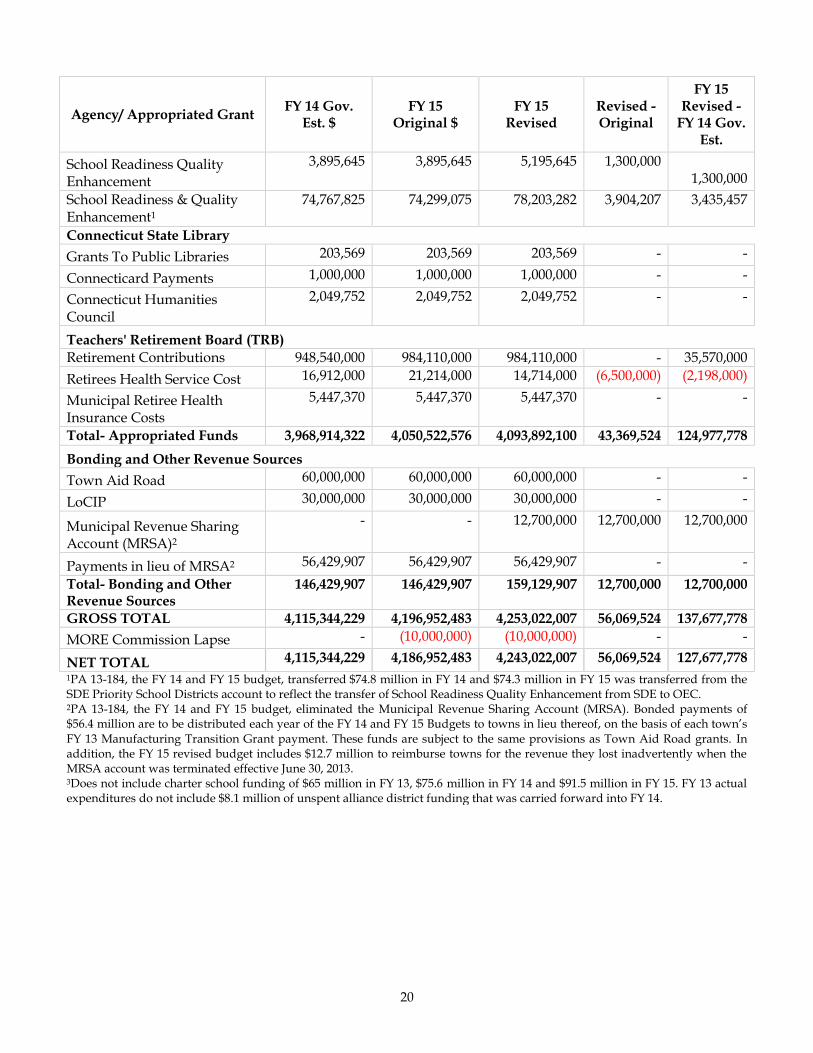
Summary of FY 15 Revised Municipal Aid
Agency/ Appropriated Grant FY 14 Gov.
Est. $ FY 15
Original $ FY 15
Revised Revised - Original
FY 15 Revised -
FY 14 Gov. Est.
Appropriated Funds
Office of Policy and Management (OPM)
State Property PILOT 73,641,646 73,641,646 83,641,646 10,000,000 10,000,000
College & Hospital PILOT 115,431,737 115,431,737 125,431,737 10,000,000 10,000,000
Reimbursement Property Tax - Disability Exemption
400,000 400,000 400,000 - -
Distressed Municipalities 5,800,000 5,800,000 5,800,000 - -
Property Tax Relief Elderly Circuit Breaker
20,505,900 20,505,900 20,505,900 - -
Property Tax Relief Elderly Freeze Program
235,000 235,000 171,400 (63,600) (63,600)
Property Tax Relief for Veterans
2,970,098 2,970,098 2,970,098 - -
Focus Deterrence 475,000 475,000 475,000 - -
Municipal Aid Adjustment 4,467,456 3,608,728 3,608,728 - (858,728)
Grants To Towns 61,779,907 61,779,907 61,779,907 - -
Property Tax Relief - - 1,126,814 1,126,814 1,126,814
Department of Housing (DOH)
Tax Abatement 1,444,646 1,444,646 1,444,646 - -
Payment In Lieu Of Taxes 1,873,400 1,873,400 1,873,400 - -

19
Agency/ Appropriated Grant FY 14 Gov.
Est. $ FY 15
Original $ FY 15
Revised Revised - Original
FY 15 Revised -
FY 14 Gov. Est.
Housing/Homeless Services - Municipality
640,398 640,398 640,398 - -
Department of Health (DPH)
Local and District Departments of Health
4,669,173 4,669,173 4,685,779 16,606 16,606
Venereal Disease Control 187,362 187,362 197,171 9,809 9,809
School Based Health Clinics 12,747,463 12,638,716 12,048,716 (590,000) (698,747)
Department of Social Services (DSS)
Human Resource Development-Hispanic Programs - Municipality
5,364 5,364 5,364 - -
Teen Pregnancy Prevention - Municipality
137,826 137,826 137,826 - -
Community Services - Municipality
83,761 83,761 83,761 - -
State Department of Education
Vocational Agriculture 9,485,565 9,485,565 10,985,565 1,500,000 1,500,000
Transportation of School Children
24,884,748 24,884,748 24,884,748 - -
Adult Education 21,033,915 21,045,036 21,045,036 - 11,121
Health and Welfare Services Pupils Private Schools
4,297,500 4,297,500 4,297,500 - -
Education Equalization Grants3
1,990,341,602 2,031,286,724 2,039,540,614 8,253,890 49,199,012
Bilingual Education 1,916,130 1,916,130 1,916,130 - -
Priority School Districts1 47,427,206 46,947,022 47,197,022 250,000 (230,184)
Young Parents Program 229,330 229,330 229,330 - -
Interdistrict Cooperation 9,146,369 9,150,379 9,242,379 92,000 96,010
School Breakfast Program 2,300,041 2,379,962 2,379,962 - 79,921
Excess Cost - Student Based 139,805,731 139,805,731 139,805,731 - -
Non-Public School Transportation
3,595,500 3,595,500 3,595,500 - -
School To Work Opportunities 213,750 213,750 213,750 - -
Youth Service Bureaus 2,989,268 2,989,268 2,989,268 - -
Open Choice Program 37,018,594 42,616,736 38,116,736 (4,500,000) 1,098,142
Magnet Schools 284,249,020 281,250,025 293,750,025 12,500,000 9,501,005
After School Program 4,500,000 4,500,000 5,093,286 593,286 593,286
Office of Early Childhood
Early Childhood Program 6,748,003 6,761,345 11,235,264 4,473,919 4,487,261
Child Care Services 18,419,752 18,419,752 19,422,345 1,002,593 1,002,593
20
Agency/ Appropriated Grant FY 14 Gov.
Est. $ FY 15
Original $ FY 15
Revised Revised - Original
FY 15 Revised -
FY 14 Gov. Est.
School Readiness Quality Enhancement
3,895,645 3,895,645 5,195,645 1,300,000 1,300,000
School Readiness & Quality Enhancement1
74,767,825 74,299,075 78,203,282 3,904,207 3,435,457
Connecticut State Library
Grants To Public Libraries 203,569 203,569 203,569 - -
Connecticard Payments 1,000,000 1,000,000 1,000,000 - -
Connecticut Humanities Council
2,049,752 2,049,752 2,049,752 - -
Teachers' Retirement Board (TRB)
Retirement Contributions 948,540,000 984,110,000 984,110,000 - 35,570,000
Retirees Health Service Cost 16,912,000 21,214,000 14,714,000 (6,500,000) (2,198,000)
Municipal Retiree Health Insurance Costs
5,447,370 5,447,370 5,447,370 - -
Total- Appropriated Funds 3,968,914,322 4,050,522,576 4,093,892,100 43,369,524 124,977,778
Bonding and Other Revenue Sources
Town Aid Road 60,000,000 60,000,000 60,000,000 - -
LoCIP 30,000,000 30,000,000 30,000,000 - -
Municipal Revenue Sharing Account (MRSA)2
- - 12,700,000 12,700,000 12,700,000
Payments in lieu of MRSA2 56,429,907 56,429,907 56,429,907 - -
Total- Bonding and Other Revenue Sources
146,429,907 146,429,907 159,129,907 12,700,000 12,700,000
GROSS TOTAL 4,115,344,229 4,196,952,483 4,253,022,007 56,069,524 137,677,778
MORE Commission Lapse - (10,000,000) (10,000,000) - -
NET TOTAL 4,115,344,229 4,186,952,483 4,243,022,007 56,069,524 127,677,778
1PA 13-184, the FY 14 and FY 15 budget, transferred $74.8 million in FY 14 and $74.3 million in FY 15 was transferred from the SDE Priority School Districts account to reflect the transfer of School Readiness Quality Enhancement from SDE to OEC. 2PA 13-184, the FY 14 and FY 15 budget, eliminated the Municipal Revenue Sharing Account (MRSA). Bonded payments of $56.4 million are to be distributed each year of the FY 14 and FY 15 Budgets to towns in lieu thereof, on the basis of each town’s FY 13 Manufacturing Transition Grant payment. These funds are subject to the same provisions as Town Aid Road grants. In addition, the FY 15 revised budget includes $12.7 million to reimburse towns for the revenue they lost inadvertently when the MRSA account was terminated effective June 30, 2013. 3Does not include charter school funding of $65 million in FY 13, $75.6 million in FY 14 and $91.5 million in FY 15. FY 13 actual expenditures do not include $8.1 million of unspent alliance district funding that was carried forward into FY 14.

21
VI. SIGNIFICANT CAPITAL BUDGET CHANGES The revised FY 15 capital budget: (1) authorizes $968.7 million in new General Obligation (GO) bonds between FY 14 and FY 24 and cancels $33.8 million in previously authorized GO bonds and (2) authorizes $77.6 million in new Special Tax Obligation (STO) bonds in FY 15 and cancels $60 million in STO bonds. The table below lists major changes to GO and STO bond authorizations.
Significant Capital Changes by Agency (in millions)
Description of Change FY 15
Revised $
General Obligation Bonds
Office of the State Comptroller
Enhancements and upgrades to the CORE financial system for the retirement module.
50.0
Enhancements and upgrades to the CoreCT HR system at the University of Connecticut.
7.0
Grant-in-aid to the Connecticut Public Broadcasting Network for transmission, broadcast, production and information technology equipment.
3.3
Office of Policy and Management
Information technology capital investment program. 25.0
Grants-in-aid to private, nonprofit health and human service organizations for alterations, renovations, improvements, additions and new construction, including health, safety, compliance with the Americans with Disabilities Act and energy conservation improvements, information technology systems, technology for independence and purchase of vehicles and acquisition of property.
30.0
Urban Action Program. 80.0
Transit-oriented development and predevelopment activities. 7.0
Department of Administrative Services
Land acquisition, construction, improvements, repairs and renovations at fire training schools.
15.8
Office of the Healthcare Advocate
Development, acquisition and implementation of Health Information Technology systems and equipment in support of the State Innovation Model.
1.9
Department of Labor
Subsidized Training and Employment program (STEP). 10.0
Department of Energy and Environmental Protection

22
Description of Change FY 15
Revised $
Grants-in-aid or loans to municipalities for acquisition of land, public parks, recreational and water quality improvements.
20.0
Funding for the Public, Educational and Governmental Programming and Educational Technology Investment Account (PEGPETIA).
3.5
Purchase of The Preserve in conjunction with the Trust for Public Land 2.0
Department of Economic and Community Development
Manufacturing Assistance Act. 100.0
Connecticut Advanced Manufacturing Fund. 30.0
Grants-in-aid to nonprofit organizations sponsoring cultural and historic sites.
10.0
Grants-in-aid to the Science Center in Hartford and the Maritime Aquarium in Norwalk.
17.1
Grant-in-aid to the Hartford Economic Development Corporation for a grant and revolving loan program for small and minority-owned businesses in urban areas.
5.0
Grant-in-aid to the Northeast Connecticut Economic Development Alliance.
2.0
Connecticut Innovations, Inc.
Regenerative Medicine Research Fund (formerly the Stem Cell Research Fund) - Provide $10 million in each of FY 16, FY 17, FY 18 & FY 19.
-
Capital Region Development Authority
Grant-in-aid for the purpose of encouraging development as provided in CGS Sec. 32-602.
30.0
Department of Housing
Shoreline Resiliency Fund. 25.0
Housing development and rehabilitation programs. 20.0
Department of Public Health
Grants-in-aid to public water systems for drinking water projects. 50.0
Department of Rehabilitation Services
Grant-in-aid for home modifications and assistive technology devices related to aging in place.
6.0
Department of Education
School Security Infrastructure Grant Program. 22.0
Grants-in-aid for the purpose of capital start-up costs related to the development of new interdistrict magnet school programs to assist the state in meeting the goals of the Sheff v. O'Neill settlement, for the purpose of purchasing a building or portable classrooms, leasing space, and purchasing equipment, including, but not limited to, computers and classroom furniture.
9.9
Grants-in-aid for alterations, repairs, improvements, technology, equipment and capital start-up costs, including acquisition costs, to
10.0

23
Description of Change FY 15
Revised $
expand the availability of high-quality school models, and assist in the implementation of common CORE state standards and assessments.
Office of Early Childhood
Smart Start (Pre-K) competitive grant program. 15.0
State Library
Creation and maintenance of a state-wide platform for the distribution of electronic books to public library patrons.
2.2
Board of Regents: Connecticut State University System
CSUS 2020. 80.0
Department of Transportation
Grants-in-aid for improvements to deep water ports, including dredging. 20.0
Transfer Town Aid Road from STO bond funds to GO bond funds. 60.0
Competitive grant program for commercial rail freight lines. 10.0
Special Tax Obligation Bonds
Environmental compliance, soil and groundwater remediation, hazardous materials abatement, demolition, salt shed construction and renovation, storage tank replacement, and environmental emergency response at or in the vicinity of state-owned properties or related to Department of Transportation operations.
6.7
Local Bridge Program. 10.0
Transfer Town Aid Road from STO bond funds to GO bond funds. (60.0)
Highway and bridge renewal equipment. 5.4
Development of a comprehensive asset management plan in accordance with federal requirements.
10.0
Bus and rail facilities and equipment, including rights-of-way, other property acquisition and related projects.
17.7
Bond Cap The FY 15 revised bond package is below the statutory bond cap on General Obligation bonds, based on net tax revenue estimates adopted by the Finance, Revenue and Bonding Committee on May 3, 2014. The table below shows that the cap calculations provided by the Office of the State Treasurer for January 1, 2014 and for July 1, 2014. The calculations show that bonding on January 1, 2014 was at 80.2% of the cap. Based on the revised FY 15 bond package and the new net tax revenue estimates adopted on May 3, 2014, the level would increase by 6.5%, to 86.7% on July 1, 2014. CGS Section 3-21 stipulates that if the level of bonded indebtedness reaches 90% of the ceiling amount, the governor must review each bond act for which no obligations have yet been incurred and recommend to the General Assembly priorities for repealing these authorizations.

24
Statutory Bond Cap for the FY 15 Revised Bond Package (in thousands)
Calculations As of
January 1, 2014 $ As of
July 1, 2014 $
Net Tax Revenues1 14,334,000 14,915,900
Multiplier 1.6 1.6
Debt Limit 22,934,400 23,865,440
Calculation of Bonds Subject to Debt Limit
Net Indebtedness 18,401,073 20,692,333
80.2% 86.7%
Debt Incurring Margin 4,533,327 3,173,107
90% Limit 20,640,960 21,478,896
Debt Incurring Margin to 90% Limit
2,239,887 786,563
1 The net tax revenue figures adopted by the Finance Committee on May 3, 2014.

25
VII. APPENDIX A
FY 15 Revised Budget – Authorized Position Summary
Fund/Agency Original Revised Revised Original
General Fund
African-American Affairs Commission 3 3 -
Agricultural Experiment Station 69 70 1
Asian Pacific American Affairs Commission 2 2 -
Attorney General 303 303 -
Auditors of Public Accounts 117 117 -
Board of Regents for Higher Education 4,614 4,617 3
Commission on Aging 4 4 -
Commission on Children 7 7 -
Commission on Human Rights and Opportunities 79 79 -
Council on Environmental Quality 2 2 -
Department of Administrative Services 650 656 6
Department of Agriculture 49 49 -
Department of Children and Families 3,208 3,240 32
Department of Construction Services - - -
Department of Consumer Protection 235 235 -
Department of Correction 6,352 6,352 -
Department of Developmental Services 3,327 3,327 -
Department of Economic and Community Development 91 91 -
Department of Education 1,714 1,779 65
Department of Emergency Services and Public Protection 1,694 1,733 39
Department of Energy and Environmental Protection 669 670 1
Department of Housing 20 21 1
Department of Mental Health and Addiction Services 3,309 -
Department of Motor Vehicles 4 4 -
Department of Public Health 476 481 5
Department of Rehabilitation Services 112 118 6
Department of Revenue Services 665 665 -
Department of Social Services 1,844 1,982 138
Department of Veterans' Affairs 248 248 -
Division of Criminal Justice 487 498 11
Governor's Office 27 28 1
Judicial Department 4,315 4,329 14
Labor Department 185 191 6

26
Fund/Agency Original Revised Revised Original
Latino and Puerto Rican Affairs Commission 4 4 -
Legislative Management 439 439 -
Lieutenant Governor's Office 7 7 -
Military Department 42 42 -
Office of Early Childhood 73 109 36
Office of Governmental Accountability 89 89 -
Office of Higher Education 21 21 -
Office of Policy and Management 124 125 1
Office of the Chief Medical Examiner 53 50 (3)
Permanent Commission on the Status of Women 6 6 -
Protection and Advocacy for Persons with Disabilities 31 31 -
Psychiatric Security Review Board 3 3 -
Public Defender Services Commission 447 447 -
Secretary of the State 85 85 -
State Comptroller 273 276 3
State Department on Aging 28 30 2
State Library 55 55 -
State Treasurer 48 48 -
Teachers' Retirement Board 27 27 -
University of Connecticut 2,413 2,413 -
University of Connecticut Health Center 1,698 1,698 -
Total General Fund 40,847 41,215 368
Special Transportation Fund
Department of Motor Vehicles 596 599 3
Department of Rehabilitation Services - - -
Department of Transportation 3,085 3,188 103
State Treasurer 1 1 -
Total Special Transportation Fund 3,682 3,788 106
Banking Fund
Department of Banking 116 116 -
Judicial Department 51 51 -
Total Banking Fund 167 167 -
Insurance Fund
Department of Public Health - 3 3
Insurance Department 159 159 -
Office of Policy and Management 2 2 -

27
Fund/Agency Original Revised Revised Original
Office of the Healthcare Advocate 17 29 12
Total Insurance Fund 178 193 15
Consumer Counsel and Public Utility Control Fund
Department of Energy and Environmental Protection 127 127 -
Office of Consumer Counsel 13 14 1
Total Consumer Counsel and Public Utility Control Fund 140 141 1
Workers' Compensation Fund
Department of Rehabilitation Services 6 6 -
Division of Criminal Justice 4 4 -
Workers' Compensation Commission 117 117 -
Total Workers' Compensation Fund 127 127 -
Regional Market Operation Fund
Department of Agriculture 7 7 -
Total Regional Market Operation Fund 7 7 -
TOTAL 45,148 45,638 490

28
VIII. APPENDIX B
FY 15 Revised All Appropriated Funds (by account type - in millions)
Expenditure Type FY 15 $ % of Total
Personnel Costs 6,134.3 32.1%
Fringe Benefits 2,695.8 14.1%
Other Grants 5,337.1 27.9%
Medicaid 2,279.3 11.9%
Teacher's Retirement: Pension & Health 998.8 5.2%
Grants to Towns 3,154.8 16.5%
Education Equalization Grants 2,130.6 11.1%
Magnet Schools 293.8 1.5%
PILOTS - State Owned & Private 205.1 1.1%
Debt Service 2,261.1 11.8%
Other Current Expenses 1,624.0 8.5%
Other Expenses & Equipment 584.3 3.1%
GAAP Accrual 41.3 0.2%
Gross Total 19,136.8 100.0%
Lapses (143.1)
NET TOTAL 18,993.7

29
FY 15 Revised All Appropriated Funds Revenue (by account type - in millions)
Revenue Item FY 15 $ % of Total
Personal Income 9,264.5 45.6%
Sales & Use 4,250.0 20.9%
Business 1,670.0 8.2%
Federal Funds 1,311.7 6.5%
Other Revenue 1,110.0 5.5%
Gambling 663.4 3.3%
Health Provider Tax 509.5 2.5%
Motor Fuels 503.9 2.5%
Tobacco 480.9 2.4%
Other Taxes 554.1 2.7%
Gross Total 20,318.0 100%
Reductions (1,315.3)
NET TOTAL 19,002.7

30
IX. APPENDIX C
FY 15 Revised All Appropriated Funds Revenue (in thousands)
Item Original $ Revised $
General Fund
Taxes
Personal Income Tax 9,399,800 9,264,500
Sales & Use Tax 4,164,800 4,167,400
Corporation Tax 749,300 704,300
Public Service Tax 284,700 295,600
Inheritance & Estate Tax 180,100 173,000
Insurance Companies Tax 277,600 256,200
Cigarettes Tax 379,500 360,900
Real Estate Conveyance Tax 150,800 186,900
Oil Companies Tax 35,500 34,800
Electric Generation Tax - -
Alcoholic Beverages Tax 60,200 60,700
Admissions & Dues Tax 37,300 38,275
Health Provider Tax 514,500 509,500
Miscellaneous Tax 20,200 95,200
Subtotal - Taxes 16,254,300 16,147,275
Less Refunds (1,115,600) (1,105,100)
Less Earned Income Tax Credit (121,000) (120,700)
Less R&D Credit Exchange (6,200) (6,800)
Net - Taxes 15,011,500 14,914,675
Other Revenue
Transfers - Special Revenue 338,400 323,100
Indian Gaming Payments 280,400 278,500
Licenses, Permits and Fees 274,400 256,207
Sales of Commodities 39,400 43,500
Rents, Fines and Escheats 116,600 118,400
Investment Income 1,600 600
Miscellaneous 170,900 161,900
Less Refunds of Payments (71,300) (72,900)
Net - Other Revenue 1,150,400 1,109,307
Other Sources
Federal Grants 1,227,900 1,299,613

31
Item Original $ Revised $
Transfer From Tobacco Settlement 106,000 119,960
Transfers (To)/From Other Funds 4,900 14,550
Net - Other Sources 1,338,800 1,434,123
GF TOTAL 17,500,700 17,458,105
Special Transportation Fund (STF)
Taxes
Motor Fuels Tax 499,100 503,900
Oil Companies Tax 379,100 379,100
Sales Tax- DMV 79,900 82,600
Less Refunds (6,600) (6,600)
Net - Taxes 951,500 959,000
Other Sources
Motor Vehicle Receipts 237,500 238,100
Licenses, Permits and Fees 139,100 138,900
Interest Income 4,100 5,000
Federal Grants 13,100 12,100
Transfers From/(To) Other Funds (19,400) (21,500)
Refunds of Payments (3,200) (3,200)
Net - Other Sources 371,200 369,400
STF TOTAL 1,322,700 1,328,400
Mashantucket Pequot and Mohegan Fund (MP&MF)
Transfers from General Fund 61,800 61,780
MP&MF TOTAL 61,800 61,780
Soldiers, Sailor and Marines Fund (SS&MF)
Transfers from the Trust Fund - -
SS&MF TOTAL - -
Regional Market Operating Fund (RMOF)
Rentals and Investment Income 1,000 1,029
RMOF TOTAL 1,000 1,029
Banking Fund
Fees and Assessments 22,301 28,800
Use of Fund Balance from Prior Years 5,546 -
BANKING FUND TOTAL 27,847 28,800
Insurance Fund
Fees and Assessments 31,968 68,345
INSURANCE FUND TOTAL 31,968 68,345
Consumer Counsel and Public Utility Control Fund (CC&PUCF)
Fees and Assessments 25,384 25,600

32
Item Original $ Revised $
CC&PUCF TOTAL 25,384 25,600
Workers' Compensation Fund (WCF)
Fees and Assessments 25,235 27,251
WCF TOTAL 25,235 27,251
Criminal Injuries Compensation Fund (CICF)
Restitutions 3,310 3,355
CICF TOTAL 3,310 3,355
TOTAL 18,999,944 19,002,665