budget, finance & audit committee - dallas · budget, finance & audit committee meeting...
TRANSCRIPT


Budget, Finance & Audit Committee Meeting Record
(DRAFT)
Meeting Date: 03-05- 2012 Convened: 1:01 p.m. Adjourned: 2:04 p.m. Committee Members Present: Jerry R. Allen, Chair Tennell Atkins, Vice Chair Monica Alonzo Ann Margolin Scott Griggs Other Council Members Present: Carolyn R. Davis Staff Present: Jeanne Chipperfield, Jack Ireland, Edward Scott, Craig Kinton, Corrine Steeger, Jing Xiao, Sarah Hasib, Warren Ernst, Lance Sehorn, Heather Lepeska, Tom Perkins, Anna Holmes, Peter Bratt AGENDA: 1. Approval of the February 21, 2012 minutes
Presenter(s): Information Only: ____ Action Taken/Committee Recommendation(s): Motion to approve the February 21, 2012 minutes.
Motion made by: Alonzo Motion seconded by: Margolin
2. Dallas Central Appraisal District 2012 – 2013 Proposed Budget Presenter(s): Ken Nolan, Executive Director/Chief Appraiser Information Only: X
Action Taken/Committee Recommendation(s): N/A
3. Dallas/Fort Worth International Airport Approval of the 48th Supplemental Bond Ordinance Presenter(s): Chris A. Poinsatte, Chief Financial Officer Information Only:
Action Taken/Committee Recommendation(s): A motion was made to approve Dallas/Fort Worth International Airport’s 48th Supplemental Bond Ordinance and forward the item to the full Council with a recommendation to approve on the March 28,
2012 City Council Agenda.
Motion made by: Atkins
Motion seconded by: Margolin
4. Uplift Education Financing Bond and TEFRA Approval Presenter(s): Jeanne Chipperfield, Chief Financial Officer Information Only: Action Taken/Committee Recommendation(s): A motion was made to forward Uplift's request to the full Council, with a recommendation to approve an item on the March 28, 2012 City Council Agenda.

Budget, Finance & Audit Committee Meeting Record
(DRAFT)
Motion made by: Atkins Motion seconded by: Margolin
5. Financial Trends Overview
Presenter(s): Ben Kohnle, Audit Partner Grant Thornton LLP Information Only: X Action Taken/Committee Recommendation(s): N/A
_______________________________________ Jerry R. Allen, Chair Budget, Finance & Audit Committee


Budget, Finance and Audit Committee April 2, 2012

Contents - Background - Initial assessment - Improvement process
- Gold Standard teams - Recommendations - ZIP processes
- Accomplishments: to date - Accomplishments: pending - Revenue trends
Building Inspection Progress Report 4/2/12 2

Background - As a result of the economic recession, the Building
Inspection Division experienced sharp reductions in staff and resources in 2008, 2009.
- Reductions caused unacceptably long customer wait times, extended plan review times, and delays in the issuance of permits.
Building Inspection Progress Report 4/2/12 3

Initial assessment - Meetings between all levels of staff and management - Identification of problem areas, wish lists - Development of action teams
Building Inspection Progress Report 4/2/12 4

Initial assessment
Building Inspection Progress Report 4/2/12 5
Initial meetings with BI staff

Initial assessment
Building Inspection Progress Report 4/2/12 6
Preliminary team reports

Improvement process: Teams - BI Gold Standard Teams
- 12 areas identified - Team created for each area; 3 to 16 staff
members per team - All voluntary membership - Personal commitment
- Specific recommendations from each team made to Leadership Team
Building Inspection Progress Report 4/2/12 7

Improvement process: Teams Highlights of Team recommendations 1. Staffing
- Fill key positions; greeter in Permit Center 2. Technology
- New server; electronic plan review 3. Best Practices
- Front reception desk at OCMC 4. Customer education
- Directional signs throughout OCMC
Building Inspection Progress Report 4/2/12 8

Improvement process: Teams 5. Morale
- Annual awards lunch; employee of the month/year; monthly events
6. Uniforms - Provide uniforms for field inspection personnel
7. Training - Provide in-house training (classes, videos)
8. Online services - Update BI web page
Building Inspection Progress Report 4/2/12 9

Improvement process: Teams 9. Supplies
- Repair (or replace) broken and necessary equipment 10. “3-1-1” / Service Requests
- Reduce misdirected SRs by providing updated guidelines for 3-1-1 operators
11. Code Updates - Encourage input from employees; follow through by
management 12. S/E District Office Relocation
- Consider future expansion at current location
Building Inspection Progress Report 4/2/12 10

Improvement process: ZIP Five ZIP processes – each thoroughly examines a basic
and frequently requested BI service 1. Customer experience and assistance 2. Obtaining a copy of a certificate of occupancy 3. Obtaining a single trade permit 4. Plan review for a single family structure 5. Requesting a foundation inspection
Building Inspection Progress Report 4/2/12 11

Improvement process: ZIP ZIP process components
- Photographic step-by-step documentation - Flow charts: ‘before’ and ‘after’ - Leadership Team review and endorsement
ZIP process findings - Recommendations for improvement - Quantification of benefits and cost savings
Building Inspection Progress Report 4/2/12 12

Improvement process: ZIP Example: finding a Certificate of Occupancy in Central Files
Example:
Building Inspection Progress Report 4/2/12 13
CURRENT (“before”) CONDITION: View of hallway to Central Files
(Should be more inviting; signage should be clearer)
CURRENT (“before”) CONDITION: Public Computers Available for Customers
(Should be more organized and welcoming)

Improvement process: ZIP Example: finding a Certificate of Occupancy in Central Files
Building Inspection Progress Report 4/2/12 14
CURRENT (“before”) CONDITION: Customer Service Representative processing
payment for printing copy of CO
CURRENT (“before”) CONDITION: Customer Sign-in Sheet

Improvement process: ZIP Example: finding a Certificate of Occupancy in Central Files
Building Inspection Progress Report 4/2/12 15

Improvement process: ZIP Example: finding a Certificate of Occupancy in Central Files
Building Inspection Progress Report 4/2/12 16

Building Inspection Progress Report 4/2/12 17
Improvement process: ZIP Example: finding a Certificate of Occupancy in Central Files
Benefits Costs 1. Customer time saved (no longer have
to wait in line for directions). 100 customer hours per day
Temporary Updated Sign : $ 50. New Building Signage: $5,000 Completion target date: 6/1/12
2. Employee time saved (no longer have to take time re-directing customers): 100 employee hours per day
Creation of new building directories: $ 5,000. Completion target date: 6/1/12
3. Employee and customer time saved: 10 hours per day
Information and instructions signs in Central Files (LL#29): $100. Completion target date: 6/1/12
4. Employee and customer time saved: 100 hours per day
$0 cost
Quantification of benefits and costs

Accomplishments to date - BI/Gold Standard Team presentations
completed - Weekly e-newsletter - Monthly employee appreciation events - Best practices: visits to Plano, Frisco,
San Antonio - BI/OCMC office remodeling
(#204 renovation for Q Team)
Building Inspection Progress Report 4/2/12 18

Accomplishments to date
Building Inspection Progress Report 4/2/12 19
Presentations to Leadership Team
Weekly employee e-newsletter
Accomplishments to date
Building Inspection Progress Report 4/2/12 20
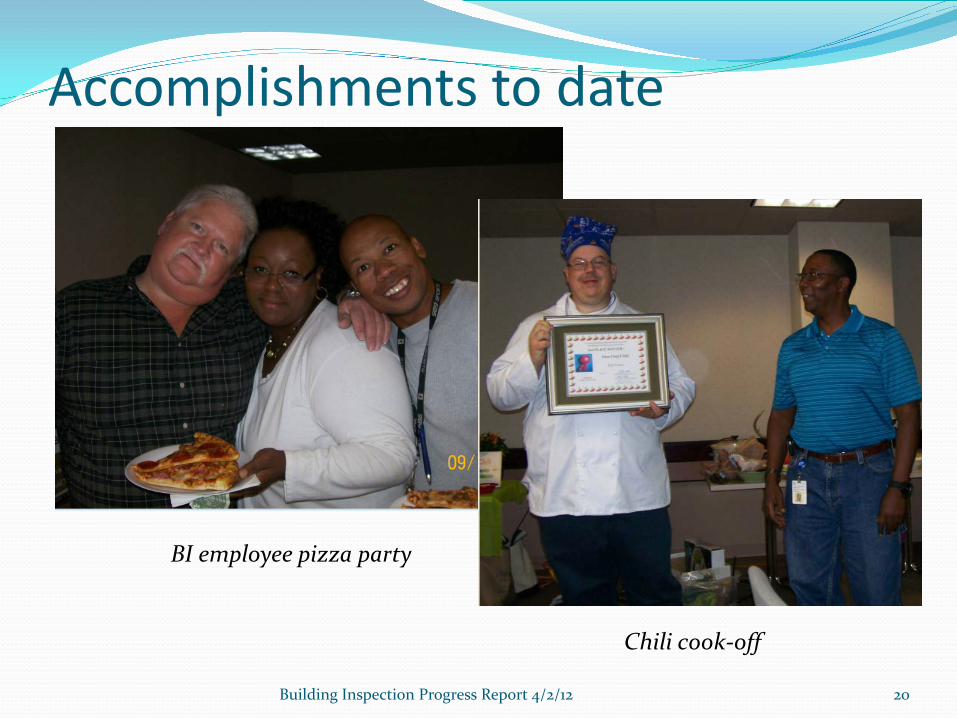
BI employee pizza party
Chili cook-off

Accomplishments to date
Building Inspection Progress Report 4/2/12 21
BEFORE: typical OCMC office space (Room #105)
AFTER: renovation of Q-Team space (Room #204)

Accomplishments to date - Equipment in Central Files
is being repaired or replaced - Budgeting
- Multi-year budgeting - concept approved
Building Inspection Progress Report 4/2/12 22

Building Inspection Progress Report 4/2/12 23
Accomplishments to date Multi-year budgeting: Concept
– Small projects (e.g. - small remodels, single trades) - Fees recorded in current year
– Large projects (e.g. - new Parkland construction) - Fees distributed to match project timing - Multi-year construction = multi-year inspections (2 to 5 years)

Building Inspection Progress Report 4/2/12 24
Accomplishments to date Multi-year budgeting: Proposed methodology
– Implement multi-year funding for projects with permit fees >$75 K – Equates to construction values >$ 80 M – Test and evaluate until 9/30/12 – “Go live” 10/1/12

Accomplishments to date – Multi-year budgeting - Examples:
- Large commercial construction: 2 years • Year #1: 40%. Year #2; 60% • (Warehouses, single story office buildings, large
remodels)
- High rises, churches: 3 years • Year #1 = 30%. Year #2 = 40%. Year #3 = 30%
- Large hospital projects: 5 years • Years #1 through #5: 20% each year
Building Inspection Progress Report 4/2/12 25

Accomplishments to date
- Uniforms purchased - BI web page updated - Employee training program established - Supplies ordered and received - “3-1-1” service requests adjusted - Pre-screener in OCMC Permit Center
Building Inspection Progress Report 4/2/12 26

Building Inspection Progress Report 4/2/12 27
Accomplishments to date
Pre-Screener function for OCMC Permit Center – Background:
- Over 50% of the walk-in customers to the OCMC Permit Center do not have the paperwork necessary to make an application for their permit. As a result, customers are frustrated, and lines are longer (repeat visits for one permit).
– Customers appreciate being met at the entrance to the OCMC Permit Center
- Reassuring to know that they are in the right place, and that their wait times will not be in vain
- Wait times for all customers are reduced when applicants with incomplete paperwork are informed promptly what additional materials they will need

Building Inspection Progress Report 4/2/12 28
Accomplishments to date Pre-Screener function
– Implemented February 27, 2012 – Result of the ZIP evaluation process – Customers are now being greeted (and their permit needs assessed) immediately upon entering the Permit Center. – Customers are now aware of all permit application requirements prior to waiting in line. – Result: lines are shorter; wait times are reduced; more permits are able to be approved during the first visit.

Building Inspection Progress Report 4/2/12 29
Accomplishments to date Building Inspection Customer Open House
– Tuesday, March 13, 2012 – Opportunity to meet BI managers, identify
problems, and propose solutions – +50 attendees

Accomplishments to date Building Inspection TREC and Stakeholders’ Meetings
- November 17, 2011 & February 2, 2012 (TREC) - March 19, 2012 & March 30, 2012 (BI Stakeholders) - Reviewed recent accomplishments and proposed
improvements
Building Inspection Progress Report 4/2/12 30

Accomplishments to date
Building Inspection Progress Report 4/2/12 31
Photo icons
added, easier to
read (more user
friendly)
Top 10 requested services
displayed on front
page

Accomplishments to date
Building Inspection Progress Report 4/2/12 32
Easier to give comments & ask questions (3 clicks from C of D main page)
1.
2.
3.

Accomplishments to date BI Staff presentation to Southeast Dallas Hispanic Chamber
of Commerce – February 22, 2012 - Topic: Certificate of Occupancy 1) application, 2) review
and 3) approval processes Building Inspection Customer Appreciation Day - February 14, 2012
Building Inspection Progress Report 4/2/12 33

Accomplishments to date
Building Inspection Progress Report 4/2/12 34
Scheduling and tracking of team
recommended initiatives

Accomplishments pending Hiring
- ‘New’ positions (approved FY2011-12) - - Target fill date: June 2012
- Includes 2nd Express Plan Review (“Q”) Team - High priority - High demand - Revenue generating - Target fill date: May 2012
Building Inspection Progress Report 4/2/12 35

Accomplishments to date Pre-development meetings:
- Staff assistance in navigating a project through the permit process including coordination, trouble-shooting, and problem solving
- All reviewers around the table at one time evaluating the same project
- Multi-division reps from SDC: BI, Engineering, Real Estate, Current Planning
- Other departments: CAO, DWU, OED, DPARD
Building Inspection Progress Report 4/2/12 36

Accomplishments pending Technology
- New document management system - Server (replaces current system, which is failing) - Contains all building permit records - CC approval target date: June 2012 - Purchase target date: July 2012
- Implement electronic plan review - Increases efficiency of plan review process - Improves customer service; saves paper - CC approval target date: June 2012 - Purchase target date: July 2012 - Installation target date: August 2012 - “Go live” target date: October 2012
Building Inspection Progress Report 4/2/12 37

Accomplishments pending Technology improvements – multiple types:
- Electronic plan submittal (e.g.: San Antonio) - Accompanies paper plan submittal
- Automated electronic plan review - Software in development - To become available in stages
Building Inspection Progress Report 4/2/12 38

Accomplishments pending
Building Inspection Progress Report 4/2/12 39
Electronic Plan Review Technology - Immediate application to Express Plan Review function - Immediate enhancement to customer service
After implementation
Before implementation

Accomplishments pending
Building Inspection Progress Report 4/2/12 40
Electronic Plan Review Technology - Smart boards (electronic mark up on touch screens) - Electronic capture of all comments and e-mail distribution to all participants

Accomplishments pending
Building Inspection Progress Report 4/2/12 41
Building Inspection customer information (“permit requirements and how-to-apply”) booth at Lowe’s Home Improvement Store, South Hampton location: mid-April, 2012

Accomplishments pending BI webpage
- Being translated into Spanish - Partially completed; to be finished by April 30, 2012
Building Inspection Progress Report 4/2/12 42

Accomplishments pending Gold Card for “frequent flyers”
- Primarily for repeat customers - Contains contractor information - Provides proper authorization/security - Faster check-in at Permit Center
Building Inspection Progress Report 4/2/12 43
Building Inspection Progress Report 4/2/12 44
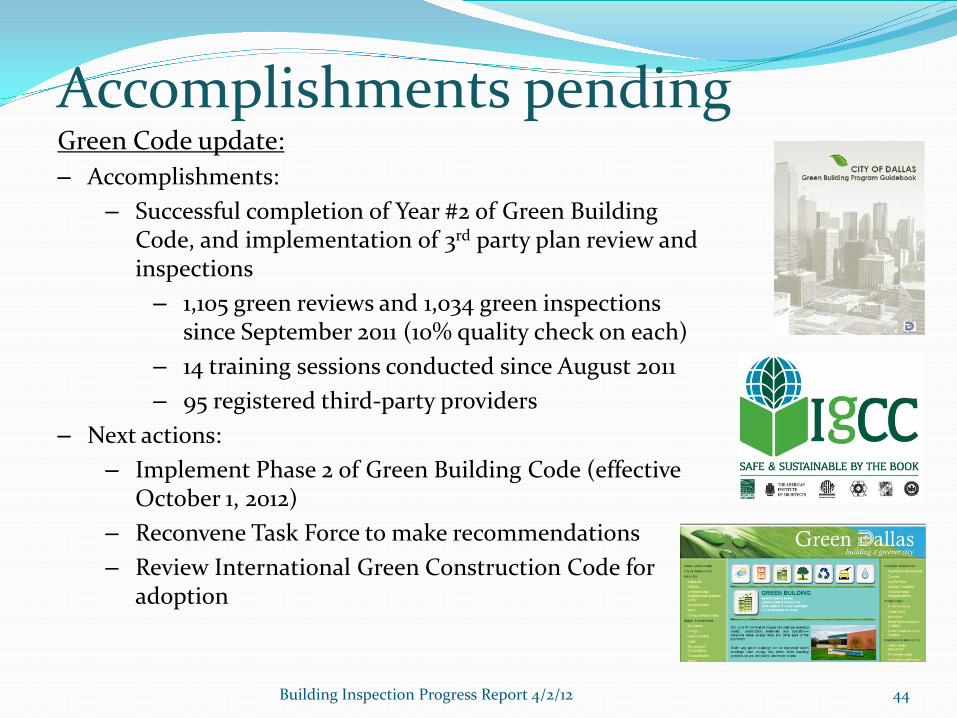
Accomplishments pending Green Code update: – Accomplishments:
– Successful completion of Year #2 of Green Building Code, and implementation of 3rd party plan review and inspections
– 1,105 green reviews and 1,034 green inspections since September 2011 (10% quality check on each)
– 14 training sessions conducted since August 2011 – 95 registered third-party providers
– Next actions: – Implement Phase 2 of Green Building Code (effective
October 1, 2012) – Reconvene Task Force to make recommendations – Review International Green Construction Code for
adoption

Accomplishments pending
Building Inspection Progress Report 4/2/12 45
Dashboard reporting capability through new technology:
- Easy to access reports - Easy to read and understand - Based on real-time data (same day info)

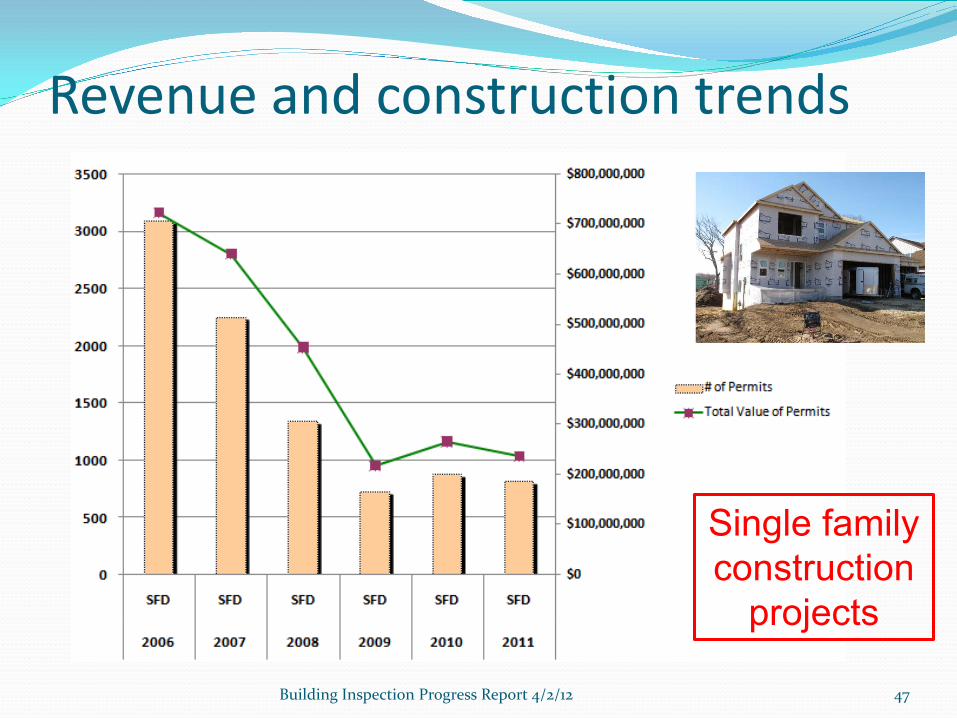
Revenue and construction trends Some construction types
- relatively steady Others construction types
- increasing
Building Inspection Progress Report 4/2/12 46
Revenue and construction trends
Building Inspection Progress Report 4/2/12 47
Single family
construction
projects

Revenue and construction trends
Building Inspection Progress Report 4/2/12 48
Apartment
construction
projects

Revenue and construction trends
Building Inspection Progress Report 4/2/12 49
Commercial
construction
projects

Performance measures
Building Inspection Progress Report 4/2/12 50

Performance measures
Building Inspection Progress Report 4/2/12 51

Performance measures
Building Inspection Progress Report 4/2/12 52

Performance measures
Building Inspection Progress Report 4/2/12 53

Permit Center statistics
Building Inspection Progress Report 4/2/12 54

Permit Center statistics
Building Inspection Progress Report 4/2/12 55

Building Inspection Progress Report 4/2/12 56

Building Inspection Progress Report 4/2/12 57


Budget, Finance and Audit Committee
City of Dallas, Park and Recreation Department
April 2, 2012
Cotton Bowl
Proposed 2013 Improvements and Financing

2 2 2
Briefing Information
Economic Impact History of the Cotton Bowl Existing Football Games Proposed Work Renovation Schedule Certificates of Obligation Certificates of Obligation – Schedule of Events
2

3 3 3
Economic Impact
AT&T Red River Rivalry (Texas and OU)* Prior to 16,000 seat expansion in 2008: Gross impact on local spending: $30.2M
Spending retained in Dallas County: $18.0M
Estimated impact after 2008 expansion: Gross impact on local spending: $33.8M
Spending retained in Dallas County: $20.2M *Data is from the report, “Economic Estimates for College Football During the 2007 State Fair of Texas”, dated Oct. 2007 by Dr. Patrick Rishe, Director, Sportsimpacts. Economic Impact was based on “non-local” spending (i.e. from visitors outside of Dallas County)
3

4 4 4
State Fair Classic (Grambling and Prairie View)* Gross impact on local spending: $6.0M Spending retained in Dallas County: $3.6M
The City of Dallas Office of Economic Development was able to interpolate City of Dallas’ gross general fund fiscal impacts for the two events evaluated in the study: The State Fair Classic would generate approximately
$100,000 in gross general fund revenue for the City The Red River Rivalry would generate approximately
$500,000 in gross general fund revenue for the City
*Data is from the report, “Economic Estimates for College Football During the 2007 State Fair of Texas”, dated Oct. 2007 by Dr. Patrick Rishe, Director, Sportsimpacts
Economic Impact

5 5
2012 TicketCity Bowl** Gross Economic Impact $9.60M
Economic Impact based on the City of Dallas and surrounding 4-county region
Economic Impact
**Data is from the report, “Economic Impact and Market Research Analysis
of the 2012 TicketCity Bowl”, dated Feb. 2012 by Dr. Patrick Rishe, Director,
Sportsimpacts

6 6 6
“Fair Park Football Stadium” was constructed in 1921 with 15,000 seats
In 1929, the Texas-OU game was established as an annual event at the stadium and became one of the greatest rivalries in American sports
6
History

7 7 7
In 1930, during the height of the Great Depression, the original facility was replaced with a 46,200-seat stadium
7

8 8 8
In 1936, the stadium was incorporated into the general layout of the Texas Centennial Exposition and officially renamed the “Cotton Bowl”
8

9 9 9
In the first Cotton Bowl game, held on January 1, 1937, the TCU Horned Frogs defeated the Marquette Golden Avalanche, 16-6
9
10 10 10
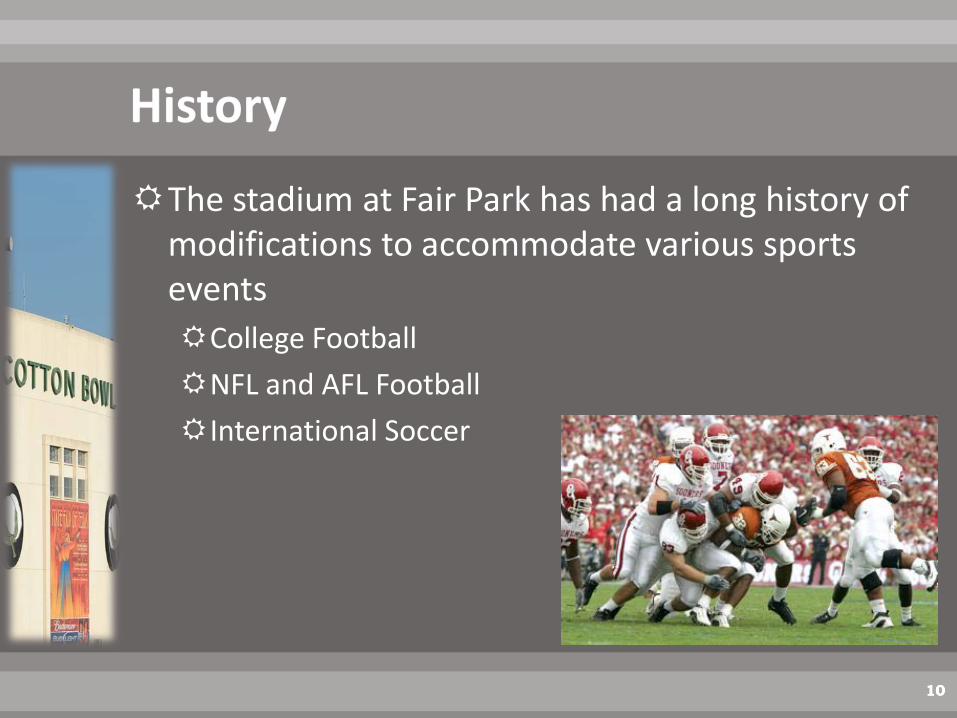
History
The stadium at Fair Park has had a long history of modifications to accommodate various sports events College Football
NFL and AFL Football
International Soccer
10

11 11 11
The upper decks were added in 1948 and 1949 when the Cotton Bowl served as home to the SMU Mustangs
Seating capacity increased to 72,000
11

12 12 12
In 1952, the Cotton Bowl was home to Dallas’ first NFL team, the Dallas Texans
In 1960, the stadium served as the home field to two professional football teams: Dallas Cowboys (NFL)
Dallas Texans (AFL – Kansas City Chiefs)
In 1968, the stadium was renovated when the bleachers were replaced by chair-back seats, reducing the capacity to 68,250 from 72,000
12

13 13 13
In 1993, the City of Dallas renovated the Cotton Bowl for World Cup soccer Restrooms and concessions expansion, minor press
box renovation New natural turf field (considered one of the top five
soccer pitches in the world) Movable bleachers increased football seating capacity
to 72,000 The 1994 World Cup was held in 9 U. S. cities The stadium hosted six international soccer games during the 1994 World Cup
13

14 14 14
In 2004, the State Fair of Texas (SFT) added bleacher seating in each end zone, increasing the stadium’s capacity by 4,000 seats to 76,000

15 15 15
2006 Capital Bonds and the State Fair provided funding for renovation and expansion Improvements were performed by the Design-Build
delivery method Design-Build process was also used for the Giants of the Savanna Exhibit at the Dallas Zoo
15
Recent Improvements

16 16 16
Phase 1: January 15 – September 15, 2007 Replacement of flip seats with new bench seats
Concrete repairs and waterproofing in entire lower bowl area
Video scoreboard– second largest board in Texas
New sound system
16
Recent Improvements

17 17 17
Phase 2: January 15 –September 15, 2008 Addition of 16,000 new seats – 9th largest stadium in USA
Addition of new rest rooms and concessions
17
Recent Improvements

18 18 18
Locker room renovation and expansion
Addition of new media and conference center
18
Recent Improvements

19
Fair Park Events Event Attendance Projections Ticket City Bowl 45,000
Mardi Gras Texas Style 20,000
Irish Festival 73,000
Summer Adventure (Scheduled to open May 3, 2013) 350,000
Earth Day Dallas 75,000
Cotton Bowl Spectacular (Scheduled to open June 1, 2015) 200,000
Univision Cinco de Mayo 50,000
City Arts Festival 35,000
Soccer United Marketing 50,000
Fair Park Fourth 40,000
Mayor’s Back to School 25,000
State Fair 3,000,000
Diwali Mela 50,000
Holiday Lights (Scheduled to Open December 1, 2014) 150,000
White Rock Marathon 100,000+

20 20 20
TX-OU Current Contract expires in 2015
Grambling-Prairie View A&M Ticket City Bowl International soccer High school football Commercial filming Concerts and other events Diwali Mela Festival of Lights
20
Diverse Events at the Cotton Bowl

21 21 21
Jan 2 TicketCity Bowl Game Feb 13-14 Gatorade Commercial Film Shoot May 6 Dog Bowl May 26 International Soccer Double-Header June 9 Univision H2O Concert June 22 National Olympic Day & National Park &
Recreation Month Kickoff Jul 4 Fair Park Fourth Aug 1 DISD Teacher Rally (T) Aug 11 BvB Charity Football Aug 24 Garland HS vs. Plano East HS Aug 25 High School Football (2 games) Oct 6 Grambling v. Prairie View Oct 13 Texas vs. OU Nov 3 Diwali Mela Festival Nov 24 Pop Warner National Football Championships
2012 Cotton Bowl Events
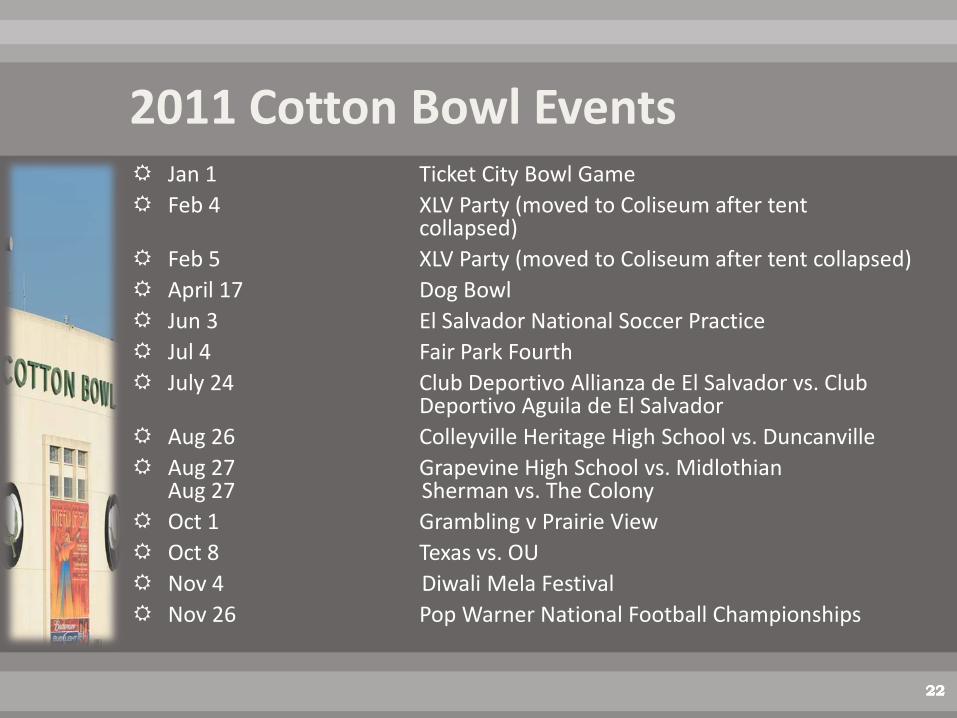
22 22 22
Jan 1 Ticket City Bowl Game Feb 4 XLV Party (moved to Coliseum after tent
collapsed) Feb 5 XLV Party (moved to Coliseum after tent collapsed) April 17 Dog Bowl Jun 3 El Salvador National Soccer Practice Jul 4 Fair Park Fourth July 24 Club Deportivo Allianza de El Salvador vs. Club
Deportivo Aguila de El Salvador Aug 26 Colleyville Heritage High School vs. Duncanville Aug 27 Grapevine High School vs. Midlothian
Aug 27 Sherman vs. The Colony Oct 1 Grambling v Prairie View Oct 8 Texas vs. OU Nov 4 Diwali Mela Festival Nov 26 Pop Warner National Football Championships
2011 Cotton Bowl Events

23 23 23
The Cotton Bowl has a long history of college games:
Red River Rivalry, since 1929 State Fair Classic, since 1984
For the college games played during the State Fair, Fair Park provides an unmatched aura and experience with rides, food, games, shows and exhibits
Attraction and Mystique of the Cotton Bowl

24 24 24
According to the “Bleacher Report,” the Texas-OU game is the number one college football rivalry in the country
Fair Park, a 277-acre National Historic Landmark, provides an unparalleled setting for sports events
Attraction and Mystique of the Cotton Bowl

25
Contribution of Cotton Bowl to City
Prestige and community pride of hosting major events
Publicity / media value from hosting major events, including national and international TV broadcasts
Promoting entertainment options for local residents Visitors / alumni enjoy being in Dallas and do more
business in Dallas in the future Maintaining public facilities requires continuous
investment to prevent more expensive “catch-up” costs later

26 26
Amenities will make the stadium more marketable in an ever-growing market of venues
The Cotton Bowl is Dallas’ largest public event facility contributing to our citizens quality of life
Allows the Cotton Bowl to remain viable as a prime destination for sports
and entertainment Retention and attraction of annual and touring events
Why Renovations Are Needed

27 27
Allows the Cotton Bowl to compete for international events: World Cup bid – 2018 and 2022
Future Olympics
Bi-annual CONCACAF (Gold Cup Soccer)
Longevity may translate to larger economic impact of events in the future
Why Renovations Are needed

28 28 28
Proposed improvements will: Address functional and aesthetic insufficiencies Add amenities that are now expected in college
stadiums Club seats Festive concourses Updated concessions Updated press box for coaches Athletic directors and the press
28
Proposed Renovations

29 29 29
New, historically contextual facade around each end zone to screen 2008 expansion Landmark Commission required that the Park and
Recreation Department return to them within 2 years with a plan and schedule for the addition of a facade as a condition of their approval of the 2008 Improvements
29
Proposed Renovations

30 30 30
Renovation of existing east and west concourses to address: Patchwork concrete floor Temporary concessions Exposed piping and conduits Poor lighting and visibility
30

31 31 31
Improvements to east and west concessions
31

32 32 32
Club seating under Press Box Level 5 overhang Finish out area at Levels 3 and 4 of the Press Box
32
Existing Press Box Level 4

33 33 33
Renovations to the existing Press Box, including broadcast TV cabling improvements
New elevator to Press Box to address capacity Conference required improvements Associated code improvements
33

34 34 34
Initiate RFQ/RFP Process for Design-Build firm March 2012
Select Design-Build firm April 2012 Park Board/Council approval
of Design-Build contract – design phase May 2012
Park Board /Council approval of GMP for construction December 2012
34

35 35 35
Renovation Schedule
Begin construction January 2013 Complete construction September 2013
35

36
Certificates of Obligation

37 37 37
Certificates of Obligation
Issuance of $25.5 million (maximum amount) in Certificates of Obligation (CO’s) is proposed for Cotton Bowl improvements
State law requires the publication of 2 notices and a 30 day waiting period between the first notice and the sale date
37
38 38 38
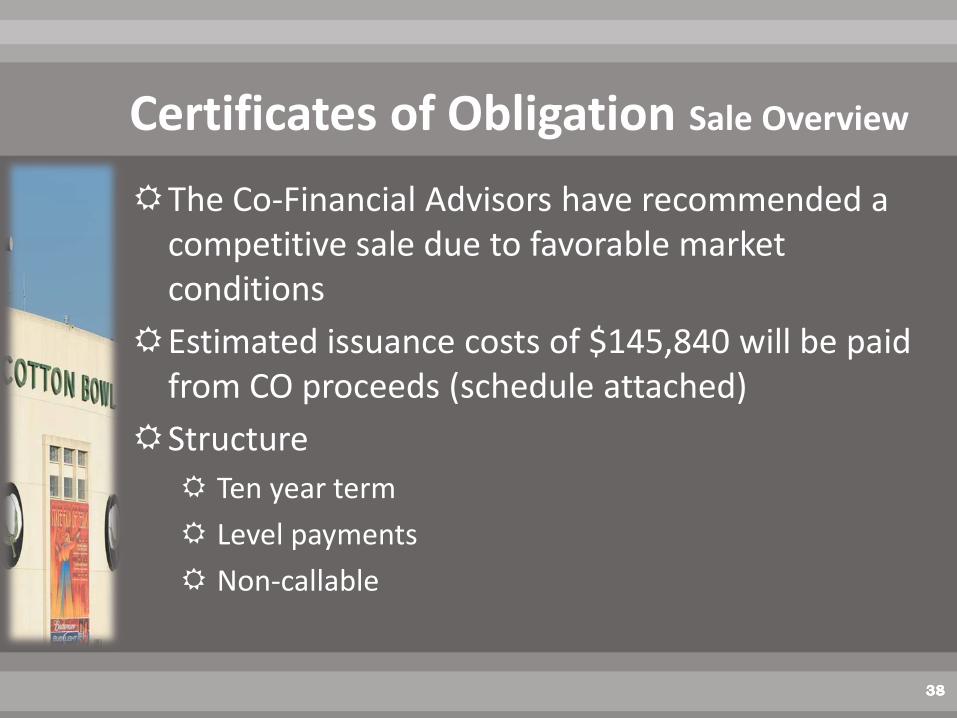
Certificates of Obligation Sale Overview
The Co-Financial Advisors have recommended a competitive sale due to favorable market conditions
Estimated issuance costs of $145,840 will be paid from CO proceeds (schedule attached)
Structure Ten year term
Level payments
Non-callable
38

39 39 39
Schedule of Events
April 2 Budget, Finance & Audit Committee Briefing
April 4 City Council briefing
April 11 City Council approval of plans to prepare for issuance of CO’s, including publication of the Notice of Intent
May 16 City Council approval of the parameters ordinance authorizing the sale of the CO’s
June 6 Receive and accept bids for the sale of the CO’s
June 26 Receive proceeds
39

40 40 40 40

41

42 42 42
Appendix
Sources and Uses – Certificates of Obligation Proceeds
Debt Service Schedule – Certificates of Obligation Proceeds
Bond Summary Statistics – Certificates of Obligation Proceeds
Estimated Issuance Costs
42

43 43 43
Source and Use of Funds
43

44 44 44
Debt Service Schedule
44

45
Bond Summary Statistics

46 46 46
Certificates of Obligation Estimated Cost of Issuance
46
Co-Bond CounselBracewell & Giuliani
West & Associates
Co-Financial AdvisorsFirst Southwest Company
Estrada Hinojosa
Official Statement Typing Fee
Official Statement Printing Fee
Rating AgenciesMoody's Investors Service
Standard & Poor's
AuditorGrant Thorton
Dallas Morning News
Filing FeeAttorney General Office
Grand Total
*Total M/WBE Participation as % of Total Issuance Costs:
$26,775 18.36%
20,825 14.28%
19,170 13.14%
12,780 8.76%
1,500 1.03%
10,000 6.86%
21,000 14.40%
15,640 10.72%
7,650 5.25%
1,000 0.69%
9,500 6.51%
$145,840 100.00%
23.04%


Memorandum DDArE March 9, 2012 CITY OF DALLAS
to The Honorable Mayor and Members of the City Council
SUBJECt Financial Forecast Report
For your information, attached is the financial forecast report for FY 201 1-12, based oninformation through January. General Fund revenues are projected to be $51 1,000below budget and expenditures are projected to be $1 ,395,000 below budget.
We will continue to closely monitor revenues and expenditures and keep you informed.
//f
Mary K. ShrnCity Manager
Attachment
A.C. Gonzalez, First Assistant City ManagerRyan S. Evans, Assistant City ManagerJill A. Jordan, PE., Assistant City ManagerForest Turner, Assistant City ManagerJoey Zapata, Assistant City Mana9erJeanne Chipperfield, Chief Financial OfficerJack Ireland, Director, Office of Financial Services
“Dallas — Together, we do it better!”
DRAFT3/9/2012 6:01 PM
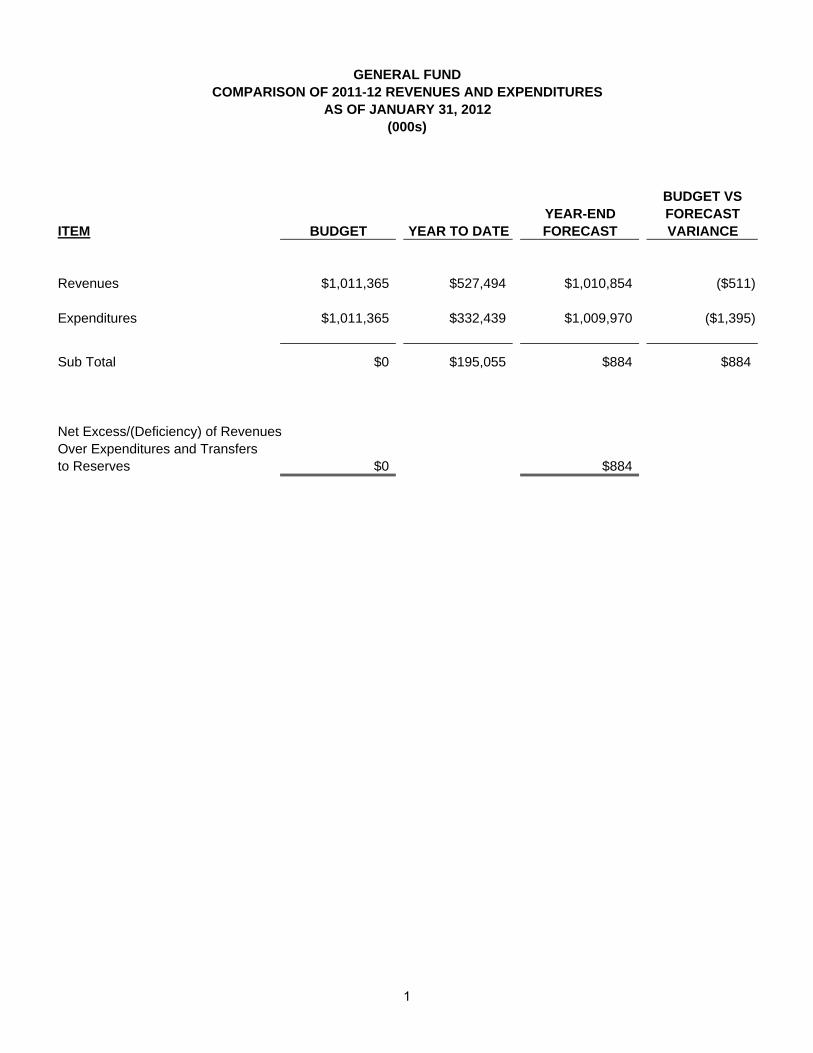
BUDGET VSYEAR-END FORECAST
ITEM BUDGET YEAR TO DATE FORECAST VARIANCE
Revenues $1,011,365 $527,494 $1,010,854 ($511)
Expenditures $1,011,365 $332,439 $1,009,970 ($1,395)
Sub Total $0 $195,055 $884 $884
Net Excess/(Deficiency) of RevenuesOver Expenditures and Transfersto Reserves $0 $884
GENERAL FUNDCOMPARISON OF 2011-12 REVENUES AND EXPENDITURES
AS OF JANUARY 31, 2012(000s)
3/9/2012 6:01 PM 1

FINANCIAL FORECAST REPORT
FY 2011-12 AS OF JANUARY 31, 2012
GENERAL FUND Revenues
• Total General Fund revenues are estimated to be $511,000 below budget.
o Municipal Court revenues are projected to be $2,602,000 below budget due to a decrease in the number of citations written, high dismissal rates, and defendants choosing not to respond/resolve their citations.
o Park revenues are projected to be $716,000 above budget primarily due to revenue received from classes
held at various recreation centers. The revenue offsets a corresponding expense for payment to instructors.
o Emergency Ambulance revenues are projected to be $1,624,000 below budget due to lower than anticipated collections. On January 25, 2012, council approved a new billing and collection contract.
o Other Charges for Service revenues are projected to be $1,000,000 below budget primarily due to Non-Owner
Occupied Registration Fees and Multi-Tenant Re-Inspection Fees being less than anticipated.
o Miscellaneous revenues are projected to be $722,000 below budget primarily due to declining price in paper and cardboard recycling.
Expenditures • Total General Fund expenditures are estimated to be $1,395,000 below budget.
o Public Works and Transportation is projected to be $340,000 below budget primarily due to delays in hiring.
o Sustainable Development and Construction is projected to be $84,000 below budget primarily due to delays in
hiring.
o Fuel expense in the General Fund is projected to be $1,108,000 over budget as a result of higher per gallon cost than anticipated.
PROPRIETARY
o Municipal Radio Fund expenses are projected to be $237,000 below budget primarily due to delays in hiring. o Sustainable Development/Construction revenues are projected to be $2,473,000 above budget due to a
recent increase in new multi-family construction and continued expansion of healthcare facilities.
2

BUDGET VSREVENUES YEAR-END FORECAST
BUDGET YEAR TO DATE FORECAST VARIANCE
TAXESAd Valorem Tax $433,218 $349,474 $436,155 $2,937Sales Tax 215,508 73,303 217,724 2,216TOTAL TAXES 648,726 422,777 653,878 5,152
FRANCHISE REVENUESOncor Electric 51,097 28,715 51,446 349AT&T 16,515 0 16,515 0Atmos Energy 11,474 3,068 11,492 18Time Warner Cable 6,170 1,032 6,182 12Other 17,212 322 17,215 3TOTAL FRANCHISE REVENUES 102,469 33,137 102,851 383
LICENSES AND PERMITS 9,747 3,850 9,511 (237)
INTEREST EARNED 914 139 914 0
INTERGOVERNMENTAL 5,430 155 5,430 0
FINES AND FORFEITURES Municipal Court 17,822 4,031 15,220 (2,602)Vehicle Towing & Storage 7,874 2,430 7,858 (16)Parking Fines 5,793 1,553 5,793 0Red Light Camera Fines 7,276 0 6,967 (309)Public Library 603 172 603 0TOTAL FINES 39,368 8,186 36,441 (2,927)
CHARGES FOR SERVICE Sanitation Service 59,922 20,065 60,170 248Parks 7,321 2,329 8,038 716Private Disposal Fees 18,336 6,148 17,836 (500)Emergency Ambulance 20,063 5,453 18,439 (1,624)Security Alarm 4,155 1,370 4,231 76Street Lighting 1,493 160 1,493 0Vital Statistics 1,563 448 1,488 (75)Other 18,756 7,534 17,755 (1,000)TOTAL CHARGES 131,610 43,507 129,450 (2,160)
INTERFUND REVENUE 60,584 12,258 60,584 0
MISCELLANEOUS 12,516 3,486 11,794 (722)TOTAL REVENUE 362,639 104,717 356,976 (5,663)TOTAL RESOURCES $1,011,365 $527,494 $1,010,854 ($511)
(000s)
GENERAL FUNDFORECAST OF FY 2011-12 REVENUES
AS OF JANUARY 31, 2012
3

BUDGETEXPENDITURESYEAR TO DATE
YEAR-ENDFORECAST
BUDGET VSFORECASTVARIANCEDEPARTMENT
GENERAL FUNDFORECAST OF FY 2010-11 EXPENDITURES
AS OF JANUARY 31, 2011 (000s)
GENERAL FUNDFORECAST OF FY 2011-12 EXPENDITURES
AS OF JANUARY 31, 2012 (000s)
Building Services ($12)$17,836 $8,417 $17,824Business Dev/Procurement Svcs $0$2,016 $708 $2,016City Attorney's Office ($51)$10,754 $3,310 $10,702City Auditor's Office $9$2,052 $644 $2,061City Controller's Office ($72)$3,597 $1,064 $3,525City Manager's Office $0$1,488 $654 $1,488City Secretary's Office ($1)$1,485 $321 $1,484Civil Service $10$1,431 $379 $1,441Code Compliance ($1)$27,316 $7,874 $27,316Court Services ($101)$10,943 $2,638 $10,841Elections $0$789 $22 $789Fire ($483)$205,558 $72,065 $205,075Housing / Community Services ($3)$8,027 $4,695 $8,024Human Resources ($1)$3,478 $1,301 $3,477Independent Audit $0$937 $0 $937Judiciary ($7)$3,077 $1,035 $3,070Library $0$18,422 $6,086 $18,422Management Services ($24)$3,255 $1,588 $3,230Mayor and Council ($92)$3,624 $983 $3,532Non-Departmental ($1,274)$29,845 $3,771 $28,571Office of Cultural Affairs ($89)$13,895 $5,488 $13,807Office of Economic Development $0$604 $601 $604Office of Financial Services ($31)$1,776 $353 $1,745Park and Recreation $716$64,643 $23,454 $65,359Police ($408)$399,406 $126,878 $398,999Public Works and Transportation ($340)$5,015 $3,179 $4,675Sanitation Services ($119)$74,535 $23,094 $74,416Street Lighting $0$18,559 $3,933 $18,559Street Services ($3)$53,165 $15,785 $53,162Sustainable Dev/Construction ($84)$1,204 $713 $1,120Trinity Watershed Management ($21)$252 $230 $231
OTHERAppraisal Districts $0$3,321 $3,321$3,321Dallas County Tax Collection ($23)$0 $533$556Jail Contract - Lew Sterrett $0$7,852 $7,852$7,852Fuel Cost (to be allocated) $1,108$0 $1,108$0
RESERVES AND TRANSFERSSalary and Benefit Reserve $0$0 $3,700$3,700Contingency Reserve $0$0 $1,663$1,663Liability/Claims Fund $0$0 $5,288$5,288
$1,011,365 $332,439TOTAL EXPENDITURES $1,009,970 ($1,395)
4

PROPRIETARY FUNDSFORECAST OF FY 2011-12 REVENUES AND EXPENDITURES
AS OF JANUARY 31, 2012 (000s)
BUDGETEXPENDITURESYEAR TO DATE
YEAR-ENDFORECAST
BUDGET VSFORECASTVARIANCEDEPARTMENT
REVENUES AND
Aviation$47,682 $15,139Revenues
Expenses $47,682 $8,145Net Excess of Revenues Over Expenses/Transfer $6,994
$47,724$47,656
$42($27)
$68$0 $68
Convention Center$59,772 $19,780Revenues
Expenses $59,404 $17,805Net Excess of Revenues Over Expenses/Transfer $1,976
$60,098$60,098
$327$694
($367)$367 $0
Municipal Radio Fund$2,842 $940Revenues
Expenses $2,798 $870Net Excess of Revenues Over Expenses/Transfer $70
$2,790$2,562
($51)($237)
$186$43 $229
Sustainable Dev/ Construction$17,932 $8,080Revenues
Expenses $17,900 $4,365Net Excess of Revenues Over Expenses/Transfer $3,716
$20,405$17,451
$2,473($449)
$2,922$32 $2,954
Water Utilities$551,600 $169,249Revenues
Expenses $551,826 $137,931Net Excess of Revenues Over Expenses/Transfer $31,318
$546,450$546,675
($5,151)($5,151)
$0($225) ($225)
Communication & Information Svcs$46,142 $17,180Revenues
Expenses $48,056 $11,270Net Excess of Revenues Over Expenses/Transfer $5,909
$46,142$48,200
$0$144
($144)($1,913) ($2,057)
5

PROPRIETARY FUNDSFORECAST OF FY 2011-12 REVENUES AND EXPENDITURES
AS OF JANUARY 31, 2012 (000s)
BUDGETEXPENDITURESYEAR TO DATE
YEAR-ENDFORECAST
BUDGET VSFORECASTVARIANCEDEPARTMENT
REVENUES AND
Equipment Services$47,743 $10,808Revenues
Expenses $47,812 $11,988Net Excess of Revenues Over Expenses/Transfer ($1,181)
$48,947$49,121
$1,204$1,308
($105)($69) ($173)
Express Business Center$3,924 $1,280Revenues
Expenses $3,868 $1,111Net Excess of Revenues Over Expenses/Transfer $169
$3,924$3,863
$0($5)
$5$56 $62
6

OTHER FUNDSFORECAST OF FY 2011-12 REVENUES AND EXPENDITURES
AS OF JANUARY 31, 2012 (000s)
BUDGETEXPENDITURESYEAR TO DATE
YEAR-ENDFORECAST
BUDGET VSFORECASTVARIANCEDEPARTMENT
REVENUES AND
Employee Benefits $614 $116 $617 $4
Risk Management $1,340 $397 $1,339 ($1)
9-1-1 System Operations$13,075 $3,368Revenues
Expenses $13,906 $1,275Net Excess of Revenues Over Expenses/Transfer ($831) $2,093
$13,075$13,866
($791)
($40)$0
$40
Storm Water Drainage$49,199 $16,802Revenues
Expenses $51,563 $5,861Net Excess of Revenues Over Expenses/Transfer ($2,365) $10,941
$49,421$51,273
($1,853)
($290)$222
$512
7

EXPENDITURES BUDGET VSAND REVENUES YEAR-END FORECAST
DEBT SERVICE BUDGET YEAR TO DATE FORECAST VARIANCE
Beginning Balance $2,918 $0 $4,238 $1,320
Revenues $248,494 $168,318 $249,908 $1,414
Expenses $248,845 $0 $248,845 $0
Ending Balance $2,567 $168,318 $5,301 $2,734
DEBT SERVICE FUNDFORECAST OF 2011-12 REVENUES AND EXPENDITURES
AS OF JANUARY 31, 2012(000s)
8

Beginning Balance October 1, 2011 $5,100,000
Balance as of January 31, 2012 $5,100,000
CONTINGENCY RESERVE STATUS
9

Beginning Balance October 1, 2011 $8,568,433
Paid October 2011 ($311,880)
Paid November 2011 ($697,640)
Paid December 2011 ($334,763)
Paid January 2012 ($729,393)
Balance as of January 31, 2012 $6,494,757
LIABILITY/CLAIMS FUND
10

ACTUAL BUDGET ACTUALFY 2010-11 FY 2011-12 FY 2011-12 DOLLARS PERCENT DOLLARS PERCENT
OCT $15,272,080 $15,623,064 $15,401,765 $129,685 0.8% ($221,299) -1.4%NOV 15,470,539 16,172,808 16,931,117 1,460,578 9.4% 758,309 4.7%DEC 22,992,788 23,741,642 24,429,551 1,436,763 6.2% 687,909 2.9%JAN 15,322,370 15,550,064 16,540,783 1,218,413 8.0% 990,719 6.4%FEB 14,670,044 14,902,387MAR 22,537,374 21,789,663APR 15,672,560 15,978,845MAY 16,714,276 16,780,773JUN 21,525,471 21,839,144JUL 18,628,602 16,428,177AUG 15,839,193 15,968,985SEP 21,247,748 20,732,552
TOTAL $215,893,045 $215,508,103 $73,303,216 $4,245,439 6.1% $2,215,639 3.1%
YTD VARIANCE FY 11-12 ACT. VS. FY 10-11 ACT.
YTD VARIANCE FY11-12 ACTUAL VS. BUDGET
SALES TAX as of January 2012
$15
$20
$25
$30
VED
MONTHLY SALES TAX REVENUESFY 10-11 vs. FY 11-12 COMPARISON
a
$0
$5
$10
$15
OCT NOV DEC JAN FEB MAR APR MAY JUN JUL AUG SEP
REV
ENU
E R
ECEI
V$
Mill
ions
FY 10-11 ACTUAL FY 11-12 BUDGET FY11-12 ACTUAL
11