bu247 managerial accounting
DESCRIPTION
BU247 Managerial Accounting. with Natasha Neumann- Causi and Mike Pegutter. Updated Presentation. This presentation is up to date Uses material from new textbook Follows course outline Contains examples from prior exams and from textbook questions - PowerPoint PPT PresentationTRANSCRIPT

BU247 Managerial Accounting
with Natasha Neumann-Causi and Mike Pegutter

Updated Presentation
This presentation is up to date
- Uses material from new textbook- Follows course outline- Contains examples from prior exams
and from textbook questions- If I miss something, let me know and I
will explain it now or in an email

General Study Tips1. DON’T PANIC! 2. USE YOUR HANDOUT!3. Know the theory well, do not memorize
calculations!4. Practice homework with time constraints5. If you get stuck on a question, leave it and
come back later6. When in doubt, GUESS! Never leave a
question blank7. Make sure you have answered everything
the question asked for!!!

Exam Outline• Multiple Choice Questions
– Definitions– Smaller calculations – Theories– Journal Entries
• True / False or Fill in the Blank– Theories and Definitions
• Short Answers– Big Calculations – Writing out Steps to Calculations

AgendaPART I: Introduction and CVP Analysis• What is management accounting? • Cost behaviour• Cost-Volume-Profit Analysis
PART II: Cost Behaviour• Variations in cost behaviours• Income Statement approaches
PART III: Cost Allocation• Overhead Rate Calculation • Applying Overhead
PART IV: System Design and Allocation• Job Order vs. Process • Service Departments
PART V: ABC Costing

INTRODUCTORY MATERIALPart I
Managerial Accounting• For management purposes only
– Cost allocations and calculations– Budgeting and future planning – Production decisions– Product decisions
• Always keep in mind:– Benefit versus cost tradeoff– Will the systems aid management?

Framework of Cost Accounting
Corporate Activities supported by Management
Accounting
Operational Control
Management Control
Strategic Planning
• Strategic Planning – focus on company objectives– Factory location– Mergers & acquisitions
• Management Control – focus on resource efficiency– Budget analysis– Variance analysis
• Operational Control – task efficiency– Inventory control– Cash management

Central Layout Management accounting involves:I. planning (alternative identification
and budgeting)II. controlling (actions and evaluations
of those actions)III. directing and motivating (smooth
operations, conflict resolution, etc.)

Financial vs. ManagementFinancial Accounting
Management Accounting
Users External people who make financial decisions
Managers who plan and control
Time Focus Historical Perspective(how did the year go?)
Future Oriented(what are we doing next year?)
Emphasis Objectivity and Verifiability
Relevance for Planning Purposes
Importance Precision of Information
Timeliness of Information
Subject Focus Summarized Data Segmented ReportsGAAP MUST FOLLOW GAAP Not necessaryRequirement Mandatory (investors
need info)Not necessary (it helps mgmt but they don’t necessarily need to)

Decisions & InformationDecision Process
1. Identify the problem2. Understand the Key
Success Factors of the company
3. Identify alternative solutions
4. Quantitative and qualitative analyses
5. Evaluation solutions and chose one
6. Implementation of the plan
Accounting Information Types
• Problem Solving Information – used for long-range planning
• Attention Directing Information – used for controlling routine operations
• Scorekeeping Information – used by investors, tax collectors, etc.
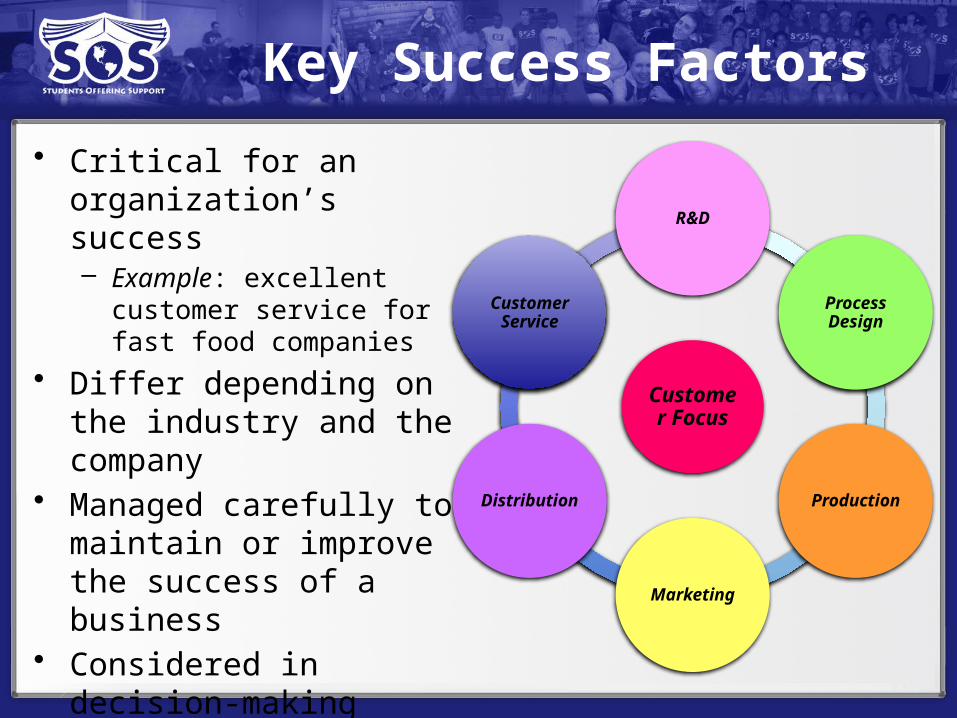
Key Success Factors• Critical for an
organization’s success – Example: excellent
customer service for fast food companies
• Differ depending on the industry and the company
• Managed carefully to maintain or improve the success of a business
• Considered in decision-making processes and always at the forefront
Customer
Focus
R&D
Process Design
Production
Marketing
Distribution
Customer Service

Professional Ethics• Competence: be able to recognize
limitations, follow laws, provide accurate and timely information
• Confidentiality: do not use confidential information and do not give that information
• Integrity: be open about conflicts of interest, avoid actions that would jeopardize reputation
• Credibility: communicate, disclose problems and all relevant information that others need to know

Professional Ethics• Resolution Conflict: follow official
policies, or talk to supervisors–confidentially should be maintained, consult legal professionals
• Corporate Governance: is the set of processes, customs, policies and laws which affect the way a company is directed, administrated or controlled
–should provide incentives for the pursuit of goals which benefit the stakeholders

Process ManagementApproaches to improving processes:• Lean Production – minimize inventory and
“pull” units through processes in response to customer orders
• Six Sigma – reduce defective products to near zero by using feedback and numerical data– Define, Measure, Analyze, Improve, Control
• Computer Technology – refers to the growing popularity of E-commerce and enterprise systems– Enterprise systems – software program that
combines all data• Risk Management – proactively seeking out
potential sources of risk, preparing yourself, or prevent it

Cost Behaviour• A cost driver is source of your total costs
– Example: the number of man hours clocked in a laboratory will make your total cost of R&D rise
• Variable costs are costs that change in direction relation to changes in cost drivers (per unit)– Example: lab technicians are paid more depending on how
many hours they work• Fixed costs are not immediately affected by
changes in the driver (total amounts)– Examples: rent, insurance payments, taxes

Relevant Range• Relevant range and Step Variable
Costs are ranges where your per unit variable costs and your fixed costs will stay constant– Outside of this range these costs will
change As long as Brick Brewery is making between 30,000 and 75,000 cases of beer, it costs $3.00 a beer to produce and fixed costs are $1.5M a month. 30 75

Cost – Volume – Profit Analysis
-
50,000
100,000
150,000
200,000
250,000
300,000
350,000
400,000
450,000
- 100 200 300 400 500 600 700 800
Total Sales
Total Costs
Fixed Costs
Breakeven Point

Breakeven Analysis• Calculating how many units need to be sold
before you can start making some profits• Equation Approach:
• Contribution Margin Method:

CVP Analysis ExampleA Playstation3 console is priced at $300 but costs about $250 each to make. Sony’s fixed costs for its gaming departments total about $17M a month and they manage to sell about
1M consoles a month. Calculate Sony’s breakeven point in dollars
Step 1: Which formulas?We need to end up with a breakeven, point in dollars, which means we need to To calculate contribution margin as a %.
Step 2: Contribution Margin %CM = $300 - $250 = $50/unitCM% = $50/$300 = 0.16667
Step 3: BEP in Dollars$17M x 12 months = $204M/year fixed costs$204M/0.16667 = $1,123.976M a
Step 4: Concluding SentenceSony will have to sell $1,123,976,000worth of PS3 in order to breakeven

Changes in Volume and Sales
• It helps to create simple income statements to help show what the contribution margin is and how it changes when multiple components are changing
• Also consider using this formula:

CM Changes ExampleAssume basketballs can be made at a variable cost of
$5/unit and with fixed costs totalling $50,000 per month. Each basketball is sold for $15/each and
current sales total 5,000 units per month. Consider the following:
A) What is the profit impact if variable costs decrease by $2/unit, advertising costs are increased by $25,000 per month and therefore sales increase by 1,500 units?
B) What price should be charged in order to achieve $75,000 in monthly profits (keeping everything else the same)?Original
Total Sales 5,000 x $15 = $75,000Total Variable Costs 5,000 x $5 = $25,000Contribution Margin $50,000Fixed Costs $50,000Net Income $0
Condition A6,500 x $5 = $97,5006,500 x $3 = $19,500$78,000$50,000 + $25,000 = $75,000$3,000
Condition BRequired: $75,000 in Net Income$75,000 = (Price - $5)(5,000 units) – $50,000$125,000 = Price(5,000 units) - $25,000$150,000 = Price(5,000)Price = $30

Margin of Safety• The excess of budgeted (or actual) sales over the
break-even volume of sales
Sports Illustrated sells 3.5 million magazines a month at an average price of $5. The cost to produce one magazine is
approximately $0.50. Fixed expenses per month are $15M. What is their margin of safety?
Step 1: Breakeven Unit Sales
Breakeven Point in Units = (Fixed Costs)/(CM per unit)Breakeven Point in Units = $15M/(5-0.5) = 3,333,333.33Round up to 3,333,334 units
Step 2: Margin of SafetyMargin of Safety = Total Sales – Breakeven SalesMOS = 3.5M – 3.33M Margin of Safety is 166,667 units

CVP with Product Mixes• Companies which sell more than one product
involves a ratio called a ‘sales mix’ • Management will try playing around with ratios like
these to see which combination is more profitable• In situations with sales mixes the calculations for CM
will change to ‘average contribution per unit’:

Multiproduct ExampleBob’s tree farm sells two types of trees: pine and maple. The sales mix is 3:1 respectively. Each pine tree sells for $20 and each maple sells for $30. Bob
estimates that each pine tree costs about $12 to grow and maintain until it is sold and about $15 for
maples since they need more water. Bob’s fixed costs are $27,000 per year. Calculate Bob’s
breakeven point in units.
Step 1: Contribution Margin for Each Product
Maple = $30-$15 = $15Pine = $20 - $12 = $8
Step 2: Average Contribution Margin per Unit=(CM of pines x Sales mix %) + (CM of maples x Sales mix %)= ($8 x 75%) + ($15 x 25%)= $9.75
Step 3: Breakeven Point in UnitsBEP = Fixed Costs / Average CM per UnitBEP = $27,000 / $9.75BEP = 2,769.23Bob needs to sell 2,770 trees to breakeven

Cost Structure and Operating Leverage
• Cost structure is relative proportion of fixed costs and variable costs
• Operating leverage shows the proportion of your fixed costs
The higher the operating leverage, the higher a company’s fixed costs are compared to variable
costs so small changes in the volume of sales will result in large changes in income (and opposite)

Cost Structure and Operating Leverage
$ Sales
Volume
$
Volume
Sales
TotalExpenses
High Operating LeverageHigh Fixed / Low Variable Costs
Higher CM/UnitHigher Break-even Point
Greater RiskGreater Potential Returns
Low Operating LeverageLow Fixed / High Variable Costs
Lower CM/UnitLower Break-even Point
Reduced RiskLower Potential Returns
TotalExpenses

COST BEHAVIOUR AND COST SYSTEMSPart II

Cost Behaviours• Step costs change abruptly at intervals of activity because
the resources and their costs come in indivisible chunks (example: salaries)
• Mixed costs contain both variable and fixed cost elements – Example: maintenance costs – supplies + labour
Management Influenced Costs• Capacity costs - fixed costs incurred when achieving a
desired production level (example: building a plant)• Committed fixed costs -large indivisible chunks of cost that
the company is obligated to pay– Example: mortgage payments
• Discretionary fixed costs are heavily influenced by management’s decisions each period on how much to spend on things like advertising, research and development, training, etc. – Example: no more lavish award ceremonies every quarter for top
salesmen – These costs do not have clear connections to production output
levels
Every cost could essentially be committed /
discretionary but it depends on contracts
you have and your ability to change it

Measuring Cost Behaviour• The mixed cost function is an equation of the
cost and its driver; a linear equation looks like this
Salesmen are paid guaranteed salaries of $50,000 per year plus 2% commission on sales. The dollar value of sales each salesman brings in is the cost driver.
Calculate the total cost of wages given the following situations:
Dollars in Sales Situation A Situation BSalesman $400,000 $600,000
Situation ATotal Cost = $50,000 + ($400,000)2% = $58,000Situation B Total Cost = $50,000 + ($600,000)2% = $62,000

Activity Analysis Methods Engineering Analysis – review of costs
from past experiences Account Analysis – review of
accounting records and the subjective evaluation of patterns
High-Low Analysis – simple linear algebra method (unreliable results)
Scattergraph Analysis – line of fit method on a graph; where the intercept is the total fixed costs and every point on the line is an estimated total level of activity (X) and total costs (Y)- this method heavily uses the mixed cost
function Regression Analysis – a process of
finding the equation that best fits the data
Activity analyses are used to identify appropriate cost drivers for each individual activity and their effects on the costs of making a product
Measuring Cost Behaviour

High-Low Analysis ExampleGiven the following information, determine the cost
equation for custodial servicesMonth Hours of Custodial
ServicesTotal Cost
June 315 $5,000July 360 $5,570
August 250 $4,375September 500 $6,345
October 475 $6,200
Step 1: High and Low Levels of ActivityHigh 500 hours at $6,345Low 250 hours at $4,375
Step 2: Change in Activity and Variable Cost
Change in Cost = $6,345 - $4,375 = $1,970
Change in Hours = 500 – 350 = 250 hoursVariable cost = $1,970/250 hours = $7.88
Step 3: Fixed Cost Estimate (Using July Numbers)Total Fixed Cost = Total Cost – Total Variable CostTotal Fixed Cost = $5,570 – (360 x $7.88) = $2,733.20
Step 4: Cost EquationY = $2,733.20 + $7.88X

Regression Analysis• All the points are considered whereas the scattergraph
considers only the points on the line of best fit• The goal is to minimize the sum of the square errors • This is the most accurate method
Regression Analysis Output- The word “Constant” which appears on an output is the fixed cost- “R-squared” is an indicator of the accuracy of the results, the closer this
number is to 1, the more X (independent) explains changes in Y (dependent)
- “X-Coefficient” is the variable cost which is multiplied by the cost driver
Excel Commands- LINEST() gives the slope of the line of best fit- INTERCEPT () gives the intercept of the line (fixed cost)- RSQ() gives the ‘r-squared’ value

Cost Behaviour: Product and Period Costs
• Product Costs – all costs involved in the purchase or manufacture of products which are expensed when the product is sold – For a manufacturer these would include direct labour, direct
materials, etc. • Inventory for a manufacturer (DM, WIP, FG)
– For a retailer these would include freight costs, purchases, etc.
• Period Costs – costs expensed immediately without ever being included in inventory – Selling & administrative costs

Cost Methods: Absorb & Vary
Absorption Costing –includes manufacturing overhead in the costs which are assigned to
inventory– “Full Costing”, in accordance with GAAP– Costs are classified by function (selling vs. manufacturing)– Inventory costs consider both variable and fixed costs– This method produces a higher inventory value since it
includes fixed costs• With this method, fixed manufacturing overhead costs are
included in inventory, and a formula is used in order to allocate costs to ‘work-in-process’

Cost Methods: Absorb & Vary
Variable Costing – this approach tries harder to separate fixed costs from variable costs
and uses a style of income statements which highlights the total fixed costs
– “Direct Costing”– Costs are classified by behaviour (variable vs.
fixed)– Inventory costs consider only variable costs– This method helps with CVP analyses– Production does not affect operating income
under this approach – Under variable costing fixed costs can be
attributed to separate divisions and therefore controlled more easily

Absorption vs. Variable
ABC CompanyAbsorption Income Statement
Sales $75,000Cost of Goods Sold:
Direct Material 10,000Direct Labour 15,000Overhead 7,000
Gross Profit$43,000Selling Expenses 15,000Admin. Expenses 17,000Operating Income $11,000
Product Costs Period CostsAbsorption Costing Variable Manufacturing
Costs+ Fixed Manufacturing Overhead
Variable Selling & AdministrativeFixed Selling & Administrative
Variable Costing Variable Manufacturing Costs
Variable Selling & AdministrativeFixed Selling & Administrative+ Fixed Manufacturing Overhead
ABC CompanyVariable Costing Income Statement
Sales $75,000Variable Expenses:
Direct Material 10,000Direct Labour 15,000Overhead 3,000Variable Selling
8,000Variable Admin 8,000
Contribution Margin $31,000Fixed Expenses:
Overhead 4,000Selling & Admin 16,000
Operating Income $11,000

Absorption vs. Variable• Variable costing statements are considered easier
to understand because net operating income is only affected by changes in unit sales
• We cannot do CVP analysis with absorption costing because it considers overhead to be a variable cost
• Both methods can be used when filing tax returns, but only absorption costing is allowed for external purposes
• For absorption costing we use units produced; whereas with variable costing we use units soldRelationships b2n
Product and SalesInventory Effects Comparison b2n
IncomeProduction > Sales Inventory Absorption > VariableProduction < Sales Inventory Absorption < VariableProduction = Sales No Change Absorption = Variable

Segmented Income Statements
• Income statements for parts of a whole company – A contribution format is used and traceable fixed costs
should be separated from common fixed costs to allow for CVP analysis and segment margin calculations
– Absorption formation may be used anyway
• Traceable fixed costs are fixed costs incurred by that particular segment alone such as the rent for its facility
• Common fixed costs are incurred by the whole company such as the executive salaries or patent protection legal fees– Common costs cannot be arbitrarily assigned to segments
because managers will be put in charge of costs they have no control over

Segmented Income StatementsSegment margin is
the best gage of the long-run profitability of a segment
Traceable costs of one segment may be common costs to another
Company(Common Costs for
Everyone)
Division A: USA(Traceable Costs for
itself, Common costs for Segments)
Division A.1: Accounting
Dvision A. 2: Marketing
Division B: Canada Division C: Europe
Not in
Handout

COST ALLOCATIONPart III

Cost Management Systems• Costs are sacrifices of resources for a particular purpose (such
as money for materials)• A cost objective is a department or product for which cost
information is collected • Direct costs can be identified exclusively with a given cost
objective (i.e. – a product) in an economical way (can be easily and reliable measured)
• Indirect costs cannot... Overtime premium – an indirect cost which includes wages paid to workers in excess of their regular hoursIdle time – wages paid for unproductive time (when everyone is standing around) Defects– scrap, warranty claims, the cost of poor customer relationships (if you can figure out a $ for that)

Cost Management Systems• Differential Costs (Revenues) are the difference in cost (revenue)
between two alternatives– Example: If you are decided between buying a car that costs $20,000 or
buying a bus pass for the next 5 years which will in total cost $15,000• The differential cost is $5,000
• Opportunity Costs are the potential benefit that is given un when one alternative is selected over another– Example: You are deciding to either buy a car that costs $20,000 or spend
the money on a college diploma which would raise your salary from $10,000/year to $25,000/year
• The opportunity cost of buying the car would be the $15,000 in increased wages. • Sunk Costs are costs already incurred and paid for that are in the
past and cannot be changed and therefore have no bearing on future decisions– Example: If you are decided between buying a car that costs $20,000 or
buying a bus pass for the next 5 years which will in total cost $15,000 but you’ve already bought your bus pass for this month which cost $80.
• You’ve bought the pass already, it’s in the past and shouldn’t affect your decision here.

Manufacturing Costs• For companies who create their inventory from
scratch, there are three main categories of costs:– Direct Material Costs – cost of acquiring materials used– Direct Labour Costs – wages or labour that is exclusive to
production – Factory Overhead Costs – all other costs (utilities, equipment
depreciation, etc.)• These costs can be combined and reduced to two
categories– Prime Costs include direct labour and material costs– Conversion Costs include the costs of converting material
into finished products (direct labour and factory overhead costs)
Direct Materials
Direct Labour
Factory Overhead
Conversion Costs
Prime Costs

Cost Allocation• Cost Allocation is the process of linking
costs or cost pools (multiple costs grouped together) with one or more cost objects through identifying and selecting cost drivers– Synonyms of cost allocation cost tracing,
assignments, distributions, apportionment– Synonyms of cost drivers allocation base,
activity measure

Manufacturing Overhead Cost Allocation
• The POHR is used no matter what the real overhead costs are and what the actual allocation activity is
• The per unit cost calculated above ≠ marginal cost of the product; if an additional unit was produced the per unit cost would slightly decrease
Journal Entry Examples in
“Extras”

Underapplied / Overapplied• Since the POHR contains estimates, the manufacturing overhead that
we actually incur and the amount applied to Work in Process using the POHR will differ 99% of the time
• Underapplied overhead - overhead applied to jobs is less than the total amount of overhead actually incurred– this will result in a remaining debit balance in the manufacturing overhead
account• Overapplied overhead - overhead applied to jobs is greater than
the total amount of overhead actually incurred– this will result in a remaining credit balance in the manufacturing overhead
account
• The difference between applied overhead and actual overhead can be dealt with in three ways:1. Close directly to Cost of Goods Sold Expense2. Allocate proportionately between WIP, Finished Goods, and COGS
Expense• based on their relative dollar value
3. Carry the balance in manufacturing overhead over to the next year

Overhead Application Example
Toyota has incurred a total of $15.0M in manufacturing overhead this month with a total of 500,000 labour hours worked on cars. Calculate the manufacturing overhead applied to Work-in-Progress cars over the month using a predetermined overhead rate of $12/hour. Was the manufacturing overhead overapplied, underapplied, or perfect ? Provide the journal entry required to close any unapplied overhead to cost of goods sold.
Step 1: Apply OverheadApplied Overhead = POHR X Actual Direct Labour HoursApplied Overhead = $12/hour X 500,000Applied Overhead = $6.0M
Step 2: Over/Underapplied?= Actual Overhead – Applied Overhead= $15M - $6M = $9M Underapplied
Step 3: Journal EntryDebit : Cost of Goods Sold $9MCredit : Manufacturing Overhead
$9M

POHR and Capacity• Biggest criticisms of using the POHR:
– Using estimates and budgeted activity levels will result in product costs that fluctuate all the time
– Applies costs that had nothing to do with products like idle time
• Using capacity limits instead of the estimated number of allocation base will reduce the overhead rate– the difference between the capacity rate and the POHR is
the idle capacity cost
Equipment is leased for $400,000 / year. A plant working at full capacity can produce 80,000 units, but the company estimates 60,000 will be made. The POHR will be $6.67/unit using the regular formula but if we
use capacity units instead it will only be $5/unit.

Professional EthicsHow will understating the estimated direct labour hours in the base for the POHR affect operating income?
Remember:
- Artificially high overhead rate- Overapplied overhead debit balance in manufacturing
overhead account- This will reduce COGS when the account is closed- This will result in higher net income
Not in
Handout

SYSTEM DESIGN AND ALLOCATIONPart IV

Product Costing Systems• Process Costing – the company mass produces one
homogenous product– Costs are accumulated by departments and thus calculates unit costs by department as well– Production is uniform on all units
• Job – Order Costing System – the company builds to order a range of unique products– Direct materials and labour will be allocated to each job as they are incurred– Indirect costs (like overhead) will accumulate over time and then be allocated

Process Costing• A processing department is any part of a
company where work is performed on a product• Transferred-in costs are those that were used in
one department and then sent to another department
The Processing
Story in “Extras”

Equivalent Units (Weighted Average
Method)• The number of complete units you could get
from putting together all the partially complete units that are sitting around in Work in Process inventory at the end of a period
Example: one unit that is 70% done put together with another unit 30% complete makes one completely
finished equivalent unit

Equivalent Units Example (Weighted Average
Method)Given the information below, calculate the equivalent
units both in terms of materials and conversion costs and also calculate the total cost per equivalent unit.
(answer in the handout)
Percent Completion Dollar ValueDepartment One
Units Materials Conversion
Materials Conversion
Beginning WIP inventory
350 60% 75% $16,000 $10,000
Units Completed and Transferred
8,000 100% 100% N/A N/A
Costs Added During Production
N/A N/A N/A $175,000 $280,000
Ending WIP Inventory
2,000 50% 35% N/A N/A

Service Department Cost Allocations
• Operating departments are the ‘heart and soul’ of the organization and carry out its purpose in life
• Service departments support the company and its operating departments; their costs incurred by these departments are allocated unto the operating departments which in turn allocate all costs to units produced
• Reciprocal Services is the term used to describe the concept of service departments and operating departments provided services to each other
Service Department
Costs
Operating Department Costs
Products

Service Allocation Methods: Direct
Ignore transactions between service departments and assume service
departments only provide to operating departments
All costs are allocated to operating departments based on the proportion of total
allocation base
Service Operating

Direct Method ExampleThe accounting department of Cars Inc. has incurred $2.5M in
costs over the year. Management has calculated that the accounting team has worked 50,000 hours this year and
employs 110 people.
The cafeteria has incurred $1M in costs over the year, employs 20 and has worked 8,000 hours.
Cars Inc.’s manufacturing plant has incurred $10M in costs this year, has worked 60,000 hours and employs 200 people.
The customization plant incurred $15M in costs, has worked 40,000 hours and employs 100 people.
Assume the allocation bases for accounting and cafeteria departments are hours and employees, respectively.

Service Allocation Method: Step-Down
Service Department “A” provides services to Service Department “B” (but no reciprocation) and both pass
on to the Operating Departments
All costs incurred by service departments are allocated to operating departments based on the proportion of
total allocation base
TIPS- Order matters, we need to know which service
department serves the other
Service A
Service B
Operating

Step-Down Method Example
The accounting department of Cars Inc. has incurred $2.5M in costs over the year. Management has calculated that the accounting team has worked 50,000 hours this year and
employs 110 people.
The cafeteria has incurred $1M in costs over the year, employs 20 and has worked 8,000 hours.
Cars Inc.’s manufacturing plant has incurred $10M in costs this year, has worked 60,000 hours and employs 200 people.
The customization plant incurred $15M in costs, has worked 40,000 hours and employs 100 people.
Assume the allocation bases for accounting and cafeteria departments are hours and employees, respectively.

Service Allocation Method: Reciprocal
Service Department “A” provides services to Service Department “B” and vice versa
Know what it is, but not how to do it.
Service A

ABC COSTINGPart V

Activity-Based Costing• A non-traditional way of allocating costs• ABC costing is more careful about which costs are
considered; only costs that are affected by product-related decisions are used– not all manufacturing costs, some non-manufacturing costs
• ABC costing has the highest number of cost pools and overhead application rates– POHR applies to the entire factory and all its departments– Process costing uses different overhead rates for
departments– ABC costing has as many rates as there are activities
• The ABC costing method has the ability to segregate costs associated with unused capacity

Activity Costing• An activity is an event that causes the consumption
of overhead resources (i.e. taking customer orders)
Five Levels of Activity1. Unit-Level Activities – activities that arise each time a
product is produced (i.e. electricity)2. Batch-Level Activities – activities that involve processing or
handling batches of product (i.e. moving them) 3. Product-Level-Activities – activities related to products that
must be done regardless of production (i.e. marketing and engineering design)
4. Customer-Level-Activities – have to do with the customers themselves (i.e. customer service)
5. Organization-Sustaining-Activities – are done no matter what else is going on
This is the only type of activity
directly related to volume of production

General Structure of ABC
1 •Cost Objects generate activities•(i.e products)
2 •Activities consume resources•(i.e. production)
3 •Consumption of Resources causes costs•(i.e. materials required in production)
4 •Costs •(i.e. materials cost money)

Implementation of ABC1. Identify and define activities
– There is no ‘right’ or ‘wrong’, there is ‘accurate’ and ‘less accurate’
2. Assign overhead costs to activity cost pools
– Only overhead, no direct or indirect3. Calculate activity rates
– Using total activity estimates for each activity4. Assign overhead costs to cost objects
– Common cost objects: products, orders, customers
5. Prepare management reports

Management ReportsProduct Margin Calculation
Product A Product BSales $2,660,00
0$540,00
0Costs
Direct MaterialDirect LabourShippingCustomer OrdersProduct DesignOrder Size
Total Cost
$905,500
263,750
60,000192,00
00
332,500
1,753,750
$69,50087,5005,000
128,000252,00047,500
589,500
Product Margin $906,250 ($49,500)
These costs are assigned using other
cost systemsCalculated using the
ABC Costing process
Product A did not do any
product design
This company is
losing money every time it
makes Product BWith this we can make big
decisions such as whether we should consider cutting out
Product B

Management ReportsCustomer Profitability Analysis
Customer 123Sales $11,350Costs
Direct MaterialDirect LabourShippingCustomer OrdersProduct DesignOrder SizeCustomer Relations
Total Cost
$2,123 1,900
205 960 630 3,363 1,470
10,651Product Margin $699
Calculated using the ABC
Costing process (Stage 4)Notice that we now add customer
relations costs
Here we can make decisions such as whether or not it is
worth keeping this customer

ABC vs. Traditional Costing• Traditional costing uses one plant wide
manufacturing overhead rates• All shipping, marketing and administrative expenses
are not allocated to the productProduct A Product B
Sales $2,660,000 $540,000
CostsDirect MaterialDirect LabourManufacturing Overhead
Total Cost
$905,500263,750875,000
2,044,250
$69,50087,500
125,000
282,000
Product Margin $615,750 $258,00
We are not losing
money on this
product according
to this method
Same in for
traditional and
ABC Only one cost pool:
overhead
Product B is “undercosted” giving it a much higher product
margin than it should

Cons of ABC Costing• ABC costing is not typically used for external
reporting because– Don’t need all the detail– Cost too much to start using ABC Costing– GAAP standards don’t like ABC– There is a lot of subjectivity
• ABC costing has its own limitations too– It costs a lot of money– Resistance from the employees when new systems are
put in place– Misinterpretation of the results– Many companies like to allocate all their costs to the
products rather than to customers and orders– Everyone needs to conform to GAAP

Final Study Tips- Your textbook is good- Read your end-of-chapter summaries
posted on MyLearningSpace- Practice questions in order to
understand concepts better- Do not memorize how to do calculations


EXTRA EXAMPLES AND CONCEPTSPart VI

Manufacturing Overhead Entries
1. All costs incurred by a company will be recorded as expenses in the accounting books over the year
2. Direct materials used are taken out of ‘Raw Materials’ and placed into ‘Work-in-Process’
3. Materials that are indirectly used over the course of the period are also taken out of ‘Raw Materials’ but are instead placed in ‘Manufacturing Overhead’
4. Wage costs are added to ‘Work-in-Process’ or ‘Manufacturing Overhead’ depending on whether they are direct or indirect labour expenses
5. Any other costs that are incurred by the manufacturing facilities are also debited to manufacturing overhead over the course of the period
6. Any other costs that are incurred by the manufacturing facilities are also debited to manufacturing overhead over the course of the period
7. When the product is complete, all the costs incurred to produce it are sent to ‘Finished Goods Inventory’ until the product is sold; at which time those costs then go to ‘Cost of Goods Sold Expense’

The Processing Story1. Raw materials are bough by the company and are debited to
the ‘raw materials inventory’ asset account2. When processing departments need raw materials, a journal
entry is recorded to show where the materials went3. The workers of the company do their jobs and are paid; but
when a company has different processing departments, the cost of labour is assigned to the department the employee works in
4. Manufacturing overhead is incurred randomly over the course of the period
5. Manufacturing overhead is applied to each processing department using a predetermined rate
6. When department A has completed its job, it passes on its inventory to department B (transferred-in costs)
7. When the last department is done making the product, all its inventory is passed into “Finished Goods Inventory” (storage)
8. When the products are sold, their cost is finally debited to Cost of Goods Sold Expense and that’s the end!

BACK TO THE BASICSPart VII

The Basics
• Debits and credits just represent the sides of a “general ledger” which is a book used to record transactions– DO NOT think of them as positives and negatives
• These are used in a double-entry accounting system to create a logical method of financial reporting
• “Normal balances” for accounts refer to which side of the general ledger represents an increase for the account
debits = assets, expensescredits = liabilities, owner’s equity, revenue

The Basics• Assets are future benefits to the company
which resulted from past events– Objects that will be used to make money– Objects that will be sold for money– Cash to spend on more objects
• Liabilities are sacrifices the company will have to make, or IOUs they have from the past
• Equity is what is left over when assets are netted against liabilities; or, what is left for the owners of the company to claim as theirs
See part II

The Basics
Everything is based around the same simple formula:
Assets = Liabilities + Owner’s Equity
When writing any transaction, this formula must apply.

Transaction Examples1. On December 1, $25,000 of office
supplies was bought on credit. What is the transaction?
2. On April 10, $100,000 worth of cash dividends was paid out to shareholders. What is the transaction?
3. A new employee was hired on October 22, 2010. What is the transaction?
NOTICE: Transactions are never written with negative numbers.

Accounting Cycle
1. Something happens – is it a transaction or not? 2. Journalization – writing transactions down in a journal3. Posting – calculating totals for all accounts on a daily or monthly
basis (or automatically)4. Trial Balance – making sure all debits equal all credits and all
accounts have their correct balances– must always net to zero
5. Adjustments – updating accruals, expensing prepaid accounts, calculating depreciation, unearned revenue, inventory, etc.
6. Adjusted Trial Balance7. Financial Statements
– some people like to use work sheets to help them create financial statements8. Closing – wiping out temporary accounts (expenses and revenues) to
get ready for the new year9. Post-Closing Trial Balance10. Reversing Entries – If necessary.. usually only if you’ve made a
mistake and have to go back and fix it

Adjusting Entry Examples1. On April 1, 2010 XYZ spent $24,000 for a year’s
worth of insurance. Prepare the adjusting journal entries for December 31.
2. In August 2010 Magazines Inc. received $36,360 for year-long subscriptions which started September 1. Prepare the adjusting journal entries for December 31.
3. ABC’s employees are paid $12,000 every other Friday. December 31, 2010 is the company’s year end, but also halfway through a pay-period. Which accounts are affected by this and what amounts should appear on the company’s financial statements?