bsr temo/up-temo gunnar lindberg nordregio espon seminar “territories acting for economic growth:...
TRANSCRIPT

BSR TeMo/Up-TeMo
Gunnar LindbergNORDREGIO
ESPON Seminar“Territories Acting for Economic Growth:
Using territorial evidence to meet challenges towards 2020”
Inspire policy making by territorial evidence

Nordregio (Lead Partner) (also in Up-TeMo)
University of Gdansk (also in Up-TeMo)
Aalto University (also in Up-TeMo)
RRG (also in Up-TeMo)
Institute of Geography and Spatial Organization
Polish Academy of Sciences
BGI Consulting Ltd.
Geomedia LLC
Project Partners


“Need to strengthen a policy oriented territorial analysis
Policymakers, stakeholders and practitioners involvement during analysis definition, development and validation”
- Graziella Guaragno, Workshop 1.A (yesterday)

What we have built
Stakeholder driven,
policy centered,
indicator based,
and analytically advanced,
monitoring of territorial dev.
in the BRS region

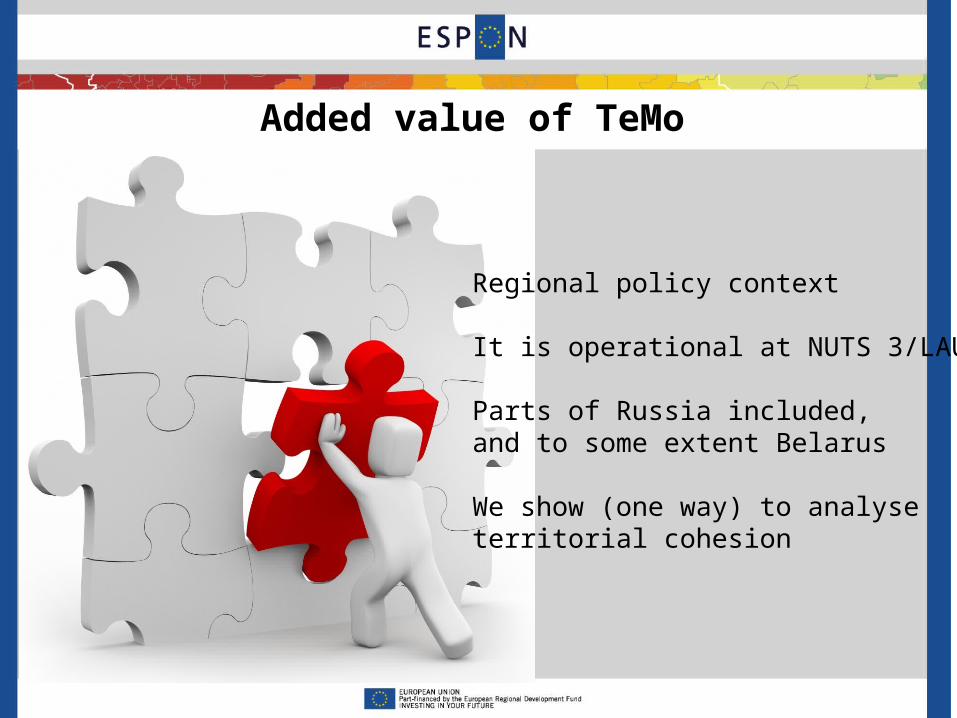
Added value of TeMo
Regional policy context
It is operational at NUTS 3/LAU2.
Parts of Russia included,and to some extent Belarus
We show (one way) to analyse territorial cohesion
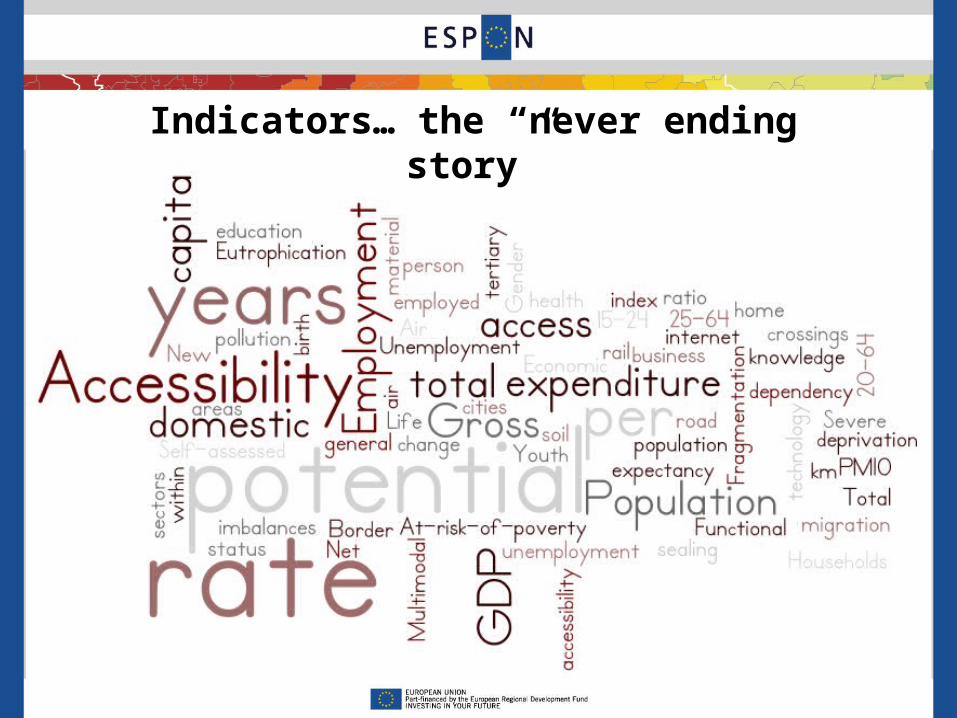
Indicators… the “never ending story”

(1.) The Gini Concentration Ratio (2.) The Atkinson index (3.) The 80/20 ratio (4.) Sigma-convergence (5.) Beta-convergence (6.) The east/west ratio (7.) The south/north ratio (8.) The urban/rural ratio (9.) The non-border/border ratio (10.) The coast/inland ratio
Analytical “toolbox” / Complex indicators
”Distribution”
”Convergence”
”Targeted/Territorial”


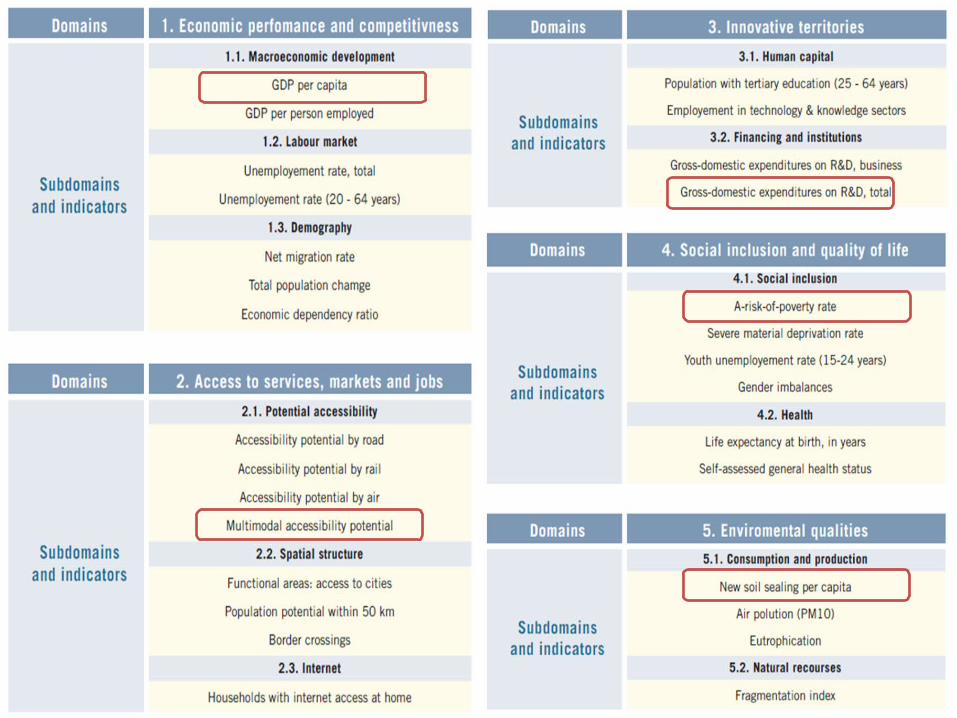
I ndicator BY DE DK EE FI LT LV NO PL RU SE
GDP per capita
GDP per person employed
Unemployment rate
Employment rate
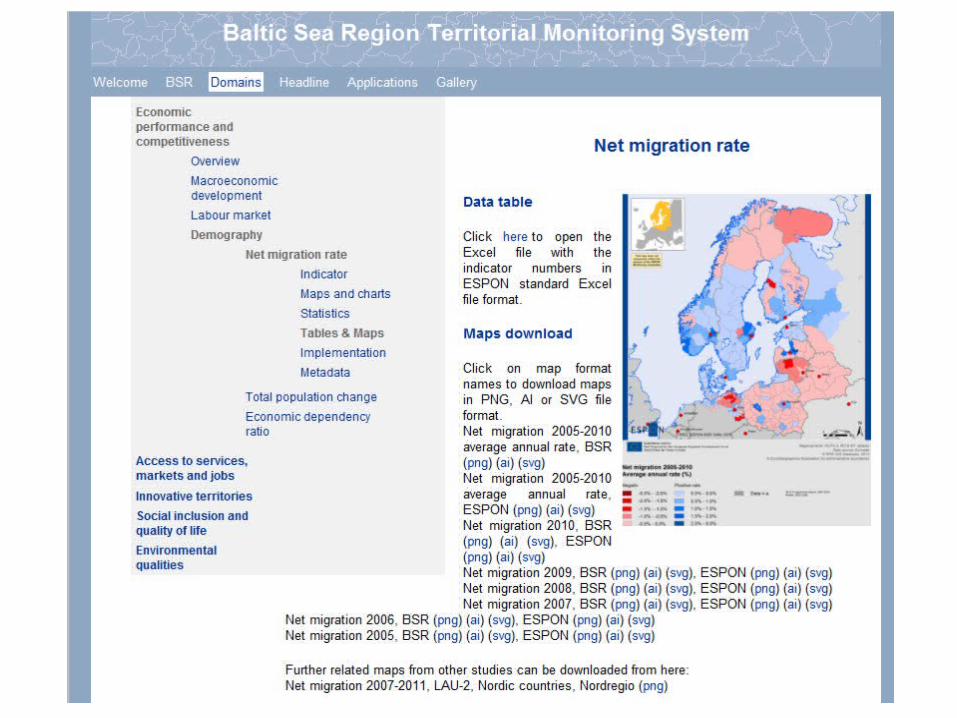
Net migration rate
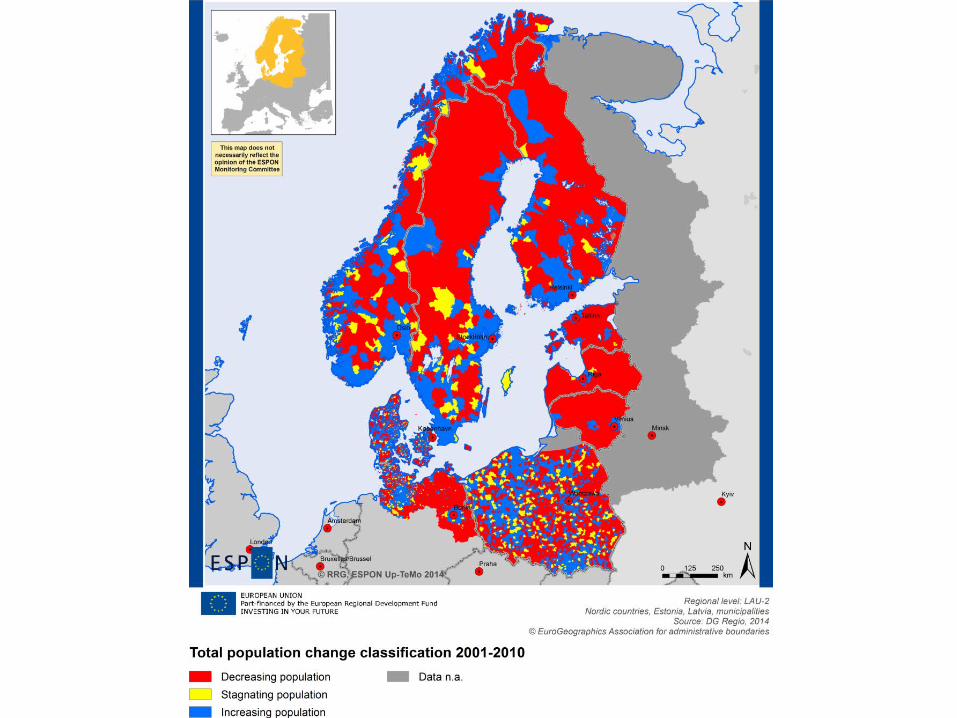
Total population change
Economic dependency ratio
Accessibility potential by road Χ Χ
Accessibility potential by rail Χ Χ
Accessibility potential by air Χ Χ
Multimodal accessibility potential Χ Χ
Functional areas: access to cities
Population potential within 50 km Χ Χ
Border crossings

I ndicator BY DE DK EE FI LT LV NO PL RU SE
Households with internet access at home
Χ Χ ( ) Χ
Population with tertiary education
Employment in technology & knowledge sectors
Χ Χ Χ Χ
Gross-domestic expenditures in R&D, business
Χ Χ Χ
Gross-domestic expenditures in R&D, total
Χ Χ
At-risk-of-poverty rate Χ Χ
Severe material deprivation rate Χ Χ Χ
Youth unemployment rate Χ ( )
Gender imbalances
Life expectancy at birth ( )
Self-assessed health status Χ
New soil sealing per capita Χ Χ Χ
Air pollution (PM10) Χ Χ Χ
Fragmentation index Χ Χ
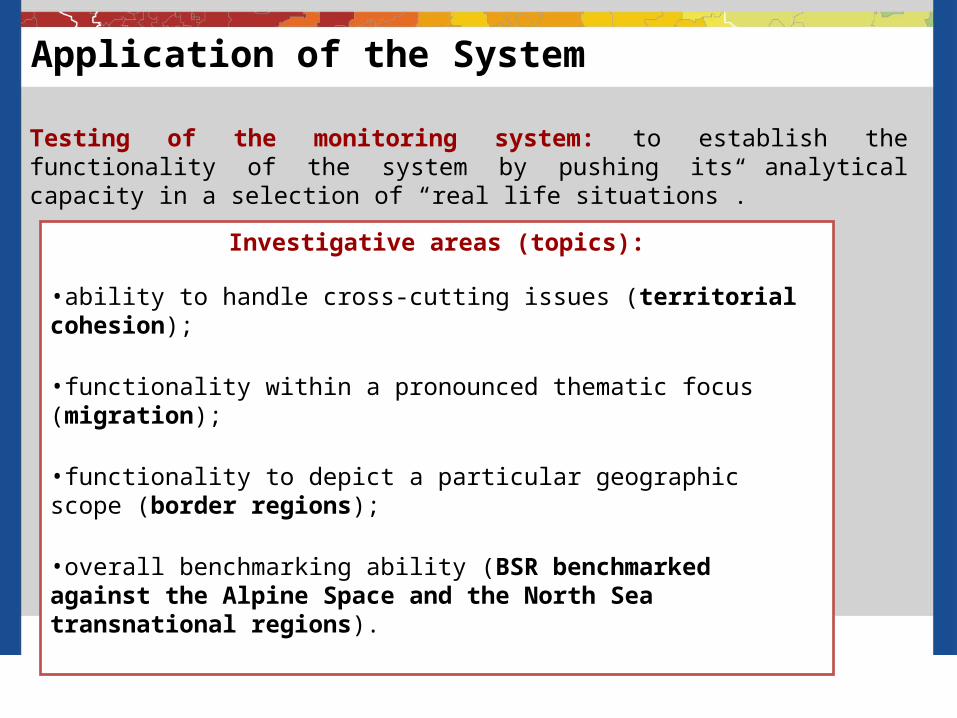
Application of the System
Testing of the monitoring system: to establish the functionality of the system by pushing its analytical capacity in a selection of “real life situations”.
Investigative areas (topics):
•ability to handle cross-cutting issues (territorial cohesion);
•functionality within a pronounced thematic focus (migration);
•functionality to depict a particular geographic scope (border regions);
•overall benchmarking ability (BSR benchmarked against the Alpine Space and the North Sea transnational regions).

The Principal Divides (1): East-West
Between more and less affluent countries.
The sharpest divide today can be found within the socio-economic spheres of development.
In terms of for instance poverty or health, the BSR displays a substantial variation.
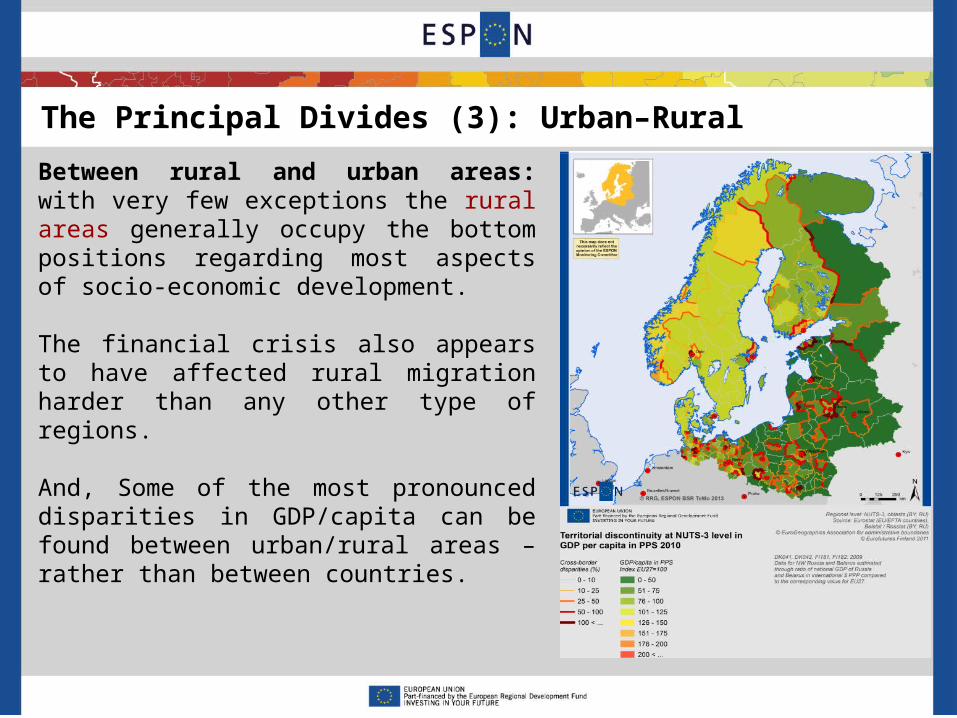
Between rural and urban areas: with very few exceptions the rural areas generally occupy the bottom positions regarding most aspects of socio-economic development.
The financial crisis also appears to have affected rural migration harder than any other type of regions.
And, Some of the most pronounced disparities in GDP/capita can be found between urban/rural areas – rather than between countries.
The Principal Divides (3): Urban–Rural

Migration: trends 2005-2010
Average annual net migration rate 2005 - 2010 according to various territorial typologies in the BSR, NUTS level 3
Border
Non-border
Sparse
Non-sparse
Coast
Inland
Predominantlyurban region
Intermediateregion
Predominantlyrural region
Capital cityregion
Second-tiermetro region
Smallermetro region
Other region
-0.3 %
0.0 %
0.3 %
0.6 %
Typology onurban-rural
regions
Typology onmetropolitan
regions
Externalborderregions
Sparselypopulatedregions
Coastalregions
Net
mig
ratio
n ra
te, a
nnua
l ave
rage
in %

Benchmarking

Benchmarking

Comparison with EU territory


Looking forward!
“Upholding” TeMo
Updating indicators
Adding an “urban” dimension
Further understanding of stakeholder needs