bs series broadcasting service (sound) - itu · recommendation itu-r bs.1864 as a zero point. an...
TRANSCRIPT
Report ITU-R BS.2054-4 (11/2014)
Audio levels and loudness
BS Series
Broadcasting service (sound)
ii Rep. ITU-R BS.2054-4
Foreword
The role of the Radiocommunication Sector is to ensure the rational, equitable, efficient and economical use of the radio-
frequency spectrum by all radiocommunication services, including satellite services, and carry out studies without limit
of frequency range on the basis of which Recommendations are adopted.
The regulatory and policy functions of the Radiocommunication Sector are performed by World and Regional
Radiocommunication Conferences and Radiocommunication Assemblies supported by Study Groups.
Policy on Intellectual Property Right (IPR)
ITU-R policy on IPR is described in the Common Patent Policy for ITU-T/ITU-R/ISO/IEC referenced in Annex 1 of
Resolution ITU-R 1. Forms to be used for the submission of patent statements and licensing declarations by patent holders
are available from http://www.itu.int/ITU-R/go/patents/en where the Guidelines for Implementation of the Common
Patent Policy for ITU-T/ITU-R/ISO/IEC and the ITU-R patent information database can also be found.
Series of ITU-R Reports
(Also available online at http://www.itu.int/publ/R-REP/en)
Series Title
BO Satellite delivery
BR Recording for production, archival and play-out; film for television
BS Broadcasting service (sound)
BT Broadcasting service (television)
F Fixed service
M Mobile, radiodetermination, amateur and related satellite services
P Radiowave propagation
RA Radio astronomy
RS Remote sensing systems
S Fixed-satellite service
SA Space applications and meteorology
SF Frequency sharing and coordination between fixed-satellite and fixed service systems
SM Spectrum management
Note: This ITU-R Report was approved in English by the Study Group under the procedure detailed in
Resolution ITU-R 1.
Electronic Publication
Geneva, 2015
ITU 2015
All rights reserved. No part of this publication may be reproduced, by any means whatsoever, without written permission of ITU.
Rep. ITU-R BS.2054-4 1
REPORT ITU-R BS.2054-4
Audio levels and loudness
(2005-2008-2011-2012-2014)
TABLE OF CONTENTS
Page
1 Definitions ...................................................................................................................... 2
2 Introduction .................................................................................................................... 3
3 Loudness considerations ................................................................................................. 3
4 Operating in the digital domain ...................................................................................... 4
5 Use of audio meters ........................................................................................................ 4
5.1 VU meters ........................................................................................................... 4
5.2 Peak meters ......................................................................................................... 5
5.3 Loudness meters ................................................................................................. 5
6 Harmonization of audio alignment levels for digital programme exchange – Adoption
of SMPTE RP155 ........................................................................................................... 5
7 Peak audio level .............................................................................................................. 6
8 The studio environment .................................................................................................. 6
9 Application of volume compression in post-production following the final mix of a
television commercial soundtrack .................................................................................. 7
10 Loudness range calculation ............................................................................................ 8
10.1 Loudness range ................................................................................................... 8
10.2 Example algorithm overview .............................................................................. 8
10.3 Example algorithm definition ............................................................................. 8
10.4 MATLAB implementation of example loudness range algorithm ..................... 10
11 Ingest of soundtracks into the television broadcasting chain ......................................... 11
12 Tests performed at CBS .................................................................................................. 13
13 Effect of channel format on predicted programme loudness .......................................... 14
13.1 Introduction ......................................................................................................... 14
13.2 A survey of audio loudness in multichannel television programmes ................. 16
2 Rep. ITU-R BS.2054-4
Page
13.3 Objectives of the survey ..................................................................................... 16
13.4 Metering .............................................................................................................. 16
13.5 Results ................................................................................................................. 17
13.6 Abnormal usage of the LFE channel .................................................................. 18
13.7 Conclusions ......................................................................................................... 18
14 References ...................................................................................................................... 23
1 Definitions
Alignment level An audio level used for alignment of VU meters. Refer
Recommendations ITU-R BS.645 and ITU-R BS.1726 for more
information.
Audio level The reading from an audio level meter such as a volume unit (VU)
meter or peak programme meter (PPM) meter. Note that these meters
read different properties of an audio signal, and the interpretation of the
audio level changes accordingly. Fluctuating signals, such as most
programme material, can also result in differences in interpretation.
Unless otherwise stated, audio levels in this document are read with a
VU meter.
Audio loudness level The reading from an audio loudness meter, typically conforming with
Recommendation ITU-R BS.1770.
dBFS Audio level in decibels relative to clipping point (“full scale”) in a
digital audio system.
LKFS Loudness level on an absolute digital scale, using “k” weighting as
defined in Recommendation ITU-R BS.1770, analogous to dBFS. An
increase of 1 LKFS corresponds to an increase of 1 dB on all active
channels in an audio system.
Loudness meter A meter indicating approximate perceived loudness under defined
listening conditions, typically conforming with Recommendation
ITU-R BS.1770.
LU Relative loudness level, often using the reference loudness level in
Recommendation ITU-R BS.1864 as a zero point. An increase of 1 LU
is the same as an increase of 1 LKFS.
Quasi-peak level The reading from a PPM meter.
Permitted maximum level An audio level used for alignment of PPM meters. Refer
Recommendations ITU-R BS.645 and ITU-R BS.1726 for more
information.
Rep. ITU-R BS.2054-4 3
PPM The units used on a PPM meter. Two scales are used, the BBC scale
1 – 7 (using steps of 4 dB) and a dB-like scale ranging from negative to
positive values, similar to a VU meter. When a reading is given without
the sign, the BBC scale should be assumed.
PPM meter Pseudo-peak meter, defined in IEC 60268-10.
Reference loudness level A loudness level specified in Recommendation ITU-R BS.1864 for
average programme loudness.
True peak level The reading from a true peak meter.
True peak meter An oversampling peak meter, typically conforming with
Recommendation ITU-R BS.1770.
VU The units used on a VU meter. An increase of 1 VU is equal to an
increase of 1 dB.
VU meter An alternative name for a volume indicator, as defined in IEC 60268-17
and BS 6840-17.
2 Introduction
The ITU-R has three Recommendations relating to measurement of programme loudness:
– Recommendation ITU-R BS.1770 – Algorithms to measure audio programme loudness and
true-peak audio level;
– Recommendation ITU-R BS.1771 – Requirements for loudness and true-peak indicating
meters;
– Recommendation ITU-R BS.1864 – Operational practices for loudness in the international
exchange of digital television programmes.
This Report is a companion to those Recommendations. It offers advice on managing audio levels
and loudness for the ingest and emission of television programmes which include pre-recorded
television advertisements (commercials). This advice covers the processes of studio production,
recording onto storage media, transport of the media and broadcast via a television presentation and
emission system. The Report is based on elements of the approaches of several administrations to
these processes.
One of the ITU’s aims in formulating Recommendations on loudness management is to give
broadcasters a means to control audio levels which can minimize the need to compress the dynamic
range of the audio. It is recognized however that some dynamic range processing may still be desired
by content producers for creative purposes and/or to enhance speech intelligibility. Guidelines have
therefore been provided specifying that volume compression used after the final mix of a television
commercial soundtrack should be restricted to a slope of 2:1 with an onset point of –12 dBFS.
3 Loudness considerations
Within most broadcasting systems, television broadcasters transmit material of varying programme
genres contiguously and interspersed with inserted material, including advertisements. There is a
potential for variations in the perceived loudness of adjacent audio segments, particularly at transition
points.
Correct alignment of audio loudness levels through the various stages of production and transmission
and the careful management of dynamic range both contribute to audience satisfaction.
4 Rep. ITU-R BS.2054-4
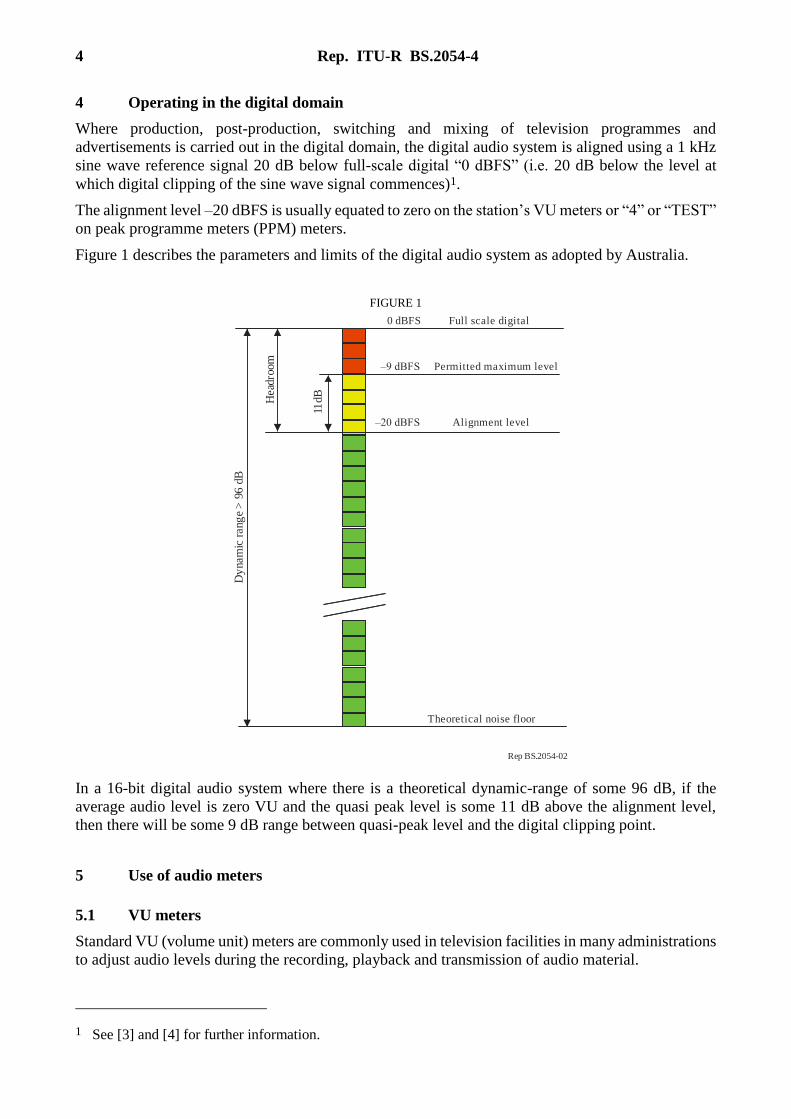
4 Operating in the digital domain
Where production, post-production, switching and mixing of television programmes and
advertisements is carried out in the digital domain, the digital audio system is aligned using a 1 kHz
sine wave reference signal 20 dB below full-scale digital “0 dBFS” (i.e. 20 dB below the level at
which digital clipping of the sine wave signal commences)1.
The alignment level –20 dBFS is usually equated to zero on the station’s VU meters or “4” or “TEST”
on peak programme meters (PPM) meters.
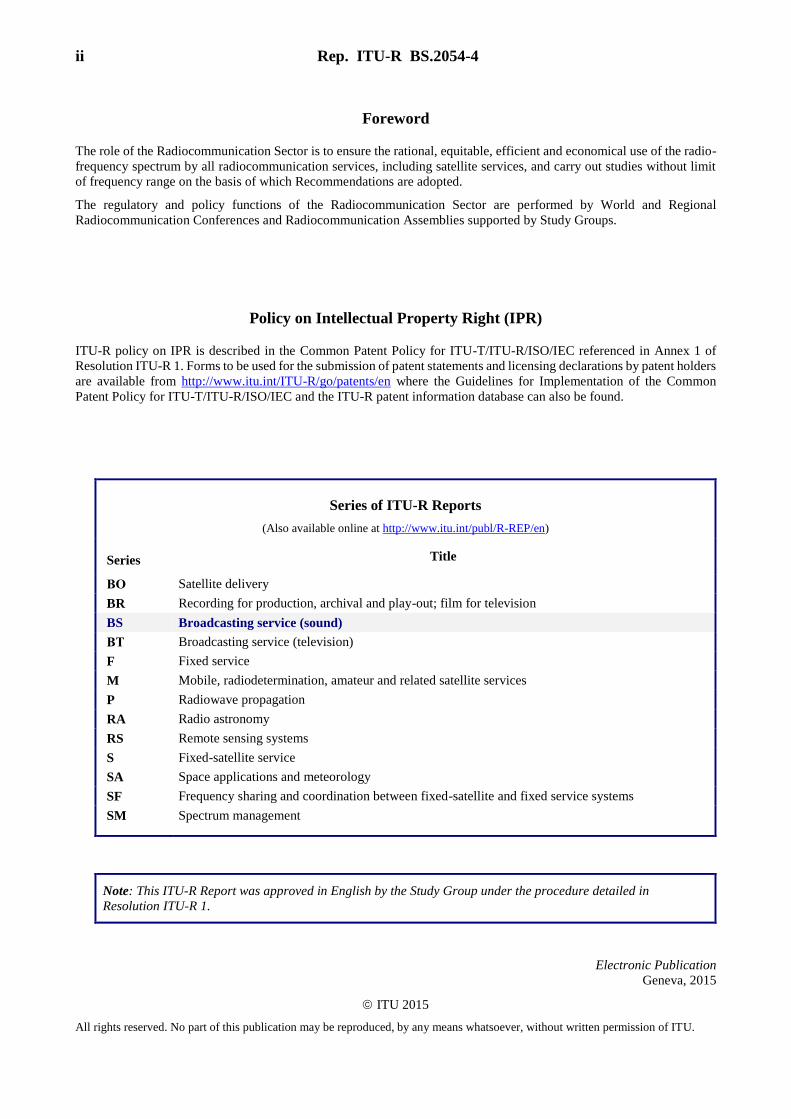
Figure 1 describes the parameters and limits of the digital audio system as adopted by Australia.
FIGURE 1
Rep BS.2054-02
Full scale digital
Alignment level
Theoretical noise floor
Dy
nam
ic r
ang
e >
96 d
B
Permitted maximum level
11dB
Head
room
0 dBFS
–20 dBFS
–9 dBFS
In a 16-bit digital audio system where there is a theoretical dynamic-range of some 96 dB, if the
average audio level is zero VU and the quasi peak level is some 11 dB above the alignment level,
then there will be some 9 dB range between quasi-peak level and the digital clipping point.
5 Use of audio meters
5.1 VU meters
Standard VU (volume unit) meters are commonly used in television facilities in many administrations
to adjust audio levels during the recording, playback and transmission of audio material.
1 See [3] and [4] for further information.
Rep. ITU-R BS.2054-4 5
A VU meter will indicate an “average” audio level, but cannot indicate the instantaneous level of
audio peaks. The standard VU meter has an integration time2 of 300 ms and thus its transient reading
relates to that particular integration time.
A VU meter scale is not capable of directly representing the full dynamic range of audio signals in
analogue or digital systems but VU meters provide a convenient means of ascertaining that the audio
level is within normal parameters relative to the alignment level and they provide some limited
indication of loudness.
It should be noted that in production and broadcasting establishments there is a wide range of audio
level indicators including LED and on-screen devices commonly called “VU meters”. Although most
audio level indicators will return consistent measurements under steady state conditions such as that
produced by a sinusoidal alignment tone, there may be inconsistencies between instruments where
they are used to measure fluctuating programme levels.
5.2 Peak meters
The peak programme meter (PPM) indicate quasi peak levels more accurately than the VU meter
because its time constants are optimized for such measurement3.
This makes PPMs more useful in the management of system headroom but they are of limited use in
assessing loudness.
Sample peak meters indicate the absolute peak level of a signal for individual digital sample values.
As such they have no value or use in assessing loudness. However, their value is in anticipation and
prevention of clipping. An oversampling version of the sample peak meter is called a true peak meter.
Such meters are valuable for anticipating and preventing clipping in oversampling D/A converters. A
true peak meter algorithm is described in Recommendation ITU-R BS.1770.
5.3 Loudness meters
The development of meters which approximately model the human perception of loudness when the
signal is reproduced on loudspeakers in a reference listening environment has led to the development
of Recommendation ITU-R BS.1770.
Such meters provide producers and broadcasters with an objective means of comparing the perceived
loudness of adjacent programme segments or commercial/programme junctions or differences
between services, solely by measuring the electrical signal level.
6 Harmonization of audio alignment levels for digital programme exchange – Adoption
of SMPTE RP155
Australian television broadcasters have adopted SMPTE RP155 audio levels for the digital audio
interface.
For television recordings a sinusoidal steady state tone at 1 kHz representing the alignment level of
–20 dBFS should precede programme material presented for broadcast. This level is usually equated
to zero (zero VU) on the station’s VU type audio level meters and is used to align the broadcaster’s
recording and transmission equipment to the same reference level as the originating equipment.
2 VU meters are specified to reach 99% of final reading in 300 ms. The time to reach 63% of final value
(–4 dB) is around 160 ms.
3 Nominal PPM rise time is 5 – 10 ms to reach 4 dB below final value. Fall time is 2 s for 20 dB fall.
6 Rep. ITU-R BS.2054-4
When measured with a VU type meter, the normal audio level of the programme material that follows
the alignment signal should be approximately zero VU.
When measured with a PPM or digital equivalent type meter, the normal quasi peak audio level of
programme material will, depending on the level of processing used, vary typically in the range of
+2 to +9 dB above alignment level (heavily compressed commercials and pop music may not peak
above 4 or 4.5 on a PPM. In contrast wide range classical music might read ppm 6 to 6.5).
7 Peak audio level
In the digital domain quasi peak level should not exceed –9 dBFS, i.e. quasi peak excursions should
not be more than 11 dB above the alignment level. It must be understood that +11 dB in this context
is not a deliberate target for production levels, but is a technical limit to be observed. This limit will
help ensure that short-duration true peaks do not reach 0 dBFS (full scale).
8 The studio environment
Studio digital sound systems typically operate with dynamic ranges of more than 90 dB. The lower
limit in a digital audio system is determined by the theoretical digital noise floor where there is no
meaningful data. This lower limit is principally determined by the audio word length (16, 18, 20,
24 bits).
The upper limit in a digital audio system is defined as the full-scale digital level, 0 dBFS. At that
point, digital clipping occurs because the audio signal cannot be adequately represented by the finite
number of data bits available.
Using a VU metering system, programme audio material should be recorded such that the normal
programme level is around zero VU with occasional louder passages allowed to exceed this level by
2 or 3 dB (+3 dB being the limit on most VU meters). In a normal broadcast audio mix of speech and
music and/or sound effects (not a proprietary multichannel surround mix), the dialogue level will
typically fall at around –2 to –3 dB below the alignment level. For significantly processed material
such as commercials or pop music the VU meter reading should not be permitted to exceed zero VU.
In both the production and transmission phases of audio, it is common to employ various forms of
audio processing. In the production phase processing is a normal part of the creative process.
However, both the production and emission processing will have a common aim, i.e. to provide
material to the viewer so that the loudest and softest passages of the material can be enjoyed without
the need to adjust the receiver volume control. An extreme example of this is the emission processing
of cinema style audio mixes which require compression for comfortable listening in the home
environment.
The consequence of compression is reduction of the ratio between the peak and “average” level of
the content. Increasing the “average” level will increase the apparent loudness. The human ear tends
to be more sensitive to frequencies in the mid-range and if these frequencies are artificially boosted,
then again the apparent loudness will increase. The use of audio processing must be judicious so that
the compression of the dynamic range of the soundtrack plus any other processing employed does not
produce excessively loud or strident material.
Soundtrack production studios often employ gates to attenuate or eliminate the sounds below a lower
threshold, and peak limiters to prevent audio exceeding the level that causes distortion, or digital
clipping. These devices should not be used for the purpose of increasing the relative loudness of the
material.
Rep. ITU-R BS.2054-4 7
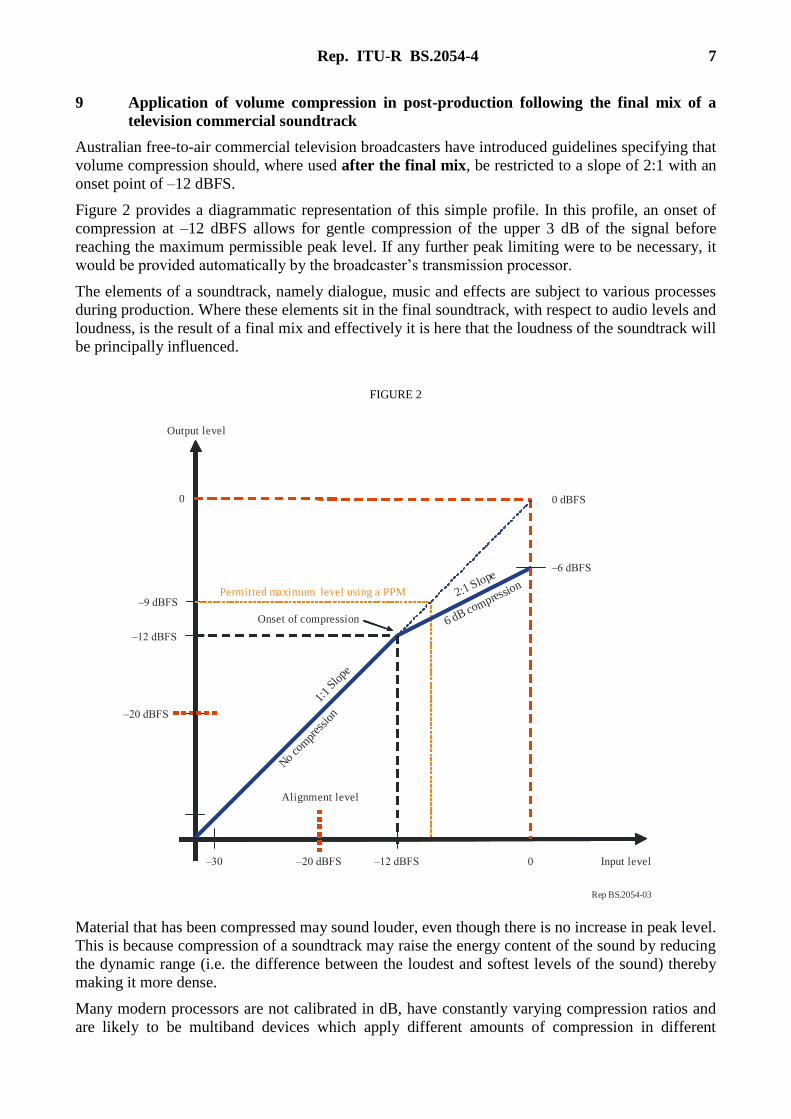
9 Application of volume compression in post-production following the final mix of a
television commercial soundtrack
Australian free-to-air commercial television broadcasters have introduced guidelines specifying that
volume compression should, where used after the final mix, be restricted to a slope of 2:1 with an
onset point of –12 dBFS.
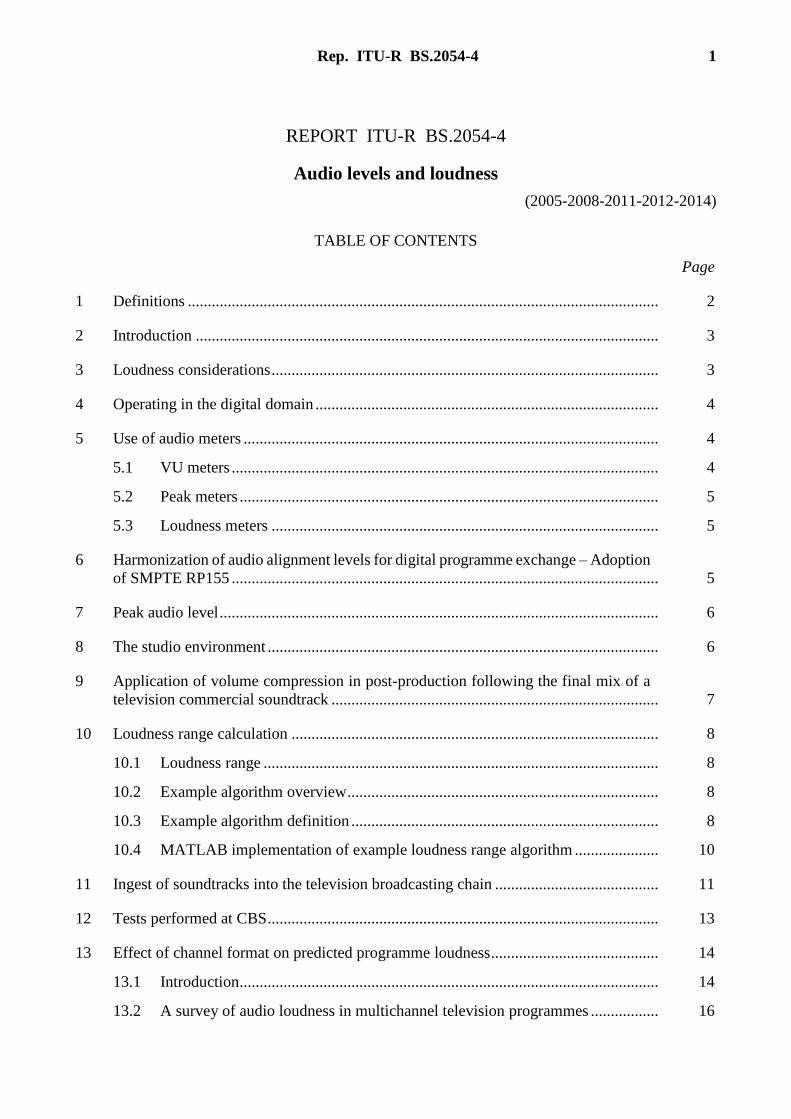
Figure 2 provides a diagrammatic representation of this simple profile. In this profile, an onset of
compression at –12 dBFS allows for gentle compression of the upper 3 dB of the signal before
reaching the maximum permissible peak level. If any further peak limiting were to be necessary, it
would be provided automatically by the broadcaster’s transmission processor.
The elements of a soundtrack, namely dialogue, music and effects are subject to various processes
during production. Where these elements sit in the final soundtrack, with respect to audio levels and
loudness, is the result of a final mix and effectively it is here that the loudness of the soundtrack will
be principally influenced.
FIGURE 2
Rep BS.2054-03
0 dBFS
Permitted m level using a PPMaximum
1:1
Slope
Alignment level
No c
ompr
ession
Input level
–9 dBFS
–12 dBFS
–20 dBFS
–6 dBFS
0–12 dBFS–20 dBFS–30
6 dB compression
Onset of compression
Output level
0
2:1 Slope
Material that has been compressed may sound louder, even though there is no increase in peak level.
This is because compression of a soundtrack may raise the energy content of the sound by reducing
the dynamic range (i.e. the difference between the loudest and softest levels of the sound) thereby
making it more dense.
Many modern processors are not calibrated in dB, have constantly varying compression ratios and
are likely to be multiband devices which apply different amounts of compression in different
8 Rep. ITU-R BS.2054-4
frequency bands. This makes it difficult for soundtrack producers to measure and quantify how much
compression is applied to a soundtrack.
10 Loudness range calculation
The EBU has studied the needs of audio signal levels in production, distribution and transmission of
broadcast programmes. The EBU has specified a descriptor “Loudness Range” that can be provided
to characterize the dynamic range of the audio programme. The information provided by this
descriptor may be useful to determine whether dynamic range processing of audio signals is needed
to comply with the technical limits of the complete signal chain as well as the aesthetic needs of each
programme/station depending on the genre(s) and the target audience.
In this Report, the descriptor “Loudness Range” and one algorithm (contributed by TC Electronic)
for its computation will be introduced and explained in detail.
10.1 Loudness range
Loudness Range (abbreviated “LRA”) quantifies the variation in a time-varying loudness
measurement. Loudness Range measures the variation of loudness on a macroscopic time-scale, in
units of LU (loudness units). This example of the computation of Loudness Range is based on a
measurement of loudness level as specified in Recommendation ITU-R BS.1770. Loudness Range
should not be confused with other measures of dynamic range or crest factor, etc.
10.2 Example algorithm overview
One method for the computation of Loudness Range is based on the statistical distribution of
measured loudness. Thus, a short but very loud event would not affect the Loudness Range of a longer
segment. Similarly the fade-out at the end of a music track, for example, would not increase Loudness
Range noticeably. Specifically, the range of the distribution of loudness levels is determined by
estimating the difference between a low and a high percentile of the distribution. This method is
analogous to the Interquartile Range (IQR), used in the field of descriptive statistics to obtain a robust
estimate of the spread of a data sample.
This method for computation of Loudness Range furthermore employs cascaded gating. Certain types
of programme may be, overall, very consistent in loudness, but have some sections with very low
loudness, for example only containing background noise (e.g. like atmosphere). If Loudness Range
did not use the gating, such programmes would (incorrectly) get quite a high Loudness Range
measurement, due to the relatively large difference in loudness between the regions of background
noise and those of normal (foreground) loudness.
This Loudness Range algorithm is independent of the sample rate and format of the input signal.
10.3 Example algorithm definition
The input to the algorithm is a vector of loudness levels, computed as specified in Recommendation
ITU-R BS.1770, using a sliding analysis-window of length 3 seconds for integration. An overlap
between consecutive analysis-windows must be used in order to prevent loss of precision in the
measurement of shorter programmes. A minimum block overlap of 66% (i.e. a minimum 2 s of
overlap) between consecutive analysis windows is required; the exact amount of overlap is
implementation-dependent.
A cascaded gating scheme is employed which uses an absolute threshold of very low level, in
combination with a relative threshold of higher, signal-dependent, level.
Rep. ITU-R BS.2054-4 9
The purpose of the relative-threshold gating is to gate out any periods of silence or background noise,
using a method that is independent of any level-normalization of the input signal. The lower edge of
Loudness Range should not be defined by the noise floor (which may be inaudible), but should instead
correspond to the weakest “real signal”. The relative threshold is set to a level of –20 LU relative to
the absolute-gated loudness level. The purpose of the absolute-threshold gate is to make the
conversion from the relative threshold to an absolute level robust against longer periods of silence or
low-level background noise. The absolute threshold is set to –70 LKFS, because no relevant signals
are generally found below this loudness level.
It is noted that measurement of very short programmes, where leading or trailing silence is included,
or of programmes consisting, for example, of isolated utterances, could result in misleadingly high
values of LRA.
The application of the cascaded gating leaves only the loudness levels of the sliding-window blocks
that contain foreground and (medium-level) background sounds, eliminating low-level signals,
background noise, and silence. The width of the distribution of these loudness levels is then quantified
using a percentile range. Percentiles belong to non-parametric statistics and are employed in the
computation of Loudness Range because the loudness levels cannot in general be assumed to belong
to a particular statistical distribution.
LRA is defined as the difference between the estimates of the 10th and the 95th percentiles of the
distribution. The lower percentile of 10%, can, for example, prevent the fade-out of a music track
from dominating Loudness Range. The upper percentile of 95% ensures that a single unusually loud
sound, such as a gunshot in a movie, cannot by itself be responsible for a large Loudness Range.
10 Rep. ITU-R BS.2054-4
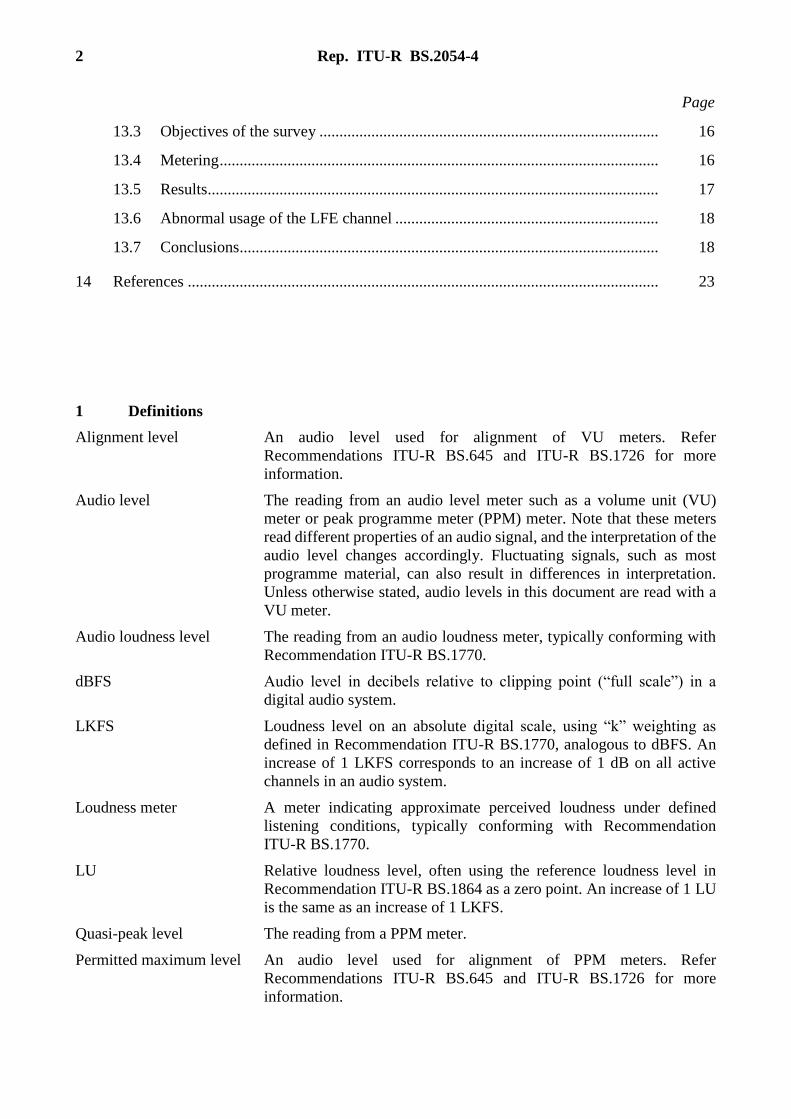
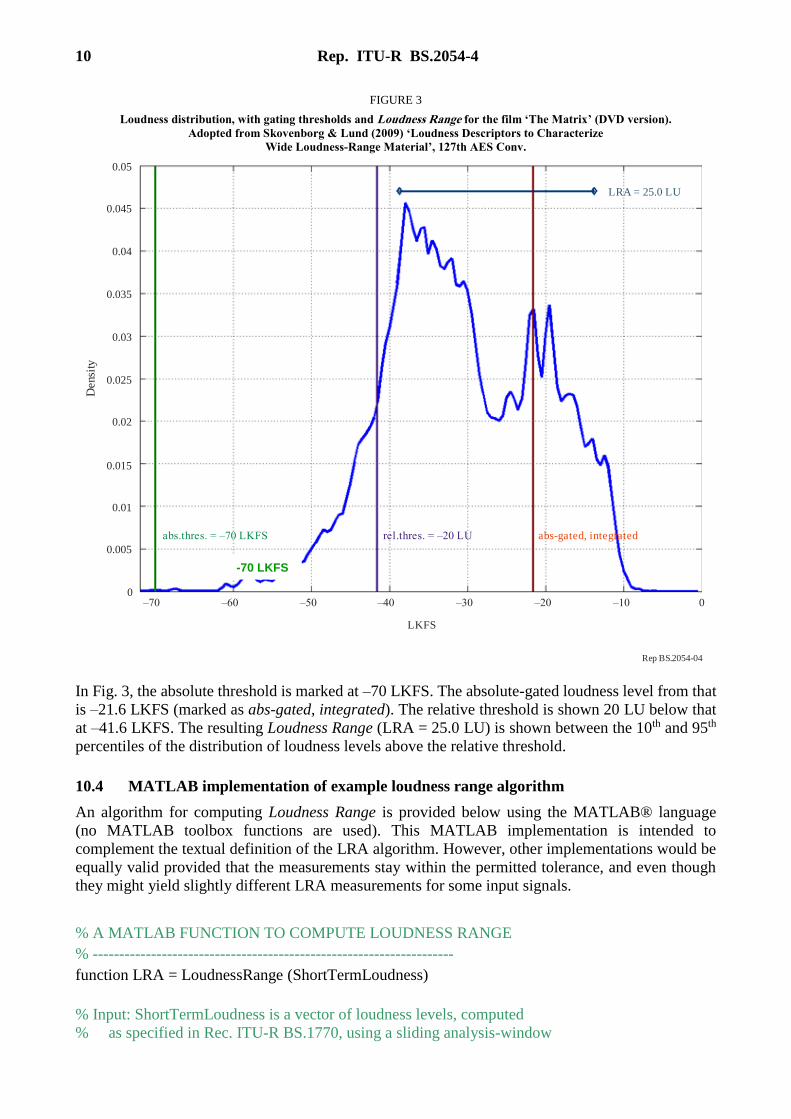
FIGURE 3
Loudness distribution, with gating thresholds and Loudness Range for the film ‘The Matrix’ (DVD version).
Adopted from Skovenborg & Lund (2009) ‘Loudness Descriptors to Characterize
Wide Loudness-Range Material’, 127th AES Conv.
Rep BS.2054-04
LKFS
0.05
0.045
0.04
0.035
0.03
0.025
0.02
0.015
0.01
0.005
0–70 –60 –50 –40 –30 –20 –10 0
Densi
ty
LRA = 25.0 LU
abs.thres. = –70 LKFS rel.thres. = –20 LU abs-gated, integrated
In Fig. 3, the absolute threshold is marked at –70 LKFS. The absolute-gated loudness level from that
is –21.6 LKFS (marked as abs-gated, integrated). The relative threshold is shown 20 LU below that
at –41.6 LKFS. The resulting Loudness Range (LRA = 25.0 LU) is shown between the 10th and 95th
percentiles of the distribution of loudness levels above the relative threshold.
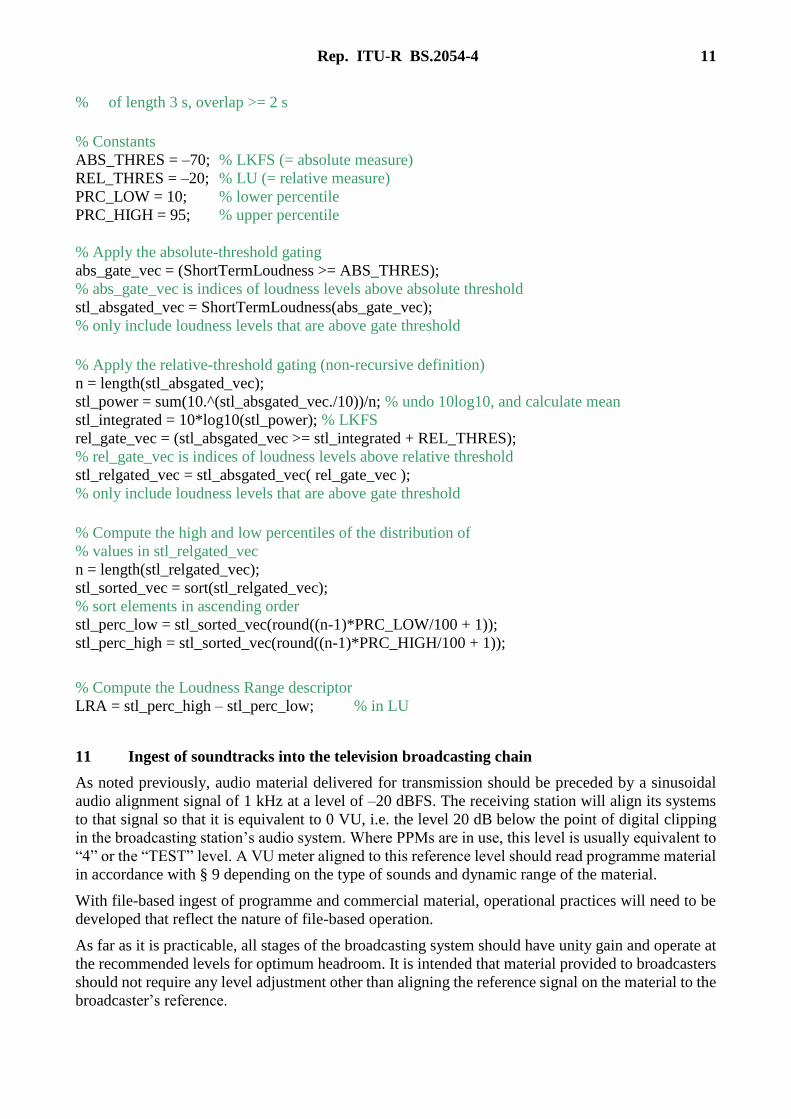
10.4 MATLAB implementation of example loudness range algorithm
An algorithm for computing Loudness Range is provided below using the MATLAB® language
(no MATLAB toolbox functions are used). This MATLAB implementation is intended to
complement the textual definition of the LRA algorithm. However, other implementations would be
equally valid provided that the measurements stay within the permitted tolerance, and even though
they might yield slightly different LRA measurements for some input signals.
% A MATLAB FUNCTION TO COMPUTE LOUDNESS RANGE
% --------------------------------------------------------------------
function LRA = LoudnessRange (ShortTermLoudness)
% Input: ShortTermLoudness is a vector of loudness levels, computed
% as specified in Rec. ITU-R BS.1770, using a sliding analysis-window
-70 LKFS
Rep. ITU-R BS.2054-4 11
% of length 3 s, overlap >= 2 s
% Constants
ABS_THRES = –70; % LKFS (= absolute measure)
REL_THRES = –20; % LU (= relative measure)
PRC_LOW = 10; % lower percentile
PRC_HIGH = 95; % upper percentile
% Apply the absolute-threshold gating
abs_gate_vec = (ShortTermLoudness >= ABS_THRES);
% abs_gate_vec is indices of loudness levels above absolute threshold
stl_absgated_vec = ShortTermLoudness(abs_gate_vec);
% only include loudness levels that are above gate threshold
% Apply the relative-threshold gating (non-recursive definition)
n = length(stl_absgated_vec);
stl_power = sum(10.^(stl_absgated_vec./10))/n; % undo 10log10, and calculate mean
stl_integrated = 10*log10(stl_power); % LKFS
rel_gate_vec = (stl_absgated_vec >= stl_integrated + REL_THRES);
% rel_gate_vec is indices of loudness levels above relative threshold
stl_relgated_vec = stl_absgated_vec( rel_gate_vec );
% only include loudness levels that are above gate threshold
% Compute the high and low percentiles of the distribution of
% values in stl_relgated_vec
n = length(stl_relgated_vec);
stl_sorted_vec = sort(stl_relgated_vec);
% sort elements in ascending order
stl_perc_low = stl_sorted_vec(round((n-1)*PRC_LOW/100 + 1));
stl_perc_high = stl_sorted_vec(round((n-1)*PRC_HIGH/100 + 1));
% Compute the Loudness Range descriptor
LRA = stl_perc_high – stl_perc_low; % in LU
11 Ingest of soundtracks into the television broadcasting chain
As noted previously, audio material delivered for transmission should be preceded by a sinusoidal
audio alignment signal of 1 kHz at a level of –20 dBFS. The receiving station will align its systems
to that signal so that it is equivalent to 0 VU, i.e. the level 20 dB below the point of digital clipping
in the broadcasting station’s audio system. Where PPMs are in use, this level is usually equivalent to
“4” or the “TEST” level. A VU meter aligned to this reference level should read programme material
in accordance with § 9 depending on the type of sounds and dynamic range of the material.
With file-based ingest of programme and commercial material, operational practices will need to be
developed that reflect the nature of file-based operation.
As far as it is practicable, all stages of the broadcasting system should have unity gain and operate at
the recommended levels for optimum headroom. It is intended that material provided to broadcasters
should not require any level adjustment other than aligning the reference signal on the material to the
broadcaster’s reference.
12 Rep. ITU-R BS.2054-4
Broadcasters may also compress the dynamic range of the audio signal at the broadcast station output
in the digital transmission chain, to ensure that the audio levels are consistent and that listeners4 can
enjoy the softest and loudest passages of sound without having to adjust their volume controls beyond
a comfortable setting. Other delivery platforms such as mobile devices and the Internet will require
even more audio processing for satisfactory reproduction.
Where broadcasters use an audio-processing system, it is strongly recommended that it provide the
following functions:
– automatic gain control (AGC);
– multiband compressor;
– capacity to adjust the attack and release time of the compressor;
– limiter;
– adjustments to limit the range of AGC and compressor action to limit the gain applied to low-
level passages; and
– ability to modify the action of the AGC and compressor to match future loudness
measurement and control systems.
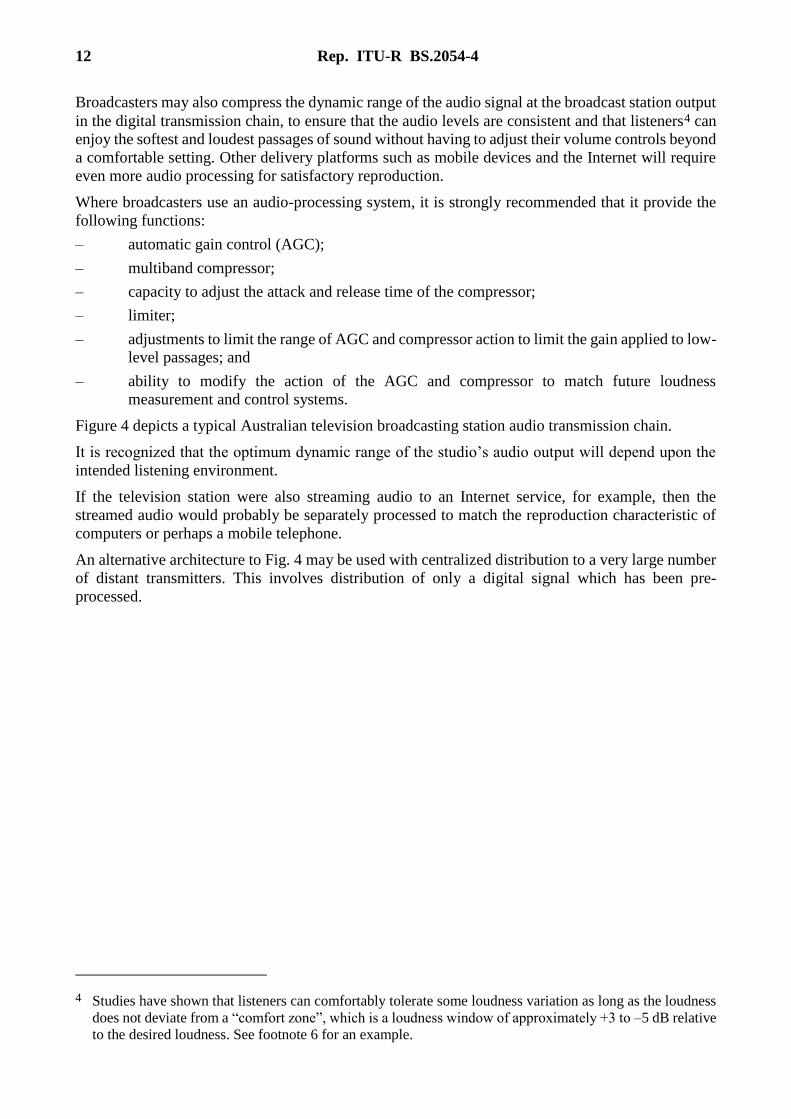
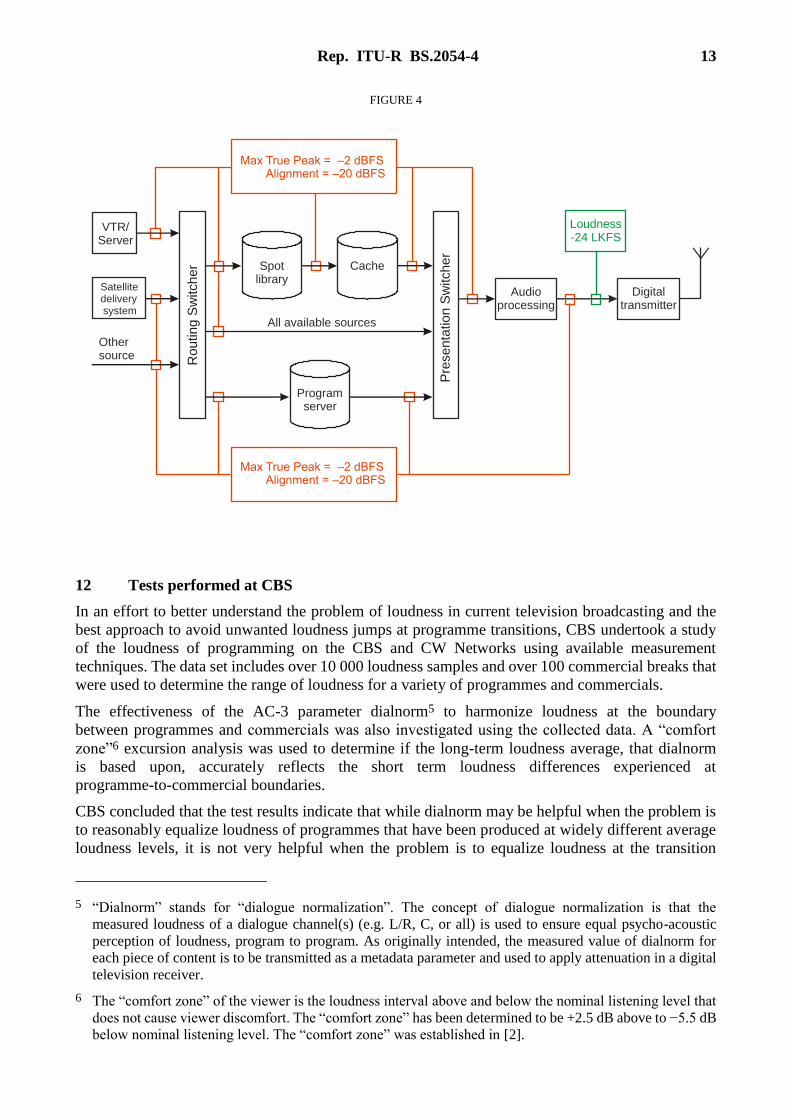
Figure 4 depicts a typical Australian television broadcasting station audio transmission chain.
It is recognized that the optimum dynamic range of the studio’s audio output will depend upon the
intended listening environment.
If the television station were also streaming audio to an Internet service, for example, then the
streamed audio would probably be separately processed to match the reproduction characteristic of
computers or perhaps a mobile telephone.
An alternative architecture to Fig. 4 may be used with centralized distribution to a very large number
of distant transmitters. This involves distribution of only a digital signal which has been pre-
processed.
4 Studies have shown that listeners can comfortably tolerate some loudness variation as long as the loudness
does not deviate from a “comfort zone”, which is a loudness window of approximately +3 to –5 dB relative
to the desired loudness. See footnote 6 for an example.
Rep. ITU-R BS.2054-4 13
FIGURE 4
12 Tests performed at CBS
In an effort to better understand the problem of loudness in current television broadcasting and the
best approach to avoid unwanted loudness jumps at programme transitions, CBS undertook a study
of the loudness of programming on the CBS and CW Networks using available measurement
techniques. The data set includes over 10 000 loudness samples and over 100 commercial breaks that
were used to determine the range of loudness for a variety of programmes and commercials.
The effectiveness of the AC-3 parameter dialnorm5 to harmonize loudness at the boundary
between programmes and commercials was also investigated using the collected data. A “comfort
zone”6 excursion analysis was used to determine if the long-term loudness average, that dialnorm
is based upon, accurately reflects the short term loudness differences experienced at
programme-to-commercial boundaries.
CBS concluded that the test results indicate that while dialnorm may be helpful when the problem is
to reasonably equalize loudness of programmes that have been produced at widely different average
loudness levels, it is not very helpful when the problem is to equalize loudness at the transition
5 “Dialnorm” stands for “dialogue normalization”. The concept of dialogue normalization is that the
measured loudness of a dialogue channel(s) (e.g. L/R, C, or all) is used to ensure equal psycho-acoustic
perception of loudness, program to program. As originally intended, the measured value of dialnorm for
each piece of content is to be transmitted as a metadata parameter and used to apply attenuation in a digital
television receiver.
6 The “comfort zone” of the viewer is the loudness interval above and below the nominal listening level that
does not cause viewer discomfort. The “comfort zone” has been determined to be +2.5 dB above to −5.5 dB
below nominal listening level. The “comfort zone” was established in [2].
Audio processing
Loudness-24 LKFS
VTR/Server
Satellitedeliverysystem
Digitaltransmitter
Cache
Programserver
Spotlibrary
All available sources
Other source
Alignment = –20 dBFS
Alignment = –20 dBFS
Max True Peak = –2 dBFS
Max True Peak = –2 dBFS
Pre
sen
tatio
n S
witcher
Routing
Sw
itche
r
14 Rep. ITU-R BS.2054-4
between programmes or commercials. The reason is that dialnorm is based on a measurement of
loudness averaged over the whole programme duration, while the perception of a loudness jump at a
programme transition depends on the difference of loudness between the few seconds that precede
the transition and the few seconds that follows it.
In addition, dialnorm, as currently implemented, does not take into account the contribution of the
LFE channel to total programme loudness, and this can introduce important discrepancies between
measured and perceived loudness on some types of programmes such as rock music.
The tests have led CBS to conclude that the operation of a loudness controller to be used on-line in
order to avoid excessive jumps in loudness at programme transitions should be based on loudness
measurements taken over a travelling window of a few seconds duration, with suitable attack and
release times and gain slopes.
CBS further concluded that loudness measurements systematically taken over the entire duration of
each programme, if available and reliable, may be useful to identify and correct major differences in
loudness between different programmes but will not generally help to remove loudness jumps at
transitions between programmes and commercials.
13 Effect of channel format on predicted programme loudness
13.1 Introduction
A survey was conducted by Free TV Australia of the loudness levels of a range of content, measured
with a meter conforming to Recommendation ITU-R BS.1770 – Algorithms to measure audio
programme loudness and true-peak audio level. The aims of this survey were:
– to examine the effect on the loudness level of including the LFE channel;
– to examine differences in loudness readings between five channel and LoRo Stereo formats.
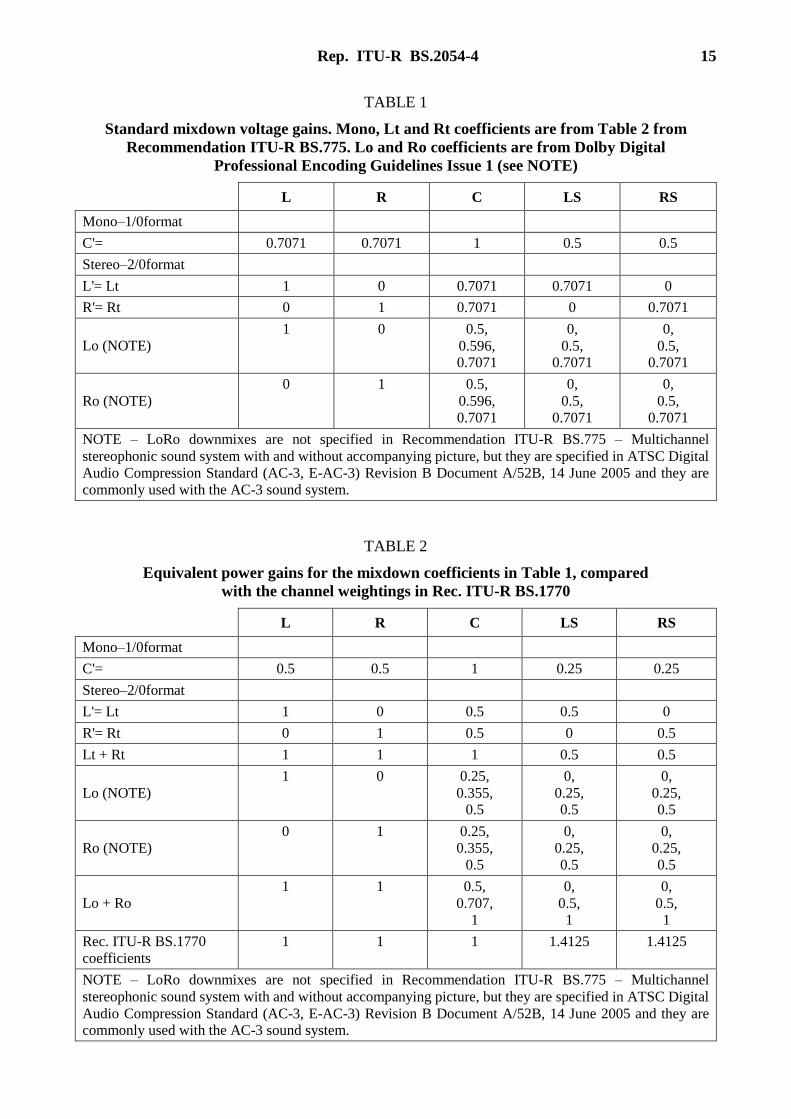
The channel weightings used in the LoRo downmix were C = 0.707 and LS, RS = 0.707.
Because the channel weightings in Recommendation ITU-R BS.1770 differ from the channel
weightings in the standard stereo downmixes specified in Recommendation ITU-R BS.775,
the loudness readings in the various channel formats may also differ (see Tables 1 and 2).
Rep. ITU-R BS.2054-4 15
TABLE 1
Standard mixdown voltage gains. Mono, Lt and Rt coefficients are from Table 2 from
Recommendation ITU-R BS.775. Lo and Ro coefficients are from Dolby Digital
Professional Encoding Guidelines Issue 1 (see NOTE)
L R C LS RS
Mono–1/0format
C'= 0.7071 0.7071 1 0.5 0.5
Stereo–2/0format
L'= Lt 1 0 0.7071 0.7071 0
R'= Rt 0 1 0.7071 0 0.7071
Lo (NOTE)
1 0 0.5,
0.596, 0.7071
0,
0.5, 0.7071
0,
0.5, 0.7071
Ro (NOTE)
0 1 0.5,
0.596,
0.7071
0,
0.5,
0.7071
0,
0.5,
0.7071
NOTE – LoRo downmixes are not specified in Recommendation ITU-R BS.775 – Multichannel
stereophonic sound system with and without accompanying picture, but they are specified in ATSC Digital
Audio Compression Standard (AC-3, E-AC-3) Revision B Document A/52B, 14 June 2005 and they are
commonly used with the AC-3 sound system.
TABLE 2
Equivalent power gains for the mixdown coefficients in Table 1, compared
with the channel weightings in Rec. ITU-R BS.1770
L R C LS RS
Mono–1/0format
C'= 0.5 0.5 1 0.25 0.25
Stereo–2/0format
L'= Lt 1 0 0.5 0.5 0
R'= Rt 0 1 0.5 0 0.5
Lt + Rt 1 1 1 0.5 0.5
Lo (NOTE)
1 0 0.25,
0.355, 0.5
0,
0.25, 0.5
0,
0.25, 0.5
Ro (NOTE)
0 1 0.25,
0.355,
0.5
0,
0.25,
0.5
0,
0.25,
0.5
Lo + Ro
1 1 0.5,
0.707, 1
0,
0.5, 1
0,
0.5, 1
Rec. ITU-R BS.1770
coefficients
1 1 1 1.4125 1.4125
NOTE – LoRo downmixes are not specified in Recommendation ITU-R BS.775 – Multichannel
stereophonic sound system with and without accompanying picture, but they are specified in ATSC Digital
Audio Compression Standard (AC-3, E-AC-3) Revision B Document A/52B, 14 June 2005 and they are commonly used with the AC-3 sound system.
16 Rep. ITU-R BS.2054-4
From the results of the study it is likely that default stereo downmixes from five channel source
material may be up to 2 LU higher or 1 LU lower in measured loudness level than the five channel
source material. This should be considered when setting programme loudness levels.
13.2 A survey of audio loudness in multichannel television programmes
This study was made by Free TV Australia, which represents the views of the Australian free-to-air
commercial broadcasters, in association with the Australian Broadcasting Corporation (ABC) and the
Special Broadcasting Service (SBS).
In addressing Question ITU-R 2/6, Working Party 6C has noted that the inclusion of the low
frequency effects (LFE) channel in the measurement method recommended in Recommendation
ITU-R BS.1770 is still under discussion. It is also recognized that since the existing measuring
algorithm was derived from tests using samples presented in monophonic form that more study should
be undertaken to facilitate a better understanding of any differences that may exist when the
Recommendation ITU-R BS.1770 method is applied to multichannel (typically presented in
5.1 format) audio material and also multichannel material that has been mixed down to two channel
stereo as part of the broadcasting process.
In June 2009, a survey of programme material with multichannel audio (5.1 channels) was conducted
in Sydney. The programme samples were supplied by Australian broadcasters. The trends shown by
the results are interesting and informative. The 36 samples were representative of typical Australian
television programming in a mixture of genres, each of 10-minute duration and chosen to be
representative of the programmes as a whole. The samples were all “as supplied” to the broadcasters
i.e. they had not been subjected to any processing or gain shifts.
This Report presents the findings of the Australian survey and draws some general conclusions that
may prove informative for those considering further studies to improve the loudness measuring
algorithm.
13.3 Objectives of the survey
The purpose of the survey was to reverse engineer the multichannel mix, determine the typical
loudness contribution of each audio channel and of certain groups of channels (with all measurements
noted in LKFS units). Additionally there were three objectives:
– To determine what, if any, abnormalities may exist in the material tested.
– To specifically determine the typical LFE contribution to help answer the question – “should
it be included in the Recommendation ITU-R BS.1770 algorithm?”
– To specifically explore the relationship between the loudness of a multichannel product and
its standard LoRo stereo downmix and to determine whether the stereo downmix loudness
varies significantly from the parent multichannel loudness. This question relates to the
weighting factor that is used in the Recommendation ITU-R BS.1770 algorithm for summing
the surround channels.
13.4 Metering
The measurements were made using the LM5D Loudness Meter from TC Electronic. This instrument
was chosen because it has flexible input options allowing individual audio channels or selected groups
of channels to be measured.
For this test, the meter was variously configured to measure:
– Centre
– Centre + Left + Right

Rep. ITU-R BS.2054-4 17
– Centre + Left + Right + Left Surround + Right Surround (5.0)
– Lo + Ro down-mix
– Low Frequency Effects.
The data sets were obtained by multiple passes of identical samples and analysis of the meter readings.
From these meter readings, the following additional quantities were derived:
– Left Surround + Right Surround
– 5.1 channels mixed
– 5.1 minus 5.0
– 5.1 minus LoRo
– 5.0 minus LoRo
– LoRo – (L+C+R).
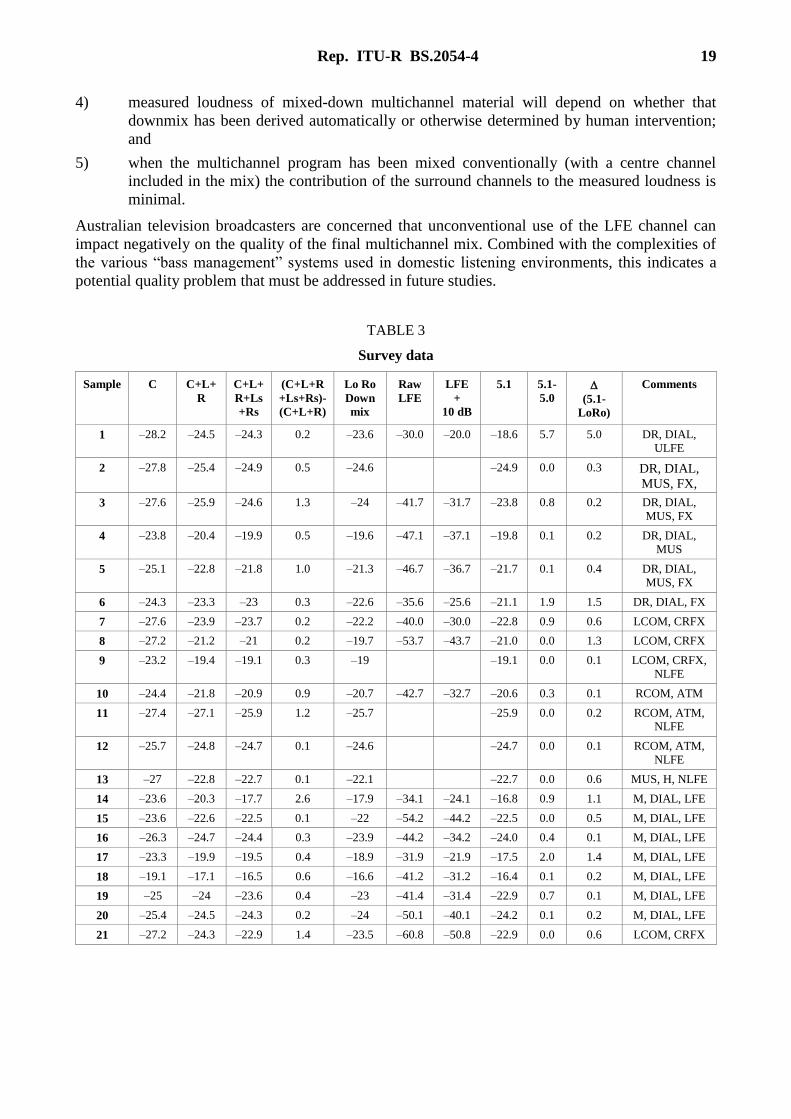
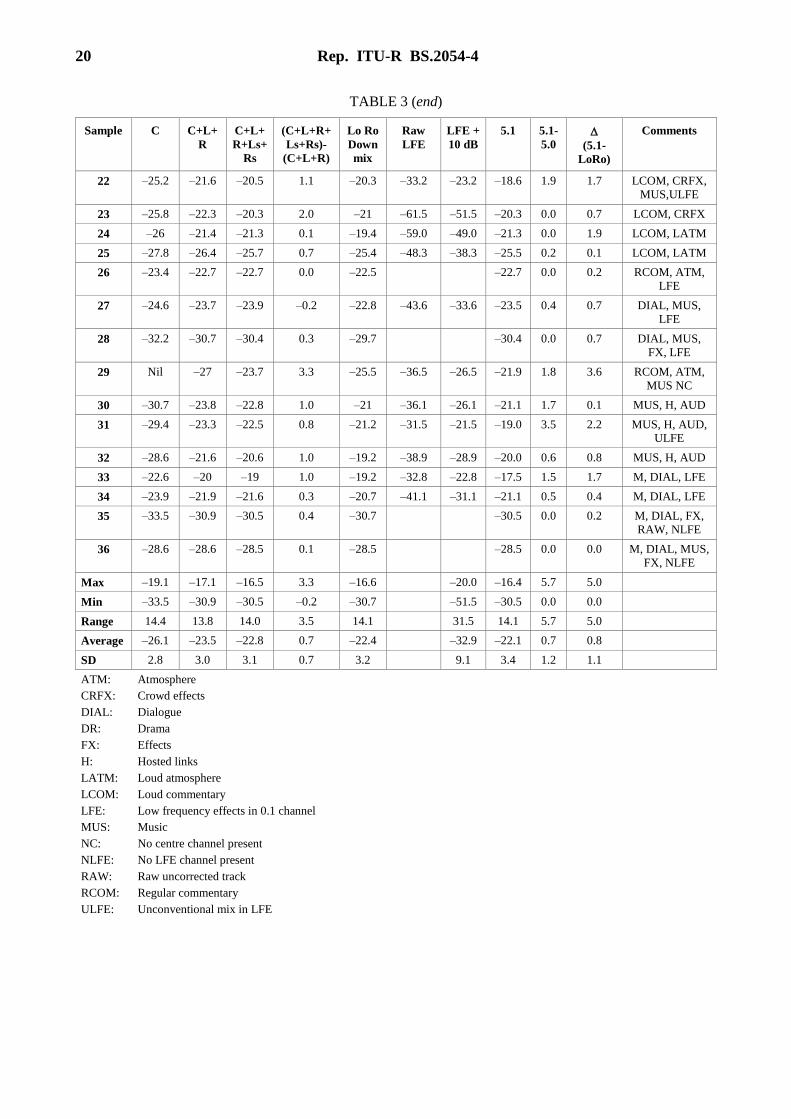
13.5 Results
The data from the loudness meter indications is set out in Table 3.
With respect to the LFE content, the average contribution is 0.7 LKFS. It should be noted that the
calculation involved adding 10 to the measured number in accordance with the standard practice of
increasing the LFE reproduction level by 10 dB, or stated more accurately, by increasing the LFE
SPL by 10 dB with respect to centre channel SPL over a band-pass of approximately 20 Hz to 120 Hz
using a real time analyser for measurement.
However small the average values are, the measured range (up to 5.7) is rather more than expected.
This is due to an abnormal situation in the case of several samples. These anomalies are clarified in
“Abnormal results” (below).
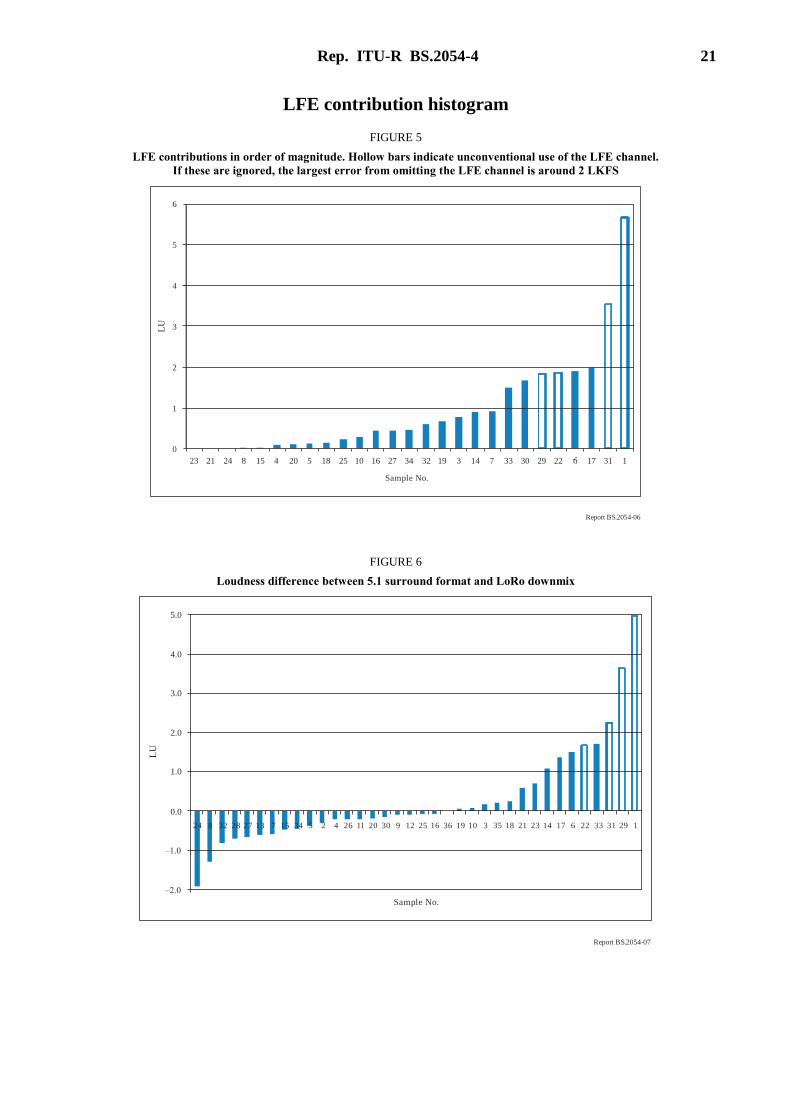
The measured LFE contributions show a small average value and a small standard deviation, but
nevertheless, as noted above, returned a large RANGE value. Figure 5 shows a plot of measured
sample values ordered from maximum to minimum. This indicates that the samples measuring from
around 2 LKFS to 5.7 LKFS are significant. Some of these samples are from what may be regarded
as abnormal content, but nonetheless these results would suggest that including the LFE content in
the Recommendation ITU-R BS.1770 algorithm would be the wiser course of action. Unfortunately,
there is no guarantee as to the nature of the LFE content – this is discussed further in “Abnormal
results” below.
Figure 6 contains a plot illustrating the combined contribution of the LFE channel and the surround
channels to the overall loudness measurement of the programme samples.
With respect to the downmix question, this is related to the surround channel weighting factors used
in the Recommendation ITU-R BS.1770 algorithm in that they might contribute to a significant
difference in the measured loudness of the multichannel product versus its standard downmix.
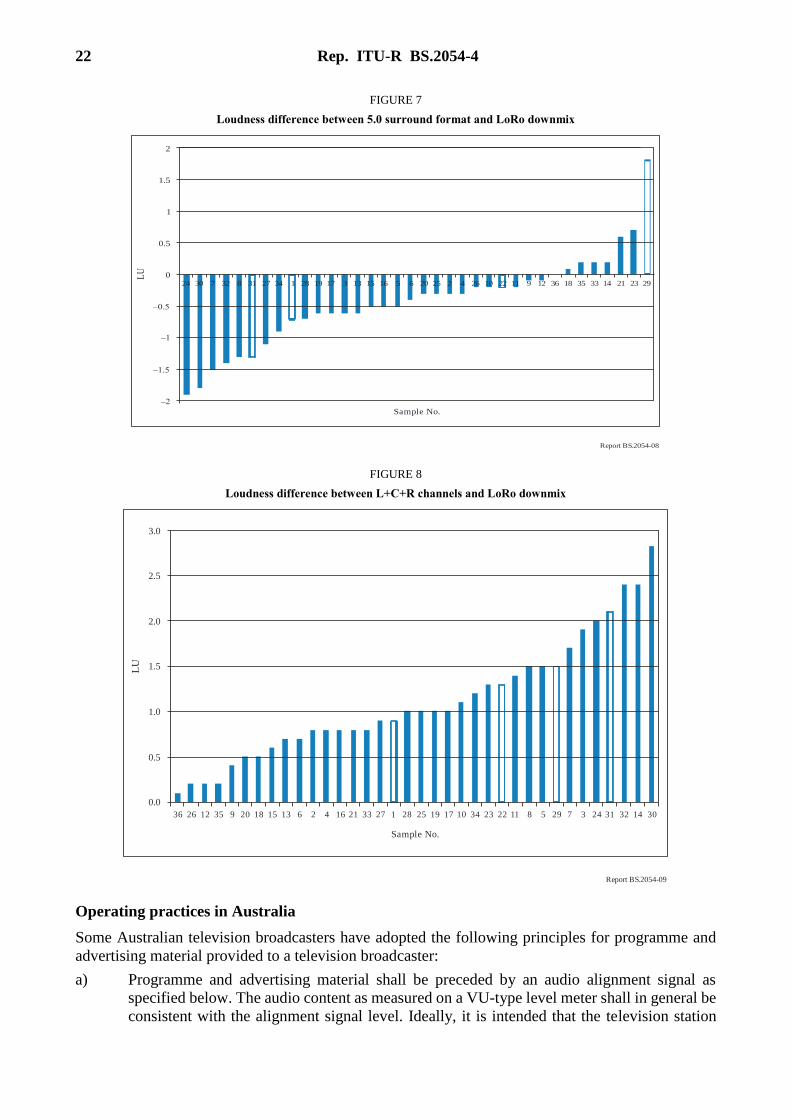
Figure 7 plots the differences between the loudness measured for 5.0 channels against that measured
in a LoRo mix of the same material. The average measured differential value was 0.8 LKFS. This
value is small and not of significance. In contrast, Fig. 8 plots the differences in loudness contribution
between a LoRo downmix and the combined contribution of Left plus Centre plus Right channels.
That plot indicates that the difference between the measured loudness of a standard downmix and an
L+C+R measurement is greater than either a 5.0 or a 5.1 measurement of the identical material.
As was the case with the LFE measurements, the downmix RANGE value (up to 6.5 LKFS) is higher
than expected. Again, as with the LFE measurements, a small number of abnormal samples have
contributed to this situation. Also, the downmix range calculations have not taken into account the
signs of the differentials. In this particular case the sign is not really relevant, as we are concerned

18 Rep. ITU-R BS.2054-4
only with the magnitude of the differential between the stereo downmix and its unique parent
multichannel product. Louder or softer is not the issue.
At the time of the measurements only a LoRo downmix with standard ITU coefficients was possible.
However, we believe that a LtRt downmix would have given essentially the same results.
Not directly relevant to these measurements but nevertheless significant is an issue with downmixing
that should be kept in mind. With any given recording that contains both multichannel audio and a
stereo downmix, it is possible that the downmix may have been created either by “machine” or by
“human”. If the downmix is a “human” creation, then its loudness may have no defined connection
with the loudness of its multichannel parent because the mixing coefficients may be set arbitrarily by
the audio director rather than being fixed and conforming to a conventional recommendation as is the
case for the automatic downmixes created in the encoding equipment or in the consumer’s receiver.
It is possible to derive the “surrounds” contribution to the overall loudness of the multichannel
product from the loudness meter readings. The average surround contribution in this test was
0.7 LKFS. The measured range extends to 3.3 LKFS, again due to what may be regarded as
an abnormal product.
13.6 Abnormal usage of the LFE channel
In this survey there are four abnormal items that have produced non-typical results (where typical is
defined as around the average value). These samples are shown in the plots as unfilled bars. One such
item (sample 29) is mixed with no centre channel and very significant surround channels, producing
a surround contribution of 3.3 LKFS. This same programme shows a large downmix differential of
3.6 LKFS which one could speculate was a result of its unconventional mix.
Potentially, the most serious problem which has been revealed, by investigation, is the process of
taking bass information from the left and right channels, mixing it to mono and then inserting it into
the LFE channel (samples 1, 22 and 31). This reveals a lack of knowledge of the purpose of the LFE
channel. It is intended for low frequency effects only. In fact there are many styles of programme
which do not require any such content, and in these cases the LFE channel should be silent.
Information from the survey indicates that in a small number of cases music has been mixed into the
LFE channel. This has occurred with drama, football and music-based programmes and has resulted
in non-typical LFE contributions and larger downmix differentials.
Many domestic installations of multichannel audio employ some form of bass management (the
characteristics of which vary). If we have a system which is a combination of variable domestic bass
management and also, effectively a form of variable “bass management” applied by the audio director
at the production stage, then the end results will truly be variable and unpredictable. This variability
will also be reflected in the perceived loudness of the material.
13.7 Conclusions
Analysis of the data yielded by measurement of the 36 samples of typical multichannel sound in
Australian television programmes suggests that:
1) loudness measured in multichannel sound depends on the structure of the multichannel mix;
2) when used for its intended purpose, the LFE channel did not contribute markedly to the
loudness in the samples tested;
3) it is acknowledged that the downmix coefficients are to create an acceptable stereo
programme, and channel weighting coefficients are to account for different perception of
loudness depending on sound source position;
Rep. ITU-R BS.2054-4 19
4) measured loudness of mixed-down multichannel material will depend on whether that
downmix has been derived automatically or otherwise determined by human intervention;
and
5) when the multichannel program has been mixed conventionally (with a centre channel
included in the mix) the contribution of the surround channels to the measured loudness is
minimal.
Australian television broadcasters are concerned that unconventional use of the LFE channel can
impact negatively on the quality of the final multichannel mix. Combined with the complexities of
the various “bass management” systems used in domestic listening environments, this indicates a
potential quality problem that must be addressed in future studies.
TABLE 3
Survey data
Sample C C+L+
R
C+L+
R+Ls
+Rs
(C+L+R
+Ls+Rs)-
(C+L+R)
Lo Ro
Down
mix
Raw
LFE
LFE
+
10 dB
5.1 5.1-
5.0
(5.1-
LoRo)
Comments
1 –28.2 –24.5 –24.3 0.2 –23.6 –30.0 –20.0 –18.6 5.7 5.0 DR, DIAL,
ULFE
2 –27.8 –25.4 –24.9 0.5 –24.6 –24.9 0.0 0.3 DR, DIAL,
MUS, FX,
NLFE 3 –27.6 –25.9 –24.6 1.3 –24 –41.7 –31.7 –23.8 0.8 0.2 DR, DIAL,
MUS, FX
4 –23.8 –20.4 –19.9 0.5 –19.6 –47.1 –37.1 –19.8 0.1 0.2 DR, DIAL,
MUS
5 –25.1 –22.8 –21.8 1.0 –21.3 –46.7 –36.7 –21.7 0.1 0.4 DR, DIAL,
MUS, FX
6 –24.3 –23.3 –23 0.3 –22.6 –35.6 –25.6 –21.1 1.9 1.5 DR, DIAL, FX
7 –27.6 –23.9 –23.7 0.2 –22.2 –40.0 –30.0 –22.8 0.9 0.6 LCOM, CRFX
8 –27.2 –21.2 –21 0.2 –19.7 –53.7 –43.7 –21.0 0.0 1.3 LCOM, CRFX
9 –23.2 –19.4 –19.1 0.3 –19 –19.1 0.0 0.1 LCOM, CRFX,
NLFE
10 –24.4 –21.8 –20.9 0.9 –20.7 –42.7 –32.7 –20.6 0.3 0.1 RCOM, ATM
11 –27.4 –27.1 –25.9 1.2 –25.7 –25.9 0.0 0.2 RCOM, ATM, NLFE
12 –25.7 –24.8 –24.7 0.1 –24.6 –24.7 0.0 0.1 RCOM, ATM,
NLFE
13 –27 –22.8 –22.7 0.1 –22.1 –22.7 0.0 0.6 MUS, H, NLFE
14 –23.6 –20.3 –17.7 2.6 –17.9 –34.1 –24.1 –16.8 0.9 1.1 M, DIAL, LFE
15 –23.6 –22.6 –22.5 0.1 –22 –54.2 –44.2 –22.5 0.0 0.5 M, DIAL, LFE
16 –26.3 –24.7 –24.4 0.3 –23.9 –44.2 –34.2 –24.0 0.4 0.1 M, DIAL, LFE
17 –23.3 –19.9 –19.5 0.4 –18.9 –31.9 –21.9 –17.5 2.0 1.4 M, DIAL, LFE
18 –19.1 –17.1 –16.5 0.6 –16.6 –41.2 –31.2 –16.4 0.1 0.2 M, DIAL, LFE
19 –25 –24 –23.6 0.4 –23 –41.4 –31.4 –22.9 0.7 0.1 M, DIAL, LFE
20 –25.4 –24.5 –24.3 0.2 –24 –50.1 –40.1 –24.2 0.1 0.2 M, DIAL, LFE
21 –27.2 –24.3 –22.9 1.4 –23.5 –60.8 –50.8 –22.9 0.0 0.6 LCOM, CRFX
20 Rep. ITU-R BS.2054-4
TABLE 3 (end)
Sample C C+L+
R
C+L+
R+Ls+
Rs
(C+L+R+
Ls+Rs)-
(C+L+R)
Lo Ro
Down
mix
Raw
LFE
LFE +
10 dB
5.1 5.1-
5.0
(5.1-
LoRo)
Comments
22 –25.2 –21.6 –20.5 1.1 –20.3 –33.2 –23.2 –18.6 1.9 1.7 LCOM, CRFX,
MUS,ULFE
23 –25.8 –22.3 –20.3 2.0 –21 –61.5 –51.5 –20.3 0.0 0.7 LCOM, CRFX
24 –26 –21.4 –21.3 0.1 –19.4 –59.0 –49.0 –21.3 0.0 1.9 LCOM, LATM
25 –27.8 –26.4 –25.7 0.7 –25.4 –48.3 –38.3 –25.5 0.2 0.1 LCOM, LATM
26 –23.4 –22.7 –22.7 0.0 –22.5 –22.7 0.0 0.2 RCOM, ATM,
LFE
27 –24.6 –23.7 –23.9 –0.2 –22.8 –43.6 –33.6 –23.5 0.4 0.7 DIAL, MUS,
LFE
28 –32.2 –30.7 –30.4 0.3 –29.7 –30.4 0.0 0.7 DIAL, MUS,
FX, LFE
29 Nil –27 –23.7 3.3 –25.5 –36.5 –26.5 –21.9 1.8 3.6 RCOM, ATM,
MUS NC
30 –30.7 –23.8 –22.8 1.0 –21 –36.1 –26.1 –21.1 1.7 0.1 MUS, H, AUD
31 –29.4 –23.3 –22.5 0.8 –21.2 –31.5 –21.5 –19.0 3.5 2.2 MUS, H, AUD, ULFE
32 –28.6 –21.6 –20.6 1.0 –19.2 –38.9 –28.9 –20.0 0.6 0.8 MUS, H, AUD
33 –22.6 –20 –19 1.0 –19.2 –32.8 –22.8 –17.5 1.5 1.7 M, DIAL, LFE
34 –23.9 –21.9 –21.6 0.3 –20.7 –41.1 –31.1 –21.1 0.5 0.4 M, DIAL, LFE
35 –33.5 –30.9 –30.5 0.4 –30.7 –30.5 0.0 0.2 M, DIAL, FX,
RAW, NLFE
36 –28.6 –28.6 –28.5 0.1 –28.5 –28.5 0.0 0.0 M, DIAL, MUS,
FX, NLFE
Max –19.1 –17.1 –16.5 3.3 –16.6 –20.0 –16.4 5.7 5.0
Min –33.5 –30.9 –30.5 –0.2 –30.7 –51.5 –30.5 0.0 0.0
Range 14.4 13.8 14.0 3.5 14.1 31.5 14.1 5.7 5.0
Average –26.1 –23.5 –22.8 0.7 –22.4 –32.9 –22.1 0.7 0.8
SD 2.8 3.0 3.1 0.7 3.2 9.1 3.4 1.2 1.1
ATM: Atmosphere
CRFX: Crowd effects
DIAL: Dialogue
DR: Drama
FX: Effects
H: Hosted links
LATM: Loud atmosphere
LCOM: Loud commentary
LFE: Low frequency effects in 0.1 channel
MUS: Music
NC: No centre channel present
NLFE: No LFE channel present
RAW: Raw uncorrected track
RCOM: Regular commentary
ULFE: Unconventional mix in LFE
Rep. ITU-R BS.2054-4 21
LFE contribution histogram
FIGURE 5
LFE contributions in order of magnitude. Hollow bars indicate unconventional use of the LFE channel.
If these are ignored, the largest error from omitting the LFE channel is around 2 LKFS
Report BS.2054-06
23 21 24 8 15 4 20 5 18 25 10 16 27 34 32 19 3 14 7 33 30 29 22 17 31 1
0
1
2
3
4
5
6
Sample No.
LU
FIGURE 6
Loudness difference between 5.1 surround format and LoRo downmix
Report BS.2054-07
24 8 32 27 13 7 15 34 5 2 4 26 11 20 30 9 12 25 16 36 19 10 3 35 18 21 23 14 17 6 22 33 31 29 128
–2.0
–1.0
0.0
1.0
2.0
3.0
4.0
5.0
Sample No.
LU
22 Rep. ITU-R BS.2054-4
FIGURE 7
Loudness difference between 5.0 surround format and LoRo downmix
Report BS.2054-08
–2
–1.5
–1
–0.5
0
0.5
1
1.5
2
24 30 7 32 8 31 27 34 1 28 19 17 3 13 15 16 5 6 20 25 2 4 26 10 22 11 9 12 36 18 35 33 14 21 23 29
Sample No.
LU
FIGURE 8
Loudness difference between L+C+R channels and LoRo downmix
Report BS.2054-09
36
0.5
26 12 35 9 20 18 15 13 6 2 4 16 21 33 27 1 28 25 19 17 10 34 23 22 11 8 5 29 7 3 24 31 32 14 30
LU
0.0
1.0
1.5
2.0
2.5
3.0
Sample No.
Operating practices in Australia
Some Australian television broadcasters have adopted the following principles for programme and
advertising material provided to a television broadcaster:
a) Programme and advertising material shall be preceded by an audio alignment signal as
specified below. The audio content as measured on a VU-type level meter shall in general be
consistent with the alignment signal level. Ideally, it is intended that the television station
Rep. ITU-R BS.2054-4 23
equipment settings should remain fixed, so that there is a unity relationship between the
alignment signal on the material, the ingest process and the transmission process.
b) In digital systems the alignment level will be 20 dB below full-scale digital, i.e. –20 dBFS,
in accordance with SMPTE RP155. The audio quasi peak level should nominally not exceed
11 dB above the alignment level.
The television station alignment level of –20 dBFS7 will be the level that causes reference modulation
in the station’s digital transmitters under test conditions (transmitter processing bypassed). It will also
ensure optimum operation and headroom in the station’s analogue and digital recording equipment.
Audio-processing techniques employed during the production of audio material must not produce
passages of audio which are strident or excessively loud. Broadcasters should process the
transmission audio in the analogue and digital streams to maintain the dynamic range within a range
of sound control settings that are comfortable for the listening audience.
14 References
[1] SMPTE RP155 Motion-Pictures and Television – Reference Level for Digital Audio Systems.
[2] RIEDMILLER, J.C., LYMAN, S. and ROBINSON, C. [2003], Intelligent Program Loudness
Measurement and Control: What Satisfies Listeners? Audio Engineering Society Convention Paper,
2003 October 10-13, New York, New York, United States of America.
[3] Recommendation ITU-R BS.645 – Test signals and metering to be used on international sound
programme connections.
[4] Recommendation ITU-R BS.1726 – Signal level of digital audio accompanying television in
international programme exchange.
[5] Recommendation ITU-R BS.1770 – Algorithms to measure audio programme loudness and true-peak
audio level.
[6] Recommendation ITU-R BS.1771 – Requirements for loudness and true-peak indicating meters.
[7] Recommendation ITU-R BS.1864 – Operational practices for loudness in the international exchange
of digital television programmes.
[8] IEC 60268-10 Sound System Equipment: Part 10 – Peak Programme Level Meters.
[9] IEC 60268-17 Sound System Equipment: Part 17 – Standard Volume Indicators.
______________
7 Normal alignment level in a studio domain is normally set using a 1 kHz tone.