bruce bradshaw - world meteorological organization · bruce bradshaw wave & drifting buoy ......
TRANSCRIPT

Bruce Bradshaw Wave & Drifting Buoy Programme Manager
Integrated Science Data Management – Fisheries and Oceans Canada
JCOMM Technical Workshop on Wave MeasurementsNew York
October 2 & 3, 2008

ISDMIntegrated Science Data Management
A Branch of DFO Science
Formed in 2006 by the merger of DFO’s Marine Environmental Data Service and the Engineering and Geomatics Branch of CHS.
Marine Environmental Data Service
+Continuously Managed Archives
WavesArgoTides & Water LevelsPhysical & Chemical ProfilesDrifting & Moored BuoysContaminants & Invasive Species…Navigation and Chart Services GeoPortal…

ISDM & International Data Management
ISDM Participates in several JCOMM Data Management Programmes
Work consists of
• Procedures for end-to-end data management
• Standards (metadata, formats, QC, etc.)
• Integrating ice, ocean, meteorological climatology
An International Data Centre within the Intergovernmental Oceanographic Data and Information Exchange programme
Work consists of
• Sharing data, experience and expertise
• Collaborating on a number of projects with international partners including the GTSPP, GOSUD and GLOSS
• ISDM operates two world data centres, one for real-time profiles and one for surface drifter data

ISDM as a Data Centre
• ISDM manages data in the real-time (hours-days) and delayed mode (months to years).
• We receive data from the Global Telecommunications System, and others, as often as every 15 minutes
• We send data through the GTS every 6 hours.
• We accept data from DFO and international partners months and years after collection.
• We add value by carrying out QC, duplicates identification and the standardization of content and structure.
• We deliver data to clients daily, weekly and on request.
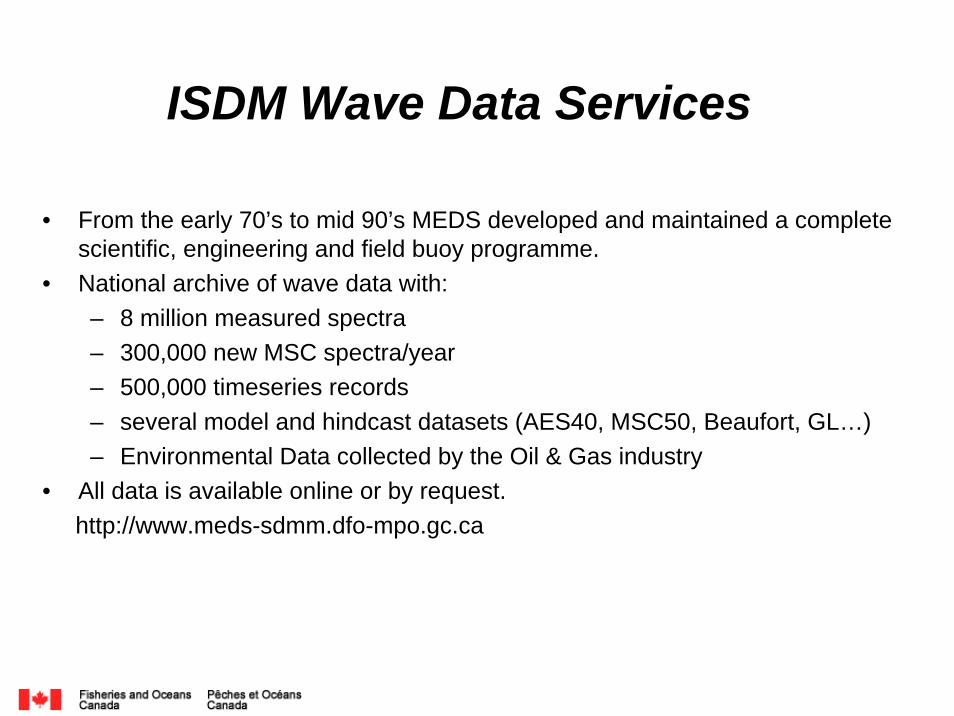
ISDM Wave Data Services
• From the early 70’s to mid 90’s MEDS developed and maintained a complete scientific, engineering and field buoy programme.
• National archive of wave data with:– 8 million measured spectra– 300,000 new MSC spectra/year– 500,000 timeseries records– several model and hindcast datasets (AES40, MSC50, Beaufort, GL…) – Environmental Data collected by the Oil & Gas industry
• All data is available online or by request.http://www.meds-sdmm.dfo-mpo.gc.ca

The ISDM Wave Data Services
• Acquisition
• Processing
• Archival
• Providing Access to Data
We describe our services in terms of the following four steps:

Wave Data Acquisition
All wave and ancillary data from the Canadian area of interest (n of 35) • Meteorological and oceanographic data from MSC weather buoy network
transmitted over the GOES satellite network
• Annual oil and gas industry submissions
• Hindcast and model data
• Other engineering or scientific research data (altimeter, radar etc.)

GOES DCP Transmissions from
Wave Buoys
GOES Message Processing by
NESDIS
DAPS Wallops Island, VA
LRGS Servers
DOMSAT or Network
INTERNET
ILEX DCS Toolkit Download
ISDM Data Management
ISDM Quality ControlINTERNET
WBSWeather Buoy
System
MSC Buoy Status Reports with GOES Platform ID’s
Config
ure Deploy
Buoys
GTS
MSC Buoy Data Acquisition

Pacific Buoy Network

Lake Buoy Network

East Coast Buoy Network
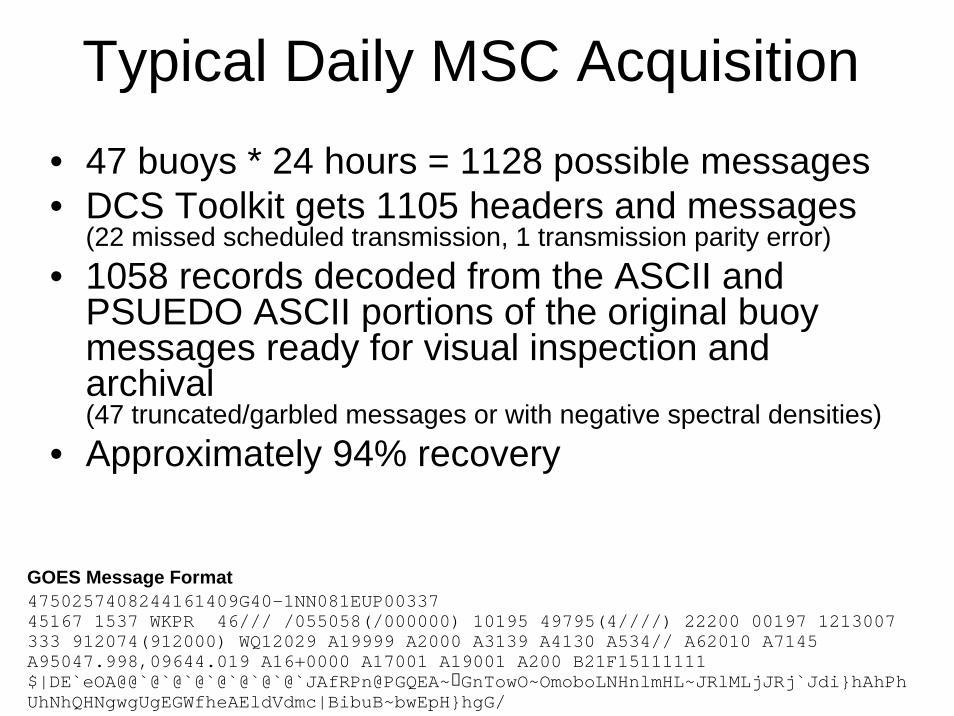
Typical Daily MSC Acquisition• 47 buoys * 24 hours = 1128 possible messages• DCS Toolkit gets 1105 headers and messages
(22 missed scheduled transmission, 1 transmission parity error)• 1058 records decoded from the ASCII and
PSUEDO ASCII portions of the original buoy messages ready for visual inspection and archival(47 truncated/garbled messages or with negative spectral densities)
• Approximately 94% recovery
GOES Message Format4750257408244161409G40-1NN081EUP0033745167 1537 WKPR 46/// /055058(/000000) 10195 49795(4////) 22200 00197 1213007 333 912074(912000) WQ12029 A19999 A2000 A3139 A4130 A534// A62010 A7145 A95047.998,09644.019 A16+0000 A17001 A19001 A200 B21F15111111
�$|DE`eOA@@`@`@`@`@`@`@`@`JAfRPn@PGQEA~ GnTowO~OmoboLNHnlmHL~JRlMLjJRj`Jdi}hAhPhUhNhQHNgwgUgEGWfheAEldVdmc|BibuB~bwEpH}hgG/

Data Recovery Challenges• Dependant on an up to date list of all GOES
transmitters ID’s in use by EC. • Transmission gaps resulting from deteriorating
satellite orbits (elevation angle for NW buoys), environmental conditions and transmitter malfunctions.
• Data recovery has improved significantly with transmitter improvements, satellite networks, download protocols and better coordination between MSC and ISDM.

Wave DataProcessing

Data Quality Control and
Spectral Analysis for
• Buoy Deployment Position• Wave Instrument Operation• Spectral Frequency Range• Spectral Shape • Significant Wave Height• Peak Period


Data Analysis and Quality ControlMethodologies
from• ISDM (DFO Canada) procedures• AXYS Technologies spectral transfer function• WMO formulae for spectral parameters• IOC Manual of Quality Control

Calculating Significant Wave Height (Hs)and Peak Period (Tp) from the Spectrum
• Hs is from the total spectral energy• Tp from the frequency with the highest energy• In small seas, low frequency noise appears in the spectrum
and causes errors in the Hs and Tp values.• The noise has to be removed to get accurate Hs and Tp.

large wave spectrum
frequency
Ener
gy D
ensi
ty
Low Frequency Noise “Tail” in Small Seas
small wave spectrum
frequency
Ener
gy D
ensi
tyLarge waves, relatively small tail
Small waves, relatively large tail at 0.033 Hz
• Standard spectral lowest frequency is 0.033 Hz
• Tail results of low frequency energy amplification transfer function.

Cut Off the Tail
Significant Wave Height is the area of the spectrum from the Low Cut-off Frequency (LCF) to the highest frequency.

Spectral Noise
0.000 0.050 0.100 0.150 0.200 0.250 0.300 0.350 0.400 0.450 0.500Frequency Hz
Ener
gy D
ensi
ty
Spectrum
Spectral Noise Approximation
from 0.033 Hz
Computed Low Frequency Cut Off
Re-evaluated Peak Period
Re-evaluated Significant Wave Height from
Spectral Energy above Low Frequency Cut Off
Find the Low Cut-off Frequency
by removing the low frequency spectral noise “tail”

Spectral Analysis and Quality ControlIncludes:
• Comparison of reported significant wave height (Hs) and peak period (Tp) to values computed from the spectrum.
• Physics in the spectrum, such as limits to wave steepness and zero crossing.
• Wave height ranges and continuity or changes over time.
• Comparison of GPS position to reported deployment station locations
Our system uses automated tests and visual checks which result in:
• Reported values changed to computed ones where appropriate
• Quality Control Flags for bad or corrupted spectra, bad or changed Hs and Tp, or buoys gone adrift or transmitting when not deployed.

Corrupted Spectrum Transmission Error
Note that the reported values for Hs and Tp are “GOOD”.

Buoy Transmitting Off of Station
1. Station position is in red. Buoy is traveling, and plotted as a yellow track.
2. Auto QC uses the data message GPS locations, and issues warnings as yellow markers.
3. Our technician flags all of these off station data messages as “BAD”.

Wave DataArchival

Enterprise Architecture in the ISDM Archive Technology
• We are making Oracle Databases, based on data standards.
• Our programmers are developing scientific data management applications in Java, together with the Oracle databases.
• We are beginning to base applications around standard Java libraries for oceanography.
• We employ multi-tier web and application servers including service oriented architecture (SOA) and J2EE.

HOURLY STATION MESSAGE
WEATHER OBSERVATIONS
SPECTRAL_ARRAY
PROCESS HISTORY
Daily Buoy Status Reportsand
Station Information Summary
Wave Instrument Type CodesQuality Codes
Parameter Codes
MSC Real Time Wave SystemStandard Definitions
Archive Tables for MSC Data
QUALITY CONTROL FLAG Data content is edited
• to include reported MSC buoy information
and
• to set variable names to standard definitions

Wave Data ServicesProviding Access to Data

ISDM Online Resources

Environment CanadaMarine Weather

The 10% Difference• Low frequency cutoff accounts for some
reduction in SWH for buoys in less than 233 m since 2002.
• SWS-1 indicated that the strap-down accelerometer consistently undervalues wave heights by about 10% over gimballed DatawellMKII.
• Differences in American/Canadian sampling and timeseries processing onboard the buoys. – If SWS TS data is available it might be worth
comparing Spectra/SWH/PP from different processors.

ISDM Integrated Science Data Management
:Bruce Bradshaw
: