brt in developing countries - uemi...brt in developing countries –case studies based on study...
TRANSCRIPT
BRT in Developing countries – case studies
Based on study developed by Darío Hidalgo,
2006: “A Critical Look at Major Bus
Improvements in Latin America:
Case Studies of Hitches, Hic-Ups and Areas
for Improvement; Synthesis of Lessons
Learned”

Contents• Overview of systems
• Impacts of BRT systems in developing world
• BRT and climate change
• Advantages of BRT over bus, rail
• Challenges of BRT in developing countries

BRT systems as of 2010
Map by Darío Hidalgo, data by Wright and Hook, 2007 and *Darío Hidalgo 2009 , Carlos Pardo 2010
México DF
Santiago
León
Porto Alegre
Istanbul*
Delhi*
Pune
Quito
Bogotá
Curitiba
Guayaquil
Pereira
Sao Paulo
Goiania
Lagos*
Beijing Hangzhou
Kunming Dalian*
Changzhou* Xiamen*
Chongqing.* Jinan*,
Guangzhou* Seoul
Jakarta
Nagoya
Taipei
Caen, Toulouse
Clermont Ferrand
Lyon, Nancy, Nantes
Nice, Paris, Rouen
Ámsterdam
Eindhoven
Utrecht
Bradford
Crawley
Edinburgh
LeedsEssen
Guatemala
Ottawa
York*
BostonEugene
Los Angeles
MiamiOrlando
Pittsburgh
New York*
Adelaide
Brisbane
Sidney
Cali*, B/manga*
Guadalajara*
Cleveland*
Ahmedabad*
Johannesburg*
Teherán*
Auckland
Mérida
Castellón*
Bologna*
Lima*

Brief historyPrevious status quo (and sometimes current) in public transport:
• Chaos
• Competition in (not for) the market
• War of the cent
• Atomized sector, owners, drivers, cooperatives, etc
• Need of an alternative (BRT!)
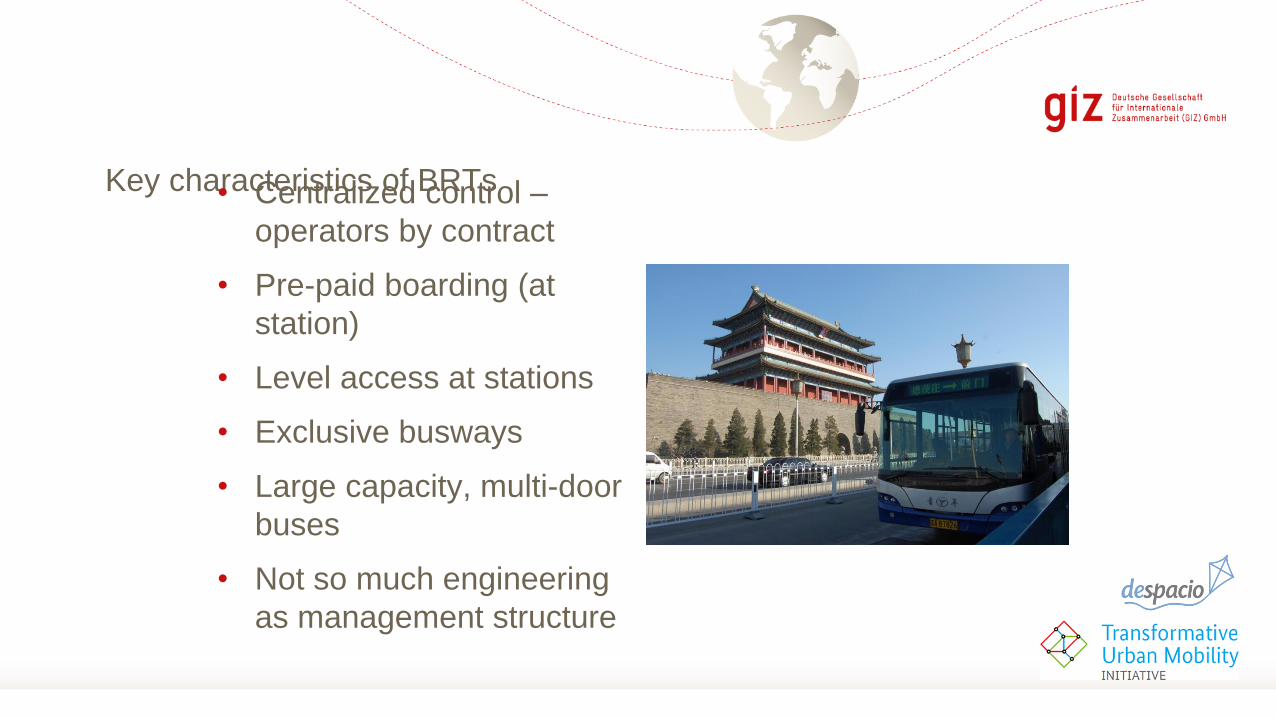
Key characteristics of BRTs• Centralized control –
operators by contract
• Pre-paid boarding (at
station)
• Level access at stations
• Exclusive busways
• Large capacity, multi-door
buses
• Not so much engineering
as management structure
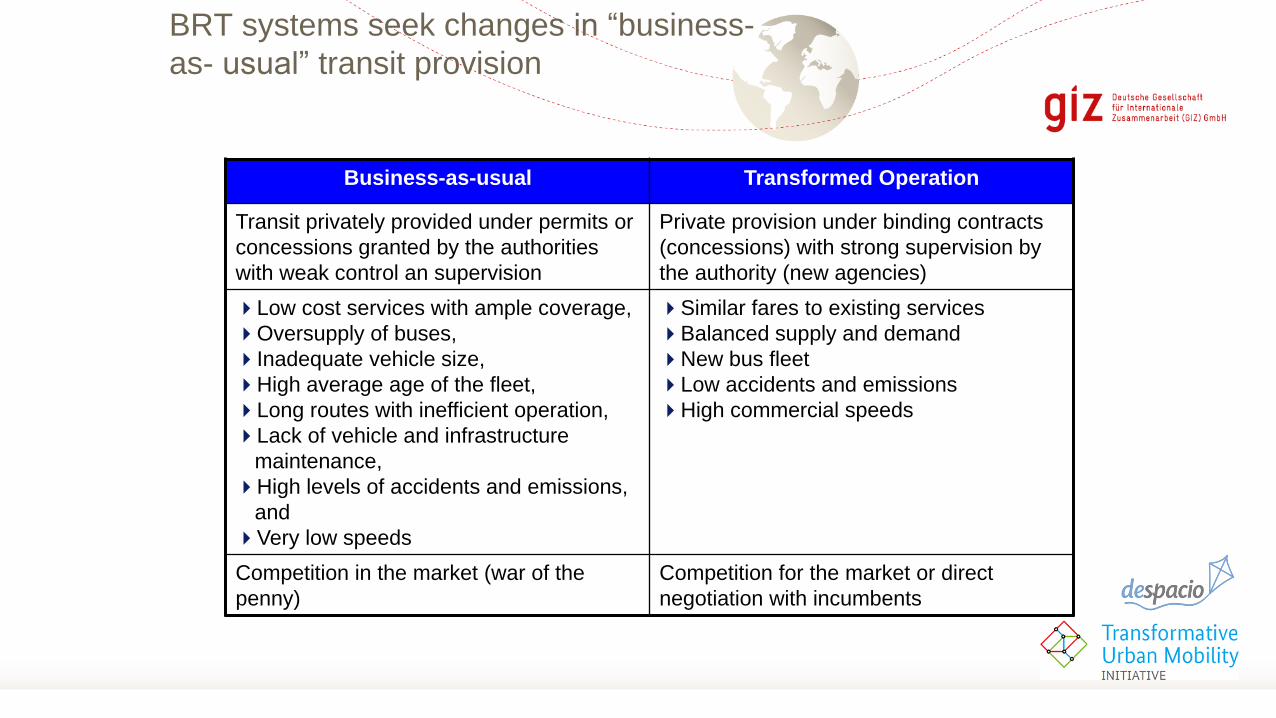
BRT systems seek changes in “business-
as- usual” transit provision
Business-as-usual Transformed Operation
Transit privately provided under permits or
concessions granted by the authorities
with weak control an supervision
Private provision under binding contracts
(concessions) with strong supervision by
the authority (new agencies)
Low cost services with ample coverage,
Oversupply of buses,
Inadequate vehicle size,
High average age of the fleet,
Long routes with inefficient operation,
Lack of vehicle and infrastructure
maintenance,
High levels of accidents and emissions,
and
Very low speeds
Similar fares to existing services
Balanced supply and demand
New bus fleet
Low accidents and emissions
High commercial speeds
Competition in the market (war of the
penny)
Competition for the market or direct
negotiation with incumbents

BRT Corridors have high performance
Performance
Measure
Quito
Metrobús-Q
Bogotá
TransMilenio
León
SIT-Optibús
México City
Metrobús
Insurgentes
Demand
(Pax/day)
Trolebus 246,000
Ecovía 81,000
North 120,000*
1,220,000 220,000* 260,000
Peak Load Section
(Pax/hour/direction)
Trolebus 9,000
Ecovía 5,000
North N.A.
45,000 3,000 8,000
Commercial Speed
(km/hour)
Trolebus 14.5
Ecovia 18.0
North 23.0
26.0 18.0-20.0 19.0
Passenger per
Kilometer Index
(PKI)
Trolebus 10.6
Ecovia 11.1
North 7.5
5.3 10.0 10.0
Passenger per
Bus/Day
Trolebus 2,181
Ecovia 1,928
North N.A.
1,450 N.A. 3,095

Capital Costs are Relatively Low
12.98
6.49
5.71
2.26
1.54
1.24
1.18
0.88
0.0 2.0 4.0 6.0 8.0 10.0 12.0 14.0
Bogota Phase 2 All
Bogota Phase 2 Transit Only
Bogota Phase 1
Quito Central Norte
Mexico Insurgentes
Quito Ecovia
Quito Trolebus
Leon
Capital Cost per Kilometer of Trunkway
0.303
0.139
0.106
0.089
0.083
0.069
0.061
0.000 0.050 0.100 0.150 0.200 0.250 0.300 0.350
Quito Trolebus
Quito Central-Norte
Bogota Phase 2
Bogota Phase 1
Quito Ecovia
Leon
Mexico Insurgentes
Annualized Capital Cost of Equipment/Annual Passengers
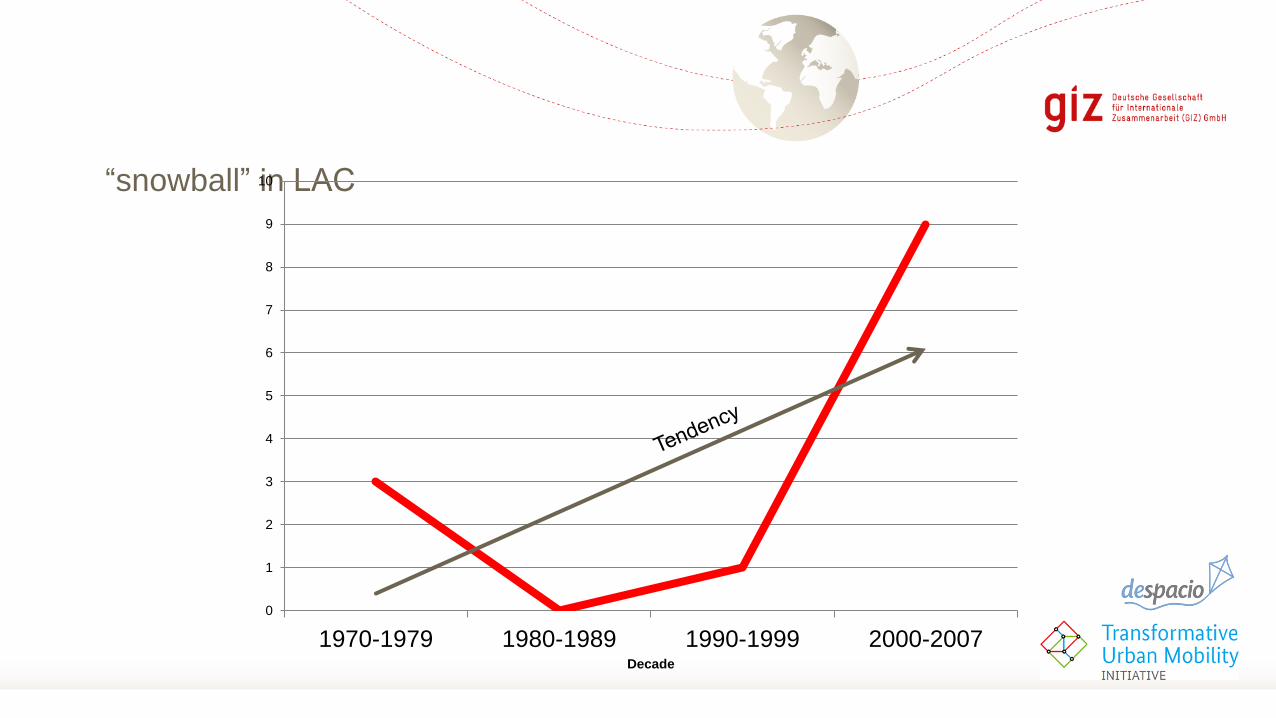
“snowball” in LAC
0
1
2
3
4
5
6
7
8
9
10
1970-1979 1980-1989 1990-1999 2000-2007Decade
Cantidad de sistemas por década (solo LAC)

Examples (short)
Curitiba (1972)
• “First” BRT system
• 64.6 kms of trunk lines
• 560,000 pax/day
• 20,000 pax/h/direction
• (bi) articulated vehicles
• 1.1-6 mio USD/km
Breakthrough Technologies Institute

Examples (short)
Quito (1995, 2001, 2004)
• 3 systems
• 37 kms of trunk lines
• 440k pax /day
• Public /private operator
• No physical or fare integration(!)
• 0.5-5mio USD/km
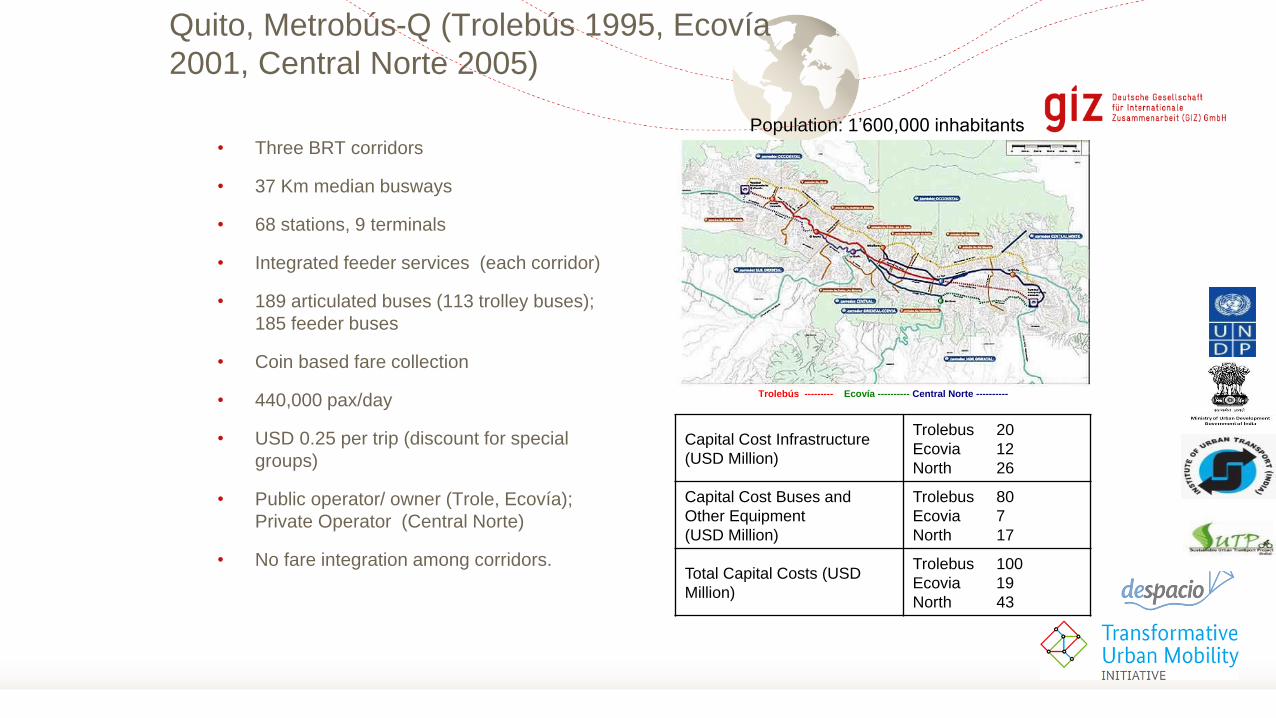
Quito, Metrobús-Q (Trolebús 1995, Ecovía
2001, Central Norte 2005)
• Three BRT corridors
• 37 Km median busways
• 68 stations, 9 terminals
• Integrated feeder services (each corridor)
• 189 articulated buses (113 trolley buses);
185 feeder buses
• Coin based fare collection
• 440,000 pax/day
• USD 0.25 per trip (discount for special
groups)
• Public operator/ owner (Trole, Ecovía);
Private Operator (Central Norte)
• No fare integration among corridors.
Trolebús --------- Ecovía ---------- Central Norte ----------
Capital Cost Infrastructure
(USD Million)
Trolebus 20
Ecovia 12
North 26
Capital Cost Buses and
Other Equipment
(USD Million)
Trolebus 80
Ecovia 7
North 17
Total Capital Costs (USD
Million)
Trolebus 100
Ecovia 19
North 43
Population: 1’600,000 inhabitants

Quito, Metrobús-Q (Trolebús 1995, Ecovía
2001, Central Norte 2005)
Things done well
• The concept of organized feeder-trunk operations has evolved as the paradigm of public transport in Quito
• The infrastructure costs have been very low
• Inclusion of electric trolleybuses for the first corridor
• High performance
Things that perhaps should have been done differently
• Corridors do not have physical and fare integration yet.
• Fares are politically defined and do not cover operation and bus capital costs.
• A transition to private operation could be beneficial, but no adequate mechanisms have been used.
• Some infrastructure problems: pavement rutting and station floor deterioration;
• Implementation of advanced fare collection technologies has been delayed.

Quito, Metrobús-Q (Trolebús 1995, Ecovía
2001, Central Norte 2005)
Critical positive enablers
International cooperation, e.g. UNDP and the Government of Spain
Decentralization of transport authority from the National government to the municipality of Quito.
Continuous mayoral support, even with changes in political parties.
Initial leadership of project director César Arias; continued leadership of Architect Hidalgo Nuñez
Initial success of the Trolebús corridor
Critical barriers
Opposition from existing transit operators
Negotiations with historic operators have brought unbalanced results for the city.
Not enough capacity has been built in public authorities
Very low fare (USD 0.25) does not cover capital investment in Trolebús and Ecovía, and may cause financial problems to private operators in Central Norte

Examples (short)Bogotá (2000)
• “Full BRT”
• 84 km operation
• 1,6 million pax / day
• Up to 45k pax/h/direction
• NMT integration
• Phase 3 construction
• 5.3-13.3 mio USD/ km
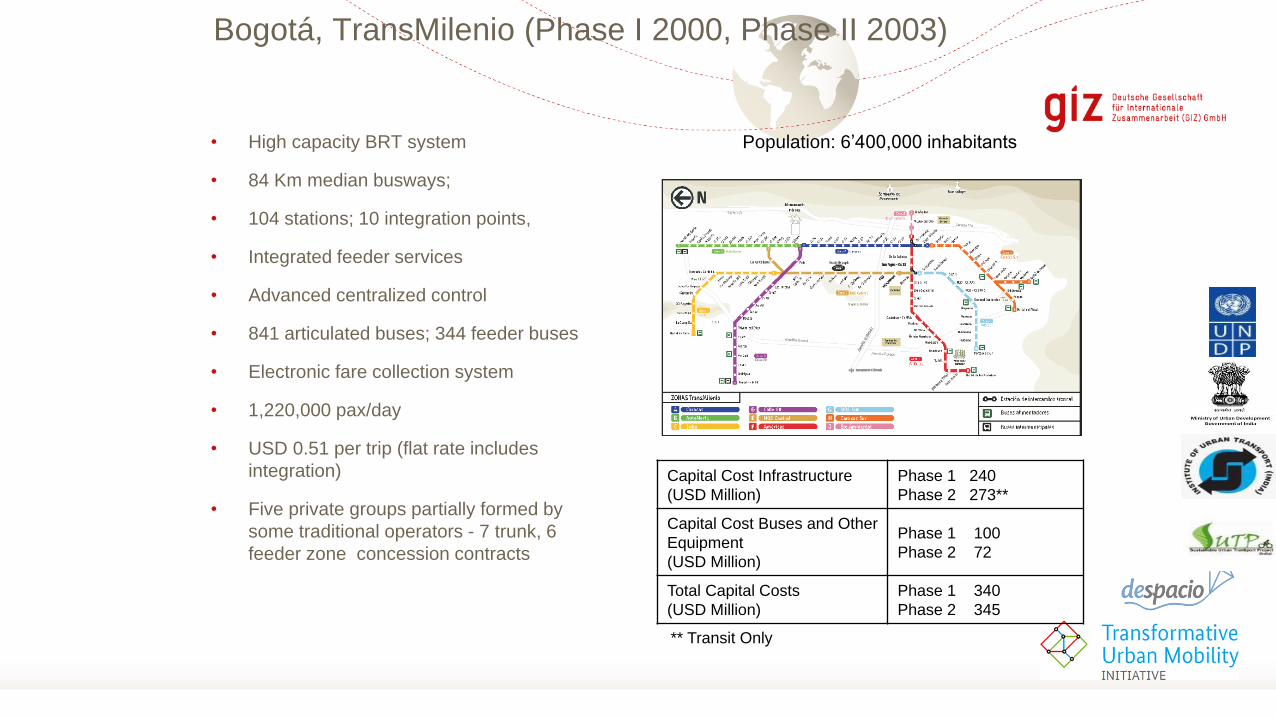
Bogotá, TransMilenio (Phase I 2000, Phase II 2003)
• High capacity BRT system
• 84 Km median busways;
• 104 stations; 10 integration points,
• Integrated feeder services
• Advanced centralized control
• 841 articulated buses; 344 feeder buses
• Electronic fare collection system
• 1,220,000 pax/day
• USD 0.51 per trip (flat rate includes
integration)
• Five private groups partially formed by
some traditional operators - 7 trunk, 6
feeder zone concession contracts
Capital Cost Infrastructure
(USD Million)
Phase 1 240
Phase 2 273**
Capital Cost Buses and Other
Equipment
(USD Million)
Phase 1 100
Phase 2 72
Total Capital Costs
(USD Million)
Phase 1 340
Phase 2 345
Population: 6’400,000 inhabitants
** Transit Only

Bogotá, TransMilenio (Phase I 2000, Phase II
2003)
Things done well
• Planning and implementation in a very short time.
• Adequate distribution of responsibilities, incentives and risks for public-private participation
• Regulation and control through binding contracts awarded after a competitive process.
• No operational subsidies required.
• High performance
Things that perhaps should have been done differently
• Some pavement structures and station floors had early deterioration
• Implementation was rushed; several details had to be adjusted with the system under operation.
• Infrastructure for Phase II could have been designed and constructed at lower cost
• Implementation for Phase II could have been preceded by large scale user education campaign.
• Better reorganization of remaining routes and actual reduction of capacity in traditional system

Bogotá, TransMilenio (Phase I 2000, Phase II
2003)
Critical positive enablers
• Leadership of Mayor Enrique Peñalosa, continued in succeeding administrations
• Conformation of a planning and implementation team outside the existing institutions
• Dedication of time and effort to carefully design system components (technical, financial, legal, regulatory)
• Existence of basic planning data from previous studies
Critical barriers
• Opposition from existing operators, especially bus owners. Priority was given to existing bus companies (and bus owners in Phase II)
• Busways had a very bad perception. It was necessary to improve the urban space and develop a distinctive image
• Low prevailing transit fares, required the highest efficiency and even redefine components to match cost and revenues
• Interference from non project participants within the government – solved through leadership of the Mayor

Road safety- TransMilenio Bogotá1378
2980 104
155
936
174
254
451
382
66
8 4 11 20
200
400
600
800
1000
1200
1400
1600
Before TM 2002 2003 2004 2005
Collisions Injuries Deaths
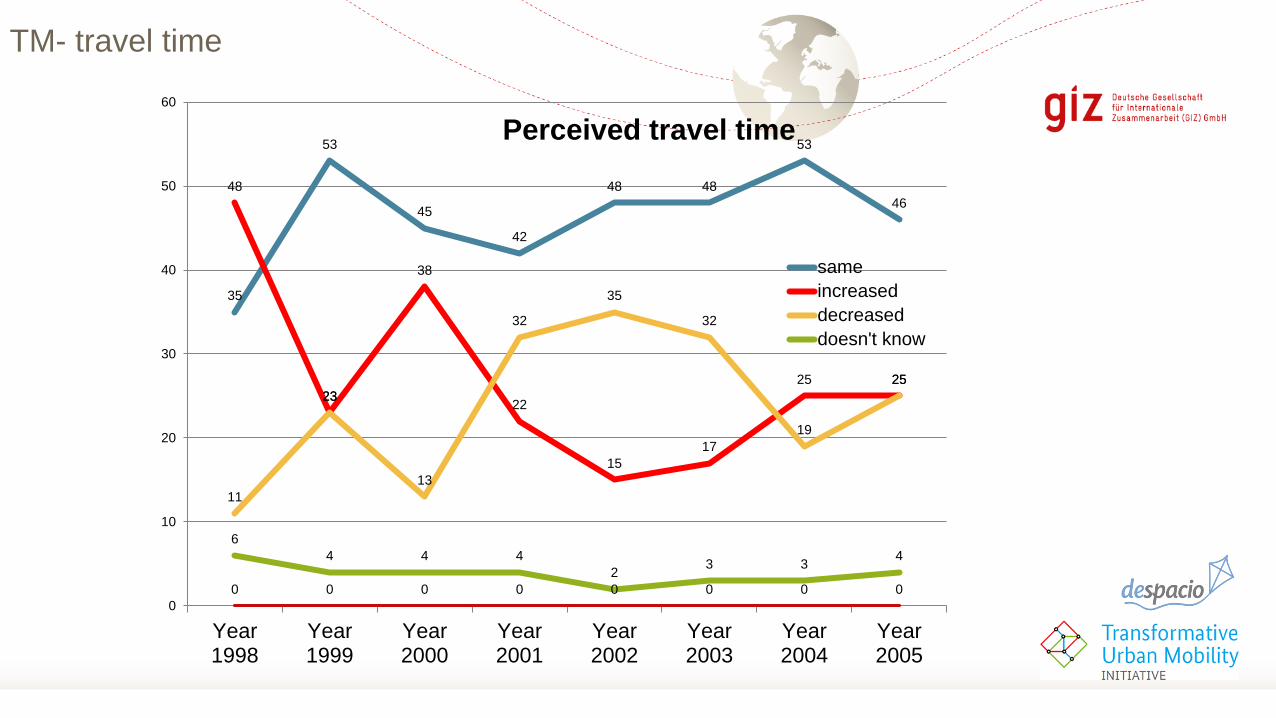
TM- travel time
0 0 0 0 0 0 0 0
35
53
45
42
48 48
53
46
48
23
38
22
15
17
25 25
11
23
13
32
35
32
19
25
6
4 4 4
23 3
4
0
10
20
30
40
50
60
Year1998
Year1999
Year2000
Year2001
Year2002
Year2003
Year2004
Year2005
Perceived travel time
same
increased
decreased
doesn't know

• Increase in rent value
(darker green is increased
value, darker blue is
decreased value)
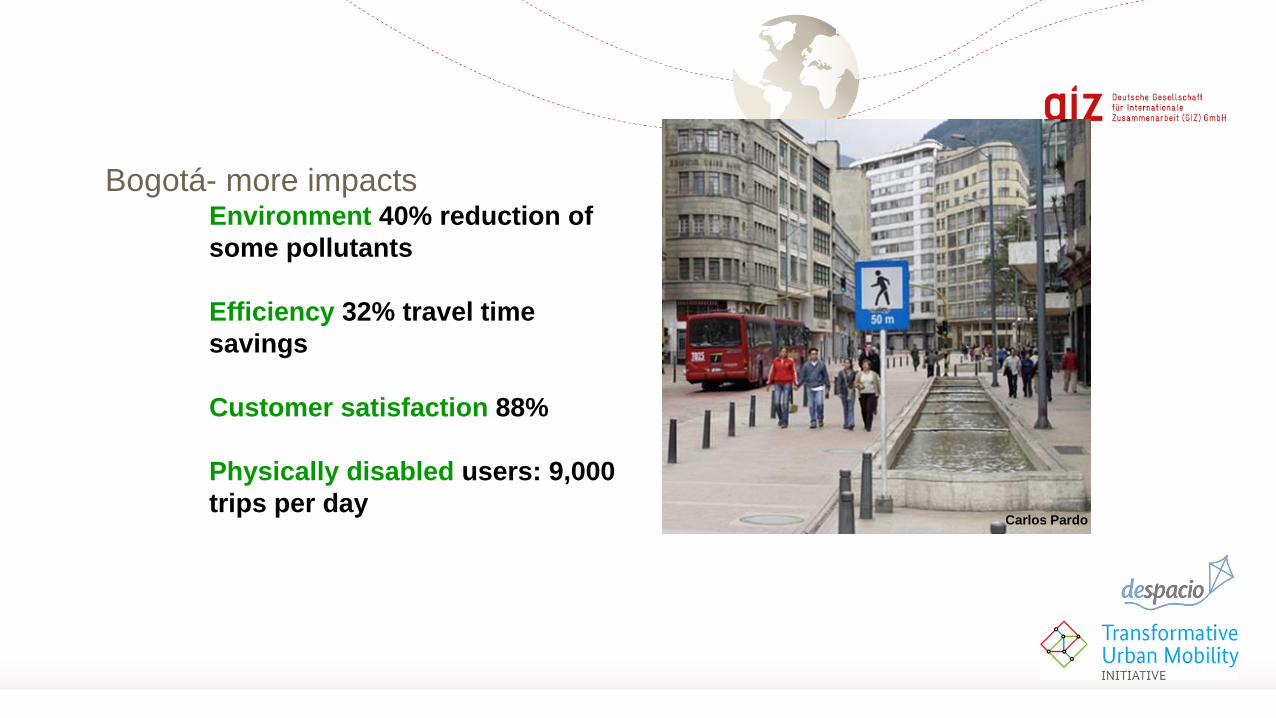
Bogotá- more impactsEnvironment 40% reduction of
some pollutants
Efficiency 32% travel time
savings
Customer satisfaction 88%
Physically disabled users: 9,000
trips per dayCarlos Pardo
CDM methodologies
• Bogotá’s TransMilenio: abating 0.25 Mt CO2e per year (certified emissions) – only certified
project
• Other Four CDM transport-related projects in Colombia: expected to abate a total of 0.55 Mt
CO2e per year.
• Cali’s MIO, Pereira’s Megabus, aerial cable car in Medellín
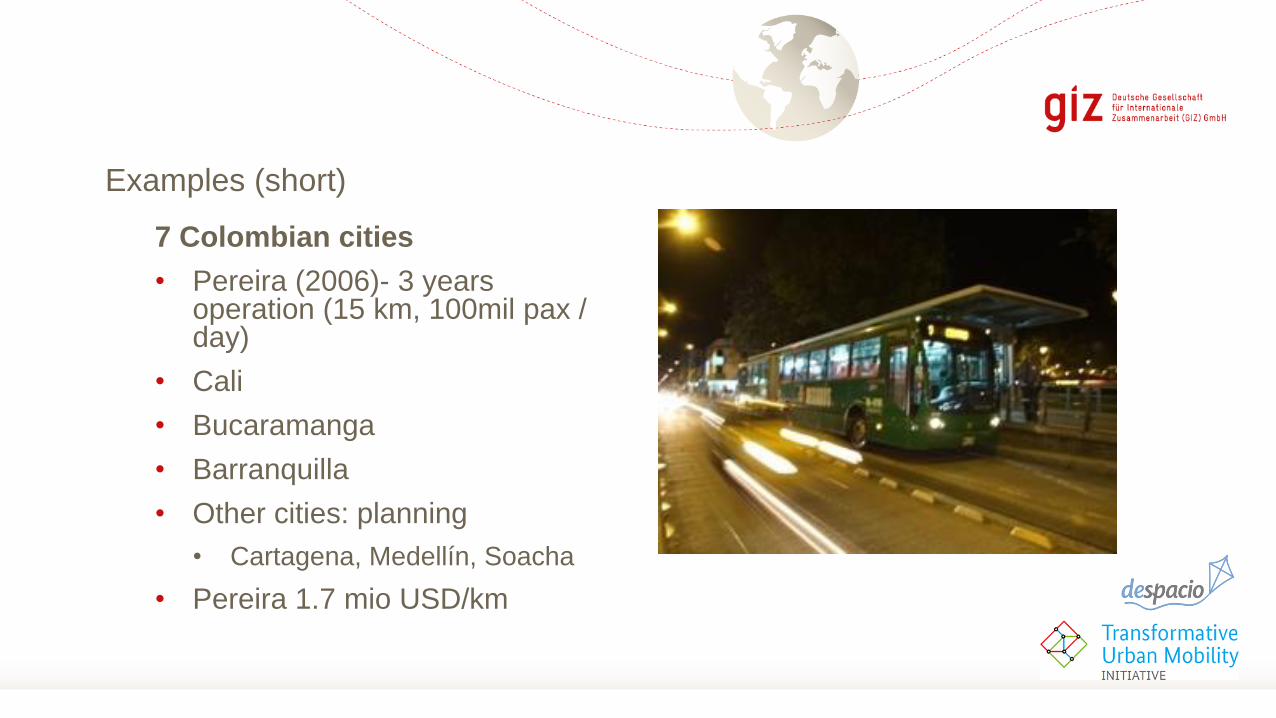
Examples (short)
7 Colombian cities
• Pereira (2006)- 3 years operation (15 km, 100mil pax / day)
• Cali
• Bucaramanga
• Barranquilla
• Other cities: planning
• Cartagena, Medellín, Soacha
• Pereira 1.7 mio USD/km

Examples (short)
Sao Paulo (2003)
• System “interligado”
• 129.5 km
• 140k pax/day
Peter Alouche

Examples (short)
México (2005)
• 50 km trunk lines
• 473 mil pax / day
• 7 operators (public, private)
• Subsidised fare
• Complements metro
• 1.5 mio USD/km
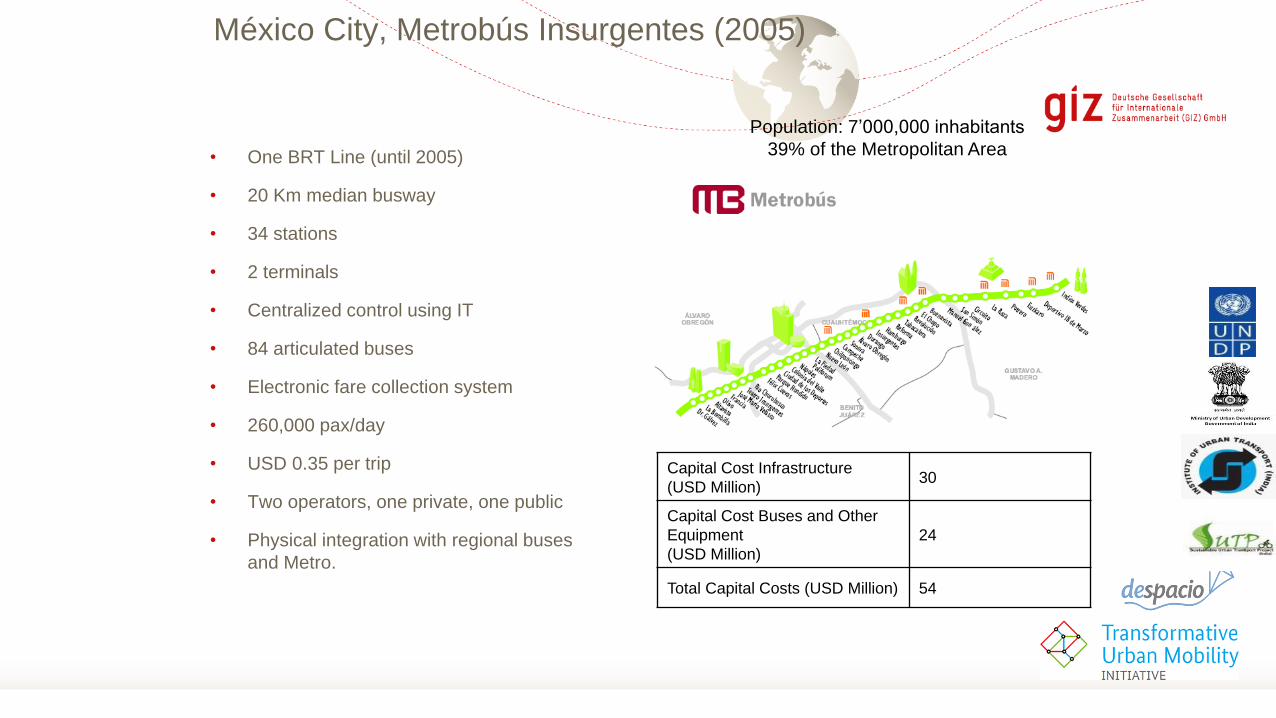
México City, Metrobús Insurgentes (2005)
• One BRT Line (until 2005)
• 20 Km median busway
• 34 stations
• 2 terminals
• Centralized control using IT
• 84 articulated buses
• Electronic fare collection system
• 260,000 pax/day
• USD 0.35 per trip
• Two operators, one private, one public
• Physical integration with regional buses
and Metro.
Capital Cost Infrastructure
(USD Million)30
Capital Cost Buses and Other
Equipment
(USD Million)
24
Total Capital Costs (USD Million) 54
Population: 7’000,000 inhabitants
39% of the Metropolitan Area

México City, Metrobús Insurgentes (2005)
Things done well
• Planning and implementation took a very short time.
• Infrastructure costs were relatively low.
• Showed the potential of high capacity/better quality bus operations.
• Involves private operators formed out of existing concessionaries.
• High performance/ good users’ ratings
Things that perhaps should have been done differently
• Implementation was rushed. Most problems were solved during the first weeks of operation.
• Financial planning was too tight (little room for contingencies) and assumptions were on the non-conservative side – operational deficit
• Early destruction of several segregation devices, bad alignment of some stations, conflicting turning bays for general traffic, and interference in Glorieta Insurgentes. Pavements were not reconstructed
• Fare collection implementation could have longer time-table and stronger supervision\

México City, Metrobús Insurgentes (2005)
Critical positive enablers
• Leadership of Secretary Claudia Sheimbaum – creation of a
planning and implementation team outside the existing
institutions
• Pressure from environmental groups -NGOs, international
development institutions,
• Selection of a highly visible corridor with low technical and
political requirements for initial implementation.
Critical barriers
• Opposition from existing concessionaries. Good conditions
were negotiated with them.
• Low technical capacity and hands on experience of the
implementation team and consultants. Technical cooperation
partially covered the gaps.
• Low target fare (USD 0.35) generated financial difficulties for
the corridor to be self sustainable.
• Interference from non project participants within the
government, required the intervention and leadership of the
Head of Government.

Examples (short)
Guayaquil (2006)
• 15.5 km trunk lines
• 100mil pax/day
• Foundation is manager
• Publicity revenue covers admin costs
• 1.4 mio USD/km
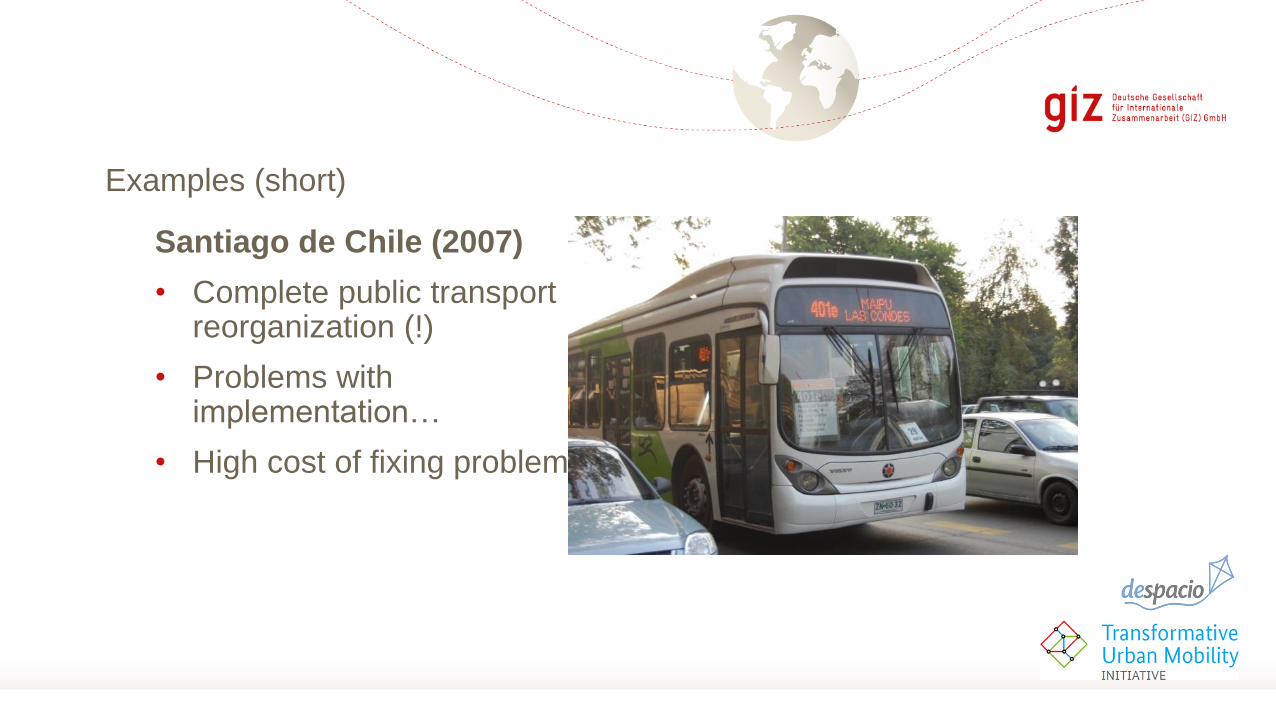
Examples (short)
Santiago de Chile (2007)
• Complete public transport reorganization (!)
• Problems with implementation…
• High cost of fixing problems

Examples (short)
Guatemala (2007)
• 11 kms trunk lines
• Part of Guatemala
2020 plan
• 143,000 pax/day

Examples (short)
Lima (2010)
• Slow implementation
• (before) low political commitment
• 32km trunk lines
• Started 2010 (trials from April, full operation from August)
Gerhard Menckhoff

Summary and impacts

Relevant data - transformation
Directly taken from Hidalgo etal, 2007
Single corridor Various corridors,
feeder routes
Citywide
transformation
Non Inte
gra
ted
Inte
gra
ted
Metrobús – Mexico
BRT – Beijing
TransMilenio - Bogotá
Metrovía - Guayaquil
Yakarta (1, 2, 3)
Quito (Trole, Ecovía, North)
Transantiago
Interligado – Sao PauloMegabús - Pereira
RIT - Curitiba
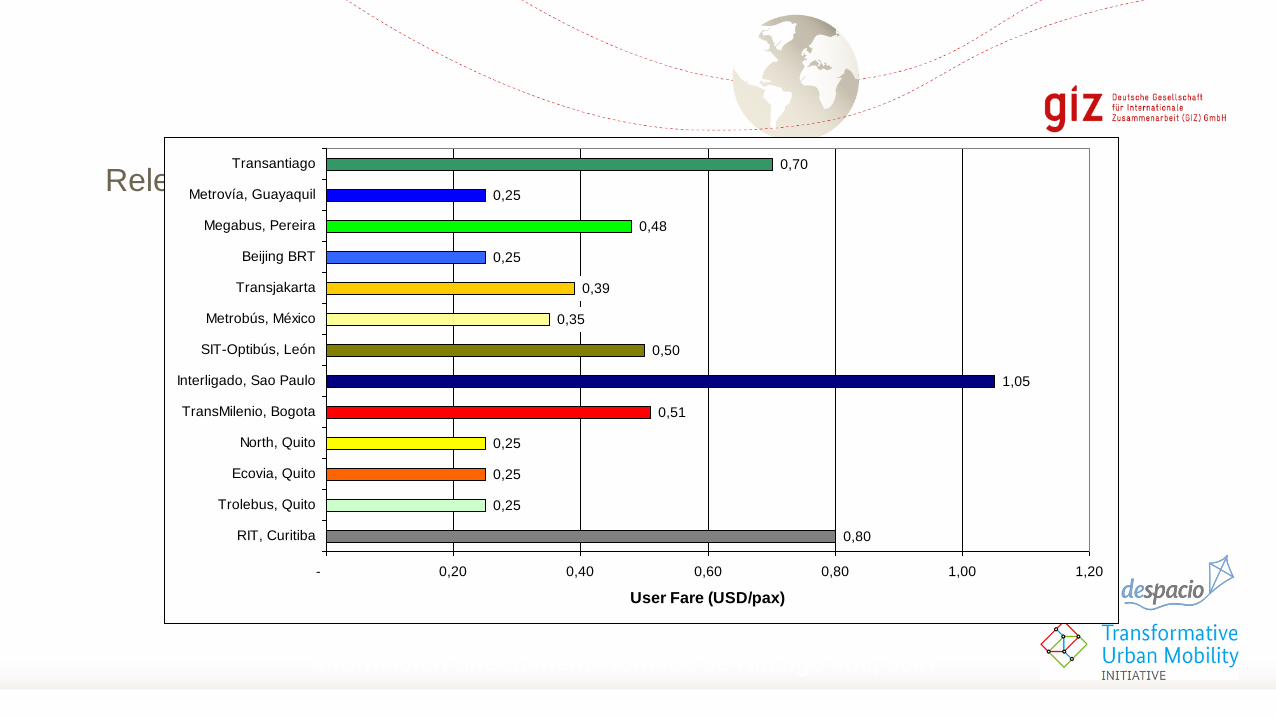
Relevant data - fares
Información directamente tomada de Hidalgo etal, 2007
0,80
0,25
0,25
0,25
0,51
1,05
0,50
0,35
0,39
0,25
0,48
0,25
0,70
- 0,20 0,40 0,60 0,80 1,00 1,20
RIT, Curitiba
Trolebus, Quito
Ecovia, Quito
North, Quito
TransMilenio, Bogota
Interligado, Sao Paulo
SIT-Optibús, León
Metrobús, México
Transjakarta
Beijing BRT
Megabus, Pereira
Metrovía, Guayaquil
Transantiago
User Fare (USD/pax)

The most relevant planning issues observed
were
• Planning activities depended on the ideas and expectations of key decision
makers. • When a clear vision of the Mayor was observed (e.g. Bogotá), planning for implementation
received priority and development cycles were short.
• Funding for planning was scarce, • Cities needed to rely on donations, grants from other levels of government, and loans. The
process took several months as well as approval of project activities. Valuable time was
expended at the beginning of the processes.
• Lack of experienced local staff was also an issue and caused delays.
• Once decisions were achieved, planning became secondary to
implementation. • Implementation was rushed. Fast evaluation and design was possible when adequate and
experienced consultants were retained and the cities formed capable planning teams.
• Lack of familiarity with BRT concepts made planning difficult. • Most effort was dedicated to transport planning issues and technical details with less effort on
key institutional, legal and financial issues.
• Definition of fare levels by the political authority was complex.
• Teams coordinating the efforts were outside the existing structures. • The cities reviewed created “task forces” that were later transformed in new institutions to
overcome the burden of business-as-usual in existing agencies.

Top-down decision processes resulted in faster implementation and less
inter-agency conflicts• The creation of an adequate regulatory framework seems to be more
important than solving technical details.
• All cities reviewed required changes either in the
regulations and definition of authority or the creation of
new institutions to plan, develop and control the projects.
• Providing adequate levels of funding for infrastructure was challenging,
despite the fact that most projects were relatively low cost.
• New mechanisms to provide funding and
intergovernmental grants were required to spark project
implementation.

Private participation has been preferred to public take-over – but there has
been a need to overhaul private operators
• Negotiation with existing operators
• Includes all existing stakeholders in the project
• Opposed stakeholders, even if they are a few, can result in project failure
• May be unbalanced, in favor of the existing operators, especially if time runs out
• Interest of special groups is privileged over larger public interest
• Limited Bidding – priority to existing operators
• Includes a number of stakeholders in the project – those not interested are left out
• Interested stakeholders help the project to advance, specially if they see their interest taken into account
• Existing operators may have low technical capacity and managerial abilities – may cause additional costs, but learning curve seems to be very steep
• Open Bidding – no priority to existing operators
• Experienced operators (generally from abroad) are considered – lower costs
• Places public interest over special interests, but can cause early rejection and total project failure

Implementation was rushed, but most
problems were solved within the initial weeks
• Infrastructure and fare collection systems were delayed due to inherent
implementation problems (short lead times; contractual problems; delays in
approvals by different authorities, etc.).
• Little time between bus delivery and start of operations, and drivers’ training
was incomplete.
• User education was also scarce (especially for expansion Phase II, causing
severe problems)
• Public protests by affected groups caused problems. The use of the authority
was required and implementation was not affected at the end. Support from
different levels of government, helped solving citywide standoffs. Fear of
protests has caused cities to seek to prevent unrest by involving all existing
operators.
Main operational concerns are high occupation, pavement maintenance,
and pickpockets • Systems are designed for very high occupation to keep operational costs as
low as possible– structural solutions may involve route reorganizations and
large capital investments (additional buses, higher user costs)
• Large waiting times for feeder buses operating on mixed traffic in local streets
– may also require large capital and operational expenses
• Pavement and other infrastructure maintenance – depend on the initial design
and construction methods, as well as availability of recurrent funding
• Solution to safety concerns (pickpockets), is only partially on hands of the
transport authorities (implementation of CCTV and expansion of safety
manpower), but also goes to economic environment (rate of unemployment)
and legislation (penalties applied to offenders)
• Service gap between organized and traditional services

The main structural problems are financial and regulatory
• Expansion of the system is limited due to pressures by existing operators and lack of funds – no
earmarked funds for maintenance (existing funds dedicated to system expansion)
• Current services are not integrated with other type of services: dual (feeder-trunk) and
complementary – improvement of coordination of traffic lights and some bottlenecks such as at-
grade access to terminals

Conclusion
• Systems reviewed have greatly improved travel conditions.
• The main achievement has been travel time savings as well as enhanced reliability.
• As efficiency has improved, systems have also reduced energy consumption and emissions.
• Urban enhancements are also evident in the cases of Bogotá and Quito Trolebús where the
appalling conditions of the corridors before system implementation have completely changed.
• Nevertheless, in every case there are elements that deserve attention and indicate lessons for
the development of similar projects in other developing cities.
Recommendations
• Planning
• Plan with implementation bias, solving “how” rather than “what”.
• Combine financial, legal and environmental aspects with engineering.
• Dedicate enough resources (time, money) to good preparation.
• Use experiences available in other cities as a reference, but adapt system components and characteristics to local conditions.
• Try to create special purpose teams for system planning and implementation, not affected by day-to-day responsibilities.
• Decision Process
• Get approval of high level decision makers early on the process (top-down approaches are faster and help solving inter agency conflicts).
• Give priority to regulatory issues, adapting regulatory framework if required.
• Try to create a special purpose agency to plan, oversee and control system development, and provide adequate coordination mechanisms.
• Be creative in funding project development, using new taxes, loans and non traditional sources –privatizations, special purpose bonds. Funding often conditions project scope.
• Involve existing operators to mitigate conflicts, but keep open bidding processes to reduce user costs.
• Implementation Approach
• Only attempt citywide reorganization of transit services if you have strong authorities and large public support.
• Try to use gradual implementation and adapt the project with initial experiences.
• Make an effort to use existing right-of-way to reduce land acquisition and non-voluntary displacement.
• Seek pavement improvements to avoid rapid deterioration.
Recommendations
• Implementation
• Generate a credible time table and manage it to prevent rushed implementation. Commissioning dates usually do not have slack due to end of terms of elected officials.
• Have contingent plans ready if system components are not complete.
• Dedicate funding to plan and implement user education programs.
• If there are protests, emphasize general benefit over special interests and apply authority.
• Operation
• Use the intrinsic flexibility of buses to balance supply and demand.
• Be aware that pavement maintenance is a permanent issue.
• Use strong dividers to segregate traffic.
• Prefer median lanes and level access platforms to increase speed and reliability.
• Allow time to adapt and implement advanced fare collection systems.
• Use advanced transit management systems if operations are complex, and apply it as tool to control reliability, not just as a means of acquiring operational data.
• Structural issues
• Try to provide mechanisms for technical (automatic) definition of fares without political interference.
• Make a strong effort to stick to the contracts – permanent renegotiation is often unbalanced in favor of the operators.

Main challenges of BRT
• Credibility of the BRT “brand”
• Rail lobbies
• Adjustment of fare distribution
among actors
• More PPP developments (e.g.
terminal stations, land
development)
• NMT integration
Photo Carlosfelipe Pardo
