brown-formanannu al report our balanced perspective 2008
TRANSCRIPT

Brown - Forman A n n u A l R e p o R t o u R B A l A n C e D p e R S p e C t I V e 2 0 0 8

FINANCIAL HIGHLIGHTS
quArTerLy FINANCIAL INFormATIoN
(Expressed in millions, except per share amounts and ratios) 2007 2008 % Change
CONTINUING OPERATIONS
Net Sales $2,806 $3,282 17%
Gross Profit $1,481 $1,695 14%
Operating Income $ 602 $ 685 14%
Net Income $ 400 $ 440 10%
Earnings Per Share
– Basic $ 3.26 $ 3.59 10%
– Diluted $ 3.22 $ 3.55 10%
Return on Average Invested Capital 17.4% 17.2%
Gross Margin 52.8% 51.6%
Operating Margin 21.5% 20.9%
(Expressed in millions, except per share amounts) Fiscal 2007 Fiscal 2008
First Second Third Fourth First Second Third Fourth Quarter Quarter Quarter Quarter Year Quarter Quarter Quarter Quarter Year
Net Sales $ 633 $ 727 $ 755 $ 691 $2,806 $ 739 $ 893 $ 877 $ 772 $3,282
Gross Profit 349 383 387 362 1,481 391 470 433 401 1,695
Net Income
Continuing Operations 95 125 112 69 400 95 130 116 99 440
Total Company 94 124 105 67 389 95 129 116 99 440
Basic EPS
Continuing Operations $ 0.77 $ 1.02 $ 0.91 $ 0.56 $ 3.26 $ 0.77 $ 1.05 $ 0.94 $ 0.82 $ 3.59
Total Company 0.76 1.01 0.86 0.54 3.17 0.77 1.05 0.94 0.82 3.59
Diluted EPS
Continuing Operations $ 0.76 $ 1.00 $ 0.90 $ 0.56 $ 3.22 $ 0.77 $ 1.04 $ 0.93 $ 0.81 $ 3.55
Total Company 0.76 1.00 0.85 0.54 3.14 0.77 1.04 0.94 0.81 3.56
Cash Dividends per Common Share
Declared $ 0.56 $ – $ 0.61 $ – $ 1.17 $ 0.61 $ – $ 0.68 $ – $ 1.29
Paid 0.28 0.28 0.30 0.30 1.17 0.30 0.30 0.34 0.34 1.29
Market Price Per Common Share
Class A High $77.70 $79.58 $73.23 $71.19 $79.58 $77.50 $82.50 $78.50 $76.15 $82.50
Class A Low 69.14 71.55 66.41 66.32 66.32 66.50 69.70 63.00 65.00 63.00
Class B High $77.65 $79.38 $72.65 $68.25 $79.38 $74.26 $79.88 $76.15 $73.35 $79.88
Class B Low 68.32 71.19 64.20 63.54 63.54 63.76 66.04 61.35 62.10 61.35
Note: Quarterly amounts may not add to amounts for the year due to rounding.
FINANCIAL HIGHLIGHTS
10,000
8,000
6,000
4,000
2,000
0
2004 2005 2006 2007 2008
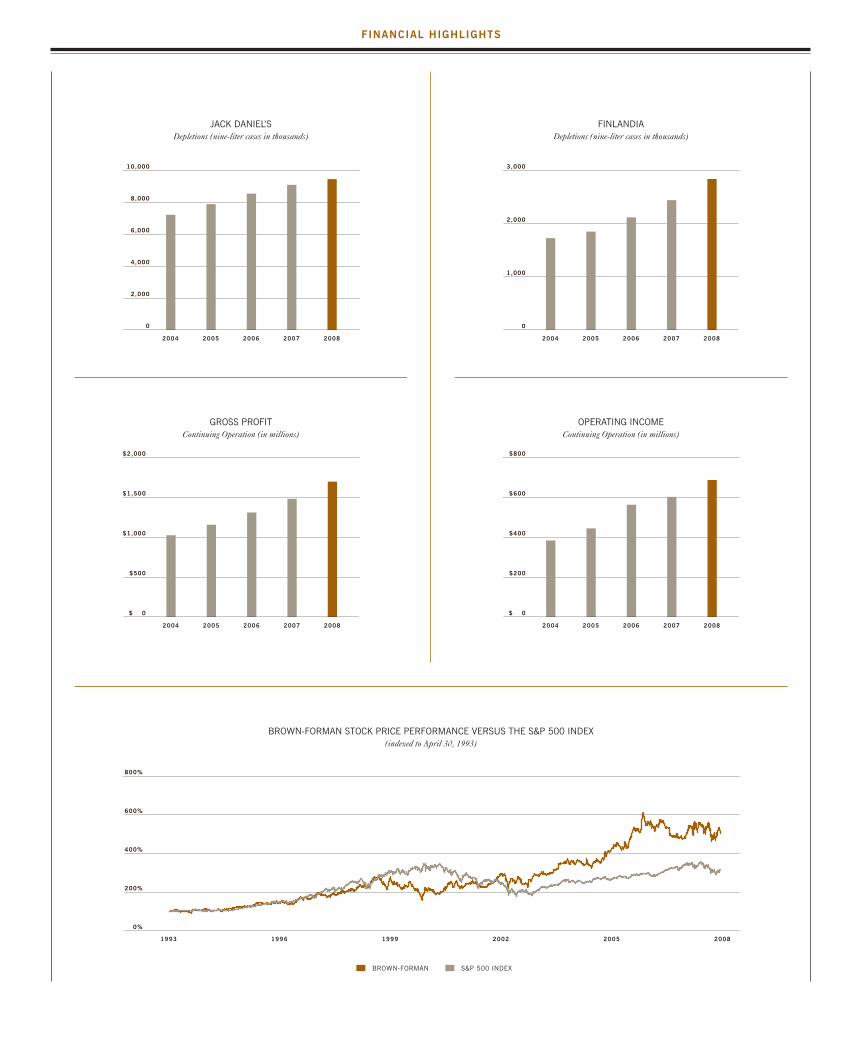
JACk DANIEl’S Depletions (nine-liter cases in thousands)
bROwN-fORmAN STOCk PRICE PERfORmANCE vERSUS ThE S&P 500 INDEx (indexed to April 30, 1993)
fINlANDIA Depletions (nine-liter cases in thousands)
3,000
2,000
1,000
0
2004 2005 2006 2007 2008
$1,000
$800
$600
$400
$200
$ 0
2004 2005 2006 2007 2008
800%
600%
400%
200%
0%
200820052002199919961993
BROWN-FORMAN S&P 500 INDEX
OPERATING INCOmE Continuing Operation (in millions)
$800
$600
$400
$200
$ 0
2004 2005 2006 2007 2008
$700
$600
$500
$400
$300
$200
$100
$ 0
2003 2004 2005 2006 2007
GROSS PROfIT Continuing Operation (in millions)
$2,000
$1,500
$1,000
$500
$ 0
2004 2005 2006 2007 2008
$700
$600
$500
$400
$300
$200
$100
$ 0
2003 2004 2005 2006 2007

2Letter From the Chief Executive Officer
5Message From the Presiding Chairman of the Board
6Balancing Acceptable Risk & Exceptional Rewards
8Balancing Our Responsibilities & Rights
1 0Balancing Brand & Geographic Expansion Opportunities
1 4Balancing Our Brand Portfolio
1 9Financial Results

B ALAnCEd. WhEn WE ARE
AskEd tO ChOOsE A sinGLE WORd thAt BEst dEsCRiBEs
BROWn-FORMAn – stRAtEGiCALLy, OPERAtiOnALLy, FinAnCiALLy,
And CuLtuRALLy – WE GRAvitAtE tO thE WORd “BALAnCEd.”
thE ExERCisE OF BuiLdinG BROWn-FORMAn is A COntinuOus
BALAnCinG ACt, WhERE WE siMuLtAnEOusLy AiM tO GROW
thE COMPAny On A sustAinEd BAsis, CREAtE EnduRinG vALuE
FOR OuR stAkEhOLdERs, And stREnGthEn OuR FutuRE As An
indEPEndEnt, FAMiLy-COntROLLEd EntERPRisE. in CARRyinG Out
this PuRsuit, WE dEPEnd hEAviLy On BALAnCEd thinkinG. WE
ARE FOCusEd On BOth thE LOnG tERM And thE shORt tERM;
WE WORk tO ACCEss BOth thE AnALytiCAL And instinCtivE
tALEnts OF OuR PEOPLE; WE FREquEntLy LOOk BACkWARd tO
BEttER undERstAnd OuR industRy And OuR COMPAny’s histORy
sO thAt WE CAn dRAW On thAt PERsPECtivE WhEn nAviGAtinG
An unCERtAin F u tuRE; And, ALthOuGh WE ExECu tE OuR
AGREEd-uPOn stRAtEGiEs With EnthusiAsM, WE ALtER OuR
COuRsE As CiRCuMstAnCEs diCtAtE.
MOst OF ALL, WE ARE diLiGEnt in BALAnCinG Risk And REWARd
On BEhALF OF OuR shAREhOLdERs. OuR AMBitiOn is tO COnsis-
tEntLy PROduCE ExCELLEnt REWARds FOR WhAt WE COnsidER
tO BE A MOdERAtE And ACCEPtABLE LEvEL OF invEstMEnt Risk.
our bALANCed perSpeCTIve

2
browN-FormAN ANNuAL reporT 2008
Fwe ACHIeve bALANCed
THINkING wITH A SkILLed
ANd experIeNCed boArd
ANd LeAderSHIp TeAm
ALoNG wITH ACTIve
INvoLvemeNT by browN
FAmILy memberS IN
mANAGemeNT, oN our
boArd, ANd AS SupporTIve
SHAreHoLderS.
PAuL C. vARGA ChAiRMAn And
ChiEF ExECutivE OFFiCER
LeTTer From THe CHIeF exeCuTIve oFFICer
1 mIllION+ CASE bRANDS
Jack daniel’s tennessee Whiskeynew Mix*
Jack daniel’s & Cola*Finlandia vodka
Fetzer Winessouthern Comfort
Canadian Mistkorbel California Champagnes
Bolla Winesel Jimador tequila
* Ready-to-drink product
iscal 2008 was a record year in the company’s 138-year history. We achieved many new milestones, including surpassing $3 billion in sales, generating more than half of our revenues outside the u.s., and breaking the 35 million case barrier in annual depletion volumes for our entire portfolio. in an environment marked by increasing consumer and competitive challenges, we produced strong results underscored by healthy underlying growth, a strong balance sheet, and excellent cash flows.
Financial Performance. For the year ended April 30, 2008, diluted earnings per share from continuing operations increased to $3.55, an increase of 10% over last year’s earnings. Operat-ing income grew 14% to $685 million on a reported basis, or 8% on an underlying basis. Our net sales for the year increased 17% to a record $3.3 billion, while gross profit grew 14% to $1.7 billion, both benefiting from the addition of the Casa herradura brands acquired in fiscal 2007 and a weaker u.s. dollar. Our healthy cash flows enabled us to pay dividends totaling $158 million to shareholders last year, a 10% increase over dividends paid out in the prior year and the 62nd consecutive year of paying regular quarterly cash dividends. since the beginning of fiscal 1999, we have returned approximately $1.3 billion to shareholders via dividends and cash distributions, including a $204 million cash distribution in early fiscal 2008 associated with the proceeds received from the sale of Lenox, inc. Our total shareholder return, assuming reinvestment of dividends, over that 10-year period has significantly outpaced the return delivered by the s&P 500. in fact, a $100 investment in our Class B stock at the end of April 1998 would be worth nearly $300 at the end of fiscal 2008. This compares quite favorably to a similar investment in the s&P 500, which today would be worth about $150. Our total shareholder return for this fiscal year was a healthy 8%, higher than nearly all of our direct competitors and well ahead of the total return for the s&P 500 which declined 5%. Reflecting our commitment to creating value for shareholders and our confidence in the future, we completed the repurchase of $223 million of our common stock at an average price of $68 per share. We believe this was an excellent investment at a time when both interest rates and our stock price were attractive.
Brand Performance. Because of the continuing excellent performance of our flagship Jack daniel’s brand over the years, some observers of Brown-Forman mistakenly view us as a “one-brand company.” But with 10 brands boasting depletions of more than 1 million cases, we are much more than a one-brand company.
Jack Daniel’s. Last year, Jack daniel’s fortified its position as the world’s best-selling American whiskey brand with global depletions approaching 9.5 million cases. depletions and net sales in the u.s. grew in the low single digits, while outside the u.s., depletions were up 8%, and net sales grew nearly 17%. total nine-liter depletions for the Jack daniel’s family
1M+

3
browN-FormAN ANNuAL reporT 2008
LeTTer From THe CHIeF exeCuTIve oFFICer
of brands, including Gentleman Jack, Jack daniel’s single Barrel, and Jack daniel’s ready-to-drink products, reached more than 10 million cases on a drinks-equivalent basis, representing volume growth of more than 6% for the fiscal year.
Finlandia. ninety percent of Finlandia’s 2.8 million cases were generated outside the u.s., including over 800,000 cases in Poland, the brand’s largest market. The brand continued to be a major growth driver with depletions advancing 16% and net sales gaining 33% this past fiscal year.
Southern Comfort. Our second-largest profit contributor, southern Comfort continued to deliver solid gross profit growth in fiscal 2008, driven by volume and price increases in Australia, south Africa, and some established European markets. Global volumes held steady at nearly 2.5 million cases, despite a decline in the u.s., the brand’s largest market. The brand continues to exemplify our company’s brand renovation capabilities and now has posted nine consecutive years of gross profit growth.
Casa Herradura. in the first full year since we acquired Casa herradura, we carefully evalu-ated the brands’ positioning, pricing, and packaging; implemented new trade practices to reduce excess wholesale and retail inventory in Mexico; and successfully integrated the herradura and el Jimador brands into our u.s. distribution network. We believe these brands, along with the new Mix el Jimador tequila-based ready-to-drink product, will be key con-tributors to the company’s long-term growth. Renowned for crafting tequilas of superior quality and authenticity, Casa herradura was recognized as the 2007 distiller of the year by Wine Enthusiast magazine – the first tequila producer to earn this prestigious title.
Balanced Thinking. As the theme for this report highlights, we believe there’s no substitute for balanced thinking. We believe it is critical to our long-term success and ongoing indepen-dence. A direct reflection of our commitment to balanced thinking is the collaborative, consensus-oriented manner in which our company is run. We have long believed that the collective wisdom of all of us is far superior to the individual intellect of any one of us. The practice of this belief helps us immensely in producing consistently thoughtful and accurate judgments about our business. We achieve balanced thinking with a skilled and experienced Board and leadership team along with active involvement by Brown family members in management, on our Board, and as supportive shareholders. in the last year, we formed the Brown-Forman/Brown Family shareholders Committee to further encourage open, constructive, ongoing dialogue between the company and its family shareholders. designed for broad family participation and includ-ing several non-family Brown-Forman executives, the committee has formed working groups to study areas of particular interest to family shareholders, including governance, philanthropy,
NET SAlES
(in billions)
Over the last four years, the company’s net sales have steadily climbed at an annual compound
growth rate of 13%.
2004 2005 2006 2007 2008
$2.0 $2
.2 $2.4
$2.8
$3.3
bONTERRA vINEyARDS
since 1987, Bonterra has been a pioneer and global
leader in organic viticulture and biodynamic farming, following a balanced approach of a “Good
Earth” philosophy and profitabil-ity. Bonterra is the no. 1 selling wine produced with organically grown grapes in the u.s. with
over 50% market share.
ThEN AND NOw
Old Forester, the company’s founding brand, is the
nation’s longest continuously produced bourbon.

4
browN-FormAN ANNuAL reporT 2008
LeTTer From THe CHIeF exeCuTIve oFFICer
and family members’ education and employment at the company. A list of the leaders and Brown family members who collectively provide the balanced thinking behind our strategies and success can be found on pages 52 and 53.
Senior Management Changes. in October 2007, we named Matthew hamel as our General Counsel. Matt brings over 21 years of international legal and corporate management experi-ence with dow Jones & Company and Colgate-Palmolive Company. he succeeds Michael Crutcher, who retired after 18 years with us, during which he built and led our team of legal and government relations professionals and served as a valued and trusted advisor. in december 2007, Ralph de Chabert was appointed as the company’s first Chief diversity Officer with the responsibility for developing and implementing a global diversity and inclusion strategy, with an initial focus on the u.s. he brings to this critical role a proven track record of significant achievements managing diversity initiatives in the public, private, for-profit, and not-for-profit sectors, including positions with Mckesson Corporation, safeway, and American President Companies, Ltd. in March 2008, donald Berg was named Chief Financial Officer effective May 1. A 19-year company veteran and member of our Executive Committee since 1999, don most recently served in the key role of senior vice President and director of Corporate Finance, with responsibilities encompassing investor relations, corporate development, treasury, and tax. he succeeds Phoebe Wood, who retired at fiscal year-end after bringing thoughtful and professional oversight to our financial and technology functions and helping lead us during a period of strong financial performance over the last seven years.
In Conclusion. i believe strongly in this company and in its prospects for long-term growth, and i thank you on behalf of our management for your long-standing support. We see tremen-dous opportunity for the development of our brands in both our u.s. market and the exciting world outside the u.s., which now accounts for the majority of our sales. As has been our practice for generations, we will strive for an optimal balance of current growth and long-term value creation that will provide our shareholders with superior returns while serving the best interest of employees, business partners, and the communities in which we work and live.
sinCERELy yOuRs,
PAuL C. vARGAChAiRMAn And ChiEF ExECutivE OFFiCER
JunE 27, 2008
< mATThEw E. hAmEl
Ex ECu tiv E v iCE PR EsidEnt, GEnER A L COu nsEL
And sECR EtARy
> RAlPh DE ChAbERT
v iCE PR EsidEnt,ChiEF div ERsit y OFF iCER
< DONAlD C. bERG
Ex ECu tiv E v iCE PR EsidEntAnd ChiEF F inAnCiA L OFF iCER
> PhOEbE A. wOOD
R EtiR Ed A PR iL 30, 20 08
RESTORING AmERICA
The national trust for historic Preservation named
Brown-Forman a 2008 “Restore America hero” to recognize our long-standing commitment to
historic preservation.

5
browN-FormAN ANNuAL reporT 2008
meSSAGe From THe preSIdING CHAIrmAN oF THe boArd
THANkS To THIS oNGoING
bALANCe oF SuSTAINAbLe
GrowTH ANd vALue
CreATIoN, our CompANy
CoNTINueS To THrIve AS
A weLL-GoverNed,
INdepeNdeNT, FAmILy
CoNTroLLed, pubLICLy
TrAded buSINeSS.
GEO. GARvin BROWn ivPREsidinG ChAiRMAn
OF thE BOARd
lONG-TERm PERSPECTIvE
At Brown-Forman, we value our long-term perspective, perpetuated through family
control, which enables us to build brands that thrive and endure
for generations. This long-term view is a natural extension of our business – because time is
an essential ingredient in many of our products.
Y our company’s leadership has delivered a record year. despite challenging economic conditions, Brown-Forman grew operating income, increased earnings per share, and created shareholder value in line with its long-term historical trends. Thanks to this ongoing balance of sustainable growth and value creation, our company continues to thrive as a well-governed, independent, family controlled, publicly traded business.
Complementing this year’s successful results, the Board also put thoughtful focus on the long- term evolution of our governance structures and Board succession planning – ensuring continuity in the work of the Board and cultivating strong and balanced ties between the company, the Board, and Brown-Forman’s long-term family shareholder base. in addition to my own appoint-ment as Presiding Chairman of the Board, Board actions since the last annual meeting included:• The decision of Owsley Brown ii, former Chairman and CEO, to retire from the Board when his term expires at this year’s annual meeting in July, concluding a remarkable 37-year service on the Board, including 12 years as its Chairman;• The gracious agreement of donald G. Calder to extend his service and stand for re-election to the Board as an independent director and as the Chairman of the Audit Committee; and• The adoption of an expanded charter for the nominating Committee, its renaming as the Corporate Governance and nominating Committee, with its Chairman, independent director Richard P. Mayer, kindly agreeing to take on this added responsibility.
in addition to these Board changes, the Brown-Forman/Brown Family shareholders Committee has been developing policies and practices to strengthen the bond between family shareholders and the company, as mentioned in Paul varga’s letter. The Committee’s formation and work mark a key milestone in passing the baton of family leadership from the fourth to the fifth generation.
in view of all this progress, i’d like to thank the independent, management, and family directors of our Board for their ongoing leadership of Brown-Forman. And on behalf of the Board, i offer my most sincere thanks to our long-term shareholders, as they continue their engaged investment in this great 138-year-old enterprise.
With fond wishes to the Brown-Forman community for the coming year,
REsPECtFuLLy,
GEO. GARvin BROWn ivPREsidinG ChAiRMAn OF thE BOARd
JunE 27, 2008

6
browN-FormAN ANNuAL reporT 2008
RISk REwARDED
Over the last 10 years, we expanded our portfolio to include
high-end chardonnay with sonoma-Cutrer, premium vodka
with Finlandia, and super-premium liqueurs tuaca and Chambord. We believe these four brands,
coupled with the recently acquired Casa herradura brand family, bolster our ability to penetrate
some of the fastest-growing categories and regions for premium
wine and distilled spirits.
bALANCING ACCepTAbLe rISk & exCepTIoNAL rewArdS
B rown-Forman views investment opportunities, business decisions, and a range of leadership challenges through a long-term lens. The advantage of our long-term view, perpetuated through family control, results in our willingness to look beyond the current month, quarter, or year as we seek to accomplish our objectives in ways that sustain growth and bolster our enduring viability.
Near-Term Investments and Long-Term Goals. in today’s highly challenging u.s. environ-ment, we need to ensure that our investments of time and dollars are keeping us competitive. Often, this requires subtle shifts between our long-term strategies and the tactical brand initiatives that we invest in over the near term. if consumers are responding more favorably to our short-term investments than our long-term ones, we may reallocate resources toward the promotions to which consumers are more responsive rather than paying for additional media impressions. specifically, in the u.s., we have continued to make appropriate shifts in our investment mix behind our portfolio of brands toward activities more relevant to consumers in the current difficult economic environment – such as spending more for retail store presence and promotional display efforts and less on tv or billboard advertising.
Organic and Acquired Growth. As brand builders, we celebrate our success in creating and building consumer demand for brands like Finlandia, Bonterra, Woodford Reserve, sonoma-Cutrer, and tuaca. But we are also excited about the recently acquired Chambord, herradura, and el Jimador brands that we expect to contribute to growth over the long term. Although nearly all of our brands were acquired at some point, we typically view prospective brand acquisitions as opportunities rather than necessities. Whether recently acquired or in our hands for decades, our ambition is the same – to build the brands in a manner that creates incremental long-term value for shareholders and enables the brands to endure for generations.
Strict Financial Discipline. We have a long-held philosophy of spending corporate resources wisely. Following this philosophy, we invest in our brands and people, make opportunistic acquisitions, and return cash to our shareholders. We seek to tip the scale in favor of share-holder value by delivering strong, consistent, and growing cash flows for what we consider to be a moderate, acceptable level of investment risk. Our long-term view and patient approach enables our balancing of risk and reward. We manage risk by maintaining a conservative capital structure and emphasizing stability over volatility, by keeping our options open, and by understanding the governmental and social issues that affect our business. When taking prudent risks, we make multiple investments across brands and geographies rather than concentrating our resources on a single brand or a single geography.
we INveST IN our
brANdS ANd peopLe,
mAke opporTuNISTIC
ACquISITIoNS, ANd
reTurN CASH To our
SHAreHoLderS. we Seek
To TIp THe SCALe IN
FAvor oF SHAreHoLder
vALue by deLIverING
STroNG, CoNSISTeNT, ANd
GrowING CASH FLowS
For wHAT we CoNSIder
To be A moderATe,
ACCepTAbLe LeveL oF
INveSTmeNT rISk.


9
browN-FormAN ANNuAL reporT 2008
EUROPEAN AlCOhOl
AND hEAlTh fORUm
With brands distributed in more than 135 countries, Brown-
Forman’s responsibility efforts extend internationally. Last year, we became a founding member of the newly formed European Alcohol and health Forum, a European union initiative to establish a
common platform of stakeholders to provide time and resources to
take meaningful actions to address alcohol-related harm.
see our 2007 Corporate Responsibility Report at www.
brown-forman.com/responsibility/report for details on our commitment.
JACk DANIEl’S ADvERTISING
Jack daniel’s brand marketing messaging focuses squarely on responsible consumption and
consumer behavior.
bALANCING our reSpoNSIbILITIeS & rIGHTS
eing Responsible in Everything We Do is one of the strategic imperatives that guide our actions both individually and corporately. For us, being responsible means making decisions and taking actions that reinforce social, environ-mental, financial, civic, and personal responsibility. As leaders in the beverage alcohol industry, we pay particular attention to how we market our products and how people drink them. When consumed responsibly and moderately, our products can be part of a healthy lifestyle and enrich life. But the misuse and abuse of our products – from underage and binge drinking to drunk driving and alcoholism – result in real social harm that profoundly affects individuals, families, and society. Our goal is to market responsibly, advertising and promoting our brands in ways that avoid any suggestion of misuse. But we also aim to use the power of our brand communications to encourage (and educate the public about) responsible consumption. We must also do what we can to reduce the harmful effects of abuse and misuse of alcohol. it is crucial that we bring the same creativity and energy to social responsibility as we do to building our brands. Our challenge is to put our values into action, actively deploying the best responsibility strategies, insights, and ideas to foster more responsible consumer attitudes and behavior.
Defending Our Rights. We deserve a level playing field as we seek to sell our products and communicate with our consumers. Globally, we face a complex set of laws, regulations, and policies governing the sale and distribution of beverage alcohol. For example, in France we face challenges in communicating with consumers because nearly all beverage alcohol adver-tising is prohibited. in the u.s., beer, wine, and spirits all seek to reach many of the same consumers and contain equivalent amounts of alcohol per standard serving size, yet different rules apply to each. For example, all the major broadcast television networks accept beer and wine advertising but reject spirits advertising. And, in many parts of the country, the sale of spirits is restricted on sundays while beer and wine are available to consumers every day.
Corporate Responsibility. We strive to balance our responsibilities to our shareholders and to the world around us. shareholder and societal returns are not mutually exclusive, and both are critical to our overall success. As part of our ongoing environmental stewardship efforts to reduce our energy use, we adopted a goal of reducing greenhouse gas emissions by 2010 against a baseline for facilities and operations owned in 2005. Our civic engagement activities support non-profit organizations that improve the lives of individuals and the vitality of our communities, making them better places for our employ-ees and their families. in fiscal 2008, we made contributions totaling approximately $8 million to support worthy community charities and causes, such as the arts, education, social services, and the environment.
B
UNIvERSITy Of kENTUCky
AlCOhOl EDUCATION GRANT
Brown-Forman has funded many alcohol-related harm-reduction
programs over the past two decades through organizations such as The Century Council. Recently, for the first time, we began direct funding of such a
program on a college campus. A $200,000 grant to the university of kentucky (uk) Alcohol and health Education Office will enable the expansion of peer
education and prevention initiatives for all uk students.
browN-FormAN ANNuAL reporT 2008

10
browN-FormAN ANNuAL reporT 2008
IN FISCAL 2008, we
ACHIeved A SIGNIFICANT
mILeSToNe by GeNerATING
more THAN 50% oF our
CoNSoLIdATed SALeS
From mArkeTS ouTSIde
THe u.S., CompAred To
LeSS THAN 20% IN 1994.
bALANCING brANd & GeoGrApHIC expANSIoN opporTuNITIeS
U.S. vS. INTERNATIONAl NET SAlES
Brown-Forman’s increasing globalization crossed a key
milestone in fiscal 2008, with non-u.s. markets now accounting for more than half of total sales.
U.S. INTERNATIONAL
52%
48%
2008
29%
71%
2003
U.S. INTERNATIONAL
48%
52%
2008
71%
29%
2003
B e are approaching the 15-year mark in our strategic initiative to expand our international business footprint. in fiscal 2008, we achieved a significant milestone by generating more than 50% of our consolidated sales from markets outside the u.s., compared to less than 20% in 1994. today, we rank among the 10 largest premium spirits companies worldwide, and our brands are distributed in more than 135 countries. Even more important, we see enormous potential for continued growth, particularly in international markets, mostly due to global demographics. The u.s. represents less than 5% of the world’s total population, and our company today accounts for less than 1% of the total volume of the global beverage alcohol market. We expect international growth opportunities to eclipse those in the u.s. and to provide an increasing share of our business over time. Our challenge is to determine the most attractive and advantageous places to grow. With that evolution, we have become global in our fundamental focus as well. We no longer distinguish between a “domestic” market and a “foreign” market. Rather, we compete effectively today in the u.s. market, the u.k. market, the Russian market, the Australian market, and dozens more around the globe.
Geographic Diversification. Because of the company’s broad geographic success, our earnings flow from a variety of diverse markets, reducing the risk of depending solely on one or two large markets. Even more important, this geographical diversification gives us a broader array of investment opportunities. The strategic value of this geographic diversification is readily apparent in our fiscal 2008 results, as our international markets drove the vast majority of our growth in sales. today, businesses of every sort, including wine and spirits marketers and distributors, are attracted to the BRiC markets – the acronym for the rapidly developing economies of Brazil, Russia, india, and China that jointly encompass 25% of the world’s land mass and 42% of the world’s population. These are extremely attractive markets with enormous long-term potential, and as a result, there is a high level of competition from both global and local brands. today, we have a solid position in China, and Russia is one of Brown-Forman’s fastest-growing markets in the world as Jack daniel’s and Finlandia are both developing rapidly. in india and Brazil, we are in earlier stages of development. We expect that the BRiC markets will continue to gain importance to our company in the coming years, and importantly, these are not the only international opportunities for Brown-Forman. We look worldwide for the most attractive opportunities to build our brands, often in markets that other competitors might consider as too small or too developed. Following this strategy, we have achieved notable success in a diverse mix of markets – including the u.k, France, Poland, south Africa, Australia, korea, Mexico, Argentina, israel, and many more.


13
browN-FormAN ANNuAL reporT 2008
Connecting with Consumers Globally. to better understand and connect with our consum-ers around the world, our employee population has grown more global. today, nearly 40% of our employees work outside the u.s., and in Europe alone we have grown from six employees in 1995 to more than 320. While enriching the human fabric of our global workforce, this diversity of nationalities and cultures provides a broader outlook and better ability to understand the consumers we are trying to cultivate. in each country or region, team members bring a unique understanding of their local markets and a valuable knowledge of consumer preferences and practices.
Expanding Our International Portfolio. Our portfolio of premium brands has expanded significantly over the past 10 years. The addition of sonoma-Cutrer, Finlandia, tuaca, Chambord, herradura, and el Jimador to our existing portfolio, which includes the Jack daniel’s family of brands, southern Comfort, Woodford Reserve, Bonterra, and Fetzer, enables us to bring an outstanding selection of premium brands to our distributors and consumers across the globe. This portfolio offers a wide range of targeted brand/market opportunities. drawing upon market and consumer research and distributor and competitive analyses, we seek to match the right brands with the right markets. As a result, we are forging a number of key developing brand/market combinations, including Jack daniel’s in Poland and Russia; Finlandia in Latin America, Poland, and Russia; Chambord in the u.k. and Australia; tuaca in the u.k. and Australia; and Woodford Reserve in the u.k. and France.
Balancing On-Premise and Off-Premise. in the current economy, u.s. consumers are increasingly likely to “drive through” rather than to dine in when eating meals away from home. We believe a similar shift is under way with on-premise wine and spirits sales declining as consumers spend less time and money in restaurants and bars, while off-premise sales at beverage alcohol outlets and supermarkets are increasing. Markets in the u.k. and Continental Europe are also experiencing many of these same economic forces and consumer trends. We are committed to building brands and forging consumer relationships in both on-premise and off-premise channels. despite current economic conditions and consumer trends, we must do both and do them equally well. Recognizing that consumer patterns and market dynamics are constantly evolving, we continually adjust our resources so that our brands are available and attractive wherever our consumers might be. A recognition of this commitment occurred last year as Cheers magazine named Brown-Forman the “Large spirits Company of the year” for partnering with restaurant companies and building strong relationships.
bALANCING brANd & GeoGrApHIC expANSIoN opporTuNITIeS
wORkfORCE lOCATION
The growing globalization of Brown-Forman’s business is
reflected in an increasingly global and culturally diverse workforce.
U.S. INTERNATIONAL
60%
40%
CAPE TOWN
100,00
3RD
LA
bOURbON STREET TO CAPE TOwN
Fueled by solid depletion growth over the past five years, south
Africa has emerged as the third-largest market for southern
Comfort, with depletions approaching 100,000 cases
in fiscal 2008.
wOODfORD RESERvE
Woodford Reserve, a super- premium small-batch bourbon, is handcrafted at America’s oldest working distillery. savored by consumers in many countries, the brand grew depletions at a healthy double-digit rate in
fiscal 2008 for the 10th consecutive year to surpass the
100,000-case milestone.

14
browN-FormAN ANNuAL reporT 2008
bALANCING our brANd porTFoLIo
GENTlEmAN JACk
Winner of the Glass Packaging institute’s “Clear Choice” Award for best overall package design, Gentleman Jack Rare tennessee
Whiskey, the fastest-growing American whiskey brand in the u.s., grew worldwide depletions
more than 40% in fiscal 2008, with annual volumes now exceeding the
200,000-case mark.
SOUThERN COmfORT
in the important u.k. on-trade market, southern Comfort is a top 10 brand and one of only two of the top 10 to deliver
value growth in 2007.
TO RUSSIA wITh lOvE
Russia became Finlandia’s fourth largest market in fiscal 2008, and the brand was listed in February as the no. 1 imported premium
vodka by the Russian government.
NúmERO UNO
SOUTh Of ThE bORDER
El Jimador Reposado, launched in 1994 as part of the Casa
herradura brand family, has been the best-selling tequila in Mexico
for the past five years.
rown-Forman offers consumers around the world a broad, balanced portfolio of wine and spirits products across several categories and price points. We have the unusual ability to remain intently focused, as individuals and as a company, on improving each of our many brands. Remaining alert to the competitive environ-ment, we will continue our fundamental strategy of building brands that endure and extending the growing presence of our brands globally.
Jack Daniel’s Tennessee Whiskey. Approaching total depletions of nearly 9.5 million cases in fiscal 2008, Jack daniel’s is a symbol and model for our global development and expansion. With worldwide depletion growth of approximately 75% over the last 10 years, Jack daniel’s boasts annual depletions exceeding 100,000 cases in 10 international markets: the u.k. (with nearly 1 million cases), Germany, spain, France, south Africa, italy, Australia, Canada, Japan, and China.
Southern Comfort. Over the past several years, we have carried out a disciplined reposition-ing and reinvention of the southern Comfort brand on a global scale. new packaging, formula improvements, regular price increases in key markets, revamped positioning, and a new global creative strategy have increased the brand’s relevance to young adult consumers – and more than doubled its gross profit contribution since fiscal 2001. in fiscal 2008, southern Comfort’s three largest non-u.s. markets – the u.k., south Africa, and Australia – achieved solid gains in gross profit and volume, balancing a challenging year in the u.s.
Finlandia Vodka. Finlandia was born in Finland and introduced in the u.s. in the 1970s as the first premium imported vodka. since we acquired a majority interest in Finlandia in fiscal 2003, the brand has grown rapidly outside the u.s. We continue to see dramatic growth in volumes and gross profits, particularly in Poland, Russia, and other parts of Central and Eastern Europe. during the year, Finlandia was recognized by Spirits Business, a u.k.-based magazine, as the “fastest growing global spirit brand.”
Casa Herradura. Our most recent acquisition, Casa herradura, truly establishes our presence in the Mexican market. importantly, it also gives us the ultra-premium herradura and premium el Jimador tequila brands, which we are working hard to expand around the world. in addition, the new Mix el Jimador tequila-based ready-to-drink product, the category leader in Mexico, continued to gain market share. We have increased the balance of our brand portfolio across the globe. Brown-Forman’s wine and spirits brands are enjoyed in countries large and small – from the world’s major industrialized
B


17
browN-FormAN ANNuAL reporT 2008
JACk dANIeL’S remAINS
THe LArGeST-SeLLING
wHISkey IN THe u.k.’S
oN-premISe CHANNeL
AS A reSuLT oF CoNSIS-
TeNT, AwArd-wINNING
AdverTISING ANd
AN INNovATIve SALeS
orGANIzATIoN THAT we
SHAre wITH bACArdI.
bALANCING our brANd porTFoLIo
fETzER vAllEy OAkS
in fiscal 2008, Fetzer launched its Green tour, a mobile wine experience that showcases the vineyard’s sustainability efforts while producing award-winning wines. The u.s. Environmental Protection Agency recognized Fetzer with a 2007 “Best of the Best” award for actions taken to protect the earth’s ozone layer.
nations to tiny regions most people could not find on a map. With our rapid international expansion, the principal markets for our brand portfolio now include not only the u.s., but the u.k., Australia, Mexico, Poland, Germany, spain, Canada, France, Czech Republic, italy, south Africa, China, Japan, and Russia.
United States. The world’s third-largest country in both size and population, with over 300 million people, the u.s. claims the world’s largest and most technologically powerful economy. We sell our broadest brand portfolio in the u.s., with 34 brands competing in the wine and spirits categories. We continue to see tremendous growth potential in this dynamic market, where in last year’s difficult economy, total distilled spirits still grew over 3% to 182 million cases and total table wines grew 4% to 294 million cases.
United Kingdom. The u.k., with a population of just over 60 million, is one of five Western European countries with trillion-dollar economies. This market has delivered 20 consecutive years of volume growth, and represents the largest market outside the u.s. volumetrically for Jack daniel’s, southern Comfort, Fetzer wines, Bonterra, Chambord, tuaca, and Woodford Reserve. Jack daniel’s remains the largest-selling whiskey in the u.k.’s on-premise channel as a result of consistent, award-winning advertising and an innovative sales organization that we share with Bacardi. Australia. Australia has a population of more than 20 million people and boasts a strong economy with 16 consecutive years of economic expansion. Ready-to-drink products are a major part of this market, reflecting its outdoor lifestyle. Our portfolio there includes ready-to-drink line extensions for two of our global brands, Jack daniel’s & Cola and southern Comfort & Cola – both of which grew faster than our overall portfolio. Mexico. With the world’s 12th largest economy and a population of nearly 110 million, this culturally diverse country represents an excellent opportunity for the expansion of our business into Latin America. With the recent acquisition of Casa herradura, we have expanded our route to marketing in this important and growing part of the world. Our tequila base provides a platform to introduce Jack daniel’s and other brands to new consumers.
Germany. Germany, with a population of more than 80 million people, claims the largest economy in Europe and fifth-largest in the world. A change in our route to market in fiscal 2006 has given us greater control over our brand development and better access to consumers, which has led to accelerated growth in this market. Our depletions have grown at a compound annual growth rate in the mid-single digits over the last five years. today, Germany ranks as the no. 3 market for Jack daniel’s and the no. 6 market for southern Comfort in volumetric terms.

18
browN-FormAN ANNuAL reporT 2008
bALANCING our brANd porTFoLIo
Jack Daniel’s family of brands
Established in 1866, Jack Daniel’s is still crafted at America’s
oldest registered distillery in the small town of lynchburg,
Tennessee, using the finest grains and pure, iron-free water
from our cave spring. The family of brands includes Jack
Daniel’s Old No. 7 brand Tennessee whiskey (black label and
Green label), Jack Daniel’s Single barrel Tennessee whiskey,
and Gentleman Jack Rare Tennessee whiskey, as well as the
Jack Daniel’s & Cola and Jack Daniel’s Country Cocktails lines
of ready-to-drink products.
finlandia vodka
finlandia vodka is made from ingredients born from the purity
of finland’s nature. In addition to its classic premium vodka,
the brand family includes a popular line of finlandia fusion
flavored vodkas in lime, mango, Cranberry, wild berries,
Redberry, and Grapefruit.
Southern Comfort liqueurs
“Southern Comfort” was used to describe bartender m.w.
heron’s secret blend of fruit, spice, and whiskey flavors,
first served in New Orleans in 1874. Today, more and more
consumers around the world are simply calling for “SoCo” and
making this iconic brand part of their legendary nights with
great friends.
Casa herradura Tequilas
One of the world’s oldest and most respected producers of
tequila, Casa herradura has handcrafted the finest tequila in
the historic village of Amatitán, Jalisco, in the heart of mexico’s
tequila region since 1870. The family of brands includes ultra-
premium herradura in Silver, Reposado, Añejo, and Extra Añejo
(Selección Suprema) expressions; premium el Jimador in both
blanco and Reposado expressions, and limited edition Añejo;
and the tequila-based ready-to-drink brand, New mix.
fetzer wines
founded in 1968, fetzer vineyards has been named winery
of the year nine times by Wine & Spirits magazine. fetzer
produces a broad array of popular varietals, including Cabernet
Sauvignon, Chardonnay, Gewurztraminer, Sauvignon blanc,
Riesling, merlot, Pinot Grigio, Pinot Noir, Shiraz/Syrah, Syrah
Rose, white zinfandel, and zinfandel.
Canadian mist blended Canadian whisky
The third-largest selling Canadian whisky in the U.S., Canadian
mist is a smooth, light-tasting whisky that’s triple distilled
and sources its water from Canada’s Georgian bay, one of the
world’s cleanest, freshest water sources.
korbel California Champagnes*
Celebrating its 125th anniversary during the 2008 fiscal year,
korbel California Champagne is America’s symbol of celebra-
tion and the No. 1 selling premium sparkling wine in the U.S.
bolla wines
bolla authentically crafts both popular varietal and classic
veronese wines from Northern Italy’s veneto region. Also mark-
ing its 125th anniversary this year, bolla has been a top-selling
Italian wine brand in the U.S. for more than 40 years.
* brands that we represent in the U.S. and other select markets.
Early Times kentucky whisky
Early Times’ proprietary formula and unique aging process
create a smooth, mellow, flavorful whisky. The Early Times mint
Julep has been the official drink of the kentucky Derby for 21
consecutive years.
bonterra vineyards wines
bonterra vineyards, the world’s leading producer of premium
wines crafted from 100% organically grown grapes, is commit-
ted to making world-class quality wines through respect for the
earth, the vineyard, and the environment.
Sonoma-Cutrer wines
Since the first vintage release in 1981, Sonoma-Cutrer has
been crafting world-class expressions of Chardonnay. In this
year’s Wine & Spirits magazine restaurant poll, it was the top-
selling Chardonnay at U.S. white tablecloth restaurants for the
17th time in 19 years and reclaimed its No. 1 ranking as the
overall preferred on-premise brand, regardless of varietal, for the
sixth time in 10 years.
five Rivers wines
Inspired by the spirit of California’s Central Coast, five Rivers
wines engage consumers with a distinct wine experience with
award-winning Chardonnay, Cabernet Sauvignon, Pinot Noir, and
Pinot Grigio varietals.
Tuaca liqueur
Crafted in the coastal town of livorno, Italy, Tuaca liqueur features a
unique taste profile with hints of vanilla and natural citrus essences.
when served icy cold, it’s a smooth drink with a unique twist.
Chambord liqueur
The luxurious taste of Chambord – the rich, intense flavor
of black raspberries mingled with a hint of honey and creamy
vanilla – makes it one of the world’s most versatile liqueurs, and
an unparalleled addition to both cocktails and culinary creations.
woodford Reserve kentucky Straight bourbon whiskey
Award-winning woodford Reserve, a super-premium, small-
batch bourbon of exceptional richness and character, is produced
at the historic woodford Reserve Distillery located in the heart of
kentucky’s bluegrass Region.
Old forester kentucky Straight bourbon whiskey
Recognizing the need for quality whiskey, company founder
George Garvin brown developed Old forester, the company’s
original brand. known as “America’s first bottled bourbon,” Old
forester ensured consistent quality in every bottle ... a promise
that continues today.
little black Dress wines
little black Dress translates the positive emotions and confident
feelings women have about their little black dresses to a wine brand.
flirty and fun, sophisticated and timeless, little black Dress is the
easy, versatile, go-to-choice in premium wine that allows women to
find and express their inner beauty at all occasions.
(Remaining portfolio: bel Arbor wines, Don Eduardo Tequila, Eleven Tongues wines,
fontana Candida wines, Gala Rouge wines, Jekel vineyards wines, michel Picard
wines, Pepe lopez Tequila, Sanctuary wines, Stellar Gin, virgin vines wines*,
and wakefield wines*)

19
2 0Selected Financial Data
2 1Management’s Discussion and Analysis
3 3Consolidated Statements of Operations
3 4Consolidated Balance Sheets
3 5Consolidated Statements of Cash Flows
3 6Consolidated Statements of Stockholders’ Equity
3 7Notes to Consolidated Financial Statements
4 9Reports of Management
5 0Report of Independent Registered Public
Accounting Firm
5 1Important Information on Forward-Looking Statements
5 2Directors and Officers
5 4Corporate Information
Financial results

20
Brown-Forman annual report 2008
(Expressed in millions, except per share amounts and ratios)
Year Ended April 30, 1999 2000 2001 2002 2003 2004 2005 2006 2007 2008
CONTINUING OPERATIONS
Net Sales $ 1,446 1,542 1,572 1,618 1,795 1,992 2,195 2,412 2,806 3,282
Gross Profit $ 741 812 848 849 900 1,024 1,156 1,308 1,481 1,695
Operating Income $ 279 296 320 326 341 383 445 563 602 685
Income from Continuing Operations $ 176 187 200 212 222 243 339 395 400 440
Weighted Average Shares used to
calculate Earnings per Share
– Basic 137.2 137.0 137.0 136.7 134.7 121.4 121.7 122.1 122.9 122.5
– Diluted 137.4 137.2 137.1 137.0 135.1 122.0 122.5 123.4 124.2 123.6
Earnings per Share from
Continuing Operations
– Basic $ 1.28 1.36 1.46 1.55 1.65 2.00 2.79 3.24 3.26 3.59
– Diluted $ 1.28 1.36 1.46 1.55 1.65 1.99 2.77 3.20 3.22 3.55
Gross Margin 51.2% 52.6% 53.9% 52.5% 50.1% 51.4% 52.7% 54.2% 52.8% 51.6%
Operating Margin 19.3% 19.2% 20.3% 20.2% 19.0% 19.2% 20.3% 23.3% 21.5% 20.9%
Effective Tax Rate 36.0% 35.9% 35.8% 34.1% 33.6% 33.1% 32.6% 29.3% 31.7% 31.7%
Average Invested Capital $ 681 889 1,016 1,128 1,266 1,392 1,535 1,863 2,431 2,747
Return on Average Invested Capital 26.7% 22.0% 20.7% 19.3% 18.0% 18.5% 23.0% 21.9% 17.4% 17.2%
TOTAL COMPANY
Cash Dividends Declared
per Common Share $ 0.58 0.61 0.64 0.68 0.73 0.80 0.92 1.05 1.17 1.29
Average Stockholders’ Equity $ 855 976 1,111 1,241 1,290 936 1,198 1,397 1,700 1,668
Total Assets at April 30 $ 1,735 1,802 1,939 2,016 2,264 2,376 2,649 2,728 3,551 3,405
Long-term Debt at April 30 $ 46 33 33 33 629 630 351 351 422 417
Total Debt at April 30 $ 290 259 237 200 829 679 630 576 1,177 1,006
Cash Flow from Operations $ 213 241 232 249 243 304 396 343 355 534
Return on Average
Stockholders’ Equity 23.4% 22.1% 20.7% 18.1% 18.7% 27.1% 25.7% 22.9% 22.9% 26.4%
Total Debt to Total Capital 24.0% 19.8% 16.6% 13.2% 49.4% 38.3% 32.5% 26.9% 42.8% 36.8%
Dividend Payout Ratio 39.5% 38.5% 38.1% 41.4% 41.1% 38.2% 36.1% 40.0% 36.8% 35.8%
Notes: 1. Includes the consolidated results of Sonoma-Cutrer Vineyards, Finlandia Vodka Worldwide, Tuoni e Canepa, Swift & Moore, Chambord, and Casa Herradura since their acquisitions in
April 1999, December 2002, February 2003, February 2006, May 2006, and January 2007, respectively.
2. Weighted average shares, earnings per share, and cash dividends declared per common share have been adjusted for a 2-for-1 common stock split in January 2004.
3. We define Return on Average Invested Capital as the sum of net income (excluding extraordinary items) and after-tax interest expense, divided by average invested capital. Invested capital equals assets less liabilities, excluding interest-bearing debt.
4. We define Return on Average Stockholders’ Equity as net income applicable to common stock divided by average stockholders’ equity.
5. We define Total Debt to Total Capital as total debt divided by the sum of total debt and stockholders’ equity.
6. We define Dividend Payout Ratio as cash dividends divided by net income.
selected Financial data

21
Brown-Forman annual report 2008
In the discussion below, we review Brown-Forman’s consolidated financial
condition and results of operations for the fiscal years ended April 30, 2006,
2007, and 2008. We also predict our anticipated financial performance, make
other forward-looking statements, and discuss factors that may affect our
future financial condition and performance. We have prepared a list of some
risk factors that could cause actual results to differ materially from our antici-
pated results. Please read this Management’s Discussion and Analysis section
in conjunction with our consolidated financial statements for the year ended
April 30, 2008, their related notes, and the important disclaimer regarding
forward-looking statements on page 51.
As discussed in Note 2 to the accompanying financial statements, we sold
Lenox, Inc. during fiscal 2006, and sold Brooks & Bentley and Hartmann
in fiscal 2007. As a result, we have reported them as discontinued opera-
tions in the accompanying financial statements.
EXECUTIVE OVERVIEW
Brown-Forman Corporation is a producer and marketer of fine-quality
consumer beverage alcohol products, including Jack Daniel’s and its fam-
ily of brands; Southern Comfort; Finlandia; Tequila Herradura; el Jimador
Tequila; Canadian Mist; Fetzer, Bolla, Bonterra, and Sonoma-Cutrer wines;
and Korbel California Champagne. We market and sell various categories
of beverage alcohol products, such as Tennessee, Canadian, and Kentucky
whiskies; Kentucky bourbon; California sparkling wine; tequila; table wine;
liqueurs; vodka; gin; and ready-to-drink products.
OUR MARKETS
We sell our brands in more than 135 countries. For the first time in our
company’s history, in fiscal 2008 more than half of total sales came from
markets outside of the U.S. But our largest and most important single
market remains the U.S., where 48% of our net sales were generated in
fiscal 2008, compared to 53% in fiscal 2007. Our sales grew 31% outside the
U.S. when compared to fiscal 2007, while sales in the U.S. grew 4%.
Net sales in Europe, our second largest region, grew 17% in fiscal 2008,
influenced in part by a weaker U.S. dollar as well as by solid underlying
growth in a number of markets, particularly in Eastern Europe. Europe
represented 29% of total net sales in fiscal 2008. Net sales from the rest
of the world (outside Europe and the U.S.) were up 55% in fiscal 2008
and now constitute 23% of our total net sales. The double-digit increase
in net sales reflects the acquisition of Casa Herradura and its related sales
outside of the U.S., primarily in Mexico, and solid growth for several other
brands in our portfolio in Australia, Canada, Latin America, and various
Asian markets.
International expansion continues to provide a significant portion of our
growth, as it has over the past decade. In fact, markets outside of the U.S.
contributed more than 85% of the overall growth in consolidated net sales in
fiscal 2008 and constituted approximately 52% of our total reported net sales
for the year. Fifteen years ago, just prior to the adoption of our strategic
initiative to expand our international footprint, net sales outside the U.S.
contributed less than 20% of our total net sales. Today, the principal
international markets for our brands include the U.K., Australia, Mexico,
Poland, Germany, Spain, Canada, France, the Czech Republic, Italy, South
Africa, China, Japan, and Russia. As we continue to expand outside of the
U.S., foreign exchange rate fluctuations increasingly affect our financial
results – in terms of both sales from goods sold in local currencies and the
cost of goods, services, and manpower purchased and paid in local currencies.
On a net basis, we sell more in local currencies than we buy, thus exposing
our financial results to the negative impact of a strengthening U.S. dollar. To
help protect against this, we regularly hedge our foreign currency exposure.
But over the long term, reported profits from our international business may
be adversely affected if the U.S. dollar strengthens against other currencies.
Consumer demand for premium brands in the U.S. continued to expand
this past year, but at a lower growth rate than in fiscal 2007, reflecting the
challenging economic environment and softening on-premise trends.
However, positive demographic trends, continued consumer interest
in spirits-based cocktails, and some consumers’ trading up to premium
offerings helped maintain the growth for premium spirits in the U.S. We
anticipate that this environment will continue in the U.S., but consumer
preferences can change quickly and could affect our performance if we do
not respond quickly to changing industry and competitive dynamics. In
the short term, the uncertain economic conditions in the U.S. and other
key markets linked to the U.S., such as Western Europe and Mexico,
could also hurt our performance.
OUR bRANdS
Over the past several years, we delivered growth in sales and earnings by
expanding our portfolio geographically, by introducing new brand offer-
ings, by adding new brands via acquisitions, by taking price increases, and
by divesting non-core businesses. Our divestiture of our former consumer
durables businesses, completed in fiscal 2007, allows us to focus on opti-
mizing opportunities in the beverage business.
We seized upon two opportunities in fiscal 2007 to further strengthen our
portfolio by buying Chambord liqueur and the Casa Herradura brands (includ-
ing el Jimador, Herradura, New Mix tequila-based ready-to-drink, Antiguo,
and Suave 35). These brands contributed to our growth in sales in the fiscal
year and met our other expectations for the year. These brand additions in the
premium or super-premium spirits categories, in high-priority markets,
complement and fit well in our portfolio of premium brands. We anticipate
that brands from these acquisitions will provide long-term earnings growth at
rates at or above our historical average, strengthening our growth profile.
management ’s discussion and analysis
$3,500
$3,000
$2,500
$2,000
$1,500
$1,000
$ 500
$ 0
200820072006
U.S. EUROPE REST OF WORLD
NET SALES bY GEOGRAPhY (in millions)

22
Brown-Forman annual report 2008
Our brand portfolio approached 36 million nine-liter cases in depletions
(shipments from distributors to retailers) in fiscal 2008. We also had 10 brands
with depletions exceeding one million nine-liter cases.
Jack Daniel’s Tennessee Whiskey remains the most important brand in
our portfolio and one of the largest, most profitable spirits brands in the
world, based on our review of industry data. Global depletions for Jack
Daniel’s increased 4% in fiscal 2008, approaching 9.5 million nine-liter
cases, driven by strong growth outside the U.S.
A positive long-term environment for premium spirits, increased levels of
advertising and promotional support, and Jack Daniel’s overall market-
place strength have combined to provide solid growth in volumes and
double-digit gains in gross profit on a global basis. A significant percent of
our total earnings is derived from Jack Daniel’s, and the brand’s growth
is vital to our overall marketplace strength. Accordingly, it remains our
primary focus. While a significant decline in volume or selling price for the
brand could materially depress our overall earnings, we are encouraged
by the accelerating geographic diversification of the brand’s profits, which
continued in fiscal 2008, and favorable demographic trends in the U.S.
and around the world. We believe this brand has continued global growth
potential and upward pricing opportunities.
The Jack Daniel’s family of brands, which includes Jack Daniel’s
Tennessee Whiskey, Gentleman Jack, Jack Daniel’s Single Barrel, and
the Jack Daniel’s & Cola ready-to-drink (measured on a drinks-equivalent
basis) crossed the 10 million case mark – and together grew volumes at
an impressive 6% rate globally, with reported net sales advancing 12%.
These brands are an increasingly important source of annual growth. Our
recently repackaged Gentleman Jack brand was the fastest-growing brand
in our portfolio, growing over 40%, with volumes well in excess of 200,000
nine-liter cases in fiscal 2008. A very recent development – an increase in
the tax on ready-to-drink products in Australia – will likely create some
headwinds in fiscal 2009 because Australia is our largest and most signifi-
cant market for Jack Daniel’s & Cola. The brand is also important to our
continued growth in the Asia-Pacific region.
Southern Comfort and Finlandia are the next two most important brands
for us. Southern Comfort delivered 6% growth in net sales on flat volumes,
as solid growth outside the U.S. was offset by declines in the U.S. (the
brand’s largest market). Finlandia surpassed Southern Comfort in volu-
metric terms in fiscal 2008, with its depletion trends accelerating 16%, led
by strong growth in Poland (the brand’s largest market, at over 800,000
nine-liter cases) and Russia. In contrast to Jack Daniel’s and Southern
Comfort, we sell nearly 90% of Finlandia’s 2.8 million nine-liter cases
outside of the U.S. We expect both Southern Comfort and Finlandia to
contribute significantly to our long-term growth.
Our mid-priced brands had mixed results during fiscal 2008. Depletions
increased for Fetzer’s Valley Oaks wines and Korbel California Cham-
pagnes, but decreased for Bolla, Canadian Mist, and Early Times. These
large, off-premise-driven category leaders remain important contributors
to our earnings and cash flow, and compete in extremely price-competitive
categories that will likely intensify in the short term with the difficult
economic environment in the U.S. While these brands could benefit from
consumers trading down or from a shift of on-premise sales to off-premise
sales during a soft economy, we have only modest growth expectations for
most of these brands.
Our brands that compete in the super-premium price category expanded
significantly with the acquisitions of Chambord and the Casa Herradura
brands. These acquired brands accounted for approximately 40% of total
net sales growth in fiscal 2008. We believe these super-premium brands
and the developing brands in our portfolio represent significant worldwide
growth opportunities for us. While volume growth rates for super-premium
brands in the U.S. are not as high as they have been over the last several
years, we continue to experience double-digit depletion growth for several
of our brands priced in this category, including Bonterra, Gentleman Jack,
and Woodford Reserve. Each of these brands reported global net sales
gains of at least 20% in fiscal 2008. In addition, Tuaca, Sonoma-Cutrer, and
Chambord continued to register solid depletion gains and combined to
grow net sales at a double-digit rate. We remain encouraged by the growth
prospects for these brands and believe they have the potential to contrib-
ute meaningfully to our future earnings, especially as we expand the Casa
Herradura tequila brands across our geographic portfolio.
OUR ROUTE-TO-CONSUMER STRATEGY
Introduced five years ago, the Brown-Forman Arrow captures our over-
arching objective to “Be the Best Brand Builder in the Industry, Period!”
and the five supporting imperatives that reach that goal. Our strategies
grow from this overarching objective.
A critical component of our brand-building strategy is a multifaceted program
designed to ensure that consumers can find our products whenever and
wherever they have an opportunity to choose a premium beverage alcohol
brand. We use a variety of distribution models around the world to imple-
ment this program. Our preference for a particular arrangement or partnership
depends on our assessment of a market’s long-term competitive dynamics and
our portfolio’s stage of development in that market. We own and operate our
distribution network in several markets, including Australia, China, the Czech
Republic, Korea, Mexico, Poland, and Thailand. In the United Kingdom and
Germany, we have joined forces with another supplier, Bacardi, to sell our and
their products. In all of these markets, we sell our beverage alcohol products
directly to retail stores and to wholesalers. In many other markets, including
the U.S., we use third parties to distribute our portfolio of brands.
The distribution environment in the U.S. continued to change this past
year, with a number of distributor consolidations. In the U.S., we formed a
sales alliance with Bacardi and Remy Cointreau in a few key states. Our
alliance provides for focused sales teams within our distributors in these
states to sell the strong, complementary portfolio of the three companies,
while we each continue our own unique, independent brand building to
supplement the distributor’s effort. We have been evaluating options to
further this alliance in other parts of the U.S.
management ’s discussion and analysis

23
Brown-Forman annual report 2008
During fiscal 2008, we decided to combine our brand portfolio in Mexico.
Effective June 1, 2008, we began to integrate our existing brands into
the sales and marketing operation we acquired with Casa Herradura.
Meanwhile, over the next 12 to 24 months, several of our distribution con-
tracts in Europe will expire. We are carefully reviewing our distribution
arrangements in these markets, and as always, we will seek out strategies
and/or partnerships that can improve our in-market brand-building efforts.
OUR COMPETITION
Our brands operate in a highly competitive industry. We compete against
many global, regional, and local brands in several categories and price
points of beverage alcohol, but our portfolio is skewed to the premium
end of the industry. Trade information indicates that we are one of the
largest wine and spirits suppliers in the U.S. based on revenues.
OUR EARNINGS OUTLOOK
Our fiscal 2009 earnings outlook of $3.73 to $3.98 per diluted share reflects
our expectations for continued solid international growth, improving
trends for both Jack Daniel’s and Southern Comfort in the U.S., and
strong growth from Casa Herradura brands in the U.S. Additionally, we
have incorporated anticipated increases in raw material and fuel costs as
well as continued leverage from prior investments in selling, general, and
administrative expenses into our 3% to 10% operating income growth
expectations for the year. This outlook also reflects our expectations for a
higher effective tax rate, the benefits of the fiscal 2008 share repurchase,
and lower interest expense. As a result, we currently expect fiscal 2009
earnings per diluted share growth of 5% to 12%.
RESULTS OF OPERATIONS
Our total company diluted earnings per share were $3.56 in fiscal 2008,
all but $0.01 of which came from continuing operations. The following
discussion of our results from continuing operations excludes the results
related to the former Consumer Durables segment, which we have
segregated from continuing operations and reflected as discontinued
operations for all periods presented. See “Discontinued Operations”
on page 29.
CONTINUING OPERATIONS
Continuing operations consist of our beverage business, which includes
strong brands representing a wide range of varietal wines, champagnes, and
spirits such as whiskey, bourbon, vodka, tequila, and liqueur. The largest
market for our brands is the U.S., which generally prohibits wine and spirits
manufacturers from selling their products directly to consumers. Instead,
we sell our products to wholesale distributors or state-owned operators, who
then sell the products to retailers, who in turn sell to consumers. We use a
similar tiered distribution model in many markets outside the U.S., but we
distribute our own products in several markets, including Australia, China,
the Czech Republic, Korea, Mexico, Poland, and Thailand.
Distributors and retailers normally keep some of our products on hand
as inventory, so retailers can sell more (or less) of our products to consumers
than distributors buy from us during any given period. Because we generally
record revenues when we ship our products to distributors, our sales do not
necessarily reflect actual consumer demand during any particular period.
Ultimately, of course, consumer demand is critical in understanding the
underlying health and financial results of our brands and business. The
beverage alcohol industry generally uses depletions (defined on
page 22) to approximate consumer demand. We also utilize syndicated
data and monitor inventory levels in the trade to confirm that depletions
are representative of consumer demand.
fISCAL 2008 COMPAREd TO fISCAL 2007
Net sales approached $3.3 billion, a record in fiscal 2008, and an increase
of 17% over net sales in fiscal 2007. For the first time in our history, sales
outside the U.S. constituted more than half (52%) of the total; just five
years ago, sales outside the U.S. constituted less than 30% of our total
sales. This shift in the geographic mix of our sales reflects an accelerat-
ing demand for our portfolio in markets outside the U.S., the effect of
acquired brands, and the benefits of a weaker U.S. dollar. Over 85% of the
$476 million increase in our net sales for fiscal 2008 came from markets
outside the U.S.
The major factors driving our fiscal 2008 sales increase were:
Growth vs. 2007
• Acquisitions 7%
• Foreign exchange 4%
• Underlying net sales growth: 6%
Volume 4%
Price/Mix 2%
Reported net sales growth 17%
In the table above, “Acquisitions” refers to the effect our Chambord and
Casa Herradura acquisitions, which occurred in May 2006 and January
2007, respectively, had on our results. Significant acquisitions can make
year-to-year comparisons difficult to understand. We believe disclosing the
effect of these acquisitions separately clarifies the underlying year-to-year
changes and provides helpful information in forecasting and planning our
growth expectations.
“Foreign exchange” refers to net gains and losses incurred by our sales
and purchases in currencies other than the U.S. dollar. We disclose this
separately to explain our business growth on a constant dollar basis,
because exchange rate fluctuations distort the underlying growth of our
business (both positively and negatively). To filter out the effect of foreign
exchange fluctuations, we translate current year results at prior year rates.
In fiscal 2008, the weaker U.S. dollar benefited our net sales, gross profit,
operating income, and earnings per share but hurt our advertising and
selling, general, and administrative expenses. Although foreign exchange
volatility is a reality for a global company, we routinely review our com-
pany performance on a constant dollar basis. We believe that separately
identifying the effect foreign exchange has on each major line item of
the consolidated statement of operations makes our underlying business
performance more transparent.
Fiscal 2008 was another solid year for Jack Daniel’s Tennessee Whiskey,
as volume increased for the 16th consecutive year, approaching 9.5 million
nine-liter cases. Consumer demand continued to expand for this iconic,
authentic American whiskey, as the brand added 375,000 nine-liter cases
globally to its already large base, growing more than 4% over the prior
year. Depletions expanded 8% outside the U.S., with geographically
management ’s discussion and analysis

24
Brown-Forman annual report 2008
diverse, broad-based gains in many markets, while net sales grew nearly
17%. The most notable case increases were in the U.K. (the brand’s
largest market outside the U.S., where annual volumes now approach
1 million nine-liter cases), France, Poland, Russia, Romania, and Turkey.
Both volumes and net sales improved in the low single digits in the
brand’s largest market, the U.S.
The overall distilled spirits category in the U.S. continued to grow during
fiscal 2008. Industry trends, as measured by National Alcohol Beverage
Control Association (NABCA) data, indicate total distilled spirits volume
grew 3.1% for the 12 months ending April 30, 2008, while Jack Daniel’s
in the U.S. grew about 1% for the same period. In our opinion, several
factors contributed to the industry-lagging growth for Jack Daniel’s in
this key market:
• Jack Daniel’s crossed the $20 and $40 price points in most U.S. markets
on its two key sizes. We have seen temporary volume declines for this
brand when it crossed through key price points before, and, as in the
past, we expect a rebound this time, too.
• “Trading down” has been affecting this brand recently, which derives
its high-volume, premium-price business from a consumer franchise
representing a broad range of household incomes. When economic
times are challenging, as we are seeing in the U.S. today, some of our
consumers seek cheaper alternatives.
• Some consumers have “traded across” to other premium brands as our
competition discounted more deeply.
• To a lesser extent, “trading up” has also affected performance; we
believe our recently repackaged Gentleman Jack brand benefited from
this shift, showing strong growth for the year.
We have planned numerous initiatives to ensure Jack Daniel’s continues
its relevance in the current competitive consumer environment. As a
result, we believe that Jack Daniel’s growth rate in the U.S. will improve
in fiscal 2009 and more closely approximate that of the distilled spirits
category generally. However, if Jack Daniel’s growth rate in the U.S. does
not improve, it could reduce our earnings expectations for fiscal 2009.
Performance for the rest of the Jack Daniel’s family of brands was also strong.
Growing 10%, Jack Daniel’s ready-to-drink products passed the 3 million
nine-liter case mark in the year and are now approaching 3.3 million nine-liter
cases on the strength of Jack Daniel’s & Cola sales in Australia. Meanwhile,
Gentlemen Jack was the fastest-growing brand in our portfolio, growing over
40% with volumes well in excess of 200,000 nine-liter cases in fiscal 2008.
Finlandia continues to be a major, and growing, contributor to our interna-
tional expansion. Since taking a majority stake in Finlandia in fiscal 2003,
we have added more than 1 million cases to the brand’s annual depletions.
Over 95% of this incremental volume has been in international markets.
The brand was a major driver of growth for us in fiscal 2008. Global
volumes advanced 16%, surpassing Southern Comfort in volumes sold,
while net sales gained 33%, reflecting volume gains, price increases, and
the benefit of a weak U.S. dollar. Strong double-digit growth in many parts
of Europe, particularly Poland, the brand’s largest market (where we sold
over 800,000 nine-liter cases of the brand), and Russia (where we added
over 100,000 nine-liter cases) fueled the brand’s growth for the year.
While Southern Comfort global depletions were flat in fiscal 2008, the
brand’s net sales grew 6%, reflecting continued premium pricing in the
U.S. and the benefits of a weaker dollar. Southern Comfort registered
solid volume gains in the U.K. (the brand’s largest market outside the
U.S.), South Africa, and Australia. Low single-digit volume declines in
the U.S. on a volumetric basis were more than offset by the effect of price
increases, which led to net sales growth of more than 1% in the brand’s
largest market.
Overall volume performance was mixed for the other brands in our
portfolio. Bonterra, Chambord, Woodford Reserve, and Sonoma-Cutrer ex-
perienced high single-digit or double-digit increases. Fetzer Valley Oaks
and Korbel California Champagnes registered low single-digit depletion
growth. Canadian Mist, Bolla, and Early Times recorded modest depletion
declines in fiscal 2008.
The following table highlights worldwide depletion results for our major
brands during fiscal 2008:
Nine-liter % Change Cases (000s) vs. 2007
Jack Daniel’s 9,450 4%
New Mix RTDs(1) 4,340 NA
Other RTDs(2) 3,675 9%
Finlandia 2,835 16%
Southern Comfort 2,460 0%
Fetzer Valley Oaks 2,355 2%
Canadian Mist 1,895 (3%)
Korbel Champagnes 1,305 2%
Bolla 1,130 (3%)
(1) New Mix is a tequila-based RTD (ready-to-drink) brand we acquired in January 2007 as part of the Casa Herradura acquisition, and sold exclusively in Mexico.
(2) Other RTD (ready-to-drink) products include Jack Daniel’s and Southern Comfort products.
Gross profit is one of our key performance measures. The same factors
described above that boosted revenue growth also fueled gross profit
growth. In fiscal 2008, gross profit grew $214 million, or 14%, to approxi-
mately $1.7 billion. The table below summarizes the major factors driving
the gross profit growth for the year.
Growth vs. 2007
• Acquisitions 4%
• Foreign exchange 4%
• Underlying gross profit growth: 6%
Volume 4%
Price/Mix 2%
Reported gross profit growth 14%
Underlying gross profit growth of 6% was fueled primarily by solid
consumer demand for Jack Daniel’s, Finlandia, Jack Daniel’s & Cola, and
Gentleman Jack. Price increases on several brands, including Jack Daniel’s,
Southern Comfort, Finlandia, Canadian Mist, Early Times, Sonoma-
Cutrer, and Korbel Champagne, also contributed to the underlying growth
in gross profit.
management ’s discussion and analysis

25
Brown-Forman annual report 2008
Gross margin declined from 52.8% in fiscal 2007 to 51.6% in fiscal 2008.
The major reason for this decline was the full-year effect of the addition
of Casa Herradura results. The gross margins for Herradura and el Jimador
on sales in the U.S. are above our overall average margin; however, gross
margins on both these brands and on New Mix (a tequila-based ready-to-
drink product) and agency brands acquired as part of this acquisition are
all considerably lower in Mexico. Gross margins for the year were also sup-
pressed by high raw material and fuel costs, which were nearly offset by
price increases on several of our brands in selected markets. Over the long
term, as the mix of our tequila business shifts toward more U.S. revenue,
we expect gross margins to improve, though rising raw material and fuel
costs will likely put pressure on margins in the short term.
Advertising expenses were up $54 million, or 15%, as we continued our long
track record of investing to build our brands. Spending behind acquired
brands (Chambord and the Casa Herradura brands) and the weaker U.S.
dollar contributed to the increase in spending for the year. On a constant-
exchange basis, and excluding the effect of acquisitions on a comparable
basis, advertising investments were up 6%, reflecting incremental spending
behind Jack Daniel’s, Southern Comfort, Finlandia, and other brands,
including Woodford Reserve, Bonterra, and Sonoma-Cutrer.
Growth vs. 2007
• Acquisitions 5%
• Foreign exchange 4%
• Underlying advertising growth 6%
Reported advertising growth 15%
Selling, general, and administrative expenses increased $57 million, or 10%,
influenced by these factors:
Growth vs. 2007
• Acquisitions 6%
• Foreign exchange 1%
• Underlying SG&A growth 3%
Reported SG&A growth 10%
Inflation of salary and related expenses was a primary factor contributing
to the underlying increase in selling, general, and administrative expenses.
This underlying increase in selling, general, and administrative expenses is
significantly lower than recent years, as we leveraged the past several years
of incremental investments in this area to support our global route-to-market
efforts. The graph on this page reflects our consistently strong investments
in our overall operating expenses over several long-term periods. These
increases in advertising and selling, general, and administrative expenses
essentially mirrored growth in gross profit over the same periods.
Amortization expense increased $3 million in fiscal 2008. Before we acquired
Casa Herradura in January 2007, the U.S. distribution rights for the
Herradura brand had been granted to another party through December 31,
2011. After purchasing Casa Herradura, we acquired those distribution
rights from that party for $25 million, which we are amortizing on a
straight-line basis through December 31, 2011. The increase in the
amortization expense for fiscal 2008 reflects the 12 full months of
amortization of the cost of acquiring those distribution rights compared
to the last three months of fiscal 2007.
Other income decreased $17 million in fiscal 2008, due primarily to the
absence of an $11 million gain we had recognized in fiscal 2007 on the sale
of an Italian winery used in producing Bolla wines to Gruppo Italiano Vini
(GIV). The Bolla brand remains a part of our portfolio, though we moved
the responsibility for producing these Italian wines to GIV, an Italian
company, during fiscal 2007.
Operating income for fiscal 2008 improved 14%, or $83 million. Positive
factors driving operating income growth were higher consumer demand
for Jack Daniel’s Tennessee Whiskey, Jack Daniel’s & Cola, and
Finlandia, particularly outside the U.S., and excellent growth in the
U.S. for Gentleman Jack. Improved volumes and profits from several
other brands, largely focused in the U.S., including Bonterra, Jack Daniel’s
Single Barrel, Woodford Reserve, and Tuaca, also contributed to income
growth. Additionally, benefits from a weaker U.S. dollar and the incremental
profits from the Casa Herradura and Chambord acquisitions in fiscal 2007
boosted year-over-year growth in operating income. Margin expansion,
driven by price increases, offset the rising costs of raw materials and fuel.
Comparisons to the prior year were also affected by the absence of the
$11 million gain recognized in fiscal 2007 on the sale of winery assets.
The following chart summarizes the major factors driving our 14% growth
in operating income and identifies our underlying operating income
growth for fiscal 2008 of 8%, which while lower than our growth rate in
recent years, is consistent with our long-term, 15-year growth rate in
operating income.
management ’s discussion and analysis
15%
10%
5%
0%
35 yrcagrsince1973
25 yrcagrsince1983
15 yrcagrsince1993
10 yrcagrsince1998
5 yrcagrsince2003
3 yrcagrsince2005
AdvERTISING SG&A
LONG-TERM OPERATING ExPENSE INvESTMENT TRENdS
(CAGR: Compound Annual Growth Rate)
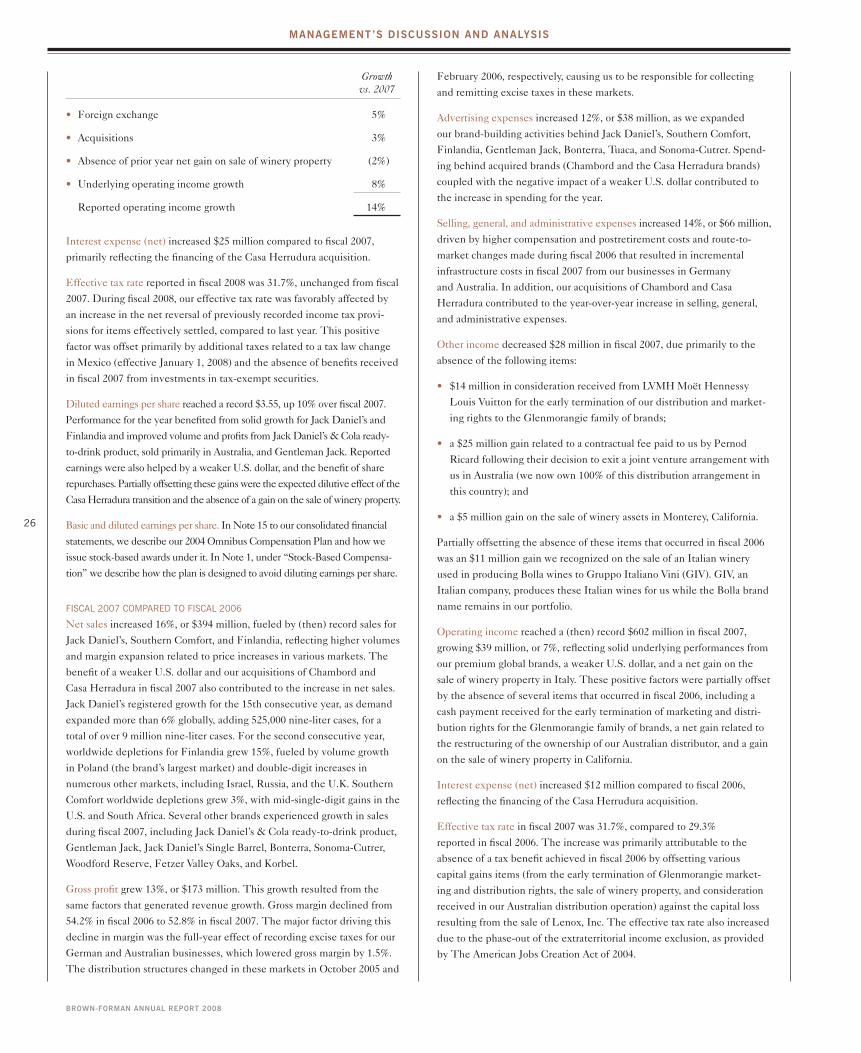
26
Brown-Forman annual report 2008
Growth vs. 2007
• Foreign exchange 5%
• Acquisitions 3%
• Absence of prior year net gain on sale of winery property (2%)
• Underlying operating income growth 8%
Reported operating income growth 14%
Interest expense (net) increased $25 million compared to fiscal 2007,
primarily reflecting the financing of the Casa Herrudura acquisition.
Effective tax rate reported in fiscal 2008 was 31.7%, unchanged from fiscal
2007. During fiscal 2008, our effective tax rate was favorably affected by
an increase in the net reversal of previously recorded income tax provi-
sions for items effectively settled, compared to last year. This positive
factor was offset primarily by additional taxes related to a tax law change
in Mexico (effective January 1, 2008) and the absence of benefits received
in fiscal 2007 from investments in tax-exempt securities.
Diluted earnings per share reached a record $3.55, up 10% over fiscal 2007.
Performance for the year benefited from solid growth for Jack Daniel’s and
Finlandia and improved volume and profits from Jack Daniel’s & Cola ready-
to-drink product, sold primarily in Australia, and Gentleman Jack. Reported
earnings were also helped by a weaker U.S. dollar, and the benefit of share
repurchases. Partially offsetting these gains were the expected dilutive effect of the
Casa Herradura transition and the absence of a gain on the sale of winery property.
Basic and diluted earnings per share. In Note 15 to our consolidated financial
statements, we describe our 2004 Omnibus Compensation Plan and how we
issue stock-based awards under it. In Note 1, under “Stock-Based Compensa-
tion” we describe how the plan is designed to avoid diluting earnings per share.
fISCAL 2007 COMPAREd TO fISCAL 2006
Net sales increased 16%, or $394 million, fueled by (then) record sales for
Jack Daniel’s, Southern Comfort, and Finlandia, reflecting higher volumes
and margin expansion related to price increases in various markets. The
benefit of a weaker U.S. dollar and our acquisitions of Chambord and
Casa Herradura in fiscal 2007 also contributed to the increase in net sales.
Jack Daniel’s registered growth for the 15th consecutive year, as demand
expanded more than 6% globally, adding 525,000 nine-liter cases, for a
total of over 9 million nine-liter cases. For the second consecutive year,
worldwide depletions for Finlandia grew 15%, fueled by volume growth
in Poland (the brand’s largest market) and double-digit increases in
numerous other markets, including Israel, Russia, and the U.K. Southern
Comfort worldwide depletions grew 3%, with mid-single-digit gains in the
U.S. and South Africa. Several other brands experienced growth in sales
during fiscal 2007, including Jack Daniel’s & Cola ready-to-drink product,
Gentleman Jack, Jack Daniel’s Single Barrel, Bonterra, Sonoma-Cutrer,
Woodford Reserve, Fetzer Valley Oaks, and Korbel.
Gross profit grew 13%, or $173 million. This growth resulted from the
same factors that generated revenue growth. Gross margin declined from
54.2% in fiscal 2006 to 52.8% in fiscal 2007. The major factor driving this
decline in margin was the full-year effect of recording excise taxes for our
German and Australian businesses, which lowered gross margin by 1.5%.
The distribution structures changed in these markets in October 2005 and
February 2006, respectively, causing us to be responsible for collecting
and remitting excise taxes in these markets.
Advertising expenses increased 12%, or $38 million, as we expanded
our brand-building activities behind Jack Daniel’s, Southern Comfort,
Finlandia, Gentleman Jack, Bonterra, Tuaca, and Sonoma-Cutrer. Spend-
ing behind acquired brands (Chambord and the Casa Herradura brands)
coupled with the negative impact of a weaker U.S. dollar contributed to
the increase in spending for the year.
Selling, general, and administrative expenses increased 14%, or $66 million,
driven by higher compensation and postretirement costs and route-to-
market changes made during fiscal 2006 that resulted in incremental
infrastructure costs in fiscal 2007 from our businesses in Germany
and Australia. In addition, our acquisitions of Chambord and Casa
Herradura contributed to the year-over-year increase in selling, general,
and administrative expenses.
Other income decreased $28 million in fiscal 2007, due primarily to the
absence of the following items:
• $14 million in consideration received from LVMH Moët Hennessy
Louis Vuitton for the early termination of our distribution and market-
ing rights to the Glenmorangie family of brands;
• a $25 million gain related to a contractual fee paid to us by Pernod
Ricard following their decision to exit a joint venture arrangement with
us in Australia (we now own 100% of this distribution arrangement in
this country); and
• a $5 million gain on the sale of winery assets in Monterey, California.
Partially offsetting the absence of these items that occurred in fiscal 2006
was an $11 million gain we recognized on the sale of an Italian winery
used in producing Bolla wines to Gruppo Italiano Vini (GIV). GIV, an
Italian company, produces these Italian wines for us while the Bolla brand
name remains in our portfolio.
Operating income reached a (then) record $602 million in fiscal 2007,
growing $39 million, or 7%, reflecting solid underlying performances from
our premium global brands, a weaker U.S. dollar, and a net gain on the
sale of winery property in Italy. These positive factors were partially offset
by the absence of several items that occurred in fiscal 2006, including a
cash payment received for the early termination of marketing and distri-
bution rights for the Glenmorangie family of brands, a net gain related to
the restructuring of the ownership of our Australian distributor, and a gain
on the sale of winery property in California.
Interest expense (net) increased $12 million compared to fiscal 2006,
reflecting the financing of the Casa Herrudura acquisition.
Effective tax rate in fiscal 2007 was 31.7%, compared to 29.3%
reported in fiscal 2006. The increase was primarily attributable to the
absence of a tax benefit achieved in fiscal 2006 by offsetting various
capital gains items (from the early termination of Glenmorangie market-
ing and distribution rights, the sale of winery property, and consideration
received in our Australian distribution operation) against the capital loss
resulting from the sale of Lenox, Inc. The effective tax rate also increased
due to the phase-out of the extraterritorial income exclusion, as provided
by The American Jobs Creation Act of 2004.
management ’s discussion and analysis
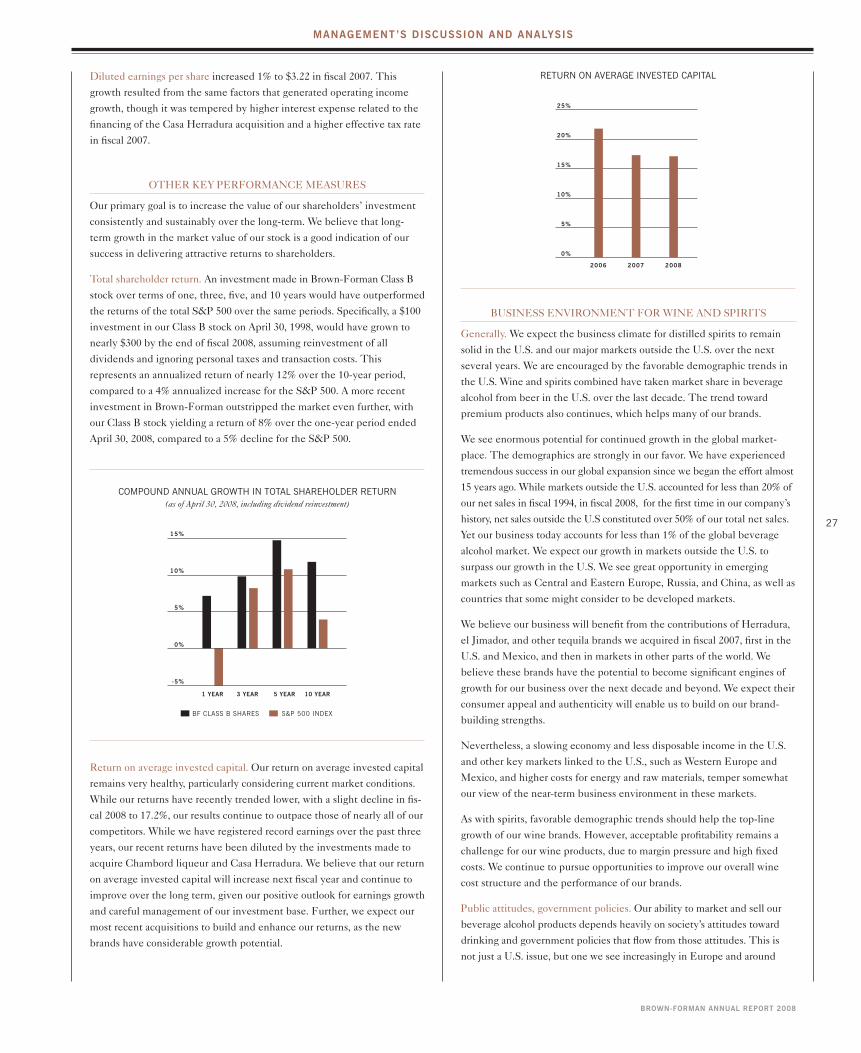
27
Brown-Forman annual report 2008
Diluted earnings per share increased 1% to $3.22 in fiscal 2007. This
growth resulted from the same factors that generated operating income
growth, though it was tempered by higher interest expense related to the
financing of the Casa Herradura acquisition and a higher effective tax rate
in fiscal 2007.
OTHER KEY PERFORMANCE MEASURES
Our primary goal is to increase the value of our shareholders’ investment
consistently and sustainably over the long-term. We believe that long-
term growth in the market value of our stock is a good indication of our
success in delivering attractive returns to shareholders.
Total shareholder return. An investment made in Brown-Forman Class B
stock over terms of one, three, five, and 10 years would have outperformed
the returns of the total S&P 500 over the same periods. Specifically, a $100
investment in our Class B stock on April 30, 1998, would have grown to
nearly $300 by the end of fiscal 2008, assuming reinvestment of all
dividends and ignoring personal taxes and transaction costs. This
represents an annualized return of nearly 12% over the 10-year period,
compared to a 4% annualized increase for the S&P 500. A more recent
investment in Brown-Forman outstripped the market even further, with
our Class B stock yielding a return of 8% over the one-year period ended
April 30, 2008, compared to a 5% decline for the S&P 500.
Return on average invested capital. Our return on average invested capital
remains very healthy, particularly considering current market conditions.
While our returns have recently trended lower, with a slight decline in fis-
cal 2008 to 17.2%, our results continue to outpace those of nearly all of our
competitors. While we have registered record earnings over the past three
years, our recent returns have been diluted by the investments made to
acquire Chambord liqueur and Casa Herradura. We believe that our return
on average invested capital will increase next fiscal year and continue to
improve over the long term, given our positive outlook for earnings growth
and careful management of our investment base. Further, we expect our
most recent acquisitions to build and enhance our returns, as the new
brands have considerable growth potential.
BUSINESS ENVIRONMENT FOR WINE AND SPIRITS
Generally. We expect the business climate for distilled spirits to remain
solid in the U.S. and our major markets outside the U.S. over the next
several years. We are encouraged by the favorable demographic trends in
the U.S. Wine and spirits combined have taken market share in beverage
alcohol from beer in the U.S. over the last decade. The trend toward
premium products also continues, which helps many of our brands.
We see enormous potential for continued growth in the global market-
place. The demographics are strongly in our favor. We have experienced
tremendous success in our global expansion since we began the effort almost
15 years ago. While markets outside the U.S. accounted for less than 20% of
our net sales in fiscal 1994, in fiscal 2008, for the first time in our company’s
history, net sales outside the U.S constituted over 50% of our total net sales.
Yet our business today accounts for less than 1% of the global beverage
alcohol market. We expect our growth in markets outside the U.S. to
surpass our growth in the U.S. We see great opportunity in emerging
markets such as Central and Eastern Europe, Russia, and China, as well as
countries that some might consider to be developed markets.
We believe our business will benefit from the contributions of Herradura,
el Jimador, and other tequila brands we acquired in fiscal 2007, first in the
U.S. and Mexico, and then in markets in other parts of the world. We
believe these brands have the potential to become significant engines of
growth for our business over the next decade and beyond. We expect their
consumer appeal and authenticity will enable us to build on our brand-
building strengths.
Nevertheless, a slowing economy and less disposable income in the U.S.
and other key markets linked to the U.S., such as Western Europe and
Mexico, and higher costs for energy and raw materials, temper somewhat
our view of the near-term business environment in these markets.
As with spirits, favorable demographic trends should help the top-line
growth of our wine brands. However, acceptable profitability remains a
challenge for our wine products, due to margin pressure and high fixed
costs. We continue to pursue opportunities to improve our overall wine
cost structure and the performance of our brands.
Public attitudes, government policies. Our ability to market and sell our
beverage alcohol products depends heavily on society’s attitudes toward
drinking and government policies that flow from those attitudes. This is
not just a U.S. issue, but one we see increasingly in Europe and around
15%
10%
5%
0%
-5%
BF CLASS B SHARES S&P 500 INDEX
1 YEAR 3 YEAR 5 YEAR 10 YEAR
COMPOUNd ANNUAL GROwTh IN TOTAL ShAREhOLdER RETURN (as of April 30, 2008, including dividend reinvestment)
0
5
10
15
20
2525%
20%
15%
10%
5%
0%
200820072006
RETURN ON AvERAGE INvESTEd CAPITAL
management ’s discussion and analysis

28
Brown-Forman annual report 2008
the world. A number of organizations criticize abusive drinking and blame
alcohol manufacturers for problems associated with alcohol misuse. Specifi-
cally, critics say alcohol companies market their products to encourage
underage drinking.
We are extremely careful to market our beverage products only to adults.
We were one of the first companies to adopt a comprehensive marketing
code governing the sale of our spirits and wine brands. Our marketing
code emphasizes the importance of content and placement to minimize
exposure to the underaged. We adhere to marketing codes of the Distilled
Spirits Council of the United States, the Wine Institute, and the European
Forum for Responsible Drinking, among others. We contribute significant
resources to The Century Council, an organization that we and other spirits
producers created to combat drunk driving and underage drinking. In
Europe, we are an active member of similar organizations, including the
Portman Group and the Drinkaware Trust in the United Kingdom.
Illegal alcohol consumption by underage drinkers and abusive drinking by
a minority of adult drinkers give rise to public issues of great significance.
Alcohol critics seek governmental measures to make beverage alcohol more
expensive, less available, and more difficult to advertise and promote. We
disagree that this is a good strategy to deal with the minority of individuals
who abuse alcohol. In our view, society is more likely to curb alcohol abuse
by better educating consumers about beverage alcohol and by setting a
good example through moderate drinking than by restricting alcohol
advertising and sales or by imposing punitive taxes.
Legal or regulatory measures against beverage alcohol (including its
advertising and promotion) could hurt our sales. Regulatory measures are a
particular concern currently in Europe, where the European Union and
many of its member countries are devoting increased attention to more
restrictive alcohol policies. In the U.S., distilled spirits are at a marked
disadvantage to beer and wine in taxation, access to network television
advertising, and in the number and type of sales outlets. Achieving greater
cultural acceptance of our products and parity with beer and wine in taxation
and access to consumers are major goals that we share with other distillers.
Notably, the World Health Organization (WHO) has begun a major alcohol
policy-making process intended to produce a global strategy to combat the
misuse of alcohol. While the WHO’s global strategy will not carry the force
of law, the organization is highly influential, particularly in the developing
world. We believe its alcohol policy recommendations will be taken seri-
ously and probably adopted into law in many WHO member states. We are
committed to working with the WHO during this policy-making process to
ensure that its global strategy is based on sound science and recognizes the
critical distinction between the use and abuse of beverage alcohol.
Policy objectives. We believe that beverage alcohol should be regarded
like other beneficial products, such as food, pharmaceuticals, and
automobiles – all of which can be hazardous if misused by the consumer.
Therefore, we encourage the proper use of our products and discourage
misuse of alcohol, particularly drinking by those under the legal drinking
age. We believe the most powerful way to encourage proper drinking and
discourage alcohol abuse is through partnership with parents, schools, law
enforcement, and other concerned stakeholders.
We also seek recognition that distilled spirits, wine, and beer are all forms
of beverage alcohol, and should be treated on an equal basis by government.
Generally speaking, however, and especially in the U.S., distilled spirits
are subject to higher taxes per ounce of pure alcohol, are subject to more
severe restrictions on the places and hours of sale, and in some venues
(such as network TV) are denied the right to advertise. We seek to “level
the playing field” for beverage alcohol.
We also seek, for the convenience of our customers, Sunday sales in those
U.S. states that still ban them. We encourage rules that liberalize interna-
tional trade, so that we can expand our international business. We oppose
tax increases which make our products more expensive for our consumers,
and seek to diminish the tax advantage enjoyed by beer.
Taxes. Like all goods, beverage alcohol sales are sensitive to higher tax
rates and tax reforms. No legislation to increase U.S. federal excise taxes
on distilled spirits is currently pending, but future excise tax increases are
always possible, as are tax increases or changes levied on the broader
business community. From time to time, some city and state legislatures
increase beverage alcohol taxes. The cumulative effect of such tax
changes over time likely would hurt sales. Changes to the U.S. presidency
and Congress may lead to significant increases in taxes paid by beverage
alcohol producers, as well as the business community at large.
Increased tax rates, advertising restrictions, burdensome labeling
requirements, and outmoded product standards affect beverage alcohol in
many of our international markets as well. In the past, those changes have
not been significant to our overall business, but as our sales outside the U.S.
continue to grow and tax regimes in international markets become increas-
ingly onerous for our products, this risk becomes more pronounced. For
instance, the Australian government recently and unexpectedly imposed a
significant excise tax increase on spirits-based ready-to-drink products, which
could impede sales of Jack Daniel’s & Cola in that brand’s largest market.
The litigation climate. Courts have dismissed most of the recent putative
class action lawsuits against spirits, beer, and wine manufacturers, including
Brown-Forman, which alleged that our marketing causes illegal alcohol
consumption by persons under the legal drinking age. The cases not
dismissed have been withdrawn voluntarily, and that series of litigation is
concluded. However, the attorneys general in a number of U.S. states
continue to investigate the trade marketing practices of beverage alcohol
producers and wholesalers. Lawsuits or governmental investigations
similar to these could hurt our business and the overall industry.
Distribution strategy. We use a variety of business models to market and
distribute our products. In the U.S., we sell our products to wholesalers
through the mandatory three-tier system. In a number of other countries,
we rely on other spirits producers to distribute our products. Consolidation
among spirits producers overseas or wholesalers in the U.S. could hinder
the distribution of our wine and spirits products in the future, but to date
this has rarely happened. Wholesalers and distributors typically seek
to distribute our premium spirits and wine brands, and we expect that
demand to continue.
Exchange rates. The strength of foreign currencies relative to the U.S.
dollar affects sales and the cost of purchasing goods and services in our
other markets. This year, a weaker U.S. dollar helped our earnings,
particularly in the U.K., Continental Europe, and Australia. We have
hedged the majority of our exposure to foreign exchange fluctuation in
2009 by entering into foreign currency forwards and option contracts.
However, if the U.S. dollar appreciates significantly, any portion not
hedged would affect our business negatively.
management ’s discussion and analysis

29
Brown-Forman annual report 2008
DISCONTINUED OPERATIONS
SUMMARY Of OPERATING PERfORMANCE
(Dollars in millions, except per share amounts) 2006 2007 2008
Net sales $166 $ 50 $ —
Operating expenses (178) (53) —
Impairment charge (60) (9) —
Transaction costs (10) (1) —
Loss before income taxes (82) (13) —
Income tax benefit 7 2 —
Net loss from
discontinued operations $ (75) $ (11) $ —
Loss per share:
Basic (0.62) (0.09) —
Diluted (0.61) (0.09) —
As discussed in Note 2 to the accompanying financial statements, we sold
Lenox, Inc. during fiscal 2006, and sold Brooks & Bentley and Hartmann
in fiscal 2007. As a result, we have reported them as discontinued opera-
tions in the accompanying financial statements.
The net loss from discontinued operations in fiscal 2007 was $11 million
compared to a net loss of $75 million in fiscal 2006. Fiscal 2006 included
a pre-tax impairment charge and transaction costs totaling $70 million in
addition to a loss from the operations of Lenox Inc. incurred during the
period before the sale. The fiscal 2007 loss included a pre-tax impair-
ment charge of $9 million. The majority of this impairment related to
our decision to sell Hartmann and to focus our efforts entirely on our
beverage business. The $7 million pre-tax impairment charge associated
with Hartmann consisted of a goodwill impairment of $4 million and an
impairment charge of $3 million that represented the excess of the carry-
ing value of the net assets to be sold over the expected sales proceeds, net
of estimated selling costs.
Before we decided to sell Hartmann, no impairment charge was recorded
because we believed its operations would generate sufficient future cash
flows to enable us to fully recover its carrying amount. The decision to
sell Hartmann reflected the Board’s opinion that the sum of the price to
be obtained from the sale and the strategic value of focusing entirely on
our beverage business would be greater than the value of continuing to
operate Hartmann.
There was also a $2 million pre-tax impairment charge recorded for
Brooks & Bentley in fiscal 2007. This impairment charge reflected a revi-
sion to its estimated fair value and costs to sell, based on the negotiations
that resulted in its ultimate sale.
LIqUIDITY AND CAPITAL RESOURCES
Our ability to generate cash from operations consistently is one of our
most significant financial strengths. Our strong cash flows enable us to pay
dividends, pursue brand-building programs, and make strategic acquisi-
tions that we believe will enhance shareholder value. Investment grade
ratings of A2 from Moody’s and A from Standard & Poor’s provide us with
financial flexibility when accessing global credit markets. We believe cash
flows from operations are more than adequate to meet our expected
operating and capital requirements. In fiscal 2008, our cash flow from
operations and cash on hand enabled us to fund capital expenditures of
$53 million (including property, plant, and equipment and technology
software investments), to distribute $362 million to our shareholders
(including dividends and the special distribution in May 2007), and to
repurchase $223 million of our stock.
CASh fLOw SUMMARY
(Dollars in millions) 2006 2007 2008
Operating activities $343 $ 355 $ 534
Investing activities:
Acquisitions — (1,045) 2
Sale of discontinued operations 205 12 —
Net (purchase) sale of
short-term securities (160) 74 86
Additions to property, plant,
and equipment (51) (58) (41)
Other 3 (21) (19)
Subtotal Investing Activities (3) (1,038) 28
Financing activities:
Net (repayment)
issuance of debt (55) 597 (172)
Acquisition of treasury stock (3) — (223)
Special distribution to stockholders — — (204)
Dividends paid (128) (143) (158)
Other 26 33 21
Subtotal Financing Activities (160) 487 (736)
Foreign exchange effect — 4 10
Change in cash/cash equivalents $180 $(192) $(164)
Cash provided by operations was $534 million in fiscal 2008 compared to
$355 million in fiscal 2007. This increase was driven by higher earnings
and a reduction in working capital requirements compared to fiscal 2007,
including a refund of taxes received in fiscal 2008 related to the acquisi-
tion of Casa Herradura.
Cash provided by investing activities in fiscal 2008 increased $1,066
million compared to fiscal 2007, reflecting the $794 million acquisition
of Casa Herradura (including fees) in January 2007 and the $251 million
acquisition of Chambord in May 2006.
Cash used for financing activities increased by $1,223 million, primar-
ily reflecting a $769 million change in net debt compared to fiscal 2007
and a $204 million special distribution to shareholders in May 2007. The
increase in cash used for financing activities also reflects the repurchase of
$223 million of our common stock during fiscal 2008.
In comparing fiscal 2007 with fiscal 2006, cash provided by operations
increased $12 million, as a reduction in cash used for discontinued opera-
tions following the sale of Lenox, Inc. in fiscal 2006 and higher earnings
were partially offset by an increase in working capital requirements.
Cash used for investing activities increased by $1,035 million in fiscal 2007,
reflecting the acquisitions of Chambord and Casa Herradura for a total of
management ’s discussion and analysis
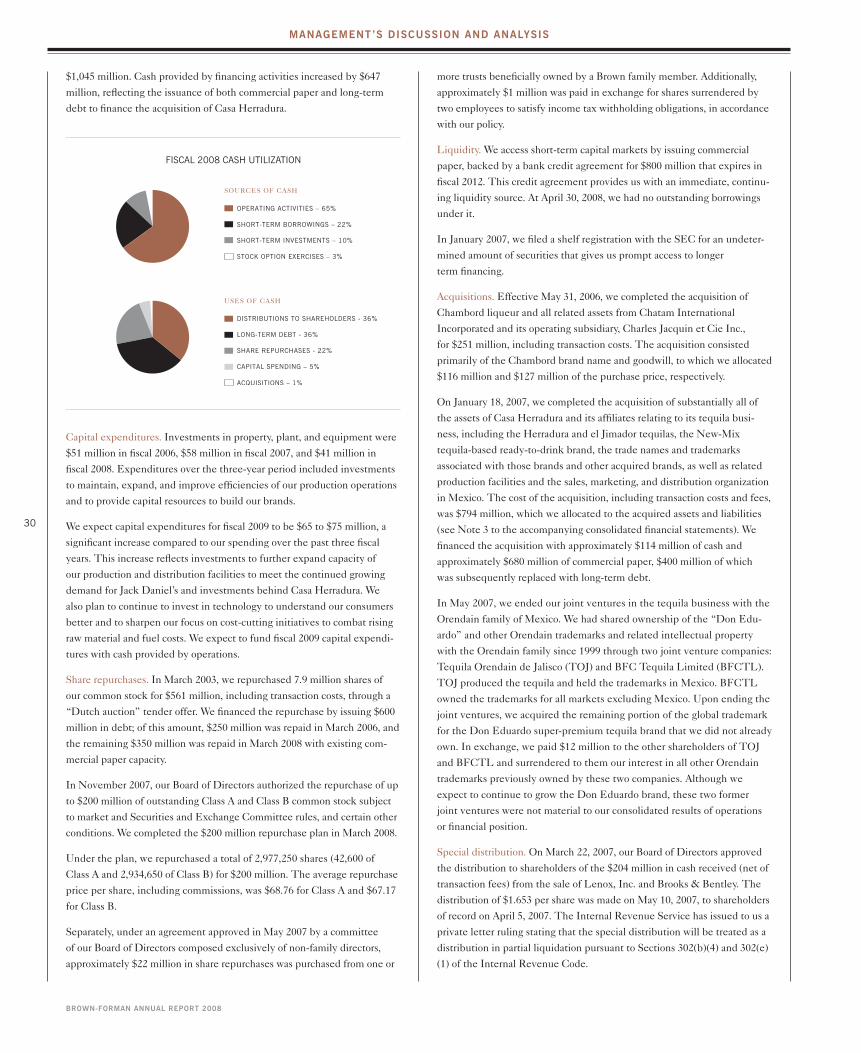
30
Brown-Forman annual report 2008
$1,045 million. Cash provided by financing activities increased by $647
million, reflecting the issuance of both commercial paper and long-term
debt to finance the acquisition of Casa Herradura.
Capital expenditures. Investments in property, plant, and equipment were
$51 million in fiscal 2006, $58 million in fiscal 2007, and $41 million in
fiscal 2008. Expenditures over the three-year period included investments
to maintain, expand, and improve efficiencies of our production operations
and to provide capital resources to build our brands.
We expect capital expenditures for fiscal 2009 to be $65 to $75 million, a
significant increase compared to our spending over the past three fiscal
years. This increase reflects investments to further expand capacity of
our production and distribution facilities to meet the continued growing
demand for Jack Daniel’s and investments behind Casa Herradura. We
also plan to continue to invest in technology to understand our consumers
better and to sharpen our focus on cost-cutting initiatives to combat rising
raw material and fuel costs. We expect to fund fiscal 2009 capital expendi-
tures with cash provided by operations.
Share repurchases. In March 2003, we repurchased 7.9 million shares of
our common stock for $561 million, including transaction costs, through a
“Dutch auction” tender offer. We financed the repurchase by issuing $600
million in debt; of this amount, $250 million was repaid in March 2006, and
the remaining $350 million was repaid in March 2008 with existing com-
mercial paper capacity.
In November 2007, our Board of Directors authorized the repurchase of up
to $200 million of outstanding Class A and Class B common stock subject
to market and Securities and Exchange Committee rules, and certain other
conditions. We completed the $200 million repurchase plan in March 2008.
Under the plan, we repurchased a total of 2,977,250 shares (42,600 of
Class A and 2,934,650 of Class B) for $200 million. The average repurchase
price per share, including commissions, was $68.76 for Class A and $67.17
for Class B.
Separately, under an agreement approved in May 2007 by a committee
of our Board of Directors composed exclusively of non-family directors,
approximately $22 million in share repurchases was purchased from one or
more trusts beneficially owned by a Brown family member. Additionally,
approximately $1 million was paid in exchange for shares surrendered by
two employees to satisfy income tax withholding obligations, in accordance
with our policy.
Liquidity. We access short-term capital markets by issuing commercial
paper, backed by a bank credit agreement for $800 million that expires in
fiscal 2012. This credit agreement provides us with an immediate, continu-
ing liquidity source. At April 30, 2008, we had no outstanding borrowings
under it.
In January 2007, we filed a shelf registration with the SEC for an undeter-
mined amount of securities that gives us prompt access to longer
term financing.
Acquisitions. Effective May 31, 2006, we completed the acquisition of
Chambord liqueur and all related assets from Chatam International
Incorporated and its operating subsidiary, Charles Jacquin et Cie Inc.,
for $251 million, including transaction costs. The acquisition consisted
primarily of the Chambord brand name and goodwill, to which we allocated
$116 million and $127 million of the purchase price, respectively.
On January 18, 2007, we completed the acquisition of substantially all of
the assets of Casa Herradura and its affiliates relating to its tequila busi-
ness, including the Herradura and el Jimador tequilas, the New-Mix
tequila-based ready-to-drink brand, the trade names and trademarks
associated with those brands and other acquired brands, as well as related
production facilities and the sales, marketing, and distribution organization
in Mexico. The cost of the acquisition, including transaction costs and fees,
was $794 million, which we allocated to the acquired assets and liabilities
(see Note 3 to the accompanying consolidated financial statements). We
financed the acquisition with approximately $114 million of cash and
approximately $680 million of commercial paper, $400 million of which
was subsequently replaced with long-term debt.
In May 2007, we ended our joint ventures in the tequila business with the
Orendain family of Mexico. We had shared ownership of the “Don Edu-
ardo” and other Orendain trademarks and related intellectual property
with the Orendain family since 1999 through two joint venture companies:
Tequila Orendain de Jalisco (TOJ) and BFC Tequila Limited (BFCTL).
TOJ produced the tequila and held the trademarks in Mexico. BFCTL
owned the trademarks for all markets excluding Mexico. Upon ending the
joint ventures, we acquired the remaining portion of the global trademark
for the Don Eduardo super-premium tequila brand that we did not already
own. In exchange, we paid $12 million to the other shareholders of TOJ
and BFCTL and surrendered to them our interest in all other Orendain
trademarks previously owned by these two companies. Although we
expect to continue to grow the Don Eduardo brand, these two former
joint ventures were not material to our consolidated results of operations
or financial position.
Special distribution. On March 22, 2007, our Board of Directors approved
the distribution to shareholders of the $204 million in cash received (net of
transaction fees) from the sale of Lenox, Inc. and Brooks & Bentley. The
distribution of $1.653 per share was made on May 10, 2007, to shareholders
of record on April 5, 2007. The Internal Revenue Service has issued to us a
private letter ruling stating that the special distribution will be treated as a
distribution in partial liquidation pursuant to Sections 302(b)(4) and 302(e)
(1) of the Internal Revenue Code.
dISTRIbUTIONS TO ShAREhOLdERS - 36%
LONG-TERM dEbT - 36%
ShARE REPURChASES - 22%
CAPITAL SPENdING – 5%
ACqUISITIONS – 1%
USES OF CASH
OPERATING ACTIvITIES – 65%
ShORT-TERM bORROwINGS – 22%
ShORT-TERM INvESTMENTS – 10%
STOCK OPTION ExERCISES – 3%
SOURCES OF CASH
fISCAL 2008 CASh UTILIzATION
management ’s discussion and analysis

31
Brown-Forman annual report 2008
LONG-TERM OBLIGATIONS
We have long-term obligations related to contracts, leases, employee
benefit plans, and borrowing arrangements that we enter into in the
normal course of business (see Notes 5, 7 and 12 to the accompanying
consolidated financial statements). The following table summarizes the
amounts of those obligations as of April 30, 2008, and the years when
those obligations must be paid:
LONG-TERM ObLIGATIONS(1)
2010- After (Dollars in millions) Total 2009 2013 2013
Long-term debt $ 421 $ 4 $414 $ 3
Interest on long-term debt 68 21 47 —
Grape purchase obligations 107 29 57 21
Operating leases 56 17 35 4
Postretirement benefit obligations(2) 7 7 n/a n/a
Agave purchase obligations(3) n/a n/a n/a n/a
Total $659 $ 78 $553 $28
(1) Excludes reserves for tax uncertainties as we are unable to reasonably predict the ultimate amount or timing of settlement
(2) As of April 30, 2008, we have unfunded pension and other postretirement benefit obligations of $105 million. Because the specific periods in which those obligations will be funded are not determinable, no amounts related to those obligations are reflected in the above table other than the $7 million of expected contribution in fiscal 2009. Historically, we have generally funded these obligations with the minimum annual contribution required by ERISA, but we may elect to contribute more than the minimum amount in future years.
(3) As discussed in Note 5 to the accompanying consolidated financial statements, we have obligations to purchase agave, a plant whose sap forms the raw material for tequila. Because the specific periods in which those obligations will be paid are not determinable, no amounts related to those obligations are reflected in the table above. However, as of April 30, 2008, based on current market prices, obligations under these contracts totaled $22 million.
We expect to meet these obligations with internally generated funds.
MARKET RISKS
We are exposed to market risks arising from adverse changes in com-
modity prices affecting the cost of our raw materials and energy, foreign
exchange rates, and interest rates. We try to manage risk responsibly
through a variety of strategies, including production initiatives and
hedging strategies. Our foreign currency hedging contracts are subject to
changes in exchange rates, our commodity futures and option contracts are
subject to changes in commodity prices, and some of our debt obligations
are subject to changes in interest rates. We discuss these contracts below
and also provide a sensitivity analysis.
See Note 5 to our consolidated financial statements for details on our
grape and agave purchase obligations, which are also exposed to commod-
ity price risk, and “Critical Accounting Estimates” for a discussion of our
pension and other postretirement plans’ exposure to interest rate risks.
See “Important Information Regarding Forward-Looking Statements”
(page 51) for details on how economic conditions affecting market risks
also affect the demand for and pricing of our products.
Foreign exchange. We estimate that our foreign currency revenues will
exceed our foreign currency expenses by $470 million in fiscal 2009. To the
extent that this foreign currency exposure is not hedged, our results of opera-
tions and financial position improve when the U.S. dollar weakens against
foreign currencies and decline when the dollar strengthens against them.
However, we routinely use foreign currency forward and option contracts
to hedge our foreign exchange risk. If these contracts work as intended,
we will not recognize any unrealized gains or losses on them until we rec-
ognize the underlying hedged transactions in earnings. At April 30, 2008,
our foreign currency hedges had a notional value of $342 million and a net
unrealized loss of $9 million.
With our hedging program, we estimate that, for the currencies in which
we do business, if the value of the U.S. dollar were to average 10% higher
in fiscal 2009 than in fiscal 2008, our fiscal 2009 operating income would
decrease by $19 million. Conversely, a 10% average decline in the value of
the dollar would increase operating income by $31 million.
Commodity prices. Commodity prices are affected by weather, supply and
demand conditions, and other geopolitical and economic variables. We use
futures contracts and options to reduce the price volatility of some com-
modities, primarily corn. At April 30, 2008, we had outstanding hedge
positions on approximately 3 million bushels of corn with unrealized
gains of $4 million. We estimate that a 10% decrease in corn prices would
reduce the unrealized gain at April 30, 2008, by $2 million. We expect
to mitigate the effect of increases in our raw material and energy costs
through our hedging strategies, ongoing production initiatives, and select
increases in prices for our brands.
Interest rates. Our short-term investments and our variable-rate debt are
exposed to the risk of changes in interest rates. We offset a portion of
this risk by entering into an interest rate swap which fixed the rate on
$75 million of our variable-rate notes for the nine-month period ending
July 1, 2008. Based on the April 30, 2008 balances of variable-rate debt
and investments, a 1% point increase in interest rates would increase our
annual interest expense (net of interest income on cash and short-term
investments) by $6 million.
CRITICAL ACCOUNTING ESTIMATES
Our financial statements reflect certain estimates involved in applying
the following critical accounting policies that entail uncertainties and
subjectivity. Using different estimates could have a material effect on
our operating results and financial condition.
Goodwill and other intangible assets. We have obtained most of our
brands through acquisitions from other companies. Upon acquisition,
the purchase price is first allocated to identifiable assets and liabilities,
including brand names and other intangible assets, based on estimated fair
value, with any remaining purchase price recorded as goodwill. Goodwill
and intangible assets with indefinite lives are not amortized. We consider
all of our brand names to have indefinite lives.
We assess our brand names and goodwill for impairment at least annually
to ensure that estimated future cash flows continue to exceed the related
book value. A brand name is impaired if its book value exceeds its fair
value. Goodwill is evaluated for impairment if the book value of its report-
ing unit exceeds its estimated fair value. Fair value is determined using
discounted estimated future cash flows, with consideration of market
values for similar assets when available. If the fair value of an evaluated
asset is less than its book value, the asset is written down to its estimated
fair value.
management ’s discussion and analysis

32
Brown-Forman annual report 2008
Considerable management judgment is necessary to assess impairment
and estimate fair value. The assumptions used in our evaluations, such as
forecasted growth rates and cost of capital, are consistent with our internal
projections and operating plans.
Property, plant, and equipment. We depreciate our property, plant, and
equipment on a straight-line basis using our estimates of useful life,
which are 20 to 40 years for buildings and improvements, 3 to 10 years for
machinery, equipment, vehicles, furniture, and fixtures, and 3 to 7 years
for capitalized software.
We assess our property, plant, and equipment and other long-lived assets
for impairment whenever events or changes in circumstances indicate that
the carrying value of the asset or asset group may not be recoverable. Fair
value is determined using discounted estimated future cash flows, with
consideration of market values for similar assets when available. If the fair
value of an evaluated asset is less than its book value, we write it down to
its estimated fair value.
Considerable management judgment is necessary to assess impairment
and estimate fair value. Assumptions used in these evaluations are consis-
tent with our internal projections and operating plans.
Pension and other postretirement benefits. We sponsor various defined
benefit pension plans as well as postretirement plans providing retiree
health care and retiree life insurance benefits. Benefits are based on such
factors as years of service and compensation level during employment.
The benefits expected to be paid are expensed over the employees’ expected
service. This requires us to make certain assumptions to determine the
net benefit expense and obligations, such as interest rates, return on plan
assets, the rate of salary increases, expected service, and health care cost
trend rates.
The assets, obligations, and assumptions used to measure pension and
retiree medical expenses are determined as of January 31 of the preced-
ing year (“measurement date”). Because obligations are measured on
a discounted basis, the discount rate is a significant assumption. It is
based on interest rates for high-quality, long-term corporate debt at each
measurement date. The expected return on pension plan assets is based
on our historical experience and our expectations for long-term rates of
return. The other assumptions also reflect our historical experience and
management’s best judgment regarding future expectations. We review
our assumptions on each annual measurement date. As of April 30, 2008,
we have increased the discount rate for pension obligations from 6.04%
to 6.64%, and for other postretirement benefit obligations from 5.98% to
6.45%. Pension and postretirement benefit expense for fiscal 2009 is esti-
mated to be approximately $20 million, compared to $25 million for fiscal
2008. A decrease/increase in the discount rate of 25 basis points would
increase/decrease the fiscal 2009 expense by approximately $2 million.
Income taxes. Our annual effective tax rate is based on our income and
the statutory tax rates in the various jurisdictions where we do business.
In fiscal 2008, our annual income tax rate for continuing operations was
31.7%, unchanged from fiscal 2007. During fiscal 2008, our effective tax
rate was favorably affected by an increase in the net reversal of uncertain
tax positions in accordance with the effective settlement of each item.
This positive factor was offset primarily by additional taxes related to a
tax law change in Mexico (effective January 1, 2008) and the absence of
benefits received in fiscal 2007 from investments in tax-exempt securities.
Significant judgment is required in evaluating our tax positions. We
establish reserves when we believe that certain positions are likely to be
challenged and may not succeed, despite our belief that our tax return
positions are fully supportable. We adjust these reserves in light of chang-
ing circumstances, such as the progress of a tax audit. We believe current
reserves are appropriate for all known contingencies, but this situation
could change.
Several years can elapse before we can resolve a particular matter for
which we have established a reserve. Although predicting the final out-
come or the timing of resolution of any particular tax matter can be
difficult, we believe that our reserves reflect the likely outcome of known
tax contingencies. Unfavorable settlement of any particular issue could
require use of our cash; whereas a favorable resolution could result in
either reduced cash tax payments, or the reversal of previously established
reserves or some combination of these which could result in a reduction to
our effective tax rate upon resolution.
Contingencies. We operate in a litigious environment, and we are sued
in the normal course of business. Sometimes plaintiffs seek substantial
damages. Significant judgment is required in predicting the outcome of
these suits and claims, many of which take years to adjudicate. We accrue
estimated costs for a contingency when we believe that a loss is probable
and we can make a reasonable estimate of the loss, and adjust the accrual
as appropriate to reflect changes in facts and circumstances.
Brown-Forman Corporation and many other manufacturers of spirits,
wine, and beer were defendants in a series of nine essentially identical
putative class action lawsuits that began in 2003 seeking damages and
injunctive relief for alleged marketing of beverage alcohol to underage
consumers. As each of these cases has been dismissed or withdrawn, the
last in November 2007, this series of litigation is concluded.
Recent accounting pronouncements. See Note 1 to the accompanying
consolidated financial statements.
management ’s discussion and analysis

33
Brown-Forman annual report 2008
(Expressed in millions, except per share amounts)
Year Ended April 30, 2006 2007 2008
Net sales $2,412 $2,806 $3,282
Excise taxes 468 588 700
Cost of sales 636 737 887
GROSS PROfIT 1,308 1,481 1,695
Advertising expenses 323 361 415
Selling, general, and administrative expenses 469 535 592
Amortization expense — 2 5
Other income, net (47) (19) (2)
OPERATING INCOME 563 602 685
Interest income 14 18 8
Interest expense 18 34 49
INCOME fROM CONTINUING OPERATIONS bEfORE INCOME TAxES 559 586 644
Income taxes 164 186 204
INCOME fROM CONTINUING OPERATIONS 395 400 440
Loss from discontinued operations, net of income taxes (75) (11) —
NET INCOME $ 320 $ 389 $ 440
Basic earnings (loss) per share:
Continuing operations $3.24 $3.26 $3.59
Discontinued operations (0.62) (0.09) —
TOTAL $2.62 $3.17 $3.59
Diluted earnings (loss) per share:
Continuing operations $3.20 $3.22 $3.55
Discontinued operations (0.61) (0.09) —
TOTAL $2.60 $3.14 $3.56
Note: Earnings (loss) per share amounts for continuing operations and discontinued operations may not add to total amount for the company due to rounding.
The accompanying notes are an integral part of the consolidated financial statements.
consolidated statements oF operations

34
Brown-Forman annual report 2008
(Expressed in millions, except share and per share amounts)
April 30, 2007 2008
ASSETS
Cash and cash equivalents $ 283 $ 119
Short-term investments 86 —
Accounts receivable, less allowance for doubtful accounts of $22 in 2007 and $19 in 2008 404 453
Inventories:
Barreled whiskey 303 311
Finished goods 151 155
Work in process 198 179
Raw materials and supplies 42 40
Total inventories 694 685
Current portion of deferred income taxes 76 102
Other current assets 92 97
TOTAL CURRENT ASSETS 1,635 1,456
Property, plant, and equipment, net 506 501
Prepaid pension cost 23 23
Goodwill 670 688
Other intangible assets 684 699
Other assets 33 38
TOTAL ASSETS $3,551 $3,405
LIAbILITIES
Accounts payable and accrued expenses $ 361 $ 380
Accrued income taxes 27 15
Payable to stockholders 204 —
Short-term borrowings 401 585
Current portion of long-term debt 354 4
TOTAL CURRENT LIAbILITIES 1,347 984
Long-term debt, less unamortized discount of $1 in 2007 and $0 in 2008 422 417
Deferred income taxes 56 89
Accrued pension and other postretirement benefits 123 121
Other liabilities 30 69
TOTAL LIAbILITIES 1,978 1,680
Commitments and contingencies
STOCKhOLdERS’ EqUITY
Common stock:
Class A, voting, $0.15 par value (57,000,000 shares authorized; 56,925,000 shares issued) 9 9
Class B, nonvoting, $0.15 par value (100,000,000 shares authorized; 69,188,000 shares issued) 10 10
Additional paid-in capital 64 74
Retained earnings 1,649 1.931
Accumulated other comprehensive income (loss):
Pension and other postretirement benefits adjustment (99) (88)
Cumulative translation adjustment 46 99
Unrealized loss on cash flow hedge contracts (4) (6)
Treasury stock, at cost (2,833,000 and 5,522,000 shares in 2007 and 2008, respectively) (102) (304)
TOTAL STOCKhOLdERS’ EqUITY 1,573 1,725
TOTAL LIAbILITIES ANd STOCKhOLdERS’ EqUITY $3,551 $3,405
The accompanying notes are an integral part of the consolidated financial statements.
consolidated Balance sHeets

35
Brown-Forman annual report 2008
(Expressed in millions)
Year Ended April 30, 2006 2007 2008
CASh fLOwS fROM OPERATING ACTIvITIES
Net income $320 $389 $440
Adjustments to reconcile net income to net cash provided by operations:
Net loss from discontinued operations 75 11 —
Depreciation and amortization 42 44 52
Stock-based compensation expense 9 8 10
Deferred income taxes (33) (7) 5
Other (2) (11) (3)
Change in assets and liabilities, excluding the effects of businesses acquired or sold:
Accounts receivable (21) (47) (43)
Inventories (37) (41) (3)
Other current assets (7) (9) (4)
Accounts payable and accrued expenses 3 14 21
Accrued income taxes 7 (20) (12)
Noncurrent assets and liabilities 5 18 71
Net cash provided by (used for) operating activities of discontinued operations (18) 6 —
Cash provided by operating activities 343 355 534
CASh fLOwS fROM INvESTING ACTIvITIES
Acquisition of businesses, net of cash acquired — (1,045) 2
Acquisition of distribution rights — (25) —
Ac quisition of brand names and trademarks (1) — (13)
Proceeds from sale of discontinued operations 205 12 —
Purchase of short-term investments (388) (249) —
Sale of short-term investments 228 323 86
Additions to property, plant, and equipment (51) (58) (41)
Proceeds from sale of property, plant, and equipment 7 14 6
Computer software expenditures — (9) (12)
Net cash used for investing activities of discontinued operations (3) (1) —
Cash (used for) provided by investing activities (3) (1,038) 28
CASh fLOwS fROM fINANCING ACTIvITIES
Net change in short-term borrowings 225 178 184
Proceeds from long-term debt — 421 —
Repayment of long-term debt (280) (2) (356)
Debt issuance costs — (2) —
Proceeds from exercise of stock options 19 27 11
Excess tax benefits from stock options 7 8 10
Acquisition of treasury stock (3) — (223)
Special distribution to stockholders — — (204)
Dividends paid (128) (143) (158)
Cash (used for) provided by financing activities (160) 487 (736)
Effect of exchange rate changes on cash and cash equivalents — 4 10
Net increase (decrease) in cash and cash equivalents 180 (192) (164)
Cash and cash equivalents, beginning of year 295 475 283
Cash and cash equivalents, end of year $475 $283 $119
SUPPLEMENTAL dISCLOSURE Of CASh PAId fOR:
Interest $ 21 $ 32 $ 50
Income taxes $188 $205 $236
The accompanying notes are an integral part of the consolidated financial statements.
consolidated statements oF casH Flows

36
Brown-Forman annual report 2008
(Dollars expressed in millions, except per share amounts)
Year Ended April 30, 2006 2007 2008
CLASS A COMMON STOCK $ 9 $ 9 $ 9
CLASS b COMMON STOCK 10 10 10
AddITIONAL PAId-IN CAPITAL
Balance at beginning of year 34 47 64
Stock issued under compensation plans — 2 3
Stock-based compensation expense 8 6 6
Adjustment for stock option exercises (3) 1 (9)
Excess tax benefits from stock options 8 8 10
Balance at end of year 47 64 74
RETAINEd EARNINGS
Balance at beginning of year 1,415 1,607 1,649
Net income 320 389 440
Cash dividends ($1.05, $1.165, and $1.285 per share, in 2006, 2007, and 2008, respectively) (128) (143) (158)
Special cash distribution to stockholders ($1.6533 per share in 2007) — (204) —
Balance at end of year 1,607 1,649 1,931
TREASURY STOCK, AT COST
Balance at beginning of year (147) (128) (102)
Acquisition of treasury stock (3) — (223)
Stock issued under compensation plans 21 24 17
Stock-based compensation expense 1 2 4
Balance at end of year (128) (102) (304)
ACCUMULATEd OThER COMPREhENSIvE INCOME (LOSS)
Balance at beginning of year (11) 18 (57)
Net other comprehensive income 29 19 62
Adjustment to initially apply SFAS 158, net of tax of $60 (Note 12) — (94) —
Balance at end of year 18 (57) 5
TOTAL STOCKhOLdERS’ EqUITY $1,563 $1,573 $1,725
COMPREhENSIvE INCOME
Net income $ 320 $ 389 $ 440
Other comprehensive income (loss):
Foreign currency translation adjustment (3) 22 53
Pension and other postretirement benefits adjustment, net of tax
of $(21), $1, and $9 in 2006, 2007, and 2008, respectively 33 (1) 11
Amounts related to cash flow hedges:
Reclassification to earnings, net of tax of $2, $(2), and $(4) in 2006, 2007, and 2008, respectively (4) 3 7
Net gain (loss) on hedging instruments, net of tax of $(2), $3, and $6 in 2006, 2007, and 2008, respectively 3 (6) (9)
Net other comprehensive income 29 18 62
Total comprehensive income $ 349 $ 407 $ 502
CLASS A COMMON ShARES OUTSTANdING (IN ThOUSANdS)
Balance at beginning of year 56,782 56,829 56,870
Acquisition of treasury stock — — (340)
Stock issued under compensation plans 47 41 43
Balance at end of year 56,829 56,870 56,573
CLASS b COMMON ShARES OUTSTANdING (IN ThOUSANdS)
Balance at beginning of year 65,106 65,636 66,367
Acquisition of treasury stock (91) — (2,937)
Stock issued under compensation plans 621 731 589
Balance at end of year 65,636 66,367 64,019
TOTAL COMMON ShARES OUTSTANdING (IN ThOUSANdS) 122,465 123,237 120,592
The accompanying notes are an integral part of the consolidated financial statements.
consolidated statements oF stocKHolders’ eQuity

37
Brown-Forman annual report 2008
1. ACCOUNTING POLICIES We apply the following accounting policies
when preparing our consolidated financial statements. References to
“FASB” are to the Financial Accounting Standards Board, the private-
sector organization that establishes financial accounting and reporting
standards, including Statements of Financial Accounting Standards (SFAS).
Principles of consolidation. Our consolidated financial statements include
the accounts of all wholly-owned and majority-owned subsidiaries. We use
the equity method to account for investments in affiliates over which we
can exercise significant influence (but not control). We carry all other invest-
ments in affiliates at cost. We eliminate all intercompany transactions.
Cash equivalents. Cash equivalents include bank demand deposits and all
highly liquid investments with original maturities of three months or less.
Short-term investments. Short-term investments consist of auction rate
securities and variable-rate demand notes. These investments are classified
as available-for-sale and recorded at cost, which approximated fair value.
Allowance for doubtful accounts. We evaluate the collectibility of accounts
receivable based on a combination of factors. When we are aware of
circumstances that may impair a specific customer’s ability to meet its
financial obligations, we record a specific allowance to reduce the net rec-
ognized receivable to the amount we reasonably believe will be collected.
Inventories. We state inventories at the lower of cost or market, with
approximately 62% of consolidated inventories being valued using the
last-in, first-out (LIFO) method. Other inventories are valued using the
first-in, first-out (FIFO) method. If the FIFO method had been used,
inventories would have been $126 and $150 higher than reported at
April 30, 2007 and 2008, respectively. FIFO cost approximates current
replacement cost.
Whiskey must be barrel-aged for several years, so we bottle and sell only
a portion of our whiskey inventory each year. Following industry practice,
we classify all barreled whiskey as a current asset. We include warehous-
ing, insurance, ad valorem taxes, and other carrying charges applicable to
barreled whiskey in inventory costs.
We classify bulk wine and agave inventories as work in process.
Property, plant, and equipment. We state property, plant, and equipment
at cost less accumulated depreciation. We calculate depreciation on a
straight-line basis over the estimated useful lives of the assets as follows:
20 to 40 years for buildings and improvements; 3 to 10 years for machin-
ery, equipment, vehicles, furniture, and fixtures; and 3 to 7 years for
capitalized software costs.
We assess our property, plant, and equipment and other long-lived assets
for impairment whenever events or changes in circumstances indicate that
the carrying value of the asset or asset group may not be recoverable. Fair
value is determined using discounted estimated future cash flows, with
consideration of market values for similar assets when available. If the fair
value of an evaluated asset is less than its book value, we write it down to
its estimated fair value.
Goodwill and other intangible assets. We assess our goodwill and other
intangible assets for impairment at least annually. If the fair value of an
evaluated asset is less than its book value, the asset is written down to its
estimated fair value. Fair value is determined using discounted estimated
future cash flows, with consideration of market values for similar assets
when available.
Foreign currency translation. The U.S. dollar is the functional currency
for most of our consolidated operations. For those operations, we report all
gains and losses from foreign currency transactions in current income. The
local currency is the functional currency for some foreign operations. For
those investments, we report cumulative translation effects as a compo-
nent of accumulated other comprehensive income (loss), a component of
stockholders’ equity.
Revenue recognition. We recognize revenue when title and risk of loss
pass to the customer, which typically is at the time the product is shipped.
Certain sales contain customer acceptance provisions that grant a right
of return on the basis of either subjective criteria or specified objective
criteria. Revenue is recorded net of the estimated cost of sales returns
and allowances.
Sales discounts. Sales discounts, which are recorded as a reduction of net
sales, totaled $157, $242, and $303 for 2006, 2007, and 2008, respectively.
Cost of sales. Cost of sales includes the costs of receiving, producing,
inspecting, warehousing, insuring, and shipping goods sold during
the period.
Shipping and handling fees and costs. We report the amounts we bill to
our customers for shipping and handling as net sales, and we report the
costs we incur for shipping and handling as cost of sales.
Advertising costs. We expense the costs of advertising during the year in
which the advertisements first take place.
Selling, general, and administrative expenses. Selling, general, and
administrative expenses include the costs associated with our sales force,
administrative staff and facilities, and other expenses related to the non-
manufacturing functions of our business.
Earnings per share. Basic earnings per share is based upon the weighted
average number of all common shares outstanding during the period.
Diluted earnings per share includes the dilutive effect of stock-based
compensation awards, including stock options, stock-settled stock appre-
ciation rights (SSARs), and non-vested restricted stock.
notes to consolidated Financial statements (dollars Expressed In Millions, Except Per Share Amounts)
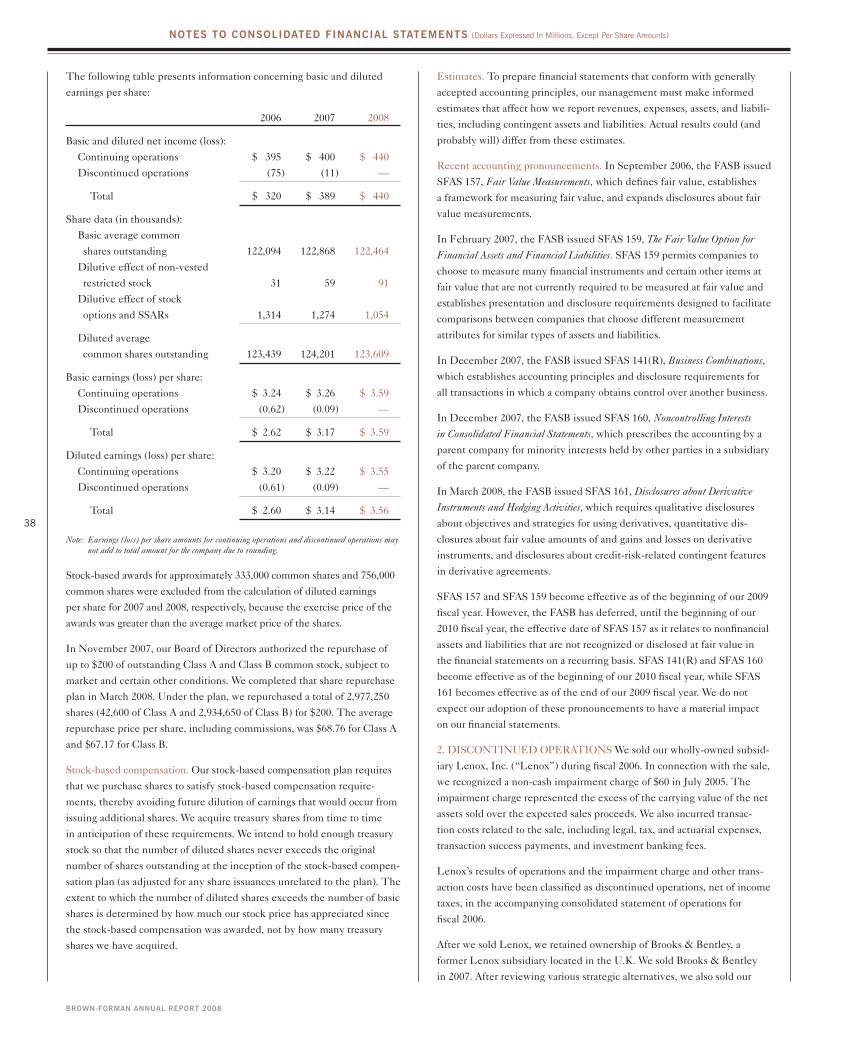
38
Brown-Forman annual report 2008
The following table presents information concerning basic and diluted
earnings per share:
2006 2007 2008
Basic and diluted net income (loss):
Continuing operations $ 395 $ 400 $ 440
Discontinued operations (75) (11) —
Total $ 320 $ 389 $ 440
Share data (in thousands):
Basic average common
shares outstanding 122,094 122,868 122,464
Dilutive effect of non-vested
restricted stock 31 59 91
Dilutive effect of stock
options and SSARs 1,314 1,274 1,054
Diluted average
common shares outstanding 123,439 124,201 123,609
Basic earnings (loss) per share:
Continuing operations $ 3.24 $ 3.26 $ 3.59
Discontinued operations (0.62) (0.09) —
Total $ 2.62 $ 3.17 $ 3.59
Diluted earnings (loss) per share:
Continuing operations $ 3.20 $ 3.22 $ 3.55
Discontinued operations (0.61) (0.09) —
Total $ 2.60 $ 3.14 $ 3.56
Note: Earnings (loss) per share amounts for continuing operations and discontinued operations may not add to total amount for the company due to rounding.
Stock-based awards for approximately 333,000 common shares and 756,000
common shares were excluded from the calculation of diluted earnings
per share for 2007 and 2008, respectively, because the exercise price of the
awards was greater than the average market price of the shares.
In November 2007, our Board of Directors authorized the repurchase of
up to $200 of outstanding Class A and Class B common stock, subject to
market and certain other conditions. We completed that share repurchase
plan in March 2008. Under the plan, we repurchased a total of 2,977,250
shares (42,600 of Class A and 2,934,650 of Class B) for $200. The average
repurchase price per share, including commissions, was $68.76 for Class A
and $67.17 for Class B.
Stock-based compensation. Our stock-based compensation plan requires
that we purchase shares to satisfy stock-based compensation require-
ments, thereby avoiding future dilution of earnings that would occur from
issuing additional shares. We acquire treasury shares from time to time
in anticipation of these requirements. We intend to hold enough treasury
stock so that the number of diluted shares never exceeds the original
number of shares outstanding at the inception of the stock-based compen-
sation plan (as adjusted for any share issuances unrelated to the plan). The
extent to which the number of diluted shares exceeds the number of basic
shares is determined by how much our stock price has appreciated since
the stock-based compensation was awarded, not by how many treasury
shares we have acquired.
Estimates. To prepare financial statements that conform with generally
accepted accounting principles, our management must make informed
estimates that affect how we report revenues, expenses, assets, and liabili-
ties, including contingent assets and liabilities. Actual results could (and
probably will) differ from these estimates.
Recent accounting pronouncements. In September 2006, the FASB issued
SFAS 157, Fair Value Measurements, which defines fair value, establishes
a framework for measuring fair value, and expands disclosures about fair
value measurements.
In February 2007, the FASB issued SFAS 159, The Fair Value Option for
Financial Assets and Financial Liabilities. SFAS 159 permits companies to
choose to measure many financial instruments and certain other items at
fair value that are not currently required to be measured at fair value and
establishes presentation and disclosure requirements designed to facilitate
comparisons between companies that choose different measurement
attributes for similar types of assets and liabilities.
In December 2007, the FASB issued SFAS 141(R), Business Combinations,
which establishes accounting principles and disclosure requirements for
all transactions in which a company obtains control over another business.
In December 2007, the FASB issued SFAS 160, Noncontrolling Interests
in Consolidated Financial Statements, which prescribes the accounting by a
parent company for minority interests held by other parties in a subsidiary
of the parent company.
In March 2008, the FASB issued SFAS 161, Disclosures about Derivative
Instruments and Hedging Activities, which requires qualitative disclosures
about objectives and strategies for using derivatives, quantitative dis-
closures about fair value amounts of and gains and losses on derivative
instruments, and disclosures about credit-risk-related contingent features
in derivative agreements.
SFAS 157 and SFAS 159 become effective as of the beginning of our 2009
fiscal year. However, the FASB has deferred, until the beginning of our
2010 fiscal year, the effective date of SFAS 157 as it relates to nonfinancial
assets and liabilities that are not recognized or disclosed at fair value in
the financial statements on a recurring basis. SFAS 141(R) and SFAS 160
become effective as of the beginning of our 2010 fiscal year, while SFAS
161 becomes effective as of the end of our 2009 fiscal year. We do not
expect our adoption of these pronouncements to have a material impact
on our financial statements.
2. DISCONTINUED OPERATIONS We sold our wholly-owned subsid-
iary Lenox, Inc. (“Lenox”) during fiscal 2006. In connection with the sale,
we recognized a non-cash impairment charge of $60 in July 2005. The
impairment charge represented the excess of the carrying value of the net
assets sold over the expected sales proceeds. We also incurred transac-
tion costs related to the sale, including legal, tax, and actuarial expenses,
transaction success payments, and investment banking fees.
Lenox’s results of operations and the impairment charge and other trans-
action costs have been classified as discontinued operations, net of income
taxes, in the accompanying consolidated statement of operations for
fiscal 2006.
After we sold Lenox, we retained ownership of Brooks & Bentley, a
former Lenox subsidiary located in the U.K. We sold Brooks & Bentley
in 2007. After reviewing various strategic alternatives, we also sold our
notes to consolidated Financial statements (dollars Expressed In Millions, Except Per Share Amounts)

39
Brown-Forman annual report 2008
wholly-owned subsidiary Hartmann, Inc. (“Hartmann”) in 2007. Accordingly,
the operating results of Brooks & Bentley and Hartmann are classified as
discontinued operations in the accompanying consolidated statements of
operations. The results of discontinued operations for 2007 include a $9
impairment charge. The majority of this impairment relates to the deci-
sion made in 2007 by our Board of Directors to sell Hartmann and to focus
our efforts entirely on our beverage business. The $7 pre-tax impairment
charge associated with Hartmann consisted of a goodwill impairment of $4
and an impairment charge of $3 that represented the excess of the carry-
ing value of the net assets to be sold over the expected sales proceeds, net
of estimated costs to sell.
Before we decided to sell Hartmann, no impairment charge was recorded
because we believed its operations would generate sufficient future cash
flows to enable us to fully recover its carrying amount. The decision to
sell Hartmann reflected the Board’s opinion that the sum of the price to
be obtained from the sale and the strategic value of focusing entirely on
our beverage business would be greater than the value of continuing to
operate Hartmann.
There was also a $2 pre-tax impairment charge recorded in 2007 for
Brooks & Bentley. This impairment charge reflected a revision to its
estimated fair value and costs to sell, based on the negotiations that
resulted in its ultimate sale.
A summary of discontinued operations follows:
Year Ended April 30, 2006 2007 2008
Net sales $166 $ 50 $ —
Operating expenses (178) (53) —
Impairment charge (60) (9) —
Transaction costs (10) (1) —
Loss before income taxes (82) (13) —
Income tax benefit 7 2 —
Net loss from
discontinued operations $ (75) $ (11) $ —
3. ACqUISITIONS We have completed the following acquisitions over
the past three years. The operating results of each acquired entity have
been consolidated with our financial statements since their respective
acquisition dates. Consolidated pro forma operating results would not
have been materially different from the actual amounts reported.
Chambord Liqueur. In May 2006, we completed the acquisition of Cham-
bord liqueur and all related assets from Chatam International Incorporated
and its operating subsidiary, Charles Jacquin et Cie Inc., for $251, includ-
ing transaction costs. We believe that Chambord, which is positioned in
the super-premium spirits category, fits well with our approach to brand
building. With the close of the transaction, we acquired the Chambord
trademark, French manufacturing operations where the brand is pro-
duced, and the services of employees who work at the facility.
The acquisition consisted primarily of the Chambord brand name and
goodwill, to which we allocated $116 and $127 of the purchase price,
respectively. The transaction provides valuable strategic opportunities,
which we believe will enable us to leverage our strong brand-building
skills and our current distribution network, allowing us to grow sales of
this super-premium priced product around the world. We also believe that
the brand will provide us with additional distributor influence and that
it complements several other brands in our portfolio, allowing for cross-
selling, merchandising, and promotion, which we expect will lead to
overall increased sales. These factors contributed to a purchase price that
resulted in the recognition of $127 of goodwill. The entire amount allocated
to goodwill is deductible for income tax purposes.
Casa Herradura. In January 2007, we completed the acquisition contem-
plated in an August 2006 asset purchase agreement among Jose Guillermo
Romo de la Peña; Luis Pedro Pablo Romo de la Peña; Grupo Industrial
Herradura, S.A. de C.V. (“Casa Herradura”); certain of their respective
affiliates; Brown-Forman; and Brown-Forman Tequila Mexico, S. de R.L.
de C.V., a subsidiary of Brown-Forman. We acquired substantially all of the
assets of Casa Herradura and its affiliates relating to its tequila business,
including the Herradura and el Jimador tequilas, the New-Mix tequila-
based ready-to-drink brand, the trade names and trademarks associated with
such brands and other acquired brands, as well as related production facili-
ties and the sales, marketing, and distribution organization in Mexico.
We believe this acquisition provides us with several strategic opportuni-
ties, including the ownership of two strong, established brands, Herradura
and el Jimador, which compete at the super-premium and premium
levels, respectively, in the world’s largest tequila markets – the U.S. and
Mexico. In addition, we believe the growth potential for these brands is
very attractive based on the fact that tequila is one of the fastest-growing
spirits category in both markets. We expect these brands will help advance
our entire business within the Hispanic population, which is the fastest
growing demographic segment in the U.S., and increase our participa-
tion in the popular cocktail culture of the U.S., where the tequila-based
margarita is the most frequently called-for mixed drink. We believe the el
Jimador ready-to-drink brand extension, New Mix, which is the category
leader in the Mexican market, also has growth potential. We also believe
the infrastructure in Mexico will give us a strong business platform to
advance our portfolio in an important international market where we
have historically had very little presence. We expect to leverage our cur-
rent distribution network outside of Mexico, allowing us to grow sales
of these super-premium and premium brands in the U.S. and to expand
the brands’ presence in the rest of the world, where the opportunities for
growth appear numerous given the very limited distribution of tequila.
Finally, by expanding and diversifying our portfolio, we believe that these
brands will provide us with additional clout with our distributors and that
the brands’ performance will benefit significantly from our strong brand-
building skills. These factors contributed to a purchase price that resulted
in the recognition of the goodwill shown on the next page.
notes to consolidated Financial statements (dollars Expressed In Millions, Except Per Share Amounts)

40
Brown-Forman annual report 2008
The cost of the acquisition was $794, including transaction costs of $16,
and was allocated based on management’s estimates as follows:
Cash $ 2
Accounts receivable 39
Inventories 124
Other current assets 48
Property, plant, and equipment 65
Deferred income taxes 4
Goodwill 355
Trademarks and brand names 215
Total assets 852
Accounts payable and accrued expenses 52
Long-term debt 1
Other noncurrent liabilities 5
Total liabilities 58
Net assets acquired $794
Standard valuation procedures were used in determining the fair value
of the acquired trademarks and brand names, which were determined to
have indefinite lives. We expect the entire goodwill amount of $355 to be
deductible for tax purposes.
We financed the acquisition with approximately $114 of cash and approxi-
mately $680 of commercial paper, $400 of which was subsequently
replaced with long-term debt.
4. GOODWILL AND OTHER INTANGIBLE ASSETS The following
table shows the changes in the amounts recorded as goodwill over the past
two years:
Balance as of April 30, 2006 $192
Acquisition of Chambord (Note 3) 127
Acquisition of Casa Herradura (Note 3) 346
Foreign currency translation adjustment 5
Balance as of April 30, 2007 670
Casa Herradura purchase price finalization 8
Foreign currency translation adjustment 10
Balance as of April 30, 2008 $688
In May 2007, we ended our joint ventures in the tequila business with the
Orendain family of Mexico. We had shared ownership of the “Don Eduardo”
and other “Orendain” trademarks and related intellectual property with
the Orendain family since 1999 through two joint venture companies:
Tequila Orendain de Jalisco (TOJ) and BFC Tequila Limited (BFCTL).
TOJ produced the tequila and held the trademarks in Mexico. BFCTL
owned the trademarks for all markets excluding Mexico. Upon ending the
joint ventures (which were not material to our consolidated results of
operations or financial position), we acquired the remaining portion of the
global trademark for the Don Eduardo super-premium tequila brand that
we did not already own. In exchange, we paid $12 to the other shareholders
of TOJ and BFCTL and surrendered to them our interest in all other
Orendain trademarks previously owned by these two companies.
As of April 30, 2007 and 2008, our other intangible assets consisted of:
Gross Carrying Accumulated Amount Amortization 2007 2008 2007 2008
Finite-lived intangible assets:
Customer relationships $ 4 $ — $ — $ —
Distribution rights 25 25 (2) (7)
$ 29 $ 25 $ (2) $ (7)
Indefinite-lived intangible assets:
Trademarks and brand names $ 657 $681 $ — $ —
Amortization expense related to intangible assets was $2 in 2007 and $5
in 2008. We expect to recognize amortization expense of $5 in 2009, $5 in
2010, $5 in 2011, and $3 in 2012. However, actual amounts of future amor-
tization expense may differ due to additional intangible asset acquisitions,
impairment of intangible assets, accelerated amortization of intangible
assets, purchase price reallocations, and other events.
5. COMMITMENTS We have contracted with various growers and
wineries to supply some of our future grape and bulk wine requirements.
Many of these contracts call for prices to be determined by market condi-
tions, but some contracts provide for minimum purchase prices that may
exceed market prices. We have total purchase obligations related to both
types of contracts of $29 in 2009, $22 in 2010, $16 in 2011, $11 in 2012,
$8 in 2013, and $21 after 2013.
We also have contracts for the purchase of agave, which is used to produce
tequila. These contracts provide for prices to be determined based on
market conditions at the time of harvest, which, although not specified,
is expected to occur over the next 10 years. As of April 30, 2008, based on
current market prices, obligations under these contracts totaled $22.
We made rental payments for real estate, vehicles, and office, computer,
and manufacturing equipment under operating leases of $16 in 2006, $19
in 2007, and $19 in 2008. We have commitments related to minimum lease
payments of $17 in 2009, $14 in 2010, $11 in 2011, $6 in 2012, $4 in 2013,
and $4 after 2013.
6. CREDIT FACILITIES We have a committed revolving credit agree-
ment with various domestic and international banks for $800 that expires
in fiscal 2012. Its most restrictive covenant requires that our consolidated
EBITDA (as defined in the agreement) to consolidated interest expense
not be less than a ratio of 3 to 1. At April 30, 2008, we were within this
covenant’s parameters. At April 30, 2008, we also had the ability to issue
an undetermined amount of debt securities under an SEC shelf registra-
tion filed in January 2007.
notes to consolidated Financial statements (dollars Expressed In Millions, Except Per Share Amounts)

41
Brown-Forman annual report 2008
7. DEBT Our long-term debt consisted of the following:
April 30, 2007 2008
3.0% notes, due in fiscal 2008 $350 $ —
Variable-rate notes, due in fiscal 2010 150 150
5.20% notes, due in fiscal 2012 250 250
Other 26 21
776 421
Less current portion 354 4
$422 $417
Debt payments required over the next five fiscal years consist of $4 in
2009, $154 in 2010, $4 in 2011, $253 in 2012, and $3 in 2013. The weighted
average interest rate on the variable-rate notes was 5.4% and 4.0% at April
30, 2007 and 2008, respectively. In addition to long-term debt, we had
short-term borrowings outstanding with weighted average interest rates
of 5.3% and 2.2% at April 30, 2007 and 2008, respectively.
8. DERIVATIVE FINANCIAL INSTRUMENTS We use foreign cur-
rency options and forward contracts to protect against the risk that the
eventual U.S. dollar cash flows resulting from our forecasted sales and
purchases of goods and services in foreign currencies will be adversely
affected by changes in exchange rates. In general, average maturities
are less than one year, although at April 30, 2008, we had some forward
contracts with maturities approaching two years. We designate these
derivative financial instruments as cash flow hedges.
We had outstanding foreign currency options and forward contracts, hedg-
ing primarily British pound, Australian dollar, euro, and South African
rand revenues, with notional amounts totaling $406 and $342 at April 30,
2007 and 2008, respectively. We also had forward contracts hedging the
fair value of a Mexican peso-denominated intercompany receivable, with
a notional value of approximately $120 and $49 at April 30, 2007 and 2008,
respectively. Our credit exposure is, however, limited to the contracts’ fair
value (see Note 9) rather than their notional amounts. We minimize credit
exposure by entering into foreign currency contracts only with major
financial institutions that have earned investment-grade credit ratings.
As of April 30, 2008, we have an interest rate swap contract outstanding
with a $75 notional value to fix the rate on a portion of our variable-rate
notes for the nine-month period ending July 1, 2008. We have designated
this contract as a cash flow hedge.
We formally assess (both at inception and at least quarterly) whether the
derivative financial instruments are effective at offsetting changes in the
cash flows of the hedged transactions. We defer the effective portion of a
derivative’s change in fair value in Accumulated Other Comprehensive
Income (Loss) until the underlying hedged transaction is recognized in
earnings. We recognize any ineffective portion of the change in fair value
immediately in earnings. No material gains or losses were recognized in
earnings due to the ineffectiveness of cash flow hedges.
We also had outstanding exchange-traded futures and options contracts on
1 million and 3 million bushels of corn as of April 30, 2007 and 2008,
respectively. As these contracts are not designated as hedges for accounting
purposes, gains and losses related to them are immediately recognized
in earnings.
9. FAIR VALUE OF FINANCIAL INSTRUMENTS The fair value of cash,
cash equivalents, short-term investments, and short-term borrowings approxi-
mates the carrying amount due to the short maturities of these instruments.
We estimate the fair value of long-term debt using discounted cash flows
based on our incremental borrowing rates for similar debt. The fair value of
commodity and foreign currency contracts is based on quoted market prices.
A comparison of the fair values and carrying amounts of these instruments
is as follows:
April 30, 2007 2008
Carrying Fair Carrying Fair Amount Value Amount Value
Assets: Cash and cash equivalents $283 $283 $119 $119 Short-term investments 86 86 — — Commodity contracts — — 7 7
Liabilities: Foreign currency contracts 4 4 10 10 Short-term borrowings 401 401 585 585 Current portion of long-term debt 354 347 4 4 Long-term debt 422 422 417 417
10. BALANCE SHEET INFORMATION Supplemental information on
our year-end balance sheet is as follows:
April 30, 2007 2008
Property, plant, and equipment: Land $ 88 $ 88 Buildings 323 342 Equipment 446 453 Construction in process 27 24
884 907
Less accumulated depreciation 378 406
$506 $501
Accounts payable and accrued expenses: Accounts payable, trade $118 $129 Accrued expenses: Advertising 65 67 Compensation and commissions 93 86 Excise and other non-income taxes 41 41 Self-insurance claims 10 10 Postretirement benefits 4 7 Interest 3 2 Other 27 38
243 251
$361 $380
notes to consolidated Financial statements (dollars Expressed In Millions, Except Per Share Amounts)
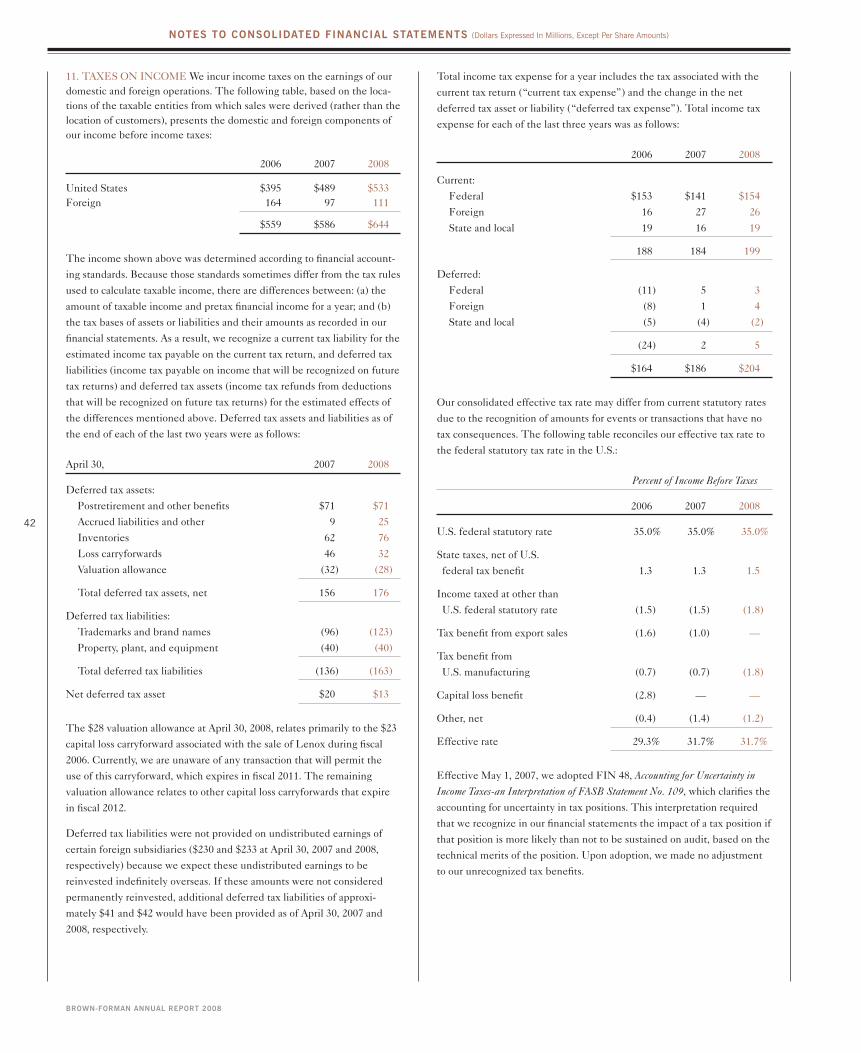
42
Brown-Forman annual report 2008
11. TAXES ON INCOME We incur income taxes on the earnings of our domestic and foreign operations. The following table, based on the loca-tions of the taxable entities from which sales were derived (rather than the location of customers), presents the domestic and foreign components of our income before income taxes:
2006 2007 2008
United States $395 $489 $533 Foreign 164 97 111
$559 $586 $644
The income shown above was determined according to financial account-
ing standards. Because those standards sometimes differ from the tax rules
used to calculate taxable income, there are differences between: (a) the
amount of taxable income and pretax financial income for a year; and (b)
the tax bases of assets or liabilities and their amounts as recorded in our
financial statements. As a result, we recognize a current tax liability for the
estimated income tax payable on the current tax return, and deferred tax
liabilities (income tax payable on income that will be recognized on future
tax returns) and deferred tax assets (income tax refunds from deductions
that will be recognized on future tax returns) for the estimated effects of
the differences mentioned above. Deferred tax assets and liabilities as of
the end of each of the last two years were as follows:
April 30, 2007 2008
Deferred tax assets:
Postretirement and other benefits $71 $71
Accrued liabilities and other 9 25
Inventories 62 76
Loss carryforwards 46 32
Valuation allowance (32) (28)
Total deferred tax assets, net 156 176
Deferred tax liabilities:
Trademarks and brand names (96) (123)
Property, plant, and equipment (40) (40)
Total deferred tax liabilities (136) (163)
Net deferred tax asset $20 $13
The $28 valuation allowance at April 30, 2008, relates primarily to the $23
capital loss carryforward associated with the sale of Lenox during fiscal
2006. Currently, we are unaware of any transaction that will permit the
use of this carryforward, which expires in fiscal 2011. The remaining
valuation allowance relates to other capital loss carryforwards that expire
in fiscal 2012.
Deferred tax liabilities were not provided on undistributed earnings of
certain foreign subsidiaries ($230 and $233 at April 30, 2007 and 2008,
respectively) because we expect these undistributed earnings to be
reinvested indefinitely overseas. If these amounts were not considered
permanently reinvested, additional deferred tax liabilities of approxi-
mately $41 and $42 would have been provided as of April 30, 2007 and
2008, respectively.
Total income tax expense for a year includes the tax associated with the
current tax return (“current tax expense”) and the change in the net
deferred tax asset or liability (“deferred tax expense”). Total income tax
expense for each of the last three years was as follows:
2006 2007 2008
Current:
Federal $153 $141 $154
Foreign 16 27 26
State and local 19 16 19
188 184 199
Deferred:
Federal (11) 5 3
Foreign (8) 1 4
State and local (5) (4) (2)
(24) 2 5
$164 $186 $204
Our consolidated effective tax rate may differ from current statutory rates
due to the recognition of amounts for events or transactions that have no
tax consequences. The following table reconciles our effective tax rate to
the federal statutory tax rate in the U.S.:
Percent of Income Before Taxes
2006 2007 2008
U.S. federal statutory rate 35.0% 35.0% 35.0%
State taxes, net of U.S.
federal tax benefit 1.3 1.3 1.5
Income taxed at other than
U.S. federal statutory rate (1.5) (1.5) (1.8)
Tax benefit from export sales (1.6) (1.0) —
Tax benefit from
U.S. manufacturing (0.7) (0.7) (1.8)
Capital loss benefit (2.8) — —
Other, net (0.4) (1.4) (1.2)
Effective rate 29.3% 31.7% 31.7%
Effective May 1, 2007, we adopted FIN 48, Accounting for Uncertainty in
Income Taxes-an Interpretation of FASB Statement No. 109, which clarifies the
accounting for uncertainty in tax positions. This interpretation required
that we recognize in our financial statements the impact of a tax position if
that position is more likely than not to be sustained on audit, based on the
technical merits of the position. Upon adoption, we made no adjustment
to our unrecognized tax benefits.
notes to consolidated Financial statements (dollars Expressed In Millions, Except Per Share Amounts)

43
Brown-Forman annual report 2008
At April 30, 2008, we had $35 of gross unrecognized tax benefits, $26 of
which would reduce our effective income tax rate if recognized. A recon-
ciliation of the beginning and ending unrecognized tax benefits follows:
RECONCILIATION Of UNRECOGNIzEd TAx bENEfITS, 2007 TO 2008
Unrecognized tax benefits, May 1, 2007 $43
Additions for tax positions provided in prior periods 1
Additions for tax positions provided in current period 4
Settlements of tax positions in the current period (7)
Lapse of statutes of limitations (6)
Unrecognized tax benefits, April 30, 2008 $35
We record interest and penalties related to unrecognized tax benefits as a
component of our income tax provision. At April 30, 2008, the gross inter-
est and penalties provided on FIN 48 contingencies in our consolidated
balance sheet was $8. Due to the above-noted settlements and lapses of
statutes of limitations, we reversed certain accruals of interest and penal-
ties during 2008. As a result, the net amount of interest and penalties that
reduced our effective tax rate and is reflected in our consolidated state-
ment of operations was approximately $1.
We file income tax returns in the U.S., including several state and local
jurisdictions, as well as in various other countries throughout the world in
which we conduct business. The major jurisdictions and their earliest
fiscal years that are currently open for tax examinations are 1998 in the
U.S., 2004 in Ireland and Italy; 2003 in the U.K.; and 2002 in Finland
and Poland.
We believe it is reasonably possible that the gross unrecognized tax benefits
may decrease by approximately $5 in the next 12 months because of the
expiration of statutes of limitations for various state income tax positions.
12. PENSION AND OTHER POSTRETIREMENT BENEFITS We
sponsor various defined benefit pension plans as well as postretirement plans
providing retiree health care and retiree life insurance benefits. Below, we
discuss our obligations related to these plans, the assets dedicated to meeting
the obligations, and the amounts we recognized in our financial statements as
a result of sponsoring these plans. We use a measurement date of January 31
to determine the amounts of the plan obligations and assets presented below.
Obligations. We provide eligible employees with pension and other
post-retirement benefits based on such factors as years of service and com-
pensation level during employment. The pension obligation shown below
(“projected benefit obligation”) consists of: (a) benefits earned by employees
to date based on current salary levels (“accumulated benefit obligation”); and
(b) benefits to be received by employees as a result of expected future salary
increases. (The obligation for medical and life insurance benefits is not
affected by future salary increases.) This table shows how the present value
of our obligation changed during each of the last two years.
Pension Medical and Life Benefits Insurance Benefits
2007 2008 2007 2008
Obligation at beginning of year $414 $448 $ 53 $ 53
Service cost 13 13 1 1
Interest cost 24 27 3 3
Net actuarial loss (gain) 14 (21) — (3)
Plan amendments — 1 — —
Retiree contributions — — 1 1
Benefits paid (16) (17) (4) (3)
Effect of Hartmann sale (1) — (1) —
Obligation at end of year $448 $451 $ 53 $ 52
Service cost represents the present value of the benefits attributed to ser-
vice rendered by employees during the year. Interest cost is the increase in
the present value of the obligation due to the passage of time. Net actuarial
loss (gain) is the change in value of the obligation resulting from experience
different from that assumed or from a change in an actuarial assumption.
(We discuss actuarial assumptions used at the end of this note.)
As shown in the previous table, our pension and other postretirement benefit
obligations were reduced by benefit payments in 2008 of $17 and $3, respec-
tively. Expected benefit payments over the next 10 years are as follows:
Pension Medical and Life Benefits Insurance Benefits
2009 $ 21 $ 3
2010 22 3
2011 24 3
2012 25 3
2013 26 3
2014-2018 155 16
Assets. We specifically invest in certain assets in order to fund our pension
benefit obligations. Our investment goal is to earn a total return that,
over time, will grow assets sufficiently to fund our plans’ liabilities, after
providing appropriate levels of contributions and accepting prudent levels
of investment risk. To achieve this goal, plan assets are invested primar-
ily in funds or portfolios of funds actively managed by outside managers.
Investment risk is managed by company policies that require diversifica-
tion of asset classes, manager styles, and individual holdings. We measure
and monitor investment risk through quarterly and annual performance
reviews, and periodic asset/liability studies.
notes to consolidated Financial statements (dollars Expressed In Millions, Except Per Share Amounts)

44
Brown-Forman annual report 2008
Asset allocation is the most important method for achieving our investment
goals and is based on our assessment of the plans’ long-term return objectives
and the appropriate balances needed for liquidity, stability, and diversification.
The allocation of our pension plan assets at fair value on January 31, 2007
and 2008, and the target allocation for 2009, by asset category, are as follows:
Actual Actual Target 2007 2008 2009
Equity securities 71% 56% 57%
Debt securities 15 22 20
Real estate 6 10 8
Other 8 12 15
Total 100% 100% 100%
This table shows how the fair value of the pension plan assets changed
during each of the last two years. (We do not have assets set aside for post-
retirement medical or life insurance benefits.)
Pension Medical and Life Benefits Insurance Benefits
2007 2008 2007 2008
Fair value at beginning of year $368 $396 $ — $ —
Actual return on plan assets 42 16 — —
Retiree contributions — — 1 1
Company contributions 2 2 3 2
Benefits paid (16) (17) (4) (3)
Fair value at end of year $396 $397 $ — $ —
Consistent with our funding policy, we expect to contribute $3 to our
postretirement medical and life insurance benefit plans in 2009. While we
may decide to contribute more, we currently expect to contribute $4 to our
pension plans in 2009.
Funded status. The funded status of a plan refers to the difference between
its assets and its obligations. Before we adopted SFAS 158 (discussed below),
this amount differed from the amount recorded as a net asset or liability on
the balance sheet. This table shows the funded status of our plans.
Pension Medical and Life Benefits Insurance Benefits
2007 2008 2007 2008
Assets $396 $397 $ — $ —
Obligations (448) (451) (53) (52)
Assets contributed
after measurement date — 1 1 —
Funded status $(52) $(53) $(52) $(52)
The net liability is recorded in the balance sheet as follows:
Pension Medical and Life Benefits Insurance Benefits
2007 2008 2007 2008
Prepaid pension cost $ 23 $ 23 $ — $ —
Accounts payable and
accrued expenses (1) (4) (3) (3)
Accrued postretirement benefits (74) (72) (49) (49)
Net liability $ (52) $ (53) $(52) $(52)
Accumulated other comprehensive loss:
Net actuarial loss $148 $131 $ 9 $ 5
Prior service cost 5 5 1 1
$153 $136 $ 10 $ 6
notes to consolidated Financial statements (dollars Expressed In Millions, Except Per Share Amounts)

45
Brown-Forman annual report 2008
On April 30, 2007, we adopted SFAS 158, Employers’ Accounting for Defined
Benefit Pension and Other Postretirement Plans. SFAS 158 requires that we
recognize the funded status of our pension and other postretirement benefit
plans as an asset or liability on our balance sheet. SFAS 158 also requires
that, beginning in 2009, the assumptions used to measure our annual pension
and other postretirement benefit expenses be determined as of the balance
sheet date, and all plan assets and liabilities be reported as of that date.
The following table illustrates the incremental effect of applying SFAS
158 on individual line items on our balance sheet as of April 30, 2007:
Before After Application Application of SFAS 158 Adjustments of SFAS 158
Prepaid pension cost $ 134 $(111) $ 23
Total assets 3,662 (111) 3,551
Accounts payable and
accrued expenses 357 4 361
Accrued postretirement
benefits 84 39 123
Deferred income taxes 116 (60) 56
Total liabilities 1,995 (17) 1,978
Accumulated other
comprehensive gain (loss) 37 (94) (57)
Total stockholders’ equity 1,667 (94) 1,573
Total liabilities and
stockholders’ equity 3,662 (111) 3,551
This table compares our pension plans that have assets in excess of their
accumulated benefit obligations with those whose assets are less than their
obligations. (As discussed above, we have no assets set aside for post-
retirement medical or life insurance benefits.)
Accumulated Projected Plan Benefit Benefit Assets Obligation Obligation
2007 2008 2007 2008 2007 2008
Plans with assets in
excess of accumulated
benefit obligation $396 $397 $346 $336 $396 $397
Plans with accumulated
benefit obligation in
excess of assets — — 42 45 52 54
Total $396 $397 $388 $381 $448 $451
Pension expense. This table shows the components of the pension
expense recognized during each of the last three years. The amount for
each year includes amortization of the prior service cost and net loss that
was unrecognized as of the beginning of the year.
Pension Benefits
2006 2007 2008
Service cost $13 $13 $13
Interest cost 22 24 27
Expected return on plan assets (32) (32) (32)
Amortization of:
Prior service cost 1 1 1
Net actuarial loss 8 12 12
Net expense $12 $18 $21
The prior service cost represents the cost of retroactive benefits granted in
plan amendments and is amortized on a straight-line basis over the aver-
age remaining service period of the employees expected to receive the
benefits. The net loss results from experience different from that assumed
or from a change in actuarial assumptions, and is amortized over at least
that same period. The estimated amount of prior service cost and net loss
that will be amortized from accumulated other comprehensive loss into
pension expense in 2009 is $1 and $8, respectively.
The pension expense recorded during the year is estimated at the begin-
ning of the year. As a result, the amount is calculated using an expected
return on plan assets rather than the actual return. The difference
between actual and expected returns is included in the unrecognized net
gain or loss at the end of the year.
notes to consolidated Financial statements (dollars Expressed In Millions, Except Per Share Amounts)

46
Brown-Forman annual report 2008
Other postretirement benefit expense. This table shows the components
of the postretirement medical and life insurance benefit expense that we
recognized during each of the last three years.
Medical and Life Insurance Benefits
2006 2007 2008
Service cost $1 $1 $1
Interest cost 3 3 3
Net expense $4 $4 $4
Other comprehensive income. Since we adopted SFAS 158, changes
in the funded status of our benefit plans that are not recognized in net
income (as pension and other postretirement benefit expense) are instead
recognized in other comprehensive income. Other comprehensive income
is also adjusted to reflect the amortization of the prior service cost and
net actuarial gain or loss, which is a component of net pension and other
postretirement benefit expense, from accumulated other comprehensive
income (loss) to net income. This table shows the amounts recognized in
other comprehensive income during 2008:
Pension Medical and Life Benefits Insurance Benefits
Prior service cost $ 1 $ —
Actuarial gain (5) (3)
Amortization reclassified to net income:
Prior service cost (1) —
Net actuarial loss (12) —
Net amount recognized
in other comprehensive income $(17) $ (3)
Assumptions and sensitivity. We use various assumptions to determine the
obligations and expense related to our pension and other postretirement
benefit plans. The assumptions used in computing benefit plan obliga-
tions as of the end of the last two years were as follows:
Pension Medical and Life Benefits Insurance Benefits
(In percent) 2007 2008 2007 2008
Discount rate 6.04 6.64 5.98 6.45
Rate of salary increase 4.00 4.00 — —
Expected return on plan assets 8.75 8.75 — —
The assumptions used in computing benefit plan expense during each of
the last three years were as follows:
Pension Medical and Life Benefits Insurance Benefits
(In percent) 2006 2007 2008 2006 2007 2008
Discount rate 5.80 5.95 6.04 5.80 5.95 5.98
Rate of salary increase 4.00 4.00 4.00 — — —
Expected return
on plan assets 8.75 8.75 8.75 — — —
The discount rate represents the interest rate used to discount the cash-
flow stream of benefit payments to a net present value as of the current
date. A lower assumed discount rate increases the present value of the
benefit obligation. We determined the discount rate using a yield curve
based on the interest rates of high-quality debt securities with maturities
corresponding to the expected timing of our benefit payments.
The assumed rate of salary increase reflects the expected annual increase
in salaries as a result of inflation, merit increases, and promotions. A lower
assumed rate decreases the present value of the benefit obligation.
The expected return on plan assets represents the long-term rate of return
that we assume will be earned over the life of the pension assets, consider-
ing the distribution of those assets among investment categories and the
related historical rates of return.
The assumed health care cost trend rates as of the end of the last two
years were as follows:
Medical and Life Insurance Benefits
(In percent) 2007 2008
Health care cost trend rate assumed for next year:
Present rate before age 65 10.0 9.0
Present rate age 65 and after 10.0 9.0
We project health care cost trend rates to decline gradually to 5.0% by
2012 and to remain level after that. Assumed health care cost trend rates
have a significant effect on the amounts reported for postretirement medi-
cal plans. A one percentage point increase/decrease in assumed health
care cost trend rates would have increased/decreased the accumulated
postretirement benefit obligation as of April 30, 2008, by $5 and the
aggregate service and interest costs for 2008 by less than $1.
notes to consolidated Financial statements (dollars Expressed In Millions, Except Per Share Amounts)

47
Brown-Forman annual report 2008
Savings plans. We also sponsor various defined contribution benefit plans
that in total cover substantially all employees. Employees can make vol-
untary contributions in accordance with the provisions of their respective
plans, which includes a 401(k) tax deferral option. We match a percentage
of each employee’s contributions in accordance with the provisions of the
plans. We expensed $7, $8, and $9 for matching contributions during 2006,
2007, and 2008, respectively.
13. SEGMENT INFORMATION The following table presents our net
sales by product category and geographic region:
2006 2007 2008
Net sales:
Spirits $2,049 $2,425 $2,896
Wine 363 381 386
$2,412 $2,806 $3,282
2006 2007 2008
Net sales:
United States $1,404 $1,498 $1,564
Europe 709 816 955
Other 299 492 763
$2,412 $2,806 $3,282
Net sales are attributed to countries based on where customers are
located. The net book value of property, plant, and equipment located in
Mexico was $63 and $64 as of April 30, 2007 and 2008, respectively. Other
long-lived assets located outside the U.S. are not significant.
14. CONTINGENCIES We operate in a litigious environment, and we
are sued in the normal course of business. Sometimes plaintiffs seek
substantial damages. Significant judgment is required in predicting the
outcome of these suits and claims, many of which take years to adjudicate.
We accrue estimated costs for a contingency when we believe that a loss
is probable and we can make a reasonable estimate of the loss, and adjust
the accrual as appropriate to reflect changes in facts and circumstances.
Brown-Forman Corporation and many other manufacturers of spirits,
wine, and beer were defendants in a series of nine essentially identical
putative class action lawsuits that began in 2003 seeking damages and
injunctive relief for alleged marketing of beverage alcohol to underage
consumers. As each of these cases has been dismissed or withdrawn, the
last in November 2007, this series of litigation is concluded.
15. STOCK-BASED COMPENSATION Under our 2004 Omnibus
Compensation Plan (the “Plan”), we can grant stock options and other
stock-based incentive awards for a total of 5,946,000 shares of common
stock to eligible employees until July 22, 2014. As of April 30, 2008,
awards for 4,412,000 shares remain available for issuance under the Plan.
Shares delivered to employees are limited by the Plan to shares that we
purchase for this purpose. No new shares may be issued.
We grant stock options and SSARs at an exercise price of not less than
the fair value of the underlying stock on the grant date. Stock options
and SSARs granted under the Plan become exercisable after three years
from the first day of the fiscal year of grant and expire seven years after
that date. The grant-date fair values of these awards granted during 2006,
2007, and 2008 were $12.59, $16.46, and $15.25 per award, respectively.
Fair values were estimated using the Black-Scholes pricing model with
the following assumptions:
2006 2007 2008
Risk-free interest rate 4.0% 5.0% 4.7%
Expected volatility 22.0% 16.9% 17.2%
Expected dividend yield 1.9% 1.8% 1.7%
Expected life (years) 6 6 6
notes to consolidated Financial statements (dollars Expressed In Millions, Except Per Share Amounts)

48
Brown-Forman annual report 2008
We also grant restricted shares of common stock under the Plan. As of
April 30, 2008, there are approximately 150,000 restricted shares outstand-
ing, with a weighted-average remaining restriction period of 2.7 years.
The following table summarizes restricted stock activity during 2008.
Weighted Average Restricted Shares Fair Value at (in thousands) Grant Date
Outstanding at May 1, 2007 122 $49.79
Granted 43 73.11
Vested (15) 55.92
Outstanding at April 30, 2008 150 $55.86
The total fair value of restricted stock vested during 2008 was $1. No
restricted stock vested during 2006 or 2007.
The accompanying consolidated statements of operations reflect com-
pensation expense related to stock-based incentive awards on a pre-tax
basis of $8 in 2006, $8 in 2007, and $10 in 2008, partially offset by deferred
income tax benefits of $3 in 2006, $3 in 2007, and $4 in 2008. As of April 30,
2008, there was $10 of total unrecognized compensation cost related to
nonvested stock-based compensation. That cost is expected to be recog-
nized over a weighted-average period of 2.2 years.
16. OTHER INCOME In July 2005, we entered into an agreement
with LVMH Moët Hennessey Louis Vuitton for the early termination of
our long-term importing and marketing agreements for Glenmorangie
products in the U.S., Canada, and certain countries in Europe and Asia,
effective July 29, 2005. We received approximately $14 for the early
termination, which is included in other income for fiscal 2006 in the
accompanying consolidated statement of operations.
In January 2006, we received proceeds of $25 as compensation for Pernod
Ricard assuming the distribution of its brands from Swift & Moore, an
Australian distribution company co-owned by Pernod Ricard (following
its purchase of Allied-Domecq) and us. This amount is recorded in other
income for fiscal 2006. Pernod Ricard surrendered its ownership inter-
est in Swift & Moore to us effective February 1, 2006, resulting in our
becoming 100% owner of Swift & Moore as of that date. Swift & Moore,
which is now Brown-Forman Australia, continues to distribute our brands
in Australia.
In January 2006, we sold winery land and buildings in California for $7,
resulting in a gain of $5 that is included in other income for fiscal 2006.
In September 2006, we entered into an agreement with Gruppo Italiano
Vini (GIV) for the production of Bolla Italian wines. Under the agreement,
we also sold our main Bolla wine production facility in Pedemonte, Italy,
to GIV, which now produces Bolla Italian Wines for us. We recognized a
gain on the sale of $11, which is included in other income for fiscal 2007.
The agreement also named GIV as Bolla’s distributor in the Italian domes-
tic market. We maintained worldwide ownership of the Bolla trademark
and continue to sell Bolla Wines in the brand’s other markets.
Here is a summary of stock option and SSAR activity under the Plan as of April 30, 2008, and changes during the year then ended:
Weighted Weighted Shares Average Exercise Average Remaining Aggregate (in thousands) Price Per Option/SSAR Contractual Term Intrinsic Value
Outstanding at May 1, 2007 4,215 $ 41.48
Granted 442 68.20
Exercised (1,001) 40.23
Forfeited or expired (77) 52.59
Outstanding at April 30, 2008 3,579 $44.89 5.1 $84
Exercisable at April 30, 2008 2,524 $36.39 3.9 $80
The total intrinsic value of options and SSARs exercised during 2006, 2007, and 2008 was $23, $26, and $31, respectively.
notes to consolidated Financial statements (dollars Expressed In Millions, Except Per Share Amounts)

49
Brown-Forman annual report 2008
reports oF management
MANAGEMENT’S RESPONSIBILITY FOR
FINANCIAL STATEMENTS
Our management is responsible for the preparation, presentation, and
integrity of the financial information presented in this Annual Report.
The consolidated financial statements were prepared in conformity with
accounting principles generally accepted in the U.S. (GAAP), including
amounts based on management’s best estimates and judgments. In man-
agement’s opinion, the consolidated financial statements fairly present the
Company’s financial position, results of operations, and cash flows.
The Audit Committee of the Board of Directors, which is composed of
independent directors, meets regularly with the independent registered
public accounting firm, PricewaterhouseCoopers LLP (PwC), internal
auditors, and representatives of management to review accounting,
internal control structure, and financial reporting matters. The internal
auditors and PwC have full, free access to the Audit Committee.
As set forth in our Code of Conduct and Compliance Guidelines, we
are firmly committed to adhering to the highest standards of moral and
ethical behaviors in all of our business activities.
MANAGEMENT’S REPORT ON INTERNAL CONTROL
OVER FINANCIAL REPORTING
Management is also responsible for establishing and maintaining adequate
internal control over financial reporting, as defined in Rule 13a-15(f) under
the Securities Exchange Act of 1934. Our internal control over financial
reporting is designed to provide reasonable assurance regarding the
reliability of financial reporting and the preparation of financial statements
for external purposes in accordance with accounting principles generally
accepted in the U.S.
Under our supervision, and with the participation of management, we
conducted an evaluation of the effectiveness of the Company’s internal
control over financial reporting based on the framework and criteria in
Internal Control – Integrated Framework issued by the Committee of
Sponsoring Organizations of the Treadway Commission. Based on this
evaluation, we concluded that the Company’s internal control over finan-
cial reporting was effective as of April 30, 2008.
There has been no change in the Company’s internal control over financial
reporting during the most recent fiscal year that has materially affected,
or is reasonably likely to materially affect, the Company’s internal control
over financial reporting. Management’s assessment of the effectiveness
of the Company’s internal control over financial reporting as of April 30,
2008, has been audited by PwC as stated in their report that appears on
page 50.
Paul C. Varga
President and Chief Executive Officer
Donald C. Berg
Executive Vice President and Chief Financial Officer

50
Brown-Forman annual report 2008
TO THE BOARD OF DIRECTORS AND STOCKHOLDERS
OF BROWN-FORMAN CORPORATION:
In our opinion, the accompanying consolidated balance sheets and the
related consolidated statements of operations, cash flows, and stockholders’
equity present fairly, in all material respects, the financial position of
Brown-Forman Corporation and its subsidiaries (the “Company”) at
April 30, 2008 and April 30, 2007, and the results of their operations and
their cash flows for each of the three years in the period ended April 30,
2008 in conformity with accounting principles generally accepted in the
United States of America. Also in our opinion, the Company maintained,
in all material respects, effective internal control over financial reporting as
of April 30, 2008, based on criteria established in Internal Control –
Integrated Framework issued by the Committee of Sponsoring Organizations
of the Treadway Commission (COSO). The Company’s management is
responsible for these financial statements, for maintaining effective
internal control over financial reporting and for its assessment of the
effectiveness of internal control over financial reporting, included in
Management’s Report on Internal Control over Financial Reporting
appearing on page 49 of this Annual Report to Stockholders. Our
responsibility is to express opinions on these financial statements and on
the Company’s internal control over financial reporting based on our
integrated audits. We conducted our audits in accordance with the
standards of the Public Company Accounting Oversight Board (United
States). Those standards require that we plan and perform the audits to
obtain reasonable assurance about whether the financial statements are
free of material misstatement and whether effective internal control over
financial reporting was maintained in all material respects. Our audits of
the financial statements included examining, on a test basis, evidence sup-
porting the amounts and disclosures in the financial statements, assessing
the accounting principles used and significant estimates made by
management, and evaluating the overall financial statement presentation.
Our audit of internal control over financial reporting included obtaining an
understanding of internal control over financial reporting, assessing the
risk that a material weakness exists, and testing and evaluating the design
and operating effectiveness of internal control based on the assessed risk.
Our audits also included performing such other procedures as we
considered necessary in the circumstances. We believe that our audits
provide a reasonable basis for our opinions.
A company’s internal control over financial reporting is a process designed
to provide reasonable assurance regarding the reliability of financial
reporting and the preparation of financial statements for external purposes
in accordance with generally accepted accounting principles. A company’s
internal control over financial reporting includes those policies and pro-
cedures that (i) pertain to the maintenance of records that, in reasonable
detail, accurately and fairly reflect the transactions and dispositions of the
assets of the company; (ii) provide reasonable assurance that transactions
are recorded as necessary to permit preparation of financial statements
in accordance with generally accepted accounting principles, and that
receipts and expenditures of the company are being made only in accor-
dance with authorizations of management and directors of the company;
and (iii) provide reasonable assurance regarding prevention or timely
detection of unauthorized acquisition, use, or disposition of the company’s
assets that could have a material effect on the financial statements.
Because of its inherent limitations, internal control over financial reporting
may not prevent or detect misstatements. Also, projections of any evalu-
ation of effectiveness to future periods are subject to the risk that controls
may become inadequate because of changes in conditions, or that the
degree of compliance with the policies or procedures may deteriorate.
PricewaterhouseCoopers LLP
Louisville, Kentucky
June 27, 2008
report oF independent registered puBlic accounting Firm

51
Brown-Forman annual report 2008
This Annual Report contains statements, estimates, or projections that
constitute “forward-looking statements” as defined under U.S. federal
securities laws. Generally, the words “expect,” “believe,” “intend,”
“estimate,” “will,” “anticipate,” “project,” and similar expressions
identify a forward-looking statement, which speaks only as of the date
the statement is made. Except as required by law, we do not intend to
update or revise any forward-looking statements, whether as a result
of new information, future events, or otherwise. We believe that the
expectations and assumptions with respect to our forward-looking state-
ments are reasonable. But by their nature, forward-looking statements
involve known and unknown risks, uncertainties, and other factors that
in some cases are out of our control. These factors could cause our actual
results to differ materially from our historical experience or our current
expectations or projections. Here is a non-exclusive list of such risks and
uncertainties:
• continuation of the deterioration in general economic conditions,
particularly in the U.S., where we earn about half of our profits, and
other markets with economies linked to the U.S., including higher
energy prices, declining home prices, deterioration of the sub-prime
lending market, decreased discretionary income, or other factors;
• pricing, marketing, and other competitive activity focused against our
major brands;
• lower consumer confidence or purchasing related to economic
conditions, major natural disasters, terrorist attacks, or widespread
outbreak of infectious diseases;
• tax increases, tariff barriers, or other restrictions affecting beverage
alcohol, whether at the federal or state level in the U.S. or in other
major markets around the world, and the unpredictability or suddenness
with which they can occur;
• limitations and restrictions on distribution of products and alcohol
marketing, including advertising and promotion, as a result of stricter
governmental policies adopted either in the U.S. or in our other major
markets;
• fluctuations in the U.S. dollar against foreign currencies, especially the
British pound, euro, Australian dollar, and the South African rand;
• reduced bar, restaurant, hotel, and travel business, including travel retail;
• longer-term, a change in consumer preferences, societal attitudes, or
cultural trends that results in the reduced consumption of our premium
beverage alcohol or our ready-to-drink products;
• changes in distribution arrangements in major markets that limit our
ability to market or sell our products;
• adverse impacts relating to our acquisition strategies or our integra-
tion of acquired businesses and conforming them to our trade practice
standards, financial controls environment, and U.S. public company
requirements;
• price increases in energy or raw materials, including grapes, grain,
agave, wood, glass, or plastic;
• changes in climate conditions, agricultural uncertainties, or other supply
limitations that adversely affect the price, availability, or quality of
grapes, agave, grain, glass, closures, or wood;
• termination of our rights to distribute and market agency brands in
our portfolio;
• press articles or other public media related to our company, brands,
personnel, operations, business performance, or prospects;
• counterfeit production of our products and any resulting negative effect
on our intellectual property rights or brand equity; and
• adverse developments stemming from state or federal investigations
of beverage alcohol industry marketing or trade practices of suppliers,
distributors, or retailers.
important inFormation on Forward-looKing statements

52
Brown-Forman annual report 2008
BROWN-FORMAN CORPORATION BOARD OF DIRECTORS
Geo. Garvin Brown IV (1) (4) Presiding Chairman of the Board, Brown-Forman Corporation; Vice President and Director, Jack Daniel’s Europe Africa
Owsley Brown II (6)
Former Chairman, Brown-Forman Corporation, Louisville, Kentucky
Paul C. Varga (1)
Chairman and Chief Executive Officer, Brown-Forman Corporation, Louisville, Kentucky
Patrick Bousquet-Chavanne (3) President and Chief Executive Officer, T-Ink, Inc., New York, New York
Barry D. Bramley (2) (4)
Former Chairman and Chief Executive Officer, British-American Tobacco Company, Ltd., London, England
Martin S. Brown, Jr.Partner, Adams and Reese LLP, Nashville, Tennessee
Donald G. Calder (2) (4)
President and Chief Financial Officer, G. L. Ohrstrom & Co., Inc., New York, New York
Sandra A. FrazierFounder and Member, Tandem Public Relations, LLC, Louisville, Kentucky
Richard P. Mayer (3) (4)
Former Chairman and Chief Executive Officer, Kraft General Foods North America (now Kraft Foods, Inc.), Northfield, Illinois
William E. Mitchell (2)
Chairman, President, and Chief Executive Officer, Arrow Electronics, Inc., Melville, New York
Matthew R. Simmons (3)
Founder and Chairman, Simmons and Company International, Houston, Texas
William M. Street (2)
Former President, Brown-Forman Corporation, Louisville, Kentucky
Dace Brown Stubbs Private Investor, Vero Beach, Florida
James S. Welch, Jr. (1)
Vice Chairman, Brown-Forman Corporation, Louisville, Kentucky
BROWN-FORMAN CORPORATION EXECUTIVE COMMITTEE OFFICERS
Paul C. Varga (1)
Chairman and Chief Executive Officer
James S. Welch, Jr. (1)
Vice Chairman
James L. BareutherExecutive Vice President and Chief Operating Officer
Donald C. BergExecutive Vice President and Chief Financial Officer
Matthew E. Hamel (5)
Executive Vice President, General Counsel, and Secretary
Mark I. McCallumExecutive Vice President and Chief Brands Officer
Jill A. JonesSenior Vice President
Philip A LichtenfelsSenior Vice President
Jane C. MorreauSenior Vice President
Lisa P. SteinerSenior Vice President
Marshall B. FarrerVice President
(1) Member of Executive Committee of the Board of Directors
(2) Member of Audit Committee
(3) Member of Compensation Committee
(4) Member of the Nominating Committee
(5) Secretary to Board of Directors, Executive Committee of the Board of Directors, and Audit Committee
(6) Retirement effective July 24, 2008
directors and oFFicers

53
Brown-Forman annual report 2008
bROwN-fORMAN CORPORATION
ExECUTIvE COMMITTEE
From left: Mark I. McCallum, ExecutiveVice President and Chief Brands Officer;
Phoebe A. Wood, (retired) Vice Chairman and Chief Financial Officer;
James L. Bareuther, Executive Vice President and Chief Operating Officer;
Jill A. Jones, Senior Vice President, Managing Director Global Production;
Paul C. Varga, Chairman and Chief Executive Officer;
Donald C. Berg, Executive Vice President and Chief Financial Officer;
Lisa P. Steiner, Senior Vice President, Director Global Human Resources;Matthew E. Hamel, Executive Vice
President, General Cousel, and Secretary; Jane C. Morreau, Senior Vice President,
Director Finance/Accounting and Technology;
Marshall B. Farrer, Vice President, Director Latin America and Carribean; James S. Welch Jr., Vice Chairman; and
Philip A. Lichtenfels, Senior Vice President and Chief of Staff
bROwN fAMILY dIRECTORS
ANd EMPLOYEES
From left: Geo. Garvin Brown IV, Presiding Chairman of the Board,
Brown-Forman Corporation, Vice President, Director Jack Daniel’s
Europe Africa; Martin S. Brown, Jr., Director, Brown-Forman Corporation;
J. McCauley Brown, Vice President, Director Business Services; Sandra A. Frazier, Director, Brown-Forman Corporation;
Ann McCauley Williams, Market Brand Manager Jack Daniel’s;
Marshall B. Farrer, Vice President, Director Latin America and Caribbean;
Christopher L. Brown, On Premise Manager;
Clay L. Kannapell, Manager SKU Processes;
Campbell P. Brown, Vice President, Director Southern Comfort Americas; Robinson S. Brown IV, Area Manager;
Barbara A. Hurt, Associate Promotions Manager;
Dace Brown Stubbs, Director, Brown-Forman Corporation; and
Owsley Brown II, Director, Brown-Forman Corporation
(retirement July 24, 2008)

54
Brown-Forman annual report 2008
Listed
New York Stock Exchange
New York City
BFA/BFB
Registrar and Transfer Agent and Dividend Disbursing Agent
National City Bank
Cleveland, Ohio
E-mail Address: [email protected]
Counsel
Stoll Keenon Ogden PLLC
Louisville, Kentucky
Independent Registered Public Accounting Firm
PricewaterhouseCoopers LLP
Louisville, Kentucky
Stock Performance Graph
This graph compares the cumulative total shareholder return of our
Class B Common Stock against the Standard & Poor’s 500 Stock Index,
the Dow Jones U.S. Consumer Goods Index, and the Dow Jones U.S.
Food & Beverage Index. The graph assumes $100 was invested on
April 30, 2003, and that all dividends were reinvested. The cumulative
returns shown on the graph represent the value that these investments
would have had on April 30 in the years since 2003.
Environmental Stewardship
Brown-Forman is committed to being a responsible corporate citizen.
As a responsible corporate citizen, Brown-Forman is committed to
environmental stewardship and sustainability. Our environment efforts
focus primarily on the efficient use of natural resources, conserving energy
and water, and minimizing waste.
This Annual Report is printed on FSC-certified paper. The uncoated
pages are printed on recycled stock. The coated pages are from
mixed sources.
corporate inFormation
Corporate Headquarters
850 Dixie Highway
Louisville, KY 40210
(502) 585-1100
Internet Address: www.brown-forman.com
E-mail Address: [email protected]
Employees
On April 30, 2008, Brown-Forman employed about 4,466 people, including
approximately 331 on a part-time or temporary basis. Brown-Forman
Corporation is an Equal Employment Opportunity and Affirmative
Action employer. All human resource practices, actions, and programs
are administered without regard to race, color, national or ethnic origin,
gender, age, religion, veteran status, sexual preference, or disability. It is
also the policy of Brown-Forman to prohibit sexual and other harassment.
Stockholders
The two classes of stock of Brown-Forman Corporation are listed on the
New York Stock Exchange. There were 3,417 holders of record of Class
A Common Stock and 4,028 holders of record of Class B Common Stock
as of April 30, 2008. Stockholders reside in all 50 states and in 26
foreign countries.
Dividend Reinvestment Service
For information on the Company’s Dividend Reinvestment Service,
write to:
National City Bank, Dept. 5352
Corporate Trust Operations
P.O. Box 94946
Cleveland, OH 44101-4946
1-800-622-6757
Form 10-K
Interested stockholders may obtain without charge a copy of the
Company’s Form 10-K, as filed with the Securities and Exchange
Commission, upon written request to: Stockholder Services, Brown-
Forman Corporation, P.O. Box 1080, Louisville, KY 40201-1080. The
Form 10-K can also be downloaded from the Company’s Web site at
www.brown-forman.com. Click on the Investor Relations section of
the Web site and then click on Financial Reports and Filings and
then on SEC Filings to view the Form 10-K, as well as other
important documents.
Corporate Governance Guidelines, Committee Charters and Codes
The Board approved Corporate Governance Guidelines are published on
the Company’s Web site. These guidelines include director responsibili-
ties and qualification standards, director compensation, management
succession policies and principles, director access to management and,
as appropriate, independent advisors, and an annual performance
self-evaluation of the Board. The Company also has posted on its Web site
the Audit Committee, Corporate Governance and Nominating Commit-
tee, and Compensation Committee charters, as well as the Company’s
Code of Conduct, which applies to all directors and employees, and a
Code of Ethics that applies specifically to the Company’s senior financial
officers. Copies of the Corporate Governance Guidelines, Committee
charters and these Codes are also available by writing to our Corporate
Secretary, Matt Hamel, 850 Dixie Highway, Louisville, KY 40210 or
e-mailing him at [email protected]
COMPOUNd ANNUAL GROwTh IN TOTAL ShAREhOLdER RETURN (as of April 30, 2008, including dividend reinvestment)
2003 2004 2005 2006 2007 2008
$100$100$100$100
$125$134$127$123
$150$138$125$131
$205$149$130$151
$184$177$154$174
$199$174$163$158
bf CLASS b ShARES S&P 500 INdEx
dOw JONES U.S.CONSUMER GOOdS
dOw JONES U.S.fOOd & bEvERAGE
2003 2004 2005 2006 2007 2008
199.05
173.87162.73157.97
bf CLASS b ShARES
S&P 500 INdEx
dOw JONES U.S.CONSUMER GOOdS
dOw JONES U.S.fOOd & bEvERAGE
