brooks expert support tool (best) software for sla …/media/brooks/documentation... · brooks®...
TRANSCRIPT
Installation and Operation Manual X-SW-BEST-eng Part Number: 541B197AAG February, 2017
Page 1
Brooks® Expert Support Tool (BEST)
Software For SLA Devices
(for version 4.2.0.0)

Installation and Operation Manual X-SW-BEST-eng Part Number: 541B197AAG February, 2017
Page 2
Dear Customer,
We recommend that you read this manual in its entirety as there have been some changes since previous versions. This will enable efficient and proper use of the Brooks Expert Support Tool software. Should you require any additional information concerning Brooks Expert Support Tool, please feel free to contact your local Brooks Sales and Service Office; see back cover for contact information, or visit us on the web at www.BrooksInstrument.com. We appreciate this opportunity to service your fluid measurement and control requirements, and trust that we will be able to provide you with further assistance in future.
Yours sincerely,
Brooks Instrument

Installation and Operation Manual X-SW-BEST-eng Part Number: 541B197AAG February, 2017
Page 3
Section 2 - Installation
Brooks Expert Support Tool
Contents
1. Introduction ............................................................................................................................................ 10
1.1. Theory of Operation ................................................................................................................. 12
1.1.1. Thermal Mass Flow Controller ................................................................................. 12
1.1.2. Pressure Controller .................................................................................................. 12
1.1.3. Remote Transducer (RT) Flow and Pressure Controller ......................................... 13
1.1.4. Set point ................................................................................................................... 13
1.2. How to Use This Manual ......................................................................................................... 14
1.3. Integrated Help ........................................................................................................................ 14
2. Installation .............................................................................................................................................. 15
2.1. Hardware Requirements .......................................................................................................... 15
2.2. System Requirements ............................................................................................................. 16
2.3. Installing the Brooks Expert Support Tool Application ............................................................ 16
2.4. Uninstalling the Brooks Expert Support Tool Application ........................................................ 18
2.5. Connection Procedure ............................................................................................................. 18
2.6. Disconnecting the PC from the Device .................................................................................... 20
3. Basic Operations ................................................................................................................................... 21
3.1. Brooks Expert Support Tool Conventions ............................................................................... 21
3.2. Main Screen ............................................................................................................................. 22
3.3. Menu Bar ................................................................................................................................. 23
4. File Menu ................................................................................................................................................ 23
5. Help Menu ............................................................................................................................................... 23
5.1. About Window ......................................................................................................................... 24
5.2. License Info Window ............................................................................................................... 25
5.3. License Install Window ............................................................................................................ 25
5.4. Help Menu ............................................................................................................................... 26
6. Window Menu ......................................................................................................................................... 26
7. Settings ................................................................................................................................................... 29
7.1. Graph Options ......................................................................................................................... 30
7.2. Data Logging Options .............................................................................................................. 31
7.3. User Totalizer Options ............................................................................................................. 31
Installation and Operation Manual X-SW-BEST-eng Part Number: 541B197AAG February, 2017
Page 4
Section 2 - Installation
Brooks Expert Support Tool
8. Tools Menu ............................................................................................................................................. 32
8.1. Pressure Units Calculator ........................................................................................................ 32
8.2. Flow Units Calculator ............................................................................................................... 33
8.3. Temperature Units Calculator .................................................................................................. 34
9. Device Comm Menu .............................................................................................................................. 34
9.1.1. Device Connection Window ...................................................................................... 35
9.1.2. Terminal Window ...................................................................................................... 39
10. Device Config Menu ............................................................................................................................ 40
10.1. Section Deleted ..................................................................................................................... 41
10.2. Section Deleted ..................................................................................................................... 42
10.3. DumpFiles.............................................................................................................................. 42
10.4. Device Info ............................................................................................................................. 43
10.5. Model Code Window ............................................................................................................. 43
10.6. Wake Up State ...................................................................................................................... 45
10.7. RT Pressure Controller Direction .......................................................................................... 45
10.8. RT Control Mode ................................................................................................................... 46
10.9. Meter Simulate MFC .............................................................................................................. 47
10.10. Protocol Settings ................................................................................................................. 47
10.11. Warnings and Alarms .......................................................................................................... 52
10.12. Warning Settings ................................................................................................................. 54
10.13. Alarm Settings ..................................................................................................................... 54
10.14. Restrictor Selection ............................................................................................................. 56
10.15. Orifice Selection .................................................................................................................. 57
11. Device Control Menu ........................................................................................................................... 58
11.1. Reboot Device ....................................................................................................................... 59
11.2. Valve Control ......................................................................................................................... 59
12. Calibration Menu.................................................................................................................................. 60
12.1. Pressure Controller Setup Diagram ...................................................................................... 61
12.2. Sensor Zero ........................................................................................................................... 62
12.2.1. Flow Sensor Zero .................................................................................................. 62
12.2.2. Pressure Sensor Zero ........................................................................................... 64
12.3. Analog Output Calibration ..................................................................................................... 66
12.4. Analog Input Calibration ........................................................................................................ 69
12.5. RT/Aux Input Calibration ....................................................................................................... 73
12.6. Cal Pages .............................................................................................................................. 76
12.6.1. Flow Cal Pages ..................................................................................................... 76

Installation and Operation Manual X-SW-BEST-eng Part Number: 541B197AAG February, 2017
Page 5
Section 2 - Installation
Brooks Expert Support Tool
12.6.2. Pressure Cal Pages ............................................................................................... 79
12.7. Calibration.............................................................................................................................. 81
12.7.1. Flow Calibration ..................................................................................................... 81
12.7.2. Pressure Controller Calibration ............................................................................. 95
12.7.3. RT Device Calibration.......................................................................................... 107
12.8. Valve Tuning ........................................................................................................................ 108
13. Monitoring Menu ................................................................................................................................ 118
13.1. Warning Status .................................................................................................................... 119
13.2. Alarm Status ........................................................................................................................ 119
13.3. User Totalizer Window ........................................................................................................ 120
13.4. Graph Window ..................................................................................................................... 121

Installation and Operation Manual X-SW-BEST-eng Part Number: 541B197AAG February, 2017
Page 6
Section 2 - Installation
Brooks Expert Support Tool
Table of Figures
Figure 1 BEST Software, Sample Screen ................................................................................................... 14
Figure 2 RS232 to RS485 Converter ........................................................................................................... 15
Figure 3 USB to RS485 Converter .............................................................................................................. 15
Figure 4 Run setup.exe as an Admin .......................................................................................................... 17
Figure 5 Installer Software Component Menu ............................................................................................. 17
Figure 6 RS232 to RS485 Connection ........................................................................................................ 19
Figure 7 Typical Diagnostics Port Connection. ........................................................................................... 19
Figure 8 Example Numeric Up/Down Control ............................................................................................. 21
Figure 9 Main Screen with Device Connection Window .............................................................................. 22
Figure 10 File->Exit Menu ........................................................................................................................... 23
Figure 11 Help Menu ................................................................................................................................... 24
Figure 12 About Window ............................................................................................................................. 24
Figure 13 License Information Window ....................................................................................................... 25
Figure 14 License Installation Window ........................................................................................................ 26
Figure 15 Window Menu Item ...................................................................................................................... 26
Figure 16 Main Graph Window .................................................................................................................... 27
Figure 17 Cascade Window Layout............................................................................................................. 28
Figure 18 Tiled Windows ............................................................................................................................. 28
Figure 19 Minimized Windows ..................................................................................................................... 29
Figure 20 Settings Menu ............................................................................................................................. 29
Figure 21 Graph Options Window ............................................................................................................... 30
Figure 22 Data Logging Options .................................................................................................................. 31
Figure 23 User Totalizer Options ................................................................................................................. 32
Figure 24 Tools Menu .................................................................................................................................. 32
Figure 25 Pressure Units Conversion Calculator ........................................................................................ 33
Figure 26 Flow Units Conversion Calculator ............................................................................................... 33
Figure 27 Temperature Units Conversion Calculator .................................................................................. 34
Figure 28 Device Connection Window ........................................................................................................ 35
Figure 29 No Device Connected ................................................................................................................. 35
Figure 30 Device Connection Menu. ........................................................................................................... 36
Figure 31 Connection Window, Single Device Attached ............................................................................. 37
Figure 32 Device Connection Window, Multiple Devices Connected ......................................................... 38

Installation and Operation Manual X-SW-BEST-eng Part Number: 541B197AAG February, 2017
Page 7
Section 2 - Installation
Brooks Expert Support Tool
Figure 33 Terminal Window ......................................................................................................................... 40
Figure 34 Device Config Menu .................................................................................................................... 41
Figure 35 BEST Control Message ............................................................................................................... 41
Figure 36 Deleted ........................................................................................................................................ 41
Figure 37 Deleted ........................................................................................................................................ 42
Figure 38 deleted ......................................................................................................................................... 42
Figure 39 Dump File Window ...................................................................................................................... 42
Figure 40 Device Info Window ..................................................................................................................... 43
Figure 41 Model Code Window ................................................................................................................... 44
Figure 42 Wake Up State Window .............................................................................................................. 45
Figure 43 RT Pressure Controller Direction Window .................................................................................. 46
Figure 44 RT Control Mode Window ........................................................................................................... 46
Figure 45 Meter Simulate MFC Window...................................................................................................... 47
Figure 46 S-Protocol Window ...................................................................................................................... 48
Figure 47 Device Net Protocol Window ....................................................................................................... 50
Figure 48 EtherCAT Protocol Window ......................................................................................................... 52
Figure 49 Warning Settings Window ........................................................................................................... 54
Figure 50 Alarm Settings RS485 Window ................................................................................................... 55
Figure 51 Alarm Settings Profibus Window ................................................................................................. 55
Figure 52 Alarm Settings DeviceNet/EtherCAT Window ............................................................................ 56
Figure 53 Restrictor Selection Window ....................................................................................................... 57
Figure 54 Orifice Selection Window ............................................................................................................ 58
Figure 55 Device Control Menu ................................................................................................................... 59
Figure 56 Reboot Device Window ............................................................................................................... 59
Figure 57 Valve Control Window ................................................................................................................. 60
Figure 58 Calibration Menu ......................................................................................................................... 61
Figure 59 Pressure Controller Setup Diagram ............................................................................................ 62
Figure 60 Flow Sensor Zero Window .......................................................................................................... 63
Figure 61 Sensor Zero PSIA Warning ......................................................................................................... 65
Figure 62 Pressure Sensor Calibration (Straight Offset Method) ................................................................ 65
Figure 63 Setup for Calibrating an Output Voltage ..................................................................................... 66
Figure 64 Setup for Calibrating an Output Current ...................................................................................... 66
Figure 65 Analog Output Calibration Window ............................................................................................. 67
Figure 66 Analog Output Check Window .................................................................................................... 68

Installation and Operation Manual X-SW-BEST-eng Part Number: 541B197AAG February, 2017
Page 8
Section 2 - Installation
Brooks Expert Support Tool
Figure 67 Analog Output Cal, Low Point ..................................................................................................... 68
Figure 68 Analog Output Cal, High Point .................................................................................................... 69
Figure 69 Setup for Calibrating an Analog Input for Voltage ....................................................................... 70
Figure 70 Setup for Calibrating an Analog Input for Current ....................................................................... 70
Figure 71 Analog Input Calibration Window ................................................................................................ 71
Figure 72 Analog Input, Low ........................................................................................................................ 72
Figure 73 Analog Input, High ....................................................................................................................... 73
Figure 74 Setup for Calibrating the RT Input ............................................................................................... 74
Figure 75 RT/Aux Analog Input ................................................................................................................... 74
Figure 76 RT/Aux Analog Input Cal, Low .................................................................................................... 75
Figure 77 RT/Aux Analog Input Cal, High .................................................................................................. 75
Figure 78 Cal Pages Window, For Flow Devices ........................................................................................ 77
Figure 79 Create Default Page, For Flow Devices ...................................................................................... 78
Figure 80 Cal Pages Window, For Pressure Devices ................................................................................. 79
Figure 81 Create Default Page Window, For Pressure Devices ................................................................. 80
Figure 82 Flow Calibration Window ............................................................................................................. 82
Figure 83 Flow Calibration, Calibration Tab ................................................................................................ 83
Figure 84 Edit Setpoints Window ................................................................................................................ 84
Figure 85 Calibration Tab, Filled Out........................................................................................................... 85
Figure 86 Flow Cal, Meter Set Point Prompt ............................................................................................... 85
Figure 87 Flow Calibration, Surrogate Page Tab ........................................................................................ 86
Figure 88 Flow Calibration, Customer Tab .................................................................................................. 87
Figure 89 Mixed Gas Data Window ............................................................................................................. 89
Figure 90 Flow Cal, Mixed Gas, Customer Tab .......................................................................................... 89
Figure 91 Flow Calibration, Validation Page ............................................................................................... 90
Figure 92 Flow Cal, Cert Sheet Preview Page ............................................................................................ 93
Figure 93 Flow Cal, Cert Sheet Report Preview ......................................................................................... 94
Figure 94 Pressure Calibration Window, Cal Setup Tab Shown ................................................................. 95
Figure 95 Pressure Calibration, Orifice Tab ................................................................................................ 97
Figure 96 Pressure Calibration, Calibration Tab ......................................................................................... 97
Figure 97 Pressure Sensor Zero, High Point .............................................................................................. 99
Figure 98 Pressure Sensor Zero, Low Point ............................................................................................. 100
Figure 99 Pressure Calibration, Calibration Tab ....................................................................................... 101
Figure 100 Pressure Calibration, Linearization Page Tab......................................................................... 102

Installation and Operation Manual X-SW-BEST-eng Part Number: 541B197AAG February, 2017
Page 9
Section 2 - Installation
Brooks Expert Support Tool
Figure 101 Pressure Calibration, Customer Page Tab ............................................................................. 103
Figure 102 Pressure Calibration, Validation Tab ....................................................................................... 104
Figure 103 Pressure Calibration, Cert Sheet Options Window ................................................................. 106
Figure 104 Pressure Calibration, Cert Sheet Preview Window ................................................................. 107
Figure 105 Pressure Page Window ........................................................................................................... 108
Figure 106 Flow Valve Tuning Setup Window .......................................................................................... 110
Figure 107 Pressure Valve Tuning Setup Window .................................................................................... 110
Figure 108 Flow Valve Tuning Operation .................................................................................................. 111
Figure 109 Valve Tuning, Kp value is too high, or Ki is too low. ............................................................... 112
Figure 110 Valve Tuning, Kp and Ki values too low. ................................................................................. 112
Figure 111 Original PID settings ................................................................................................................ 113
Figure 112 Valve Tuning, Increase Kp value ............................................................................................ 113
Figure 113 Valve Tuning, Overshoot ......................................................................................................... 114
Figure 114 Pressure Valve Tuning, Default Values .................................................................................. 115
Figure 115 Pressure Valve Tuning, Cycle Settings ................................................................................... 115
Figure 116 Pressure Valve Tuning, Kp Low .............................................................................................. 116
Figure 117 Pressure Valve Tuning, Ki Low ............................................................................................... 116
Figure 118 Pressure Valve Tuning, Correct Kp and Ki Values ................................................................. 117
Figure 119 Anti Windup for a Normally Closed valve ................................................................................ 117
Figure 120 Anti Windup for a Normally Open valve .................................................................................. 118
Figure 121 Warning Status Window .......................................................................................................... 119
Figure 122 Alarm Status Window .............................................................................................................. 120
Figure 123 User Totalizer Window ............................................................................................................ 121
Figure 124 Main Graph Window ................................................................................................................ 121
Figure 125 Main Graph Window with Cursor ............................................................................................ 123
Figure 126 Main Graph Window Context Menu ........................................................................................ 124
Figure 127 Graph Window Zoomed .......................................................................................................... 124

Installation and Operation Manual X-SW-BEST-eng Part Number: 541B197AAG February, 2017
Page 10
Section 2 - Installation
Brooks Expert Support Tool
1. Introduction
The Brooks Expert Support Tool provides expanded control of the Brooks Digital Thermal Mass Flow Controller/Meters, Pressure Controller and Remote pressure Transducer (RT) models for servicing tasks that include setup, configuration, calibration*, tuning, control, monitoring, and troubleshooting.
*Use of calibration features requires a software license which is obtainable on a subscription basis. Contact Brooks Instrument for details. Other features do not require a license.
See Table 1 below for an overview of the supported models.
Table 1: Models Supported in BEST
Model Code Wildcard Customer Interface
SLA****S RS485 Analog supporting the digital S-Protocol
SLA****A Analog Only
SLA****P SLA****R SLA****T
Profibus
SLA****D SLA****J SLA****K SLA****L SLA****V
DeviceNet
SLA****E EtherCAT
Model Code Wildcard
Operation Mode Description
SLA**5* MFC Thermal Mass Flow Controller
SLA**6* MFM Thermal Mass Flow Meter
SLA**1* PC Pressure Controller downstream
SLA**2* PC Pressure Controller upstream
SLA**4* RT Thermal Mass Flow Controller with Remote Transducer (RT) input

Installation and Operation Manual X-SW-BEST-eng Part Number: 541B197AAG February, 2017
Page 11
Section 2 - Installation
Brooks Expert Support Tool
Using an RS232 to RS485 converter between a personal computer (PC) and the device’s service port, you can use the Brooks Expert Support Tool to view, control, and modify data such as:
Flow
Pressure
Set point
Analog input/output (I/O) configuration
Valve tuning
Device I/O calibrations
Diagnostics
Note: For device troubleshooting information, refer to the device’s Installation and Operations Manual.
Installation and Operation Manual X-SW-BEST-eng Part Number: 541B197AAG February, 2017
Page 12
Section 2 - Installation
Brooks Expert Support Tool
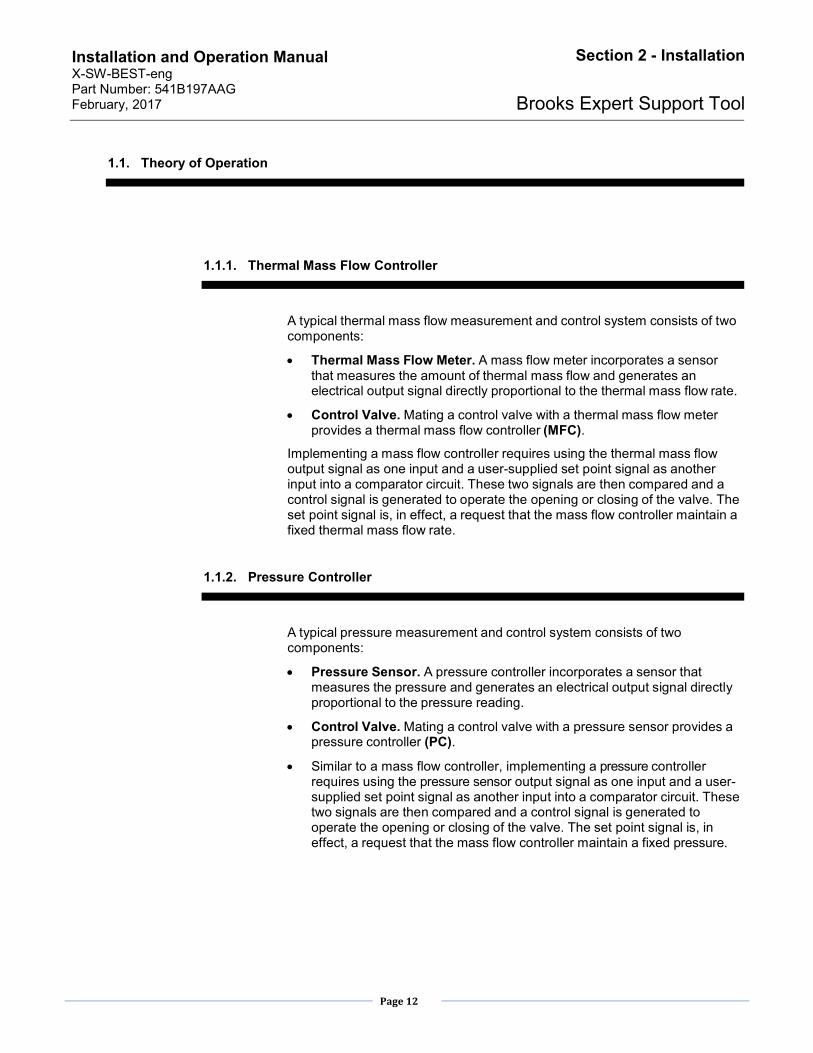
1.1. Theory of Operation
1.1.1. Thermal Mass Flow Controller
A typical thermal mass flow measurement and control system consists of two components:
Thermal Mass Flow Meter. A mass flow meter incorporates a sensor that measures the amount of thermal mass flow and generates an electrical output signal directly proportional to the thermal mass flow rate.
Control Valve. Mating a control valve with a thermal mass flow meter provides a thermal mass flow controller (MFC).
Implementing a mass flow controller requires using the thermal mass flow output signal as one input and a user-supplied set point signal as another input into a comparator circuit. These two signals are then compared and a control signal is generated to operate the opening or closing of the valve. The set point signal is, in effect, a request that the mass flow controller maintain a fixed thermal mass flow rate.
1.1.2. Pressure Controller
A typical pressure measurement and control system consists of two components:
Pressure Sensor. A pressure controller incorporates a sensor that measures the pressure and generates an electrical output signal directly proportional to the pressure reading.
Control Valve. Mating a control valve with a pressure sensor provides a pressure controller (PC).
Similar to a mass flow controller, implementing a pressure controller requires using the pressure sensor output signal as one input and a user-supplied set point signal as another input into a comparator circuit. These two signals are then compared and a control signal is generated to operate the opening or closing of the valve. The set point signal is, in effect, a request that the mass flow controller maintain a fixed pressure.

Installation and Operation Manual X-SW-BEST-eng Part Number: 541B197AAG February, 2017
Page 13
Section 2 - Installation
Brooks Expert Support Tool
1.1.3. Remote Transducer (RT) Flow and Pressure Controller
The remote pressure transducer model (RT), capable of controlling both flow and pressure (but not simultaneously), consists of three components:
Thermal Mass Flow Meter. A mass flow meter incorporates a sensor that measures the amount of thermal mass flow and generates an electrical output signal directly proportional to the thermal mass flow rate.
Remote Pressure Transducer Analog Input. A 0 to 5 Volt or 0 to 10 Volt selectable analog input allowing a user to connect to a remote pressure transducer providing the pressure reading.
Control Valve. Mating a control valve with a thermal mass flow sensor and an external pressure transducer provides a combined flow and pressure controller (RT). In the default controller mode, either pressure or flow control can be selected.
1.1.4. Set point
A set point signal can come in many forms. The Brooks MFC devices can be digital or analog controlled. The analog input/output (I/O) signals between the thermal mass flow device and the user’s control side are represented as a voltage (0–5 Vdc, 1–5 Vdc or 0-10 Vdc) or current (0–20 mA or 4–20 mA). Alternately, a service tool (i.e. software) can be used to drive the set point digitally.
The Brooks Expert Support Tool software communicates with the device using an RS485 to RS232 converter or an RS485 to USB converter between the PC and the device’s diagnostics port connector. A proprietary digital protocol is used over this connection. The Brooks Expert Support Tool has two operating modes:
Indicator, in which the Brooks Expert Support Tool is reporting on the data sent to it from the device, but the device is being controlled by the normal set point source.
Control, in which the Brooks Expert Support Tool user specifies the set point, overriding the normal set point source.
In either arrangement, the device will attempt to manage the opening and closing of the control valve to maintain the amount of thermal mass flow as requested by the set point source.
Note that the Brooks Expert Support Tool is meant to be used as a startup and troubleshooting tool. It is not intended to be permanently connected to the device in your system/application.

Installation and Operation Manual X-SW-BEST-eng Part Number: 541B197AAG February, 2017
Page 14
Section 2 - Installation
Brooks Expert Support Tool
Figure 1 BEST Software, Sample Screen
1.2. How to Use This Manual
It is recommended that you read this manual completely before installing or using the Brooks Expert Support Tool.
Note: For device troubleshooting information, refer to the device’s Installation and Operations Manual
1.3. Integrated Help
This user manual (which is searchable) can be accessed directly from the software, on the About->Help menu item. See section 5.4.
Installation and Operation Manual X-SW-BEST-eng Part Number: 541B197AAG February, 2017
Page 15
Section 2 - Installation
Brooks Expert Support Tool
2. Installation
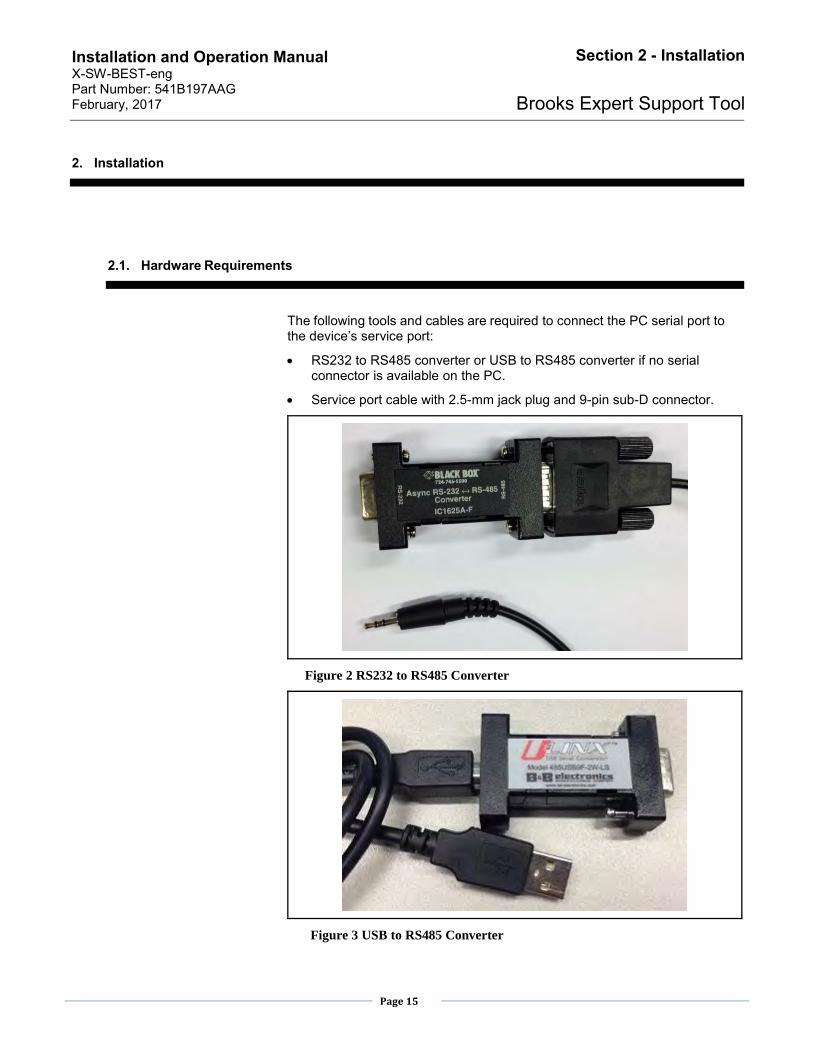
2.1. Hardware Requirements
The following tools and cables are required to connect the PC serial port to the device’s service port:
RS232 to RS485 converter or USB to RS485 converter if no serial connector is available on the PC.
Service port cable with 2.5-mm jack plug and 9-pin sub-D connector.
Figure 2 RS232 to RS485 Converter
Figure 3 USB to RS485 Converter

Installation and Operation Manual X-SW-BEST-eng Part Number: 541B197AAG February, 2017
Page 16
Section 2 - Installation
Brooks Expert Support Tool
This equipment may be purchased either along with the Brooks Expert Support Tool software or separately from Brooks Instrument. Contact the factory or your local representative for details.
No license dongle is required, but a software license is required for Pro features of BEST.
2.2. System Requirements
This section describes system and software requirements to use the Brooks Expert Support Tool application onto a personal computer (PC).
The Brooks Expert Support Tool application can be installed on a Windows PC with the following requirements:
Table 2: System Requirements
Component Minimum Requirements
Operating System Microsoft Windows 7 – 32-bit/64-bit Microsoft Windows 8 – 32-bit/64-bit Microsoft Windows XP, SP3 – 32-bit
Graphics Resolution 1024 x 768, minimum*
COM Port One dedicated serial port or USB port Software License Required for Pro Features (Calibration)
*It is recommended to operate Windows with the text size set to smaller (100%) or Medium (125%), but not Larger (150%). Go to Control Panel->Screen Resolution->Make text and other items larger.
2.3. Installing the Brooks Expert Support Tool Application
This section describes how to install the Brooks Expert Support Tool application onto a personal computer (PC).
Uninstallation of existing versions of BEST prior to installation is not required, but recommended. If you install over a previous version (> version 4.0) without uninstalling first, your user settings will be preserved. See section 2.4 below for more details about uninstallation.
Versions of BEST above 4.0.0.0 can co-exist with versions below 4.0.0.0.
To install the Brooks Expert Support Tool application, download the BEST file from the Products/Software Section of the Brooks Instrument website (www.brooksinstrument.com). Once the setup file is downloaded and uncompressed, run the setup.exe file (it is recommended to run this file as an administrator (see Figure 4).

Installation and Operation Manual X-SW-BEST-eng Part Number: 541B197AAG February, 2017
Page 17
Section 2 - Installation
Brooks Expert Support Tool
Figure 4 Run setup.exe as an Admin
Next, follow the installation instructions provided by the software. It is recommended to install BEST and its componenets in the default folders provided by the installer.
The installer will install BEST and its required software components, including versions of FloCom, FloComPlus and the FlocCom databases..
For users who require a specific version of the FloCom database component, during the installation, the user will be presented with a software component selection menu (see Figure 5). Uncheck the item FloCom Databases to preserve the currently installed version/not install the version from the installer. *NOTE: BEST requires some version of the FloCom database be installed. If you do not install the database from the installer you must ensure that the desired version of FloCom database is installed separately from the BEST installer.
Figure 5 Installer Software Component Menu

Installation and Operation Manual X-SW-BEST-eng Part Number: 541B197AAG February, 2017
Page 18
Section 2 - Installation
Brooks Expert Support Tool
During installation, if it is installing a software component that already exists, the installer may present you with the options of Modify, Repair, or Remove, or similar. Typically, chooose repair.
The installer will optionally create an item in the Brooks Instrument program group and a shortcut icon on the Windows desktop.
Upon completion of installation, A software license must also be installed for access to Pro features of BEST. Contact Brooks Instrument to obtain a license. License installation instructions are covered in section 5.3.
2.4. Uninstalling the Brooks Expert Support Tool Application
To uninstall BEST, go to the Windows Control Panel -> Programs and Features. Look for any items entitled “Brooks Expert Support Tool”. Right click the item and select Uninstall. Follow the onscreen instructions. Repeat for any items with the title “Brooks Expert Support Tool”.
Also, uninstalling removes any user preferences and resets them to default values upon re-installation.
*NOTE: The uninstallation does not uninstall any of the auxiliary components such as FloCom or FloCom databases, installed with BEST. These do not necessarily need to be uninstalled, but to uninstall, repeat the above paragraph for the item “FloCom”, etc.
2.5. Connection Procedure
To physically connect the PC to the device’s service port:
1. Connect the RS232 side of the RS232 to RS485 converter or the USB side of the USB to RS485 converter to a serial port or USB port on your computer, as shown in Figure 6. Ensure the “RS232” side is connected to the computer.

Installation and Operation Manual X-SW-BEST-eng Part Number: 541B197AAG February, 2017
Page 19
Section 2 - Installation
Brooks Expert Support Tool
Figure 6 RS232 to RS485 Connection
2. Insert the 2.5-mm jack plug into the device’s diagnostics port (labeled “DIAG” on the device, as shown in Figure 7.
Figure 7 Typical Diagnostics Port Connection.
Note: some device types have a different appearance, but all contain the same type of “DIAG” portConnect the desired power cable to the device and to the power source.

Installation and Operation Manual X-SW-BEST-eng Part Number: 541B197AAG February, 2017
Page 20
Section 2 - Installation
Brooks Expert Support Tool
3. Verify that the device is powered on and the MOD LED is solid green or flashing red.
You are now ready to use the Brooks Expert Support Tool.
2.6. Disconnecting the PC from the Device
When you are done using the Brooks Expert Support Tool, you should disconnect the computer from the device.
To disconnect the computer from the device’s service port:
1. Exit from the Brooks Expert Support Tool software.
2. Disconnect the RS232 to RS485 converter or USB to RS485 converter from the PC and disconnect the 2.5-mm jack plug from the device.

Installation and Operation Manual X-SW-BEST-eng Part Number: 541B197AAG February, 2017
Page 21
Brooks Expert Support Tool
3. Basic Operations
3.1. Brooks Expert Support Tool Conventions
The Brooks Expert Support Tool was designed to remain consistent with regard to how the user interacts with the application across all functions and features. It is also generally consistent with Windows user interface conventions.
The following text field conventions apply throughout the software:
Text fields with a gray background display a read-only value (such as the Current Position (%) in Figure 8 below).
Text fields with a white background are editable (such as Set Valve Position (%) in Figure 8 below).
Usually, editable text fields update the software or device either when the user clicks the Enter button, when the focus moves to another field by using the Tab key or mouse, or when a separate apply button is clicked (see each section in the manual for specific instructions).
If a text box contains “NaN” or “n. def.” it means “Not a Number”, not defined, or invalid calculation result.
Many windows also require numeric input from the user. This type of window is also called a “form”. For numeric input, forms often feature numeric up/down controls. See Figure 8 below for an example of a numeric up/down control (circled).
Figure 8 Example Numeric Up/Down Control
Up/down controls help prevent invalid numeric data entry. Click the up arrow to increment the numeric value, or the down arrow to decrement. Up/down controls also have maximum and minimum values. You may also type in a number directly, but it won’t allow non-numeric entry. Also, in some cases, it won’t accept a thousands separator character (for example, “,” in English culture). In most forms, you may also click enter to accept the entered value, or move the focus off the control to another control on the form.

Installation and Operation Manual X-SW-BEST-eng Part Number: 541B197AAG February, 2017
Page 22
Brooks Expert Support Tool
Data Entry and International Locales:
Currently, BEST must be run with the Windows regional settings set to English. A future revision of BEST is planned for non-English cultures.
3.2. Main Screen
When the BEST software is started (either from the Brooks Instrument program folder or a shortcut on the desktop), the main screen appears as shown in Figure 9 below
Title Bar-> Menu Bar-> Devices Panel->
Status Bar->
Figure 9 Main Screen with Device Connection Window
The Title Bar shows the name and current version of the software. The title bar can also be used to select, move, and maximize the window, according to Windows conventions.
The Menu Bar is where most functionality of BEST is accessed. BEST windows are opened from the menu bar. Menu items are typically accessed from left to right and top to bottom.
The BEST desktop is where all opened BEST windows exist. This is similar to the Windows desktop, except that this desktop contains only BEST windows. See also section 6.
The Status Bar shows useful instructions and messages about the current status of the software and its processes.

Installation and Operation Manual X-SW-BEST-eng Part Number: 541B197AAG February, 2017
Page 23
Brooks Expert Support Tool
You will notice that when the software first starts, it shows the device connection window in the center of the Window Background. To use most features of BEST, you must first “attach” (or establish communication with) a device using the connection window. See section 9.1.1 for more details about the Connection Window.
3.3. Menu Bar
The Menu Bar (see Figure 9) is where most functionality of BEST is accessed. BEST windows are opened from the menu bar, and then those windows will exist on the BEST Desktop. Menu items are typically accessed from left to right and top to bottom.
Note that this manual shows all menu items. Certain menus may not appear if the features of those menus are not supprted by the currently selected device.
4. File Menu
The File Menu Item contains a place to exit the program. See Figure 10 below. (You may also exit the program via the “X” in the upper right of the title bar, according to Windows convention).
Figure 10 File->Exit Menu
5. Help Menu
The Help Menu Item is where information about the BEST software can be accessed, including the current version of BEST, licensing options, and user help. A device connection is not required to access these menu items.

Installation and Operation Manual X-SW-BEST-eng Part Number: 541B197AAG February, 2017
Page 24
Brooks Expert Support Tool
Figure 11 Help Menu
5.1. About Window
The About-> About Menu Item is where information about the current version of BEST and it software components can be viewed. Information provided includes the current version of BEST and it software components. (The current version of BEST is also always visible in the main screen’s title bar.)
Figure 12 About Window

Installation and Operation Manual X-SW-BEST-eng Part Number: 541B197AAG February, 2017
Page 25
Brooks Expert Support Tool
5.2. License Info Window
The License Info Menu Item is where information about installed licenses for the current version of BEST can be viewed (but not updated). The user may also set options about when to be reminded of license expiration.
Figure 13 License Information Window
5.3. License Install Window
The License Install Menu Item is where licenses may be installed (and uninstalled). To obtain a license, the user must contact Brooks Instrument to obtain a 1-year license subscription. The user will receive a license key (a number), then enter it in the License Key text block.
*NOTE: After receiving your license key, store it in a safe location (backed up and secure from unauthorized use) for later retrieval.
Normally, the license installation process requires an Internet connection. A license can be installed without an Internet connection – contact Brooks Instrument for details.

Installation and Operation Manual X-SW-BEST-eng Part Number: 541B197AAG February, 2017
Page 26
Brooks Expert Support Tool
Figure 14 License Installation Window
5.4. Help Menu
This manual (which is searchable) can be accessible directly from the software under the About->Help menu. A PDF file reader (such as Adobe Reader) must be installed on the computer to read this file.
6. Window Menu
The Window Menu Item is where BEST windows can be accessed and controlled.
Figure 15 Window Menu Item

Installation and Operation Manual X-SW-BEST-eng Part Number: 541B197AAG February, 2017
Page 27
Brooks Expert Support Tool
A note about BEST Windows and the BEST desktop: BEST windows exist on the BEST desktop (see Figure 9). This is similar to the Windows desktop, except that the BEST desktop contains only BEST windows. BEST windows are sized and closed in a similar way as in the Windows operating system. Most BEST windows can be sized, minimized, maximized, restored. Some BEST windows have minimum and/or maximum sizes. Multiple windows may be opened with some exceptions. Some windows, such as calibration windows, when they are open, do not allow access to other windows until they are first closed. (These are called “modal” windows).
Note also that the title bar of each BEST window shows the serial number of the device associated with that window.
If any windows are open in the BEST desktop, they will be listed in the Window menu under the Arrange item (see Figure 15). Clicking on one of those items will activate that window.
The most used window is the main graph window shown below in Figure 16 (see also section 13.4).
Legend-> <- User Annotation MainGraph-> Control Buttons-> Meters Panel-> Status Panel-> Graph Status Bar->
Figure 16 Main Graph Window
The Close All Window menu item closes all windows (for all devices).
The Cascade Window menu item, arranges all open windows in a “cascade” arrangement from the upper left corner of the windows. See figure 17 below.

Installation and Operation Manual X-SW-BEST-eng Part Number: 541B197AAG February, 2017
Page 28
Brooks Expert Support Tool
Figure 17 Cascade Window Layout
Tile will arrange all open windows in a “tile” arrangement. See Figure 18 below.
Figure 18 Tiled Windows
Minimize All minimizes all windows to an icon representation. See Figure 19 below.
Installation and Operation Manual X-SW-BEST-eng Part Number: 541B197AAG February, 2017
Page 29
Brooks Expert Support Tool
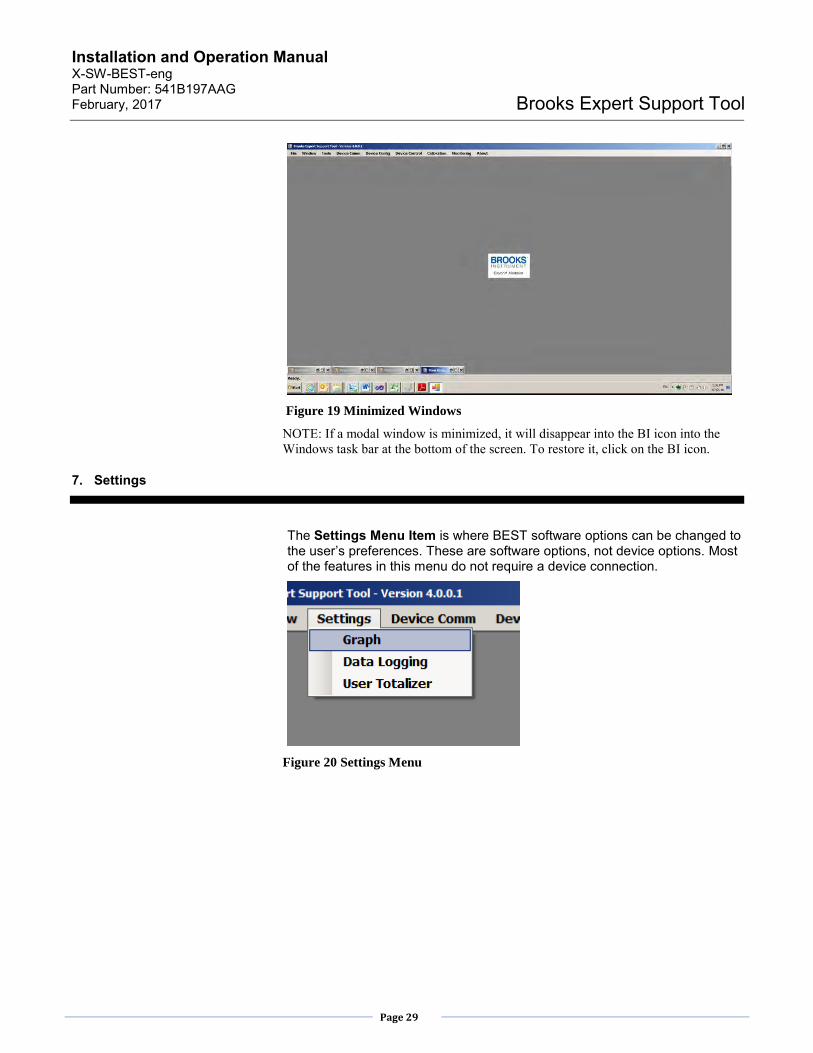
Figure 19 Minimized Windows
NOTE: If a modal window is minimized, it will disappear into the BI icon into the Windows task bar at the bottom of the screen. To restore it, click on the BI icon.
7. Settings
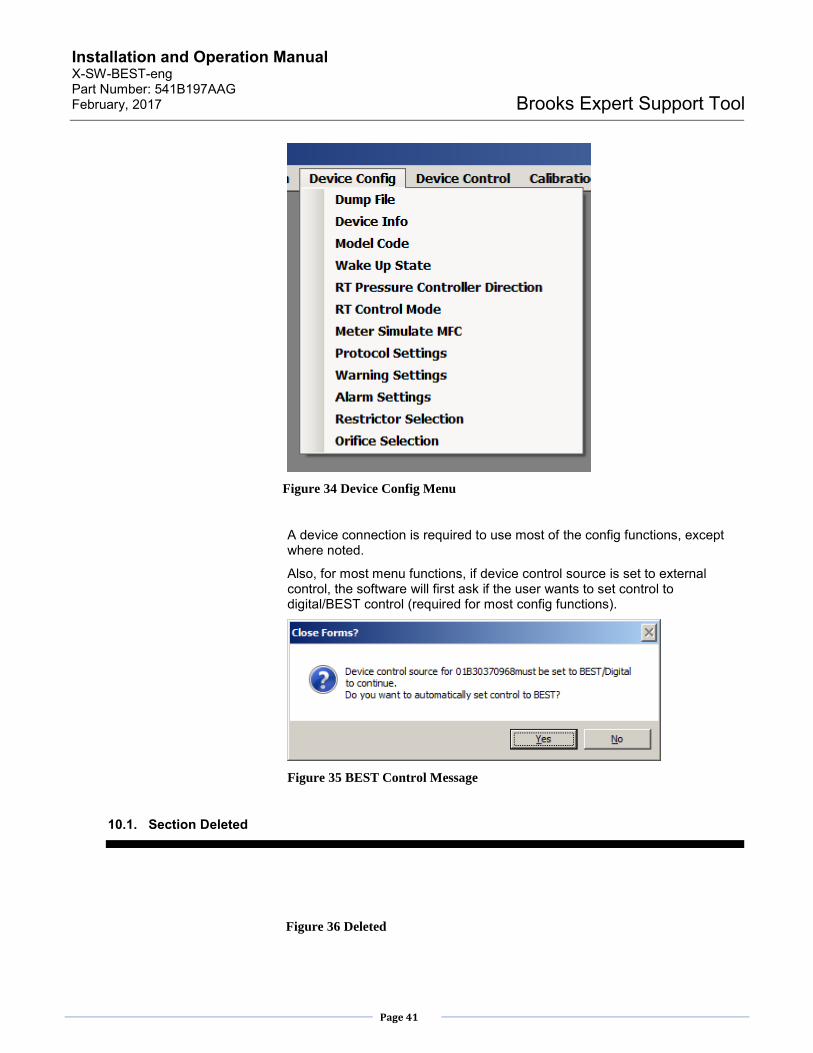
The Settings Menu Item is where BEST software options can be changed to the user’s preferences. These are software options, not device options. Most of the features in this menu do not require a device connection.
Figure 20 Settings Menu

Installation and Operation Manual X-SW-BEST-eng Part Number: 541B197AAG February, 2017
Page 30
Brooks Expert Support Tool
7.1. Graph Options
The Graph Options is where the user can select options and preferences for the operation of the main graph window. Here the user can select the data units, scaling, and graph legend options. See Figure 21 below for the graph options window.
For each graph parameter, the user can chose which parameters to show on the graph, legend and meters panel (see section 13.4 for more information on the meters panel of the main graph window).
The user can also choose to allow the software to determine which parameters to show automatically by choosing to select Auto Show Default Parameters, in which case the software will show only the parameters relevent for the device type (for example, an MFC device will not show pressure or pressure setpoint). If Auto Show Default Parameters is checked, the individual parmeters’ Show on Graph check boxes will be disabled – if it is unchecked they will be enabled.
For each parameter, the user can choose “device units” in which case the units stored in the device are automatically chosen for display.
The NumDec Places block sets the number of decimal places displayed for flow and presure across the software.
Figure 21 Graph Options Window

Installation and Operation Manual X-SW-BEST-eng Part Number: 541B197AAG February, 2017
Page 31
Brooks Expert Support Tool
7.2. Data Logging Options
The Data Logging Options Menu Item is where the user can set preferences as to whether data from the main graph window is to be saved to file as it monitors. The user can also conveniently open the last saved file directly by clicking a single button, the Open button. If there has been no data file saved for the current device, the file name shown will include wildcards for part of the file name. See Figure 22 below for the Data logging options window.
Figure 22 Data Logging Options
7.3. User Totalizer Options
The User Totalizer Options Menu Item is where the user can set preferences for the user totalizer (NOTE: the user totalizer is different than the device’s hardware totalizer. See section 13.4 for details on the hardware totalizer and section 13.3 for more details on the user totalizer). The user can set preferences as to how often to update the user totalizer window and reset the user totalizer. See Figure 23 below. The user totalizer units are always the same as the device’s settings for totalizer units.
A device must be attached to use this window.

Installation and Operation Manual X-SW-BEST-eng Part Number: 541B197AAG February, 2017
Page 32
Brooks Expert Support Tool
Figure 23 User Totalizer Options
8. Tools Menu
Figure 24 Tools Menu
The Tools Menu Item is where some utility tools can be accessed. Most of the features in this menu do not require a device connection.
8.1. Pressure Units Calculator
The Pressure Units Calculator Menu Item opens a convenient utility that can convert a pressure value from one unit to another.

Installation and Operation Manual X-SW-BEST-eng Part Number: 541B197AAG February, 2017
Page 33
Brooks Expert Support Tool
Figure 25 Pressure Units Conversion Calculator
8.2. Flow Units Calculator
The Flow Units Calculator Menu Item opens a convenient utility that can convert a flow value from one unit to another. The user can optionally factor into the conversion the reference temperature, and pressure.
Figure 26 Flow Units Conversion Calculator

Installation and Operation Manual X-SW-BEST-eng Part Number: 541B197AAG February, 2017
Page 34
Brooks Expert Support Tool
8.3. Temperature Units Calculator
The Temperature Units Calculator Menu Item opens a convenient utility which can convert a temperature value from one unit to another.
Figure 27 Temperature Units Conversion Calculator
9. Device Comm Menu
The Device Comm Menu Item is where BEST software performs communication tasks with a device. The Connection menu item establishes communication with a device. Terminal provides low-level communication (sending commands) with a device.

Installation and Operation Manual X-SW-BEST-eng Part Number: 541B197AAG February, 2017
Page 35
Brooks Expert Support Tool
9.1.1. Device Connection Window
Figure 28 Device Connection Window
Most features of BEST software require a connection to a device. If you attempt to access a feature that requires a device connection and you do have not connected to a device, you will see a message box that looks like the following:
Figure 29 No Device Connected
When BEST software starts, no devices are attached. Devices are attached via the device connection window. For convenience, the software opens the device connection window for you upon startup.

Installation and Operation Manual X-SW-BEST-eng Part Number: 541B197AAG February, 2017
Page 36
Brooks Expert Support Tool
You can close this window if you wish. If it is closed, you may re-open the window via the Device Comm->Connection menu or the Connection button in the devices panel (see Figure 9).
Figure 30 Device Connection Menu.
The diagnostics port of the device supports one or multiple devices connected simultaneously. The use of the connection window is slightly different when using a single device compared to multiple devices.
First, select the COM Port you are using to connect to the devices(s) in the Device Connection/Port drop-down list (see Figure 28). Next, select the desired Baud rate from the Device Connection/Baud rate drop-down list. Most users will choose optimize, which will automatically select the fastest baud rate that successfully communicates with the device. if you have trouble attaching to a device, you can try a lower baud rate to troubleshoot. Your selected port and baud rate selections will be retained by the software for convenience.
Attaching a single device:
In case there is only a single device connected, use the Next > 1 Device button to find the connected MAC address. After a few moments, if a device is located, its MAC ID (or “address”) is listed in the Mac ID drop-down list.
Once a device’s MAC address is located, make sure it is highlighted in the Mac ID drop-down list, then click on the Attach button. After a few moments, if it is attached, a row appears in the connected devices box, as shown in Figure 31 below.

Installation and Operation Manual X-SW-BEST-eng Part Number: 541B197AAG February, 2017
Page 37
Brooks Expert Support Tool
Figure 31 Connection Window, Single Device Attached
Attaching Multiple Devices Simultaneously:
BEST supports connecting to multiple devices simultaneously. There are two methods of doing this:
1.) Connecting multiple devices to a single COM port.
2.) Connecting using multiple COM ports.
Single COM Port
The diagnostics port supports RS485 communication, which is a multi-drop communication type. This means that it's possible to connect multiple devices simultaneously to a single RS485 communication cable (daisy chain). This requires a custom splitter cable between a single COM port on the computer and multiple devices. (This type of cable is not supplied by Brooks Instrument). Each device on a single COM port must have a unique MAC ID address.
Multiple COM Ports
You may also connect devices to multiple COM ports. Each device on a single COM port must have a unique MAC ID address on that COM port.
Using the Software to Attach
If you have connected multiple devices to a COM Port, you use the Next >> All Devices button to find the MAC addresses of all devices connected on the selected COM port.

Installation and Operation Manual X-SW-BEST-eng Part Number: 541B197AAG February, 2017
Page 38
Brooks Expert Support Tool
If the application has found one or more devices on the selected COM port, their MAC addresses will be listed in the Mac ID drop-down box. Choose the MAC address that you want to connect to from the drop down box and click the Attach button for each device you wish to attach. (You must attach one at a time).
The attached devices will be shown in the Connected Devices as shown in Figure 32 below. They will also be shown as buttons in the devices panel (see Figure 1).
Figure 32 Device Connection Window, Multiple Devices Connected
Selecting the active device:
While multiple devices may be attached simultaneously, only one at a time is considered the active device. If a single device is connected, it is considered the active device. If multiple devices are attached, the active device is selected by clicking on its row in the Connected Devices box. In Figure 32 above, the device at address 43 is selected as the active device. An attached device may also be selected by clicking the button in the device panel, or clicking the title bar of its associated main graph window. When a device is selected, the coresponding button is highlighted in green.

Installation and Operation Manual X-SW-BEST-eng Part Number: 541B197AAG February, 2017
Page 39
Brooks Expert Support Tool
Device Type Codes
In the Connected Devices box, under the Dev Type field, the possible values are:
MFC Mass Flow Controller
MFM Mass Flow Meter
PC Pressure Controller
RT Remote Transducer Device
Detaching a Device: To detach a device, make sure that device is selected as the active device (by the blue highlight bar), then click the Detach button. The device will be removed from the Connected Devices list and from the devices panel.
*NOTE: clicking the Detach button detaches the device highlighted in blue in the Connected Device list, NOT the device select in the Mac ID drop-down box.
You may close the Device Connection window with the Close button or clicking the “X” in the upper right of the Device Connection window’s title bar.
When you exit the BEST program, all devices are detached automatically.
9.1.2. Terminal Window
The Terminal provides low level communication access with a device. A connection to a device is required for this feature. This feature is for advanced users. A software license is required for this feature.
*NOTE: All numeric or date information entered into this window must be in English culture format. Likewise, any numeric or data information displayed in this window are in English culture format.

Installation and Operation Manual X-SW-BEST-eng Part Number: 541B197AAG February, 2017
Page 40
Brooks Expert Support Tool
Figure 33 Terminal Window
10. Device Config Menu
The Device Config Menu provides functionality to help a user configure a device with settings such as model code, control mode, alarm settings, and protocol settings.
Installation and Operation Manual X-SW-BEST-eng Part Number: 541B197AAG February, 2017
Page 41
Brooks Expert Support Tool
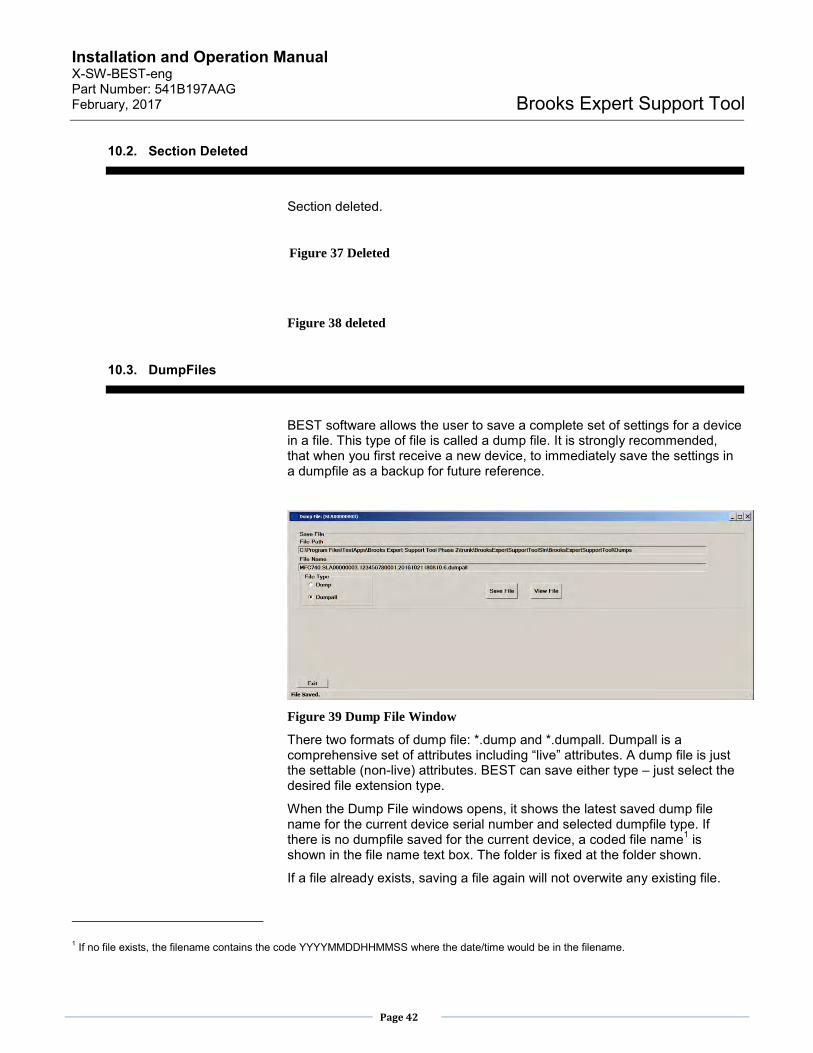
Figure 34 Device Config Menu
A device connection is required to use most of the config functions, except where noted.
Also, for most menu functions, if device control source is set to external control, the software will first ask if the user wants to set control to digital/BEST control (required for most config functions).
Figure 35 BEST Control Message
10.1. Section Deleted
Figure 36 Deleted
Installation and Operation Manual X-SW-BEST-eng Part Number: 541B197AAG February, 2017
Page 42
Brooks Expert Support Tool
10.2. Section Deleted
Section deleted.
Figure 37 Deleted
Figure 38 deleted
10.3. DumpFiles
BEST software allows the user to save a complete set of settings for a device in a file. This type of file is called a dump file. It is strongly recommended, that when you first receive a new device, to immediately save the settings in a dumpfile as a backup for future reference.
Figure 39 Dump File Window
There two formats of dump file: *.dump and *.dumpall. Dumpall is a comprehensive set of attributes including “live” attributes. A dump file is just the settable (non-live) attributes. BEST can save either type – just select the desired file extension type.
When the Dump File windows opens, it shows the latest saved dump file name for the current device serial number and selected dumpfile type. If there is no dumpfile saved for the current device, a coded file name1 is shown in the file name text box. The folder is fixed at the folder shown.
If a file already exists, saving a file again will not overwite any existing file.
1 If no file exists, the filename contains the code YYYYMMDDHHMMSS where the date/time would be in the filename.

Installation and Operation Manual X-SW-BEST-eng Part Number: 541B197AAG February, 2017
Page 43
Brooks Expert Support Tool
To save a file, first select a file type, then click Save File. It may take a few minutes to complete the save operation. Then you can open the file directly to view it by simply clicking Open File.
The ability to restore a dumpfile is planned for a future revision release of BEST software.
10.4. Device Info
The Device Info menu item allows a user to view selected information about a connected device. This window is read-only.
Figure 40 Device Info Window
10.5. Model Code Window
The model code window allows the user to configure the device’s model code. The model code (also called the Product Data Code or “PDC”) identifies the type and options of a device. The model code is a string a letters, numbers, and characters with coded fields representing various device options.
Most users will not need to modify the model code. However, advanced users, such as those who obtain unconfigured devices, may need to modify the model code. A license is required for use of this feature.
To protect the integrity of the model code text, the model code window does not allow the user to directly edit the text of the model code. The model code window requires the user to make selections from pre-defined choices.

Installation and Operation Manual X-SW-BEST-eng Part Number: 541B197AAG February, 2017
Page 44
Brooks Expert Support Tool
*NOTE: It is very important to have a correct model code (the model code that matches the hardware configuration), especially before beginning a device calibration. The model code is complex, so exercise caution when modifying it.
Figure 41 Model Code Window
The process for modifying the model code is as follows.
First, select a parameter to change (you may modify only one parameter/ field at a time). See Figure 41 above. This is chosen from the Parameter drop-down box. Notice that as you change the selected parameter there, a section of the model code above in the Full Code text box is highlighted – this is the corresponding field of the full model code. Notice also that the current value text box changes, as well as the description.
Next, select a new value or new value numeric formn the New value drop-down box. Notice that as you change the value, you may see a new description of the new value.
When you have selected the new value that you want, click Update. Note that the model code field will not be updated in the device unless you click Update. Notice that the field value in the Full Code text box is updated to the new value.
*NOTE: All numeric or date information entered into this form must be in English culture units/formats. Likewise, any numeric or data information displayed in the form are in English culuture units/formats. Special Fields:
Restrictor Type: For flow devices, the Restrictor Type field is used for restrictor type code, but for pressure controllers, this field is used for pressure transducer rang code.
Gas Code: The gas code field is for the process gas, not the calibration gas (if the calibration gas is different than the process gas - see section 12.7.1). This code must be an integer number.

Installation and Operation Manual X-SW-BEST-eng Part Number: 541B197AAG February, 2017
Page 45
Brooks Expert Support Tool
Gas Range: The gas range field is the range for the process gas, not the calibration gas (if the calibration gas is different than the process gas - see section 12.7.1).
Gas Units: The gas units field is the units for the process gas, not the calibration gas (if the calibration gas is different than the process gas - see section 12.7.1).
It is also recommended after changing the model code, to detach the device, cycle power and then re-attach, or reboot the unit (see section 11.1.1).
10.6. Wake Up State
The Wake Up State window allows the user to configure the state of the device the next time it powers up or reboots (“wakes up”). Here, the user may set the control source, the diagnostic port Mac ID (address), or RT Device Control mode (for RT devices) upon reboot. See Figure 42 below.
When the window opens, it shows the current wake-up state. The user may change any of these parameters. The user must click Change to apply these changes. The control source is for the power-up control state, not the current control state (see section 13.4 to change the current control state).
For the Diagnostic Port Mac ID, after the user clicks Change, the device will be rebooted (after the user confirms), and the device will remian attahced, but with the new Mac ID number.
Figure 42 Wake Up State Window
(the RT Device Control Mode block appears only for RT devices)
10.7. RT Pressure Controller Direction
The RT Pressure Controller direction window is used to change the direction (upstream or downstream) of the pressure mode of an RT device.
This change is available only for RT devices (not available for pressure controller devices).

Installation and Operation Manual X-SW-BEST-eng Part Number: 541B197AAG February, 2017
Page 46
Brooks Expert Support Tool
Figure 43 RT Pressure Controller Direction Window
10.8. RT Control Mode
The RT Control Mode window is used to change the current control mode of an RT device between Flow control and Pressure control modes. This change is only available for RT devices.
*NOTE: This change only affects the current state of the device, not the Wake-Up state (see section 10.6 for the Wake-Up State).
The window (Figure 44) also shows a live reading of the remote pressure transducer, if the user clicks Start.
*NOTE: the changes won’t be applied unless the user clicks Change.
Figure 44 RT Control Mode Window
Installation and Operation Manual X-SW-BEST-eng Part Number: 541B197AAG February, 2017
Page 47
Brooks Expert Support Tool
10.9. Meter Simulate MFC
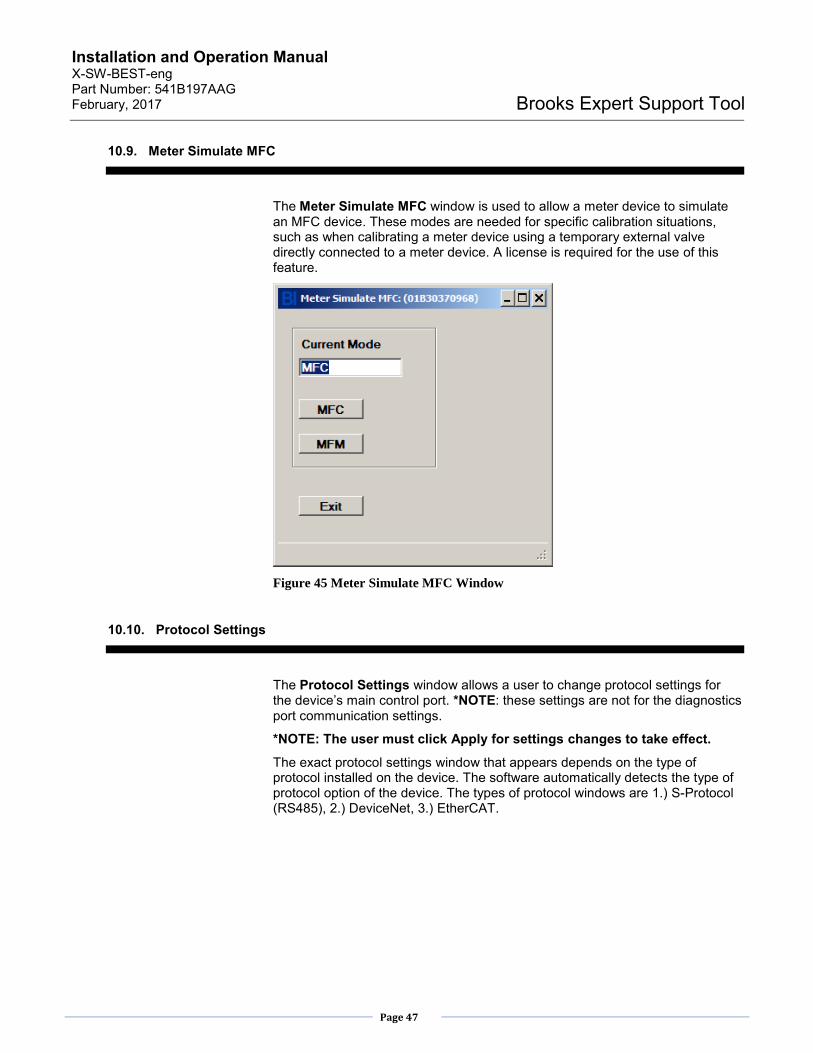
The Meter Simulate MFC window is used to allow a meter device to simulate an MFC device. These modes are needed for specific calibration situations, such as when calibrating a meter device using a temporary external valve directly connected to a meter device. A license is required for the use of this feature.
Figure 45 Meter Simulate MFC Window
10.10. Protocol Settings
The Protocol Settings window allows a user to change protocol settings for the device’s main control port. *NOTE: these settings are not for the diagnostics port communication settings.
*NOTE: The user must click Apply for settings changes to take effect.
The exact protocol settings window that appears depends on the type of protocol installed on the device. The software automatically detects the type of protocol option of the device. The types of protocol windows are 1.) S-Protocol (RS485), 2.) DeviceNet, 3.) EtherCAT.

Installation and Operation Manual X-SW-BEST-eng Part Number: 541B197AAG February, 2017
Page 48
Brooks Expert Support Tool
Figure 46 S-Protocol Window
Table 3: S-Protocol Configuration Parameters
Parameter Description
Date 32-bit integer value that represents the date value that is written and read via the S-Protocol Communication port. The Date value can be utilized by the user for any purpose and has no effect on the device.
Descriptor A 16-character string that the user can use to describe the device. This parameter can be written and read via the S-Protocol Communication port.
Device Type Read Only. Will always be 100 for SLA Enhanced devices.
Data Rate Sets the data rate for serial communications of the S-Protocol port. Must be 9600, 19200, or 38400.
User Ref. Temp. Reference Temperature (K) for which flow is to be reported if the user-specified Standard Reference Conditions. (See the S-protocol manual for more details.)
Manuf. ID Read Only. Always 10 for Brooks Instrument devices.
Message A 32-character string that the user can use for any desired purpose. This parameter can be written and read via the S-Protocol Communication port.
Tag Name 8-character string used to identify the device on the network to obtain the device’s long address.
Unique ID No. A 32-bit integer in the range of 0 to 16777216. This value is assigned by Brooks and must be unique for all devices supporting the RS485 S-Protocol.
User Ref. Pressure Reference Pressure (Pa) for which flow is to be reported if the user-specified Standard Reference Conditions are selected. (See the S-protocol manual for more details.)

Installation and Operation Manual X-SW-BEST-eng Part Number: 541B197AAG February, 2017
Page 49
Brooks Expert Support Tool
Parameter Description
Number of Preambles The number of Preamble characters that the device will transmit as part of every response message on the S-Protocol communications port.
Polling Address Short address of the device, must be in the range 0 to 15. This address can be used to access the long address from the device.
Flow Units Defines the UOM that flow is to be reported in on the S-Protocol Communications Port.
Temp. Units Defines the UOM that temperature is to be reported in on the S-Protocol Communications Port.
Note: Brooks Instrument provides an S-Protocol manual that describes the operation
of the S-Protocol supporting devices. Contact the Factory or your local sales
representative for more information.

Installation and Operation Manual X-SW-BEST-eng Part Number: 541B197AAG February, 2017
Page 50
Brooks Expert Support Tool
Figure 47 Device Net Protocol Window

Installation and Operation Manual X-SW-BEST-eng Part Number: 541B197AAG February, 2017
Page 51
Brooks Expert Support Tool
Table 4 DeviceNet Configuration Parameters
Parameter Description
Date 32-bit integer value that represents the date value that is written and read via the S-Protocol Communication port. The Date value can be utilized by the user for any purpose and has no effect on the device.
Descriptor A 16-character string that the user can use to describe the device. This parameter can be written and read via the S-Protocol Communication port.
Device Type Read Only. Will always be 100 for SLA Enhanced devices.
Data Rate Sets the data rate for serial communications of the S-Protocol port. Must be 9600, 19200, or 38400.
User Ref. Temp. Reference Temperature (K) for which flow is to be reported if the user-specified Standard Reference Conditions. (See the S-protocol manual for more details.)
Manuf. ID Read Only. Always 10 for Brooks Instrument devices.
Message A 32-character string that the user can use for any desired purpose. This parameter can be written and read via the S-Protocol Communication port.
Tag Name 8-character string used to identify the device on the network to obtain the device’s long address.
Unique ID No. A 32-bit integer in the range of 0 to 16777216. This value is assigned by Brooks and must be unique for all devices supporting the RS485 S-Protocol.
User Ref. Pressure Reference Pressure (Pa) for which flow is to be reported if the user-specified Standard Reference Conditions are selected. (See the S-protocol manual for more details.)
Number of Preambles The number of Preamble characters that the device will transmit as part of every response message on the S-Protocol communications port.
Polling Address Short address of the device, must be in the range 0 to 15. This address can be used to access the long address from the device.
Flow Units Defines the UOM that flow is to be reported in on the S-Protocol Communications Port.
Temp. Units Defines the UOM that temperature is to be reported in on the S-Protocol Communications Port.

Installation and Operation Manual X-SW-BEST-eng Part Number: 541B197AAG February, 2017
Page 52
Brooks Expert Support Tool
Note: Brooks Instrument provides a DeviceNet manual that describes the
operation of the DeviceNet supporting devices. Contact the Factory or your
local sales representative for more information.
Figure 48 EtherCAT Protocol Window
10.11. Warnings and Alarms
The software monitors the warning and/or alarm status for all of the alarms and warnings that the device may potentially indicate. The alarm and warning reporting functionality and related settings are dedicated to the supported protocol and model. Pressure-related warnings and alarms, for example, will only be supported by the PC and RT models. If the RS485 Analog customer interface with the S-Protocol supports flash codes, the MOD LED will flash the specified number of times if a certain alarm or warning is raised. This feature is not supported by other customer interface types. The DeviceNet customer interface also supports warnings in addition to alarms.
Also, more details on the Alarms and Warnings and their validity per model and customer interface is shown in Table 5 below.

Installation and Operation Manual X-SW-BEST-eng Part Number: 541B197AAG February, 2017
Page 53
Brooks Expert Support Tool
Table 5: Event Conditions for Which Alarms/Warnings Can Be Set
Event Condition Model Customer
Interface Description
Program memory corrupt MFC, MFM, PC, RT
RS485 Analog Program memory checksum failure.
RAM test failure MFC, MFM, PC, RT
RS485 Analog Byte-by-byte test of RAM, detects bad memory location.
Non-volatile memory failure MFC, MFM, PC, RT
RS485 Analog Byte-by-byte test of non-volatile memory, detects bad memory location.
Internal power supply failure MFC, MFM, PC, RT
RS485 Analog Any internally generated power supply voltage outside operational limits. Internal supply voltages must be within their nominal limits.
Temperature Low/High MFC, MFM, PC, RT
RS485 Analog This condition occurs when the internal temperature is below the low limit or the internal temperature is above the high limit. Contact Brooks if there is a need to alter these low and high temperature limits.
Device calibration due MFC, MFM, PC, RT
RS485 Analog This condition occurs after the specified elapsed hours indicating that the device needs to be recalibrated. Default the corresponding hours limit is set to 8760 hours, equal to 1 year. The alarm will be cleared once either the alarm is disabled or the corresponding hours limit is set different from 0 in the Alarm Settings screen.
Device overhaul due MFC, MFM, PC, RT
RS485 Analog, Profibus, DeviceNet
This condition occurs after the specified elapsed hours with gas flowing greater than 0.5%. The alarm will be cleared once either the alarm is disabled or the corresponding hours limit is set different from 0 in the Alarm Settings screen. Default this alarm is set to elapse in 8760 hours, equal to 1 year.
Setpoint deviation MFC, MFM, PC, RT
RS485 Analog An alarm/warning condition occurs if the difference between the set point and flow exceeds the specified limit.
Valve drive low/high MFC, PC, MFC- RT
RS485 Analog, Profibus, DeviceNet
This condition occurs when the valve drive is below the low limit or above the high limit.
No flow indication MFC, MFM, RT RS485 Analog This condition occurs if the measurement of flow indicates flow less than the specified limit value.
Flow low/high MFC, MFM, RT RS485 Analog, Profibus, DeviceNet
This condition occurs when flow is below the low limit or above the high limit.
Totalizer overflow MFC, MFM, RT RS485 Analog This condition occurs if the Flow Totalizer value exceeds its maximum value.
Pressure low/high PC, RT RS485 Analog, Profibus, DeviceNet
This condition occurs when the pressure is below the low limit or above the high limit.
Flow controller error band MFC, RT Profibus, DeviceNet
An alarm/warning condition occurs if the difference between the set point and flow exceeds the specified limit.
Pressure controller error band PC, RT Profibus, DeviceNet
An alarm/warning condition occurs if the difference between the set point and pressure reading exceeds the specified limit

Installation and Operation Manual X-SW-BEST-eng Part Number: 541B197AAG February, 2017
Page 54
Brooks Expert Support Tool
10.12. Warning Settings
The Warning Settings window allows a user to change warning settings for the device. This is similar to alarm settings. Only devices with DeviceNet or EtherCAT interfaces have warning settings.
The Low Limit and High Limit are in terms of the units specifed under the units colum for each row.
*NOTE: The user must click Apply for settings changes to take effect.
Figure 49 Warning Settings Window
10.13. Alarm Settings
The Alarm Settings window allows a user to change alarm settings for the device.
*NOTE: The user must click Apply for settings changes to take effect.
The exact alarm settings window that appears depends on the type of protocol installed on the device. The software automatically detects the type of protocol in the device. The types of alarm settings windows are 1.) RS485, 2.) Profibus, 3.) DeviceNet/EtherCAT.

Installation and Operation Manual X-SW-BEST-eng Part Number: 541B197AAG February, 2017
Page 55
Brooks Expert Support Tool
Figure 50 Alarm Settings RS485 Window (exact alarms settings available varies depending
on device type)
*NOTE: For SLA devices firmware prior to version 1.20, the Pressure Out of Limits Alarm Enable high and low are not independently settable. Either both are enabled or both are disabled (checking enable for one enables the other, and vice-versa).
Figure 51 Alarm Settings Profibus Window (exact alarms settings available varies depending
on device type)

Installation and Operation Manual X-SW-BEST-eng Part Number: 541B197AAG February, 2017
Page 56
Brooks Expert Support Tool
Figure 52 Alarm Settings DeviceNet/EtherCAT Window (exact alarms settings available varies depending
on device type)
10.14. Restrictor Selection
The Restrictor Selection window guides a user in changing settings for device restrictors.
*NOTE:Restrictor selection is an advanced topic. Most users will not need to use this feature. A license is require to use this feature.

Installation and Operation Manual X-SW-BEST-eng Part Number: 541B197AAG February, 2017
Page 57
Brooks Expert Support Tool
Figure 53 Restrictor Selection Window
When you open the Restrictor Selection window, it shows the current restrictor part number, as well as all the valid restrictor selection options. Each row in the grid represents a valid combination of settings with each restrictor part number. The current restrictor configuration is represented by the selected row in the grid. To select a new restrictor option, click on a new row to select it, then click Change (you must click Change for the the change to take effect permanently). Click Optimal to allow the software to automatically choose the optimal restrictor (be sure that the model code is set correctly beforehand). Again, you must click Change for the change to take effect permanently.
For custom combinations of restrictor part numbers and other model code parameters use the Model Code window or contact the factory.
10.15. Orifice Selection
The Orifice Selection window guides a user in changing settings for device orifice configurations.
*NOTE:Restrictor selection is an advanced topic. Most users will not need to use this feature. A license is require to use this feature.

Installation and Operation Manual X-SW-BEST-eng Part Number: 541B197AAG February, 2017
Page 58
Brooks Expert Support Tool
Figure 54 Orifice Selection Window
When you open the Orifice Selection window, it shows the current orifice part number, as well as all the valid orifice option selections. Each row in the grid represents a valid combination of settings with each orifice part number. The current orifice configuration is represented by the selected row in the grid. To select a new orifice option, click on a new row to select it, then click Change (you must click Change for the the change to take effect permanently). Click Optimal to allow the software to automatically choose the optimal orifice (be sure that the model code is set correctly beforehand). Again, you must click Change for the change to take effect permanently.
For custom combinations of orifice part numbers and other model code parameters use the Model Code window or contact the factory.
11. Device Control Menu
The Device Control menu provides functionality to control a device with functions such as valve control, and rebooting a device.

Installation and Operation Manual X-SW-BEST-eng Part Number: 541B197AAG February, 2017
Page 59
Brooks Expert Support Tool
Figure 55 Device Control Menu
A device connection is required to use most of these functions, except where noted.
Also, if control is set to Analog/External, the software will ask if the user wants to set control to Digital/BEST control. See Figure 35.
Also, if the valve control mode is not set to normal, the mode will automatically be set to normal (see section 11.2).
11.1. Reboot Device
This window will allow a user to reboot a device. A reboot is similar to cycling the power to the device. If the user clicks reset, and confirms, the device will be reset and the device will remain attached to the software.
Figure 56 Reboot Device Window
11.2. Valve Control
The Valve Control menu provides functionality to directly control a device’s valve. This is not available for meter (MFM) devices, as they do not have valves.
Normally, the device’s valve may freely move up and down to regulate the flow or pressure of the controller device. However, The Valve Control menu allows the user to directly control the valve position.

Installation and Operation Manual X-SW-BEST-eng Part Number: 541B197AAG February, 2017
Page 60
Brooks Expert Support Tool
Figure 57 Valve Control Window
First, the user selects the desired valve control mode. The current valve control mode is shown on the window.
Normal mode is when the valve is automatically moved up and down to regulate flow or pressure.
Open is when the valve is forced fully open.
Closed is when the valve is forced fully closed.
Manual is when the user can select a valve position from 0 to 100%. When manual is selected, the Manual Control box on the right side of the form becomes enabled. The user can view and set the valve position (the user must click the Set button or click Set on the Up/Down numeric control). The valve will then be held at this position.
*NOTE: if the user is using an external controller (such as the brooks 0254) and that controller has its valve override enabled, BEST’s valve control mode may not be able to change the mode.
When the user closes this window, if the mode is not set to normal, the software will ask the user if they want to set the mode back to normal before leaving the window, as a reminder. Normal mode is required for most other functions.
12. Calibration Menu
The Calibration menu guides the user through the process of calibrating and tuning a device. Customer devices are ususally calibrated from the factory. However, BEST allows an advanced user to calibrated a device themselves
A software license is required for the core calibration routines (Calibration->Calibration menu item). Valve tuning and I/O calibration do not require a license.
Both flow and pressure devices need to be calibrated for accurate control and measurement. The calibration menu includes functions for flow or pressure calibration, valve tuning, and analog input and output tuning.

Installation and Operation Manual X-SW-BEST-eng Part Number: 541B197AAG February, 2017
Page 61
Brooks Expert Support Tool
Calibration is the most complex aspect of BEST software.
CAUTION: Some of the features contained within the Calibration menu can be used to alter the performance of the device. It is recommended that you save the device configuration before proceeding with any calibration or tuning function. For instructions on how to save the device configuration, refer to section 10.3.
Figure 58 Calibration Menu
*NOTE: Before conducting any calibration menu operations, verify the model code is set correctly (see section 10.5).
12.1. Pressure Controller Setup Diagram
The Pressure Controller Setup Diagram menu displays a basic setup diagram for pressure controller and RT devices. The diagram shows typical setups for an upstream and a downstream application. These diagrams are from the device manual but are available directly from the software as a convenience. These are merely suggested setups – for detailed system analysis consult the device user manual or contact Brooks Instrument.
The form also shows the configured direction (upstream or downstream) of the current device (see Figure 59).
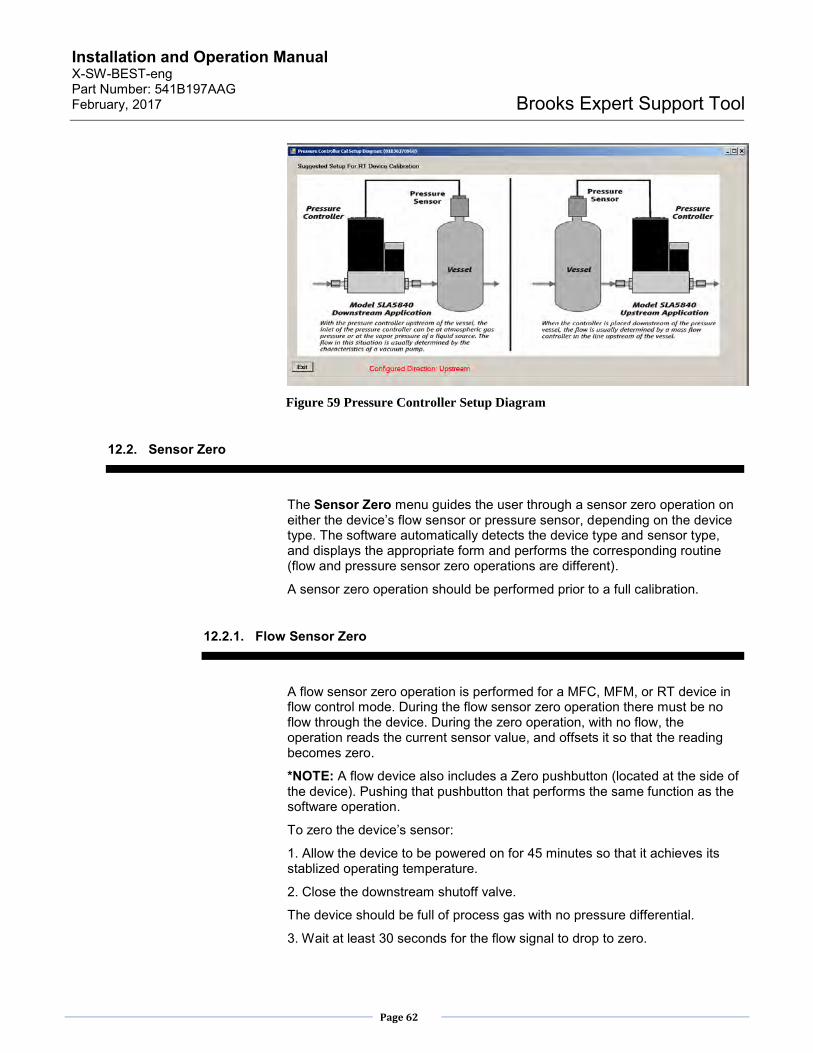
Installation and Operation Manual X-SW-BEST-eng Part Number: 541B197AAG February, 2017
Page 62
Brooks Expert Support Tool
Figure 59 Pressure Controller Setup Diagram
12.2. Sensor Zero
The Sensor Zero menu guides the user through a sensor zero operation on either the device’s flow sensor or pressure sensor, depending on the device type. The software automatically detects the device type and sensor type, and displays the appropriate form and performs the corresponding routine (flow and pressure sensor zero operations are different).
A sensor zero operation should be performed prior to a full calibration.
12.2.1. Flow Sensor Zero
A flow sensor zero operation is performed for a MFC, MFM, or RT device in flow control mode. During the flow sensor zero operation there must be no flow through the device. During the zero operation, with no flow, the operation reads the current sensor value, and offsets it so that the reading becomes zero.
*NOTE: A flow device also includes a Zero pushbutton (located at the side of the device). Pushing that pushbutton that performs the same function as the software operation.
To zero the device’s sensor:
1. Allow the device to be powered on for 45 minutes so that it achieves its stablized operating temperature.
2. Close the downstream shutoff valve.
The device should be full of process gas with no pressure differential.
3. Wait at least 30 seconds for the flow signal to drop to zero.

Installation and Operation Manual X-SW-BEST-eng Part Number: 541B197AAG February, 2017
Page 63
Brooks Expert Support Tool
4. Using the device’s Zero pushbutton or the Brooks Expert Support Tool’s Sensor Adjust function, zero the device.
If using the pushbutton, press the pushbutton until the device’s Status LED flashes red, then release the pushbutton. After a few seconds, a successful zeroing operation is indicated by the Status LED being a steady green (if there’s no alarm condition present).
If using the software, access the menu item Calibration->Sensor Zero.
Figure 60 Flow Sensor Zero Window
In the flow sensor zero window (Figure 60), the Actual Zero Value is the current (“live”) flow measurement of the flow sensor. The Flow Sensor Zero Correction is the current correction offset. The Flow Sensor State is “Idle” while the zero operation is not processing.
With no flow present, click the Zero button. The state changes to “InProgress” while the zero operation takes place. The process may take up to 15 seconds. When completed, it returns to “Idle”.
If you attempt to zero the device while gas is flowing at ≥5% of full scale, a dialog box displays prompting you to confirm whether you want to continue with the operation.
*NOTE: There is another way to access the flow sensor zero operation, under the Calibration->Calibration menu (see Figure 83). Both of these access methods perform exactly the same flow sensor zero operation, except that the Calibration->Calibration menu method gives the user the option of performing a purge (opens the valve temporarily for 5 seconds) to relieve any trapped pressure.

Installation and Operation Manual X-SW-BEST-eng Part Number: 541B197AAG February, 2017
Page 64
Brooks Expert Support Tool
12.2.2. Pressure Sensor Zero
A pressure sensor zero operation is performed for a PC device only. (*NOTE: While an RT device does measure pressure, it measures pressure with an external (remote) pressure sensor connected to the device. This external sensor is not zeroed by BEST software - it is assumed that the sensor’s range (0-10V or 0-5V) represents its full specified range. See section 12.5 for calibrating the range of this external RT sensor.)
*NOTE: There are several ways to access the pressure sensor zero operation: the zero pushbutton, under this menu (Calibration->Sensor Zero) and the Calibration->Calibration menu (see section 12.7.2). These access methods perform different methods of sensor zero operation as explained below.
A pressure controller’s pressure sensor can be calibrated in three ways:
1.) Use the physical reset button on the device
2.) A straight offset correction (BEST software, Calibration->Sensor Zero menu)
3.) An interpolated correction (BEST software, Calibration->Calibration menu – see section 12.7.2)
A pressure device includes a zero pushbutton (located at the side of the device) that performs a straight offset correction. For pressure devices with a psia sensor (all SLA devices currently are psia), this zero is assumed to be at absolute zero pressure (0 psia) which requires a vacuum at the outlet.
The straight offset method, which is similar to a flow sensor zero method, is a simpler method than the interpolated method, but must be performed under a vacuum. (As of this version of BEST, all SLA Pressure controllers are based on psia pressure sensors, which means they are designed to work under a vacuum, and thus zero pressure is absolute zero pressure - or close to it). As this pressure, even under a vacuum, cannot achieve actual absolute zero, this method has limited accuracy. Thus, the interpolated method is recommended. The Calibration->Sensor Zero menu item performs the straight offset method.
The interpolated method does not need to be performed under a vacuum but is a more complicated process. This method is performed under the Calibration->Calibration menu item (see section 12.7.2).
As this menu performs the straight offset method, it gives a warning. When the user clicks on the sensor zero menu (with a pressure controller device attached), the following warning is displayed:

Installation and Operation Manual X-SW-BEST-eng Part Number: 541B197AAG February, 2017
Page 65
Brooks Expert Support Tool
Figure 61 Sensor Zero PSIA Warning
After this, the pressure sensor zero window appears (see figure 62 below). From this point forward, the zero operation is straightforward and is the same as the flow sensor zero operation.
Figure 62 Pressure Sensor Calibration (Straight Offset Method)
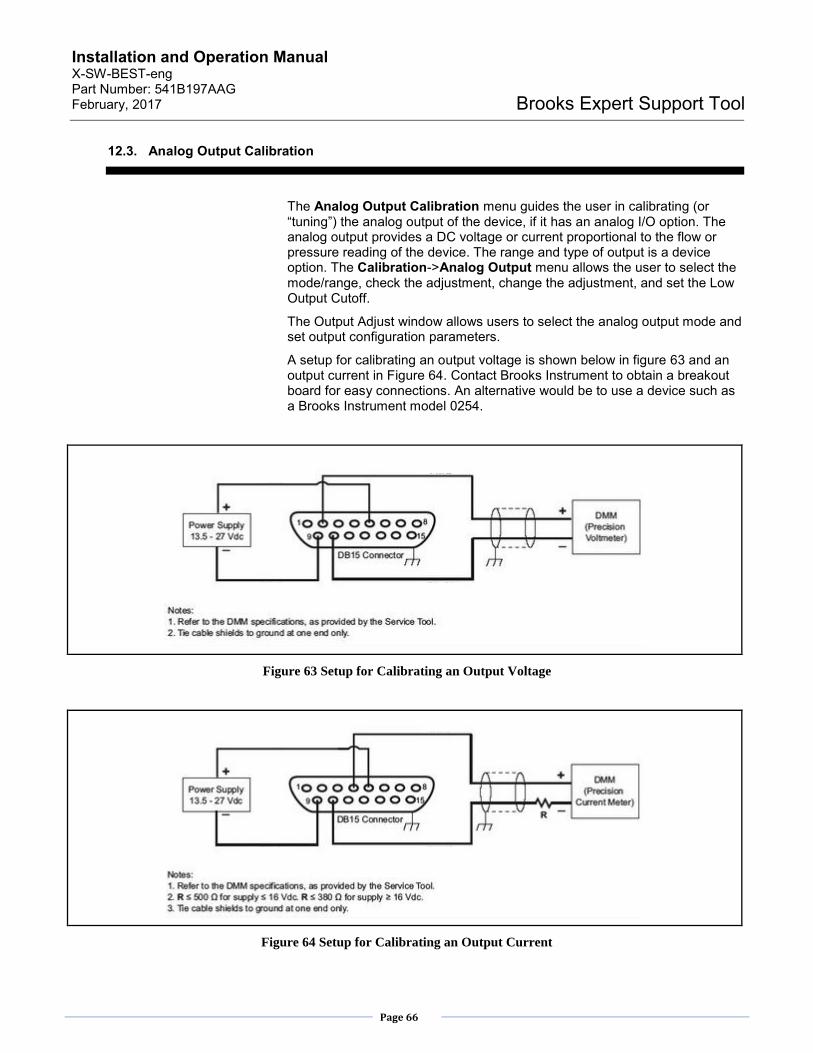
Installation and Operation Manual X-SW-BEST-eng Part Number: 541B197AAG February, 2017
Page 66
Brooks Expert Support Tool
12.3. Analog Output Calibration
The Analog Output Calibration menu guides the user in calibrating (or “tuning”) the analog output of the device, if it has an analog I/O option. The analog output provides a DC voltage or current proportional to the flow or pressure reading of the device. The range and type of output is a device option. The Calibration->Analog Output menu allows the user to select the mode/range, check the adjustment, change the adjustment, and set the Low Output Cutoff.
The Output Adjust window allows users to select the analog output mode and set output configuration parameters.
A setup for calibrating an output voltage is shown below in figure 63 and an output current in Figure 64. Contact Brooks Instrument to obtain a breakout board for easy connections. An alternative would be to use a device such as a Brooks Instrument model 0254.
Figure 63 Setup for Calibrating an Output Voltage
Figure 64 Setup for Calibrating an Output Current
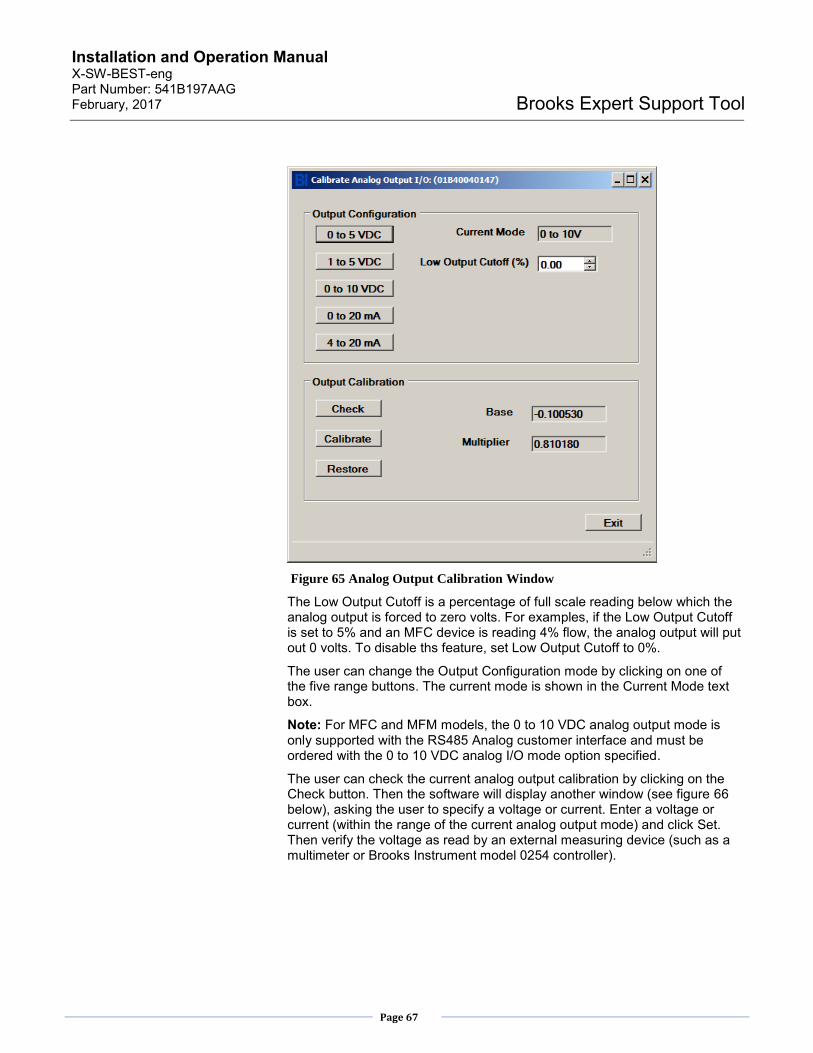
Installation and Operation Manual X-SW-BEST-eng Part Number: 541B197AAG February, 2017
Page 67
Brooks Expert Support Tool
Figure 65 Analog Output Calibration Window
The Low Output Cutoff is a percentage of full scale reading below which the analog output is forced to zero volts. For examples, if the Low Output Cutoff is set to 5% and an MFC device is reading 4% flow, the analog output will put out 0 volts. To disable ths feature, set Low Output Cutoff to 0%.
The user can change the Output Configuration mode by clicking on one of the five range buttons. The current mode is shown in the Current Mode text box.
Note: For MFC and MFM models, the 0 to 10 VDC analog output mode is only supported with the RS485 Analog customer interface and must be ordered with the 0 to 10 VDC analog I/O mode option specified.
The user can check the current analog output calibration by clicking on the Check button. Then the software will display another window (see figure 66 below), asking the user to specify a voltage or current. Enter a voltage or current (within the range of the current analog output mode) and click Set. Then verify the voltage as read by an external measuring device (such as a multimeter or Brooks Instrument model 0254 controller).
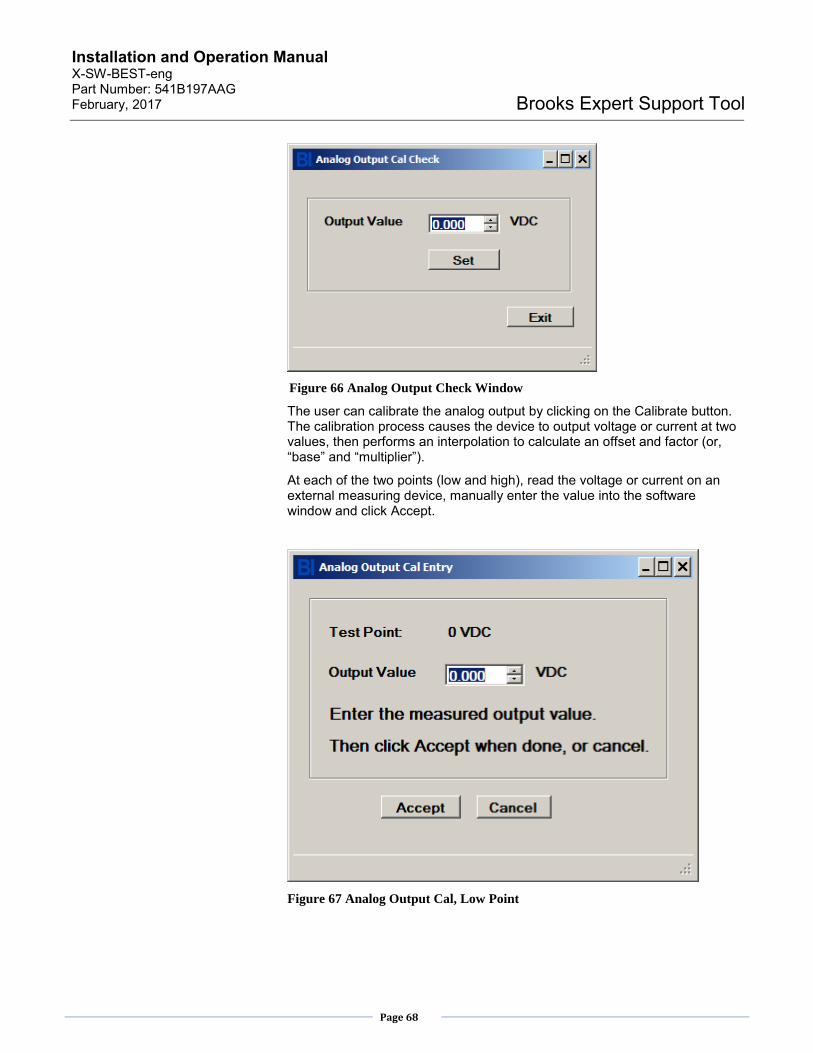
Installation and Operation Manual X-SW-BEST-eng Part Number: 541B197AAG February, 2017
Page 68
Brooks Expert Support Tool
Figure 66 Analog Output Check Window
The user can calibrate the analog output by clicking on the Calibrate button. The calibration process causes the device to output voltage or current at two values, then performs an interpolation to calculate an offset and factor (or, “base” and “multiplier”).
At each of the two points (low and high), read the voltage or current on an external measuring device, manually enter the value into the software window and click Accept.
Figure 67 Analog Output Cal, Low Point

Installation and Operation Manual X-SW-BEST-eng Part Number: 541B197AAG February, 2017
Page 69
Brooks Expert Support Tool
Figure 68 Analog Output Cal, High Point
Afterwards, the Base and Multiplier values will be updated.
The user may revert back to the original values of all parameters (when the Analog Output form was last opened) by clicking the restore button.
12.4. Analog Input Calibration
The Analog Input Calibration menu guides the user in calibrating (or “tuning”) the analog input of the device, if it has the analog I/O option. If the device’s Control Source is set to External (see section 13.4), the device responds to an analog input as a either a DC voltage or current, changing its flow or pressure set point proportionally to the voltage or current. The range and type of input is a device option. The Analog Input Calibration menu allows the user to select the mode and range, check the adjustment, change the adjustment, set the Softstart Ramp Time, and set the Low Input Cutoff.
The Input Adjust window allows you to select the analog input mode and set input configuration parameters. Before you begin, perform a sensor zero operation.
Note: For MFC and MFM models, the 0 to 10 VDC analog input mode is only supported with the RS485 Analog customer interface and must be ordered with the 0 to 10 VDC analog I/O mode option specified.

Installation and Operation Manual X-SW-BEST-eng Part Number: 541B197AAG February, 2017
Page 70
Brooks Expert Support Tool
A setup for calibrating the analog input for voltage is shown below in figure 69 and for current in Figure 70. Contact Brooks Instrument to obtain a breakout board for easy connections. An alternative would be to use a device such as a Brooks Instrument model 0254.
Figure 69 Setup for Calibrating an Analog Input for Voltage
Figure 70 Setup for Calibrating an Analog Input for Current

Installation and Operation Manual X-SW-BEST-eng Part Number: 541B197AAG February, 2017
Page 71
Brooks Expert Support Tool
Figure 71 Analog Input Calibration Window
The Low Input Cutoff is a percentage of full scale reading on the analog input below which the device set point is forced to zero. For example, if the Low Input Cutoff is set to 5% and the analog input is at 4%, the set point will be set to 0. To disable, set Low Input Cutoff to 0%.
The Softstart Ramp Time parameter allows user to ramp the set point in a certain time period specified in milliseconds (ms). For default behavior, set this parameter to 0 to allow for the fastest possible set point ramp time.
The user can change the Input Configuration mode by clicking on one of the five range buttons. The current mode is shown in the Current Mode text box.
The user can check the current analog input calibration by providing a voltage or current with an external source (such as a power supply or Brooks Instrument model 0254 controller) to the device’s analog input, then viewing the measured “live” level in the Measured Input text box.
Note: Sometimes the valve may oscillate during the time between adjusting setpoint input base and multiplier. This is a normal event that will resolve itself immediately after setpoint input multiplier is adjusted.

Installation and Operation Manual X-SW-BEST-eng Part Number: 541B197AAG February, 2017
Page 72
Brooks Expert Support Tool
The user can calibrate the analog input by clicking on the Calibrate button. The calibration process prompts the user to supply external voltages or currents to the device’s analog input at two points (high and low), then performs an interpolation to calculate an offset and factor (or, “base” and “multiplier”).
At each of the two points (low and high), supply an external voltage or current as directed. The live voltage or current is shown in the Measured Input text box. Click Accept when ready.
Figure 72 Analog Input, Low

Installation and Operation Manual X-SW-BEST-eng Part Number: 541B197AAG February, 2017
Page 73
Brooks Expert Support Tool
Figure 73 Analog Input, High
The user may revert back to the original values of all parameters (when the Analog Input form was last opened) by clicking the restore button.
12.5. RT/Aux Input Calibration
The RT/Aux Input Calibration menu guides the user in calibrating (or “tuning”) the auxiliary input of an RT device. The auxiliary input of an RT device is connected to the external (“remote”) pressure sensor. This operation adjusts the input of the sensor to its range (0 to 5V or 0 to 10V).
The RT/Aux Input Calibration menu allows the user to select the range (0 to 5V or 0 to 10V only), check the adjustment, and calibrate the input.
*NOTE: under nomal circumstances, this adjut is set at the factory to respoand to an input voltage of 0 to 10VDC or 0 to 5VDC and does not need to be adjusted in the field. The user’s RT sensor is assumed to produce the specified voltage range for the specified pressure range.
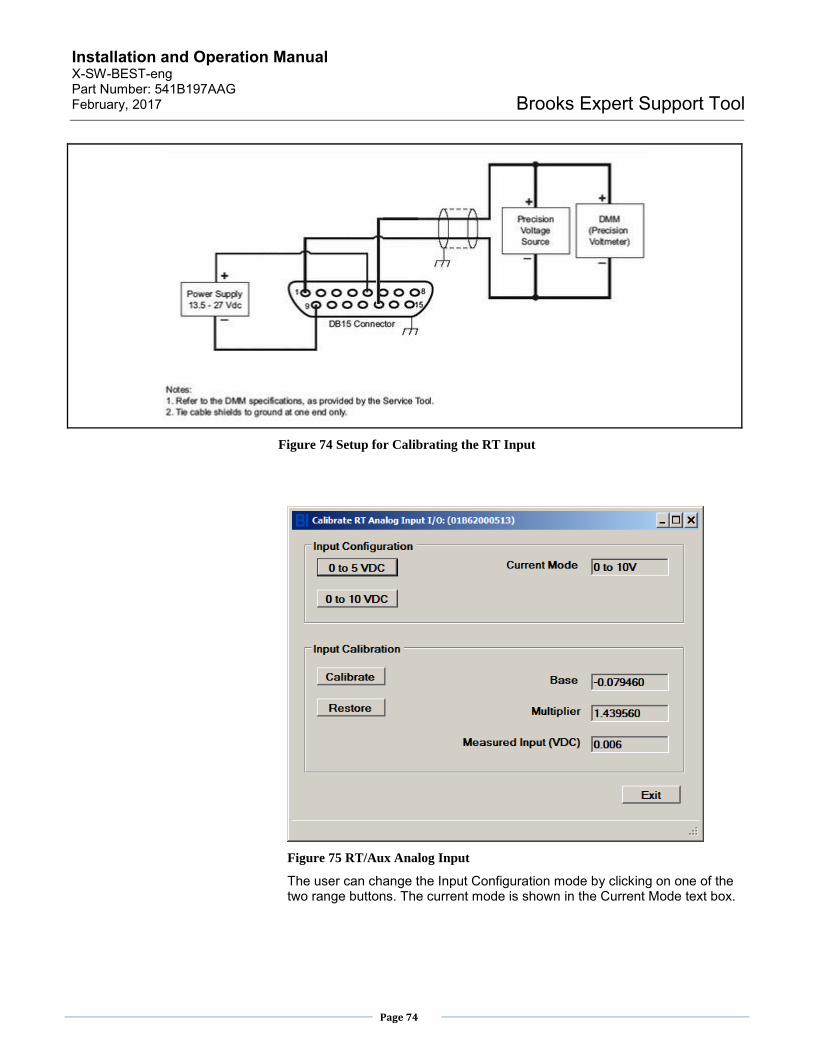
Installation and Operation Manual X-SW-BEST-eng Part Number: 541B197AAG February, 2017
Page 74
Brooks Expert Support Tool
Figure 74 Setup for Calibrating the RT Input
Figure 75 RT/Aux Analog Input
The user can change the Input Configuration mode by clicking on one of the two range buttons. The current mode is shown in the Current Mode text box.
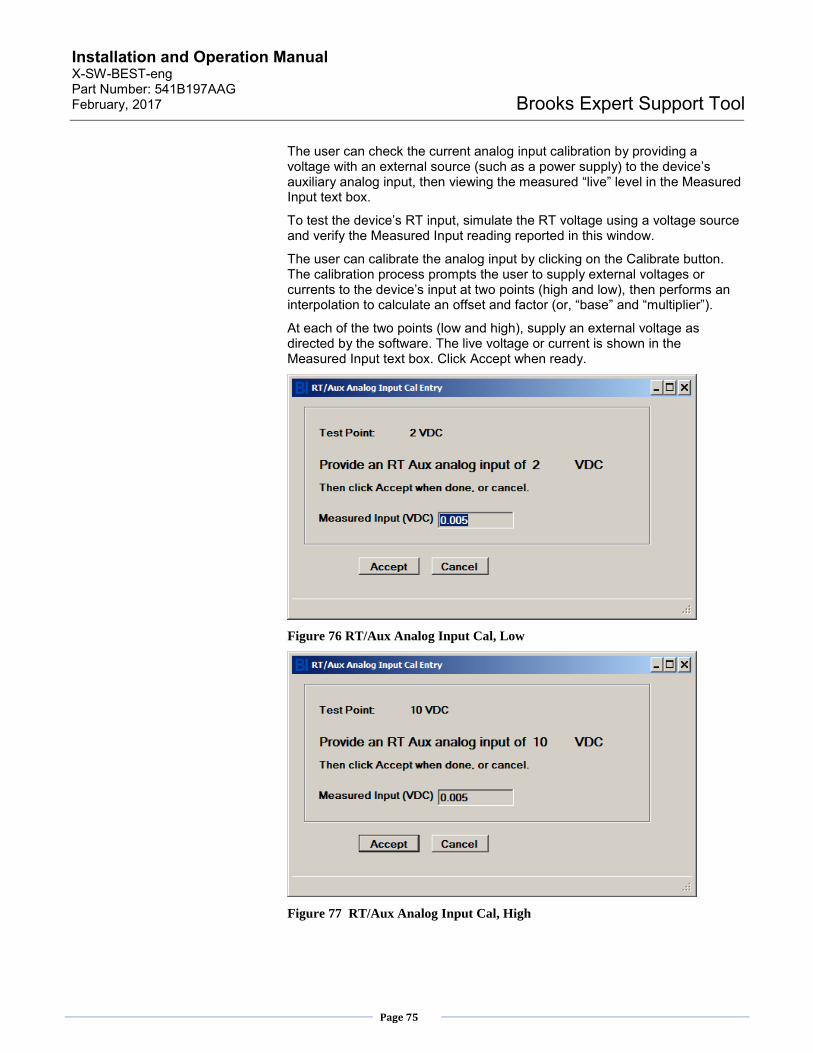
Installation and Operation Manual X-SW-BEST-eng Part Number: 541B197AAG February, 2017
Page 75
Brooks Expert Support Tool
The user can check the current analog input calibration by providing a voltage with an external source (such as a power supply) to the device’s auxiliary analog input, then viewing the measured “live” level in the Measured Input text box.
To test the device’s RT input, simulate the RT voltage using a voltage source and verify the Measured Input reading reported in this window.
The user can calibrate the analog input by clicking on the Calibrate button. The calibration process prompts the user to supply external voltages or currents to the device’s input at two points (high and low), then performs an interpolation to calculate an offset and factor (or, “base” and “multiplier”).
At each of the two points (low and high), supply an external voltage as directed by the software. The live voltage or current is shown in the Measured Input text box. Click Accept when ready.
Figure 76 RT/Aux Analog Input Cal, Low
Figure 77 RT/Aux Analog Input Cal, High

Installation and Operation Manual X-SW-BEST-eng Part Number: 541B197AAG February, 2017
Page 76
Brooks Expert Support Tool
12.6. Cal Pages
The Cal Pages menu is where the user can select the active calibration page, create default pages, and delete pages. A “page” is a completely configured and calibrated set-up of the device. A page is created via the calibration process (section 12.7) or by creating a default page (from this Cal Pages form). A page is selected from the set of pages (the “calibration data set”) that have previously been created, either by the user or by the factory.
Typically, this menu is of interest only to users who have a device with more than one calibration page stored in the device.
Flow devices and pressure devices each have a separate set of possible pages and thus, different Cal Pages windows. There are separate menu items for flow pages and presure pages (see Figure 56). MFC and MFM devices have flow cal pages, PC devices have pressure pages, and RT devices can have both types.
12.6.1. Flow Cal Pages
The Cal Pages window for flow devices is shown in Figure 78 below.

Installation and Operation Manual X-SW-BEST-eng Part Number: 541B197AAG February, 2017
Page 77
Brooks Expert Support Tool
Figure 78 Cal Pages Window, For Flow Devices
The Surrogate Gas Pages section of this form is where the user can see the temporary pages created as a byproduct of the calibration process. At this time, the user will see at maximum, one surrogate page. The average user rarely needs to be concerned with surrogate pages.
The Process Gas Pages section of this form is where the user can view and select from the existing set of created calibration pages. To see the complete set of pages present in the device, click on the Process Gas Page drop-down box.
The active page is prefixed with an asterisk in the Process Gas Page drop-down box. Possible page numbers are 1 through 6 (page 6 is typically reserved as a test page). To activate a page, select one of the pages from the drop-down box, then click Activate. To view selected parameters of a page, select the page from the drop-down box, and the parameters are shown below the drop-down box.
To delete a page, select the page from the drop-down box, and click delete.
*NOTE: Exercise caution if deleting pages.
To create a default page, click Create Default Page. A new window appears as shown in the figure below.

Installation and Operation Manual X-SW-BEST-eng Part Number: 541B197AAG February, 2017
Page 78
Brooks Expert Support Tool
Figure 79 Create Default Page, For Flow Devices
In this form, the Existing Process Gas Pages section shows the existing calibration pages, the same as in the previous form (but you can’t change the active page from here, this is just for viewing purposes).
If the user has a license installed, they can create a default page (uncalibrated).
In the New Process Gas Page section, it shows selected parameters that will used in the new default page. These cannot be changed, as it is a “default” page. Below that is the New Process Gas Page Number drop-down box. The user can select a page number from 1 to 6 for the new page.
To create the new page, click Create Default Page. If the user selected a page number that already exists, the user will be prompted whether they want to overwrite the existing page. Note that the “default page” that is created Is not a calibrated page. To create a calibrated page from a previously created surrogate page, see section 12.7.1, to create a Customer Page.

Installation and Operation Manual X-SW-BEST-eng Part Number: 541B197AAG February, 2017
Page 79
Brooks Expert Support Tool
If the new page is created, it will be added to the list of process gas pages and be made the new active page.
12.6.2. Pressure Cal Pages
The Cal Pages window for pressure devices is shown in the figure below.
Figure 80 Cal Pages Window, For Pressure Devices
The Pressure Application Pages section of this form is where the user can view and select from the set of created calibration pages. To see the complete set of pages present in the device, click on the Pressure Application Page drop-down box.
The active page is prefixed with an asterisk. Possible page numbers are 1 through 6 (page 6 is typcially reserved as a test page). To activate a page, select one of the pages from the drop-down box, then click Activate. To view selected parameters of a page, select the page from the drop-down box, and the parameters are shown below the drop-down box.
To delete a page, select the page from the drop-down box, and click delete.
*NOTE Exercise caution if deleting pages.
If the user has a license installed, they can create a default page (uncalibrated).
To create a default page, click Create Default Page. A new window appears as shown in the figure below.

Installation and Operation Manual X-SW-BEST-eng Part Number: 541B197AAG February, 2017
Page 80
Brooks Expert Support Tool
Figure 81 Create Default Page Window, For Pressure Devices
In this form, the Existing Pressure Pages section shows the existing pressure calibration pages, the same as in the previous form (but you can’t change the active page from here, this is just for viewing purposes).
In the New Pressure Page section, it shows selected parameters that will used in the new default page. For pressure controller devices, the Full Scale Range here must be <= the transducer range.
Below that is the New Pressure Page Number drop-down box. The user can select a page number from 1 to 6 for the new page.
To create the new page, click Create Default Page. If the user selected a page number that already exists, the user will be prompted whether they want to overwrite the existing page. Note that the “default page” that is created Is not a calibrated page. To create a calibrated page from a previously created surrogate page, see section 12.7.2, to create a Customer Page.
If the new page is created, it will appear in the list of process gas pages.

Installation and Operation Manual X-SW-BEST-eng Part Number: 541B197AAG February, 2017
Page 81
Brooks Expert Support Tool
12.7. Calibration
The Calibration menu is where the user can calibrate their devices for accuracy. The calibration procedure requires a license (see section 5.3).
Users can calibrate both flow and pressure devices, including RT devices. Devices can create multiple calibrations, stored in “pages” in the device (see section 12.6). The user can then switch between calibrations by selecting pages.
The software automatically detects the device type and guides the user in the appropriate type of calibration to perform. The windows that appear are different, depending on the device type and calibration type.
The calibration process typically involves the following steps: setting up a calibration, performing the calibration, validating the calibration, and producing a calibration report.
To perform a calibration, the following conditions are required:
- The device has been powered on for at least 45 minutes.
- The sensor has been zeroed.
- There is a supply of gas.
- During the calibration process, the device must be in a thermally stable environment. Rapid or significant temperature changes during the calibration process will affect the device’s accuracy.
Calibrating a meter (MFM) device is very similar to calibrating a Mass Flow Controller. There are a few steps that are slightly different and are described in these instructions where needed. The main difference is to make sure you have a bench setup that can control the flow going through the device.
*NOTE: Make sure that the model code information is set correctly prior to starting calibration (see section 10.5).
12.7.1. Flow Calibration
Flow calibration is performed for MFC, MFM and RT device types. An example flow calibration window is shown in the figure below.
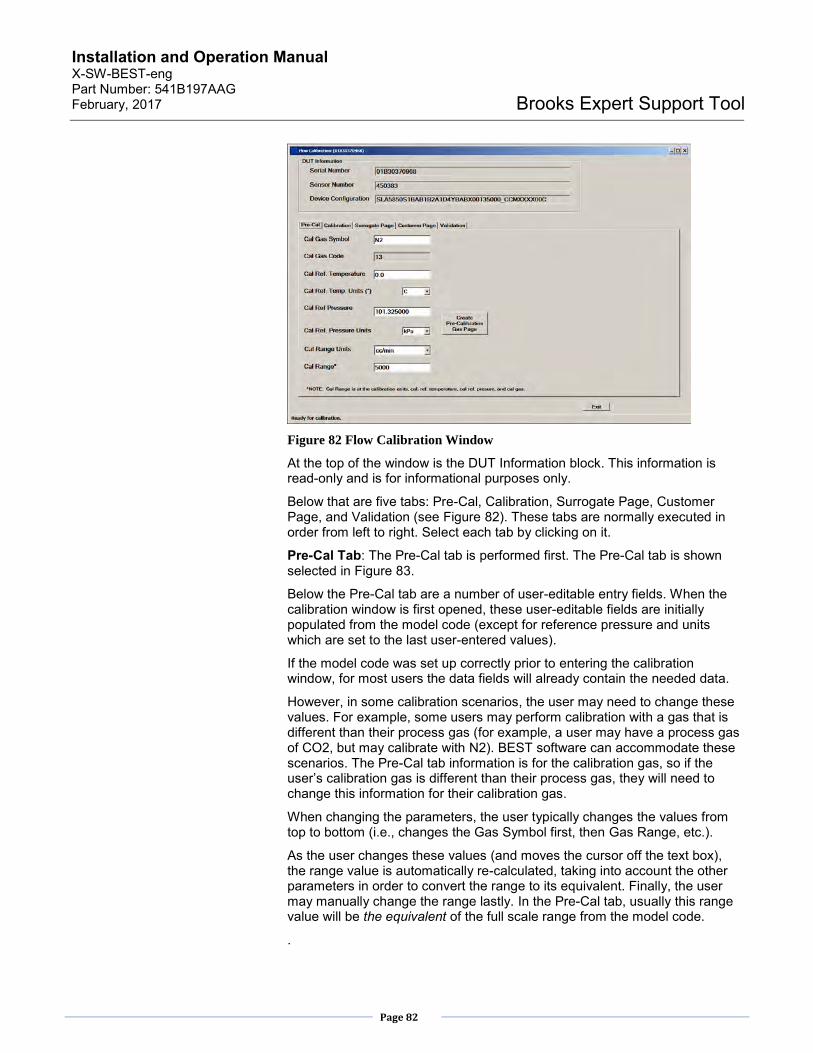
Installation and Operation Manual X-SW-BEST-eng Part Number: 541B197AAG February, 2017
Page 82
Brooks Expert Support Tool
Figure 82 Flow Calibration Window
At the top of the window is the DUT Information block. This information is read-only and is for informational purposes only.
Below that are five tabs: Pre-Cal, Calibration, Surrogate Page, Customer Page, and Validation (see Figure 82). These tabs are normally executed in order from left to right. Select each tab by clicking on it.
Pre-Cal Tab: The Pre-Cal tab is performed first. The Pre-Cal tab is shown selected in Figure 83.
Below the Pre-Cal tab are a number of user-editable entry fields. When the calibration window is first opened, these user-editable fields are initially populated from the model code (except for reference pressure and units which are set to the last user-entered values).
If the model code was set up correctly prior to entering the calibration window, for most users the data fields will already contain the needed data.
However, in some calibration scenarios, the user may need to change these values. For example, some users may perform calibration with a gas that is different than their process gas (for example, a user may have a process gas of CO2, but may calibrate with N2). BEST software can accommodate these scenarios. The Pre-Cal tab information is for the calibration gas, so if the user’s calibration gas is different than their process gas, they will need to change this information for their calibration gas.
When changing the parameters, the user typically changes the values from top to bottom (i.e., changes the Gas Symbol first, then Gas Range, etc.).
As the user changes these values (and moves the cursor off the text box), the range value is automatically re-calculated, taking into account the other parameters in order to convert the range to its equivalent. Finally, the user may manually change the range lastly. In the Pre-Cal tab, usually this range value will be the equivalent of the full scale range from the model code.
.
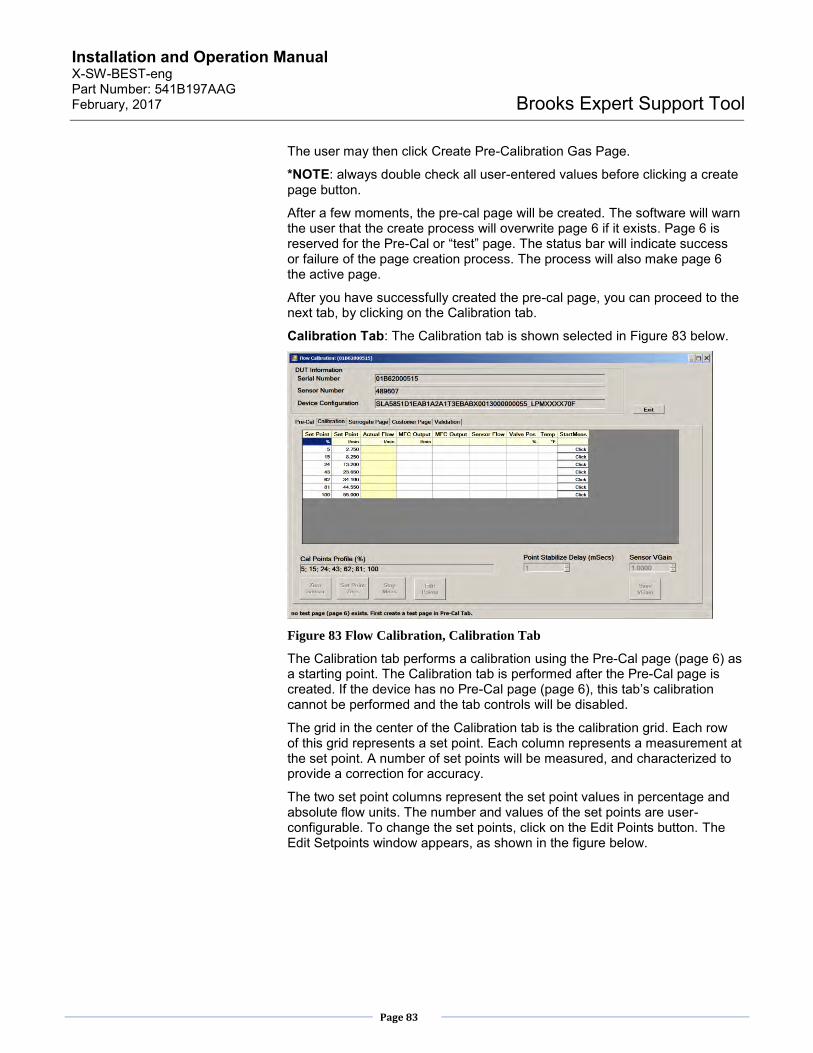
Installation and Operation Manual X-SW-BEST-eng Part Number: 541B197AAG February, 2017
Page 83
Brooks Expert Support Tool
The user may then click Create Pre-Calibration Gas Page.
*NOTE: always double check all user-entered values before clicking a create page button.
After a few moments, the pre-cal page will be created. The software will warn the user that the create process will overwrite page 6 if it exists. Page 6 is reserved for the Pre-Cal or “test” page. The status bar will indicate success or failure of the page creation process. The process will also make page 6 the active page.
After you have successfully created the pre-cal page, you can proceed to the next tab, by clicking on the Calibration tab.
Calibration Tab: The Calibration tab is shown selected in Figure 83 below.
Figure 83 Flow Calibration, Calibration Tab
The Calibration tab performs a calibration using the Pre-Cal page (page 6) as a starting point. The Calibration tab is performed after the Pre-Cal page is created. If the device has no Pre-Cal page (page 6), this tab’s calibration cannot be performed and the tab controls will be disabled.
The grid in the center of the Calibration tab is the calibration grid. Each row of this grid represents a set point. Each column represents a measurement at the set point. A number of set points will be measured, and characterized to provide a correction for accuracy.
The two set point columns represent the set point values in percentage and absolute flow units. The number and values of the set points are user-configurable. To change the set points, click on the Edit Points button. The Edit Setpoints window appears, as shown in the figure below.

Installation and Operation Manual X-SW-BEST-eng Part Number: 541B197AAG February, 2017
Page 84
Brooks Expert Support Tool
Figure 84 Edit Setpoints Window
Type in or edit a semicolon-separated list of set point percentages. Rules for the set point list are as follows:
- Must be a comma-separated list.
- Number of points must be between 2 and 10.
- All fields must be a numeric integer or floating point.
- All numbers must be between 0 and 100. (0 is ignored for linearization or validation purposes)
- List may not contain duplicate numbers.
- Numbers must be incremental (left to right).
To set the list to its default set, click Default.
When done, click Save, then Exit. The calibration grid now contains the new set of set points.
The first row of the grid contains the titles of the columns. The second row contains the units for each column. The flow units are from the device’s pre-cal page (page 6). The temperature units come from the Pre-Cal tab. Columns without units are unit-less or ratio values.
The Zero Sensor button performs the same function as the Calibration->Zero Sensor menu item (section 12.2.1). The sensor should be zeroed prior to starting the calibration.
The calibration is started by clicking on a Click button in one of the rows under the StartMeas Column. Clicking on one of these buttons starts a live measurement at the set point of the clicked row. The software will set the device’s set point to the value in the set point column, and then continually read the device’s output including flow, temperature, and valve position. See figure below.

Installation and Operation Manual X-SW-BEST-eng Part Number: 541B197AAG February, 2017
Page 85
Brooks Expert Support Tool
Figure 85 Calibration Tab, Filled Out
Note: when performing this calibration with a meter type device, a pop-up window will appear, prompting the user to manually set the flow through the device (see figure 86 below). Since meter devices do not have a valve, the user must set the flow manually in their system. Also, the Valve Position column will not show valid data for a meter device, of course.
Figure 86 Flow Cal, Meter Set Point Prompt
The user must enter the actual flow into the Actual Flow column, the column with a dark yellow background. An external flow measuring device is required. The user will read the flow measurement from the external device and manually type it into the Actual Flow column. The user must type a valid numeric entry, or else a calibration page will not be be able to be created.
*NOTE: If the actual flow is not within 5% of the set point, the MFC output columns will turn red as a warning. When calibrating meters, take care to accurately manually adjust the flow rate (until the columns are no loger red), as this factors into the error calculation.
To go to another row (another set point), click a Click button in one of the other rows under the StartMeas Column. All rows must be filled out to continue the calibration beyond this tab. Set points can be completed in any order.

Installation and Operation Manual X-SW-BEST-eng Part Number: 541B197AAG February, 2017
Page 86
Brooks Expert Support Tool
The VGain sets the approximate full scale range. To check the value, click the StartMeas Button for 100% set point. Note the flow value shown by the external flow meter. If it is approximately at the nominal full scale range, no adjustment is needed. If it is significantly different from the nominal full scale value, an adjustment may be necessary. To adjust, change the value in the Sensor VGain numeric up/down control. To increase flow, decrease the gain value or vice-versa. You must click Save VGain to set the gain in the device. You may need to repeat this process until the full scale flow is near the desired range, as it is a trial-and-error adjustment. The gain should be set prior to measuring each set point.
To stop live readings, click the Stop Meas button or click on another tab.
The Zero Set Point button changes the device set point to 0% (useful if the set point list does not contain 0%) and stops the live measurements.
When you have filled out the grid info for all set point rows, you should click Stop Meas.
The Point Stabilize Delay value determines how much time delay occurs after clicking a set point button before the user may enter a flow value. This is to help prevent the user from entering a flow value before the flow has stabilized after changing a set point. The delay for the Calibration tab is always the same value as for the validation tab (see section Validation Tab section below).
Then you can proceed to the next tab, by clicking on the Surrogate Page tab.
Surrogate Page Tab: The Surrogate Page tab is shown in Figure 87 below.
Figure 87 Flow Calibration, Surrogate Page Tab
The surrogate page tab process uses the pre-cal page and the calibration data from the Calibration Tab to create another background page called the surrogate page. Once the surrogate page is created, multiple calibrations can be easily generated from this surrogate page without re-calibrating.
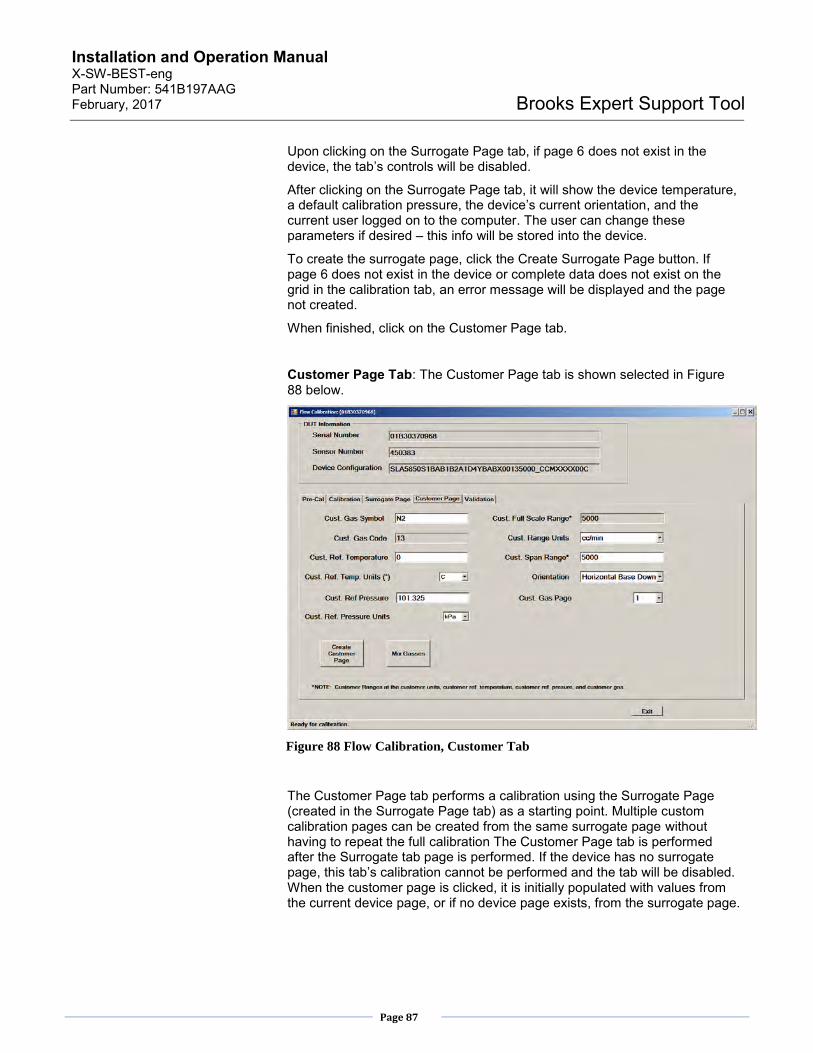
Installation and Operation Manual X-SW-BEST-eng Part Number: 541B197AAG February, 2017
Page 87
Brooks Expert Support Tool
Upon clicking on the Surrogate Page tab, if page 6 does not exist in the device, the tab’s controls will be disabled.
After clicking on the Surrogate Page tab, it will show the device temperature, a default calibration pressure, the device’s current orientation, and the current user logged on to the computer. The user can change these parameters if desired – this info will be stored into the device.
To create the surrogate page, click the Create Surrogate Page button. If page 6 does not exist in the device or complete data does not exist on the grid in the calibration tab, an error message will be displayed and the page not created.
When finished, click on the Customer Page tab.
Customer Page Tab: The Customer Page tab is shown selected in Figure 88 below.
Figure 88 Flow Calibration, Customer Tab
The Customer Page tab performs a calibration using the Surrogate Page (created in the Surrogate Page tab) as a starting point. Multiple custom calibration pages can be created from the same surrogate page without having to repeat the full calibration The Customer Page tab is performed after the Surrogate tab page is performed. If the device has no surrogate page, this tab’s calibration cannot be performed and the tab will be disabled. When the customer page is clicked, it is initially populated with values from the current device page, or if no device page exists, from the surrogate page.

Installation and Operation Manual X-SW-BEST-eng Part Number: 541B197AAG February, 2017
Page 88
Brooks Expert Support Tool
Below the Customer tab are a number of user-editable entry fields. When the Customer tab is selected, these user-editable fields are populated with the values from the device’s surrogate page (except for reference pressure and units which are set to the last user-entered values).
The user may use the existing data in the fields or, in some calibration scenarios, the user may need to change these values. For example, some users may perform calibration with a gas that is different than their process gas (for example, a user may have a process gas of CO2, but may calibrate with nitrogen). The customer page is where the user enters the process gas and its associated parameters.
When changing the parameters, the user typically changes the values from top to bottom (i.e., changes the Gas Symbol first, then Reference Temperature, etc).
*NOTE: At this stage, the parameter values may or may not match the parameters from the model code. The user must make sure to enter the values that will be used for the process gas prior to creating the customer page. In most scenarios, the data values will be changed to match the model code, if necessary.
As the user changes these values (and moves the cursor off a text box), the range value is automatically re-calculated, taking into account the other customer parameters in order to convert the range to its equivalent of the device. Finally, the user may manually change the range explicitly to the desired value.
The user will select the Cust. Gas Page from the drop down list for the page number where they want to store the new calibration.
*NOTE: If the calibration gas and process gas are different, do not select page 2 here, as that is reserved for the validation page (see section “Validation Tab” below)
Mix Gases: if the user’s process gas consists of a mix of gasses, the user may use BEST’s mixed gas set up. The user will need to obtain mixed gas parameter data on their mixture (contact Brooks Instrument).
NOTE: For mixed gas, BEST only supports N2 and the mixed gas itself as the calibration gas.
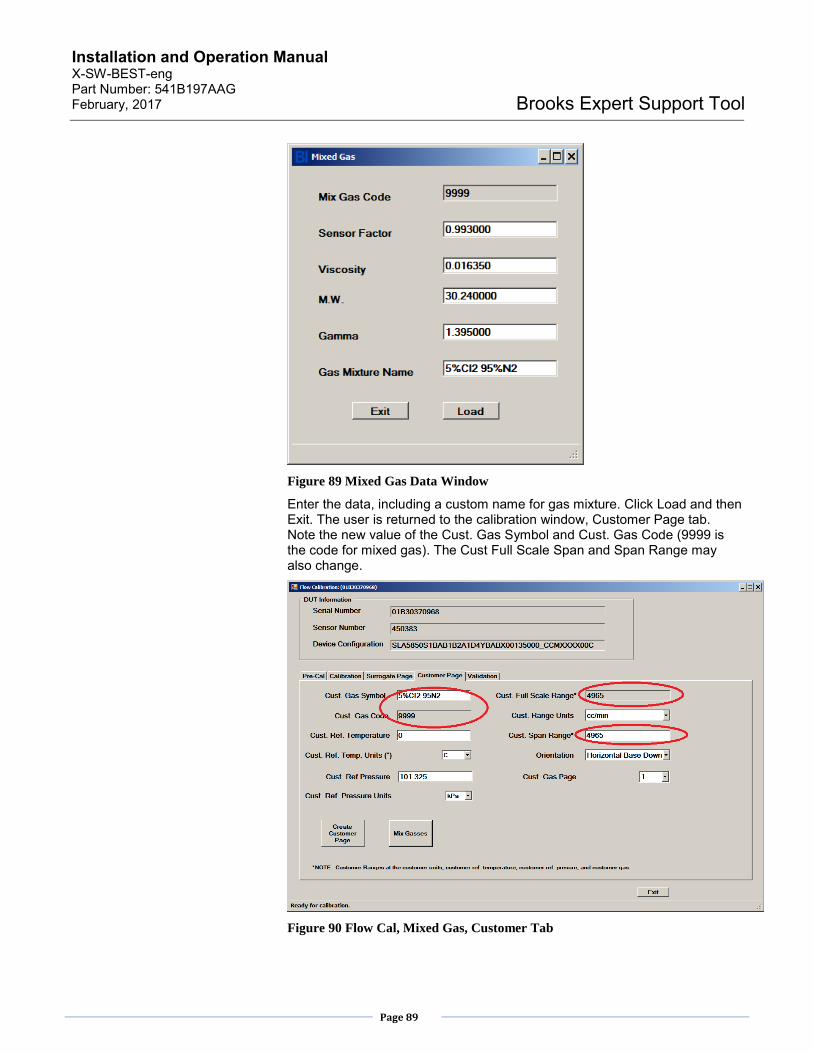
Installation and Operation Manual X-SW-BEST-eng Part Number: 541B197AAG February, 2017
Page 89
Brooks Expert Support Tool
Figure 89 Mixed Gas Data Window
Enter the data, including a custom name for gas mixture. Click Load and then Exit. The user is returned to the calibration window, Customer Page tab. Note the new value of the Cust. Gas Symbol and Cust. Gas Code (9999 is the code for mixed gas). The Cust Full Scale Span and Span Range may also change.
Figure 90 Flow Cal, Mixed Gas, Customer Tab

Installation and Operation Manual X-SW-BEST-eng Part Number: 541B197AAG February, 2017
Page 90
Brooks Expert Support Tool
Always be sure to double check all the data before clicking the Create Customer Page button. When all the data parameters are selected, the user is ready to click the Create Customer Page button. After the user confirms, the page will be created.
Next, click on the Validation tab.
Validation Tab: The Validation tab is shown selected in Figure 91 below.
Figure 91 Flow Calibration, Validation Page
If the calibration gas and customer gas are the same gas, the validation is performed using the process gas. However, if the calibration gas and customer gas are different gasses, the validation is performed using the calibration gas. In this case, you must create a separate “validation page” for the calibration gas (not the customer gas). This is done by clicking the Create Validation Page button (this button is only visible if the calibration gas and process gas are different). Clicking this button creates a new page (as page 2) and makes that page the active page. Then page 2 is used to validate the calibration using the calibration gas (the validation report will show equivalent flwo values for the process gas).
The Validation tab performs a validation of a customer page’s calibration. The page verified is the current page (see section 12.6.1 to select a page). It is assumed that the current page is the process gas page or validation page. The Customer page was created in the Customer Page tab. The Validation tab is performed after the Customer page is created. If the device has no customer page, this tab’s validation cannot be performed and the whole tab will be disabled.

Installation and Operation Manual X-SW-BEST-eng Part Number: 541B197AAG February, 2017
Page 91
Brooks Expert Support Tool
The grid in the center of the Calibration tab is the validation grid. Like the calibration grid, each row of the validation grid represents a set point. Each column represents a measurement at a set point. A number of set points will be measured and checked for accuracy.
The set point columns represent the set point values in percentage and absolute flow units. The number and values of the set points are user-configurable. The set of validation points does not need to match the set of calibration points.To change the set points, click on the Edit Points button. The Edit Setpoints window appears, as shown in Figure 84, the same way as for calibration set point selection.
The Point Stabilize Delay value determines how much time delay occurs after clicking a set point button before the user may enter a flow value. This is to prevent the user from entering a flow value before the device has stabilized (in terms of flow control) after changing a set point. The delay for the Validation tab is always the same value as for the Calibration tab (see section Calibration Tab section above).
The first row of the grid contains the titles of the columns. The second row contains the units for each column. The flow units and temperature units are from the device’s customer page. Columns without units are unit-less or ratio values.
Like the calibration tab, the validation for a set point is started by clicking on a Click button in one of the rows under the StartMeas Column. The software will set the device’s set point to the value in the set point column, and then continually read the device’s output including flow, temperature, and valve position. See Figure 91 above.
*Note: when performing this validation with a meter device (MFM), a pop-up window will appear, the same one that appears for the Calibration tab, prompting the user to manually set the flow through the device (see figure 86 above). Since meter devices do not have a valve, the user must set the flow manually in their system. Also, the Valve Position column will show 0% for meter devies.
*NOTE: If the actual flow is not within 5% of the set point, the MFC output columns will turn red as a warning. When calibrating meters, take care to accurately manually adjust the flow rate (until the columns are no loger red) as this may affect the accuracy calculation.
*NOTE: The accuracy calculation is the delta between the expected flow and external actual measurement. The pass/fail criteria (red or green) is based on the percentage of full-scale for all points.
Like the calibration tab, in the validation tab the user must enter the actual flow into the Actual Flow column, the column with a red background. An external flow measuring device is required. The user will read the flow measurement from the external device and manually type it into the Actual Flow column.
To go to another row (another set point), click a Click button in one of the other rows under the StartMeas Column. All rows must be filled out with valid numeric data to complete the validation and create a certification sheet (see section “Print Cert” below). Set points can be completed in any order.

Installation and Operation Manual X-SW-BEST-eng Part Number: 541B197AAG February, 2017
Page 92
Brooks Expert Support Tool
Once a user types in an actual flow value, the error percentage is automatically calculated and updated for the current row.
Clicking the Validate Accuracy button stops live measurements and recalculates the accuracy for all set points (all rows). The accuracy calculation compares the target set point/flow rate to the (manually entered) external meter value.
At any time, to stop live readings, click the Stop Meas button.
The Zero Set Point button stops live measurement and changes the device set point to 0% (useful if the set point list does not contain 0%).
When you have filled out the grid info for all set point rows, you should click Stop Meas. Then, if desired, you can proceed to print a certification report, (see next section).
Print Cert: Once the validation is completed, the user can print out a certification sheet (or “Cert”). This is a report showing the validation results data and some custom user information.
Click the Print Cert button. A window will open allowing the user to choose a set of custom data items that will appear on the report, in addition to the validation data. The user may select, edit, and save the set of custom report data (see Figure below).
The fields with a white background are initialzied from values from the device or software. Fields with a yellow background are initialzied with values from a user profile. A user profile is a set of user-selected values that are stored so that the user does not have to repeatedly type in the same values. The user save a set of values in a profile, create aprofile and select a profile. The fields with a gray background can not be changed by the user. The user may also choose the image that appears on the footer of the report. The user may choose the default, or may provide their own logo.
The user may also select the number of decimal plcaes that appear in the tabuar data on the report, via the Decimal Places box.

Installation and Operation Manual X-SW-BEST-eng Part Number: 541B197AAG February, 2017
Page 93
Brooks Expert Support Tool
Figure 92 Flow Cal, Cert Sheet Preview Page
After this, click Generate Report and a preview of the report will be displayed.
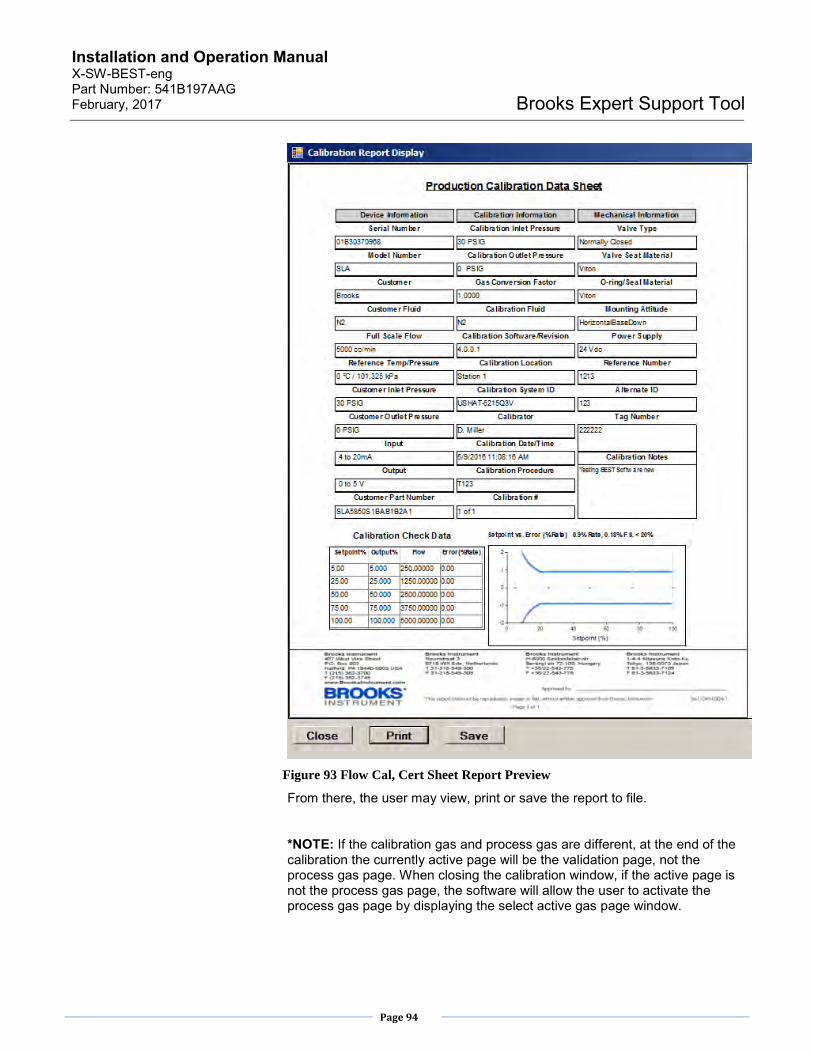
Installation and Operation Manual X-SW-BEST-eng Part Number: 541B197AAG February, 2017
Page 94
Brooks Expert Support Tool
Figure 93 Flow Cal, Cert Sheet Report Preview
From there, the user may view, print or save the report to file.
*NOTE: If the calibration gas and process gas are different, at the end of the calibration the currently active page will be the validation page, not the process gas page. When closing the calibration window, if the active page is not the process gas page, the software will allow the user to activate the process gas page by displaying the select active gas page window.

Installation and Operation Manual X-SW-BEST-eng Part Number: 541B197AAG February, 2017
Page 95
Brooks Expert Support Tool
When the user closes the calibration window, if a temporary page (test page or validation page) is still active (as when the calibration process is not completed), the software will notify the user that a tmepoarary page is still active, It will ask the user if they would like to select a customer page – if they answer yes, the cal pages window will appear to allow the user to select a customer page.
12.7.2. Pressure Controller Calibration
Pressure calibration is performed for PC device types (this is not performed for RT devices). The process is similar to the flow calibration process, although less complex. An example pressure calibration window is shown in the figure below.
Figure 94 Pressure Calibration Window, Cal Setup Tab Shown
At the top of the window is the DUT information block. This information is read-only and is for information purposes only.
Below that are the tabs: Cal Setup, Orifice, Calibration, Linearization Page, Customer Page, and Validation (see Figure 94). These tabs are normally executed in order from left to right. Select each tab by clicking on it.
Cal Setup Tab: The Cal Setup tab is performed first. The Cal Setup tab is shown selected in Figure 94.

Installation and Operation Manual X-SW-BEST-eng Part Number: 541B197AAG February, 2017
Page 96
Brooks Expert Support Tool
Below the Cal Setup tab are a number of data fields. Most of these fields are read-only, and are obtained from the device and its model code.
The Transducer Full Scale Pressure and its units are the rated value of the device’s internal pressure transducer and can’t be changed.
*NOTE: Make sure the model code has been set up correctly prior to starting the calibration (see section 10.5).
The user may change the Cal Pressure Units (External Gauge) value. This is typically set to the units of the user’s external pressure gauge in their system, for convenience, for making manual readings needed during the calibration process (see section “Calibration Tab” below). If the user changes this units value to another units, the numerical value of the Cal Full-Scale Pressure text box is converted to the equivalent in user units.
The user will then click Create Pre-Calibration Gas Page. This will create an initial, temporary calibration page in Page 6, to be used later in the calibration process. (Page 6 is considered the linearization page that, once created, can be used later to create other custom pages without needing to perform the full calibration again.) The user is asked if they are okay with overwriting any existing page 6.
Then the user is asked if they want to over-write the Pressure Response Tuning attributes with default values. These are values in the device, in the current page, that may have been created during a valve tuning operation (see section 12.8) for the current page. If the user had previously done a valve tuning operation (which creates these attributes), they may want to preserve those values. Click No to copy the current values form the current page to the the new page 6 and continue with the calibration. Click Cancel to cancel the process. Or, cick Yes to write default values to the new page 6 and continue with the calibration.
After clicking the Create Pre-Calibration Gas Page button, the page is created as page 6, and that page is activated as the current page.
Netx, click the Orifice Tab.
Orifice Tab: The orifice tab is used as an aid in calculating the orifice factor and adjusted flow range when the gas used for valve tuning is different than the process gas. If the gas used for valve tuning is the same as the process gas, this tab may be ignored.
This tab is initially populated with process gas values from the device’s model code. The user should edit their calibration gas values under the calibration text block. Then click the Calc Orifice Factor and Range button.
The orifice factor and equivalent adjusted flow range will be calculated., as well as the gas densities of the gasses. The new orifice factor and equivalent adjusted flow will appear on the cal sheet.
*NOTE: You must click the calculate button to recalulate the values.

Installation and Operation Manual X-SW-BEST-eng Part Number: 541B197AAG February, 2017
Page 97
Brooks Expert Support Tool
Figure 95 Pressure Calibration, Orifice Tab
Calibration Tab: The Calibration tab for pressure calibration is shown in the figure below.
Figure 96 Pressure Calibration, Calibration Tab
Installation and Operation Manual X-SW-BEST-eng Part Number: 541B197AAG February, 2017
Page 98
Brooks Expert Support Tool
The Calibration tab performs a calibration using the Pre-Cal page (created in the previous tab) as a starting point. The Calibration tab is performed after the Pre-Cal page is created. If the device has no Pre-Cal page (page 6), this tab’s calibration cannot be performed and the tab will be disabled.
The Point Stabilize Delay value determines how much time delay occurs after clicking a set point button before the user may enter a pressure value. This is to prevent the user from entering a pressure value before the flow has stabilized after changing the set point. The delay for the Calibration tab is always the same value as for the validation tab (see section Validation Tab below).
The set point columns represent the set point values in percentage and absolute pressure units. The number and values of the set points are user-configurable. To change the set points, click on the Edit Points button. The Edit Setpoints operation is the same as for the flow calibration, except that for pressure calibration, it is recommended that all set points be <= 80%. For pressure calibration, two points is usually sufficient. The set of calibration points does not need to match the set of validation points.
The grid in the center of the Calibration tab is the calibration grid. Each row of this grid represents a set point. Each column represents a measurement at the set point. A number of set points will be measured, and characterized to provide a correction for accuracy.
The first row of the grid contains the titles of the columns. The second row contains the units for each column. The pressure units are from the Cal Setup tab selection. The temperature units come from the model code. Columns without units are unit-less or ratio values.
Sensor Zero: If you intend to use the interpolated version of the sensor zero operation (see section 12.2.2), you must do so before measuring any of the set points. After opening the Calibration window and clicking on a set point for the first time, a reminder for the sensor zero will appear. This will ask if you want to perform a sensor zero operation. If you click “Yes”, the set point will not be measured, giving the user an opportunity to click on the Zero Sensor button. Clicking “No” will continue with the set point setup, and will not again remind the user (until the calibration window is closed and re-opened).
Clicking the Zero Sensor button on the calibration window will perform the interpolated pressure sensor zero operation (see section 12.2.2 for additional information). As mentioned in section 12.2.2, the interpolated method is the preferred method.
The interpolated pressure sensor zero operation will measure two points along the range of the sensor. The points for a zero operation are at 80% and 0% of the full scale transducer range. These two points will be used in a linear interpolation to calculate the offset correction at absolute zero pressure (0 psia).
First, the operation prompts the user to set up their system for calibration, including pressure on the inlet and vacuum on the outlet, as needed. The setup requires an external pressure meter as well.

Installation and Operation Manual X-SW-BEST-eng Part Number: 541B197AAG February, 2017
Page 99
Brooks Expert Support Tool
Next, at the high point (80%) the software prompts the user to set up the pressure at 80%. The window shows the live reading of device pressure and valve position for reference. The user is instructed to read the external meter and manually enter the pressure value (in user’s units) onto the form. (See figure below).
Figure 97 Pressure Sensor Zero, High Point
Next, at the Low point (0%) the software prompts the user to set up the pressure to 0% pressure. The window shows the live reading of device pressure and valve position for reference. The user is instructed to read the external meter and manually enter the pressure value (in user’s units) onto the form. (See figure below).

Installation and Operation Manual X-SW-BEST-eng Part Number: 541B197AAG February, 2017
Page 100
Brooks Expert Support Tool
Figure 98 Pressure Sensor Zero, Low Point
After this, a final measurement at zero pressure again will be presented in the same manner, for a final, corrected measurement at zero pressure. This completes the pressure sensor zero operation.
Next, the calibration set points can be measured.
The calibration is started by clicking on a Click button in one of the rows under the StartMeas Column (see Figure 99) Clicking on one of these buttons starts a live measurement at the set point of the clicked row. The software will set the device’s set point to the value in the set point column, and then continually read the device’s output including pressure, temperature, and valve position for reference. See figure below.

Installation and Operation Manual X-SW-BEST-eng Part Number: 541B197AAG February, 2017
Page 101
Brooks Expert Support Tool
Figure 99 Pressure Calibration, Calibration Tab
The user must manually enter the actual pressure into the Actual Pressure column, the column with a dark yellow background. An external pressure meter is required. The user will read the pressure measurement from the external meter and manually type it into the Actual Pressure column.
To go to another row (another set point), click a Click button in one of the other rows under the StartMeas Column. All rows must be filled out to continue the calibration beyond this tab. Set points can be completed in any order.
To stop live readings, click the Stop Meas button.
The Zero Set Point button changes the device set point to 0% (useful if the set point list does not contain 0%) and stops the live measurements.
When you have filled out the grid info for all set point rows, you should click Stop Meas. Then you can proceed to the next tab, by clicking on the Linearization Page tab.
Linearization Page Tab: The Linearization Page tab is performed next. The Linearization Page tab is shown below in Figure 100.

Installation and Operation Manual X-SW-BEST-eng Part Number: 541B197AAG February, 2017
Page 102
Brooks Expert Support Tool
Figure 100 Pressure Calibration, Linearization Page Tab
Click the Create Linearization page button to create the linearization page. The linearization is saved to page 6 and that page becomes the active page.
Customer Page Tab: The Customer Page tab is performed next. The Customer Page tab is shown below in Figure 101.

Installation and Operation Manual X-SW-BEST-eng Part Number: 541B197AAG February, 2017
Page 103
Brooks Expert Support Tool
Figure 101 Pressure Calibration, Customer Page Tab
The Customer Page tab is where the user can customize some settings. The Customer Page uses the linearization page (page 6, created in the Linearization Page tab) and creates a user-specified “customer page”. Multiple customer pages can be created from the same linearization page without performing a full calibration again.
The Customer Full-Scale Pressure is the pressure to be used for the final full-scale pressure on the device (after page creation). This value can be at the transducer full scale pressure, or lower. The Customer Pressure Units drop-down box is user-selectable. However, note that the Customer Full-Scale Pressure and Customer Pressure Units are used together to determine the pressure scale for the device.
The Customer Page Number can be any number from 1 to 6. It is recommended that you not select page 6 to preserve the linearization page for future use in creating other new pages, if desired. However, if you are done with page 6 you may overwrite it if desired.
The tuning values block contains the tuning values presently in the device. These can be changed here if desired. However, if these values need to be changed, they would typically be changed during a valve tuning operation (see section 12.8).
Clicking Create Customer page creates the page as the page number selected. That page number will be active afterwards.
Validation Tab: The Validation tab is shown selected in Figure 102 below.

Installation and Operation Manual X-SW-BEST-eng Part Number: 541B197AAG February, 2017
Page 104
Brooks Expert Support Tool
Figure 102 Pressure Calibration, Validation Tab
The Validation tab performs a validation of a customer page’s calibration. The page verified is the current page (see section 12.6.2 to select a page). It is assumed that the current page is the customer page. The Customer page was created in the Customer Page tab. The Validation tab is performed after the Customer page is created. If the device has no customer page, this tab’s validation cannot be performed and the whole tab will be disabled.
The grid in the center of the Calibration tab is the validation grid. Like the calibration grid, each row of the validation grid represents a set point. Each column represents a measurement. A number of set points will be measured and checked for accuracy.
The set point columns represent the set point values in percentage and absolute pressure units. The number and values of the set points are user-configurable. To change the set points, click on the Edit Points button. The Edit Setpoints window appears, the same way as for calibration set point selection (see Figure 84 to set the collection of set points).
The Point Stabilize Delay value determines how much time delay occurs after clicking a set point button before the user may enter a flow value. This is to prevent the user from entering a flow value before the flow has stabilized after changing a set point. The delay for the Validation tab is always the same value as for the Calibration tab (see section Calibration Tab section above).
The first row of the grid contains the titles of the columns. The second row contains the units for each column. The pressure units are the user’s preference from the Customer Page tab and temperature units are from the device’s model code. Columns without units are unit-less or ratio values.

Installation and Operation Manual X-SW-BEST-eng Part Number: 541B197AAG February, 2017
Page 105
Brooks Expert Support Tool
Like the calibration tab, the validation for a set point is started by clicking on a Click button in one of the rows under the StartMeas Column. Clicking on one of these buttons starts a live measurement at the set point of the clicked row. The software will set the device’s set point to the value in the set point column, and then continually read the device’s output including pressure, temperature, and valve position. See Figure 102.
Like the calibration tab, in the validation tab, the user must manually enter the actual pressure into the Actual Pressure column, the column with a dark yellow background. An external pressure meter is required. The user will read the pressure measurement from the external meter and manually type it into the Actual Pressure column.
To go to another another set point, click a Click button in one of the other rows under the StartMeas Column. All rows must be filled out to complete the validation and create a certification sheet. Set points can be completed in any order.
Once a user types in an actual pressure value, the error percentage is automatically calculated and updated for the current row. The accuracy calculated is the set point pressurecompared to the actual, external pressure reading.
Clicking the Validate Accuracy button stops live measurements and recalculates the accuracy for all rows (all set points).
At any time, to stop live readings, click the Stop Meas button.
The Zero Set Point button stop slive measurement and changes the device set point to 0% (useful if the set point list does not contain 0%).
When you have filled out the grid info for all set point rows, you should click Stop Meas. Then, if desired, you can proceed to print a certification report, (see next paragraph).
Print Cert: Once the validation is completed, the user can print out a certification sheet (or “Cert”). This is a report showing the validation results data and some custom user information.
Click the Print Cert button. A window will open allowing the user to choose a set of custom data items that will appear on the report, in addition to the validation data. The user may select, edit, and save the set of custom report data (see Figure 103 below).

Installation and Operation Manual X-SW-BEST-eng Part Number: 541B197AAG February, 2017
Page 106
Brooks Expert Support Tool
Figure 103 Pressure Calibration, Cert Sheet Options Window
After this, a preview of the report will be displayed.

Installation and Operation Manual X-SW-BEST-eng Part Number: 541B197AAG February, 2017
Page 107
Brooks Expert Support Tool
Figure 104 Pressure Calibration, Cert Sheet Preview Window
From there, the user may view, print or save the report to file.
12.7.3. RT Device Calibration
The calibration process for an RT device is exactly the same as for an MFC device, with a few minor exceptions.
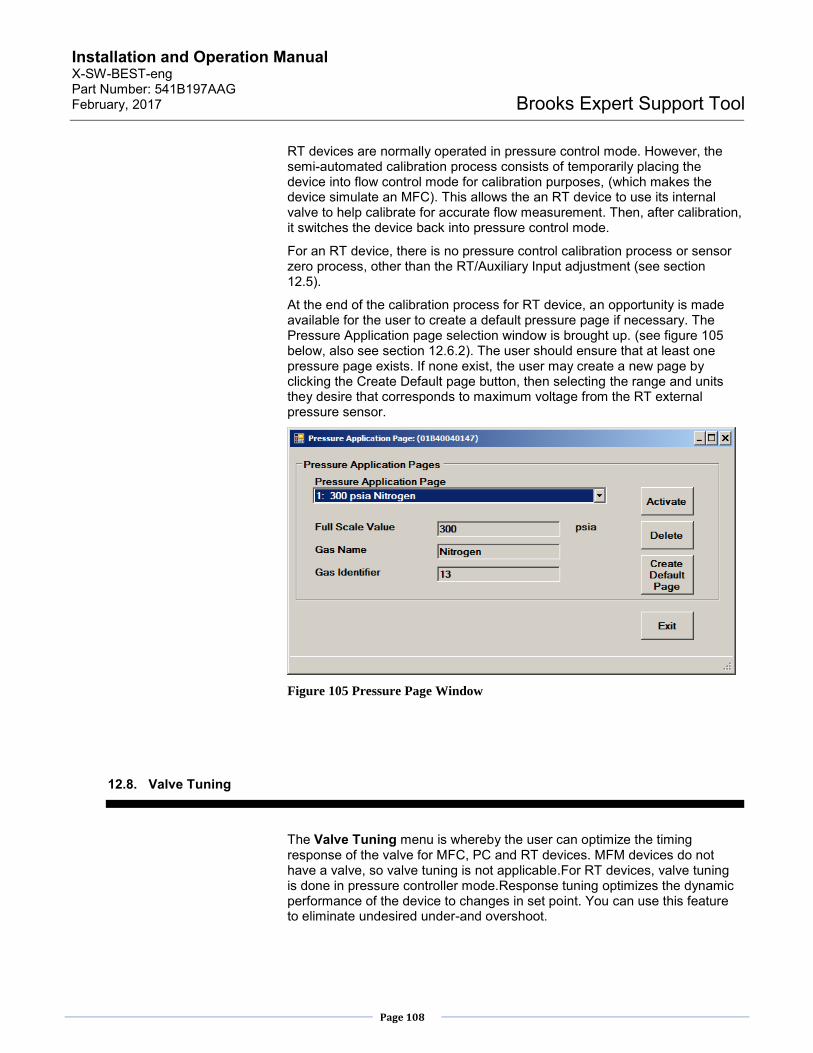
Installation and Operation Manual X-SW-BEST-eng Part Number: 541B197AAG February, 2017
Page 108
Brooks Expert Support Tool
RT devices are normally operated in pressure control mode. However, the semi-automated calibration process consists of temporarily placing the device into flow control mode for calibration purposes, (which makes the device simulate an MFC). This allows the an RT device to use its internal valve to help calibrate for accurate flow measurement. Then, after calibration, it switches the device back into pressure control mode.
For an RT device, there is no pressure control calibration process or sensor zero process, other than the RT/Auxiliary Input adjustment (see section 12.5).
At the end of the calibration process for RT device, an opportunity is made available for the user to create a default pressure page if necessary. The Pressure Application page selection window is brought up. (see figure 105 below, also see section 12.6.2). The user should ensure that at least one pressure page exists. If none exist, the user may create a new page by clicking the Create Default page button, then selecting the range and units they desire that corresponds to maximum voltage from the RT external pressure sensor.
Figure 105 Pressure Page Window
12.8. Valve Tuning
The Valve Tuning menu is whereby the user can optimize the timing response of the valve for MFC, PC and RT devices. MFM devices do not have a valve, so valve tuning is not applicable.For RT devices, valve tuning is done in pressure controller mode.Response tuning optimizes the dynamic performance of the device to changes in set point. You can use this feature to eliminate undesired under-and overshoot.

Installation and Operation Manual X-SW-BEST-eng Part Number: 541B197AAG February, 2017
Page 109
Brooks Expert Support Tool
Users can tune valves on either flow or pressure control devices. The process is very similar for both. In the following section, the description applies to both flow and pressure control devices, except where noted.
Pedestal Tuning: The valve tuning process typically starts with pedestal tuning. Tuning the pedestal sets the valve's offset and has a great effect on the response to a set point change.
The way of calculating the pedestal value is different for normally closed and normally open valves.
For MFC and RT devices, the basic procedure for finding the pedestal value is to find the valve drive value at the point where the device starts flowing gas. This can easily be done with MFC and RT devices; however, for a PC device, it is more complicated. For an MFC or RT device, you configure a set point of 1%. If the device has a wrong pedestal, it might take some time for the device to reach the 1% flow. You might be able to speed this up by first configuring a set point of 10% and then going down to 1%.
For a pressure controller, configuring a set point will not work. You have to use the manual valve control mode in the Device Control -> Valve Control menu. Find the point at which the device starts flowing gas using the valve position field. Use an external flow meter to measure the flow and try to get down to ~1% of the maximum flow of the pressure controller at a low pressure.
If the device has a normally closed valve (i.e., closed when unpowered), the pedestal is equal to the valve drive in percent at 1% flow, minus 7%. If the device has a normally open valve (i.e., opened when unpowered) the pedestal is equal to the inverse of the valve drive in percent at 1% flow, plus 7% (100% -'valve drive in %' -7%).
*Note: For devices calibrated at the factory, response tuning adjustments should not be necessary, as calibrations are performed to the device’s specified process conditions. If you do want to adjust the response tuning, it is strongly recommended that you only adjust the PID Kp and Ki (proportional and integral gain). Only in rare occasions the Kd1 and Kd2 (derivative gain) values might improve performance. Make sure that you have saved the device configuration prior to adjusting these values. For Brooks Expert Support Tool training, which includes training for response tuning, contact your local Brooks service representative.
The valve tuning process typically involves cycling the flow or pressure between a high and a low set point value, while watching and adjusting the parameters that control the response of the valve. The objective is to minimize overshoot and undershoot.
To tune the device’s response, you will set up a square wave for the set point. You will then make adjustments to tuning parameters to make the actual flow graph match the set point’s square wave.
The user will open the main graph window (see section 13.4) and start the monitoring. Then the user will open the Calibration->Valve Tuning menu and make adjustments there while watching the performance on the main graph. Position the Graph window so that you can see the Tuning and Graph windows at same time.

Installation and Operation Manual X-SW-BEST-eng Part Number: 541B197AAG February, 2017
Page 110
Brooks Expert Support Tool
The flow controller valve response tuning setup window is shown below in figure 106 and the pressure controller valve response tuning setup window is shown in figure 107.
Figure 106 Flow Valve Tuning Setup Window
Figure 107 Pressure Valve Tuning Setup Window
Set up the set point square wave, in the Cycling block of the Tuning window. You should pick high and low set points that are at the expected range of your process application.

Installation and Operation Manual X-SW-BEST-eng Part Number: 541B197AAG February, 2017
Page 111
Brooks Expert Support Tool
The Cycling block in this window allows the user to select parameters determining the high and low set point of the cycling. The Start button starts the cycling and the Stop button stops the cycling. The Switching time determines how often the set point changes state during the cycling.
For valve tuning, it is recommended that you choose % as your units of display for setpoint, pressure and flow.
*Note: The Brooks Expert Support Tool is intended to be used for thermal mass flow controllers and thermal mass flow meters. If you are adjusting a meter model (MFM), use a separate flow controller to regulate the set point cycling.
Click the Start button to begin flow.
Observe how closely the actual flow matches the set point square wave. Start making adjustments using the PID Kp and Ki (proportional and integral gain) values.
The Status block of the valve response tuning form shows the status during the cycling.
The Adjustments block is where the adjustments are made during the cycling. When changing values, always remember to click Apply.
Figure 108 Flow Valve Tuning Operation
Effect of Kp and Ki Values on Flow Control: The following screens how some examples of what the flow graph looks like when Kp and Ki values are too high or too low.

Installation and Operation Manual X-SW-BEST-eng Part Number: 541B197AAG February, 2017
Page 112
Brooks Expert Support Tool
Figure 109 Valve Tuning, Kp value is too high, or Ki is too low.
Figure 110 Valve Tuning, Kp and Ki values too low.
Start with the original PID settings. Note that these may vary per device.

Installation and Operation Manual X-SW-BEST-eng Part Number: 541B197AAG February, 2017
Page 113
Brooks Expert Support Tool
Figure 111 Original PID settings
Increase the Kp value, the slope of the red circled part will slightly increase.
Figure 112 Valve Tuning, Increase Kp value
Increase the Ki value, to move the flow curve towards the set point curve. This change will be the most visible but might lead to overshoot and undershoot.

Installation and Operation Manual X-SW-BEST-eng Part Number: 541B197AAG February, 2017
Page 114
Brooks Expert Support Tool
Figure 113 Valve Tuning, Overshoot
Pressure Response Tuning: Response tuning optimizes the dynamic performance of the pressure controller device to changes in set point. You can use this feature to eliminate undesired undershoot and overshoot.
Note: PID values for pressure controllers are tuned in the factory. However these PID values might not be optimal for the customer's setup. If you do need to adjust the response tuning, it is strongly recommended that you only adjust the PID Kp and Ki (proportional and integral gain) and anti windup low/high limits. Only in rare occasions the Kd1 and Kd2 (derivative gain) values might improve performance. Anti windup gain can be disabled by setting the anti windup gain to 0. Do not use any other value than the default of 0.2 or 0. Tuning the anti windup limits will help in solving undershoot and/or overshoot without slowing down the signal too much. Make sure that you have saved the device configuration prior to adjusting these values. For Brooks Expert Support Tool training, which includes training for response tuning, contact your local Brooks service representative.
To tune the device’s response, you will set up a square wave for the set point. You will then make adjustments to tuning parameters to make the actual pressure graph match the set point’s square wave.
Make sure that the valve pedestal value is correct, use the procedure in section “Pedestal Tuning” above to get the correct value.
To tune the device’s response:
1. Open the Tune menu and click the Pressure Response Tuning button to display the Pressure Response Tuning window.
The sample screen below shows some default tuning values.

Installation and Operation Manual X-SW-BEST-eng Part Number: 541B197AAG February, 2017
Page 115
Brooks Expert Support Tool
Figure 114 Pressure Valve Tuning, Default Values
2. Position the Graph window so that you can see the Tuning and Graph windows at same time.
3. Set up the set point square wave, as shown in the Figure below. You
should pick high and low set points that are at the expected range of your process application.
Figure 115 Pressure Valve Tuning, Cycle Settings
Note: The Brooks Expert Support Tool is intended to be used for thermal mass flow controllers and thermal mass flow meters. If you are adjusting a meter model, use a separate flow controller to regulate the set point cycling. 4. Click the Start button to begin flow.
5. Observe how closely the actual flow matches the set point square wave.

Installation and Operation Manual X-SW-BEST-eng Part Number: 541B197AAG February, 2017
Page 116
Brooks Expert Support Tool
6. Start making adjustments using the PID Kp and Ki (proportional and integral gain) values.
Effect of Kp and Ki Values on Pressure Control: The following screens show some examples of what the pressure graph looks like when Kp and Ki values are too high or too low.
Figure 116 Pressure Valve Tuning, Kp Low
A Kp value that is too low leads to oscillations in both the pressure reading and valve drive.
Figure 117 Pressure Valve Tuning, Ki Low
A Ki value that is too low leads to a pressure reading curve that does not reach its end value in a straight line; see red circled part.

Installation and Operation Manual X-SW-BEST-eng Part Number: 541B197AAG February, 2017
Page 117
Brooks Expert Support Tool
Figure 118 Pressure Valve Tuning, Correct Kp and Ki Values
Effect of Anti-Windup Settings on Pressure Control: Tuning the anti windup low and high limits will remove any under- or overshoot of pressure response to a set point. The values of these limits are different for a normally closed versus a normally opened valve. By definition, the high limit should be higher in value than the low limit in all cases.
Normally Closed Valve: For a normally closed valve, the default value of the low limit is 5% below the pedestal value. The high limit is the valve drive at the maximum pressure and maximum flow, plus a tolerance of 10%.
Figure 119 Anti Windup for a Normally Closed valve
Normally Open Valve: For a normally open valve, the default value of the high limit is 5% above the pedestal value. The low limit is the

Installation and Operation Manual X-SW-BEST-eng Part Number: 541B197AAG February, 2017
Page 118
Brooks Expert Support Tool
inverse (100%-valve drive in percent) of the valve drive at the maximum pressure and maximum flow, minus a tolerance of 10%.
Figure 120 Anti Windup for a Normally Open valve
13. Monitoring Menu
The Monitoring menu gives the user the ability to monitor various aspects of the device. Each of the windows accessible through the Monitoring menu, when opened, shows a live status of various parameters of the device. This includes alarms, warnings, flow, pressure, control, and other status parameters.
Except for the graph window (section 13.4), these windows are monitoring as long as they are open. These windows update at once a second typically. These windows are read-only windows and can access and display these parameters whether the device is in internal (digital) or external (analog) control mode.
Most Monitoring menu windows can be resized by using the mouse to grab an edge or corner of the window and dragging.

Installation and Operation Manual X-SW-BEST-eng Part Number: 541B197AAG February, 2017
Page 119
Brooks Expert Support Tool
13.1. Warning Status
The Warning Status Window shows detailed warning states for supported devices interfaces/protocols. Currently, only EtherCAT/DeviceNet interfaces support warnings. The exact warnings shown may vary depending on the device type. The warning window for a flow controller is shown below in Figure 121.
Figure 121 Warning Status Window
13.2. Alarm Status
The Alarm Status window shows detailed alarm states for supported devices interfaces/protocols. The exact warnings shown may vary depending on the protocol type and device type. The alarm window for a flow controller with RS485 interface is shown below in Figure 122.

Installation and Operation Manual X-SW-BEST-eng Part Number: 541B197AAG February, 2017
Page 120
Brooks Expert Support Tool
Figure 122 Alarm Status Window
13.3. User Totalizer Window
The User Totalizer allows a user to track to total flow of a device over time form a user reference point in time. The totalizer may be reset by clicking the Reset button in the window. The window’s update rate and flow units displayed may be set by the user (see section 7.3). The window shows the total elapsed time since the last reset.
*NOTE: The User Totalizer is different from the hardware totalizer. The hardware totalizer is a totalizer that exists in the device firmware. The hardware totalizer cannot be reset, as it is for maintenance purposes. The user totalizer, however, is based on the hardware totalizer.
The User Totalizer window is in Figure 123 shown below.

Installation and Operation Manual X-SW-BEST-eng Part Number: 541B197AAG February, 2017
Page 121
Brooks Expert Support Tool
Figure 123 User Totalizer Window
13.4. Graph Window
The Main Graph window shows device measurements such as flow, flow set point, pressure, pressure set point, temperature, and valve position, over time. It also features some commonly used control funtions.
Legend-> <- User Annotation MainGraph-> Control Buttons-> Meters Panel-> Status Panel-> Graph Status Bar->
Figure 124 Main Graph Window
When the main Graph window is opened it does not start monitoring automatically. To start monitoring, click the Start button. Click Stop to stop monitoring. Click Start to re-start, or Resume to resume monitoring.
There are a number of options of the graph that the user can select. They can be selected in the Tools->Options->Graph menu (see section 7.1). The parameters that are graphed on the window, the units used for the parameters, X scale, Y scale, and legend are all user options.

Installation and Operation Manual X-SW-BEST-eng Part Number: 541B197AAG February, 2017
Page 122
Brooks Expert Support Tool
The Meters Panel shows important device measurements. (The name “meters” was chosen because a flow meter measures flow, a temperature meter measures temperature, etc.). The exact parameters that are shown mya change depending on the user graph settings and the type of device (see section 7.1). The Meters Panel is also where the user selects the control source and set point.
The Control Source can be either Software or External for control of the set point. If the control source is set to Software, the user controls the set point via BEST software via the diagnostics port (see section Set Point control below). If External is selected, the software no longer controls the set point, (but can still monitor the set points) – the set point is control by an external controller physcially connected to the device on its normal control port (and not via the Diagnostics port). Selecting External disables BEST software’s set point up/down control. Selecting Software control re-enables it. Changing the Control Source from External to Software will cause the software to change the device’s set point to 0 for safety.
The Set Point Control allows the user to set the device’s set point via BEST software (if Control Source is set to Software). The units for the set point are displayed next to the numeric up/down control. These units are the same as set by the graph options for set point (flow or pressure depending on the type of device - see section 7.1). If the user changes the units options unbder the graph options menu, the units here will be updated to match and the numeric value will be updated to the equivalent units.
The Basic Status Panel shows some basic status parameters. The displayed parameters are:
Monitoring: Whether the main graph is currently Running or Stopped.
Full Scale: Displays the full scale flow or pressure range of the active device (value and units).
Communication: Will show “Active” or the last error message, if any.
Alarm: Will show “Alarm”, “Warning” or “Normal”. Alarm will show if any alarm is active. To see which alarm is occurring, open the Alarm Status window (see section 13.3). If there is no alarm, but a warning is occurring, this will show “Warning”. To see which warning is occurring, open the Warning Status window (see section 13.1).
Valve State: Will show the valve control state: Manual, Normal, Open, or Closed. Manual means manual control, normal means set point control of the valve. Open means valve override open. Closed means valve is closed.
Control Source: External or Software.
Totalizer: The value of the hardware totalizer (See also section 13.4).
There is a user Text Annotation block that can be used for labeling purposes. The text can be edited, moved, and resized. To edit the text block, click on the text block, type in the new text, then click off the block. To move the text block, click on the text block and a frame will appear - then drag the box to the desired location. To resize the text block, click on the text block and a frame will appear – then drag one of the handles (sides or corners). To clear the text, select the text and edit it to an empty text string. If the text is hidden, click Find Annot.

Installation and Operation Manual X-SW-BEST-eng Part Number: 541B197AAG February, 2017
Page 123
Brooks Expert Support Tool
Screen Capture: The graph can be saved to a graphics file by clicking Capture. Supported graphics file format are jpg, bmp, gif, png, and tiff.
CAUTION: The default file path for the capture file after installing or updating BEST will be set to a subfolder of the BEST folder. After installing or updating BEST, these folder path should be changed to a folder on your personal computer or network (preferably on a backed up folder location).
Print Screen: The graph can also be printed. Click Print.
Cursor: The user can display a cursor on the graph. A cursor is cross-hair that can pin point a location on the graph. To activate a cursor, click anywhere on the graph with the mouse. A crosshair appears and in the lower right corner of the graph, a box appears with the X and Y location of the cursor (see Figure 125). To move the cursor click on another location in the graph and the the location of the cursor is updated in the box. To remove the cursor, right click on the graph. A context menu appears – click Clear Cursor (see Figure 126).
Zoom: The user can zoom in on a portion of the graph. To zoom in, click anywhere on the graph with the mouse, then drag to form a rectangle, then release the mouse. The graph shows a zoomed area of the graph and scroll bars appear (see Figure 127). To remove the zoom effect, right click on the graph. A context menu appears – click reset Graph Zoom (see Figure 126).
Figure 125 Main Graph Window with Cursor

Installation and Operation Manual X-SW-BEST-eng Part Number: 541B197AAG February, 2017
Page 124
Brooks Expert Support Tool
Figure 126 Main Graph Window Context Menu
Figure 127 Graph Window Zoomed

Installation and Operation Manual X-SW-BEST-eng Part Number: 541B197AAG February, 2017
Page 125
Brooks Expert Support Tool
LIMITED WARRANTY Visit www.BrooksInstrument.com for the terms and conditions of our limited war BROOKS SERVICE AND SUPPORT Brooks is committed to assuring all of our customers receive the ideal flow solution for their application, along with outstanding service and support to back it up. We operate first class repair facilities located around the world to provide rapid response and support. Each location utilizes primary standard calibration equipment to ensure accuracy and reliability for repairs and recalibration and is certified by our local Weights and Measures Authorities and traceable to the relevant International Standards. Visit www.BrooksInstrument.com to locate the service location nearest to you. START-UP SERVICE AND IN-SITU CALIBRATION Brooks Instrument can provide start-up service prior to operation when required. For some process applications, where ISO-9001 Quality Certification is important, it is mandatory to verify and/or (re)calibrate the products periodically. In many cases this service can be provided under in-situ conditions, and the results will be traceable to the relevant international quality standards. CUSTOMER SEMINARS AND TRAINING Brooks Instrument can provide customer seminars and dedicated training to engineers, end users and maintenance persons. Please contact your nearest sales representative for more details. HELP DESK In case you need technical assistance: USA 888 275 8946 Korea +82 31 708 2521 Netherlands +31 (0) 318 549290 Taiwan +886 3 5590 988 Germany +49 351 215 2040 China +86 21 5079 8828 Japan +81 3 5633 7100 Singapore +6297 9741 Due to Brooks Instrument's commitment to continuous improvement of our products, all specifications are subject to change without notice. RADEMARKS Brooks Brooks Instrument, LLC DeviceNet Open DeviceNet Vendors
Association, Inc.