brookline public health report on the novel coronavirus
TRANSCRIPT

Brookline Public Health Report on the
Novel Coronavirus (COVID-19)
Brookline Public Health and Human Services
March 2020-2021
Prepared by:
Dr. Swannie Jett, DrPH, MSc
Chandni Joshi, DrPH Candidate, MPH
Anna Phares, MD/MPH Candidate
Alyssa Amick, MPH

Contents
Message from the Health Commissioner .................................................. 3
Executive Summary ................................................................................... 4
COVID-19: The Basics .............................................................................. 5
INTRODUCTION ............................................................................................................................ 5
SYMPTOMS..................................................................................................................................... 5
MORTALITY ................................................................................................................................... 6
TREATMENT .................................................................................................................................. 6
PREVENTION ................................................................................................................................. 6
A Timeline of COVID-19 Developments in 2020 ..................................... 8
The Impact ................................................................................................. 9
THE U.S. ........................................................................................................................................... 9
IN MASSACHUSETTS .................................................................................................................. 10
IN BROOKLINE ............................................................................................................................. 11
Our Response ............................................................................................ 11
FACE-COVERING ........................................................................................................................ 12
SOCIAL DISTANCING AND REDUCING LARGE GATHERINGS ........................................ 12
OUTREACH AND COMMUNICATION WITH COMMUNITY MEMBERS ........................... 13
MENTAL HEALTH ....................................................................................................................... 13
EQUITY AND SOCIAL DETERMINANTS OF HEALTH ......................................................... 14
A Timeline of Brookline’s Response to COVID-19................................ 15
The Data ................................................................................................... 16
HOW BROOKLINE COMPARES TO THE STATE AND THE NATION? ............................... 16
DETAILED DATA ON CASES AND DEATHS IN BROOKLINE ............................................. 20 Total Cases in Brookline ............................................................................................................. 20
COVID-19 Cases by Social Determinants of Health .................................................................. 24
Location of COVID-19 Deaths .................................................................................................... 31
References ................................................................................................ 33

Message from the Health Commissioner
The mission of the Brookline Public Health and Human Services is to
preserve, protect, and promote the physical, mental, and environmental
health of the Brookline Community. We collaborate with partners to
reduce health inequities and respond to emerging public health
challenges. We envision an inclusive community that is healthy, safe,
connected, and equitable for all. Our goal is to control communicable
diseases and existing and potential environmental hazards; to provide
health education and clinical health services, with emphasis on the
prevention and early detection of chronic diseases and the improved
management of lifestyle issues affecting health; and to deliver services
dealing with conditions resulting from the abuse of drugs or alcohol.
In line with our goals and mission, we have implemented a range of preventative public health
measures in Brookline to the fight against the COVID-19 pandemic. We are proud to announce that
we successfully contained the spread of the virus early on during the pandemic and were successful
in maintaining one of the lowest disease rates in Massachusetts. I hope this report will help
Brookline residents and the general public to understand the trajectory of the virus and the impact of
our mitigation strategies at the community level.
-Dr. Swannie Jett

Executive Summary
COVID-19, which is caused by the novel coronavirus (SARS-CoV-2), is one of the most
widespread global pandemics to date. The purpose of this report is to provide Brookline
residents with information about the virus, the recent data and data trends, the effects on the
community, and the Brookline Department of Health’s response. The first section of this report
is an introduction to COVID-19, including transmission, symptoms, risk factors, treatment, and
prevention. The second section assesses the impacts of COVID-19 across global, state, and
town lines, before focusing specifically on the Town of Brookline. The report details actions
taken by the Department of Health to prevent the spread of the disease. Finally, the report
provides specific Town of Brookline data, including trends in cases and deaths.
Brookline was successful in containing the spread of the virus early on during the pandemic and
has one of the lowest rates of the disease in Massachusetts. The sustained implementation and
enforcement of community mitigation measures like face-mask mandates, social distancing and
reducing large gatherings, and active outreach and communication with community members
were key to Brookline’s success. Brookline reported a total of 2,123 cases and 96 deaths by the
end of March 2021. Minority race/ethnicity groups were most affected with the highest rates of
positive cases in Blacks and Hispanics; the highest cumulative death rate was observed in the
Asian population.
The prospects of the COVID-19 disease control in Brookline in 2021 are promising with the
FDA approval of three vaccines and smooth vaccine rollout in Massachusetts. However, it is
imperative that COVID-19 variants continue to be monitored as the pandemic continues.

COVID-19: The Basics
INTRODUCTION
The severe acute respiratory syndrome coronavirus-2 (SARS-CoV-2, which causes the
disease COVID-19) is a new respiratory virus that was first identified in Wuhan, China, in
December 2019. Because this is a novel virus, there was no previous exposure or protective
immunity to stop or slow the transmission of the disease. This allowed for rapid spread around
the world, leading to one of the largest and most widespread global pandemics in modern
times. Since the first cases in December 2019, there have been more than 130 million cases and
2.8 million deaths worldwide as of March 2021.1
SYMPTOMS
COVID-19 spreads from person to person via respiratory droplets that are produced when an
individual coughs, talks, or sneezes.2 The clinical manifestation of COVID-19 ranges from
asymptomatic to severe illness.2 While the combination of symptoms is different across
individuals, the most commonly reported symptoms include:
• Cough
• Fever
• Chills
• Muscle pain
• Shortness of breath or difficulty breathing
• Sore throat
• Headache
• New loss of taste or smell
• Fatigue
• Congestion or runny nose
This list is not exhaustive; in addition to those listed above, there have also been reports of less
common symptoms, including diarrhea and nausea/vomiting.2 On average, symptoms present
2-14 days after exposure, with a median incubation period of 5.1 days. The duration of
symptoms is typically 10-14 days.2

MORTALITY
There is varying data on the mortality associated with COVID-19. However, there are certain
groups that are at high-risk for severe illness and death, including people aged 65 years and
older, people who live in a nursing home, and people of all ages with underlying medical
conditions. Specifically, those with chronic lung disease, serious heart conditions, a
compromised immune state (i.e., cancer, organ transplant, immune deficiencies, and poorly
controlled HIV), diabetes, or chronic kidney disease have been associated with more severe
disease or worse outcomes.3
TREATMENT
The U.S. Food and Drug Administration (FDA) has provided emergency use authorizations to
two potential treatments for COVID-19 cases: Remdesivir, an antiviral drug is approved for
hospitalized COVID-19 cases; and several monoclonal antibody treatments have been approved
for mild/moderate COVID-19 cases that may progress to serious hospitalized COVID-19.3
Current treatment plans for mild cases include mandatory quarantine and acetaminophen
(Tylenol) for symptomatic relief.4
PREVENTION
Prevention of person-to-person transmission has become one of the main focuses of most public
health efforts, which requires individual, community, and state public health actions. Community
mitigation measures can help slow the spread of COVID-19; these measures include wearing

masks, social distancing, reducing the number and size of large gatherings, pausing operation of
businesses where maintaining social distancing is challenging, working from or staying at home,
and implementing certain workplace and educational institution controls. At the individual level,
the measures include maintaining social distance, wearing face masks when in public, washing
hands often, and completing a 14-day quarantine if exposed. The U.S. FDA has given
emergency use authorization for three COVID-19 vaccines, the Pfizer/BioNTech COVID-19
vaccine, the Moderna COVID-19 vaccine, and the Johnson & Johnson’s Janssen COVID-19
vaccine.5

A Timeline of COVID-19 Developments in 20206 Jan 09 WHO announces mysterious coronavirus-related pneumonia in Wuhan, China.
Jan 21 CDC confirms first US coronavirus case in Washington state.
Jan 31 WHO issues global health emergency.
Feb 03 US declares public health emergency.
Mar 11 WHO declares COVID-19 a pandemic.
Mar 13 Trump declares COVID-19 a national emergency.
Mar 19 California issues statewide stay-at-home order.
Mar 27 Trump signs into law the CARES Act, the largest economic recovery package in history,
providing $2 trillion in aid to hospitals, small businesses, and state and local governments.
Apr 28 Young, poor avoid care for COVID-19 symptoms.
May 21 US and AstraZeneca form vaccine deal.
May 28 US COVID-19 deaths pass the 100,000 mark.
Jun 10 US COVID-19 cases reach 2 million.
Jun 22 Study suggests 80% of cases in March went undetected.
Jul 07 US surpasses 3 million infections.
Jul 27 Senate introduces HEALS Act, the second COVID-19 economic stimulus.
Aug 04 Rural hotspots face lack of intensive care unit beds.
Aug 13 Biden calls for 3-month mask mandate.
Aug 17 COVID-19 now the third-leading cause of death in the US.
Aug 28 First known case of COVID-19 reinfection reported in the US.
Oct 02 Trump, First Lady test positive for COVID-19; Trump enters hospital.
Oct 08 White House COVID-19 outbreak grows to 34.
Nov 04 US reports unprecedented 100,000 cases in 1 day.
Dec 11 FDA approves Emergency Use Authorization (EUA) for COVID-19 vaccine from Pfizer,
BioNTech.
Dec 18 FDA approves EUA for Moderna's COVID-19 vaccine.
Dec 21 New more contagious COVID-19 variant circling the UK.
Dec 29 First US case of new more contagious COVID-19 variant found in a Colorado man with no
travel history.
Dec 31 2.8 million people in the US received an initial vaccination, falling short of the goal to give
20 million vaccinations by the end of the year.
The Impact
THE U.S.
The United States became the epicenter of COVID-19 on March 26, 2020 when the number of
cases officially surpassed that of China. As of March 2021, over 30 million Americans have
contracted the disease.1 However, many experts believe the actual number of cases may be higher
due to a widespread shortage of tests during the spring and summer of 2020. COVID-19 reduced
U.S. life expectancy by a year in the first half of 2020, the biggest drop since WWII. Racial
minorities suffered the biggest impact, with Black Americans losing nearly three years and
Hispanics losing nearly two years of their life expectancy.7
COVID-19 placed a profound burden on the U.S. healthcare system. As of December 12, 2020 a
total of 96,444 individuals had been hospitalized for COVID-19, representing a cumulative
hospitalization rate of 295.8 per 100,000 population.8 Within the first few weeks of the pandemic,
many hospitals in New York and other states in New England had reached full capacity. Many
states and cities were forced to undertake substantial measures to accommodate the surge,
including the establishment of field hospitals and drive-through testing tents to alleviate stress on
hospitals.8
The impact on healthcare extends beyond the specific morbidity and mortality of COVID-19. As
hospitals prepared for surges in cases, other services and offices were shut down to prevent
exposure and spread. Emergency departments, primary care offices, and many specialty offices
were closed during the early stages of the pandemic. As a result, many Americans were not able
to access care as needed, and mortality due to other conditions, including but not limited to heart
disease, Alzheimer’s/dementia, and diabetes, also increased.9 While the official death toll in the
U.S. was 328,014 (as of December 27), researchers believe the total death toll from COVID-
related closures and fallout to be much higher.1
Finally, the U.S. economy has greatly suffered as a result of COVID-19. Industries across the
board—notably healthcare, airlines, and hospitality— lost billions in revenue, and the future of
many companies remains unclear. The number of unemployed Americans increased sharply from
February 2020, and peaked in April 2020 when 23.1 million Americans were unemployed, a historic
unemployment rate of 14.4%, reflecting the highest rate in the post-WWII era.11

IN MASSACHUSETTS
Massachusetts (MA) became one of the earliest hotspots for COVID-19 spread. On March 10,
2020, Governor Charlie Baker declared a State of Emergency, and within the first few weeks of
the pandemic, the state had the third highest number of cases in the nation.10 The peak of the first
surge was on April 17th, when 2,977 new cases were recorded. Since then, the number of cases
declined steadily but by October, cases started to increase and peaked on January 4th with 9,047
new cases in one day. As of March 2021, there have been over 598,000 total cases and over
16,000 deaths in the state.12
Amidst the pandemic’s economic shutdown, an estimated one in four MA workers lost their
jobs. By the beginning of May 2020, 780,000 individuals had filed jobless claims for traditional
unemployment benefits. The official unemployment rate in MA was 16.2% in April 2020 and
16.3% in May 2020, the highest rates since 1976. These unemployment rates in MA in April and
May are tied for the fourth- highest in the nation.13 The state’s unemployment rate has since
declined, at 7.4% in December 2020 and 6.8% in March 2021.11
In response to declining COVID-19 cases, Governor Baker released a four-phase plan on May 18,
2020, for reopening the state. The plan included mandatory safety standards for workplaces and
“best practices” recommendations to ensure reopening occurs without leading to a new spike in
cases. The progression through stages was not predetermined and will instead be driven by the
most recent public health data. Key metrics include positive test rate, deaths, hospitalizations,
healthcare system readiness, testing capacity and contact tracing capabilities. The state will move
forward or back in stage as needed. On December 13, MA entered Phase 3, which included the
reopening of gyms, fitness studios, movie theaters, museums and other indoor entertainment
venues.14
So far, three vaccines, the Pfizer-BioNTech COVID-19 vaccine, the Moderna COVID-19 vaccine,
and the Johnson & Johnson’s Janssen COVID-19 vaccine have received emergency use
authorization in the U.S.5 Vaccination of health care workers performing COVID-facing care
began in MA on December 15th, 2020.15 Phase 1 of the state vaccination plan included health care
workers, long term care and assisted living facilities, first responders, and home-based health care
workers.15 Phase 2 of the MA vaccination plan started on February 1, 2021 and began with

individuals 75 years or older before expanding to individuals 65 years and older or individuals
with two or more medical conditions. By the end of March, phase 2 eligibility expanded to also
include K-12 educators, staff and childcare workers, and individuals 60 years and older.15
IN BROOKLINE
Compared to other densely populated towns and cities in MA, Brookline experienced a relatively
low burden of disease. There have been 2,123 positive cases and 96 total deaths as of March
2021 from COVID-19. Given the close proximity to Boston (an epicenter of the disease within
the state), the lower rates could be a reflection of successful social distancing and quarantine
practices by Brookline residents. The subsequent sections will analyze Brookline COVID-19
trends and data more closely.
Brookline also experienced lower rates of unemployment compared to the rest of the state. In
April and May 2020, the unemployment rates were 8.4% and 7.4%, respectively. The town is
reopening in accordance with Governor Baker’s plan, but continues to monitor COVID-19 trends
vigilantly and practice safe social distancing measures.
Since the approval of three vaccines for prevention of COVID-19, Brookline has received limited
doses for distribution. By the end of March, the town of Brookline has received 2,100 doses of
vaccine, with 1,945 doses administered, 954 individuals fully vaccinated, and 150 doses on hand.
These numbers only include vaccinations distributed through the town of Brookline and do not
reflect individuals who were vaccinated elsewhere.
Our Response
The Brookline Department of Public Health firmly believes the most effective approach to
prevention of disease is to act quickly and swiftly. As a result, Brookline was one of the first
towns across the nation to implement contact tracing and mandatory face-coverings in public.
Other components of our response included weekly publications, town hall meetings, and efforts
to limit large gatherings of people. We believe our approach has been fundamental to the
relatively low burden of disease in Brookline.

“Stop the spread. Save a life. WEAR A MASK.”
The Brookline Mitigation Plan, developed by the Health Commissioner, guided the policies and
strategies to stop the spread of the disease. These strategies are described below.
FACE-COVERING
Brookline, on April 17th, 2020, became one of the first townships to implement mandatory
face-coverings.
Masks were freely distributed in highly-trafficked areas.
We invested in town-wide communication of the face-covering mandate via posters,
advertisements, and social media campaigns.
Virtual mask-making events were conducted to encourage use of masks in a social way.
SOCIAL DISTANCING AND REDUCING LARGE GATHERINGS
All public schools were closed effective March 13, 2020 until the end of the academic year.
Popular pedestrian streets were reconfigured to better accommodate social distancing.
Local elections were postponed to avoid the gathering of large populations. Later, the
election occurred as “No-Touch” with extra social distancing precautions.
We continuously updated regulations for food and retail establishments to ensure the highest
level of safety for both employees and patrons, guided by the latest data on transmission from
the CDC and other top agencies.

Seniors-only hours at the grocery stores were implemented to limit exposure among
vulnerable populations.
We implemented an eviction moratorium in April 2020 to ensure members of the Brookline
community could still practice safe social distancing protocols.
OUTREACH AND COMMUNICATION WITH COMMUNITY MEMBERS
Brookline was one of the first townships to begin contact tracing efforts.
An official COVID-19 website was launched on March 17, 2020 to keep residents informed
about recent data, publications, and communications.
Every week, the site was updated with “Need to Know Updates” and data reports for public
viewing.
The COVID-19 Call Center was activated on March 18, 2020 where residents could call with
any questions, comments, or concerns regarding any virus-related topics.
The Call Center was demobilized on June 19, 2020 after a steady decline in cases.
We routinely organized broadcasts and WebEx Town Halls to provide opportunities for the
public to directly interact with officials and health experts. Examples of these meetings
include the Advisory Council Public Health Virtual Town Hall on March 24, 2020, the Youth
Town Hall on April 29, 2020 and the Conversation about COVID-19 WebEx on June 22,
2020.
MENTAL HEALTH
Brookline Police Social Workers held office hours for those in need of support or resources
related to mental health.
Virtual mask-making events were conducted to increase social connectivity.
We implemented an eviction moratorium in April 2020 to relieve stress during a financially
burdensome time.
The Department of Public Health partnered with FriendshipWorks to combat the detrimental
impact of social isolation on mental health, offering residents weekly check-ins through the
“Friendly Caller Program.”

EQUITY AND SOCIAL DETERMINANTS OF HEALTH
Seniors-only hours at the grocery stores were implemented to limit exposure among
vulnerable populations.
We implemented an eviction moratorium in April 2020 to relieve financial burden for
socioeconomically disadvantaged people.
Free and reduced pricing lunches were available to students in qualifying families on
Mondays, Wednesdays, and Fridays.
Free masks were distributed in highly-trafficked areas.
Free pop-up testing sites were organized for any individual who had participated or
been in large gatherings.

A Timeline of Brookline’s Response to COVID-19 in 2020
Mar 13 All public schools closed until April 6.
Mar 16 The Brookline Health Commissioner declares a public health
emergency with Select Board.
Mar 16 Townhall, food establishments, and other town facilities closed.
Mar 17 Brookline’s COVID-19 website launched to keep residents informed.
Mar 18 Brookline’s COVID-19 Call Center with Emergency Management
launched.
Mar 18 Local cable channels live broadcast the Advisory Council on Public
Health meeting.
Mar 23 Grocery stores implement special hours for seniors to shop.
Mar 24 Brookline Public Health hosts a virtual town hall for residents to ask
questions to community experts.
Apr 3 Officials postpone the local election to limit large gatherings.
Apr 7 Officials release enhanced regulations for food establishments.
Apr 9 Officials reconfigure streets to accommodate social distancing by
pedestrians.
Apr 17 The Health Commissioner mandates face masks for all residents >2
years old in all public spaces.
Apr 29 The Virtual Youth Town Hall hosted.
Apr 21 Public school closure extends to the end of the academic year.
May 7 Town distributes free masks in highly trafficked areas.
May 20 The Brookline Police Social Workers begin holding office hours for
those in need of mental-health related support or resources.
Jun 17 Town offers free pop-up testing sites for those who have been in large
gatherings in the wake of city-wide protests and demonstrations.
Jun 19 Officials demobilize the COVID-19 Call Center and Email following a
steady decline in cases.
Jun 22 The Conversation about COVID-19 WebEx hosted.

The Data
HOW BROOKLINE COMPARES TO THE STATE AND THE NATION?
By mid-March 2021, there were over 119 million COVID-19 cases globally and 29 million cases in the
United States, of which, approximately 576,000 were in the state of Massachusetts (Table 1). A total of
1,983 COVID-19 cases and 96 deaths were reported to the Brookline Health Department by March 12,
2021 (Table 1). When compared to national and state trends, the cumulative COVID-19 rate in Brookline
is among the lowest in Massachusetts and much lower than the national cumulative case rate (Figure 1).
Likewise, the per day new case rate per 100,000 individuals was consistently lower in Brookline than in
either the state or the country (Figure 2). Across many demographic trends, including age and gender, data
from Brookline closely mirrors national trends.

04/17/20 04/24/20 05/06/20 05/20/20 05/27/20 06/05/20 10/05/20 03/12/21
Global
Confirmed cases
2.2M 2.7M 3.7M 4.9M 5.7M 6.6M 35.5M 119.5M
Deaths 151K 187K 258K 324K 353K 391K 1.4M 2.6M
U.S.
Confirmed cases 690K 906K
1.2M
1.6M 1.7M 1.9M 7.7M 29.3M
Deaths 36K 51K
73K 92K 101K 110K 210K 531K
MA
Confirmed cases 32K 46K 70K 88K 94K 102K 135K 576K
Deaths 1K
2K 4K 6K 6K 7K 10K 17K
Brookline Confirmed cases
177 237 311 341 350 368 505 1,983
Deaths 4 18 33 38 44 44 64 96
Table 1: COVID-19 confirmed cases and deaths on the global, national, state, and local scale at select time
points between April 2020 and March 2021.

Figure 1: COVID-19 Cumulative Case Rates on the local, state and national levels. Data from
March 2020 through March 2021.
0
1,000
2,000
3,000
4,000
5,000
6,000
7,000
8,000
9,000
10,0001
9-M
ar2
9-M
ar8
-Ap
r1
8-A
pr
28
-Ap
r8
-May
18
-May
28
-May
7-J
un
17
-Ju
n2
7-J
un
7-J
ul
17
-Ju
l2
7-J
ul
6-A
ug
16
-Au
g2
6-A
ug
5-S
ep
15
-Se
p2
5-S
ep
5-O
ct1
5-O
ct2
5-O
ct4
-No
v1
4-N
ov
24
-No
v4
-Dec
14
-De
c2
4-D
ec
3-J
an1
3-J
an2
3-J
an2
-Fe
b1
2-F
eb
22
-Fe
b4
-Mar
14
-Mar
Cu
mu
lati
ve C
ase
s p
er
10
0,0
00
Re
sid
en
ts
COVID-19 Cumulative Case Rates
National
Mass
Brookline

Figure 2. New COVID-19 cases per day per 100,000 residents across the country (blue), state
(red), and in Brookline (green).

DETAILED DATA ON CASES AND DEATHS IN BROOKLINE
Total Cases in Brookline
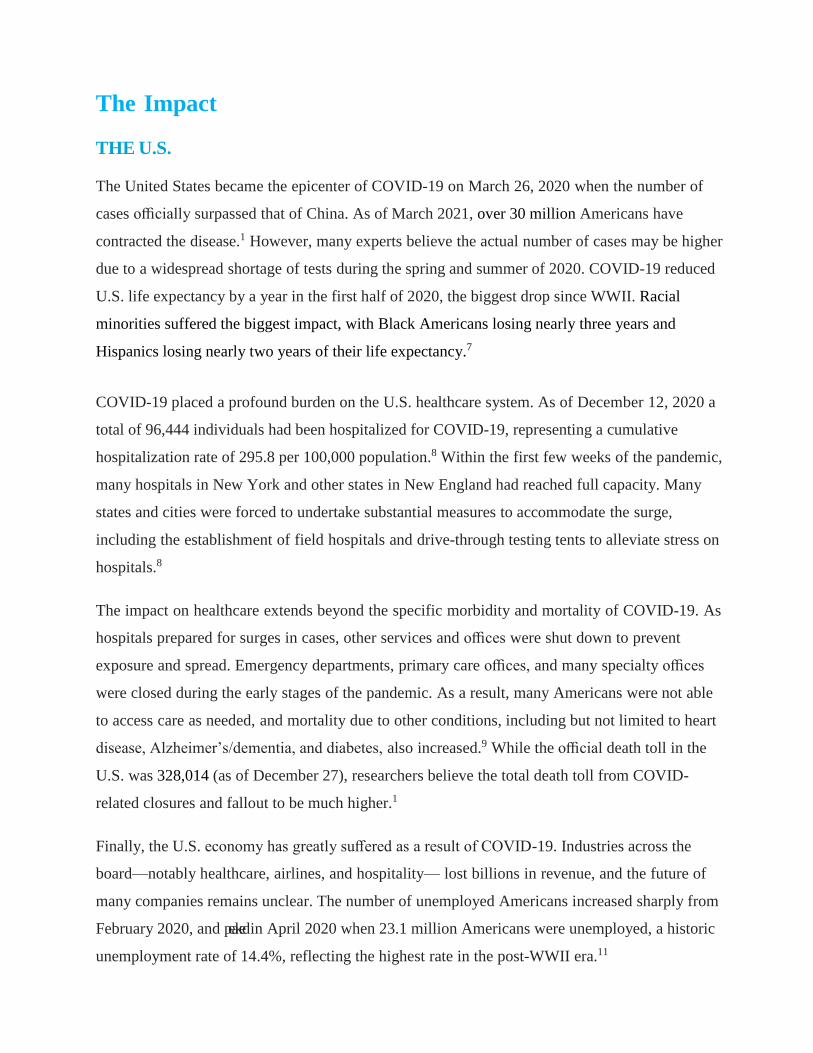
A total of 1,983 COVID-19 confirmed cases and 96 deaths were reported to the Brookline Health Department by March 2021 (Table 2).
In addition to the confirmed cases, there have been at least 198 probable cases and 43 suspected cases (Table 2). Since the beginning of the
outbreak in Brookline, over 1,500 people completed their required quarantine period (Table 2). In the past year, COVID-19 cases in
Massachusetts and Brookline peaked in April 2020 and again in December 2020/January 2021. The first peak coincided with the
introduction of COVID-19 into the state while the second peak coincided with decreasing temperatures resulting in more indoor
socializations and increased travel and socialization for the holiday season. These two peaks are reflected in the steeper slopes of Figure 3,
and the higher case counts per month in Figure 3.

4/17/20 4/24/20 5/6/20 5/20/20 5/27/20 6/5/20 7/21/20 8/10/20 8/24/20 10/5/20 11/16/20 12/8/20 1/19/21 2/9/21 2/23/21 03/9/21
Positive cases 177 237 311 341 350 368 404 425 440 505 670 1,027 1,658 1,801 1,868 1,953
Probable cases - - - - - - 100 114 122 122 - 135 168 175 188 195
Quarantined individuals 228 235 272 292 300 312 354 373 380 - 629 950 1,267 1,391 1,476 1,551
Individuals released
from quarantine
131 143 171 224 246 256 284 295 305 333 431 530 667 705 705 790
Individuals released
from isolation
78 92 123 185 206 228 280 296 318 355 435 590 961 1,080 1,114 1,181
Total of Suspect Cases
26 31 40 79 87 88 - - - - 88 - - - - -
Deaths 4 18 33 38 44 44 57 59 60 64 68 74 90 93 95 96
Table 2. Brookline COVID-19 Status Report. Data from April 2020 through March 2021. (- data unavailable) This table provides a
snapshot of cumulative counts for each metric at selected time point throughout the year.
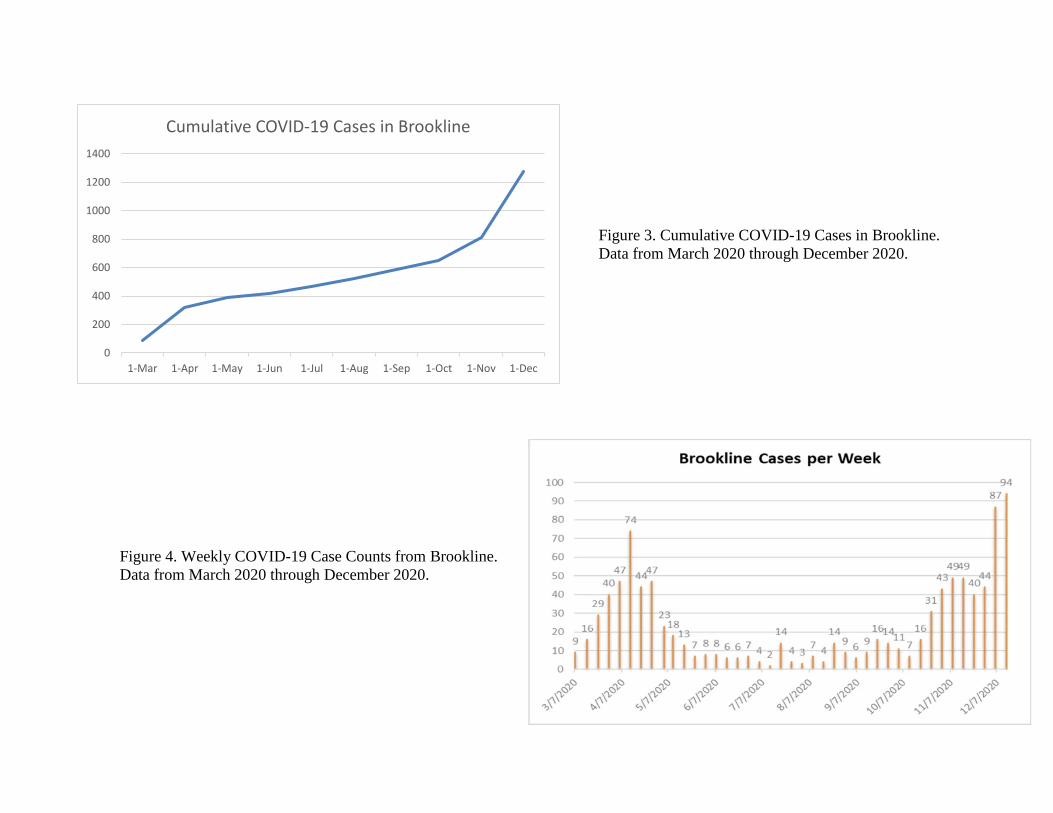
Figure 3. Cumulative COVID-19 Cases in Brookline.
Data from March 2020 through December 2020.
Figure 4. Weekly COVID-19 Case Counts from Brookline.
Data from March 2020 through December 2020.
0
200
400
600
800
1000
1200
1400
1-Mar 1-Apr 1-May 1-Jun 1-Jul 1-Aug 1-Sep 1-Oct 1-Nov 1-Dec
Cumulative COVID-19 Cases in Brookline

As cases increased in the spring of 2020, the Brookline Health Department worked diligently to contact cases and identify individuals who
were exposed to the virus. Early notification allowed for these individuals to begin a quarantine periods of two weeks to help slow the
spread of the virus. Throughout the first three months, the number of individuals in quarantine was often equal to or greater than the
number of COVID-19 cases (Figure 5).
Figure 5. COVID-19 Quarantine and Case Numbers. Data from March 2020-May 2020.
0
100
200
300
400
500
600
700
11
-Mar
13
-Mar
15
-Mar
17
-Mar
19
-Mar
21
-Mar
23
-Mar
25
-Mar
27
-Mar
29
-Mar
31
-Mar
2-A
pr
4-A
pr
6-A
pr
8-A
pr
10
-Ap
r
12
-Ap
r
14
-Ap
r
16
-Ap
r
18
-Ap
r
20
-Ap
r
22
-Ap
r
24
-Ap
r
26
-Ap
r
28
-Ap
r
30
-Ap
r
2-M
ay
4-M
ay
6-M
ay
11-Mar 20-Mar 27-Mar 3-Apr 10-Apr 13-Apr 21-Apr 24-Apr 25-Apr 1-May 4-May 6-May
Quarantine 0 30 83 151 175 188 216 230 260 262 262 272
Cases 2 11 27 57 105 119 218 228 264 276 305 311
COVID-19 Quarantine and Case Numbers

COVID-19 Cases by Social Determinants of Health
COVID-19 Cases by Age
Across the country and the world, COVID-19 has affected different age groups in different ways.
Nationally, the death rates among older populations are reliably higher even while the most
number of cases are occurring among younger Americans.16 These trends remain true in
Brookline as well. Among Brookline residents, the age group with the largest number of COVID-
19 cases was 20-29-year-olds (Figure 6). Likewise, the trend continues on a per month basis – in
every month except for April 2020, the 20-39 age group had the highest proportion of cases
ranging from 33% to 65% of cases for any given month (Figure 7).
Figure 6: COVID-19 Cases in Brookline by Age. Data from March 2020 through March 2021.
0
100
200
300
400
500
600
Brookline COVID-19 Cases by Age

Figure 7: COVID-19 Cases in Brookline by Age over Time. Bars are colored proportionally to
the number of cases from each age group per month. Data from March 2020 - December 2020.
COVID-19 Cases by Gender
Since the start of the outbreak in Boston, of cases with known gender, more cases have been
detected in women, 54%, than in men, 46% (Figure 8). These estimates align with 2019 census
population trends in Brookline, which estimates that 53% of the population of Brookline is
female, suggesting that there is no difference in the rate at which men and women become
diagnosed with COVID-19.17 These trends match those observed at the national level; across the
U.S., 52% of cases have been diagnosed in women while 48% were in men.16
Figure 8: COVID-19 Cases in Brookline by Gender. Data from March 2020-2021.
0
20
40
60
80
100
120
140
160
180
03/20 04/20 05/20 06/20 07/20 08/20 09/20 10/20 11/20 12/20
COVID-19 Cases per Month by Age
0-19 20-39 40-59 60-79 80+
53%47%
COVID-19 Cases by Gender
Female Male

Figure 9: COVID-19 Cases in Brookline by Month and Gender. Data from March 2020 –
December 2020.
COVID-19 Cases by Age and Gender
Separating Brookline COVID-19 cases by age and gender demonstrates similar results. The
age/gender group with the highest number of cases was females 20-30 years old – 178 cases,
followed by males of the same age range – 128 cases (Figure 10).
Figure 10: Brookline COVID-19 cases by age and gender. Data from March 2020 – December
2020.
0
50
100
150
200
250
300
03/20 04/20 05/20 06/20 07/20 08/20 09/20 10/20 11/20 12/20
COVID-19 Cases per Month by Gender
Female Male
0
20
40
60
80
100
120
140
160
180
200
0-9 10-19 20-29 30-39 40-49 50-59 60-69 70-79 80-89 90-99 100+
Cases by Age and Gender
Female Male

COVID-19 Cases by Race and Ethnicity
Of Brookline cases with known race/ethnicity data, 64% were White, 14% Other Race/Ethnicity,
10% Asian, 8% Latinx/Hispanic, and 4% were Black/African American (Figure 11). When
adjusted by the race/ethnicity proportions that comprise the population of Brookline, Other
Race/Ethnicity and Black/African American had the highest cumulative rates of 12,104 and 5,090
per 100,000 residents, respectively from March 2020 to March 2021 (Figure 11, right, Table 3).
Asian and White had the lowest cumulative rates of 2,075 and 3,090 per 100,000 residents (Table
3).
Figure 11: Unadjusted (left) and adjusted (right) COVID-19 cases by Data from March 2020 –
March 2021.
Races Cases Population
Brookline Cum.
Rate per 100,000
MA Cum. Rate per
100,00010
White 1,274 41,217 3,090 4,891
Black 87 1,709 5,090 7,464
Asian 195 9,397 2,075 3,635
Hispanic 163 4,604 3,540 15,789
Other 279 2,305 12,104 --
Table 3: COVID-19 Annual cumulative rates per 100,000 people by race/ethnicity in Brookline
and MA. Data for one year from March 2020-2021.
64%4%
10%
8%
14%
COVID-19 Cases by Race/Ethnicity
White Black Asian Hispanic Other
12%
20%
8%
14%
47%
Adjusted Covid-19 Cases by Race/Ethnicity
White Black Asian Hispanic Other

COVID-19 Cases by Housing Status
The majority of Brookline residents who were diagnosed with COVID-19 were stably housed -
86.9%. The remaining cases with known housing status were split between long term care
facilities - 11.3%, Other unspecified - 1.4%, and treatment recovery center(s) - 0.4% (Table 4).
Housing Status Cases
Stably Housed 617
Long term Care Facility 80
Other 10
Treatment Recovery Center 3
Total: Known Housing Status 710
Table 4: Brookline COVID-19 Cases by Housing Status. Data from March 2020-2021.
Total Deaths in Brookline
Brookline reported a total of 96 deaths from COVID-19 by the end of March 2021. COVID-
related deaths peaked in April 2020, with 30 deaths, and then declined steeply (Figure 12).
Although there was a second peak of COVID-19 cases in December 2020-January 2021, fewer
deaths were observed during that peak compared to the first wave in April 2020. Almost all the
deaths were among the elderly population (>65 years). Both the counts and adjusted counts (i.e.,
the number of deaths adjusted for their proportion in the corresponding population by age) show
an increasing number of deaths with increasing age. Of the 96 deaths, 63 were aged 80 years and
over (Figure 13). The highest absolute number of deaths were among White people. However,
when the numbers were adjusted by proportion in the corresponding population by race, Asian
people had the highest death rate (Figure 14).

Figure 12: Deaths from COVID-19 in Brookline. Data from February 2020 through December
2020.
COVID-19 Deaths Segregated by Determinants of Health
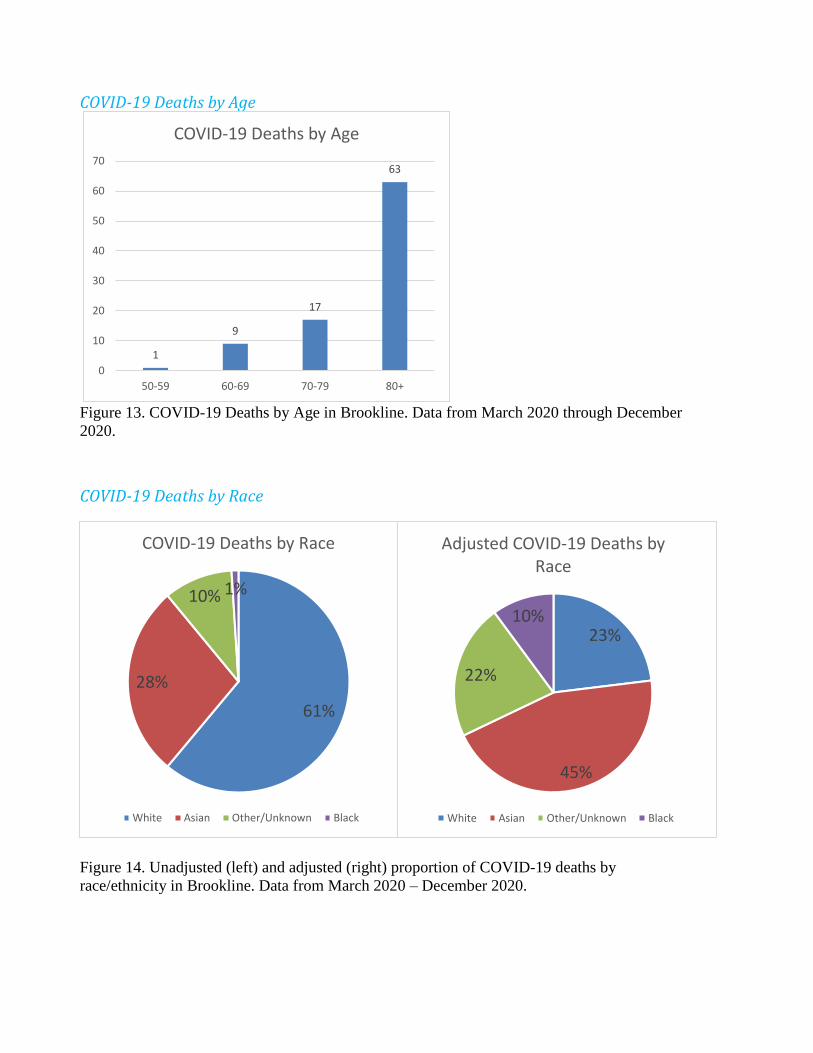
The greatest number of deaths among confirmed COVID-19 cases occurred in the age group 80+,
representing 70% of the deaths from COVID-19 (Figure 13). 19% of deaths occurred in the 70-79
age group and 10% occurred in the 60-69 age group, with only 1% of deaths in the 50-59 age
group (Figure 13). The trends observed here match the national trends observed, older
populations have a much higher rate of death from COVID-19 compared to younger
populations.16
When examining COVID-19 deaths by race/ethnicity, White had the highest proportion of deaths
at 61%, but when weighted by proportion of the race/ethnicity in the Brookline population, had
only the second highest at 23% (Figure 14). The Asian population had the highest proportion of
deaths by race/ethnicity when weighted by population (Figure 14). When comparing the
unadjusted and adjusted pie charts, an increase in the size of the slice indicates that a population
group had disproportionately higher rates of death compared to a section that decreased in size
(Figure 14).
01
30
16
8
3 42 2
6 6
0
5
10
15
20
25
30
35
Feb Mar Apr May Jun Jul Aug Sep Oct Nov Dec
COVID-19 Deaths by Age
Figure 13. COVID-19 Deaths by Age in Brookline. Data from March 2020 through December
2020.
COVID-19 Deaths by Race
Figure 14. Unadjusted (left) and adjusted (right) proportion of COVID-19 deaths by
race/ethnicity in Brookline. Data from March 2020 – December 2020.
1
9
17
63
0
10
20
30
40
50
60
70
50-59 60-69 70-79 80+
COVID-19 Deaths by Age
23%
45%
22%
10%
Adjusted COVID-19 Deaths by Race
White Asian Other/Unknown Black
61%
28%
10% 1%
COVID-19 Deaths by Race
White Asian Other/Unknown Black

Location of COVID-19 Deaths
The highest density of deaths was located in the intersection of census tracts 4005 and 4008, as
shown by the heat map in Figure 15. The number of deaths were highest in the census tract 4008
followed by eight census tracts to the south -- 4011, 5.02, 3736, 4012, 1201.05, 3739, 1301 and
1106.01 (Figure 16, left). When the number of deaths were adjusted by rates per 10,000
population, census tract 4008 still had the highest death rate, followed by two census tracts, 4011
and 5.02 (Figure 16, right).
Figure 15: Heat map of COVID-19 deaths in Brookline. Data from March 2020 through
December 2020.

Figure 16: Number (Left) and 10-month rate per 10,000 people (right) of COVID-19 Deaths in Brookline Census Tracts. Data from March
through December 2020.

References
1. WHO. WHO Coronavirus (COVID-19) Dashboard. Accessed May 2, 2021. https://covid19.who.int
2. CDC. Coronavirus Disease 2019 (COVID-19) – Symptoms. Centers for Disease Control and Prevention.
Published February 22, 2021. Accessed May 2, 2021. https://www.cdc.gov/coronavirus/2019-
ncov/symptoms-testing/symptoms.html
3. FDA. Know Your Treatment Options for COVID-19. FDA. Published online March 15, 2021. Accessed
May 2, 2021. https://www.fda.gov/consumers/consumer-updates/know-your-treatment-options-covid-19
4. CDC. COVID-19 and Your Health. Centers for Disease Control and Prevention. Published February 11,
2020. Accessed May 2, 2021. https://www.cdc.gov/coronavirus/2019-ncov/if-you-are-sick/steps-when-
sick.html
5. CDC. Different COVID-19 Vaccines. Centers for Disease Control and Prevention. Published April 23,
2021. Accessed May 2, 2021. https://www.cdc.gov/coronavirus/2019-ncov/vaccines/different-
vaccines.html
6. AJMC. A Timeline of COVID-19 Developments in 2020. Published online January 1, 2021. Retrieved
March 19, 2021. https://www.ajmc.com/view/a-timeline-of-covid19-developments-in-2020
7. Suliman A. Covid-19 cuts U.S. life expectancy by a year in first half of 2020, biggest drop since WWII.
Accessed May 2, 2021. https://www.nbcnews.com/news/us-news/covid-19-cuts-u-s-life-expectancy-
year-first-half-n1258219
8. CDC. COVID View - December 12, 2020. Accessed May 2, 2021.
https://www.cdc.gov/coronavirus/2019-ncov/covid-data/pdf/covidview-12-18-2020.pdf
9. Woolf SH, Chapman DA, Sabo RT, Zimmerman EB. Excess Deaths From COVID-19 and Other Causes
in the US, March 1, 2020, to January 2, 2021. JAMA. Published online April 2, 2021.
doi:10.1001/jama.2021.5199
10. The Wall Street Journal. Massachusetts Ranks Third Among States with Most Coronavirus Cases 2020.
Published online April 18, 2020. Accessed March 19, 2021.
https://www.wsj.com/articles/massachusetts-ranks-third-among-states-with-most-coronavirus-cases-
11587211201
11. Falk G, Carter JA, Nicchitta IA, Nyhof EC, Romero PD. Unemployment Rates During the COVID-19
Pandemic: In Brief. :16.
12. Mass.gov. COVID-19 Response Reporting. Accessed May 2, 2021. https://www.mass.gov/info-
details/covid-19-response-reporting
13. Chris L. Mass. Unemployment Rate Tied for 4th-Highest in US. Published June 20, 2020. Accessed May
2, 2021. https://www.nbcboston.com/news/local/mass-unemployment-rate-tied-for-4th-highest-in-
us/2146503/
14. Mass.gov. Baker-Polito Administration Announces Statewide Rollback to Phase Three, Step One,
Additional Restrictions Effective December 13th. Accessed May 2, 2021.
https://www.mass.gov/news/baker-polito-administration-announces-statewide-rollback-to-phase-three-
step-one-additional
15. Mass.gov. Massachusetts’ COVID-19 vaccination phases. Accessed May 2, 2021.
https://www.mass.gov/info-details/massachusetts-covid-19-vaccination-phases
16. CDC. COVID Data Tracker. Centers for Disease Control and Prevention. Published March 28, 2020.
Accessed May 2, 2021. https://covid.cdc.gov/covid-data-tracker
17. U.S. Census Bureau QuickFacts: Brookline CDP, Massachusetts. Accessed May 2, 2021.
https://www.census.gov/quickfacts/fact/table/brooklinecdpmassachusetts/SEX255219#SEX255219