brookfield renewable partners (bep) - brookfield …/media/files/b/brookfield...brookfield renewable...
TRANSCRIPT
Brookfield Renewable A Leader in Renewable Power Generation
Brookfield Renewable Partners (BEP)
September 2016
Corporate Profile
2 2 CAUTIONARY STATEMENT REGARDING FORWARD-LOOKING STATEMENTS
This presentation contains forward-looking statements and information within the meaning of Canadian provincial securities laws and “forward-looking statements” within the meaning of Section 27A of the U.S. Securities Act of 1933, as amended, Section 21E of the U.S. Securities Exchange Act of 1934, as amended, “safe harbor” provisions of the United States Private Securities Litigation Reform Act of 1995 and in any applicable Canadian securities regulations. The words “will”, “should”, “could”, “potential”, “tend to”, “target” “future”, “growth”, “expect”, “believe”, “goal”, “plan”, derivatives thereof and other expressions which are predictions of or indicate future events, trends or prospects and which do not relate to historical matters identify the above mentioned and other forward-looking statements. Forward-looking statements in this presentation include statements regarding the quality of Brookfield Renewable’s business, the expectation for future cash flows and distribution growth, the availability of acquisition opportunities, liquidity, and the timing and completion of current acquisitions and development projects. Although Brookfield Renewable believes that these forward-looking statements and information are based upon reasonable assumptions and expectations, the reader should not place undue reliance on them, or any other forward looking statements or information in this presentation. The future performance and prospects of Brookfield Renewable are subject to a number of known and unknown risks and uncertainties. Factors that could cause actual results of Brookfield Renewable to differ materially from those contemplated or implied by the statements in this presentation include economic conditions in the jurisdictions in which we operate; our ability to sell products and services under contract or into merchant energy markets; weather conditions and other factors which may impact generation levels at our facilities; changes to government regulations, including incentives for renewable energy; our ability to grow within our current markets or expand into new markets; our ability to complete development and capital projects on time and on budget; our inability to finance our operations or fund future acquisitions due to the status of the capital markets; the ability to effectively source, complete and integrate new acquisitions and to realize the benefits of such acquisitions; health, safety, security or environmental incidents; regulatory risks relating to the power markets in which we operate, including relating to the regulation of our assets, licensing and litigation; risks relating to our internal control environment; we do not have control over all of our operations; contract counterparties not fulfilling their obligations; and other risks associated with the construction, development and operation of power generating facilities.
We caution that the foregoing list of important factors that may affect future results is not exhaustive. The forward-looking statements represent our views as of the date of this presentation and should not be relied upon as representing our views as of any date subsequent to the date of this presentation. While we anticipate that subsequent events and developments may cause our views to change, we disclaim any obligation to update the forward-looking statements, other than as required by applicable law. For further information on these known and unknown risks, please see “Risk Factors” included in our Form 20-F.
CAUTIONARY STATEMENT REGARDING USE OF NON-IFRS MEASURES
This presentation contains references to Adjusted EBITDA, Funds From Operations and Adjusted Funds From Operations, which are not generally accepted accounting measures under IFRS and therefore may differ from definitions of Adjusted EBITDA, Funds From Operations and Adjusted Funds From Operations used by other entities. We believe that Adjusted EBITDA, Funds From Operations and Adjusted Funds From Operations are useful supplemental measures that may assist investors in assessing the financial performance and the cash anticipated to be generated by our operating portfolio. Neither Adjusted EBITDA, Funds From Operations nor Adjusted Funds From Operations per LP Unit should be considered as the sole measure of our performance and should not be considered in isolation from, or as a substitute for, analysis of our financial statements prepared in accordance with IFRS.
References to Brookfield Renewable are to Brookfield Renewable Partners L.P. together with its subsidiary and operating entities unless the context reflects otherwise.
All amounts are in U.S. dollars and presented on a consolidated basis unless otherwise specified.
Calderwood, Tennessee, United States
Who We Are
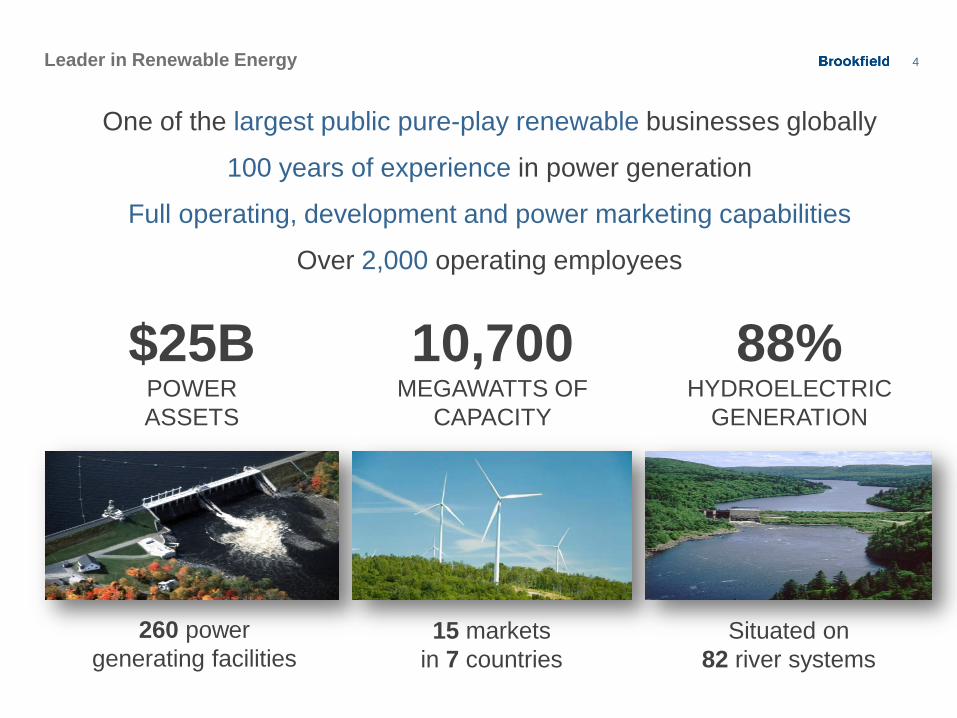
4 Leader in Renewable Energy
One of the largest public pure-play renewable businesses globally
100 years of experience in power generation
Full operating, development and power marketing capabilities
Over 2,000 operating employees
10,700 MEGAWATTS OF
CAPACITY
88% HYDROELECTRIC
GENERATION
260 power generating facilities
15 markets in 7 countries
Situated on 82 river systems
$25B POWER ASSETS
5
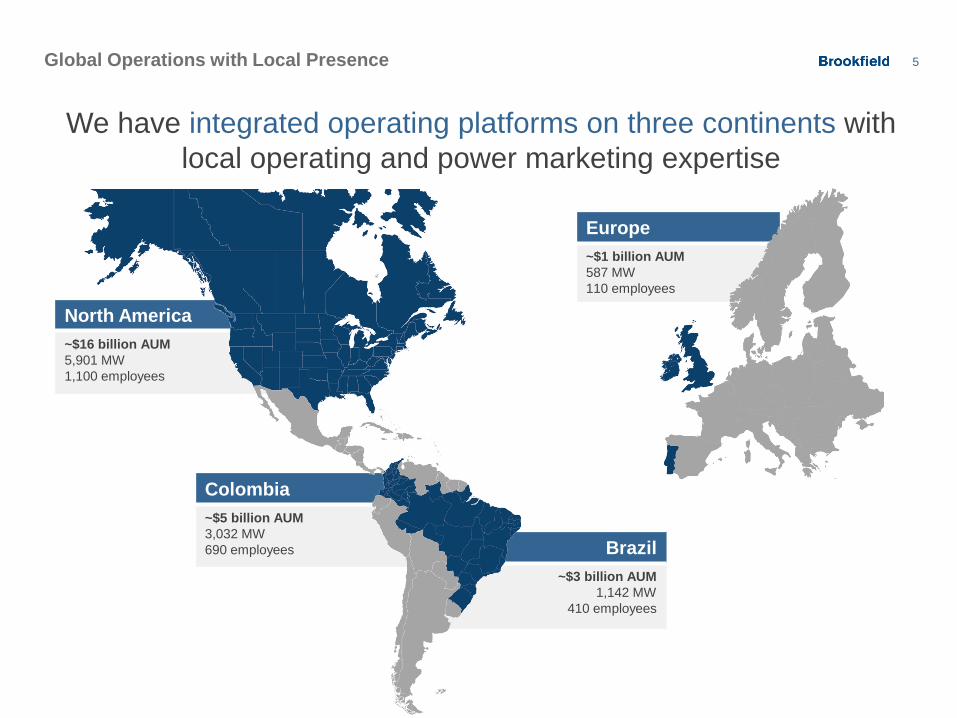
Colombia ~$5 billion AUM 3,032 MW 690 employees
Global Operations with Local Presence
We have integrated operating platforms on three continents with local operating and power marketing expertise
Europe ~$1 billion AUM 587 MW 110 employees
North America ~$16 billion AUM 5,901 MW 1,100 employees
Brazil ~$3 billion AUM
1,142 MW 410 employees
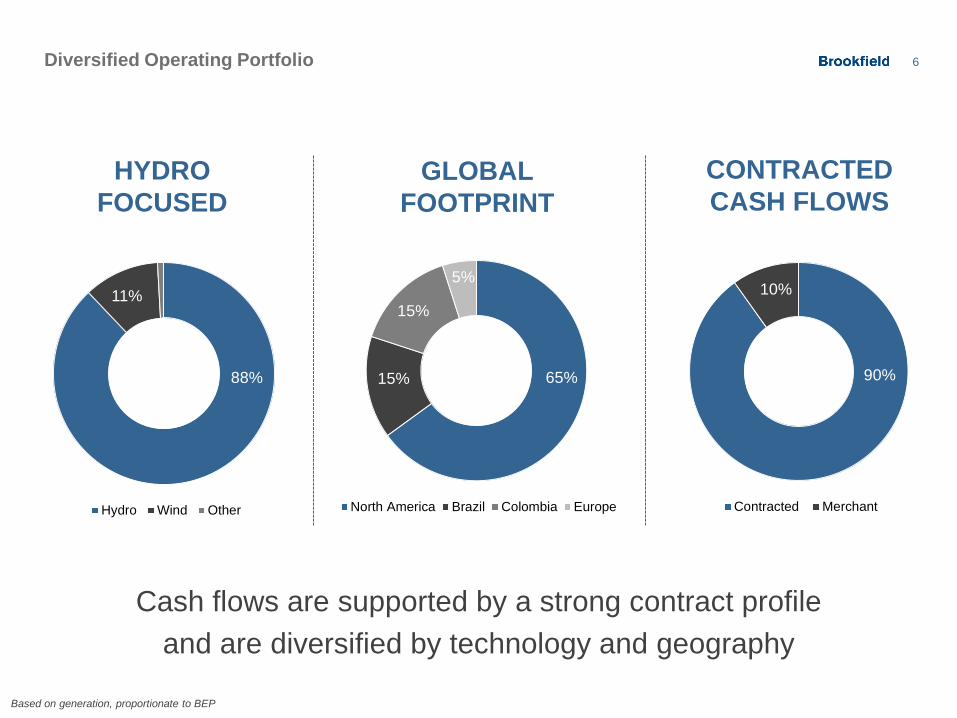
6 Diversified Operating Portfolio
Hydro Wind Other
11%
North America Brazil Colombia Europe
65%
5%
15%
15%
Contracted Merchant
90%
10%
88%
HYDRO FOCUSED
GLOBAL FOOTPRINT
CONTRACTED CASH FLOWS
Cash flows are supported by a strong contract profile and are diversified by technology and geography
Based on generation, proportionate to BEP
7
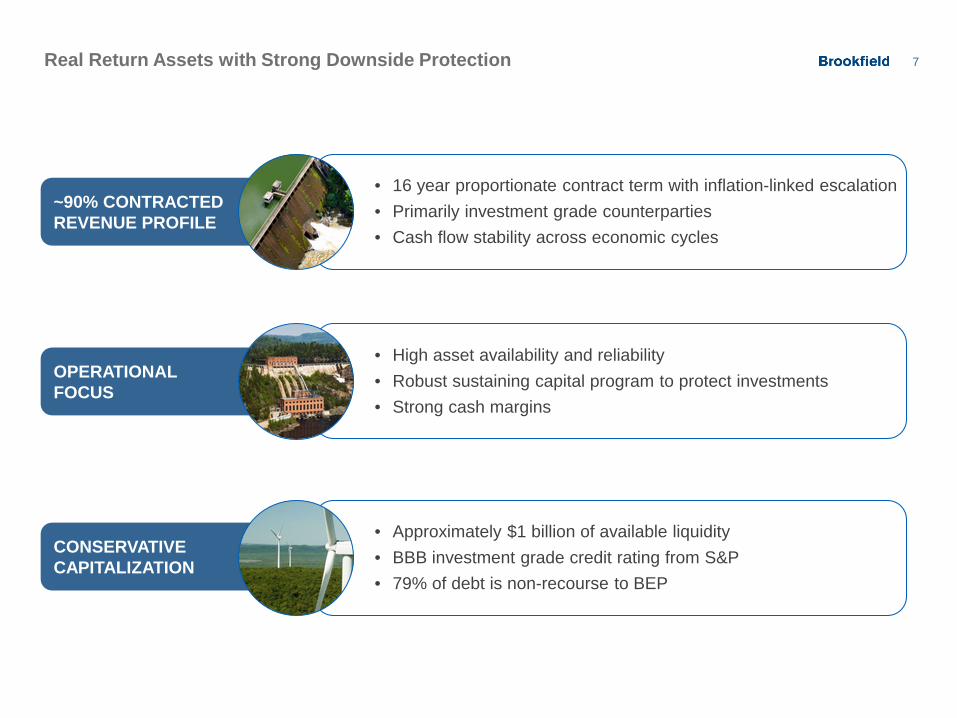
OPERATIONAL FOCUS
~90% CONTRACTED REVENUE PROFILE
Real Return Assets with Strong Downside Protection
CONSERVATIVE CAPITALIZATION
• High asset availability and reliability • Robust sustaining capital program to protect investments • Strong cash margins
• Approximately $1 billion of available liquidity • BBB investment grade credit rating from S&P • 79% of debt is non-recourse to BEP
• 16 year proportionate contract term with inflation-linked escalation • Primarily investment grade counterparties • Cash flow stability across economic cycles
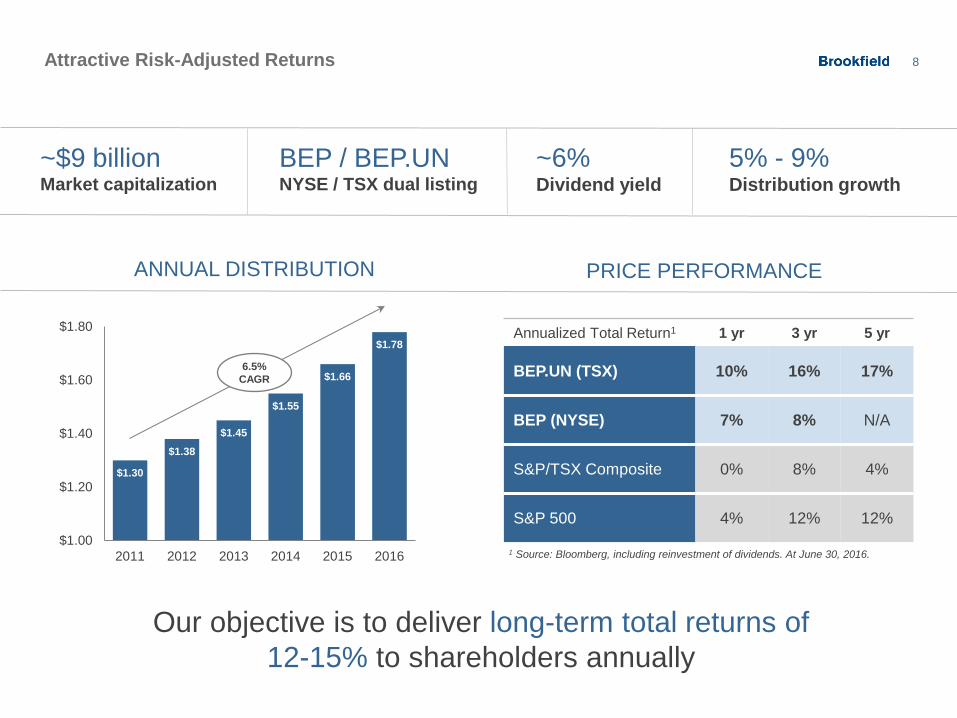
8 Attractive Risk-Adjusted Returns
BEP / BEP.UN NYSE / TSX dual listing
~6% Dividend yield
Annualized Total Return1 1 yr 3 yr 5 yr
BEP.UN (TSX) 10% 16% 17%
BEP (NYSE) 7% 8% N/A
S&P/TSX Composite 0% 8% 4%
S&P 500 4% 12% 12%
1 Source: Bloomberg, including reinvestment of dividends. At June 30, 2016.
5% - 9% Distribution growth
~$9 billion Market capitalization
$1.30
$1.38
$1.45
$1.55
$1.66
$1.78
$1.00
$1.20
$1.40
$1.60
$1.80
2011 2012 2013 2014 2015 2016
ANNUAL DISTRIBUTION PRICE PERFORMANCE
6.5% CAGR
Our objective is to deliver long-term total returns of 12-15% to shareholders annually
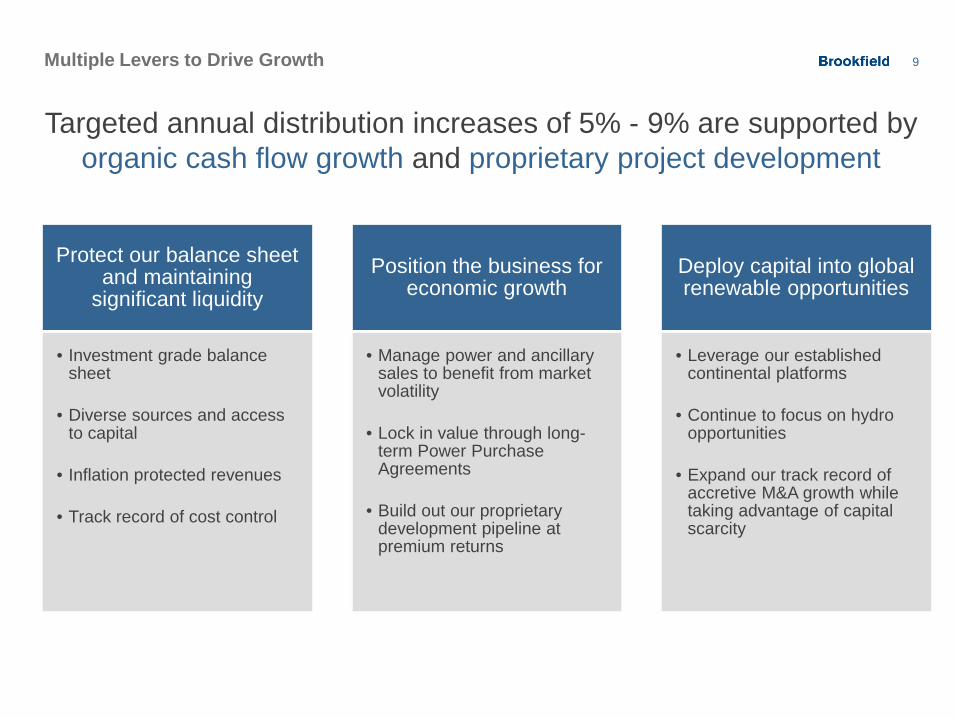
9 Multiple Levers to Drive Growth
Targeted annual distribution increases of 5% - 9% are supported by organic cash flow growth and proprietary project development
Protect our balance sheet and maintaining
significant liquidity
• Investment grade balance sheet
• Diverse sources and access to capital
• Inflation protected revenues
• Track record of cost control
Position the business for economic growth
• Manage power and ancillary sales to benefit from market volatility
• Lock in value through long-term Power Purchase Agreements
• Build out our proprietary development pipeline at premium returns
Deploy capital into global renewable opportunities
• Leverage our established continental platforms
• Continue to focus on hydro opportunities
• Expand our track record of accretive M&A growth while taking advantage of capital scarcity
10
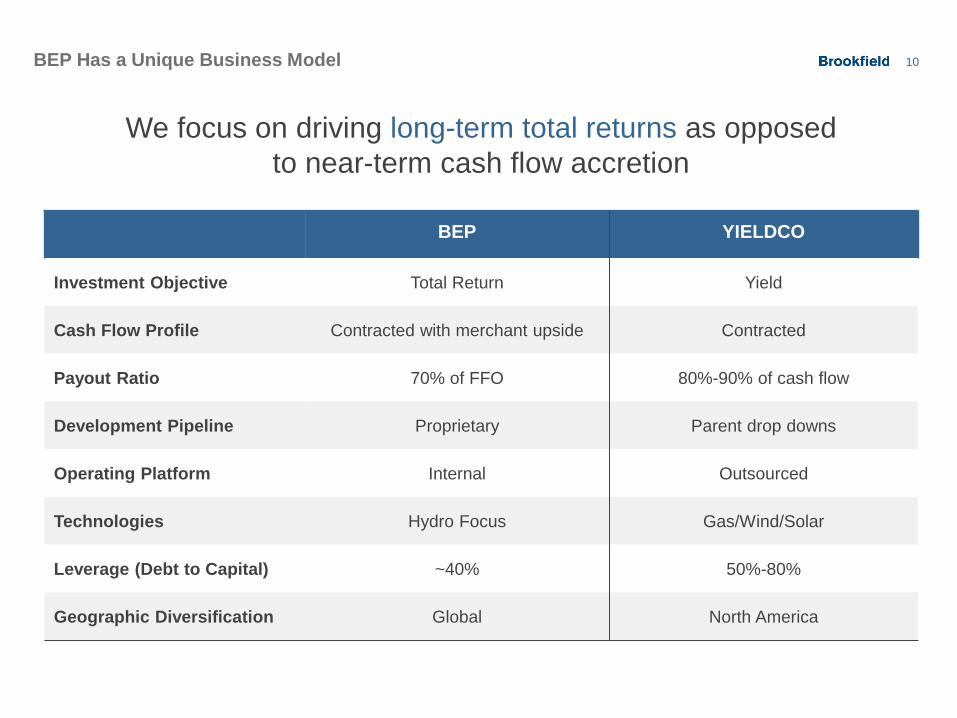
BEP YIELDCO
Investment Objective Total Return Yield
Cash Flow Profile Contracted with merchant upside Contracted
Payout Ratio 70% of FFO 80%-90% of cash flow
Development Pipeline Proprietary Parent drop downs
Operating Platform Internal Outsourced
Technologies Hydro Focus Gas/Wind/Solar
Leverage (Debt to Capital) ~40% 50%-80%
Geographic Diversification Global North America
BEP Has a Unique Business Model
We focus on driving long-term total returns as opposed to near-term cash flow accretion
High Falls Hydro Facility, Quebec, Canada
High Quality Assets
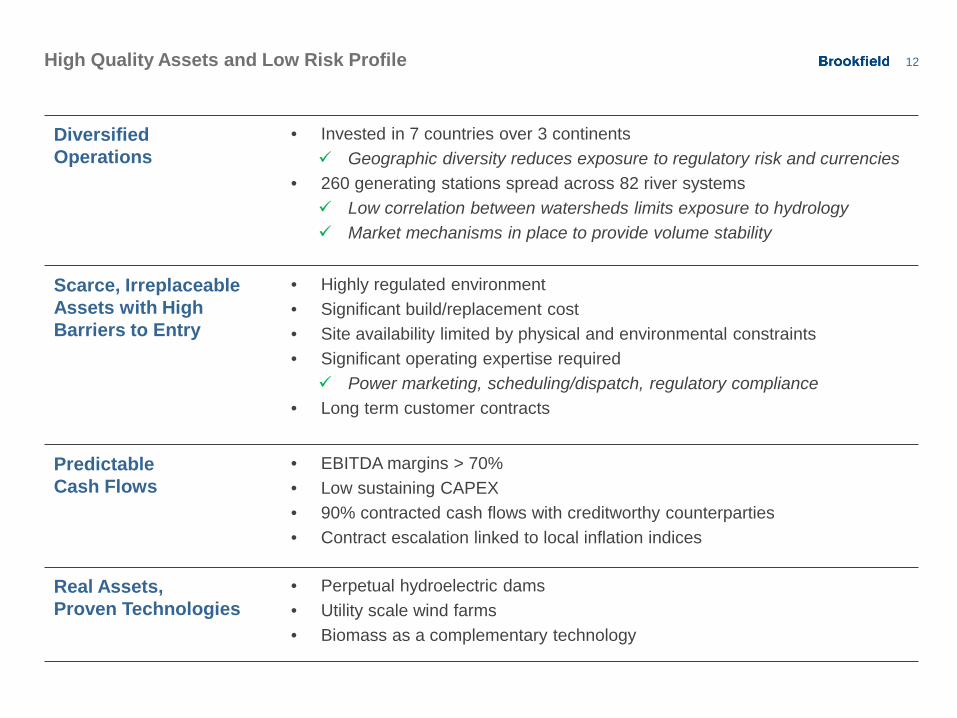
12 High Quality Assets and Low Risk Profile
Diversified Operations
• Invested in 7 countries over 3 continents Geographic diversity reduces exposure to regulatory risk and currencies
• 260 generating stations spread across 82 river systems Low correlation between watersheds limits exposure to hydrology Market mechanisms in place to provide volume stability
Scarce, Irreplaceable Assets with High Barriers to Entry
• Highly regulated environment • Significant build/replacement cost • Site availability limited by physical and environmental constraints • Significant operating expertise required Power marketing, scheduling/dispatch, regulatory compliance
• Long term customer contracts
Predictable Cash Flows
• EBITDA margins > 70% • Low sustaining CAPEX • 90% contracted cash flows with creditworthy counterparties • Contract escalation linked to local inflation indices
Real Assets, Proven Technologies
• Perpetual hydroelectric dams • Utility scale wind farms • Biomass as a complementary technology
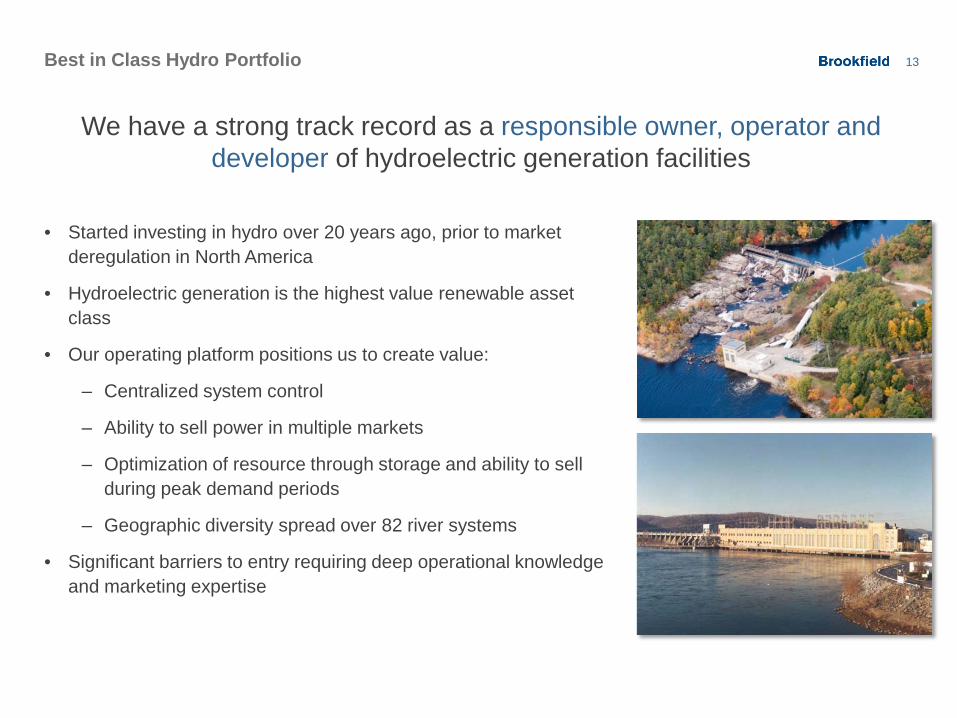
13 Best in Class Hydro Portfolio
• Started investing in hydro over 20 years ago, prior to market deregulation in North America
• Hydroelectric generation is the highest value renewable asset class
• Our operating platform positions us to create value:
‒ Centralized system control
‒ Ability to sell power in multiple markets
‒ Optimization of resource through storage and ability to sell during peak demand periods
‒ Geographic diversity spread over 82 river systems
• Significant barriers to entry requiring deep operational knowledge and marketing expertise
We have a strong track record as a responsible owner, operator and developer of hydroelectric generation facilities
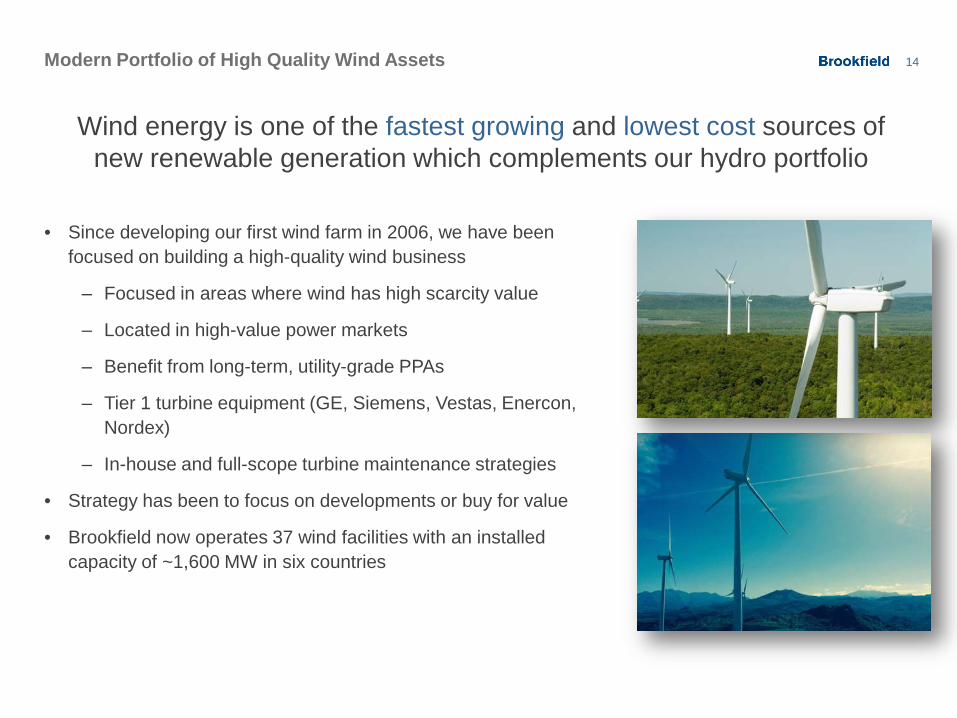
14 Modern Portfolio of High Quality Wind Assets
• Since developing our first wind farm in 2006, we have been focused on building a high-quality wind business
‒ Focused in areas where wind has high scarcity value
‒ Located in high-value power markets
‒ Benefit from long-term, utility-grade PPAs
‒ Tier 1 turbine equipment (GE, Siemens, Vestas, Enercon, Nordex)
‒ In-house and full-scope turbine maintenance strategies
• Strategy has been to focus on developments or buy for value
• Brookfield now operates 37 wind facilities with an installed capacity of ~1,600 MW in six countries
Wind energy is one of the fastest growing and lowest cost sources of new renewable generation which complements our hydro portfolio
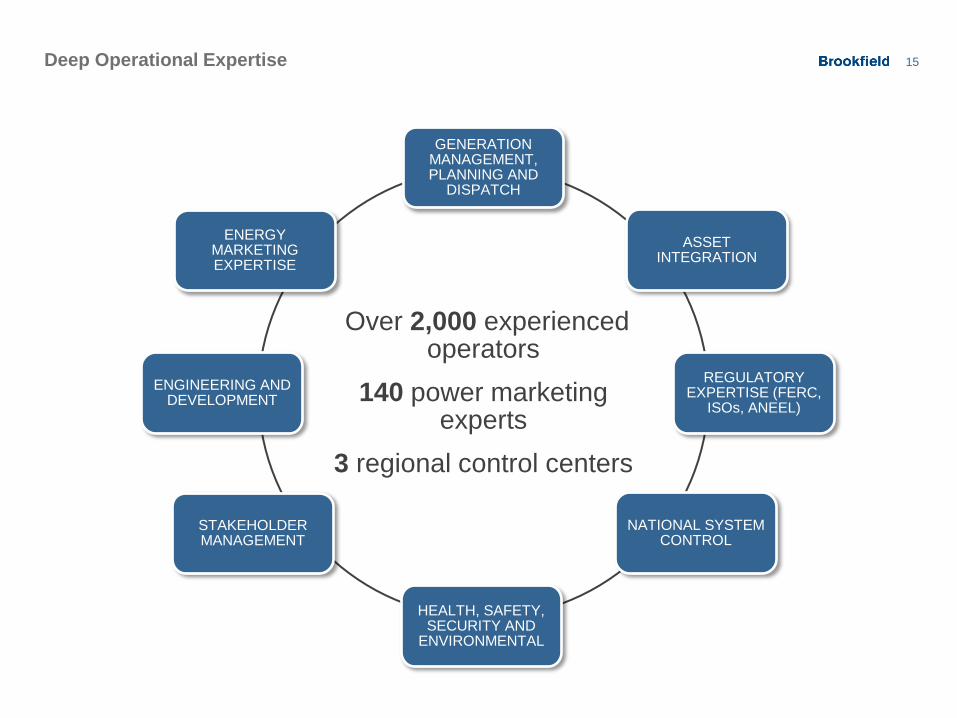
15 Deep Operational Expertise
Over 2,000 experienced operators
140 power marketing experts
3 regional control centers
GENERATION MANAGEMENT, PLANNING AND
DISPATCH
ASSET INTEGRATION
REGULATORY EXPERTISE (FERC,
ISOs, ANEEL)
NATIONAL SYSTEM CONTROL
HEALTH, SAFETY, SECURITY AND
ENVIRONMENTAL
STAKEHOLDER MANAGEMENT
ENGINEERING AND DEVELOPMENT
ENERGY MARKETING EXPERTISE
Prince Wind Farm, Ontario, Canada
Financial Profile
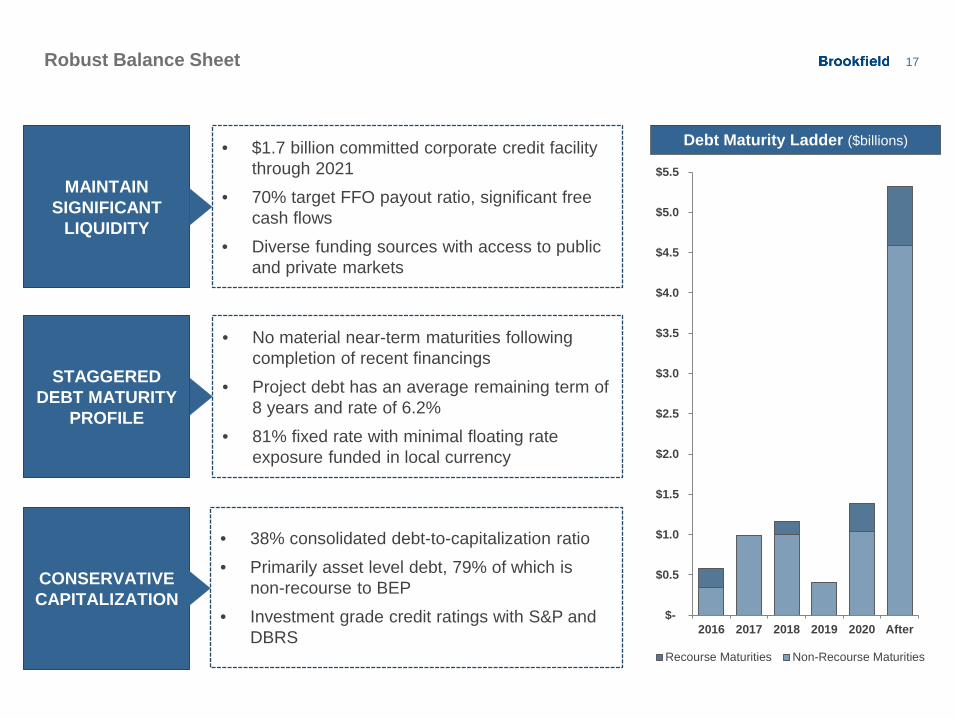
17 Robust Balance Sheet
MAINTAIN SIGNIFICANT
LIQUIDITY
• $1.7 billion committed corporate credit facility through 2021
• 70% target FFO payout ratio, significant free cash flows
• Diverse funding sources with access to public and private markets
STAGGERED DEBT MATURITY
PROFILE
• No material near-term maturities following completion of recent financings
• Project debt has an average remaining term of 8 years and rate of 6.2%
• 81% fixed rate with minimal floating rate exposure funded in local currency
CONSERVATIVE CAPITALIZATION
• 38% consolidated debt-to-capitalization ratio
• Primarily asset level debt, 79% of which is non-recourse to BEP
• Investment grade credit ratings with S&P and DBRS
Debt Maturity Ladder ($billions)
$-
$0.5
$1.0
$1.5
$2.0
$2.5
$3.0
$3.5
$4.0
$4.5
$5.0
$5.5
2016 2017 2018 2019 2020 After
Recourse Maturities Non-Recourse Maturities
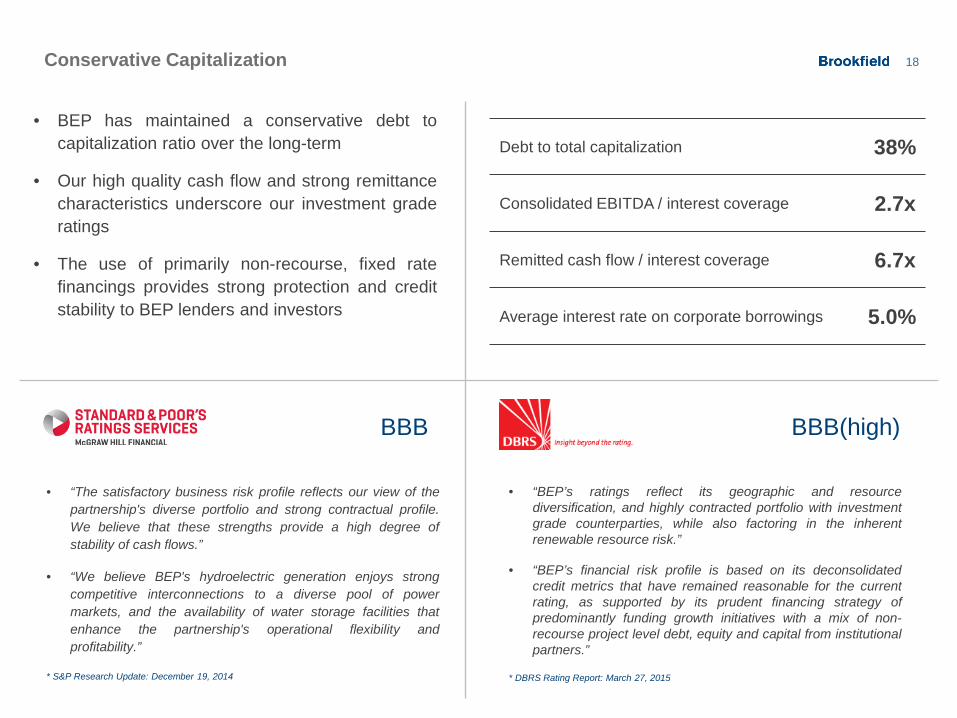
18 Conservative Capitalization
• BEP has maintained a conservative debt to capitalization ratio over the long-term
• Our high quality cash flow and strong remittance characteristics underscore our investment grade ratings
• The use of primarily non-recourse, fixed rate financings provides strong protection and credit stability to BEP lenders and investors
BBB BBB(high)
• “The satisfactory business risk profile reflects our view of the partnership's diverse portfolio and strong contractual profile. We believe that these strengths provide a high degree of stability of cash flows.”
• “We believe BEP's hydroelectric generation enjoys strong competitive interconnections to a diverse pool of power markets, and the availability of water storage facilities that enhance the partnership's operational flexibility and profitability.”
* S&P Research Update: December 19, 2014
• “BEP’s ratings reflect its geographic and resource diversification, and highly contracted portfolio with investment grade counterparties, while also factoring in the inherent renewable resource risk.”
• “BEP’s financial risk profile is based on its deconsolidated credit metrics that have remained reasonable for the current rating, as supported by its prudent financing strategy of predominantly funding growth initiatives with a mix of non-recourse project level debt, equity and capital from institutional partners.”
* DBRS Rating Report: March 27, 2015
Debt to total capitalization 38%
Consolidated EBITDA / interest coverage 2.7x
Remitted cash flow / interest coverage 6.7x
Average interest rate on corporate borrowings 5.0%
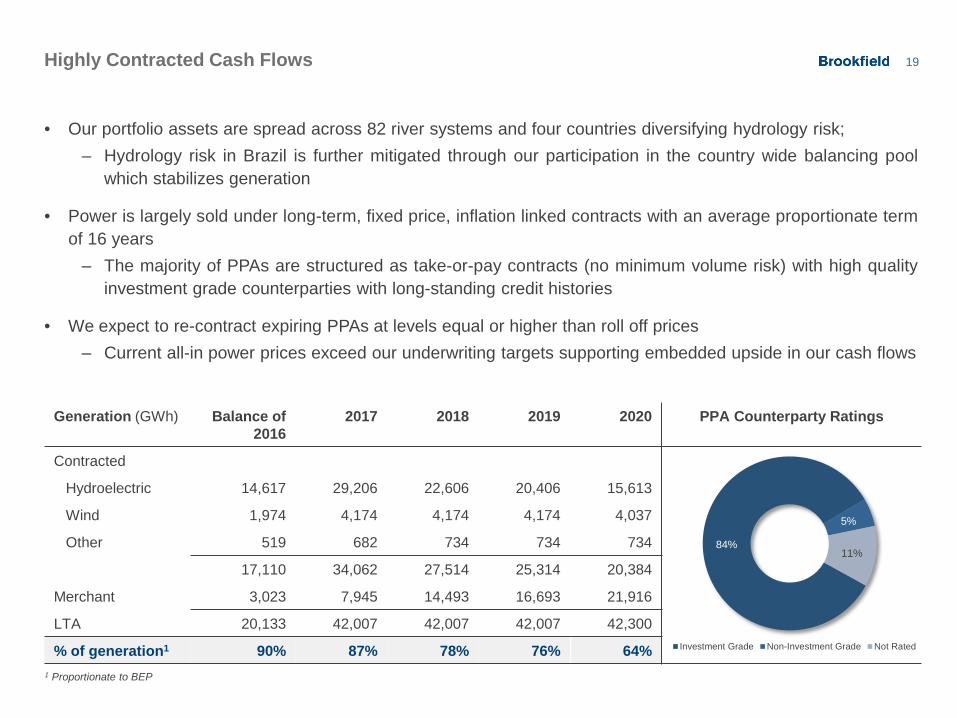
19
Generation (GWh) Balance of 2016
2017 2018 2019 2020 PPA Counterparty Ratings
Contracted
Hydroelectric 14,617 29,206 22,606 20,406 15,613
Wind 1,974 4,174 4,174 4,174 4,037
Other 519 682 734 734 734
17,110 34,062 27,514 25,314 20,384
Merchant 3,023 7,945 14,493 16,693 21,916
LTA 20,133 42,007 42,007 42,007 42,300
% of generation1 90% 87% 78% 76% 64%
Highly Contracted Cash Flows
• Our portfolio assets are spread across 82 river systems and four countries diversifying hydrology risk; ‒ Hydrology risk in Brazil is further mitigated through our participation in the country wide balancing pool
which stabilizes generation
• Power is largely sold under long-term, fixed price, inflation linked contracts with an average proportionate term of 16 years ‒ The majority of PPAs are structured as take-or-pay contracts (no minimum volume risk) with high quality
investment grade counterparties with long-standing credit histories
• We expect to re-contract expiring PPAs at levels equal or higher than roll off prices ‒ Current all-in power prices exceed our underwriting targets supporting embedded upside in our cash flows
84%
5%
11%
Investment Grade Non-Investment Grade Not Rated
1 Proportionate to BEP
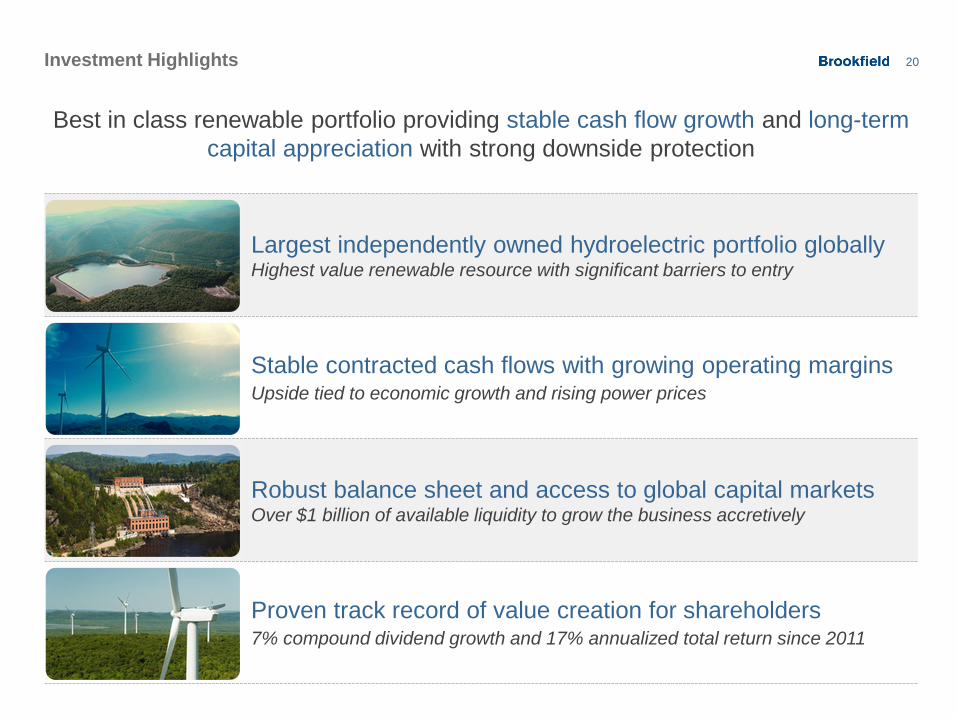
20 Investment Highlights
Best in class renewable portfolio providing stable cash flow growth and long-term capital appreciation with strong downside protection
Largest independently owned hydroelectric portfolio globally Highest value renewable resource with significant barriers to entry
Stable contracted cash flows with growing operating margins Upside tied to economic growth and rising power prices
Robust balance sheet and access to global capital markets Over $1 billion of available liquidity to grow the business accretively
Proven track record of value creation for shareholders 7% compound dividend growth and 17% annualized total return since 2011

21 Contacts
Sachin Shah Chief Executive Officer [email protected] 416.369.6008
Nick Goodman Chief Financial Officer [email protected] 416.369.2546
Zev Korman Senior Vice President, Investor and Media Relations [email protected] 416.359.1955
Rosie Mandla Manager, Investor Relations [email protected] 416.369.6010
Brookfield Tehachapi Wind Farm, California, United States
Appendix
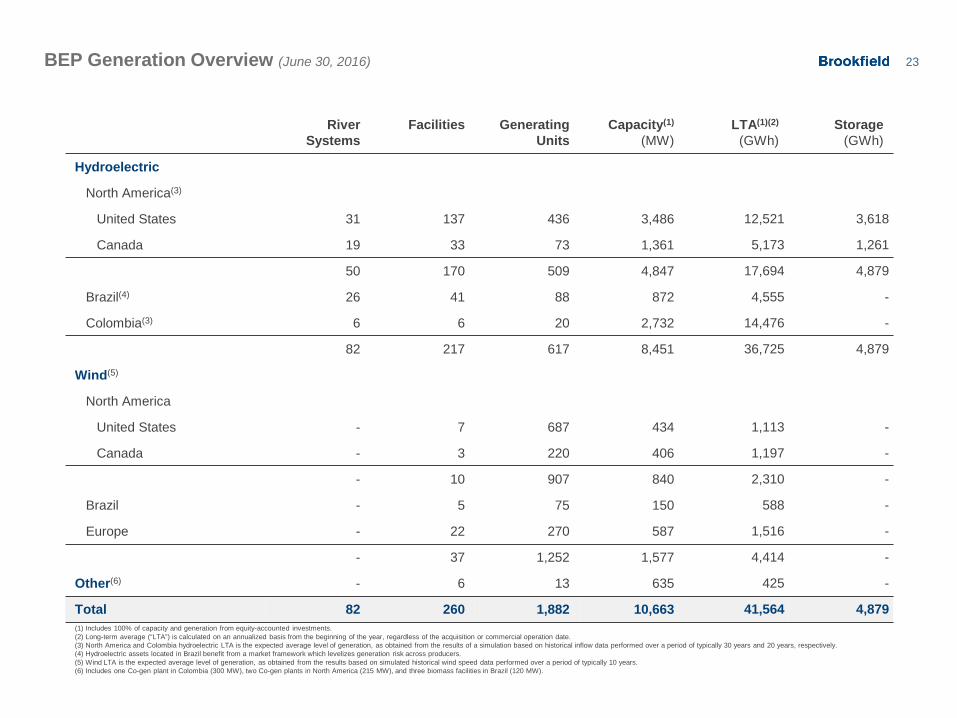
23 BEP Generation Overview (June 30, 2016)
River Systems
Facilities Generating Units
Capacity(1)
(MW) LTA(1)(2)
(GWh) Storage
(GWh)
Hydroelectric
North America(3)
United States 31 137 436 3,486 12,521 3,618
Canada 19 33 73 1,361 5,173 1,261
50 170 509 4,847 17,694 4,879
Brazil(4) 26 41 88 872 4,555 -
Colombia(3) 6 6 20 2,732 14,476 -
82 217 617 8,451 36,725 4,879
Wind(5)
North America
United States - 7 687 434 1,113 -
Canada - 3 220 406 1,197 -
- 10 907 840 2,310 -
Brazil - 5 75 150 588 -
Europe - 22 270 587 1,516 -
- 37 1,252 1,577 4,414 -
Other(6) - 6 13 635 425 -
Total 82 260 1,882 10,663 41,564 4,879 (1) Includes 100% of capacity and generation from equity-accounted investments. (2) Long-term average (“LTA”) is calculated on an annualized basis from the beginning of the year, regardless of the acquisition or commercial operation date. (3) North America and Colombia hydroelectric LTA is the expected average level of generation, as obtained from the results of a simulation based on historical inflow data performed over a period of typically 30 years and 20 years, respectively. (4) Hydroelectric assets located in Brazil benefit from a market framework which levelizes generation risk across producers. (5) Wind LTA is the expected average level of generation, as obtained from the results based on simulated historical wind speed data performed over a period of typically 10 years. (6) Includes one Co-gen plant in Colombia (300 MW), two Co-gen plants in North America (215 MW), and three biomass facilities in Brazil (120 MW).
24
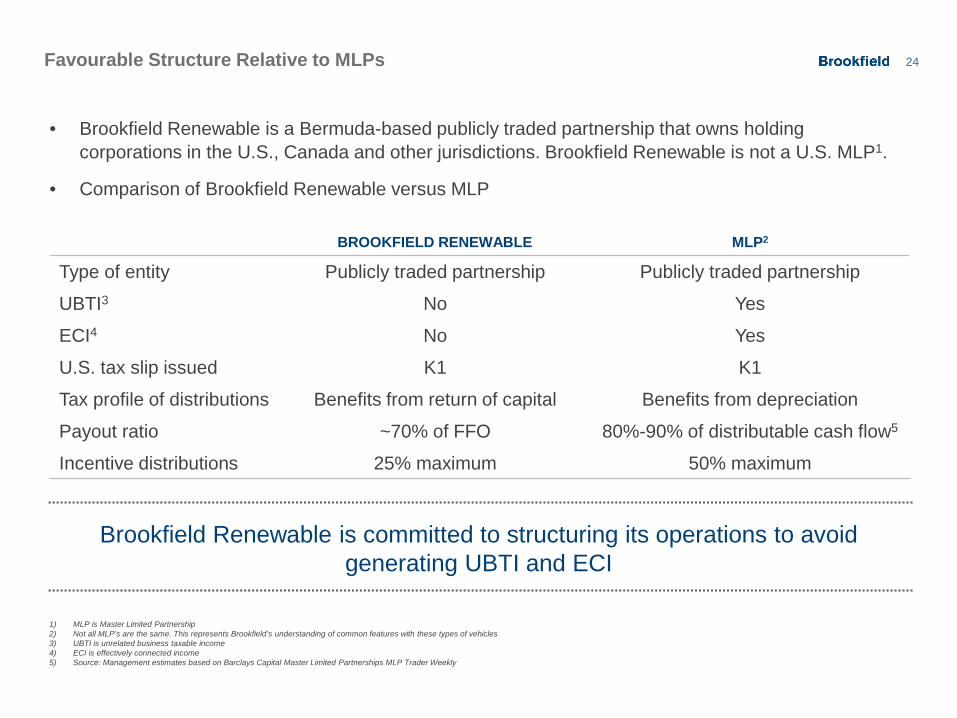
• Brookfield Renewable is a Bermuda-based publicly traded partnership that owns holding corporations in the U.S., Canada and other jurisdictions. Brookfield Renewable is not a U.S. MLP1.
• Comparison of Brookfield Renewable versus MLP
Brookfield Renewable is committed to structuring its operations to avoid generating UBTI and ECI
BROOKFIELD RENEWABLE MLP2
Type of entity Publicly traded partnership Publicly traded partnership
UBTI3 No Yes
ECI4 No Yes
U.S. tax slip issued K1 K1
Tax profile of distributions Benefits from return of capital Benefits from depreciation
Payout ratio ~70% of FFO 80%-90% of distributable cash flow5
Incentive distributions 25% maximum 50% maximum
1) MLP is Master Limited Partnership 2) Not all MLP’s are the same. This represents Brookfield’s understanding of common features with these types of vehicles 3) UBTI is unrelated business taxable income 4) ECI is effectively connected income 5) Source: Management estimates based on Barclays Capital Master Limited Partnerships MLP Trader Weekly
Favourable Structure Relative to MLPs
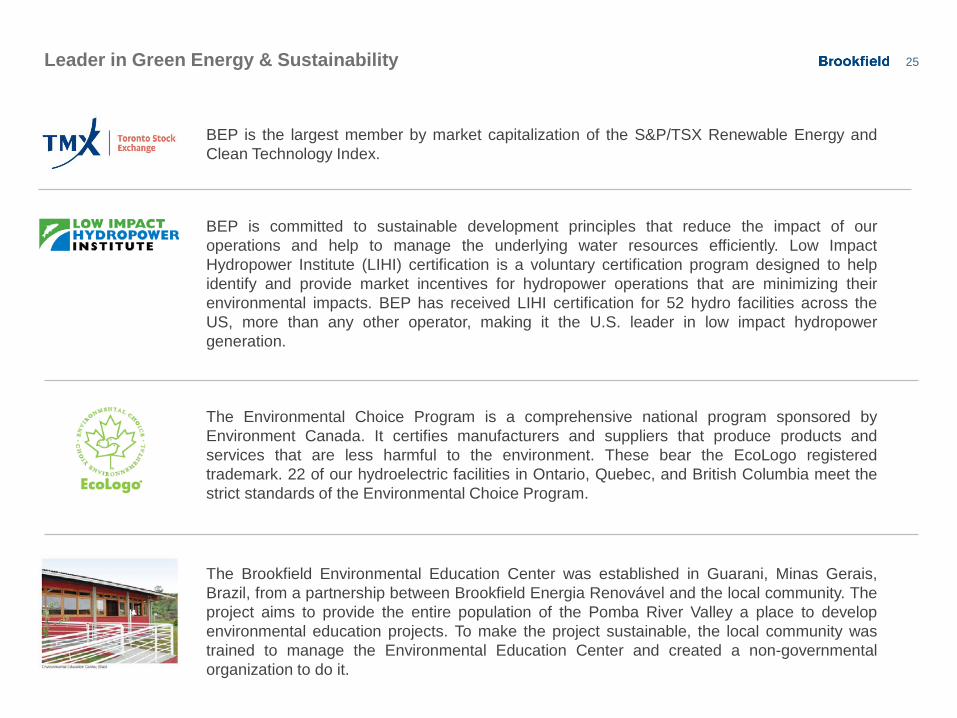
25 Leader in Green Energy & Sustainability
BEP is the largest member by market capitalization of the S&P/TSX Renewable Energy and Clean Technology Index.
BEP is committed to sustainable development principles that reduce the impact of our operations and help to manage the underlying water resources efficiently. Low Impact Hydropower Institute (LIHI) certification is a voluntary certification program designed to help identify and provide market incentives for hydropower operations that are minimizing their environmental impacts. BEP has received LIHI certification for 52 hydro facilities across the US, more than any other operator, making it the U.S. leader in low impact hydropower generation.
The Environmental Choice Program is a comprehensive national program sponsored by Environment Canada. It certifies manufacturers and suppliers that produce products and services that are less harmful to the environment. These bear the EcoLogo registered trademark. 22 of our hydroelectric facilities in Ontario, Quebec, and British Columbia meet the strict standards of the Environmental Choice Program.
The Brookfield Environmental Education Center was established in Guarani, Minas Gerais, Brazil, from a partnership between Brookfield Energia Renovável and the local community. The project aims to provide the entire population of the Pomba River Valley a place to develop environmental education projects. To make the project sustainable, the local community was trained to manage the Environmental Education Center and created a non-governmental organization to do it.