brookfield global infrastructure securities income fund/media/files/b/brookfield... · brookfield...
TRANSCRIPT
2013Annual Management Report of Fund Performance
For the period from July 18, 2013 to December 31, 2013
Brookfield Investment Management
Brookf ie ld Global Infrastructure Secur i t ies Income FundBGI.UN
Brookfield Global Infrastructure Securities Income Fund
2013 Annual Management Report of Fund Performance | 1
IN PROFILE
Brookfield Global Infrastructure Securities Income Fund (the “Fund”) is managed byBrookfield Investment Management (Canada) Inc. (“BIM Canada”). BIM Canada is asubsidiary of Brookfield Asset Management Inc., a global alternative asset managerwith over $187 billion of assets under management as at December 31, 2013 and overa 100-year history of owning and operating assets with a focus on property,renewable power, infrastructure and private equity.
Brookfield Investment Management Inc. is the investment manager of the Fund.
BGI.UN (TSX LISTED) UNIT INFORMATION
Units Outstanding (December 31, 2013): 34,400,000 Units
Targeted Quarterly Distributions: The quarterly distributions are targeted to be $0.15per Unit ($0.60 per annum representing an annualcash distribution of 6.0% based on the $10.00 perUnit issue price). The Fund does not have a fixeddistribution.
Record Date: The last business day of each of March, June,September and December.
Payment Date: No later than the 15th business day of the monthfollowing the distribution Record Date.
Brookfield Global Infrastructure Securities Income Fund
2013 Annual Management Report of Fund Performance | 2
LETTER TO UNITHOLDERS
Dear Unitholders,
We are pleased to provide this Annual Management Report of Fund Performance for Brookfield GlobalInfrastructure Securities Income Fund (the “Fund”) for the period from July 18, 2013 and endedDecember 31, 2013 (the “Period”).
The Fund was created with the objectives to (i) provide holders of Units (“Unitholders”) with quarterlycash distributions; (ii) maximize total return for Unitholders through distributions and capitalappreciation; and (iii) preserve capital. The quarterly distributions are currently targeted at $0.15 perUnit or $0.60 per annum, representing a targeted annual cash distribution of 6.0% based on the $10.00per unit issue price. To achieve this high income return, the Fund is comprised primarily of publicly-traded global infrastructure equity securities.
PERFORMANCE
As at December 31, 2013, the net asset value per Unit of the Fund was $10.31 after payments of twoquarterly distributions to Unitholders of $0.15 per Unit. This compares to the subscription price of$10.00 per Unit on July 18, 2013, the Fund’s inception date. For the period ended December 31, 2013,the Fund had a total return of 6.12% including payment of quarterly distributions to Unitholders of$0.15 per Unit. The Fund’s distributions were paid out of return of capital and the total return of 6.12%was largely comprised of income generated on the Portfolio.
Market sentiment throughout 2013 was driven by interest rates – first by euphoria over low rates andlater by fear over their imminent rise. Governments across the globe helped drive yields on fixedincome investments to all-time lows. Not least was the Japanese government’s unprecedented monthlydebt purchase announcement equaling 7.5 trillion yen, or approximately US $76 billion. Followingseveral months of yield focused equity investing spurred by all-time low fixed income yields, marketsreversed course in May when U.S. Federal Reserve Chairman Ben Bernanke foreshadowed a reduction ingovernment bond purchases. Thereafter, interest rates rose substantially with the yield on the 10-yearU.S. Treasury Note increasing 118 basis points, from 1.86% on January 2 to 3.04% on December 31.
Global equity market movements were generally positive, and the MSCI World Index rose 27.4%1. U.S.markets outpaced global markets for the year, but ongoing political and monetary policy turmoil drovevolatility in U.S. markets. International outliers included Japan, where optimism over the new Abegovernment’s policies led the market to outperform, and Europe, which rebounded in the year on signsof stabilization. Boosting markets into year-end was the Fed’s tapering announcement on December 18.The Committee’s decision to reduce purchases of agency mortgage-backed securities and longer-termTreasury securities by a total of US$10 billion per month was generally perceived as dovish. Theannouncement also included a provision that the targeted federal funds rate would remain“exceptionally low” until unemployment in the U.S. falls below 6.5%, further boosting sentiment.
Global infrastructure securities as measured by the Dow Jones Brookfield Global InfrastructureComposite Index2 returned 18.8% in 2013. As was the case more broadly, Europe was a bright spotamong infrastructure stocks as the region rebounded off its lows. European infrastructure securitiesreturned a strong 22.5% in 2013, followed by the Americas and Asia Pacific, up 13.6% and 11.3%respectively. Higher growth sectors levered to an economic recovery were also strong, led by airports(+26.6%) and toll roads (+25.0%). Communications (+7.7%) and water (+9.4%) lagged. Water suffered
1 The MSCI World Index is a free float-adjusted market capitalization weighted index that is designed to measure the equity market performance ofdeveloped markets.2 The Dow Jones Brookfield Global Infrastructure Composite Index is calculated and maintained by S&P Dow Jones Indices and comprisesinfrastructure companies with at least 70% of its annual cash flows derived from owning and operating infrastructure assets, including Master LimitedPartnerships.
Brookfield Global Infrastructure Securities Income Fund
2013 Annual Management Report of Fund Performance | 3
from its low growth profile while communications companies may have been impacted by higherinterest rates and fear of slower growth3.
We believe underperformance of the infrastructure asset class in 2013 creates investmentopportunities for the year ahead. While a steep increase in interest rates would present a downside riskfor infrastructure securities, we expect a modest rise in long-term interest rates at a moderate pace. Anumber of positive trends, particularly investor demand for infrastructure securities as well as rapidgrowth in the asset class, support our positive outlook for the space in 2014.
Master Limited Partnerships (“MLPs”) had a banner year, and the Alerian MLP Total Return Index4
returned 27.6%. MLPs are generally among the highest yielding infrastructure securities and offerstrong earnings growth driven by new pipelines which will become operational in the coming years.Demand for MLPs did not slow in 2013. Indicatively, dedicated MLP funds have been highly successful.Five closed end and six open end funds totaling more than US$4.2 billion (including leverage)5 wereraised this year, indicating ongoing retail investor demand for MLPs. We remain constructive on theMLP sector due to expectations that strong earnings growth will offset the impact of rising interestrates.
Estimates indicate a $25 trillion gap in government infrastructure spending over the next 25 years,creating a significant opportunity for investment by publicly traded infrastructure companies6. Listedinfrastructure companies have taken action in 2013, and we have seen notable expansion of theinfrastructure securities investment universe.
PrivatizationsCash strapped governments have increasingly turned to private companies to recapitalize their balancesheets. In 2013, the first ever privatization of a U.S. airport occurred. Rights to operate the San Juanairport in Puerto Rico were sold to Grupo Aeroportuario del Sureste (ASUR), a Mexican airport companythat operates the Cancun airport among others, together with partner Highstar Capital. In the firstquarter of 2013, the consortium received the final approvals required by the Federal AviationAdministration (“FAA”) to operate the airport. The transaction may pave the way for others. In fact,under the Airport Privatization Pilot Program, the FAA has already agreed to permit up to 10 publicairport sponsors to sell or lease an airport in the U.S.
Emerging markets also offer significant privatization opportunities as many of these governments arecapital constrained. We view Brazil especially positively in light of attractive valuations, even thoughthe macro climate is characterized by inflation, low savings rates and low growth forecasts. PresidentDilma Rousseff’s administration has made significant attempts to stimulate economic growth bypromoting private ownership of infrastructure assets. In 2012, President Rousseff unveiled aninfrastructure privatization initiative to privatize 7,500 kilometers of toll roads requiring US$20 billionof capital investment and 10,000 kilometers of railroads requiring US$45 billion of investment. During2013, the success of Brazilian infrastructure privatizations varied, but the two most recent airportauctions were a boon to the Rousseff administration. The most publicized sale was the Galeao Airportin Rio. The winning bid came from a Brazilian private construction group Odebrecht SA together with aunit of Changi Airport Group, which bid 19 billion reais for the asset. This significantly outpaced therequired minimum bid of 4.8 billion reais. Odebrecht SA was also awarded another Brazilian auction,BR-163 highway, an 851 kilometer toll road.IPOsNew investment opportunities also arose through a number of successful IPOs. For instance, Mexicaninfrastructure company Infraestructura Energetica Nova SAB de CV (IENOVA) completed an IPO in March
3 Sector and regional performance is measured by The Dow Jones Brookfield Infrastructure Indices, which aim to measure the stock performance ofcompanies worldwide that are owners and operators of infrastructure assets. To be included in the indices, a company must have more than 70% ofestimated cash flows (based on publicly available information) derived from the following infrastructure sectors: airports, toll roads, ports,communications, electricity transmission & distribution, oil & gas storage & transportation, water or diversified (multiple sectors).4 The Alerian MLP Total Return Index is a composite of the 50 most prominent energy Master Limited Partnerships (MLPs) and is calculated using afloat-adjusted, capitalization-weighted methodology.5 As of December 31, 2013. Source: Morningstar.6 Source: Brookfield Investment Management estimate based on OECD data, August 2003.
Brookfield Global Infrastructure Securities Income Fund
2013 Annual Management Report of Fund Performance | 4
priced at the top end of the range at 34.00 Mexican pesos per share, or approximately US$2.75. IENOVAis a subsidiary of portfolio holding Sempra Energy (SRE), a U.S. long-haul pipeline company, and ownsand operates natural gas pipelines and distribution facilities in Mexico as well as the Costa Azulliquefied natural gas (or “LNG”) facility near Ensenada, Mexico. Separately, NRGY Yield (NYLD) listed inJuly and issued 22,511,250 common shares at US$22 per share in a well-received offering. NYLD wasspun out of NRG Energy, Inc. and is a diversified infrastructure company with stable cash flows drivenby long term contracts.
Exploring new territoryBeyond IPOs and privatizations, growth opportunities for infrastructure securities come in the form ofnew development and expansions. For instance, new mining operations in Canada’s oil sands continueto be announced, creating opportunities for pipeline companies to meet the growing transportationneed. For example, Suncor Energy recently announced that its Fort Hills Project, located in Alberta’sAthabasca region, will be in production as early as late 2017. Enbridge Inc., an oil and gas pipelinecompany, was selected by Suncor and its partners to develop a new US$1.6 billion pipeline (WoodBuffalo Extension) to transport crude oil from the Fort Hills Project to Hardisty, Alberta, an importanthub for oil sands production. Other companies in the infrastructure universe may benefit as additionalmining operations are approved.
Separately, new liquefied natural gas (“LNG”) exports are being approved by the U.S. Department ofEnergy (“DOE”), providing international growth avenues for listed companies in our investmentuniverse. The DOE has taken a number of steps toward relaxing its policy regarding the export of LNGto international countries without Free Trade Agreements (“FTAs”) with the U.S. Last December, theDOE issued a report that was supportive of natural gas drilling, and therefore positive for the energyinfrastructure sector. The study was intended to protect public interest by examining the impact ondomestic natural gas pricing as additional LNG export facilities become operational. Current lawsrequire natural gas companies to obtain a license when exporting natural gas to non-FTA countries. Thereport concluded that additional LNG export facilities in the U.S. for exports of up to 12 billion cubicfeet (“bcf”) per day would likely have a minimal impact on natural gas pricing, and that benefits wouldlikely outweigh any costs.
Subsequent to this decision the DOE has approved five projects. We believe ongoing approvals mark animportant shift for the global infrastructure securities asset class. North American energyinfrastructure companies may benefit as their pipelines connect to these export facilities and areanticipated to see additional volumes as exports grow. Additionally, as the 12 bcf per day amountaddressed in the DOE study draws nearer, there will be winners and losers. We believe that reaching 12bcf per day may trigger an additional study, which would create approval delays and could effectivelycap non-FTA exports in the medium term. We are monitoring the situation closely.
OUTLOOK
As we look ahead to the New Year, we do not plan to make dramatic changes to portfolio exposures.We continue to favor high growth sectors in the U.S., including pipelines and rail companies. Crude byrail shipments out of the Bakken shale region in the U.S. have grown dramatically, and we expectgrowth to continue into 2014. We also anticipate crude by rail growth out of Canada, where rail loadingfacilities are being constructed. Within Europe, we remain cautious on regulated businesses like UKwater companies in light of regulatory uncertainty. We favor transportation infrastructure in Spain andItaly, where signs of improving traffic driven by GDP growth should benefit transportation operators inthe region.
We also expect continued opportunities to arise within emerging markets. In Brazil, we anticipate shortterm volatility until the October 2014 elections, but have identified ongoing value opportunities amonghigh quality companies in the country. We continue to favor gas utilities in China, and December’sThird Plenum boosted optimism for economic reform in the region. Finally, energy reform in Mexico
Brookfield Global Infrastructure Securities Income Fund
2013 Annual Management Report of Fund Performance | 5
may necessitate infrastructure build-out, spurring new opportunities for U.S. energy infrastructurecompanies.
We aim to capitalize on growth opportunities in the coming year. We believe infrastructure securitiesare generally well positioned to benefit from an improving macro economy while offering attractiveincome and capital preservation against ongoing market volatility into 2014.
We welcome your questions and comments, and encourage you to contact our Investor Relations teamat (855) 777-8001 or visit us at www.brookfieldim.com for more information. Thank you for yoursupport.
Craig Noble, Managing DirectorOn behalf of the Investment Manager,Brookfield Investment Management Inc.
Brookfield Global Infrastructure Securities Income Fund
2013 Annual Management Report of Fund Performance | 6
MANAGEMENT REPORT OF FUND PERFORMANCE
This annual management report of fund performance contains financial highlights but does not containthe complete annual financial statements of Brookfield Global Infrastructure Securities Income Fund(the “Fund”). The annual financial statements may contain information not included in themanagement report of fund performance. You can get a copy of the annual financial statements atyour request, and at no cost, by contacting us (see contact information at end of this report) or byvisiting our website at www.brookfieldim.com or by viewing our filings on SEDAR at www.sedar.com.Unitholders may also contact us to request a free copy of the Fund’s interim financial report, proxyvoting policies and procedures, proxy voting disclosure record, or quarterly portfolio disclosure.
This report may contain forward-looking statements. The use of any of the words anticipate, may, will,expect, estimate, should, believe and similar expressions are intended to identify forward-lookingstatements. Such statements reflect the opinion of Brookfield Investment Management Inc.(“Investment Manager” or “BIM”) regarding factors that might be reasonably expected to affect theperformance and the distribution on units of the Fund and are based on information available at thetime of writing. The Investment Manager believes that the expectations reflected in these forward-looking statements and in the report are reasonable but no assurance can be given that theseexpectations or the report will prove to be correct and accordingly, they should not be unduly reliedon. These statements speak only as at the date of the report. Actual events and outcomes may differmaterially from those described in these forward-looking statements or report.
Unless otherwise indicated, all information is presented as at December 31, 2013 and expressed inCanadian dollars.
None of the websites referred to in this annual management report of fund performance, or any of theinformation on such websites, are incorporated by reference in this annual management report of fundperformance.
INVESTMENT OBJECTIVES AND STRATEGIES
The Fund endeavours to provide holders of units (“Unitholders”) with quarterly cash distributionscurrently targeted at $0.15 per unit ($0.60 per annum representing an annual cash distribution of 6.0%based on the $10.00 per unit issue price).
The Fund invests in a portfolio (the “Portfolio”) comprised primarily of publicly-traded globalinfrastructure companies that own and operate infrastructure assets. Brookfield InvestmentManagement (Canada) Inc. (“BIM Canada”) is the manager (the “Manager”) of the Fund (the “Fund”)and Brookfield Investment Management Inc. (“BIM”) is the investment manager of the Fund.
RISK
At December 31, 2013, the Fund was primarily invested publicly-traded global infrastructure equitysecurities of companies domiciled in the United States and to a lesser extent, Canada, Europe, Asia,Australia, and Latin America. To fund the cash distribution currently targeted at $0.6 per annum, whilepreserving the net asset value, the Fund, is exposed to various risks including risks related to the creditquality of the issuer of the securities, the trading liquidity of the securities and the currency in whichthe securities are denominated. The Fund seeks to minimize potentially adverse effects of these riskson performance by employing experienced portfolio managers, by continuously monitoring the Fund’ssecurities positions and markets. Since the Fund’s inception on July 18, 2013, there has been nomaterial change in the overall level of risk created by the credit quality, trading liquidity or currencydenomination of the investments.
Brookfield Global Infrastructure Securities Income Fund
2013 Annual Management Report of Fund Performance | 7
The Fund uses leverage to finance the purchase of certain investments. Leverage is restricted to 33% ofthe total assets. Accordingly, at the time of borrowing, the maximum amount of leverage that the Fundcould employ is 1.50:1 (total long positions (including leveraged positions) divided by net assets of theFund). As at December 31, 2013, the Fund had employed leverage equal to 24.2% of total assets,equating to $127.9 million of the total assets. The minimum and maximum amount of borrowingsoutstanding during the period from July 18, 2013 to December 31, 2013 was $0 and $127.9 million,respectively. The borrowings were used to grow the Fund’s investments and for working capital needs.Adding a controlled amount of leverage to the Fund is consistent with the Fund’s objectives.
RESULTS OF OPERATIONS
The Fund began operations on July 18, 2013 when it completed an initial public offering of 32,500,000units (the “Units”) and subsequently issued 1,900,000 Units pursuant to an over-allotment option onJuly 31, 2013 at $10.00 per Unit, for gross proceeds of $344 million and net proceeds of $325.1 millionafter deducting issuance costs of approximately $18.9 million.
The Fund’s net asset value was $354.6 million as at December 31, 2013, an increase of $29.5 millionfrom $325.1 million as at July 18, 2013. The increase in net asset value was largely comprised of netinvestment loss of $0.3 million plus net realized and unrealized investment gains of approximately$43.0 million and net realized and unrealized currency losses of approximately $2.8 million. The Fund’snet asset value was reduced by $10.3 million during 2013 through distributions to Unitholders.
For the period from the commencement of operations on July 18, 2013 to December 31, 2013 (the“Period”), the net asset value per Unit of the Fund was $10.31 compared to $9.45 on July 18, 2013.The Fund’s total return was 6.12% for the Period.
The Fund’s total return of 6.12% over the period was primarily driven by: (1) investment income earnedin the Portfolio, (2) price changes in individual holdings of the Portfolio, and (3) the positive impact ofcurrency translation.
The Portfolio was overweight in the Basic Industry sector, which benefited from stronger economicgrowth and improved corporate cash flows which resulted from strict cost controls on the part of manycompanies. This overweight allocation added significant performance during the Period, particularlyfrom Building Materials and Chemical holdings and was somewhat offset by lagging performance in theFund’s allocation to Metals. The Fund was overweight the Services sector, which also contributed toperformance, particularly due to effective security selection in Gaming bonds. The Automotive sectorwas also over-weighted as the Investment Manager perceived improved prospects for North Americanautomobile sales resulting from increasing consumer confidence and an aging automobile fleet. Thisoverweight contributed to performance.
FUTURE ACCOUNTING CHANGES
International Financial Reporting Standards (“IFRS”) replaced Canadian GAAP for publicly accountableenterprises other than investment funds. Under the general transition rules, publicly accountableenterprises, other than investment funds, adopted IFRS for the fiscal period beginning January 1, 2011.
On September 7, 2010, the Canadian Accounting Standards Board ("AcSB") approved an optional oneyear deferral of IFRS adoption for investment companies applying Accounting Guideline AcG 18,Investment Companies until fiscal years beginning on or after January 1, 2012. On January 12, 2011,the AcSB approved an additional one year extension to the optional one year deferral until fiscal yearsbeginning on or after January 1, 2013 and in December 2011 was further extended to January 1, 2014.Accordingly, the Fund will adopt IFRS no later than for the fiscal year beginning January 1, 2014, andwill issue its initial financial statements in accordance with IFRS, including comparative information, nolater than for the period ending June 30, 2014. At this point in the transition from GAAP to IFRS, theFund anticipates that there will not be a material impact to the Net Assets per Unit. The impact of IFRS
Brookfield Global Infrastructure Securities Income Fund
2013 Annual Management Report of Fund Performance | 8
on accounting policies and implementation decisions will mainly be in the areas of additional notedisclosures in the financial statements.
RELATED PARTY TRANSACTIONS
The Manager and the Investment Manager are wholly owned subsidiaries of Brookfield AssetManagement Inc. (“Brookfield”) and the Investment Manager manages the investment and tradingactivities of the Fund pursuant to a management agreement. Due to Brookfield’s ability to control theFund, Brookfield, and its affiliates over which it has the ability to exercise control or significantinfluence, are related parties of the Fund by virtue of common control or common significantinfluence.
Transactions with related parties, including investment transactions, are conducted in the normalcourse of operations and are recorded at exchange amounts, which are equivalent to normal marketterms. Please refer to the section titled “Management Fees”, which outlines the fees paid to theManager by the Fund.
There were no related party transactions conducted during the Period.
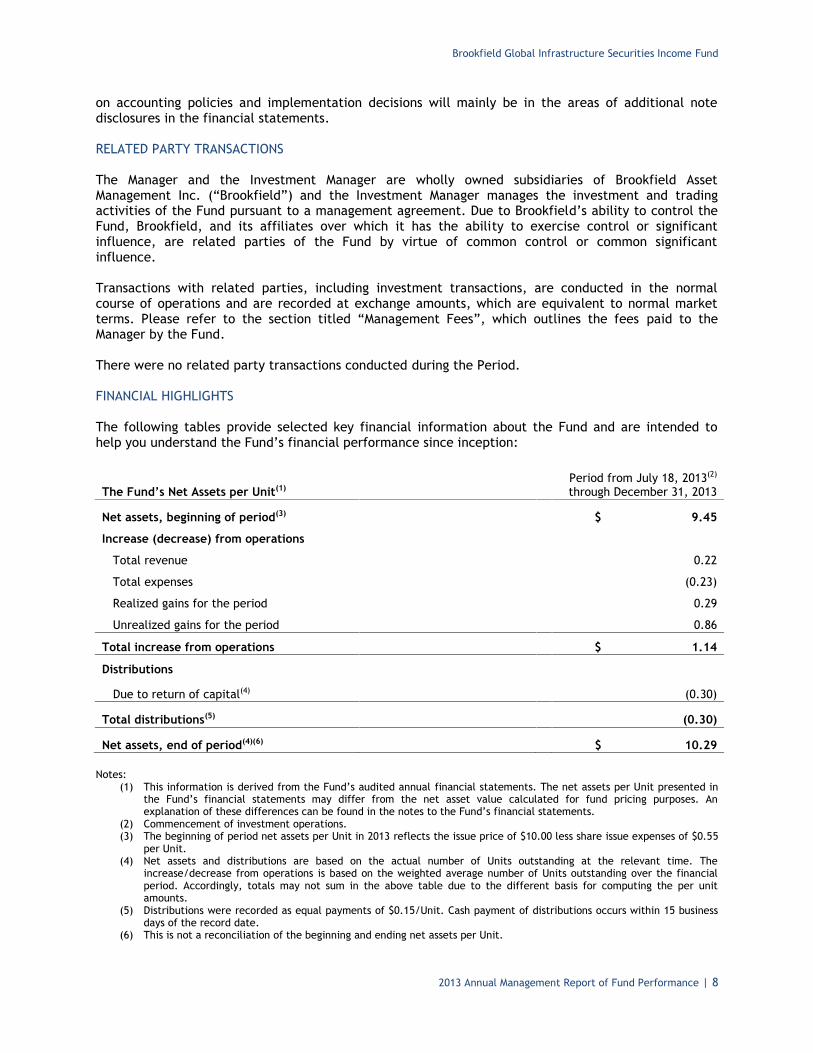
FINANCIAL HIGHLIGHTS
The following tables provide selected key financial information about the Fund and are intended tohelp you understand the Fund’s financial performance since inception:
The Fund’s Net Assets per Unit(1)Period from July 18, 2013(2)
through December 31, 2013
Net assets, beginning of period(3) $ 9.45
Increase (decrease) from operations
Total revenue 0.22
Total expenses (0.23)
Realized gains for the period 0.29
Unrealized gains for the period 0.86
Total increase from operations $ 1.14
Distributions
Due to return of capital(4) (0.30)
Total distributions(5) (0.30)
Net assets, end of period(4)(6) $ 10.29
Notes:(1) This information is derived from the Fund’s audited annual financial statements. The net assets per Unit presented in
the Fund’s financial statements may differ from the net asset value calculated for fund pricing purposes. Anexplanation of these differences can be found in the notes to the Fund’s financial statements.
(2) Commencement of investment operations.(3) The beginning of period net assets per Unit in 2013 reflects the issue price of $10.00 less share issue expenses of $0.55
per Unit.(4) Net assets and distributions are based on the actual number of Units outstanding at the relevant time. The
increase/decrease from operations is based on the weighted average number of Units outstanding over the financialperiod. Accordingly, totals may not sum in the above table due to the different basis for computing the per unitamounts.
(5) Distributions were recorded as equal payments of $0.15/Unit. Cash payment of distributions occurs within 15 businessdays of the record date.
(6) This is not a reconciliation of the beginning and ending net assets per Unit.
Brookfield Global Infrastructure Securities Income Fund
2013 Annual Management Report of Fund Performance | 9
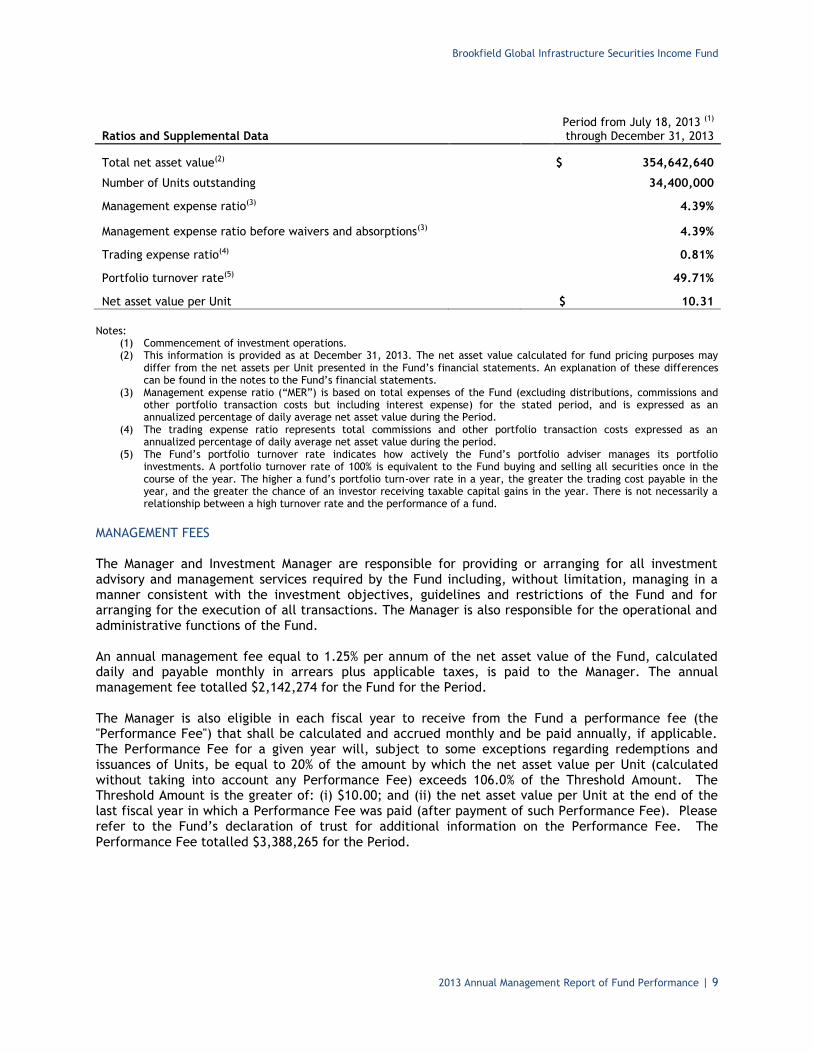
Ratios and Supplemental DataPeriod from July 18, 2013 (1)
through December 31, 2013
Total net asset value(2) $ 354,642,640
Number of Units outstanding 34,400,000
Management expense ratio(3) 4.39%
Management expense ratio before waivers and absorptions(3) 4.39%
Trading expense ratio(4) 0.81%
Portfolio turnover rate(5) 49.71%
Net asset value per Unit $ 10.31
Notes:(1) Commencement of investment operations.(2) This information is provided as at December 31, 2013. The net asset value calculated for fund pricing purposes may
differ from the net assets per Unit presented in the Fund’s financial statements. An explanation of these differencescan be found in the notes to the Fund’s financial statements.
(3) Management expense ratio (“MER”) is based on total expenses of the Fund (excluding distributions, commissions andother portfolio transaction costs but including interest expense) for the stated period, and is expressed as anannualized percentage of daily average net asset value during the Period.
(4) The trading expense ratio represents total commissions and other portfolio transaction costs expressed as anannualized percentage of daily average net asset value during the period.
(5) The Fund’s portfolio turnover rate indicates how actively the Fund’s portfolio adviser manages its portfolioinvestments. A portfolio turnover rate of 100% is equivalent to the Fund buying and selling all securities once in thecourse of the year. The higher a fund’s portfolio turn-over rate in a year, the greater the trading cost payable in theyear, and the greater the chance of an investor receiving taxable capital gains in the year. There is not necessarily arelationship between a high turnover rate and the performance of a fund.
MANAGEMENT FEES
The Manager and Investment Manager are responsible for providing or arranging for all investmentadvisory and management services required by the Fund including, without limitation, managing in amanner consistent with the investment objectives, guidelines and restrictions of the Fund and forarranging for the execution of all transactions. The Manager is also responsible for the operational andadministrative functions of the Fund.
An annual management fee equal to 1.25% per annum of the net asset value of the Fund, calculateddaily and payable monthly in arrears plus applicable taxes, is paid to the Manager. The annualmanagement fee totalled $2,142,274 for the Fund for the Period.
The Manager is also eligible in each fiscal year to receive from the Fund a performance fee (the"Performance Fee") that shall be calculated and accrued monthly and be paid annually, if applicable.The Performance Fee for a given year will, subject to some exceptions regarding redemptions andissuances of Units, be equal to 20% of the amount by which the net asset value per Unit (calculatedwithout taking into account any Performance Fee) exceeds 106.0% of the Threshold Amount. TheThreshold Amount is the greater of: (i) $10.00; and (ii) the net asset value per Unit at the end of thelast fiscal year in which a Performance Fee was paid (after payment of such Performance Fee). Pleaserefer to the Fund’s declaration of trust for additional information on the Performance Fee. ThePerformance Fee totalled $3,388,265 for the Period.
Brookfield Global Infrastructure Securities Income Fund
2013 Annual Management Report of Fund Performance | 10
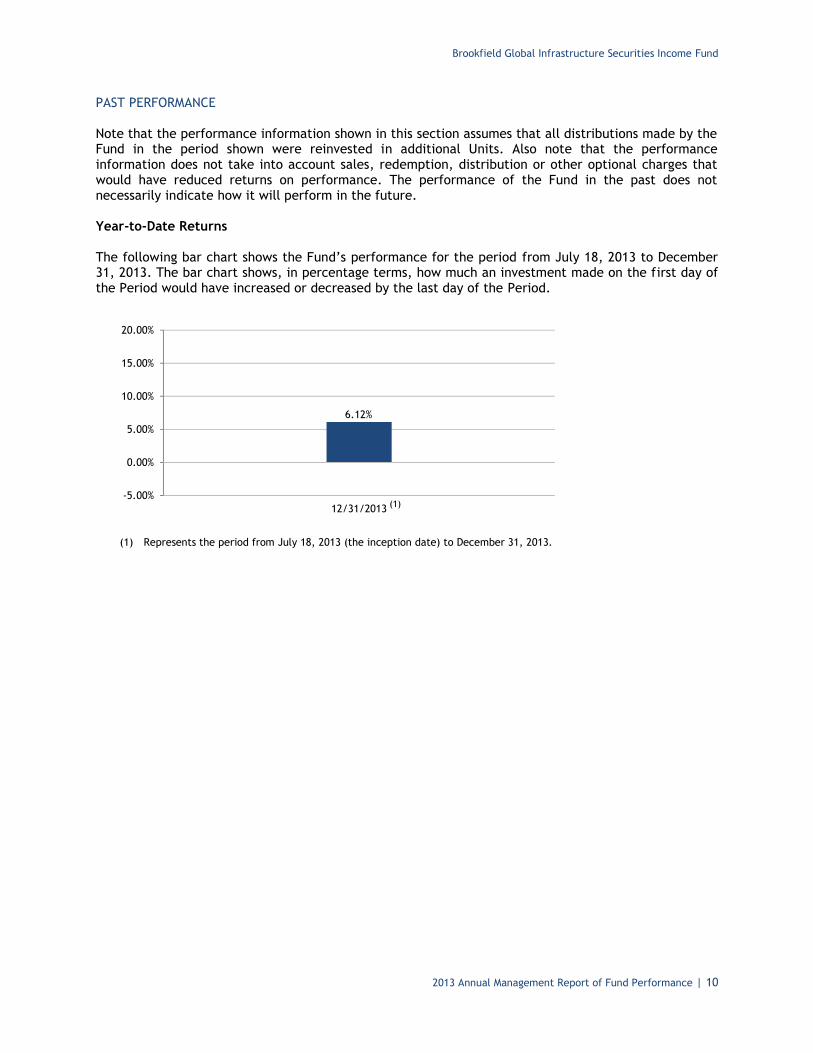
PAST PERFORMANCE
Note that the performance information shown in this section assumes that all distributions made by theFund in the period shown were reinvested in additional Units. Also note that the performanceinformation does not take into account sales, redemption, distribution or other optional charges thatwould have reduced returns on performance. The performance of the Fund in the past does notnecessarily indicate how it will perform in the future.
Year-to-Date Returns
The following bar chart shows the Fund’s performance for the period from July 18, 2013 to December31, 2013. The bar chart shows, in percentage terms, how much an investment made on the first day ofthe Period would have increased or decreased by the last day of the Period.
(1) Represents the period from July 18, 2013 (the inception date) to December 31, 2013.
6.12%
-5.00%
0.00%
5.00%
10.00%
15.00%
20.00%
12/31/2013 (1)
Brookfield Global Infrastructure Securities Income Fund
2013 Annual Management Report of Fund Performance | 11
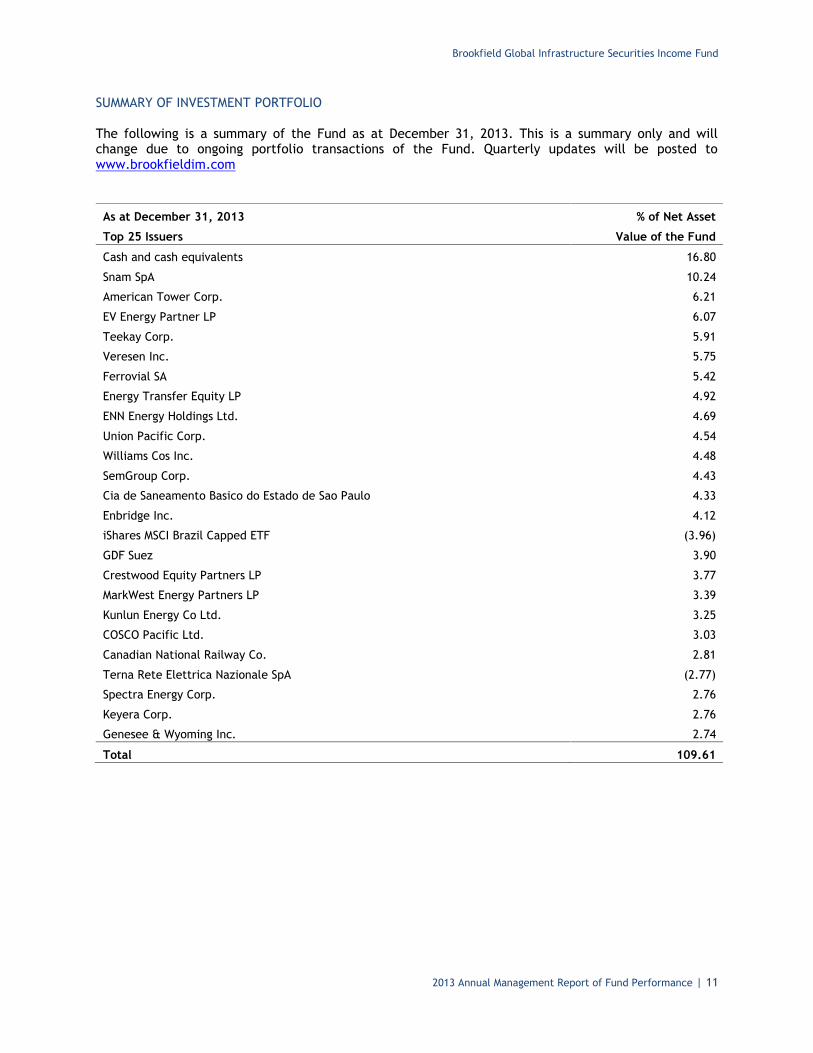
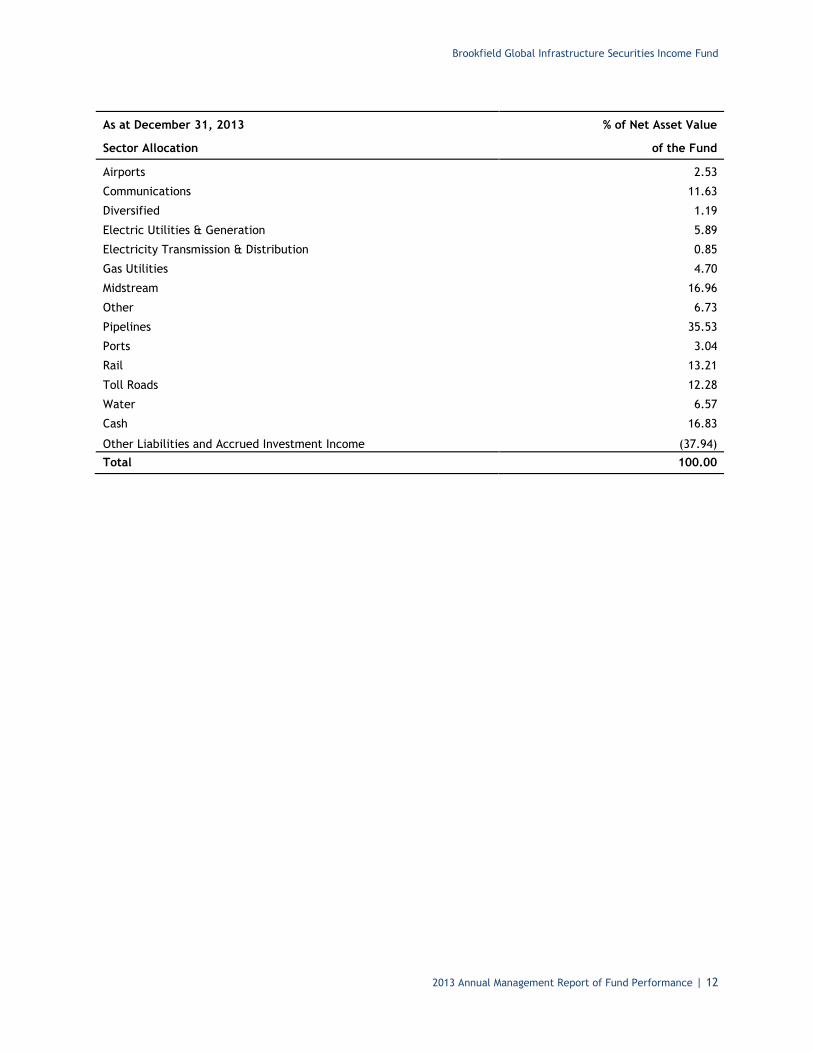
SUMMARY OF INVESTMENT PORTFOLIO
The following is a summary of the Fund as at December 31, 2013. This is a summary only and willchange due to ongoing portfolio transactions of the Fund. Quarterly updates will be posted towww.brookfieldim.com
As at December 31, 2013 % of Net Asset
Top 25 Issuers Value of the Fund
Cash and cash equivalents 16.80
Snam SpA 10.24
American Tower Corp. 6.21
EV Energy Partner LP 6.07
Teekay Corp. 5.91
Veresen Inc. 5.75
Ferrovial SA 5.42
Energy Transfer Equity LP 4.92
ENN Energy Holdings Ltd. 4.69
Union Pacific Corp. 4.54
Williams Cos Inc. 4.48
SemGroup Corp. 4.43
Cia de Saneamento Basico do Estado de Sao Paulo 4.33
Enbridge Inc. 4.12
iShares MSCI Brazil Capped ETF (3.96)
GDF Suez 3.90
Crestwood Equity Partners LP 3.77
MarkWest Energy Partners LP 3.39
Kunlun Energy Co Ltd. 3.25
COSCO Pacific Ltd. 3.03
Canadian National Railway Co. 2.81
Terna Rete Elettrica Nazionale SpA (2.77)
Spectra Energy Corp. 2.76
Keyera Corp. 2.76
Genesee & Wyoming Inc. 2.74
Total 109.61
Brookfield Global Infrastructure Securities Income Fund
2013 Annual Management Report of Fund Performance | 12
As at December 31, 2013 % of Net Asset Value
Sector Allocation of the Fund
Airports 2.53
Communications 11.63
Diversified 1.19
Electric Utilities & Generation 5.89
Electricity Transmission & Distribution 0.85
Gas Utilities 4.70
Midstream 16.96
Other 6.73
Pipelines 35.53
Ports 3.04
Rail 13.21
Toll Roads 12.28
Water 6.57
Cash 16.83
Other Liabilities and Accrued Investment Income (37.94)
Total 100.00

Brookfield Global Infrastructure Securities Income Fund
2013 Annual Management Report of Fund Performance | 13
FUND INFORMATION
MANAGER AND TRUSTEE
Brookfield Investment Management (Canada) Inc.George E. MyhalDirector, President & Chief Executive Officer
Jonathan TyrasManaging Director, Chief Financial Officer, andGeneral Counsel
Gail CecilDirector, Managing Director
Craig NobleDirector
INDEPENDENT REVIEW COMMITTEE
John P. Barratt (Chair)Corporate Director
James L. R. KellyPresidentEarth Power Inc.
Frank LochanCorporate Director
CONTACT INFORMATION
Brookfield Global Infrastructure Securities Income Fund welcomes inquiries from Unitholders, analysts,media representatives or other interested parties.
Investment Manager
Brookfield Investment Management Inc.Brookfield Place250 Vesey Street, 15th FloorNew York, New York10281-1023t. 855.777.8001w. www.brookfieldim.com
Transfer Agent and Registrar
Unitholder inquiries relating to distributions,address changes and Unitholder accountinformation should be directed to the Fund’sTransfer Agent:
Valiant Trust Company710, 130 King Street WestToronto, Ontario M5X 1A9t. 866.313.1872 (toll-free North America)f. 855.375.6916 (toll-free North America)
International 416.360.1646e. [email protected]. www.valianttrust.com