broadband diffusion and firm performance in rural areas ...ftp.iza.org/dp9429.pdf · discussion...
TRANSCRIPT

Forschungsinstitut zur Zukunft der ArbeitInstitute for the Study of Labor
DI
SC
US
SI
ON
P
AP
ER
S
ER
IE
S
Broadband Diffusion and Firm Performancein Rural Areas: Quasi-Experimental Evidence
IZA DP No. 9429
October 2015
Giulia CanzianSamuele PoySimone Schüller

Broadband Diffusion and Firm Performance in Rural Areas:
Quasi-Experimental Evidence
Giulia Canzian FBK-IRVAPP
Samuele Poy
Università Cattolica del Sacro Cuore
Simone Schüller
FBK-IRVAPP and IZA
Discussion Paper No. 9429 October 2015
IZA
P.O. Box 7240 53072 Bonn
Germany
Phone: +49-228-3894-0 Fax: +49-228-3894-180
E-mail: [email protected]
Any opinions expressed here are those of the author(s) and not those of IZA. Research published in this series may include views on policy, but the institute itself takes no institutional policy positions. The IZA research network is committed to the IZA Guiding Principles of Research Integrity. The Institute for the Study of Labor (IZA) in Bonn is a local and virtual international research center and a place of communication between science, politics and business. IZA is an independent nonprofit organization supported by Deutsche Post Foundation. The center is associated with the University of Bonn and offers a stimulating research environment through its international network, workshops and conferences, data service, project support, research visits and doctoral program. IZA engages in (i) original and internationally competitive research in all fields of labor economics, (ii) development of policy concepts, and (iii) dissemination of research results and concepts to the interested public. IZA Discussion Papers often represent preliminary work and are circulated to encourage discussion. Citation of such a paper should account for its provisional character. A revised version may be available directly from the author.

IZA Discussion Paper No. 9429 October 2015
ABSTRACT
Broadband Diffusion and Firm Performance in Rural Areas: Quasi-Experimental Evidence*
This article analyzes the causal impact of advanced broadband accessibility on firm performance. We exploit a unique local policy intervention of a staged broadband infrastructure installation across rural municipalities in the Province of Trento (Italy), generating a source of exogenous (spatial and temporal) variation in the provision of next-generation broadband technology (ADSL2+). Employing a difference-in-differences strategy and using longitudinal firm-level data on annual balance sheet information of corporate enterprises, we show that ADSL2+ availability is associated with a significant increase in annual sales turnover of about 40 percent and an increase in value added of roughly 25 percent over the period of two years. The positive effect is found to be rather stable for different lengths of treatment exposure and across industrial sectors. However, no significant effects are found with respect to number of employees. Placebo estimations support a causal interpretation of our results. Overall, established corporate enterprises in ‘underserved’ rural and remote areas appear to profit considerably from enhanced broadband delivery programs in terms of economic performance. JEL Classification: O33, J24, L24, L26 Keywords: broadband internet, firm performance, quasi experiment, regional development Corresponding author: Simone Schüller FBK-IRVAPP Via Santa Croce 77 38122 Trento Italy E-mail: [email protected]
* We thank conference participants at the 14th IZA/SOLE Transatlantic Meeting of Labor Economists 2015, XXIX Jornadas de Economia Industrial 2014, COMPIE 2014, SIE 2014, AIEL 2014 and seminar participants at CESifo Munich. We also thank Antonio Accetturo, Erich Battistin, Oliver Falck and Enrico Rettore for helpful comments and suggestions. We are grateful to Trentino Network and Telecom Italia for providing us with knowledge and data on the broadband infrastructure diffusion in the Province of Trento, and especially Alessandro Zorer for frequent discussions on the topic. We further thank Adrian Belton who carefully copy-edited the paper. Research has been fully funded by FBK-IRVAPP.

1. Introduction
Spatial cohesion is a paramount objective in many advanced countries. The European Union Co-hesion Policy accounts for roughly one third of the EU’s total budget for the programming periods2007–2013 and 2014–2020 (European Union, 2013; European Commission, 2014b). Yet, notwith-standing the political emphasis and substantial spending on fostering local growth especially indisadvantaged regions, there is no consensus on its impact. In fact, empirical studies have pro-vided mixed results concerning the economic impact of spatially targeted policies in Europe andthe U.S. (see, e.g. the literature reviewed in Becker et al., 2010; Mohl and Hagen, 2010; Accetturoand de Blasio, 2012).
With the emergence of the EU 2020 Strategy, recent developments in EU Regional Policy havefocused on “smart growth”, i.e. growth based on the knowledge economy (European Commission,2010a,b). The provision of fixed broadband infrastructure and in particular the reduction of theso-called “digital divide” between rural and urban areas play a crucial role in this regard. Despitethe increased policy attention to broadband diffusion in rural areas, not much is known about itseconomic impact. Does broadband access improve the local economy in sparsely populated andeconomically disadvantaged areas?
The purpose of this paper is to contribute to the literature concerned with the impact evaluationof broadband delivery programs explicitly targeted on ‘underserved’ rural and sparsely populatedareas. We present a rigorous econometric analysis of the causal impact of broadband availabilityon firm performance by exploiting a unique local broadband delivery program in Italy that cre-ates the conditions for a quasi-experiment. More precisely, we analyze a local policy where thepublic authority in the autonomous Province of Trento (Italy) provided a subsidy to the telecomprovider to finance the installation of broadband access points in (predominantly remote and rural)areas which were not privately supplied. Importantly, this specific policy aimed at the provision ofhigh-speed broadband technology, i.e. connections delivering download speeds of up to 20 Mbpsvia ADSL2+ technology. The staged installation of broadband infrastructures between 2011 and2014 generated a source of exogenous (spatial and temporal) variation in advanced broadband in-ternet provision, which enables us to provide causal estimates of broadband availability effects onfirm performance. Employing a difference-in-differences approach (controlling for year and mu-nicipality fixed effects) enables us to difference away pre-existing location-specific conditions andthereby to identify the independent effect of advanced broadband access on local firm performance.Using longitudinal data on corporate enterprises’ annual balance sheets, we find significant posi-tive effects of ADSL2+ availability on firms’ annual sales turnover and value added, while thereappears to be no significant impact on the number of employees employed in these firms.
1

Recent economic literature concerned with the overall causal impact of broadband penetrationsuggests generally beneficial effects in terms of GDP growth at the macro-level (Czernich et al.,2011) and an increase in the relative labor productivity of skilled versus unskilled workers at themicro-level (Akerman et al., 2015).1 Yet, sound empirical evidence of a causal link between broad-band diffusion and local economic growth in specifically rural or disadvantaged areas is extremelyscant. To our knowledge, only one broadband delivery program explicitly targeting rural areas hasbeen evaluated to date (the US Rural Broadband Loan Program), providing mixed results with pos-itive effects on local employment, wages and firm entry being mainly driven by counties locatedclose to metropolitan areas (Kandilov and Renkow, 2010; Kim and Orazem, 2012). More positiveresults emerge from studies which do not exploit specific policy interventions. Based on propen-sity score matching strategies, Whitacre et al. (2014) find that high levels of broadband adoption inUS rural areas led to increased income growth and unemployment reduction. Kolko (2012) instru-ments broadband expansion in the US with terrain steepness and finds relatively stronger positiveemployment effects in sparsely populated areas compared with urban ones. As regards Europeanevidence, Fabritz (2013) conducts a panel data analysis of broadband diffusion in Germany andfinds overall moderate positive employment effects which are stronger in remote areas.
Our analysis extends the previous literature in several ways. To our knowledge, this is the firststudy to conduct an impact analysis with respect to next-generation broadband technologies. Notethat previous causal evidence concerns the impact of the very first generation of asymmetric digitalsubscriber line (ADSL) technology: that is, the introduction of internet connections with downloadspeeds exceeding 256 Kbps. In recent years, however, much faster broadband speeds of up to20 Mbps have become standard in OECD countries, with fast and ultra-fast connections (deliveringspeeds of up to 30 and 100 Mbps respectively) becoming more and more popular (Digital AgendaScoreboard, 2014). With a view to the constant improvement of infrastructure standards, policymakers are increasingly concerned with the urban-rural digital divide and the related risk that ruralareas may permanently lag behind in terms of the availability and adoption of advanced broadbandtechnology.2
Second, we exploit a rare local broadband delivery policy as a quasi-experiment to estimatecausal effects. Generally, estimating causal effects in the context of broadband provision has
1Only very few studies evaluate causal effects at the micro, i.e. firm level, providing mixed evidence (see, forinstance, Haller and Lyons, 2014; Bertschek et al., 2013; Colombo et al., 2013; De Stefano et al., 2014).
2In fact, while considerable progress has been achieved in reducing the digital divide with respect to basic broad-band coverage, the rural-urban gap remains substantial with respect to next-generation fast and ultra-fast broadbandtechnologies, with 18.1 percent rural coverage compared to 62 percent among all EU households (European Commis-sion, 2014a).
2

proved difficult due to endogeneity issues. In fact, firms’ broadband adoption is likely to be cor-related with unobservable determinants of firm productivity that are difficult to difference awayin empirical strategies. The top-down approach of a broadband delivery program may help gen-erate exogenous variation in broadband access, which enables the estimation of causal effects.However, explicit broadband delivery programs are rare. Broadband infrastructure installation ismarket-led in most countries, with policy mainly focusing on issues of regulation and competitionrather than supply (see the discussion in What Works Centre for Local Economic Growth, 2015).Our approach is close to that of Akerman et al. (2015), who exploit the Norwegian National Broad-band Programme, in which the state-owned telecom company Telenor rolled out broadband accesspoints across the country over the period 2000–2008.
Third, we provide an extremely rare impact evaluation of a program explicitly targeting ruraland sparsely populated municipalities. The only other program evaluations of which we are awareconcern the USDA Rural Broadband Loan Program in the US. To our best knowledge, we are thefirst to evaluate a local rural broadband initiative in Europe.
Our results suggest that established corporate enterprises in rural areas benefit substantiallyfrom access to advanced broadband technology, at least in the short- to medium-run (two yearsafter program start). The positive effect is found with respect to annual sales turnover and valueadded, and it appears to be rather stable across industrial sectors. However, no significant effectsare found with respect to the number of employees employed in corporate enterprises. We performdetailed robustness checks which confirm the plausibility of the common trend assumption under-lying our identification strategy. Overall, our findings are consistent with the view that the impactof advanced broadband provision on local economic growth in rural and remote areas is positiveand substantial.
The paper is structured as follows. Section 2 provides a detailed description of the publicprogram, as well as tests and discussion of the key identifying assumption. Section 3 presents theempirical strategy and the data used. Section 4 sets out the results, and Section 5 concludes.
2. Institutional Background
2.1. The Policy
Decreasing the so-called ‘digital divide’ and the speedy diffusion of new internet technologies areamong the key objectives of the EU 2020 initiative. The situation in Italy is rather diversified:while the south of the country remains well below the European average, several regions in thenorthern part are on a par with the most technologically developed European regions. Amongthese, the Province of Trento stands out with the highest percentage of broadband availability for
3

households and firms (ISTAT, 2013). In fact, the digital divide with respect to the accessibilityof first-generation broadband technologies (download speeds up to 2 Mbps) had already beenovercome by 2010 via fixed (ADSL) or wireless infrastructure diffusion across the entire territory.
Yet, by 2010, next-generation ADSL2+ broadband technology (up to 20 Mbps) had only beenavailable in the 56 principal urban municipalities of the province (such as Trento, Rovereto or Rivadel Garda). In the remaining 167 more rural and remote areas of the region, Telecom Italia – themajor ICT provider in Italy – had no economic interest in investing to equip local access points withthe advanced technology. In order to remedy this market failure and reach 100-percent coveragewith next-generation broadband access via a service of up to 20 Mbps, the public authority decidedin September 2010 (Reg.delib.n. 2204 and n. 2528) to issue a public tender investing over 8.4million euros. The tender was won by Telecom Italia, and it financed the equipment of 184 localaccess points serving the 167 municipalities not already provided with the ADSL2+ technologyfor high speed broadband access.
It is evident from Table 1, displaying the main demographic, economic and geographic charac-teristics of municipalities addressed and not addressed by the policy (measured in the pre-programperiod), that the former are relatively less urbanized, less economically active, and geographicallymore remote. In what follows, our analysis focuses exclusively on firms located in the 167 munic-ipalities addressed by the broadband diffusion policy. We therefore exclude the more urban mu-nicipalities in the Province of Trento, which, by 2010, had already been equipped with ADSL2+access points by private initiative. Consequently, we estimate effects of broadband diffusion onfirm performance in relatively remote and rural areas.
Table 1 about here
Of particular importance in the context of this study is that the broadband expansion policyincluded no guidelines about roll-out timing or geographical diffusion, i.e., the local authorityhad neither territorial nor temporal ordering preferences with respect to the roll out. The mainconcern of the administration was to ensure the universal diffusion of the advanced broadbandinfrastructure, and to make sure that this was accomplished in a relatively short amount of time,preferably no later than December 2013 (in order for the Province to comply with the Europe 2020objectives). Neither municipal authorities nor firms or residents in the municipalities addressedby the program could influence the roll-out timing or ordering. Moreover, Telecom Italia itselfprobably had no interest in an ordering that reflected the economic characteristics of municipalitiessince the strategically most important areas for profit purposes were already covered pre-policy,and due to the fact that all the municipalities addressed would in any case be covered within a
4

relatively short period of time. The roll-out of broadband access points started in early 2011.Complete coverage was achieved by end-January 2014.
According to Telecom Italia, the main factors determining the roll-out timing were the technicalfeatures of pre-existing internet technologies available in the municipalities addressed by the pol-icy. As mentioned above, at the time of program start all municipalities were equipped with somesort of first-generation broadband technology, via either fixed (ADSL) or a wireless infrastructure.Technically, it was convenient for Telecom Italia to start the roll-out of next-generation broadbandin those access points where a fixed ADSL infrastructure was already available. In fact, at the startof the program in spring 2011, about 85 percent of municipalities addressed by the policy had ac-cess to an ADSL infrastructure of either up to 7 Mbps (66.5 percent) or up to 1.2 Mbps (so-calledADSL-Lite) connectivity (18.6 percent) (see Table 1). Both types of infrastructures were, withrespect to delivered speed, notably inferior to the ADSL2+ technology (delivering up to 20 Mbps)installed via the public program.
Figure 1 about here
As displayed at the bottom of Table 1, 88 percent of municipalities addressed by the policy hadbeen ‘treated’ with an average of about 280 days of advanced broadband exposure by end-2012.Figure 1 depicts treatment status and treatment intensity across municipalities as of end-2012. Inparticular, treatment intensity is defined as the number of days that a municipality was exposed toADSL2+ broadband accessibility in the time period between program start (defined as the date ofthe first observed activation) and end-2012.3 Black areas indicate municipalities that have not beensubject to the broadband diffusion policy and hence are excluded from our analysis.
Figure 2 about here
Figure 2 displays the sample distribution of treatment intensity among municipalities addressedby the policy. It evidences considerable variability in treatment intensity, with peaks of activationat around 0, 200, 400 and 600 days after the program’s start.
3Note that each municipality can in principle be covered by more than one access point with potentially differentADSL2+ activation dates. De facto, around 42 percent of the municipalities in our sample are covered by a singlebroadband access point. In another ca. 44 percent of the municipalities a single access point covers more than 80 per-cent of the municipal territory. In these cases, we assign each municipality the activation date of the access pointwhich mainly covers the territory. In the remaining ca. 14 percent of municipalities we take a conservative approachby assigning each municipality the earliest activation date among those access points which cover at least 20 percentof the municipal territory. Note that this approach introduces, if at all, a downward bias in our estimates since weoverstate the days of ADSL2+ exposure for part of the territory.
5
2.2. Assessing the Exogeneity of Roll-out Timing
Although the ADSL2+ broadband diffusion was not explicitly designed as a randomized exper-iment, the program features described above suggest that the roll-out timing was likely exoge-nous to key correlates of local firm performance: the program was implemented top-down withoutstrategic input from the municipal authorities or Telecom Italia and with no provision for firms orresidents to request earlier equipment of access points. In fact, it was clear that within a relativelyshort time-frame of little more than two years all municipalities addressed by the policy wouldbe equipped with the ADSL2+ technology. Hence, demand factors are unlikely to have played adirect role in roll-out timing. However, we know from Telecom Italia that a pre-existing ADSLinfrastructure (which was present in the large majority of the municipalities) speeded up the physi-cal installation of broadband access points for technical reasons. Although clearly pre-determinedwith respect to the ADSL2+ policy, the pre-existing broadband infrastructure is unlikely to havebeen randomly allocated since – other than the policy analyzed here – the installation of previousADSL technology was a private initiative and hence profit-oriented.
As a first step in assessing whether the data are overall consistent with exogenous roll-outtiming, we examine the relationship between roll-out timing and municipalities’ productive char-acteristics measured in the pre-policy period. In particular, we regress both a binary treatmentindicator and a measure of treatment intensity on pre-policy municipality characteristics. Bothvariables reflect municipalities’ roll-out status as of end-2012. Binary treatment indicates whetheror not a municipality had been equipped with the ADSL2+ technology by end-2012. Treatmentintensity is defined as the number of days a municipality was exposed to ADSL2+ access fromprogram start until end-2012. The latter measure is divided by 30 throughout the analysis to easeinterpretation.
The pre-policy municipality characteristics employed in this exercise include information ondemography, industrial structure, geography and measures of the pre-policy presence of a previ-ous ADSL technology. The latter indicate whether or not a municipality had access to a 7 Mbpsor “Lite” (1.2 Mbps) ADSL technology by 2010. Demographic characteristics include residentpopulation density, employment rate, share of high-educated residents and share of residents aged65 and over. As measures of industrial structure we use the number of firms and sector-specificemployment share. The geographical indicators are municipal altitude and distance to the nearestmotorway. The municipality-level information on demography and industry structure are drawn
6

from the Italian Population Census and the Italian Industry Census of 2001.4 Besides the informa-tion from the 2001 censuses, we also include the 10-year growth rates in resident population andlocal employment over the pre roll-out period from 1991 to 2001.
Table 2 about here
Table 2 displays the estimated coefficients. None of the included demographic, economic orgeographic pre-policy characteristics appear to be significantly correlated with the roll-out timingof the ADSL2+ policy – neither when employing the binary treatment indicator (Column 1) norwhen employing the continuous measure of treatment intensity (Column 2).5 However, the indica-tors of pre-policy presence of a 7Mbps or “Lite” ADSL infrastructure appear to be positively andsignificantly related to earlier roll-out timing. Since the installation of pre-policy ADSL infrastruc-ture was market-led and hence potentially non-random, we cannot exclude that roll-out timing wassystematically associated with observed or unobserved local productive characteristics in ways thatpotentially confound a causal interpretation.
Taken together, the evidence suggests that the ADSL2+ policy cannot exactly be treated like arandomized experiment, in which case a mean-comparison between firm outcomes in municipali-ties with differential roll-out timing would be sufficient to identify causal effects. Instead, any ef-fort to measure the causal impact of advanced broadband availability must control for pre-existinglocation-specific fixed factors that influence the profitability of broadband provision. We conse-quently apply a difference-in-differences identification strategy which controls for municipalityand year fixed effects. That is, we abstract from time-invariant differences across municipalitiesand instead exploit differences in within-municipality variation over time. This strategy allowsroll-out timing to be associated with municipality characteristics that are stable over time, but itcrucially relies on the assumption that ADSL2+ roll-out timing was exogenous with respect to dif-ferent underlying trends in economic performance across municipalities (the so-called “common-trend assumption”). In other words, we assume that – in the absence of the ADSL2+ policy – therewould have been no difference in average trends of firm-performance between municipalities withearlier or later roll-out timing. In the context of our policy of interest, this assumption seems rather
4Both censuses are decennial. See summary statistics in Table 1; and for further details on data sources andvariable definition see Table A1 in Appendix. We refrain from using the 2011 census to assess exogeneity sinceroughly 44 percent of the municipalities addressed by the policy had been equipped with ADSL2+ by end-2011;hence 2011 cannot be treated as ‘pre-policy’.
5Furthermore, the tests reported at the bottom of Table 2 suggest that the null-hypothesis of no joint significanceof these covariates cannot be rejected.
7

plausible: whatever correlation existed between roll-out timing and relevant municipality charac-teristics (due to market-led installation of previous technology), it is plausible to assume that thiscorrelation did not systematically change with the introduction of the ADSL2+ technology.
The common trend assumption is typically tested by examining pre-policy trends in the out-come of interest. If the common-trend assumption holds, we should observe no differential trendaccording to roll-out timing prior to the actual roll-out. Before turning to a more detailed test ofthe common-trend assumption with respect to our main outcome of interest in Section 4.2, weexamine whether this assumption plausibly holds with respect to some key correlates of local eco-nomic performance. In particular, we again exploit information from the population and industrialcensuses 1991 and 2001 and regress log population density as well as log number of firms on ourbinary (continuous) treatment variable interacted with census year, and – importantly – controllingfor municipality and year fixed effects.
Table 3 about here
Table 3 reports the estimation results. Of importance as a test of the common trend assumptionis the coefficient on the interaction of our respective binary and continuous measures of roll-outtiming and the dummy variable for the year 2001. This coefficient indicates whether ADSL2+ roll-out was significantly related to different pre-policy trends (1991-2001) in urbanization and size ofprivate sector. This does not seem to be the case, which supports the common trend assumption.We also perform this exercise with respect to industrial structure, obtaining similar results (seeTable A2 in Appendix).
Overall, the results reported in Table 3 and A2 lend substantial support to the argument thatthe policy intervention generated geographical and temporal variation in ADSL2+ availabilitywhich was exogenous to underlying trends in local economic performance – conditional on time-invariant municipality characteristics. A further, more detailed test of the exogeneity assumption ispresented in Section 4.2, where we show the zero-effects of a placebo roll out on firm performancein the pre-policy period.
3. Empirical Setup
3.1. Empirical Strategy
Our empirical approach relies upon the unique policy intervention of a staged broadband infrastruc-ture installation across municipalities in the Province of Trento, generating a source of exogenousspatial and temporal variation in advanced broadband accessibility. We use the exogenous roll-out timing of ADSL2+ broadband technology as a quasi-randomized experiment to avoid biased
8

estimates due to the correlation between broadband access and unobserved determinants of firmproductivity.
As discussed in Section 2.2, we exploit panel data to follow an identification strategy whichcontrols for municipality and year fixed effects. In a first specification, we apply a difference-in-differences approach employing a binary treatment indicator. That is, we compare annual firmperformance between firms located in treated and not-yet treated municipalities in the second yearafter program start (2012), relating them to the same firms’ pre-policy performance two yearspreviously (2010).
In a second specification, we employ a continuous treatment measure indicating the number ofdays that a municipality had been provided with ADSL2+ broadband access from the start of thepolicy intervention until end-2012. Thus, we compare growth in outcomes between 2010 and 2012of firms experiencing diverse levels of treatment intensity, i.e. more or fewer days of exposure toadvanced broadband access. The estimation equation is specified as
lnyimt = β0 +β1Treatmt +[β2Treat2mt ]+ γm +λt +ω
′imt + εimt , (1)
where lnyimt represents a measure of annual performance of firm i in municipality m in year t
(with t = [2010;2012]). Treatmt indicates the treatment status of firms located in municipality m
by the end of year t. Depending on the specification, we define the treatment status either in abinary way indicating whether firms located in municipality m in year t had access to ADSL2+broadband, or as a continuous treatment, i.e. the number of days of exposure to broadband acces-sibility as of the end of year t. In the case of the continuous treatment intensity measure, we alsoadd (a) a specification including a squared term Treat2
mt and (b) a specification employing treat-ment intensity categories in order to investigate potential nonlinearities in the impact of treatmentintensity.
Unobservable factors of firm performance that are fixed at the municipality level are controlledfor by municipality fixed effects (γm); common time shocks are absorbed by the year indicator (λt).Our preferred specification includes firm fixed effects instead of municipality fixed effects (whichdoes not contribute to identification of our parameter of interest because the treatment is defined atmunicipality level, but it helps to increase the precision of the estimate). The vector ω includes a setof industrial sector indicators (2-digit). εimt is a time-varying idiosyncratic error term. Through-out the empirical analysis, standard errors are clustered at the municipality level and robust toheteroscedasticity.
9

The parameter β1 (and β2) estimates the causal effect of interest under the common trendassumption. This parameter is identified through variation in firms’ performance levels between2010 (pre-policy) and 2012, and the comparison of this difference either between the group offirms located in municipalities with and without broadband access by end-2012 (in the case ofbinary treatment) or firms located in municipalities with different treatment intensity (in case ofthe continuous treatment measure). Note that the causal effect is thus identified by variabilityacross municipalities since our treatment (broadband accessibility) varies at municipality level.The key identifying assumption is that the trend in outcomes would be the same for firms located inrelatively earlier and later treated municipalities in the absence of treatment. We conduct a placeboanalysis for the pre-policy years 2008 – 2010 to test whether the common trend assumption isplausible in this context.
3.2. Data
Our analysis employs a unique dataset which combines data from two main sources. Importantly,Telecom Italia provided us with municipality-level data on the spatial diffusion and timing ofbroadband infrastructure installations in the Province of Trento. Second, we use the full version ofthe AIDA dataset (Analisi Informatizzata Delle Aziende), which is a commercial database on Italianfirms maintained by Bureau van Dijk. The data covers the full universe of corporate enterprises andcontains detailed balance sheet information on firms’ annual output (such as revenues and valueadded) and inputs (such as capital, labor, etc.), as well as other information on location, industrysector or year of foundation. Corporate enterprises represent roughly 13.2 percent of firms (PATStatistical Office, 2014) and cover approximately 41.9 percent of total employees in the Provinceof Trento according to the ISTAT Industrial Census 2011.
The main outcome of interest is firms’ annual turnover, that is, total sales income. We opt toanalyze variations in annual turnover since these best capture overall changes in firm performance.Additional analysis presented in Section 4.3 provides results with respect to firms’ value added andnumber of employees.
This analysis concerns the “non-farm” business sector: that is, we exclude corporate enterprisesin agriculture and public services.6 For the period of analysis (2008 – 2012) we then restrict oursample to firms located in those municipalities in the Province of Trento that have been addressedby the ADSL2+ policy (see the detailed list in Reg.delib.n. 2528 All.1). Among those firms, wefurther focus on those that filed annual balance sheets in 2012 and were founded before 2006 (that
6Finance and insurance is also excluded due to the low number of corporate enterprises present (no more than 7in a given year).
10

is, firms that had been in business for at least 5 years in 2010) in order to prevent our results beingaffected by relatively higher volatility among recent start-ups. To reduce the influence of outliers,we delete firm-year observations with unusually high or low values of annual turnover (outside the1%–99% range). Table A3 in Appendix contains the summary statistics of our final estimationsample.7
4. Results and Discussion
4.1. Baseline Results
Table 4 presents first evidence of an impact of the ADSL2+ policy on firm performance. Weprovide results for two samples: first, an unbalanced panel (Columns 1–3) and second, a balancedsample in which we only include firms observed in 2010 as well as in 2012 (Columns 4–10). Theestimations presented in Columns 4–6 include municipality fixed effects, whereas Columns 7–10show results from models employing firm fixed effects instead of municipality fixed effects.
Columns 1, 4 and 7 of Table 4 set out the results obtained from estimating Model (1) and em-ploying a binary treatment indicator. This specification corresponds to a difference-in-differencesapproach: while the coefficient on Year=2012 indicates the bi-annual turnover growth experiencedby firms located in (by end-2012) not-yet treated municipalities, the coefficient on the exposuredummy indicates the difference in outcome growth between the not-yet treated and treated mu-nicipalities (difference-in-differences estimate – β1 in Model (1)). Estimates for both unbalancedand balanced sample as well as estimates with municipality or firm fixed effects are statisticallyhighly significant, positive and of considerable size. Overall, the estimated effect magnitude isvery similar across balanced and unbalanced samples and for models with municipality and firmfixed effects: the estimate suggests that ADSL2+ availability is on average related to a roughly 40percent increase in annual turnover over the period of two years. Note that this is an average effectover firms residing in ‘treated’ municipalities with differential exposure (treatment intensity) tobroadband availability in the period 2010–2012.
Table 4 about here
The results reported in Columns 2, 5 and 8 of Table 4 employ the continuous measure oftreatment intensity instead of a binary treatment indicator. For the unbalanced sample, these linear
7Throughout the paper, all monetary values are fixed at 2010 level after adjusting for inflation. We used a valueadded deflator which stems from elaborations on regional economical accounts data and is defined at the sectoral level(see Podesta (2010) for more details).
11

estimates of treatment intensity effects suggest that an additional 30 days of exposure to ADSL2+broadband access increased firms’ annual turnover on average by about 1.5 percent within twoyears (Column 2). For the balanced sample, the linear estimate of treatment intensity decreases insize and is not statistically significant. However, it is apparent from Columns 3, 6, 9 and 10 thatthe effect is not monotonically increasing with treatment intensity, but is instead nonlinear in someway.
Nonlinearities could potentially be explained by the timing of firms’ adoption behavior withinmunicipalities. The intensive margin of ADSL2+ adoption may become very small close to thesaturation point, resulting in a nonlinear relationship of some kind between broadband infrastruc-ture and economic benefits. For example, if relatively more motivated firms adopt the advancedbroadband technology earlier than others, and if more motivated entrepreneurs also adopt moresuccessfully, we can imagine the following situation for two municipalities A and B: at end-2012,municipality A has been treated for one month, whereas municipality B has been treated for tenmonths. If the most motivated entrepreneurs start adopting first, and subsequently also the lessand less motivated ones, then we should expect a relatively larger share of highly-motivated en-trepreneurs among the adopters in municipality A than in municipality B. If at the same time moremotivated entrepreneurs gain relatively more from advanced broadband adoption, this would re-sult in a nonlinear pattern of the positive effect of ADSL2+ exposure. However, due to the lack ofdata on firms’ technology adoption and its timing, this potential explanation of effect nonlinearitycannot be investigated directly and must remain tentative.
To investigate the nonlinear shape of treatment intensity effects on annual turnover, we employboth a quadratic polynomial and a ‘category’ specification. The latter imposes fewer assumptionsabout the shape of effects and contains indicator variables for five treatment intensity groups basedon days of ADSL2+ exposure by end-2012. The categories are: 1) zero exposure (base group), 2)exposure up to 6 months, 3) more than 6 months and up to 12 months, 4) more than 12 months andup to 18 months, and 5) more than 18 months of exposure (for summary statistics see Table A3 inAppendix). Columns 9 and 10 of Table 4 report the results of both specifications for the balancedsample and Figure 3 graphically illustrates the respective estimated treatment intensity effect.
Figure 3 about here
First, it is apparent that effects are not short-term: they persist and are positive over the fullrange of exposure intensity. Moreover, the results from the category specification show that thepositive effect is rather stable at around 40 percent for the different levels of exposure intensity.Hence, imposing a quadratic shape that suggests diminishing effects with increasing exposure
12

might not be an entirely appropriate way to describe the actual shape of treatment intensity effectscorrectly.
Our preferred estimates set out in Table 4 are based on firm fixed effects models (Columns 7–10). With respect to models employing municipality fixed effects (see Columns 4–6), there appearsto be no considerable change in the point estimates of the treatment effects (which is to be expectedsince treatment is defined at the municipality- and not the firm-level), yet with a slight increase inprecision.
Overall the results presented in Table 4 suggest substantial and significant revenue-enhancingeffects of advanced broadband accessibility. First, having or not having access in the two yearsfrom policy-start results in significant outcome differences amounting to 40 percent on average.Second, the treatment effect appears to be rather constant across different broadband exposureintensities.
At this point, it is important to bear in mind that we estimate the impact of ADSL2+ avail-ability exclusively for corporate enterprises and for firms located in the relatively rural and remotemunicipalities. Our results consequently provide some support for recent empirical evidence sug-gesting that rural areas may benefit from the provision of new broadband technologies (see e.g.Kolko, 2012; Fabritz, 2013; Whitacre et al., 2014); yet we cannot evaluate whether they benefitmore or less strongly than urban areas do.
4.2. Placebo Test – Assessing the Common Trend Assumption
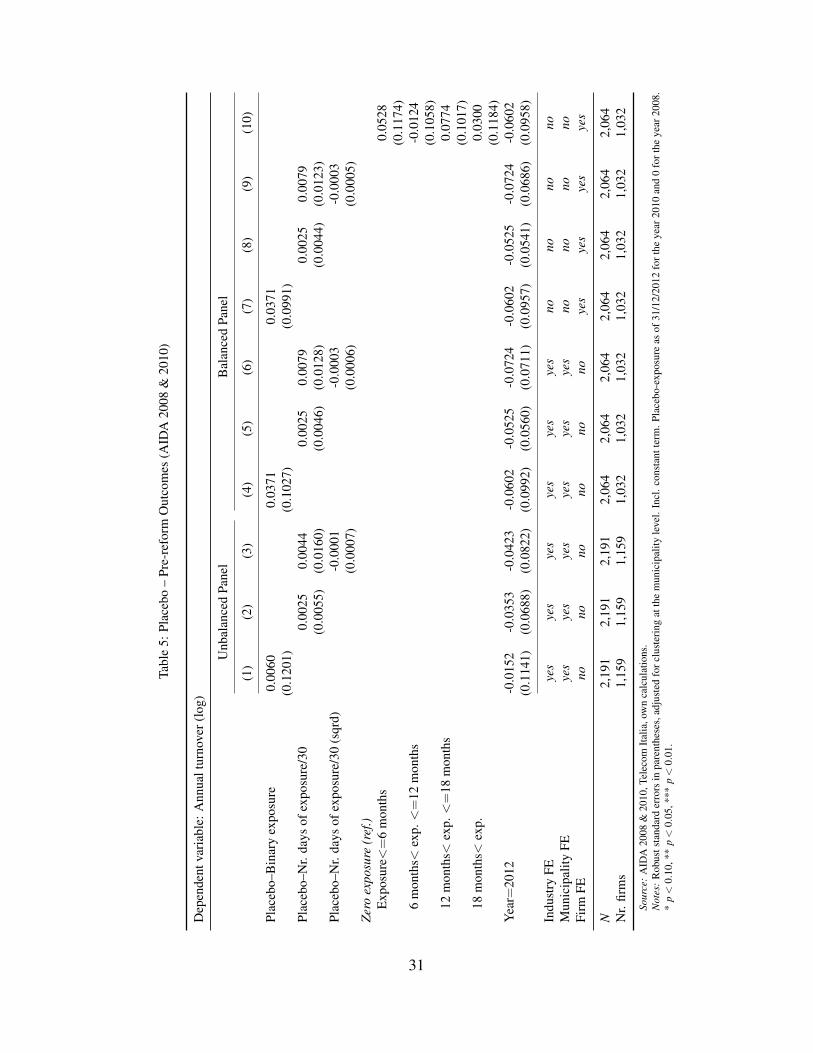
Table 5 reports the results of a placebo analysis testing the common trend assumption underlyingour empirical identification strategy. The idea is to analyze turnover growth for the pre-policyyears 2008 and 2010 by assigning treatment measures, both binary and continuous, as if the pol-icy took place between 2008 and 2010 (as opposed to 2010 and 2012). We then adopt the sameempirical strategy as in the main analysis described above, regressing annual log turnover on thefake measures of placebo treatment. This strategy provides a powerful test of the important iden-tifying assumption that the effects discussed above are in fact caused by the policy intervention(providing broadband availability) and not by any other underlying difference between municipal-ities treated relatively later or earlier. If such underlying differences not related to the policy itselfexist, we should find them also in the absence of the treatment. The placebo analysis performed inthe pre-policy period is one way to test this assumption directly.
Table 5 about here
The results shown in Table 5 indeed suggest that we can rely on our identifying assumptionof common trends in the outcome variable. Firms in municipalities ‘fake-treated’ earlier are not
13

significantly different (in terms of turnover growth) from firms located in late-treated municipalitiesin the actual absence of the policy, i.e. in a pre-policy period. This finding holds for the unbalancedas well as the balanced sample and for both models employing municipality fixed effects and firm-fixed effects models.
Table 6 reports the results of a similar test of the common trend assumption employing data forthe full period 2008–2012. We again employ measures of binary as well as continuous treatment.However, in contrast to the above analysis, we use time-invariant treatment measures (binary andcontinuous) fixed at municipalities’ treatment status by end-2012.
Before we turn to a regression-based test, Figure 4 provides graphically descriptive evidencein support of the common trend assumption. On plotting average trends in our outcome of inter-est separately for control and treatment municipalities (according to their binary treatment statusby end-2012), we clearly see parallel trends in the pre-policy period and deviating trends in thepost-policy period (2010 is the year of policy start). Note that the post-policy period coincideswith a period of economic recession, which might explain the downward trend of average firmperformance in control municipalities. In comparison, firms in treatment municipalities show amore stable trend in the years after policy-start.
Figure 4 about here
Table 6 about here
Table 6 displays the results from firm-fixed effects models for a balanced and an unbalancedsample. The interaction of interest for assessing the common trend assumption are “Year=2009 ×exposure” and “Year=2010 × exposure”. The statistical significance of the estimated coefficienton these interactions indicates whether there are differences in trends of annual turnover (withrespect to base year 2008) between late- and early-treated municipalities already in years beforethe actual ADSL2+ program start. We expect both groups of firms to differ only in the years afterprogram start (in 2011) and we expect there to be no differences before program start. Indeed,the results shown in Table 6 support the common trend assumption in that the coefficients oninteractions for the years 2009 and 2010 are not statistically different from zero, neither in thecase of our binary treatment nor when a continuous treatment measure is employed. Overall, theseresults reinforce the common trend assumption and hence the causal interpretation of the estimatesreported in Table 4.
4.3. Value Added and Employment
This section describes the results with respect to two additional outcomes: firms’ annual valueadded and the number of employees. With respect to the sample employed in our main analy-
14
sis of firms’ annual sales turnover, we respectively discard firm-year observations with negativevalue added (127 observations) and observations with missing information on the number of em-ployees (192 observations). Moreover, we present results on samples that are balanced with re-gard to the respective outcome.8 Concerning the employment estimations, we choose to employlog(nr.employees+ 1) as the dependent variable due to the large number of firms with zero em-ployees in the sample (roughly 50 percent).
Table 7 about here
Panel A of Table 7 presents the estimation results with respect to annual value added (Columns 1–4) and number of employees (Columns 5–6). With the difference-in-differences specification em-ploying a binary treatment indicator, ADSL2+ availability appears to be associated with a signifi-cant increase in value added of roughly 25 percent over the period of two years (Column 1). Thisis about 62 percent of the effect magnitude found for annual sales turnover. On the other hand, wefind no significant effect on the number of employees (Column 5).
On employing the continuous treatment intensity measure, the estimates suggest that an addi-tional 30 days of exposure to ADSL2+ broadband access on average increased firms’ annual valueadded by about 1 percent within two years (Column 3).
Further exploring nonlinearities in the treatment intensity effect, we find that the squared termof treatment intensity in the quadratic specification is not significant. Also the category specifica-tion and graphical illustrations of the effect shape displayed in Figure 5 indicate that the treatmentintensity effect is slightly more linear with respect to value added than what we found for annualturnover. However, the results of the category specification (Column 4) show no strict monotonyof treatment intensity effects. Overall, we cannot exclude constant effects of around 25 percentirrespective of treatment intensity.
No significant relationship is found in regard to employment, neither in the linear specifi-cation of treatment intensity nor with quadratic polynomials or treatment intensity categories(Columns 6–8, see also Figure 6).
Figure 5 about here
Figure 6 about here
8Results on unbalanced samples and employing municipality fixed effects instead of firm fixed effects are quali-tatively similar and available upon request.
15

Panel B Table 7 shows the results of placebo estimations analogous to the placebo analysiswith respect to our main outcome annual turnover in Section 4.2. The results clearly support thecommon trend assumption also for the outcome of value added and the various specifications. Inregard to number of employees, the common trend assumption is borne out overall. 9
4.4. Effect Heterogeneity
In view of the substantial treatment effects that we find in regard to corporate enterprises’ annualsales turnover and value added, it is important to analyze heterogeneous effects across several typesof firms and also with respect to potentially relevant municipality characteristics. The question weattempt to answer is whether factors such as industrial sector, municipalities’ degree of urbaniza-tion, or presence of a previous ADSL infrastructure are related to the extent to which firms benefitfrom ADSL2+ accessibility.
Table 8 about here
Panel A of Table 8 is concerned with effect heterogeneity with respect to firms’ industrialsector. We focus on the overall treatment effect, i.e. we employ the difference-in-differencesspecification and estimate treatment effects for each industrial sector category separately. Estima-tions are performed on balanced panels and include firm fixed effects. Importantly, we allow forindustry-specific treatment effects. Reported below are the results of F-tests testing the equalityof each coefficient with respect to the estimated treatment effect for the sector “Manufacturing,mining (B,C)” (the most numerous sector in our sample, see Table A3 in Appendix).
In the case of annual sales turnover (Column 1), we find that ADSL2+ accessibility signif-icantly increased sales turnover of corporate enterprises in the manufacturing sector by around30 percent. This effect is statistically similar for most of the other sectors except “Hotels, restau-rants (I)” and “Professional, scientific, technical and administrative activities (M,N)”, for whichwe find significantly stronger effects of around 50 and 55 percent respectively. It makes intuitivesense that the hospitality/tourism sector can profit most from booking and marketing applicationswhich require high-speed internet access. Also the finding of stronger effects for professional, sci-entific, technical and administrative activities is not surprising since this category likely includeshigh-skilled professionals whose productivity return on ADSL2+ might be substantial.
With respect to firms’ annual value added (Column 2), ADSL2+ accessibility has a significantand positive effect of about 21 percent for manufacturing enterprises. F-tests confirm that the effect
9Only the ‘placebo’–treatment intensity category of 6–12 months proves to be statistically significant in the ab-sence of actual treatment. Note, however, that statistical significance is weak (at the 10 percent-level).
16
magnitude in other sectors is not statistically different from this estimate. The estimated effectfor “Hotels, restaurants (I)” is with ca. 30 percent relatively stronger, but the difference is onlymarginally statistically significant at the 10-percent level. The results for number of employees(Column 3) by and large confirm the previous finding of no significant overall ADSL2+ effect forthe single sectors. Once again the exception is the sector “Hotels, restaurants (I)”, which appearsto have experienced a very strong increase in employees of about 63 percent. This might partlybe explained by the strong treatment effect that we find for this sector with respect to turnover(almost 50 percent) and value added (almost 30 percent). Additionally, the hospitality sector istraditionally relatively more reactive in terms of hiring and firing than other sectors.
In Panel B of Table 8 we report the results of interacting the treatment effect with an indicatorof sectoral technology intensity. We define high-tech sectors based on 2-digit industrial sector andaccording to the classification described in EUROSTAT (2015). Only around 11 percent of firms inour sample are active in a high-tech sector (see also Table A3 in Appendix). In fact, with respect toannual turnover and value added (Columns 1 and 2), we find that effects of ADSL2+ accessibilityare not statistically different for firms in high-tech sectors compared with others.
Table 9 about here
Table 9 shows potential interactions of the ADSL2+ treatment effect with the pre-policy pres-ence of ADSL infrastructures of less speed (ADSL Lite and 7Mpbs) and degree of urbanizationand remoteness of municipalities. The former is motivated by the assumption that firms with pre-vious access to a fixed ADSL infrastructure, even of much lower velocity, may react differentlyto the introduction of access to a high-speed ADSL2+ technology than firms in locations lackingany ADSL infrastructure. We examine the association between urbanization and remoteness be-cause previous literature for the US has shown that, particularly in rural areas, broadband effectsare stronger in locations closer to metropolitan areas and with higher population density (Kandilovand Renkow, 2010; Kim and Orazem, 2012). Fabritz (2013) conversely finds for Germany thatpositive employment effects of broadband diffusion are stronger in remote areas.
With regard to pre-policy ADSL we find no differential treatment effects for firms in mu-nicipalities with or without previous exposure to ADSL infrastructures of minor velocity. Theresults concerning urbanization and remoteness are interestingly opposite in sign: whereas thepositive effect on turnover increases significantly with road distance to the regional capital (ourmeasure of remoteness), the effect also increases with population density (our measure of urban-ization). Hence, both more urbanized and more remote (rural) areas seem to benefit relativelymore strongly from ADSL2+ accessibility. There appears to be no such effect heterogeneity with
17

respect to value added. Interestingly, in the case of employment effects, we find that the interactionterm of treatment and remoteness is significant and positive, whereas the interaction of treatmentand urbanization is significant and negative. We would accordingly expect positive employmenteffects, if at all, in the most remote and least urbanized areas, which would be in line with thefindings of Fabritz (2013) in Germany.
5. Conclusions
There is substantial and increasing policy attention to public investment in broadband infrastructure.The underlying assumption in this policy debate is that the availability of broadband technology isbeneficial for local economic growth. Yet there is little empirical evidence of a causal impact oneconomic performance at the firm level. Moreover, it is unclear whether beneficial effects wouldprevail (or even be stronger) in rural areas and whether there would be similar effects for the intro-duction of new-generation broadband technologies.
We provide micro-level evidence by exploiting a quasi-experimental setting. A unique publicprogram in the Province of Trento (Italy) provides plausibly exogenous variation of ADSL2+broadband availability in relatively rural and remote areas. To control carefully for pre-existing,location-specific fixed factors, we employ a difference-in-differences strategy which controls formunicipality and year fixed effects. Moreover, we conduct placebo analysis and detailed tests ofthe common trend assumption underlying our identification strategy.
The results are based on longitudinal balance sheet data of local corporate enterprises and sug-gest a strong and statistically significant impact of ADSL2+ availability on corporate enterprises’economic performance. ADSL2+ availability appears to be associated with a significant increasein annual sales turnover of about 40 percent and an increase in value added of roughly 25 percentover the period of two years. The positive effect is found to be rather stable for different levelsof treatment intensity (days of ADSL2+ availability) and across industrial sectors (with relativelystronger benefits for the hospitality sector). Overall, no significant effects are found with respectto the number of employees employed in corporate enterprises (except for the hospitality sector).
Taken together, our findings have important implications for the ongoing policy debate ongovernment investment in broadband infrastructure to encourage local economic growth, even (andperhaps especially) in relatively under-developed remote and rural areas.
18

References
Accetturo, A. and G. de Blasio (2012). Policies for Local Development: An Evaluation of Italy’s “PattiTerritoriali”. Regional Science and Urban Economics 42(1–2), 15–26.
Akerman, A., I. Gaarder, and M. Mogstad (2015). The Skill Complementarity of Broadband Internet. TheQuarterly Journal of Economics, forthcoming.
Becker, S. O., P. H. Egger, and M. von Ehrlich (2010). Going NUTS: The Effect of EU Structural Funds onRegional Performance. Journal of Public Economics 94(9–10), 578–590.
Bertschek, I., D. Cerquera, and G. J. Klein (2013). More Bits - More Bucks? Measuring the Impact ofBroadband Internet on Firm Performance. Information Economics and Policy 25(3), 190–203.
Colombo, M. G., A. Croce, and L. Grilli (2013). ICT Services and Small Businesses’ Productivity Gains:An Analysis of the Use of Broadband Internet Technology. Information Economics and Policy 25(3),171–189.
Czernich, N., O. Falck, T. Kretschmer, and L. Woessmann (2011). Broadband Infrastructure and EconomicGrowth. The Economic Journal 121(552), 505–523.
De Stefano, T., R. Kneller, and J. Timmis (2014). The (Fuzzy) Digital Divide: The Effect of BroadbandInternet Use on UK Firm Performance. University of Nottingham Discussion Papers in Economics No.14/06, University of Nottingham.
Digital Agenda Scoreboard (2014). Broadband Markets. Technical report, European Commission,retreived from http://ec.europa.eu/information_society/newsroom/cf/dae/document.cfm?doc_id=5810 (last accessed on 30.10.2014).
European Commission (2010a). Europe 2020 – A Strategy for Smart, Sustainable and Inclusive Growth.Communication COM(2010)2020, retreived from http://eur-lex.europa.eu/legal-content/EN/TXT/PDF/?uri=CELEX:52010DC2020&from=EN (last accessed on 17.06.2015).
European Commission (2010b). Regional Policy Contributing to Smart Growth in Europe2020. Communication COM(2010)553, retreived from http://ec.europa.eu/regional_policy/sources/docoffic/official/communic/smart_growth/comm2010_553_en.pdf (last accessed on17.06.2015).
European Commission (2014a). Broadband Coverage in Europe 2013 - Mapping Progress Towards theCoverage Objectives of the Digital Agenda. Retreived from http://ec.europa.eu/information_society/newsroom/cf/dae/document.cfm?doc_id=8238 (last accessed on 17.06.2015).
European Commission (2014b). EU Budget 2013 Financial Report – Also Covering Multiannual FinancialFramework 2007-13. Retreived from http://ec.europa.eu/budget/financialreport/2013/lib/financial_report_2013_en.pdf (last accessed on 17.06.2015).
European Union (2013). Council Regulation No. 1311/2013 of 2 December 2013. Laying Downthe Multiannual Financial Framework for 2014-2020. Official Journal of the European UnionL 347/884, retreived from http://eur-lex.europa.eu/LexUriServ/LexUriServ.do?uri=OJ:L:2013:347:0884:0891:EN:PDF (last accessed on 17.06.2015).
19

EUROSTAT (2015). Eurostat Indicators on High-tech Industry and Knowledge-intensive Services: Annex3 – High-tech Aggregation by NACE Rev. 2. Eurostat metadata, retreived from http://ec.europa.eu/eurostat/cache/metadata/Annexes/htec_esms_an3.pdf (last accessed on 14.08.2015).
Fabritz, N. (2013). The Impact of Broadband on Economic Activity in Rural Areas: Evidence from GermanMunicipalities. Ifo Working Paper No. 166, Ifo, Munich.
Haller, S. A. and S. Lyons (2014). Broadband Adoption and Firm Productivity: Evidence from Irish Mani-facturing Firms. Telecom 39(1), 1–13.
ISTAT (2013). Noi Italia. 100 statistiche per capire il Paese in cui viviamo. Technical report, Italian NationalInstitute of Statistics, retreived from http://www.istat.it/it/files/2013/03/Noi-Italia-2013.pdf (last accessed on 30.10.2014).
Kandilov, I. T. and M. Renkow (2010). Infrastructure Investment and Rural Economic Development: AnEvaluation of USDA’s Broadband Loan Program. Growth and Change 41(2), 165–191.
Kim, Y. and P. Orazem (2012). Broadband Internet and Firm Entry: Evidence from Rural Iowa. Iowa StateUniversity Working Paper No. 12026, Iowa State University.
Kolko, J. (2012). Broadband and Local Growth. Journal of Urban Economics 71(1), 100–113.
Mohl, P. and T. Hagen (2010). Do EU Structural Funds Promote Regional Growth? New Evidence fromVarious Panel Data Approaches. Regional Science and Urban Economics 40(5), 352–365.
PAT Statistical Office (2014). Annuario Statistico Online. Technical report, Province of Trento, retreivedfrom http://www.statweb.provincia.tn.it/annuario/%28S%28uqggbmi3lg3dzf45g5sn2r45%29%29/Default.aspx (last accessed on 30.10.2014).
Podesta, F. (Ed.) (2010). Il modello econometrico multisettoriale del Trentino, Volume Q25 of Quadernidella Programmazione. Trento: Edizioni31.
What Works Centre for Local Economic Growth (2015). Evidence Review 6: Broadband. Technical report,What Works Centre for Local Economic Growth.
Whitacre, B., R. Gallardo, and S. Strover (2014). Broadband’s Contribution to Economic Growth in RuralAreas: Moving towards a Causal Relationship. Telecommunications Policy 38(11), 1011–1023.
20

Figure 1: Nr. of Days of ADSL2+ Broadband Exposure as of 31/12/2012 Across Municipalities in the Province ofTrento
696
0not addressed by policy
Source: Own calculations based on data from Telecom Italia.
21

Figure 2: Histogram – Nr. of Days of ADSL2+ Broadband Exposure as of 31/12/2012
05
1015
Per
cent
0 200 400 600 800Nr. days of exposure as of 31/12/2012
Source: Own calculations based on data from Telecom Italia.Note: N =167 Municipalities
22

Figure 3: The Shape of Treatment Intensity Effects on Annual Turnover
0.2
.4.6
.8
1 2 3 4 5 6 7 8 9 10 11 12 13 14 15 16 17 18 19 20 21 22 23 24Nr. days of exposure/30
A. Quadratic Specification
0.2
.4.6
.8
< 6
mon
ths
6 - 1
2 m
onth
s
12 -
18 m
onth
s
> 18
mon
ths
B. 'Category' Specification
Source: AIDA 2010 & 2012, Telecom Italia, own calculations.Note: Marginal effects of treatment intensity on annual turnover (log) based on Columns 9 and 10of Table 4 with 95% confidence intervals.
23

Figure 4: Testing the Common Trend Assumption – Descriptive Evidence
5.6
5.8
66.
26.
46.
6(m
ean)
ln_r
even
ues
2008 2009 2010 2011 2012
Control Treatment
A. Unbalanced Sample
66.
26.
46.
66.
8(m
ean)
ln_r
even
ues
2008 2009 2010 2011 2012
Control Treatment
B. Balanced Sample
Source: AIDA 2008–2012, Telecom Italia, own calculations.Note: Treatment and control group are defined on the basis of ADSL2+ broadband exposure as of 31/12/2012:Treated= firms located in municipalities with ADSL2+ access by end-2012. Control = firms located inmunicipalities without ADSL2+ access by end-2012. 2011 is the starting year of the ADSL2+ policy.
24

Figure 5: The Shape of Treatment Intensity Effects on Value Added
0.1
.2.3
.4.5
1 2 3 4 5 6 7 8 9 10 11 12 13 14 15 16 17 18 19 20 21 22 23 24Nr. days of exposure/30
A. Quadratic Specification
0.1
.2.3
.4.5
< 6
mon
ths
6 - 1
2 m
onth
s
12 -
18 m
onth
s
> 18
mon
ths
B. 'Category' Specification
Source: AIDA 2010 & 2012, Telecom Italia, own calculations.Note: Marginal effects of treatment intensity on value added (log) based on Columns 3 and 4of Table 7 (Panel A) with 95% confidence intervals.
25

Figure 6: The Shape of Treatment Intensity Effects on Employment
-.6
-.4
-.2
0.2
.4.6
1 2 3 4 5 6 7 8 9 10 11 12 13 14 15 16 17 18 19 20 21 22 23 24Nr. days of exposure/30
A. Quadratic Specification
-.6
-.4
-.2
0.2
.4.6
< 6
mon
ths
6 - 1
2 m
onth
s
12 -
18 m
onth
s
> 18
mon
ths
B. 'Category' Specification
Source: AIDA 2010 & 2012, Telecom Italia, own calculations.Note: Marginal effects of treatment intensity on nr. of employees (log) based on Columns 7 and 8of Table 7 (Panel A) with 95% confidence intervals.
26
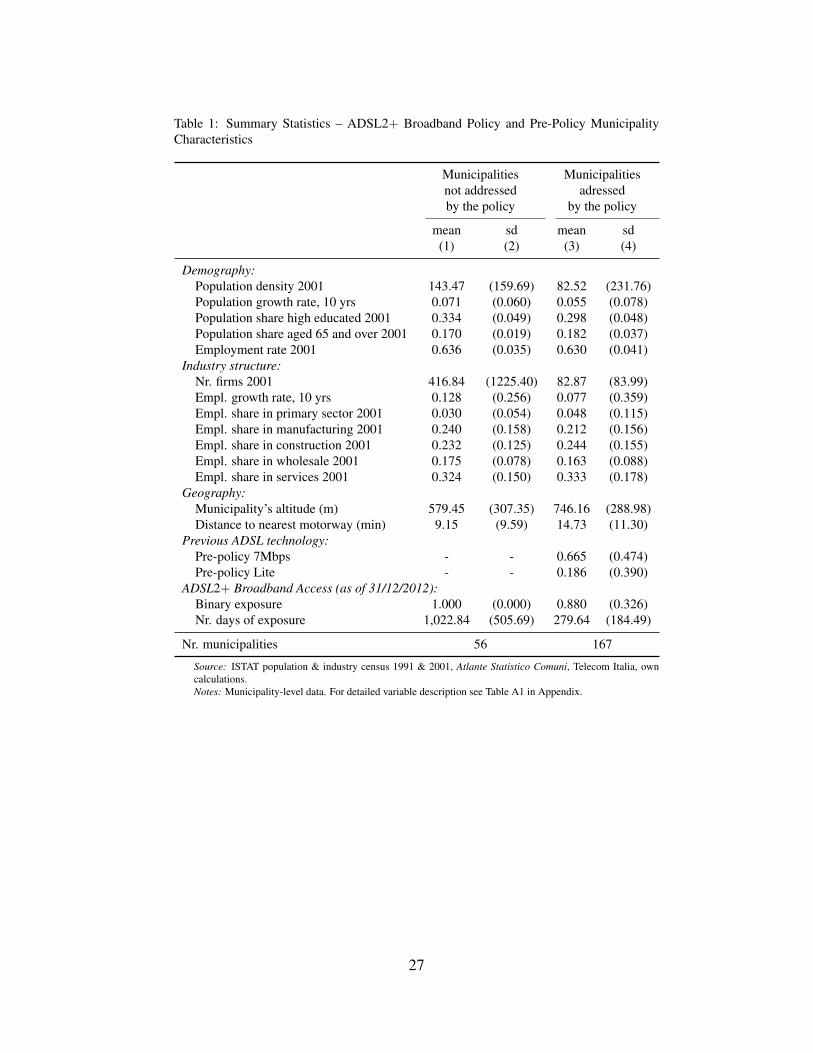
Table 1: Summary Statistics – ADSL2+ Broadband Policy and Pre-Policy MunicipalityCharacteristics
Municipalities Municipalitiesnot addressed adressedby the policy by the policy
mean sd mean sd(1) (2) (3) (4)
Demography:Population density 2001 143.47 (159.69) 82.52 (231.76)Population growth rate, 10 yrs 0.071 (0.060) 0.055 (0.078)Population share high educated 2001 0.334 (0.049) 0.298 (0.048)Population share aged 65 and over 2001 0.170 (0.019) 0.182 (0.037)Employment rate 2001 0.636 (0.035) 0.630 (0.041)
Industry structure:Nr. firms 2001 416.84 (1225.40) 82.87 (83.99)Empl. growth rate, 10 yrs 0.128 (0.256) 0.077 (0.359)Empl. share in primary sector 2001 0.030 (0.054) 0.048 (0.115)Empl. share in manufacturing 2001 0.240 (0.158) 0.212 (0.156)Empl. share in construction 2001 0.232 (0.125) 0.244 (0.155)Empl. share in wholesale 2001 0.175 (0.078) 0.163 (0.088)Empl. share in services 2001 0.324 (0.150) 0.333 (0.178)
Geography:Municipality’s altitude (m) 579.45 (307.35) 746.16 (288.98)Distance to nearest motorway (min) 9.15 (9.59) 14.73 (11.30)
Previous ADSL technology:Pre-policy 7Mbps - - 0.665 (0.474)Pre-policy Lite - - 0.186 (0.390)
ADSL2+ Broadband Access (as of 31/12/2012):Binary exposure 1.000 (0.000) 0.880 (0.326)Nr. days of exposure 1,022.84 (505.69) 279.64 (184.49)
Nr. municipalities 56 167
Source: ISTAT population & industry census 1991 & 2001, Atlante Statistico Comuni, Telecom Italia, owncalculations.Notes: Municipality-level data. For detailed variable description see Table A1 in Appendix.
27

Table 2: Was Roll-out Timing Exogenous?
ADSL2+ exposure as of 31/12/2012
Binary Nr. of Days/30
(1) (2)
Demography:Population density 2001 (log) -0.025 -0.048
(0.031) (0.568)Population growth rate, 10 yrs 0.326 -1.930
(0.340) (6.255)Employment rate 2001 -0.374 7.859
(0.600) (11.046)Pop. share high educated 2001 0.530 6.327
(0.552) (10.150)Pop. share aged 65 and over 2001 0.399 -9.086
(0.758) (13.951)Industry structure:
Nr firms 2001 (log) -0.023 -0.710(0.026) (0.484)
Empl. growth rate, 10 yrs -0.015 1.903(0.063) (1.155)
Empl. share in manufacturing 2001 0.252 6.549(0.234) (4.312)
Empl. share in construction 2001 -0.061 3.764(0.221) (4.060)
Empl. share in wholesale 2001 0.174 2.714(0.315) (5.786)
Empl. share in services 2001 -0.192 3.631(0.214) (3.933)
Geography:Municipality’s (log) -0.008 -0.098
(0.055) (1.009)Distance to nearest motorway (log) -0.009 -0.075
(0.022) (0.408)Previous ADSL technology:
Pre-policy 7Mbps 0.496∗∗∗ 8.954∗∗∗
(0.070) (1.282)Pre-policy Lite 0.334∗∗∗ 2.957∗∗
(0.079) (1.461)
N 167 167
F-test (joint sign. exc. pre-policy 7Mbps/Lite) 0.91 0.63Prob > F 0.5419 0.8280
Source: ISTAT population & industry census 1991 & 2001, Atlante Statistico Comuni Italiani, TelecomItalia, own calculations.Notes: Municipality-level data. Standard errors in parentheses. For detailed variable description see Ta-ble A1 in Appendix. * p < 0.10, ** p < 0.05, *** p < 0.01.
28
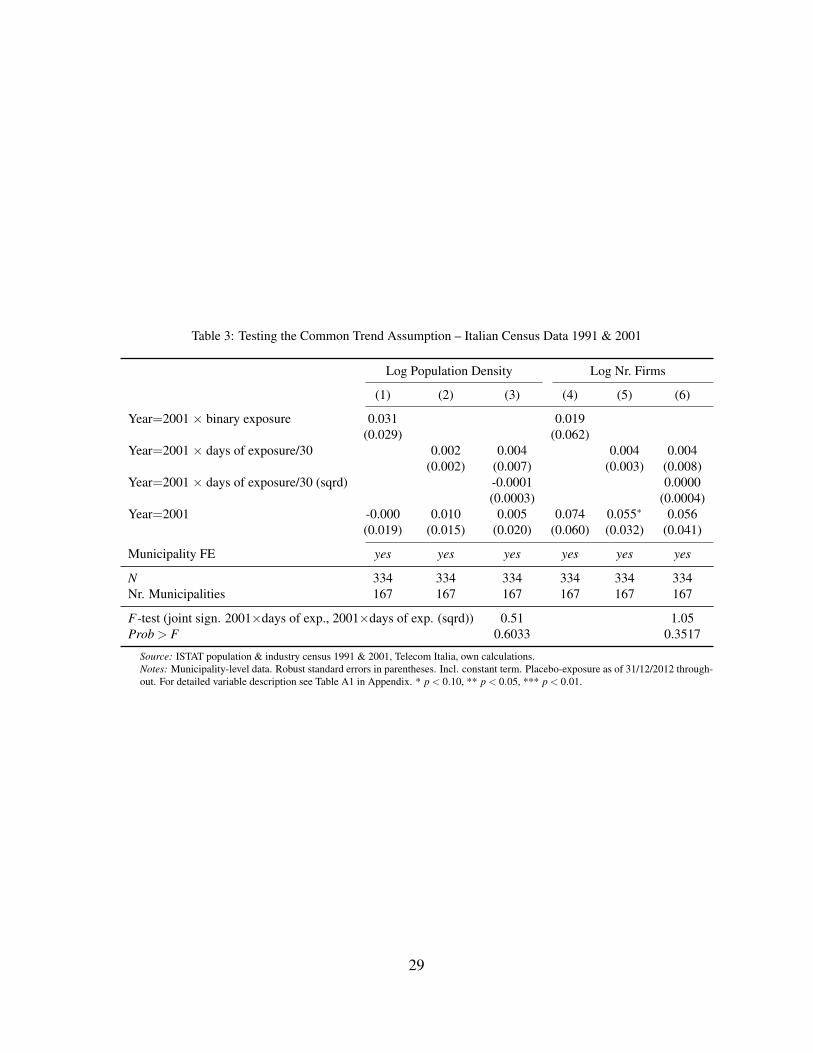
Table 3: Testing the Common Trend Assumption – Italian Census Data 1991 & 2001
Log Population Density Log Nr. Firms
(1) (2) (3) (4) (5) (6)
Year=2001 × binary exposure 0.031 0.019(0.029) (0.062)
Year=2001 × days of exposure/30 0.002 0.004 0.004 0.004(0.002) (0.007) (0.003) (0.008)
Year=2001 × days of exposure/30 (sqrd) -0.0001 0.0000(0.0003) (0.0004)
Year=2001 -0.000 0.010 0.005 0.074 0.055∗ 0.056(0.019) (0.015) (0.020) (0.060) (0.032) (0.041)
Municipality FE yes yes yes yes yes yes
N 334 334 334 334 334 334Nr. Municipalities 167 167 167 167 167 167
F-test (joint sign. 2001×days of exp., 2001×days of exp. (sqrd)) 0.51 1.05Prob > F 0.6033 0.3517
Source: ISTAT population & industry census 1991 & 2001, Telecom Italia, own calculations.Notes: Municipality-level data. Robust standard errors in parentheses. Incl. constant term. Placebo-exposure as of 31/12/2012 through-out. For detailed variable description see Table A1 in Appendix. * p < 0.10, ** p < 0.05, *** p < 0.01.
29

Tabl
e4:
Mai
nR
esul
ts–
AID
A20
10&
2012
Dep
ende
ntva
riab
le:A
nnua
ltur
nove
r(lo
g)
Unb
alan
ced
Pane
lB
alan
ced
Pane
l
(1)
(2)
(3)
(4)
(5)
(6)
(7)
(8)
(9)
(10)
Bin
ary
expo
sure
0.39
91∗∗∗
0.39
59∗∗∗
0.39
59∗∗∗
(0.0
995)
(0.0
981)
(0.0
948)
Nr.
days
ofex
posu
re/3
00.
0145∗∗∗
0.03
75∗∗∗
0.01
040.
0554∗∗∗
0.01
040.
0554∗∗∗
(0.0
054)
(0.0
139)
(0.0
069)
(0.0
140)
(0.0
066)
(0.0
135)
Nr.
days
ofex
posu
re/3
0(s
qrd)
-0.0
011∗
-0.0
021∗∗∗
-0.0
021∗∗∗
(0.0
006)
(0.0
005)
(0.0
005)
Zero
expo
sure
(ref
.)E
xpos
ure<
=6
mon
ths
0.40
79∗∗∗
(0.1
409)
6m
onth
s<ex
p.<=
12m
onth
s0.
3215∗∗∗
(0.1
039)
12m
onth
s<ex
p.<=
18m
onth
s0.
4855∗∗∗
(0.0
968)
18m
onth
s<ex
p.0.
3109∗∗∗
(0.0
996)
Yea
r=20
12-0
.486
8∗∗∗
-0.2
764∗∗∗
-0.3
612∗∗∗
-0.4
306∗∗∗
-0.1
810∗∗
-0.3
455∗∗∗
-0.4
306∗∗∗
-0.1
810∗∗
-0.3
455∗∗∗
-0.4
306∗∗∗
(0.0
928)
(0.0
658)
(0.0
729)
(0.0
937)
(0.0
833)
(0.0
844)
(0.0
905)
(0.0
805)
(0.0
815)
(0.0
906)
Indu
stry
FEye
sye
sye
sye
sye
sye
sno
nono
noM
unic
ipal
ityFE
yes
yes
yes
yes
yes
yes
nono
nono
Firm
FEno
nono
nono
noye
sye
sye
sye
s
N2,
270
2,27
02,
270
2,13
22,
132
2,13
22,
132
2,13
22,
132
2,13
2N
r.Fi
rms
1,20
41,
204
1,20
41,
066
1,06
61,
066
1,06
61,
066
1,06
61,
066
Sour
ce:
AID
A20
10&
2012
,Tel
ecom
Ital
ia,o
wn
calc
ulat
ions
.N
otes
:R
obus
tsta
ndar
der
rors
inpa
rent
hese
s,ad
just
edfo
rcl
uste
ring
atth
em
unic
ipal
ityle
vel.
Incl
.co
nsta
ntte
rm.
AD
SL2+
expo
sure
asof
Dec
embe
r31
inth
ere
spec
tive
year
.*
p<
0.10
,**
p<
0.05
,***
p<
0.01
.
30
Tabl
e5:
Plac
ebo
–Pr
e-re
form
Out
com
es(A
IDA
2008
&20
10)
Dep
ende
ntva
riab
le:A
nnua
ltur
nove
r(lo
g)
Unb
alan
ced
Pane
lB
alan
ced
Pane
l
(1)
(2)
(3)
(4)
(5)
(6)
(7)
(8)
(9)
(10)
Plac
ebo–
Bin
ary
expo
sure
0.00
600.
0371
0.03
71(0
.120
1)(0
.102
7)(0
.099
1)Pl
aceb
o–N
r.da
ysof
expo
sure
/30
0.00
250.
0044
0.00
250.
0079
0.00
250.
0079
(0.0
055)
(0.0
160)
(0.0
046)
(0.0
128)
(0.0
044)
(0.0
123)
Plac
ebo–
Nr.
days
ofex
posu
re/3
0(s
qrd)
-0.0
001
-0.0
003
-0.0
003
(0.0
007)
(0.0
006)
(0.0
005)
Zero
expo
sure
(ref
.)E
xpos
ure<
=6
mon
ths
0.05
28(0
.117
4)6
mon
ths<
exp.
<=
12m
onth
s-0
.012
4(0
.105
8)12
mon
ths<
exp.
<=
18m
onth
s0.
0774
(0.1
017)
18m
onth
s<ex
p.0.
0300
(0.1
184)
Yea
r=20
12-0
.015
2-0
.035
3-0
.042
3-0
.060
2-0
.052
5-0
.072
4-0
.060
2-0
.052
5-0
.072
4-0
.060
2(0
.114
1)(0
.068
8)(0
.082
2)(0
.099
2)(0
.056
0)(0
.071
1)(0
.095
7)(0
.054
1)(0
.068
6)(0
.095
8)
Indu
stry
FEye
sye
sye
sye
sye
sye
sno
nono
noM
unic
ipal
ityFE
yes
yes
yes
yes
yes
yes
nono
nono
Firm
FEno
nono
nono
noye
sye
sye
sye
s
N2,
191
2,19
12,
191
2,06
42,
064
2,06
42,
064
2,06
42,
064
2,06
4N
r.fir
ms
1,15
91,
159
1,15
91,
032
1,03
21,
032
1,03
21,
032
1,03
21,
032
Sour
ce:
AID
A20
08&
2010
,Tel
ecom
Ital
ia,o
wn
calc
ulat
ions
.N
otes
:R
obus
tsta
ndar
der
rors
inpa
rent
hese
s,ad
just
edfo
rclu
ster
ing
atth
em
unic
ipal
ityle
vel.
Incl
.con
stan
tter
m.P
lace
bo-e
xpos
ure
asof
31/1
2/20
12fo
rthe
year
2010
and
0fo
rthe
year
2008
.*
p<
0.10
,**
p<
0.05
,***
p<
0.01
.
31

Table 6: Testing the Common Trend Assumption (AIDA 2008–2012)
Dependent variable: Annual turnover (log)
Unbalanced Panel Balanced Panel
(1) (2) (3) (4) (5) (6)
Year=2008 × binary exposure (ref.)Year=2009 × binary exposure 0.0843 0.0369
(0.0862) (0.0924)Year=2010 × binary exposure 0.0173 0.0306
(0.1015) (0.1127)Year=2011 × binary exposure 0.2036 0.1686
(0.1235) (0.1061)Year=2012 × binary exposure 0.3926∗∗∗ 0.2838∗
(0.1252) (0.1491)Year=2008 × days of exposure/30 (ref.)Year=2009 × days of exposure/30 0.0076 0.0068 0.0031 0.0042
(0.0050) (0.0123) (0.0040) (0.0114)Year=2010 × days of exposure/30 0.0012 0.0029 0.0020 0.0080
(0.0043) (0.0128) (0.0046) (0.0134)Year=2011 × days of exposure/30 0.0026 0.0231 0.0018 0.0259∗
(0.0062) (0.0182) (0.0053) (0.0151)Year=2012 × days of exposure/30 0.0117 0.0551∗∗∗ 0.0065 0.0492∗∗
(0.0081) (0.0186) (0.0086) (0.0195)Year=2008 × days of exposure/30 (sqrd) (ref.)Year=2009 × days of exposure/30 (sqrd) 0.0000 -0.0001
(0.0006) (0.0005)Year=2010 × days of exposure/30 (sqrd) -0.0001 -0.0003
(0.0005) (0.0006)Year=2011 × days of exposure/30 (sqrd) -0.0010 -0.0011∗
(0.0007) (0.0006)Year=2012 × days of exposure/30 (sqrd) -0.0020∗∗∗ -0.0020∗∗
(0.0007) (0.0008)Year=2008 (ref.)Year=2009 -0.1053 -0.1080∗ -0.1045 -0.0235 -0.0220 -0.0262
(0.0807) (0.0581) (0.0658) (0.0900) (0.0465) (0.0643)Year=2010 -0.0464 -0.0433 -0.0494 -0.0414 -0.0347 -0.0565
(0.0988) (0.0519) (0.0721) (0.1094) (0.0576) (0.0761)Year=2011 -0.2612∗∗ -0.1048 -0.1800∗ -0.1621 -0.0289 -0.1166
(0.1162) (0.0849) (0.1025) (0.1016) (0.0673) (0.0826)Year=2012 -0.4623∗∗∗ -0.2294∗∗ -0.3886∗∗∗ -0.3270∗∗ -0.1385 -0.2939∗∗∗
(0.1194) (0.0939) (0.1004) (0.1446) (0.1000) (0.1094)
Firm FE yes yes yes yes yes yes
N 5,587 5,587 5,587 4,830 4,830 4,830Nr. Firms 1,244 1,244 1,244 966 966 966
Source: AIDA 2008 – 2012, Telecom Italia, own calculations.Notes: Robust standard errors in parentheses, adjusted for clustering at the municipality level. Incl. constant term. Exposure as of 31/12/2012throughout. * p < 0.10, ** p < 0.05, *** p < 0.01.
32

Table 7: Other Outcomes – Value Added and Employment
A: Main, 2010 & 2012
Annual value added (log) Nr. employees (log)
(1) (2) (3) (4) (5) (6) (7) (8)
Binary exposure 0.2465∗∗ 0.0287(0.0999) (0.2034)
Nr. days of exposure/30 0.0105∗∗ 0.0262∗ -0.0118 0.0187(0.0046) (0.0137) (0.0072) (0.0241)
Nr. days of exposure/30 (sqrd) -0.0007 -0.0014(0.0005) (0.0009)
Zero exposure (ref.)Exposure<=6 months 0.2323∗∗ -0.0541
(0.1172) (0.2472)6 months< exp. <=12 months 0.1742∗ 0.2283
(0.1040) (0.2070)12 months< exp. <=18 months 0.2999∗∗∗ -0.0554
(0.1024) (0.2106)18 months< exp. 0.2810∗∗ -0.1728
(0.1075) (0.2023)Year=2012 -0.2401∗∗ -0.1254∗∗ -0.1838∗∗ -0.2401∗∗ 0.5200∗∗∗ 0.6668∗∗∗ 0.5533∗∗∗ 0.5200∗∗∗
(0.0977) (0.0606) (0.0825) (0.0978) (0.1987) (0.0997) (0.1441) (0.1989)
Firm FE yes yes yes yes yes yes yes yes
N 1,964 1,964 1,964 1,964 1,756 1,756 1,756 1,756Nr. Firms 982 982 982 982 878 878 878 878
B: Placebo, 2008 & 2010
Annual value added (log) Nr. employees (log)
(1) (2) (3) (4) (5) (6) (7) (8)
Placebo–Binary exposure 0.0896 -0.1465(0.1217) (0.1517)
Placebo–Nr. days of exposure/30 0.0027 0.0138 0.0046 -0.0262(0.0051) (0.0151) (0.0060) (0.0176)
Placebo–Nr. days of exposure/30 (sqrd) -0.0005 0.0014∗∗
(0.0006) (0.0007)Zero exposure (ref.)
Exposure<=6 months 0.0763 -0.0525(0.1528) (0.1612)
6 months< exp. <=12 months 0.0806 -0.2943∗
(0.1241) (0.1615)12 months< exp. <=18 months 0.1111 -0.0860
(0.1254) (0.1578)18 months< exp. 0.0582 -0.0320
(0.1392) (0.1636)Year=2010 -0.0903 -0.0375 -0.0780 -0.0903 -0.1803 -0.3603∗∗∗ -0.2450∗∗ -0.1803
(0.1191) (0.0641) (0.0905) (0.1192) (0.1465) (0.0783) (0.1000) (0.1466)
Firm FE yes yes yes yes yes yes yes yes
N 1,922 1,922 1,922 1,922 1,628 1,628 1,628 1,628Nr. Firms 961 961 961 961 814 814 814 814
Source: A: AIDA 2010 & 2012, B: AIDA 2008 & 2010 , Telecom Italia, own calculations.Notes: Balanced panels. Robust standard errors in parentheses, adjusted for clustering at the municipality level. Incl. constant term. * p < 0.10, ** p < 0.05, *** p < 0.01.
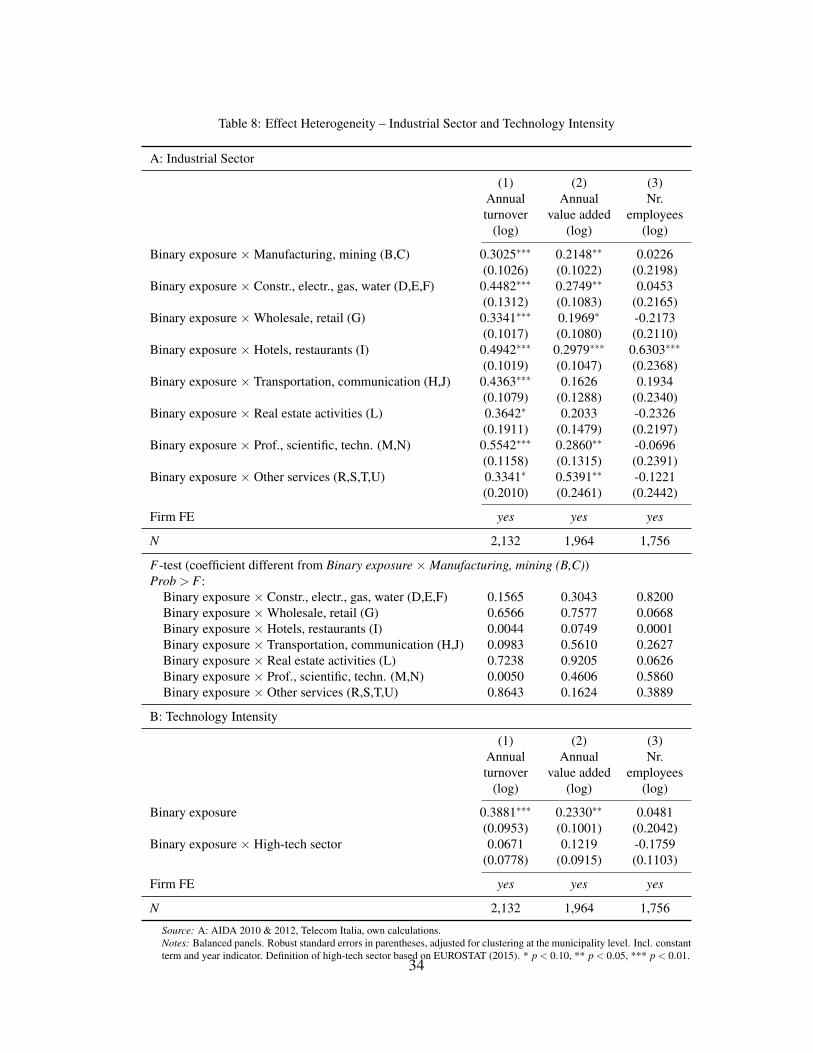
Table 8: Effect Heterogeneity – Industrial Sector and Technology Intensity
A: Industrial Sector
(1) (2) (3)Annual Annual Nr.turnover value added employees
(log) (log) (log)
Binary exposure ×Manufacturing, mining (B,C) 0.3025∗∗∗ 0.2148∗∗ 0.0226(0.1026) (0.1022) (0.2198)
Binary exposure × Constr., electr., gas, water (D,E,F) 0.4482∗∗∗ 0.2749∗∗ 0.0453(0.1312) (0.1083) (0.2165)
Binary exposure ×Wholesale, retail (G) 0.3341∗∗∗ 0.1969∗ -0.2173(0.1017) (0.1080) (0.2110)
Binary exposure × Hotels, restaurants (I) 0.4942∗∗∗ 0.2979∗∗∗ 0.6303∗∗∗
(0.1019) (0.1047) (0.2368)Binary exposure × Transportation, communication (H,J) 0.4363∗∗∗ 0.1626 0.1934
(0.1079) (0.1288) (0.2340)Binary exposure × Real estate activities (L) 0.3642∗ 0.2033 -0.2326
(0.1911) (0.1479) (0.2197)Binary exposure × Prof., scientific, techn. (M,N) 0.5542∗∗∗ 0.2860∗∗ -0.0696
(0.1158) (0.1315) (0.2391)Binary exposure × Other services (R,S,T,U) 0.3341∗ 0.5391∗∗ -0.1221
(0.2010) (0.2461) (0.2442)
Firm FE yes yes yes
N 2,132 1,964 1,756
F-test (coefficient different from Binary exposure ×Manufacturing, mining (B,C))Prob > F :
Binary exposure × Constr., electr., gas, water (D,E,F) 0.1565 0.3043 0.8200Binary exposure ×Wholesale, retail (G) 0.6566 0.7577 0.0668Binary exposure × Hotels, restaurants (I) 0.0044 0.0749 0.0001Binary exposure × Transportation, communication (H,J) 0.0983 0.5610 0.2627Binary exposure × Real estate activities (L) 0.7238 0.9205 0.0626Binary exposure × Prof., scientific, techn. (M,N) 0.0050 0.4606 0.5860Binary exposure × Other services (R,S,T,U) 0.8643 0.1624 0.3889
B: Technology Intensity
(1) (2) (3)Annual Annual Nr.turnover value added employees
(log) (log) (log)
Binary exposure 0.3881∗∗∗ 0.2330∗∗ 0.0481(0.0953) (0.1001) (0.2042)
Binary exposure × High-tech sector 0.0671 0.1219 -0.1759(0.0778) (0.0915) (0.1103)
Firm FE yes yes yes
N 2,132 1,964 1,756
Source: A: AIDA 2010 & 2012, Telecom Italia, own calculations.Notes: Balanced panels. Robust standard errors in parentheses, adjusted for clustering at the municipality level. Incl. constantterm and year indicator. Definition of high-tech sector based on EUROSTAT (2015). * p < 0.10, ** p < 0.05, *** p < 0.01.
34

Table 9: Effect Heterogeneity – Pre-Policy ADSL, Remoteness and Urbanization
(1) (2) (3)Annual Annual Nr.turnover value added employees
(log) (log) (log)
A: Pre-Policy ADSL
Binary exposure 0.3917∗∗∗ 0.2542∗∗ 0.0187(0.0954) (0.1001) (0.2044)
Dummy exposure × Pre-policy 7Mbps (ref.)Binary exposure × No pre-policy ADSL -0.0211 -0.0648 0.0459
(0.1138) (0.0921) (0.1542)Binary exposure × Pre-policy Lite 0.0961 -0.0820 0.1364
(0.1149) (0.1131) (0.1260)
Firm FE yes yes yes
N 2,132 1,964 1,756
B: Remoteness
Binary exposure 0.2660∗∗ 0.2408∗∗ -0.1794(0.1101) (0.1091) (0.2167)
Binary exposure × Road distance to regional capital (min) 0.0034∗∗ 0.0001 0.0055∗∗
(0.0014) (0.0012) (0.0022)
Firm FE yes yes yes
N 2,132 1,964 1,756
C: Urbanization
Binary exposure 0.3806∗∗∗ 0.2479∗∗ 0.0470(0.0952) (0.1001) (0.2039)
Binary exposure × 2001 Population density/10 0.0136∗∗∗ -0.0013 -0.0155∗∗∗
(0.0017) (0.0022) (0.0032)
Firm FE yes yes yes
N 2,132 1,964 1,756
Source: AIDA 2010 & 2012 , Telecom Italia, own calculations.Notes: Balanced panels. Robust standard errors in parentheses, adjusted for clustering at the municipality level. Incl. constantterm and year indicator. * p < 0.10, ** p < 0.05, *** p < 0.01.
35

Appendix
Table A1: Variable Description – Municipality Characteristics
Variable Description
Demography Source: ISTAT (2001) 14◦ Censimento generale della popolazione e delle abitazioniPopulation density Total nr of residents over municipal area (in square kilometers)Population growth rate, 10 yrs 10-year population growth rate (1991-2001)Employment rate Nr of employed residents over working age population (15–64)Population share high educated Nr of residents with upper secondary or higher education over total nr of residentsPopulation share aged 65 and over Nr of residents aged at least 65 over total nr of residents
Industry structure Source: ISTAT (2001) 8◦ Censimento dell’industria e dei serviziNr. firms (log) Total nr of firmsEmpl. growth rate, 10 yrs 10-year growth rate of total nr of jobs (1991-2001)Empl. share in primary sector Nr of jobs in the primary sector (agriculture and mining) over total nr of jobsEmpl. share in manufacturing Nr of jobs in manufacturing over total nr of jobsEmpl. share in construction Nr of jobs in construction and utilities (gas, water, electricity) over total nr of jobsEmpl. share in wholesale Nr of jobs in wholesale and retail over total nr of jobsEmpl. share in services Nr of jobs in other services over total nr of jobs
Geography Source: ISTAT (2009) Atlante Statistico dei ComuniMunicipality’s altitude (log) Altitude at the city hall level (in meters)Distance to nearest motorway (log) Road distance of the municipality to the next motorway (in minutes)
Previous ADSL technology: Source: Trentino NetworkPre-policy 7Mbps Pre-policy availability of previous ADSL technology 7MbpsPre-policy Lite Pre-policy availability of previous ADSL technology Lite
36
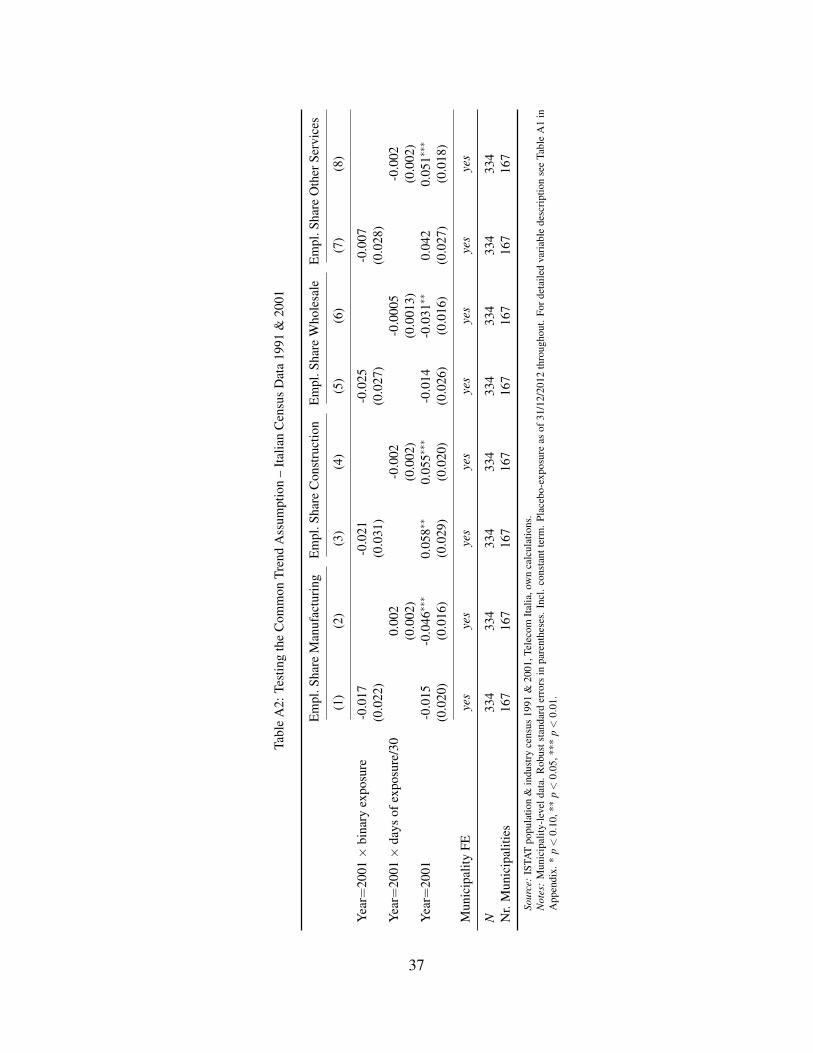
Tabl
eA
2:Te
stin
gth
eC
omm
onTr
end
Ass
umpt
ion
–It
alia
nC
ensu
sD
ata
1991
&20
01
Em
pl.S
hare
Man
ufac
turi
ngE
mpl
.Sha
reC
onst
ruct
ion
Em
pl.S
hare
Who
lesa
leE
mpl
.Sha
reO
ther
Serv
ices
(1)
(2)
(3)
(4)
(5)
(6)
(7)
(8)
Yea
r=20
01×
bina
ryex
posu
re-0
.017
-0.0
21-0
.025
-0.0
07(0
.022
)(0
.031
)(0
.027
)(0
.028
)Y
ear=
2001×
days
ofex
posu
re/3
00.
002
-0.0
02-0
.000
5-0
.002
(0.0
02)
(0.0
02)
(0.0
013)
(0.0
02)
Yea
r=20
01-0
.015
-0.0
46∗∗∗
0.05
8∗∗
0.05
5∗∗∗
-0.0
14-0
.031∗∗
0.04
20.
051∗∗∗
(0.0
20)
(0.0
16)
(0.0
29)
(0.0
20)
(0.0
26)
(0.0
16)
(0.0
27)
(0.0
18)
Mun
icip
ality
FEye
sye
sye
sye
sye
sye
sye
sye
s
N33
433
433
433
433
433
433
433
4N
r.M
unic
ipal
ities
167
167
167
167
167
167
167
167
Sour
ce:
ISTA
Tpo
pula
tion
&in
dust
ryce
nsus
1991
&20
01,T
elec
omIt
alia
,ow
nca
lcul
atio
ns.
Not
es:
Mun
icip
ality
-lev
elda
ta.R
obus
tsta
ndar
der
rors
inpa
rent
hese
s.In
cl.c
onst
antt
erm
.Pla
cebo
-exp
osur
eas
of31
/12/
2012
thro
ugho
ut.F
orde
taile
dva
riab
lede
scri
ptio
nse
eTa
ble
A1
inA
ppen
dix.
*p<
0.10
,**
p<
0.05
,***
p<
0.01
.
37
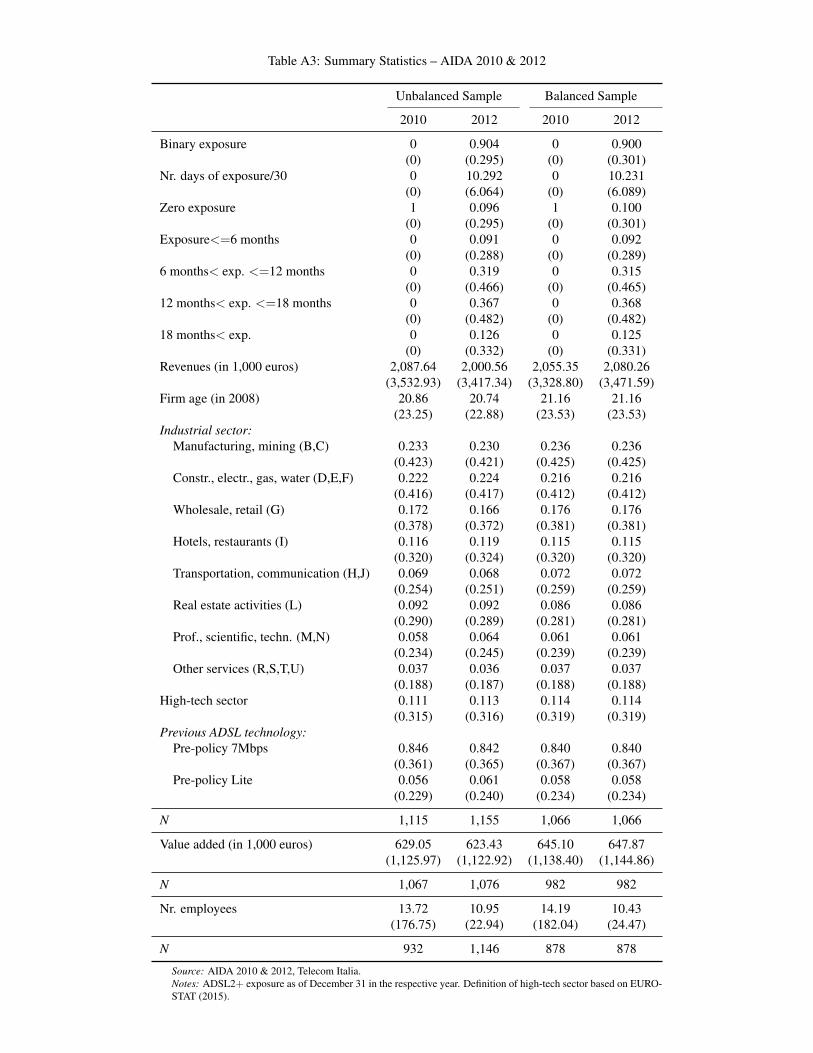
Table A3: Summary Statistics – AIDA 2010 & 2012
Unbalanced Sample Balanced Sample
2010 2012 2010 2012
Binary exposure 0 0.904 0 0.900(0) (0.295) (0) (0.301)
Nr. days of exposure/30 0 10.292 0 10.231(0) (6.064) (0) (6.089)
Zero exposure 1 0.096 1 0.100(0) (0.295) (0) (0.301)
Exposure<=6 months 0 0.091 0 0.092(0) (0.288) (0) (0.289)
6 months< exp. <=12 months 0 0.319 0 0.315(0) (0.466) (0) (0.465)
12 months< exp. <=18 months 0 0.367 0 0.368(0) (0.482) (0) (0.482)
18 months< exp. 0 0.126 0 0.125(0) (0.332) (0) (0.331)
Revenues (in 1,000 euros) 2,087.64 2,000.56 2,055.35 2,080.26(3,532.93) (3,417.34) (3,328.80) (3,471.59)
Firm age (in 2008) 20.86 20.74 21.16 21.16(23.25) (22.88) (23.53) (23.53)
Industrial sector:Manufacturing, mining (B,C) 0.233 0.230 0.236 0.236
(0.423) (0.421) (0.425) (0.425)Constr., electr., gas, water (D,E,F) 0.222 0.224 0.216 0.216
(0.416) (0.417) (0.412) (0.412)Wholesale, retail (G) 0.172 0.166 0.176 0.176
(0.378) (0.372) (0.381) (0.381)Hotels, restaurants (I) 0.116 0.119 0.115 0.115
(0.320) (0.324) (0.320) (0.320)Transportation, communication (H,J) 0.069 0.068 0.072 0.072
(0.254) (0.251) (0.259) (0.259)Real estate activities (L) 0.092 0.092 0.086 0.086
(0.290) (0.289) (0.281) (0.281)Prof., scientific, techn. (M,N) 0.058 0.064 0.061 0.061
(0.234) (0.245) (0.239) (0.239)Other services (R,S,T,U) 0.037 0.036 0.037 0.037
(0.188) (0.187) (0.188) (0.188)High-tech sector 0.111 0.113 0.114 0.114
(0.315) (0.316) (0.319) (0.319)Previous ADSL technology:
Pre-policy 7Mbps 0.846 0.842 0.840 0.840(0.361) (0.365) (0.367) (0.367)
Pre-policy Lite 0.056 0.061 0.058 0.058(0.229) (0.240) (0.234) (0.234)
N 1,115 1,155 1,066 1,066
Value added (in 1,000 euros) 629.05 623.43 645.10 647.87(1,125.97) (1,122.92) (1,138.40) (1,144.86)
N 1,067 1,076 982 982
Nr. employees 13.72 10.95 14.19 10.43(176.75) (22.94) (182.04) (24.47)
N 932 1,146 878 878
Source: AIDA 2010 & 2012, Telecom Italia.Notes: ADSL2+ exposure as of December 31 in the respective year. Definition of high-tech sector based on EURO-STAT (2015).