broadband dielectric spectroscopy studies of glassy-state relaxations in annealed...
TRANSCRIPT
55
Research ArticleReceived: 7 January 2011 Revised: 16 April 2011 Accepted: 12 May 2011 Published online in Wiley Online Library: 30 August 2011
(wileyonlinelibrary.com) DOI 10.1002/pi.3147
Broadband dielectric spectroscopy studiesof glassy-state relaxations in annealedpoly(2,5-benzimidazole)Amol Nalawade,a Mohammad K. Hassan,a,b William A. Jarrett,a
Kenneth A. Mauritza∗ and Morton H. Litta
Abstract
A broadband dielectric spectroscopic (BDS) study of poly(2,5-benzimidazole) revealed three sub-glass relaxations and themanner in which the time scales of these local molecular motions shift with annealing temperature and time. Also issuingfrom the BDS studies was a trend in the degree of connectivity of charge migration pathways and conductivity withannealing temperature and time. These studies were complemented with dynamic mechanical analysis, which showed the samerelaxations, and solid state 1H and 13C NMR studies that showed hydrogen bonding group mobility versus temperature. Wideangle X-ray diffraction investigations indicated an increase in chain-packing efficiency that was used to rationalize the BDS andNMR results.c© 2011 Society of Chemical Industry
Keywords: ABPBI; annealing; dielectric spectroscopy; molecular dynamics; relaxation
INTRODUCTIONPoly(2,5-benzimidazole) (ABPBI) is one of the most thermally stablepolymers having excellent chemical resistance. It has an aromaticheterocyclic rigid backbone that imparts high strength-to-weight,resulting in good dimensional stability at high temperatures.1,2
The hygroscopic nature of ABPBI results in a relatively highequilibrium water content (15%–18%).3 Intermolecular hydrogenbonds form between nitrogen and nitrogen–hydrogen groups inABPBI and incorporated water. Fibers of ABPBI produced by dryspinning4 find applications in a firefighter’s protective apparel,race car drivers’ suits and astronaut flight suits, fire-blocking layersand wall fabrics of aircraft. The densely packed macromolecularstructure and rigid backbone cause difficulty in melt processing,although techniques for preparing ABPBI films by solvent castingwith high orientation and superior mechanical properties arewell developed.1,5 ABPBI in the form of membranes has potentialapplications in the areas of gas separation technologies and fuelcells. With regard to the latter, ABPBI polymers, when phosphoricacid doped, show high proton conductivity at low relative humidity(RH) in the high temperature range of 100 to 200 ◦C which is ofbenefit with regard to optimal electrode kinetics.6,7 This materialis not commercially available and has a chemical structure similarto that of commercial polybenzimidazole (PBI) but without theconnecting phenyl group. ABPBI has the advantage of easier,less expensive monomer synthesis by a condensation reaction of3,4-diaminobenzoic acid in polyphosphoric acid.
The annealing of polymers beneath their glass transitiontemperatures supplies thermal kinetic energy that lowers freevolume in amorphous regions and increases the efficiency ofchain packing in crystalline regions. These microstructural shiftsslow the dynamics of macromolecular motions as there aremore mobility constraints on chains. Polymers that incorporate
water will dehydrate upon heating so that the chains seek outmore efficient packing, thereby increasing the overall strengthof intermolecular interactions and resulting in greater materialcohesion and decreased molecular mobility.
The work presented here addresses the results of ABPBIannealing on a fundamental level, namely the shift in the dynamicsof motions in the polymer chains. Owing to the fact that ABPBI hasa glass transition temperature greater than 450 ◦C, the relaxationsinvestigated over lower temperatures are short ranged. Theprimary tool of inquiry is broadband dielectric spectroscopy (BDS).BDS is particularly well suited for this investigation because it isable to sense molecular motions over a vast range of time anddistance scales.
While there have been prior studies of similar polymers, theconclusions were speculative and offer no specific assignmentsof molecular motions for the relaxations observed in the workreported here. The relevant literature, such as it is, and conclusionsderived therein are as follows.
Gillham discussed the thermomechanical behavior of polyben-zimidazole as studied by torsion braid analysis.8 Relaxation peakswere observed at around −70 ◦C, 310 ◦C and 430 ◦C, but no ex-planations of their origins were offered. Aharoni and Litt reported
∗ Correspondence to: Kenneth A. Mauritz, School of Polymers and High Per-formance Materials, University of Southern Mississippi, Hattiesburg, MS39406-0001, USA. E-mail: [email protected]
a School of Polymers and High Performance Materials, University of SouthernMississippi, Hattiesburg, MS 39406-0001, USA
b Faculty of Science, Department of Chemistry, Bani Suef University, Bani Suef,Egypt
Polym Int 2012; 61: 55–64 www.soci.org c© 2011 Society of Chemical Industry

56
www.soci.org A Nalawade et al.
properties of poly(2,5-trimethylene benzimidazole).9 Dielectric tanδ versus temperature curves from around 21 to 180 ◦C for differ-ent molecular weights for the neutral form showed insignificantrelaxation activity until around 130–140 ◦C, after which the curvesrose until they were off-scale. Wereta et al.1 presented rheovibronstudies of original and drawn poly 2,5(6)-benzimidazole (ABPBI)films over the temperature range −150 to 120 ◦C. The drawn filmsare not of interest here as they possess an oriented morphology.The reported tan δ versus temperature scans at a vibrational fre-quency of 11 Hz showed only one sub-Tg thermal transition ataround −60 ◦C that was sensitive to moisture.1 This relaxation hadan activation energy of 10.2 kcal mol−1 (42.7 kJ mol−1).
Liang et al. investigated the thermal, dielectric and mechanicalrelaxations in poly(benzimidazole)/poly(etherimide) (PEI) blendsthat exhibited a lower critical solution temperature (LCST).10 Thedielectric and mechanical relaxation data were said to reflectwater desorption, solvent loss and phase separation above thePEI Tg although no particular relaxation assignments were offered.In any case, hydrogen bonding reactions between C O andN–H groups pose a complication and the blend exhibits lowercritical solution temperature behavior. Menczel performed DSCand dynamic mechanical analysis (DMA) studies of PBI fibers.2
The following conclusions were drawn for as-spun (unoriented)fibers. DMA indicated an α relaxation (Tg) at 465 ◦C. A sub-Tg
(β) relaxation at 290 ◦C was speculated as arising from water orsolvent release. A relaxation (γ ) was observed at 20 ◦C that wassuggested to arise from the rotation of two benzimidazole rings.The lowest temperature relaxation (δ) at −90 ◦C was speculatedto arise from the onset of rotation of the m-phenylene ring.Lushcheikin et al. reported the results of a dielectric relaxationstudy of poly(diphenylenebenzimidazole terephthalamide) andpoly(p-phenylene terephthalamide) over the temperature range18–340 ◦C.11 ε′′ maxima were seen at above 230 ◦C (α), near 150 ◦C(β) and in the range 50–80 ◦C (γ ). The γ relaxation was said to berelated to structural rearrangements due to breaking of hydrogenbonds and water desorption. The β relaxation was ascribed tothe activation of local mobility in terms of rotational oscillationsof p-substituted benzene fragments. The high temperature α
relaxation was ascribed to a glass transition.While a detailed BDS study of acid-doped ABPBI would be
relevant in the context of fuel cell membranes, the limited studypresented here was intended to be only the first step in progressingto more complicated materials that resemble fuel cell membranes.The results of these limited studies are simply intended to providebaseline information against which information gleaned fromacid-doped materials will be compared as it is logical to establishthe relaxation behavior of undoped materials before investigatingmore complex doped ABPBI.
EXPERIMENTALMaterialsThe ABPBI samples were synthesized by M.H. Litt et al. at CaseWestern Reserve University. P2O5 and H3PO4 were placed into athree-necked flask equipped with mechanical stirrer and a nitrogeninlet tube. The flask was placed in a dry box and heated to 160 ◦Cto dissolve all the P2O5, and sparged with nitrogen for 1 h. Thesample was cooled to room temperature and recrystallized 3,4-diaminobenzoic acid was added. The solution was stirred and thetemperature was raised to 200 ◦C and held for 2 h. The gelledsolution was removed from the flask and cooled with liquidnitrogen. Fine ABPBI powder was obtained by pulverizing in a
blender. The powder was washed with boiling water until neutralpH was obtained. The powder was filtered and dried under vacuumat 150 ◦C. Further details of the synthesis of the ABPBI membraneused in these studies are given elsewhere.12 – 16
Samples were stored in a controlled humidity chamber at 19%RH until dielectric spectroscopy experiments were conducted.ABPBI materials have equilibrium water contents of ca 18%. Asmentioned, these materials, when doped with acid, are used asproton exchange membranes in fuel cells that operate at hightemperature with RH = 10%–30%. The value of 19% RH used hereis in the middle of this range, which is why it was selected forour studies. Membrane hydration is influenced by incorporatedphosphoric acid but, as mentioned, these initial studies are strictlymeant to establish baseline information without the complicationsintroduced by imbibed acid.
Film castingAs reported earlier,5,16 1 g of pulverized ABPBI powder was refluxedin 20 mL of 100% ethanol containing 0.63 g sodium hydroxideuntil the polymer dissolved. The solution was filtered with a coarsesintered glass pressure filter (30 psi) and stored under N2. Filmswere cast by pouring solutions onto glass plates and drying invacuum at 40 ◦C for 24 h, after which they were washed with wateruntil they were neutral and then dried in vacuum at 25 ◦C for 48 h.Films with uniform thickness of 31±1 µm were obtained and usedfor the characterization procedures discussed below.
DMADMA experiments were conducted on ABPBI films using a TA Q800system (TA Instruments, New Castle, Delaware, USA). Rectangularsamples of dimensions 3 × 12 mm were run under nitrogen intensile mode using strain control with an amplitude of 20 µmand a frequency of 1 Hz. The temperature (T) was increased from−80 ◦C to 350 ◦C at a rate of 2 ◦C min−1 and the dynamic losstangent (tan δ = E′′/E′, where E′′ and E′ are the imaginary and realtensile modulus, respectively) versus T curves were determined forthe purpose of identifying mechanical relaxations to be comparedwith the observed dielectric relaxations.
BDSBDS spectra were collected using a Novocontrol GmbH Concept40 Broadband Dielectric Spectrometer (NOVOCONTROL Technolo-gies GmbH & Co. KG, Hundsangen, Germany) over the frequency(f ) range 0.1 Hz to 3 MHz and over the temperature range −80to 250 ◦C in 10 ◦C increments. Also, spectra were collected un-der isothermal conditions within the same frequency range attemperatures of 90, 120, 140, 160 and 200 ◦C. Each experimentconsisted of f sweep iterations at constant temperature for 5.7 h.The temperature stability of the instrument was controlled towithin ±0.2 ◦C. All films were preconditioned in a controlled hu-midity chamber at 19% RH at room temperature for 7 days. Sinceall films experienced exactly the same hydration history it is as-sumed that the same amount of water exists in all samples at thebeginning of each BDS in situ annealing experiment. Samples werecut to a diameter of 2 cm and placed between two 2 cm diametergold coated copper electrodes. Aluminum foil was sandwichedbetween the film sample and electrode to avoid any adherenceof polymer to the gold-coated electrode surface. Curve fitting todielectric permittivity data was performed using the NovocontrolWinfit program. The Havriliak–Negami equation (discussed later)
wileyonlinelibrary.com/journal/pi c© 2011 Society of Chemical Industry Polym Int 2012; 61: 55–64

57
Broadband dielectric spectroscopy studies of glassy-state relaxations www.soci.org
was best-fitted to loss spectra (ε′′ versus f ) for each sample to ob-tain parameters that quantify the nature of relaxations and chargeconductivity.
Wide angle X-ray diffraction (WAXD)Samples that were annealed in the BDS instrument at temperaturesfrom 90 to 200 ◦C were also studied for crystalline content atroom temperature using a Rigaku Ultima III wide angle X-raydiffractometer (Rigaku Americas Corp., Texas, USA) in reflectionmode. The X-ray source was Cu Kα (λ = 0.154 nm). In thisexperimental arrangement, X-rays can interrogate up to around100 µm depth into samples. However, the membranes used inthese studies have uniform thicknesses of 31 ± 1 µm which isless than the penetration depth. Thus, the interior as well asnear surface region was probed. Membranes were mounted on asample holder and scanned for diffracted X-ray intensity at anglesof 2θ from 2◦ to 40◦ at a constant speed of 0.5◦ min−1.
Solid-state NMR spectroscopySolid-state NMR spectroscopic studies were performed using aVarian UNITYINOVA 400 spectrometer with a Chemagnetics 3channel 4 mm PENCILO-style probe. Samples were loaded intozirconia rotor sleeves, sealed with Teflon caps and spun at a rateof 10.0 kHz. 13C spectra were acquired using either the standardcross-polarization/magic angle spinning (CP/MAS) technique17 orthe variable amplitude cross-polarization method18 with high-power proton decoupling implemented during data acquisition.Carbon acquisition parameters were as follows: the 1H 90◦ pulsewidth was 4.0 ms, the cross-polarization contact time was 1 or3 ms, the dead time delay was 6.4 ms and the acquisition timewas 45 ms. A recycle delay of 3 s between scans was utilizedand the 1H decoupling field of 62.5 kHz was implemented duringacquisition. The number of scans accumulated for each spectrumranged from 4800 to 10 000. Proton MAS spectra were obtainedusing a 4.0 ms 1H 90◦ pulse width, a recycle delay of 3 s andan acquisition time of 150 ms. The spectral width was 50 kHz,and the free induction decay (FID) was composed of 15 000 datapoints. The FID was zero-filled to 32K points and apodized withan exponential filter of 20 Hz prior to application of the Fouriertransform. Sixteen transients were co-added for each spectrum.Chemical shifts were referenced externally to adamantane (upfieldpeak in 13C 29.5 ppm, 1H shift 1.63 ppm).
RESULTS AND DISCUSSIONDynamic mechanical and dielectric relaxation resultsA dynamic mechanical tan δ versus temperature curve for anABPBI film is shown in Fig. 1. There are three secondary relaxationprocesses labeled β , γ and δ in decreasing order of temperature.These sub-Tg relaxations presumably result from short-rangemacromolecular motions in the usual sense. The δ process occursbetween −50 and 40 ◦C and there is a β peak at around 270 ◦Cas well as a γ relaxation that appears as a shoulder on theformer at around 225 ◦C. The glass transition temperature of thesematerials is of no interest here because it takes place at veryhigh temperatures of ca 450 ◦C.10,19,20 Hence, the experimentswere conducted over the temperature range −80 to 250 ◦C withinwhich fuel cells (ABPBI with added phosphoric acid) operate.
A dielectric tan δ versus temperature plot for f = 1.14 Hz isshown in Fig. 2 to compare with the corresponding dynamicmechanical tan δ versus temperature curve in Fig. 1. As in
Figure 1. Dynamic mechanical tan δ versus T (at f = 1 Hz) showing β , γ
and δ sub-Tg relaxations.
Figure 2. Dielectric tan δ versus T (at f = 1.14 Hz) showing β , γ and δ
relaxations.
the dynamic mechanical case, there are three relaxations: aδ process from −50 to 25 ◦C, a broad γ process from 30 to180 ◦C and a β process above 200 ◦C. The dielectric relaxationsappear at lower temperatures than the corresponding dynamicmechanical relaxations. While the frequencies of perturbation inboth experiments are practically equal, differences in temperaturepositions, intensities and shapes of the curves in Figs 1 and 2 aredue in part to the material excitations being of a different nature(mechanical versus electrical oscillations).
The viscoelastic relaxation observed for ABPBI at around −60 ◦Cby Wereta et al.1 is in close vicinity to the δ relaxation seen inFig. 1. At most, it can be said that this relaxation, given theabsence of side-chains, involves local backbone motions in ageneral sense. It is difficult to assign the γ peaks in the DMA anddielectric spectra to the same mechanism owing to significantlydifferent peak temperatures (DMA 230 ◦C versus dielectric 110 ◦C).This difference is too great to be attributed to differences inexperimental methods. In the realm of speculation, perhaps theserelaxations are due to local chain motions caused by hydrogenbond rearrangements caused by water desorption. In the same
Polym Int 2012; 61: 55–64 c© 2011 Society of Chemical Industry wileyonlinelibrary.com/journal/pi

58
www.soci.org A Nalawade et al.
Figure 3. Dielectric ε′ versus T at f = 1.14 Hz.
realm of speculation, theβ transition might be considered to reflectthe mobility of chain segments in close proximity to crystallites asdiscussed by Parepechko.21
As seen in Fig. 3, ε′ at f = 1.14 Hz increases with increasein temperature owing to an increase in electrical polarizabilitydue to increased polymer dipole mobility affected by an increasein thermal kinetic energy, although the very high values of ε′at the highest temperatures might be due to sample–electrodeinterfacial polarization.
In order to extract useful parameters that quantify relaxations,the Havriliak–Negami equation22 – 24 was fitted to experimentaldata. This equation for the complex dielectric permittivityε∗ = ε′ − iε′′, where ε′ and ε′′ are the real and imaginarycomponents, is given by
ε∗(ω) = ε′ − iε′′ = −i
(σ dc
ε0ω
)N
+3∑
k=1
[εk
(1 + (iωτHN)αk )βk+ ε∞k
](1)
There are three relaxation terms in the sum and the term onthe left accounts for dc conductivity, when present. ε0 is thevacuum permittivity and ω = 2π f . For each relaxation term k,εk = (εR − ε∞)k , is the difference between ε′ at very low andvery high frequencies, respectively. In the first term σ dc is thedc conductivity and N characterizes conduction in terms of thenature of charge hopping pathways and mobility constraints, aswill be discussed later.25 – 29 The parameters α and β characterizethe breadth and symmetry, respectively, of ε′′ versus ω peaks.τHN, the Havriliak–Negami relaxation time, is related to the actualrelaxation time at loss peak maximum (τmax) by the equation30
τmax = τHN
sin
(παβ
2(β + 1)
)
sin
(πα
2(β + 1)
)
1α
(2)
The dc term accounts for inherent or unintended (impurity)charge migration that is often subtracted to uncover loss peaksat low frequencies corresponding to macromolecular motions. Asthe experimental time scale, i.e. one-half the period of electric fieldoscillation = (2f )−1, increases, mobile charges can execute moreelementary hops before the applied field reverses. In the low f
Figure 4. ε′′ − f − T surface for ABPBI membrane preconditioned in 19%RH at room temperature. Isothermal frequency sweeps from −80 to 250 ◦Cin 10 ◦C increments without BDS in situ annealing. The β and γ peaks arehighly overlapped in this view.
Figure 5. Log relaxation time versus 1/T for an in situ annealed ABPBI filmfor the δ relaxation.
region, ε′′ is directly proportional to σ dc according to the equation
ε′′ ≈ σ dc/2π fε0 (3)
An overall view of relaxations is seen on the three-dimensionalε′′ − f − T surface shown in Fig. 4. All β , γ and δ relaxations shift tohigher frequency with increase in temperature as expected owingto greater thermal excitation of molecular motions. Due to overlapof the high temperature relaxations β and γ , they are not resolvedon the response surface. The upswing of the surface at low f andhigh T is due to dc conductivity.
Figure 5 is a log relaxation time versus inverse T plot for thelow temperature δ relaxation whose peak does not overlap thoseof the higher temperature relaxations. This plot is linear whichis characteristic of short-range motions in the glassy state. Theactivation energy for the relaxation, derived from the slope of theline, is 73.27 kJ mol−1. Wereta et al.1 reported an activation energyfor ABPBI for a relaxation observed around the same temperaturerange of 42.7 kJ mol−1. This activation energy varied with the type
wileyonlinelibrary.com/journal/pi c© 2011 Society of Chemical Industry Polym Int 2012; 61: 55–64
59
Broadband dielectric spectroscopy studies of glassy-state relaxations www.soci.org
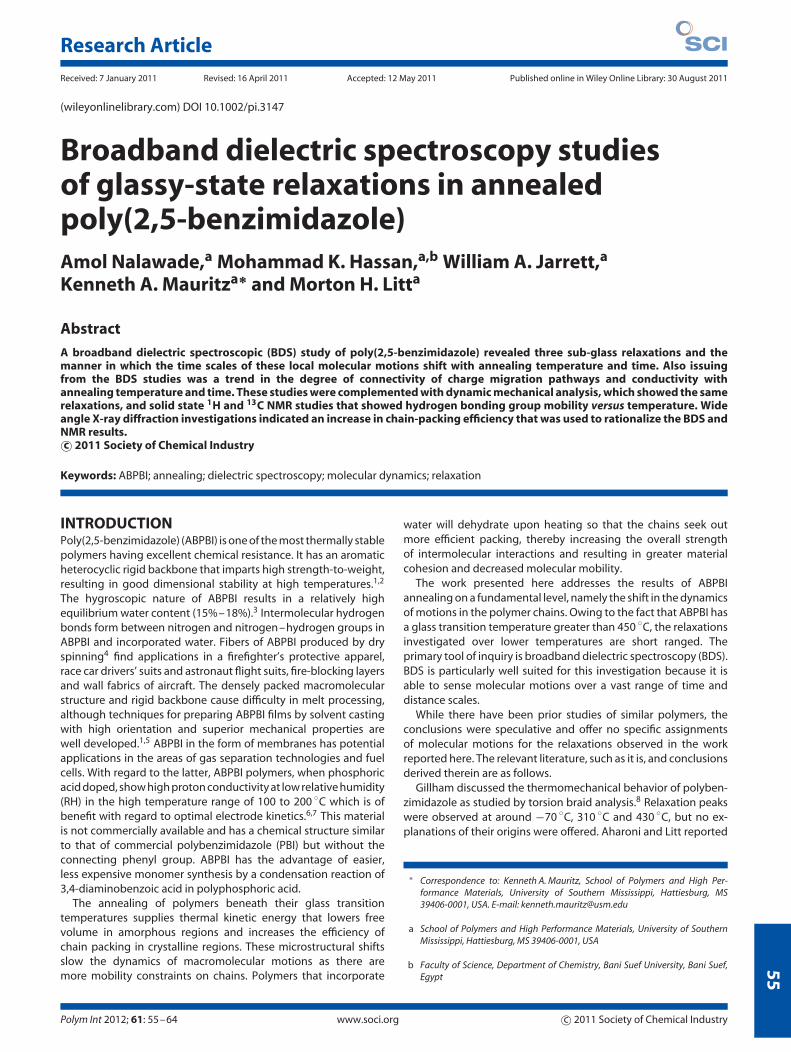
Figure 6. ε′′ versus f showing leftward shift in the δ relaxation peak versusBDS in situ annealing time at 90 ◦C; dc contribution is subtracted from thespectra.
Figure 7. ε′′ versus f showing changes in δ and γ relaxation peaks for threereal-time BDS in situ annealing times at 120 ◦C; dc contribution has beensubtracted for all curves.
of film casting solvent and increased with film drawing in theirexperiments.1
ε′′ versus f spectra for which the low frequency dc contributionwas subtracted show changes in the δ relaxation peak in responseto real-time BDS in situ annealing at 90 ◦C for 25, 100 and 325 min,as displayed in Fig. 6. The Havriliak–Negami equation can be fittedto these data very well to effect this subtraction. With increasedannealing time, the curves shift to lower frequency and becomenarrower and the peak height decreases. It is suggested thatannealing results in loss of moisture and less free volume whichmakes these particular molecular motions more difficult owing tobetter chain packing on a local level, as discussed for the case ofsimilar studies of Nafion membranes.31 The peak narrowing canbe reasonably ascribed to a narrowing distribution of free volumepocket sizes. The reduction in peak area might be accountedfor by a suppression of the molecular fragments involved in thisrelaxation.
Similar trends are observed for the δ relaxation for a sampleannealed in situ at the higher temperature of 120 ◦C, as shown
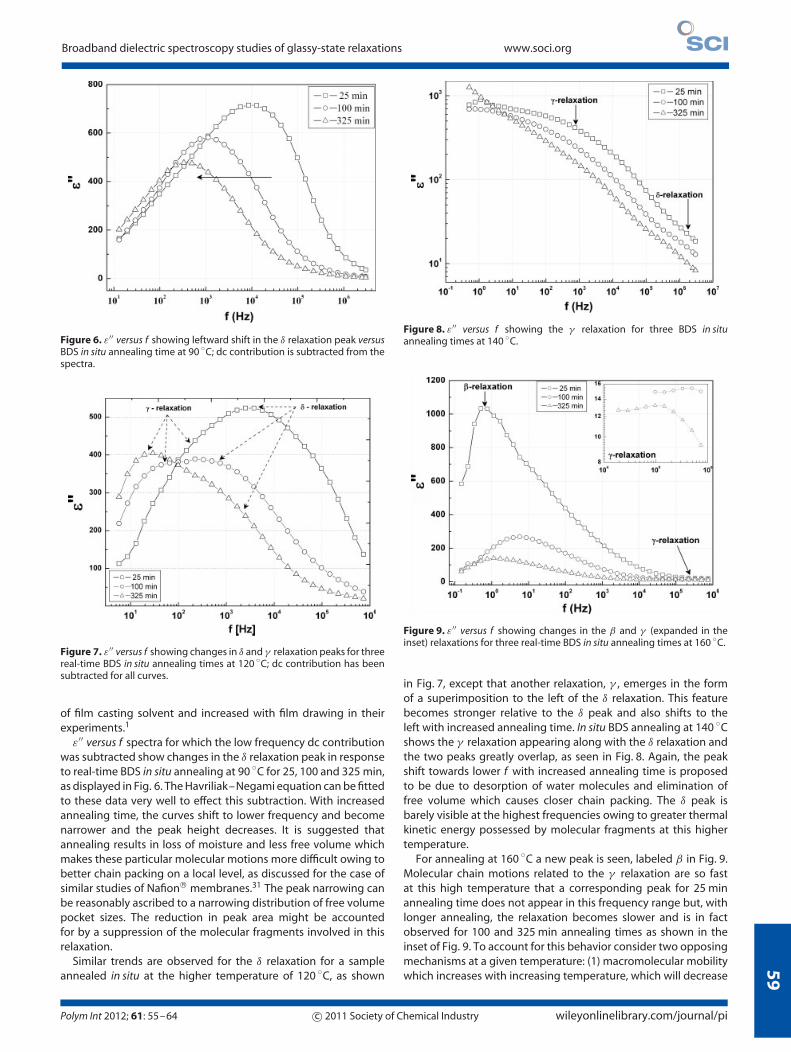
Figure 8. ε′′ versus f showing the γ relaxation for three BDS in situannealing times at 140 ◦C.
Figure 9. ε′′ versus f showing changes in the β and γ (expanded in theinset) relaxations for three real-time BDS in situ annealing times at 160 ◦C.
in Fig. 7, except that another relaxation, γ , emerges in the formof a superimposition to the left of the δ relaxation. This featurebecomes stronger relative to the δ peak and also shifts to theleft with increased annealing time. In situ BDS annealing at 140 ◦Cshows the γ relaxation appearing along with the δ relaxation andthe two peaks greatly overlap, as seen in Fig. 8. Again, the peakshift towards lower f with increased annealing time is proposedto be due to desorption of water molecules and elimination offree volume which causes closer chain packing. The δ peak isbarely visible at the highest frequencies owing to greater thermalkinetic energy possessed by molecular fragments at this highertemperature.
For annealing at 160 ◦C a new peak is seen, labeled β in Fig. 9.Molecular chain motions related to the γ relaxation are so fastat this high temperature that a corresponding peak for 25 minannealing time does not appear in this frequency range but, withlonger annealing, the relaxation becomes slower and is in factobserved for 100 and 325 min annealing times as shown in theinset of Fig. 9. To account for this behavior consider two opposingmechanisms at a given temperature: (1) macromolecular mobilitywhich increases with increasing temperature, which will decrease
Polym Int 2012; 61: 55–64 c© 2011 Society of Chemical Industry wileyonlinelibrary.com/journal/pi

60
www.soci.org A Nalawade et al.
Figure 10. ε′′ versus f showing changes in the β and γ relaxations for threereal-time BDS in situ annealing times at 200 ◦C. The γ relaxation and itsshift to lower frequency are magnified in the inset.
Figure 11. δ relaxation time versus annealing time at temperatures of 90,120 and 140 ◦C.
the relaxation time; (2) opposing this, temperature-driven waterloss reduces free volume which will increase the relaxation timeby affecting more closely packed chains. It seems that (2) will bedominant at higher temperatures. Thus, in progressing from 160 to200 ◦C, the γ relaxation becomes more sluggish due to water lossand its peak shifts down into the experimental frequency range.The β relaxation diminishes in intensity with increased annealingtime but the peak shifts to a higher frequency before it shiftsto the left. This non-monotonic behavior might be related to amorphological change caused by time of annealing, although thismust be verified.
Both the β and γ relaxations are observed at 200 ◦C for allannealing times, as seen in Fig. 10, and theβ relaxation is dominant.Both β and γ peaks shift towards lower frequency with annealingtime. The β relaxation corresponding to 325 min of annealing timeis not seen clearly on the graph. The corresponding peak height ismore suppressed due to more complete moisture desorption anddecreased free volume which results in a decrease in the numberof relaxing units. All β , γ and δ relaxations show similar trends withannealing time but the underlying molecular motions might beexpected to occur at increasingly longer time scales in this order.
Figure 12. γ relaxation time versus annealing time at temperatures of 120,140 and 160 ◦C.
Figure 13. β relaxation time versus annealing time at temperatures of 160and 200 ◦C.
Figures 11, 12 and 13 show δ, γ and β relaxation times versusBDS in situ annealing time. In Fig. 11 the δ relaxation timeis plotted for annealing temperatures 90, 120 and 140 ◦C. At140 ◦C, the δ relaxation occurs at an fmax = (2πτmax)−1 thatis so high that the peak is out of the experimental frequencyrange and therefore no points can be gathered beyond ca140 min, as seen in the figure. The δ relaxation time curves shiftupward with increased annealing temperature which indicatesslower molecular motions with increased sample drying. At eachtemperature τmax increases with annealing time and reachesa horizontal asymptote at which presumably most, if not all,water molecules have evacuated the sample. The asymptoteoccurs progressively earlier with increased temperature due toan increasingly faster water desorption rate. The overall changesin relaxation time are to within a little more than an order ofmagnitude at each temperature although the curves are separatedby orders of magnitude. In concept, there are two mechanismsthat interplay at a given temperature: (1) macromolecular mobilityincreases with increasing temperature which will decrease therelaxation time; (2) opposing this, water loss reduces free volumewhich will increase the relaxation time. The evidence suggests that(2) will be dominant at higher temperatures.
wileyonlinelibrary.com/journal/pi c© 2011 Society of Chemical Industry Polym Int 2012; 61: 55–64

61
Broadband dielectric spectroscopy studies of glassy-state relaxations www.soci.org
Figure 14. Charge pathway interconnectivity parameter N versus anneal-ing time at 90, 160 and 200 ◦C.
Figure 15. σ dc versus annealing time at 90, 160 and 200 ◦C.
The γ relaxation peak appears in the experimental frequencyrange from 120 ◦C upward while the β relaxation begins at around160 ◦C. Similar trends as for the δ relaxation are observed forboth γ and β relaxations with annealing time. The degree towhich β relaxation motions occur faster than those for the γ
relaxation is seen in these figures. Data scatter is due, in part, tothe accuracy with which relaxation peaks can be resolved from thetotal spectrum.
The exponent N in Eqn (1) is a rough index of morphological‘texture’ and the degree to which proton hopping pathways areinterconnected.25 – 29,32 N = 1 corresponds to an ‘ideal’ conductorwherein contiguous charge pathways span the entire sampledimensions and charge drift is dominant over random hopping.N < 1 indicates charge traps or dead ends on the conductivitygrid and N = 1/2 suggests random charge conducting paths. Ndecreases as charge traps become more numerous on the grid. Inprinciple, N is related to the degree of morphological order andmacromolecular dynamics in the membrane.
Fitted values of N are plotted against annealing time for threetemperatures in Fig. 14. N values for 90 ◦C are lower than thosefor 160 and 200 ◦C. It is noted that the system passes through
Figure 16. ε versus annealing time for the δ relaxation at temperaturesof 90, 120 and 140 ◦C.
the γ relaxation between 90 and 160 ◦C which might influence Nthrough an increase in molecular mobility. Perhaps the activationof the molecular motions associated with this relaxation causesan increase in the connectivity of charge conducting pathways,thereby causing the increase in N at a given time. The highestvalue of N (ca 1) is observed at the beginning of annealing atall three temperatures which suggests highly contiguous chargepathways, but these pathways become disrupted with increase inannealing time when charge traps develop as free volume pocketsbecome smaller and water molecules leave so that N can be lessthan 0.5.
This idea is reinforced in Fig. 15 which indicates that σ dc
increases with increase in annealing time. This behavior at firstappears counter-intuitive as it is expected that conductivitywill decrease due to increase in charge traps and removal ofwater molecules along which protons could hop via the Grotthusmechanism. N and σ dc in this system are related inversely ratherthan directly. One explanation might involve –NH group protondonors coming closer to each other with drying so that protonhopping shifts from the situation of taking place between watermolecules to occurring primarily between –NH–and –N donorand acceptor groups, respectively. Loss of water molecules wouldcause closer chain packing, which in turn would form strongerhydrogen bonds, thereby increasing conductivity. An increasein hydrogen bonding strength was in fact observed with thevariable temperature NMR results discussed later. Similar trendswere observed for N and σ dc for BDS in situ annealed Nafion
membranes.31
It should be emphasized that σ dc values extracted by BDSanalysis are not expected to be the same as those generatedby the in-plane four-point probe fringing field method usedto determine the charge conductivity of conducting films for anumber of reasons. Rather, conductivity values generated usingBDS are intimately connected with local polymer structure anddynamics coupled with the long-range charge hopping process.The low values of N are reflective of charge hopping on an ultra-structural level at which ohmic conduction has little meaning.
The dielectric strength ε is proportional to the density ofdipoles involved in a given relaxation.33 As seen in Fig. 16, ε
for the δ relaxation decreases with increased annealing time forall three temperatures. ε values and the magnitude of the
Polym Int 2012; 61: 55–64 c© 2011 Society of Chemical Industry wileyonlinelibrary.com/journal/pi

62
www.soci.org A Nalawade et al.
Figure 17. G(τ ) at 90 ◦C for the δ relaxation for three annealing times.
initial drop in ε is greater for the highest temperature which isreasonable considering that the rate of water loss will increasewith increasing temperature, which will account for the large dropin ε at 140 ◦C. The large initial ε value could be explainedby an increase in water molecule dipole reorientation mobility,which, however, becomes greatly restricted with increased dryingtime and diminishing free volume in the amorphous fraction ofthe polymer. An increase in crystallinity upon sample annealing,discussed later, would also hinder molecular chain motions andthe number of dipoles capable of reorientation to reduce thedielectric strength.34 – 36 The 140 ◦C curve cannot be seen after150 min of annealing because this relaxation becomes very slowand moves out of the experimental time scale.
A rationalization of the rise in the curve from 120 to 140 ◦Ccan only be offered in the spirit of speculation. At 90 ◦C thewater desorption rate would be slower than at 120 ◦C whichwould result in lowered ε with increase in temperature. Perhapsbeyond 120 ◦C, having evacuated most water molecules andcollapsing a significant fraction of free volume, the molecularmotions then become more active as thermal kinetic energyovercomes intermolecular interactions, thereby enhancing dipolemobility.
Similar trends are observed for ε versus annealing time for theβ and γ relaxations (not shown). For both relaxations, an initialrapid drop in ε followed by a slower drop is explained by thesame reasoning offered above.
In the Havriliak–Negami equation α and β determine thedistribution of relaxation times, G(τ ), such that α characterizesthe distribution breadth and β , by its deviation from unity,characterizes the degree of curve symmetry. G(τ ) is given bythe following equation:23
G(τ ) =
(τ
τ 0i
)β iαi
sin(β i i)
πτ
((τ
τ 0i
)2αi
+ 2
(τ
τ 0i
)αi
cos(παi) + 1
) β i2
(4)
where
i = arctan
sin(παi)(
τ
τ 0i
)αi
+ cos(παi)
Figure 18. G(τ ) at 200 ◦C for the β relaxation for three annealing times.
G(τ ) curves at 90 ◦C for the δ relaxation and at 200 ◦C forthe β relaxation for three annealing times are given in Figs 17and 18. The dc contribution was subtracted so that the distributionapplies to pure relaxation peaks. The decreasing area underthe curves for both relaxations with increasing annealing timeindicates a diminishing number of relaxing elements or frozen-in dipole motions. Another general feature possessed by bothdistributions is that they are multimodal, indicating structuralheterogeneity at the scale of the respective molecular motions.No significant distribution broadening versus annealing time isobserved for either relaxation although the distributions shift tolonger relaxation times.
WAXD resultsABPBI materials have a degree of chain packing order althoughX-ray scans show few reflections.1,5 – 7,37 – 39 This paucity ofreflections was also observed in the WAXD results presentedhere. As in other semicrystalline polymers, it was presumed thatdegree of chain order increases with increased annealing as theimparted thermal kinetic energy allows for chains to seek out theirminimum free energy packing. This structural reorganization mustbe considered in addition to water desorption in understandingshifts in macromolecular relaxation behavior that result fromannealing.
WAXD intensity versus 2θ scans obtained for films that wereannealed BDS in situ at different temperatures are displayed inFig. 19. For the control sample, there is a broad unsymmetricdiffraction peak at 2θ = 26◦ which corresponds to a Bragg spacingof about 3.4 Å. This spacing corresponds to the perpendiculardistance between planes composed of stacked aromatic rings.1,5
There is a broad wing to the left of the peak at 2θ = 18◦ whichcorresponds to a Bragg spacing of 4.9 Å. Upon annealing, thiswing develops into a somewhat less broadened peak. The peakemergence could be due to formation of smaller crystallites orto ordering within largely disordered regions of ABPBI molecules.Clearly, the increase in annealing temperature from 90 to 200 ◦Caffected greater packing order. This increase in chain packingefficiency reduces the average free volume, which, in turn, wouldincrease the time scales of the molecular motions underlyingthe relaxations discussed above. Moreover, the shifting of chainsto closer proximity would increase intermolecular interactions,including hydrogen bonding.
wileyonlinelibrary.com/journal/pi c© 2011 Society of Chemical Industry Polym Int 2012; 61: 55–64

63
Broadband dielectric spectroscopy studies of glassy-state relaxations www.soci.org
1612 20
2θ24 28 32
120 °C
90 °C
200 °C
140 °C
160 °C
control sample
Figure 19. WAXD scans for an unannealed control and BDS in situ annealedABPBI films at different temperatures.
Figure 20. 1H variable temperature MAS NMR spectra of ABPBI attemperatures ranging from 25 to 225 ◦C. The vertical scale of the 25 ◦Cspectrum is magnified in the inset to show the 15 ppm peak.
Solid-state NMR resultsFigure 20 shows stacked 1H MAS spectra obtained at temperaturesfrom 25 to 225 ◦C. At room temperature the peaks are broadwith the aromatic ring C–H protons exhibiting a resonance at7.8 ppm. On the same spectra, further downfield another broadpeak is observed, composed of two separate peaks at ca 10.8 ppmand 15 ppm which are attributed to hydrogen-bonded ring N–Hprotons. The 15 ppm peak is not clearly seen on the spectra.In order to see it, the vertical scale of the 25 ◦C spectrum isincreased by a factor of 4 in the inset of Fig. 20. The temperature
Figure 21. 13C variable temperature CP/MAS NMR spectra of ABPBI attemperatures ranging from 25 to 225 ◦C.
rise from 25 to 75 ◦C increases the proton motions. The protonsrearrange themselves, increasing the effective hydrogen bondstrength and thus giving a less broad single peak at 11.3 ppmon the 75 ◦C spectrum. Henceforth, the 15 ppm peak observed at25 ◦C is no more seen at 75 ◦C and temperatures above. Theseshift ranges are consistent with hydrogen-bonded systems40 – 45
with sites undergoing stronger hydrogen bonding having thefurther downfield shifts. As the temperature increases from 25 to225 ◦C the aromatic proton linewidth narrows due to increasedproton motions while its 1H chemical shift remains unchanged.The resonance at 10.8 ppm observed for the 25 ◦C spectrum shiftsdownfield with increasing temperature (to 11.3 ppm at 75 ◦C andto 12.3 ppm at 125 ◦C and 175 ◦C). Interestingly, at 225 ◦C, theN–H peak shifts downfield to 12.8 ppm and broadens slightly.The downward shift confirms hydrogen bond strengthening. Thechains would seem to move more rapidly as the temperatureincreases to 175 ◦C but at 225 ◦C hydrogen bonds must restrictring mobility resulting in resonance peak broadening. Proton lineshapes are sensitive to changes in mobility. Thus, in passing tohigher temperature, the increase in hydrogen bonding may be areason for increased relaxation time along with the consequenceof greater water desorption that would result in reduced freevolume, as observed in Figs 11, 12 and 13 for the δ, γ and β
relaxations respectively. The 1H MAS NMR spectra collected overthe temperature range 25–225 ◦C confirm the rearrangement ofN–H protons and hydrogen bond strengthening. The tan δ versusT plots by DMA and BDS (Figs 1 and 2 respectively) show that thesub-Tg γ relaxation occurs over the same temperature range asthe NMR variable temperature experimental range. Thus, the 1HMAS NMR results further confirm that the γ relaxation is due tolocal chain motions caused by hydrogen bond rearrangements.
Figure 21 shows variable temperature 13C CP/MAS spectra. Thelarge peak at ca 117 ppm is due to protonated carbon sites;the resonance at ca 126 ppm reflects the quaternary carbon in thebenzene ring; the peak at ca 135 ppm is for quaternary carbon sitesnext to the nitrogen atoms; the peak at ca 152 ppm is the imidazolecarbon. These spectra exhibit a decrease in signal-to-noise (S/N)as the temperature increases from 25 to 175 ◦C. This is consistentwith increased proton mobility decreasing the efficiency of cross-polarization. However, it appears that S/N increases at 225 ◦C. Inthe 1H MAS spectra, the linewidth for the N–H site also increasedat this temperature. These two observations would be consistent
Polym Int 2012; 61: 55–64 c© 2011 Society of Chemical Industry wileyonlinelibrary.com/journal/pi

64
www.soci.org A Nalawade et al.
with a slight decrease in proton mobility. The absence of shiftin resonance peaks for 13C CP/MAS spectra implies that there islittle motion in the backbone, as is usual for rigid polymers. Also,the spectra for ABPBI were obtained at 225 ◦C using normal andvariable amplitude CP/MAS (VACP/MAS) methods (not shown).Variable amplitude CP/MAS is used for improving S/N in casesof very mobile (i.e. rubbery) samples or high speed (>15 kHz)MAS. The fact that a significant spectral signal is observed forthe VACP/MAS spectrum is another indicator that differences inproton mobility are responsible for the spectral changes.
CONCLUSIONSA dielectric spectroscopic investigation of sub-glass relaxationsin ABPBI uncovered and demonstrated the shift in these localmolecular motions with annealing time at different temperatures.The studies were complemented by dynamic mechanical analysesthat showed three secondary relaxation processes labeled β , γ
and δ in order of decreasing temperature. For all relaxations, itis suggested that annealing results in loss of incorporated waterwhich diminishes free volume which, in turn, renders molecularmotions more difficult owing to better chain packing on a locallevel. This view is supported by the fact that relaxation timeincreases with annealing for all three processes. This evolutionof chain packing efficiency, seen in the WAXD studies, affectsthe state of hydrogen bonding for relaxations influenced bythe interactions. A quantity N, a rough index of the degreeto which proton hopping pathways are interconnected, wasextracted from dielectric spectra at low frequencies. The highestvalue of N was observed at the beginning of annealing at alltemperatures suggesting highly contiguous charge pathways, butthese pathways become disrupted with decrease in annealingtime. This is explained in terms of charge traps that develop asfree volume pockets become smaller and the system is evacuatedof water molecules. The dc conductivity increases with increasein annealing time. An explanation for this involves increasedproton hopping between –NH–and –N proton donor andacceptor groups, respectively, that is brought about by the lossof water molecules that causes closer chain packing and strongerhydrogen bonds, thereby increasing conductivity. An increase inhydrogen bonding strength was in fact observed with the variabletemperature NMR results.
A general conclusion derived from these studies is that dielectricspectroscopy can be a powerful tool in the investigation ofpolymer relaxations and their relationship to proton conductivityin materials.
ACKNOWLEDGEMENTSThe authors gratefully acknowledge financial support provided bythe Department of Energy (Grant DE-FG36-08GO88106) for thiswork.
REFERENCES1 Wereta AJ, Gehatia MT and Wiff DR, Polym Eng Sci 18:204–209 (1978).2 Menczel JD, J Therm Anal Calorim 59:1023–1027 (2000).3 Brooks NW, Duckett RA, Rose J, Ward IM and Clements J, Polymer
34:4038–4042 (1993).
4 Conciatori AB, Chenevey EC, Bohrer TC and Price AE, J Poly Sci C19:49–64 (1967).
5 Cho J, Blackwell J, Chvalun SN, Litt MH and Wang Y, J Polym Sci PolymPhys 42:2576–2585 (2004).
6 Asensio JA, Borros S and Gomez-Romero P, J Membr Sci 241:89–93(2004).
7 Asensio JA and Gomez-Romero P, Fuel Cells 5:336–343 (2005).8 Gillham JK, Polymer Preprints, American Chemical Society, Division of
Polymer Chemistry, pp. 513–519 (1966).9 Aharoni SM and Litt MH, J Polym Sci Polym Chem Ed 12:639–650 (1974).
10 Liang K, Banhegyi G, Karasz FE and MacKnight WJ, J Polym Sci PolymPhys 29:649–657 (1991).
11 Lushcheikin GA, Shchetinin AM and Frenkel GG, Polym Sci Ser B46:1230–1234 (2004).
12 Litt MH, Ameri R, Wang Y, Savinell R and Wainright J, Mater Res SocSymp Proc 548:313 (1999).
13 Savinell RF and Litt MH, (eds) US Patent 5,525,436, Case WesternReserve University, Cleveland, OH (1996).
14 Savinell RF and Litt MH, (eds) US Patent 5,716,727, Case WesternReserve University, Cleveland, OH (1998).
15 Asensio JA, Borros S and Gomez-Romero P, Electrochem Commun5:967–972 (2003).
16 Wang Y, PhD Thesis, Case Western Reserve University, Cleveland, OH(1997).
17 Schaefer J, Stejskal EO and Buchdahl R, Macromolecules 10:384–405(1977).
18 Peersen OB, Xiaoling W and Smith SO, J Magn Reson, Ser A106:127–131 (1994).
19 Kim T-H, Lim TW, Park Y-S, Shin K and Lee L-C, Macromol Chem Phys208:2293–2302 (2007).
20 Guerra G, Williams DJ, Karasz FE and MacKnight WJ, J Polym Sci PolymPhys 26:301–313 (1988).
21 Perepechko II, Khimiya, Moscow 188 (1973).22 Havriliak S and Negami S, J Polym Sci Polym Symp 14:99–103 (1966).23 Havriliak S and Negami S, Polym J 8:161–205 (1967).24 Negami S, Ruch RJ and Myers RR, J Colloid Interface Sci 90:117–126
(1982).25 Mauritz KA and Fu R-M, Macromolecules 21:1324–1333 (1988).26 Mauritz KA and Yun H, Macromolecules 21:2738–2743 (1988).27 Mauritz KA, Macromolecules 22:4483–4488 (1989).28 Deng ZD and Mauritz KA, Macromolecules 25:2369–2380 (1992).29 Mauritz KA and Yun H, Macromolecules 21:220–225 (1989).30 Kremer F and Schonhals A, Broadband Dielectric Spectroscopy. Springer,
Berlin (2003).31 Hassan MK and Mauritz KA, ECS Trans 25:371–384 (2009).32 Deng ZD and Mauritz KA, Macromolecules 25:2739–2745 (1992).33 Froehlich H, Theory of Dielectrics. Oxford University Press, Oxford
(1949).34 Fulcher GS, J Am Ceram Soc 8:339–355 (1923).35 Tammann G and Hesse WZ, Z Anorg Allg Chem 156:245–247 (1926).36 Ezquerra TA, Majszczyk J and Balta-Calleja F-J, PhysRevB 50:6023–6031
(1994).37 Asensio JA, Borros S and Gomez-Romero P, J Electrochem Soc
151:A304–A310 (2004).38 Hwang WF, Wiff DR, Benner CL and Helminiak TE, J Macromol Sci, Phys
B22:231–257 (1983).39 Krause SJ, Haddock T, Lenhert PG, O’Brien JF, Helminak TE and
Adams WW, J Polym Sci Polym Phys 24:1991–2016 (1986).40 Akbey U, Robert G, Peter PC and Spiess HW, Aust J Chem 62:848–856
(2009).41 Akbey U, Graf R, Peng YG, Chu PP and Spiess HW, J Polym Sci Polym
Phys 47:138–155 (2009).42 Wozniak K, Krygowski TM, Grech E, Kolodziejski W and Klinowski J,
J Phys Chem 97:1862–1867 (1993).43 Benhabbour SR, Chapman RP, Scharfenberger G, Meyer HW and
Goward GR, Chem Mater 17:1605–1612 (2005).44 Hori S, Yamauchi K, Kuroki S and Ando I, Int J Mol Sci 3:907–913 (2002).45 Lee YJ, Bingol B, Tatiana M, Daniel S, Wolfgang HM, Gerhard W, et al,
J Phys Chem 111:9711–9721 (2007).
wileyonlinelibrary.com/journal/pi c© 2011 Society of Chemical Industry Polym Int 2012; 61: 55–64