britvic plc · source (mat): nielsen gb take-home to 26 sep 2015, ... pepsi continued to gain share...
TRANSCRIPT

Britvic plc Prelims presentation 2015

Gerald Corbett Chairman

John Gibney Chief Financial Officer

Another year of strong earnings growth despite an increasingly
challenging environment
4
-0.6% +7.1% +100bps +12.0% 0.2x +10.0%
Group
Revenue
Group EBITA
Group EBITA
margin
Underlying adjusted *
EPS of
Reduction in underlying* net debt to
EBITDA
Full year
DPS
£1,300.1m £171.6m 13.2% 46.7p £351.7m 23.0p
Disciplined cost management underpinning profitability
and continued investment in long-term growth drivers
EBITA is defined as operating profit before exceptional and other items and amortisation. Only amortisation attributable to intangibles on acquisition is added back, in the period this is £2.6m (2014: £2.9m AER). Adjusted earnings per share adds back the amortisation attributable to intangibles on acquisition. The share base is the weighted average number of ordinary shares in issue during the period, excluding shares held by Britvic to satisfy employee share-based incentive programmes. Numbers are on a constant currency, pre-exceptional and other items basis. * Underlying adjusted EPS, net debt and net debt to EBITDA ratio excludes the impact of the share placement on 23 July 2015.

Trading conditions were increasingly challenging throughout 2015
Food & Beverage not benefiting from increased
consumer spending
Retail environment in GB & Ireland has been
increasingly challenging
Large-format grocery has declined
Discounters continued to take share
Growth in convenience, online and leisure
retail
France “buying groups” resulted in significant
price pressure
1%
4%
6% 7% 8%
0.0%1.0%2.0%3.0%4.0%5.0%6.0%7.0%8.0%9.0%
Visa UK expenditure – Sep 2015 Growth YOY
Source (MAT): Nielsen GB take-home to 26 Sep 2015, ROI take-home to 4 Oct & France IRI take-home to 20 Sep 2015 5
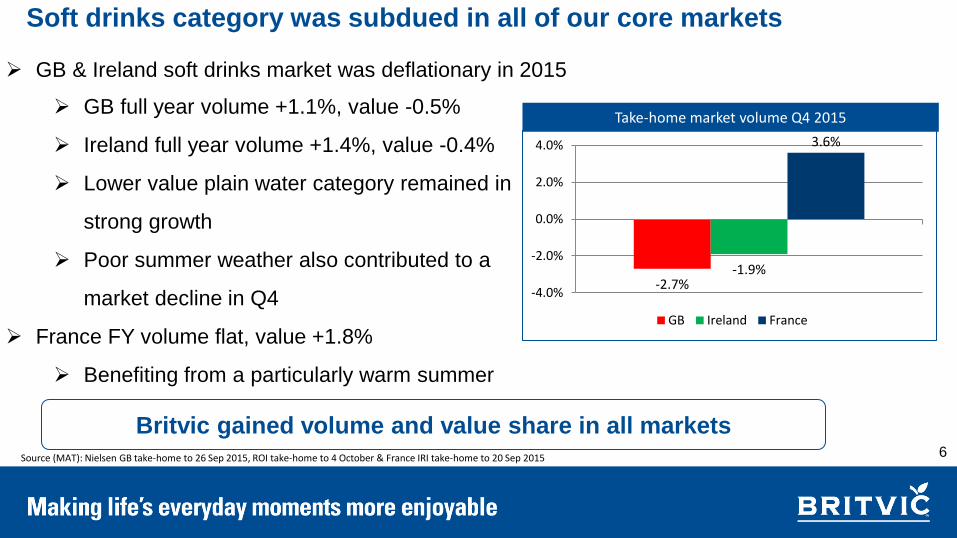
Soft drinks category was subdued in all of our core markets
GB full year volume +1.1%, value -0.5%
Ireland full year volume +1.4%, value -0.4%
Lower value plain water category remained in
strong growth
Poor summer weather also contributed to a
market decline in Q4
France FY volume flat, value +1.8%
Benefiting from a particularly warm summer
Take-home market volume Q4 2015
-2.7% -1.9%
3.6%
-4.0%
-2.0%
0.0%
2.0%
4.0%
GB Ireland France
Source (MAT): Nielsen GB take-home to 26 Sep 2015, ROI take-home to 4 October & France IRI take-home to 20 Sep 2015
Britvic gained volume and value share in all markets 6
GB & Ireland soft drinks market was deflationary in 2015

GB Stills
7
Significant innovations
launched in H2
Improving H2 performance,
adversely impacted
by the weather
2015
£m
2014
£m
%
change
Volume 377.5 378.9 (0.4)
ARP per litre 85.2p 88.5p (3.7)
Revenue 321.6 335.2 (4.1)
Brand contribution 151.1 159.4 (5.2)
Brand margin % 47.0% 47.6% (60)bps

GB Carbonates
2015
£m
2014
£m
%
change
Volume 1,206.7 1,204.7 0.2
ARP per litre 46.9p 47.1p (0.4)
Revenue 565.7 567.8 (0.4)
Brand contribution 225.1 222.4 1.2
Brand margin % 39.8% 39.2% 60bps
8
Pepsi continued to gain
share and drive category
growth
Over 60% of Pepsi volume is
no sugar, and growing
Source: Nielsen GB take-home to 26 Sep 2015

France
9
Growth in syrups and kids
categories driven by Britvic
2015
£m
2014
£m
%
change
% constant
currency
Volume 288.9 273.6 5.6 5.6
ARP per litre 83.2p 93.2p (10.7) (1.3)
Revenue 240.3 254.9 (5.7) 4.2
Brand contribution 75.6 67.1 12.7 24.3
Brand margin % 31.5% 26.3% 520bps 510bps
Teisseire #3 soft drink & Fruit
Shoot #1 in kids category
Source: France IRI take-home to 20 Sep 2015

Ireland
10
Returned to revenue and
profit growth, despite
poor summer
Outperformed the market with
volume & value share gains
2015
£m
2014
£m
%
change
% constant
currency
Volume 202.2 197.0 2.6 2.6
ARP per litre 49.7p 54.1p (8.1) (1.0)
Revenue 120.4 128.3 (6.2) 1.3
Brand contribution 44.2 47.0 (6.0) 2.8
Brand margin % 36.7% 36.6% 10bps 50bps
Source: Nielsen ROI take-home to 4 October 2015

International
11
Underlying revenue growth
masked by one-off impacts in
the Netherlands and USA
Sales of Fruit Shoot to consumers
in the USA and India in
encouraging growth
2015
£m
2014
£m
%
change
% constant
currency
Volume 41.3 44.3 (6.8) (6.8)
ARP per litre 126.2p 131.4p (4.0) (0.0)
Revenue 52.1 58.2 (10.5) (6.8)
Brand contribution 16.9 21.0 (19.5) (16.7)
Brand margin % 32.4% 36.1% (370)bps (390)bps

A&P and Overheads
12
2015
£m
2014
£m
AER %
change
Total A&P spend 71.1 72.0 1.3
A&P % revenue 5.6% 5.4% (20)bps
Non-brand A&P 9.7 9.9 2.0
Fixed supply chain 92.6 101.8 9.0
Selling costs 118.6 120.7 1.7
Overheads & other costs 123.0 126.4 2.7
Total cost base 343.9 358.8 4.2
Significant investment in
long-term growth drivers
Continued disciplined
cost management
2013 cost saving programme
largely delivered

Exceptional costs and other items
Item 2015 £m
Brazil acquisition related costs (6.5)
Strategic restructuring costs (3.6)
Business capability programme-related costs (1.4)
Fair value movements 0.9
Gains on disposal of property 1.2
Total exceptional costs (9.4)
13
Cash impact £8.6m

EBIT to Earnings
14
2015
£m
2014
£m
%
change
%
constant
currency
EBIT 169.0 158.1 6.9 7.2
Interest (22.0) (25.2) 12.7 12.4
Profit before tax 147.0 132.9 10.6 10.9
Tax (34.5) (33.0) (4.5) (5.5)
Effective tax rate 23.5% 24.8% 130bps 120bps
Profit after tax 112.5 99.9 12.6 12.7
Interest cost
reduced following
successful
bank refinancing
Strong leverage
through the P&L
to earnings

Cash flow and Net debt
15
2015 £m 2014 £m
EBIT 169.0 158.1
Depreciation and amortisation 42.1 43.0
EBITDA 211.1 201.1
Working capital 10.3 (1.6)
Capital spend (60.9) (57.3)
Pension contributions (21.6) (20.8)
Other spend (49.6) (32.5)
Underlying free cash flow 89.3 88.9
Dividends (52.9) (46.8)
Adjusted net debt (263.9) (380.9)
Net debt to EBITDA ratio 1.3x 1.9x
Underlying* adjusted net debt (351.7) -
Underlying* net debt to EBITDA ratio 1.7x -
Brazil acquisition completed
post year-end. Underlying*
net debt to EBITDA of 1.7x
Capital spend below
previous guidance, £20m
re-phased into 2016
* Underlying adjusted EPS, net debt and net debt to EBITDA ratio excludes the impact of the share placement on 23 July 2015 and initial equity and debt consideration.

Ebba acquisition completed 30 September
First equity consideration of R$193.8m paid 30 September
R$ denominated net debt of c.R$160m repaid post completion
Second equity consideration of R$193.8m due September 2017
with 75% now hedged
2016 & 2017 EBITDA at broadly similar levels to 2015, as
previously guided
R$ exchange rate has weakened since July announcement
Will result in lower sterling translation of profits in 2016
Acquisition price will part benefit from exchange rate
movements
16

2016 guidance
Anticipate continued challenging market conditions in our core markets
Benign raw material environment anticipated
Effective tax rate of 23% to 24%, coupon interest rate of 5.0% to 5.5%
Capital spend of £120m to £130m, including 2015 re-phasing of £20m
Exceptional costs of c £14m
Adjusted net debt to EBITDA leverage between 1.9x to 2.0x
Continued progressive dividend policy, minimum 50% pay-out of earnings
53-week EBITA guidance anticipated in the range of £180m to £190m including
Brazil.
17 EBITA will be the primary profit performance measure. Given the unknown impact of the acquisition related amortisation and fair value charges for Brazil, amortisation has been assumed at current level of £2.6m and will be revised once Brazil valuations are completed

We have delivered our commitments since 2013 building on our strong
track record of creating shareholder value since IPO
10 Years since IPO 2012 to 2015
EPS CAGR 10.9%
DPS CAGR 9.7%
TSR 328%
EPS CAGR 19.7%
DPS CAGR 9.4%
TSR 106%
A strong balance sheet
and funding platform
Disciplined cost control
and investment in
growth drivers
Sustainable free cash
flow generation
UNDERPINNED BY:
18

Capital allocation priorities
A progressive
dividend policy
Invest in
business
capability
Selective M&A in
core categories
Maintain on-going
debt leverage within
1.5x to 2.5X range
Delivering superior shareholder returns
Profitable growth
Strong underlying FCF conversion
19

Simon Litherland
Chief Executive Officer

Our journey to become a global branded soft drinks
business
Progress against our 2013 strategic commitments
The drivers of future growth
Summary
21

In 2013 we communicated a strategy to deliver long-term growth
22
Exploit global
opportunities in
kids, family and
adult categories
Continue to
step-change our
business capability
Build trust and
respect in our
communities
Generate profitable
growth in our
core markets

We have made great progress executing this strategy
23
Generate profitable
growth in our core markets
Exploit global opportunities in
kids, family and adult categories
Continue to
step-change our
business capability
Build trust and
respect in our
communities
Share gains in all
markets
Major investment in
marketing & innovation
Innovation launched in
all business units
Fruit Shoot #2 US
single serve kids juice
drink & launched in
India
Acquisition of Ebba,
accessing world’s
largest dilutes market
Culture, talent and
capability evolving
Strategic cost initiatives
delivered
280bps EBITA margin
growth
Valued by our
customers
2 star “Business in
the Community” CR
Index
18 billion calorie
reduction

We have recruited international experience to the executive team
Mathew Dunn – New CFO, joined September 2015
Joined from SAB Miller where he was CFO of South Africa division
Strong BU and PLC leadership experience across multiple geographies
Hessel De Jong – International MD, joined October 2015
Previously with Heineken and Coca-Cola
Extensive commercial and general management experience in Europe & Asia
João Caetano de Mello Neto – Brazil MD, joined September 2015
CEO of Ebba since 2011, leading its rapid growth
A career in FMCG, including 7 years as CEO of The Muller Drinks Company
24

25
Exploit channel
and category
opportunities
Innovation
Revenue
management
Leverage the Pepsi
relationship
Deliver the
potential in USA,
Brazil and India
Selective M&A and
partnerships in key
markets
Best in class
supply chain
Retain & recruit
great talent
Improve A&P
effectiveness
Maximise cost
base efficiency
A great company to
do business with
Play a leading
role in addressing
the public health
agenda
Minimise impact on
the environment
A clear strategy to create superior shareholder returns
Generating profitable
growth in our core markets
Exploit global opportunities
in kids, family and adult categories
Continue to
step-change our
business capability
Build trust and
respect in our
communities
Sustainable long-term earnings growth

Generate profitable growth in our
core markets - innovation

Innovating to capitalise on changing consumer needs
27
Improve participation Expand category “Well-being” leadership

We continue to evolve the Fruit Shoot offering
Core range reformulated with added multivitamins
Reduced sweetness and improved flavour
Fruit Shoot Hydro re-launched to capitalise on growth of
flavoured water
New liquid and reduced sweetness
Further innovation in late 2016, extending into new
sub-categories
No.2 most motivating claim amongst parents
28

Exploiting global opportunities in kids, family
& adult categories – USA & Brazil

Fruit Shoot is driving single-serve kids beverage growth in the USA
Good progress to-date:
#2 kids juice brand in convenience and gas channel
Driving category growth, brand retail sales value +23%
Market share now at 17%
Significant opportunities remain:
Scale distribution opportunities in C&G, Leisure and Foodservice
channels
Authorisation for distribution in Pizza Hut reached
Launch new flavours to broaden appeal and increase consumer base
Increased marketing activity to drive distribution and rate of sale
30
Source: USA IRI 52 weeks to August 2015

USA multi-pack route to market established
Broker warehousing model more efficient & cost effective RTM than direct
store delivery for grocery channel
Advantage Sales & Marketing appointed who will:
Facilitate the relationship with key retailers
Provide category management & insight support
Manage order to cash process
Multi-pack will launch in H1 2016, aligned to customer range reviews
Initial listings secured
New senior leadership team recruited with extensive US FMCG experience
Comprehensive marketing campaign to drive trial and awareness
31

Acquisition of Ebba will create significant value for shareholders
Ambition to at least double EBITDA by 2020, despite tough market macros
Acquiring the leading brands, in a category core to our strategy
+50% market share of liquid dilutes
Maguary has 90% brand awareness and resonates with Brazilian
families in the way Robinsons, MiWadi and Teisseire do in Europe
A clear plan to create value
1. Re-invigorate the core dilutes category
2. Accelerate growth in RTD nectars
3. Introduce Britvic brands and innovation to the market
A strong local management team retained
32

Continue to step-change our business
capability – best in class supply chain

A GB supply chain programme that will provide:
34
Additional capacity in growth packs
Pack flexibility to maximise channel opportunities
Lower on-going production costs
A more efficient logistics and warehousing network
Lower maintenance capital spend requirements on-going
Significant environmental benefits

Increased period of capital spend
2016 total capital guidance of £120m to £130m
Including £20m deferred from 2015
Group historical run rate capex c £50m to £55m
Strong focus on cash returns from enhanced investment in capital
base, minimum annual cash return of 15%
£6m EBITDA (£1m EBIT) in 2017
£12m EBITDA (£7m EBIT) from 2020
Plant assets to be depreciated over 15 years
Programme for 2017 & 2018 will be reviewed during 2016
35

Build trust and respect in our
communities

Best positioned portfolio
Market leading low/no
sugar propositions
Bold approach to calorie
reduction: delist of added
sugar Robinsons
“Better for you” innovation
and reformulation
Inspired 2.6 million people
to get active in 2015
Fruit Shoot Mini Mudder in
multiple territories
Long-term partnership with
Wimbledon tennis
Tour de France
sponsorship
No advertising to children
under 12
Pepsi & 7Up marketing led
by no-sugar variants
Early adopter of front of
pack nutritional labelling in
GB
37
A leading role in addressing the public health agenda
Evolving our portfolio Encouraging active lifestyles Responsible marketing

Summary
Continued delivery of the strategy
Another year of double-digit earnings growth in
challenging market conditions
Future growth drivers are clear
Maintain focus on building business efficiency
38