british columbia, canada: northeast pacific ocean bottom
TRANSCRIPT

Groundfish
©Monterey Bay Aquarium
British Columbia, Canada: Northeast Pacific Ocean
Bottom trawls, Jig, Longlines (shallow-set & deep-set), Setlonglines, Trolling lines
April 11, 2016
Seafood Watch Consulting Researcher
DisclaimerSeafood Watch strives to have all Seafood Reports rev iewed for accuracy and completeness by external scientists with expertise in ecology,fisheries science and aquaculture. Scientific rev iew, however, does not constitute an endorsement of the Seafood Watch program or itsrecommendations on the part of the rev iewing scientists. Seafood Watch is solely responsible for the conclusions reached in this report.
Seafood Watch Standard used in this assessment: Standard for Fisheries vF2
®®
®

. . . . . . . . . . . . . . . . . . . . . . . . . . . . . . . . . . . . . . . . . . . . . . . . . . . . . . . . . . . . . . . . . . . . . . . . . . . . . . . . . . . . . . . . . . . . . . . . . . . . . . . . . . . . . . . . . . . . . . . . . . . . . . . . . . . . . . . . . . . . . . . . . . . . . . . . . . . . . . . .3
. . . . . . . . . . . . . . . . . . . . . . . . . . . . . . . . . . . . . . . . . . . . . . . . . . . . . . . . . . . . . . . . . . . . . . . . . . . . . . . . . . . . . . . . . . . . . . . . . . . . . . . . . . . . . . . . . . . . . . . . . . . . . . . . . . . . . . . . . . . . . . . . . . . . . . . . . . . . . . . .4
. . . . . . . . . . . . . . . . . . . . . . . . . . . . . . . . . . . . . . . . . . . . . . . . . . . . . . . . . . . . . . . . . . . . . . . . . . . . . . . . . . . . . . . . . . . . . . . . . . . . . . . . . . . . . . . . . . . . . . . . . . . . . . . . . . . . . . . . . . . . . . . . . . . . . . . . . . . . . . . .5
. . . . . . . . . . . . . . . . . . . . . . . . . . . . . . . . . . . . . . . . . . . . . . . . . . . . . . . . . . . . . . . . . . . . . . . . . . . . . . . . . . . . . . . . . . . . . . . . . . . . . . . . . . . . . . . . . . . . . . . . . . . . . . . . . . . . . . . . . . . . . . . . . . . . . . . . . . . . . . . .6
. . . . . . . . . . . . . . . . . . . . . . . . . . . . . . . . . . . . . . . . . . . . . . . . . . . . . . . . . . . . . . . . . . . . . . . . . . . . . . . . . . . . . . . . . . . . . . . . . . . . . . . . . . . . . . . . . . . . . . . . . . . . . . . . . . . . . . . . . . . . . . . . . . . . . . . . . . . . . . . .18
. . . . . . . . . . . . . . . . . . . . . . . . . . . . . . . . . . . . . . . . . . . . . . . . . . . . . . . . . . . . . . . . . . . . . . . . . . . . . . . . . . . . . . . . . . . . . . . . . . . . . . . . . . . . . . . . . . . . . . . . . . . . . . . . . . . . . . . . . . . . . . . . . . . . . . . . . . . . . . . .24. . . . . . . . . . . . . . . . . . . . . . . . . . . . . . . . . . . . . . . . . . . . . . . . . . . . . . . . . . . . . . . . . . . . . . . . . . . . . . . . . . . . . . . . . . . . . . . . . . . . . . . . . . . . . . . . . . . . . . . . . . . . . . . . . . . . . . . . . . . . . . . . . . . . . . . . . . . . . . . .24. . . . . . . . . . . . . . . . . . . . . . . . . . . . . . . . . . . . . . . . . . . . . . . . . . . . . . . . . . . . . . . . . . . . . . . . . . . . . . . . . . . . . . . . . . . . . . . . . . . . . . . . . . . . . . . . . . . . . . . . . . . . . . . . . . . . . . . . . . . . . . . . . . . . . . . . . . . . . . . .106. . . . . . . . . . . . . . . . . . . . . . . . . . . . . . . . . . . . . . . . . . . . . . . . . . . . . . . . . . . . . . . . . . . . . . . . . . . . . . . . . . . . . . . . . . . . . . . . . . . . . . . . . . . . . . . . . . . . . . . . . . . . . . . . . . . . . . . . . . . . . . . . . . . . . . . . . . . . . . . .205. . . . . . . . . . . . . . . . . . . . . . . . . . . . . . . . . . . . . . . . . . . . . . . . . . . . . . . . . . . . . . . . . . . . . . . . . . . . . . . . . . . . . . . . . . . . . . . . . . . . . . . . . . . . . . . . . . . . . . . . . . . . . . . . . . . . . . . . . . . . . . . . . . . . . . . . . . . . . . . .217
. . . . . . . . . . . . . . . . . . . . . . . . . . . . . . . . . . . . . . . . . . . . . . . . . . . . . . . . . . . . . . . . . . . . . . . . . . . . . . . . . . . . . . . . . . . . . . . . . . . . . . . . . . . . . . . . . . . . . . . . . . . . . . . . . . . . . . . . . . . . . . . . . . . . . . . . . . . . . . . .226
. . . . . . . . . . . . . . . . . . . . . . . . . . . . . . . . . . . . . . . . . . . . . . . . . . . . . . . . . . . . . . . . . . . . . . . . . . . . . . . . . . . . . . . . . . . . . . . . . . . . . . . . . . . . . . . . . . . . . . . . . . . . . . . . . . . . . . . . . . . . . . . . . . . . . . . . . . . . . . . .227
. . . . . . . . . . . . . . . . . . . . . . . . . . . . . . . . . . . . . . . . . . . . . . . . . . . . . . . . . . . . . . . . . . . . . . . . . . . . . . . . . . . . . . . . . . . . . . . . . . . . . . . . . . . . . . . . . . . . . . . . . . . . . . . . . . . . . . . . . . . . . . . . . . . . . . . . . . . . . . . .233
. . . . . . . . . . . . . . . . . . . . . . . . . . . . . . . . . . . . . . . . . . . . . . . . . . . . . . . . . . . . . . . . . . . . . . . . . . . . . . . . . . . . . . . . . . . . . . . . . . . . . . . . . . . . . . . . . . . . . . . . . . . . . . . . . . . . . . . . . . . . . . . . . . . . . . . . . . . . . . . .244
. . . . . . . . . . . . . . . . . . . . . . . . . . . . . . . . . . . . . . . . . . . . . . . . . . . . . . . . . . . . . . . . . . . . . . . . . . . . . . . . . . . . . . . . . . . . . . . . . . . . . . . . . . . . . . . . . . . . . . . . . . . . . . . . . . . . . . . . . . . . . . . . . . . . . . . . . . . . . . . .
245. . . . . . . . . . . . . . . . . . . . . . . . . . . . . . . . . . . . . . . . . . . . . . . . . . . . . . . . . . . . . . . . . . . . . . . . . . . . . . . . . . . . . . . . . . . . . . . . . . . . . . . . . . . . . . . . . . . . . . . . . . . . . . . . . . . . . . . . . . . . . . . . . . . . . . . . . . . . . . . .247
Table of Contents
About Seafood Watch
Guiding Principles
Summary
Final Seafood Recommendations
Introduction
Assessment
Criterion 1: Impacts on the species under assessment
Criterion 2: Impacts on other species
Criterion 3: Management Effectiveness
Criterion 4: Impacts on the habitat and ecosystem
Acknowledgements
References
Appendix A: Extra By Catch Species
Appendix B: A: COSEWIC, SARA, and IUCN statuses of rockfish species
Appendix C: B: Bycatch of seabirds, marine mammals, large sharks, salmon, and green
sturgeon
Appendix D: C: Summary of changes made in 2016 update report
2

About Seafood WatchMonterey Bay Aquarium’s Seafood Watch program evaluates the ecological sustainability of wild-caught andfarmed seafood commonly found in the United States marketplace. Seafood Watch defines sustainableseafood as originating from sources, whether wild-caught or farmed, which can maintain or increase productionin the long-term without jeopardizing the structure or function of affected ecosystems. Seafood Watch makesits science-based recommendations available to the public in the form of regional pocket guides that can bedownloaded from www.seafoodwatch.org. The program’s goals are to raise awareness of important oceanconservation issues and empower seafood consumers and businesses to make choices for healthy oceans.
Each sustainability recommendation on the regional pocket guides is supported by a Seafood Report. Eachreport synthesizes and analyzes the most current ecological, fisheries and ecosystem science on a species, thenevaluates this information against the program’s conservation ethic to arrive at a recommendation of “BestChoices,” “Good Alternatives” or “Avoid.” The detailed evaluation methodology is available upon request. Inproducing the Seafood Reports, Seafood Watch seeks out research published in academic, peer-reviewedjournals whenever possible. Other sources of information include government technical publications, fisherymanagement plans and supporting documents, and other scientific reviews of ecological sustainability. SeafoodWatch Research Analysts also communicate regularly with ecologists, fisheries and aquaculture scientists, andmembers of industry and conservation organizations when evaluating fisheries and aquaculture practices.Capture fisheries and aquaculture practices are highly dynamic; as the scientific information on each specieschanges, Seafood Watch ’s sustainability recommendations and the underlying Seafood Reports will be updatedto reflect these changes.
Parties interested in capture fisheries, aquaculture practices and the sustainability of ocean ecosystems arewelcome to use Seafood Reports in any way they find useful. For more information about Seafood Watch andSeafood Reports, please contact the Seafood Watch program at Monterey Bay Aquarium by calling 1-877-229-9990.
®
®
®
®
®
®
®
®
3
Guiding PrinciplesSeafood Watch defines sustainable seafood as originating from sources, whether fished or farmed, that canmaintain or increase production in the long-term without jeopardizing the structure or function of affectedecosystems.
Based on this principle, Seafood Watch had developed four sustainability criteria for evaluating wildcatchfisheries for consumers and businesses. These criteria are:
How does fishing affect the species under assessment?How does the fishing affect other, target and non-target species?How effective is the fishery’s management?How does the fishing affect habitats and the stability of the ecosystem?
Each criterion includes:
Factors to evaluate and scoreGuidelines for integrating these factors to produce a numerical score and rating
Once a rating has been assigned to each criterion, we develop an overall recommendation. Criteria ratings andthe overall recommendation are color-coded to correspond to the categories on the Seafood Watch pocketguide and online guide:
Best Choice/Green: Are well managed and caught in ways that cause little harm to habitats or other wildlife.
Good Alternative/Yellow: Buy, but be aware there are concerns with how they’re caught.
Avoid/Red Take a pass on these for now. These items are overfished or caught in ways that harm othermarine life or the environment.
“Fish” is used throughout this document to refer to finfish, shellfish and other invertebrates
1
1
4

SummaryOf the 90 stock/gear combinations that were assessed in this report, 48 received an overall ’yellow’recommendation, 41 received a ’red’ recommendation, and one received a ’green’ recommendation. The singlegreatest factor that reduced scores was a broad lack of up-to-date information for stock status and mortality;many stocks received conservative stock status and fishing mortality scores due to a lack of availableinformation. Strengths for these fisheries include 100% at-sea and dockside monitoring, and habitatconservation measures.
The majority (60) of the stock/gear combinations received a red or yellow rating under Criterion 1. Up- to-dateand reliable information is essential for a green rating. For many of the stocks with yellow and red ratings, theprimary issue is one of data availability. Many stocks have never been assessed, or have out-of-dateassessments and, as such have received conservative ratings for Criterion 1.
Due to the multispecies nature of the integrated groundfish fishery, there are actually few fish species thatexclusively qualify as ‘bycatch’ in the traditional sense. Bocaccio are avoided due to their extremely low stockstatus and the resulting highly restrictive limits placed on their capture. Grenadier and ratfish are caught duringnormal fishing operations, but are of no market value. As was the case for Criterion 1, information availability—especially in the form of up-to-date stock assessments—is the primary determinant of many of the Criterion 2rankings.
The Seafood Watch criteria define effective management via a number of guidelines. To be scored ‘highlyeffective’ for any of the guidelines, a fishery must achieve all of that guidelines’ requirements. Due to themultispecies nature of these fisheries, achieving all of the requirements for the ‘management strategy andimplementation’ guidelines is challenging. Certain aspects of these fisheries’ management regime are verystrong. This is especially true for the at-sea and dockside monitoring requirements that are in place. However,challenges noted in ‘management strategy and implementation’ and ‘recovery of stocks of concern’ preclude ahigher score for Criterion 3.
The groundfish fishing gears used in the British Columbia fisheries are expected to come into contact with theseafloor during their regular use. As such, the potential for disturbance and destruction of habitat is alwayspresent with these gears. The destructive potential of mobile gears is well known, and bottom longlines andpots may also cause damage. Many of the species that the groundfish fisheries pursue are known to associatewith hard substrates, which are known to be more susceptible to gear disturbance and damage than softsubstrates in high-energy areas. Spatial management measures such as the sponge reef trawl closures havehelped to minimize the potential for damage to certain habitats, and in 2012 a new suite of managementmeasures for the trawl fishery was implemented in order to minimize and manage this fishery’s bycatch ofcorals and sponges.
5

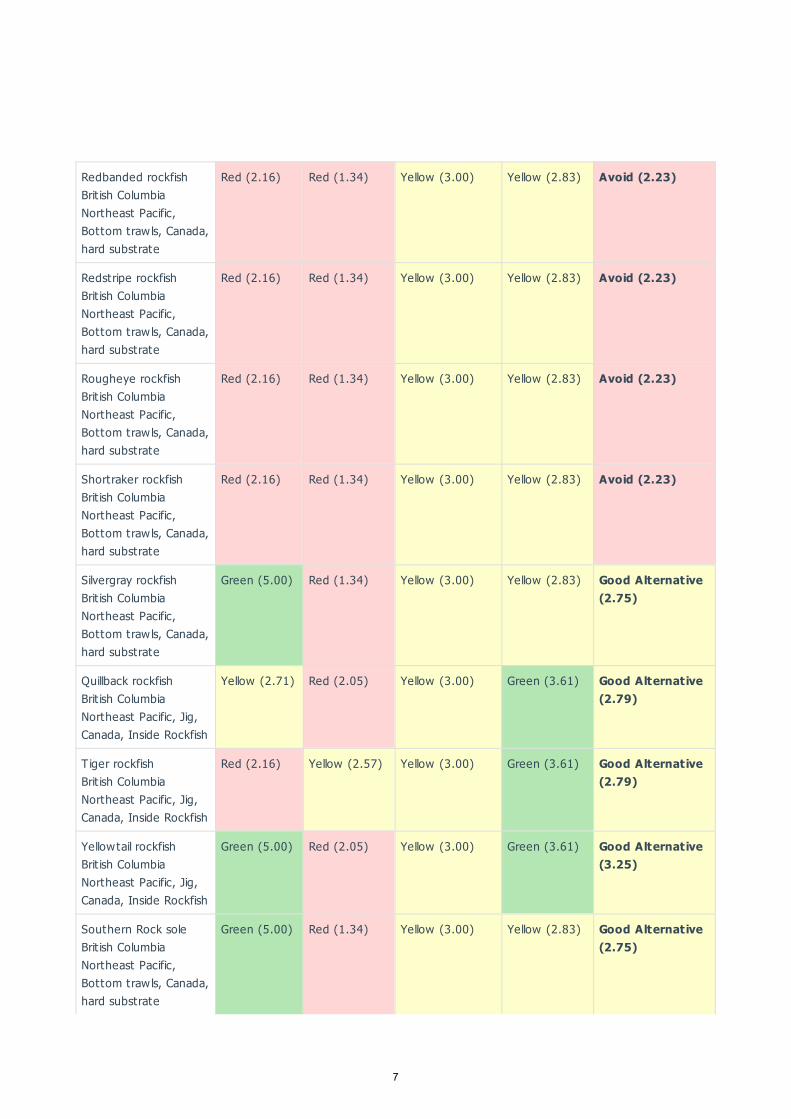
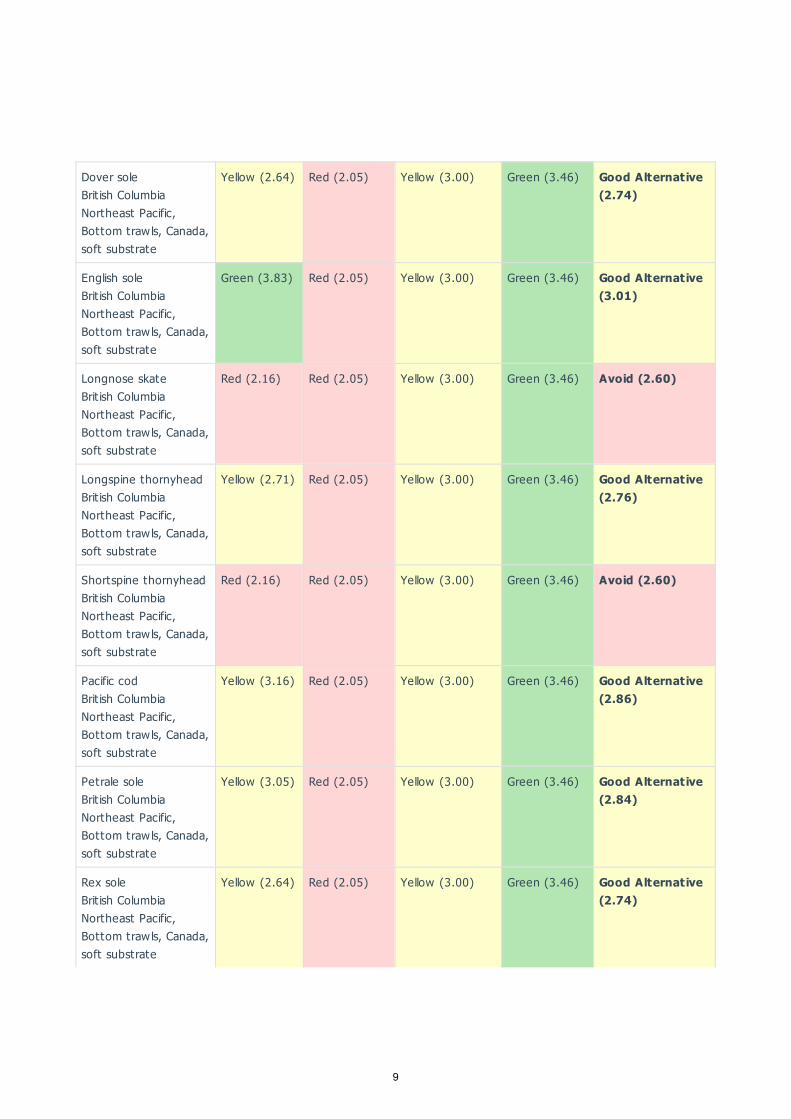
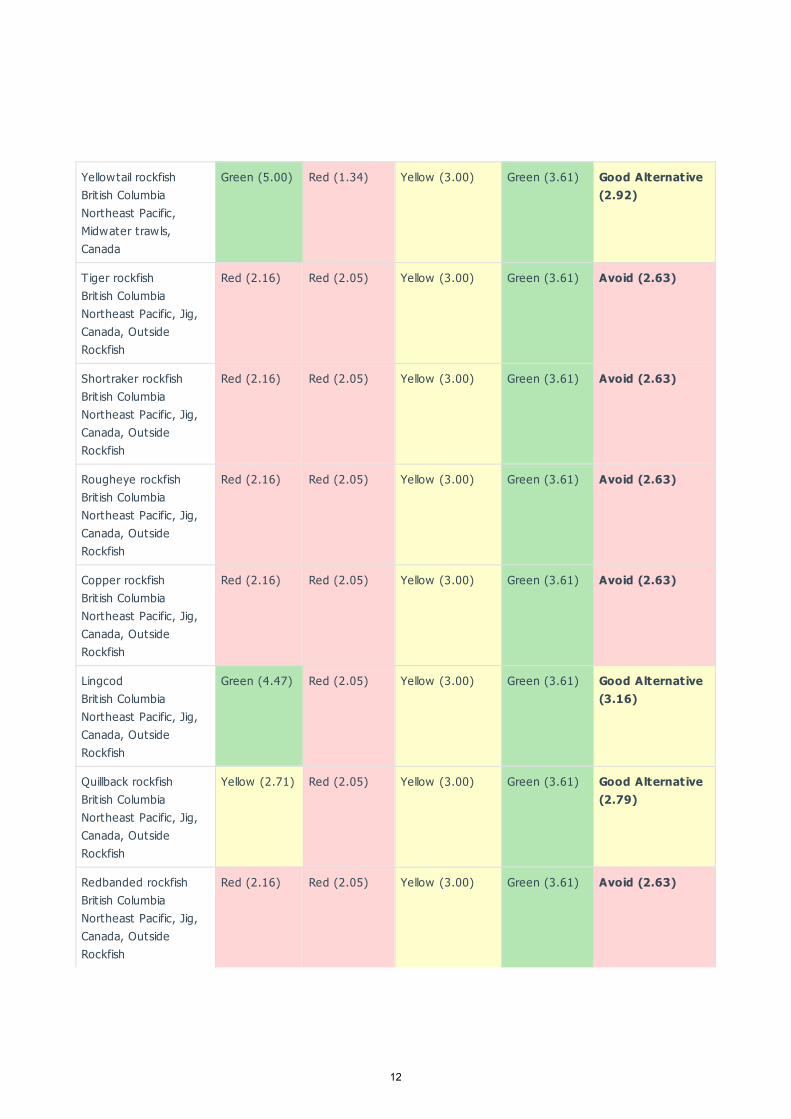
Final Seafood Recommendations
SPECIES/FISHERY
CRITERION1: IMPACTSON THESPECIES
CRITERION 2:IMPACTS ONOTHERSPECIES
CRITERION 3:MANAGEMENTEFFECTIVENESS
CRITERION 4:HABITAT ANDECOSYSTEM
OVERALLRECOMMENDATION
Arrowtooth flounderBrit ish ColumbiaNortheast Pacific,Bottom traw ls, Canada,hard substrate
Green (5.00) Red (1.34) Yellow (3.00) Yellow (2.83) Good Alternative(2.75)
Canary rockfishBrit ish ColumbiaNortheast Pacific,Bottom traw ls, Canada,hard substrate
Green (4.47) Red (1.34) Yellow (3.00) Yellow (2.83) Good Alternative(2.67)
Darkblotched rockfishBrit ish ColumbiaNortheast Pacific,Bottom traw ls, Canada,hard substrate
Red (2.16) Red (1.34) Yellow (3.00) Yellow (2.83) Avoid (2.23)
Longnose skateBrit ish ColumbiaNortheast Pacific,Longline (shallow-set),Canada
Red (2.16) Red (2.05) Yellow (3.00) Green (3.61) Avoid (2.63)
Spiny dogfishBrit ish ColumbiaNortheast Pacific,Longline (shallow-set),Canada
Green (3.32) Red (2.05) Yellow (3.00) Green (3.61) Good Alternative(2.93)
Greenstriped rockfishBrit ish ColumbiaNortheast Pacific,Bottom traw ls, Canada,hard substrate
Yellow (2.64) Red (1.34) Yellow (3.00) Yellow (2.83) Good Alternative(2.34)
LingcodBrit ish ColumbiaNortheast Pacific,Bottom traw ls, Canada,hard substrate
Green (4.47) Red (1.34) Yellow (3.00) Yellow (2.83) Good Alternative(2.67)
Pacific Ocean perchBrit ish ColumbiaNortheast Pacific,Bottom traw ls, Canada,hard substrate
Yellow (3.05) Red (1.34) Yellow (3.00) Yellow (2.83) Good Alternative(2.43)
6
Redbanded rockfishBrit ish ColumbiaNortheast Pacific,Bottom traw ls, Canada,hard substrate
Red (2.16) Red (1.34) Yellow (3.00) Yellow (2.83) Avoid (2.23)
Redstripe rockfishBrit ish ColumbiaNortheast Pacific,Bottom traw ls, Canada,hard substrate
Red (2.16) Red (1.34) Yellow (3.00) Yellow (2.83) Avoid (2.23)
Rougheye rockfishBrit ish ColumbiaNortheast Pacific,Bottom traw ls, Canada,hard substrate
Red (2.16) Red (1.34) Yellow (3.00) Yellow (2.83) Avoid (2.23)
Shortraker rockfishBrit ish ColumbiaNortheast Pacific,Bottom traw ls, Canada,hard substrate
Red (2.16) Red (1.34) Yellow (3.00) Yellow (2.83) Avoid (2.23)
Silvergray rockfishBrit ish ColumbiaNortheast Pacific,Bottom traw ls, Canada,hard substrate
Green (5.00) Red (1.34) Yellow (3.00) Yellow (2.83) Good Alternative(2.75)
Quillback rockfishBrit ish ColumbiaNortheast Pacific, Jig,Canada, Inside Rockfish
Yellow (2.71) Red (2.05) Yellow (3.00) Green (3.61) Good Alternative(2.79)
Tiger rockfishBrit ish ColumbiaNortheast Pacific, Jig,Canada, Inside Rockfish
Red (2.16) Yellow (2.57) Yellow (3.00) Green (3.61) Good Alternative(2.79)
Yellowtail rockfishBrit ish ColumbiaNortheast Pacific, Jig,Canada, Inside Rockfish
Green (5.00) Red (2.05) Yellow (3.00) Green (3.61) Good Alternative(3.25)
Southern Rock soleBrit ish ColumbiaNortheast Pacific,Bottom traw ls, Canada,hard substrate
Green (5.00) Red (1.34) Yellow (3.00) Yellow (2.83) Good Alternative(2.75)
7

Widow rockfishBrit ish ColumbiaNortheast Pacific,Bottom traw ls, Canada,hard substrate
Red (2.16) Red (1.34) Yellow (3.00) Yellow (2.83) Avoid (2.23)
Yellowmouth rockfishBrit ish ColumbiaNortheast Pacific,Bottom traw ls, Canada,hard substrate
Green (4.47) Red (1.34) Yellow (3.00) Yellow (2.83) Good Alternative(2.67)
Yellowtail rockfishBrit ish ColumbiaNortheast Pacific,Bottom traw ls, Canada,hard substrate
Green (5.00) Red (1.34) Yellow (3.00) Yellow (2.83) Good Alternative(2.75)
Redbanded rockfishBrit ish ColumbiaNortheast Pacific,Longline (deep-set),Canada
Red (2.16) Red (2.05) Yellow (3.00) Green (3.61) Avoid (2.63)
Rougheye rockfishBrit ish ColumbiaNortheast Pacific,Longline (deep-set),Canada
Red (2.16) Red (2.05) Yellow (3.00) Green (3.61) Avoid (2.63)
SablefishBrit ish ColumbiaNortheast Pacific,Longline (deep-set),Canada
Green (3.83) Red (2.05) Yellow (3.00) Green (3.61) Good Alternative(3.04)
Shortraker rockfishBrit ish ColumbiaNortheast Pacific,Longline (deep-set),Canada
Red (2.16) Red (2.05) Yellow (3.00) Green (3.61) Avoid (2.63)
Big skateBrit ish ColumbiaNortheast Pacific,Bottom traw ls, Canada,soft substrate
Green (3.32) Red (2.05) Yellow (3.00) Green (3.46) Good Alternative(2.90)
8
Dover soleBrit ish ColumbiaNortheast Pacific,Bottom traw ls, Canada,soft substrate
Yellow (2.64) Red (2.05) Yellow (3.00) Green (3.46) Good Alternative(2.74)
English soleBrit ish ColumbiaNortheast Pacific,Bottom traw ls, Canada,soft substrate
Green (3.83) Red (2.05) Yellow (3.00) Green (3.46) Good Alternative(3.01)
Longnose skateBrit ish ColumbiaNortheast Pacific,Bottom traw ls, Canada,soft substrate
Red (2.16) Red (2.05) Yellow (3.00) Green (3.46) Avoid (2.60)
Longspine thornyheadBrit ish ColumbiaNortheast Pacific,Bottom traw ls, Canada,soft substrate
Yellow (2.71) Red (2.05) Yellow (3.00) Green (3.46) Good Alternative(2.76)
Shortspine thornyheadBrit ish ColumbiaNortheast Pacific,Bottom traw ls, Canada,soft substrate
Red (2.16) Red (2.05) Yellow (3.00) Green (3.46) Avoid (2.60)
Pacific codBrit ish ColumbiaNortheast Pacific,Bottom traw ls, Canada,soft substrate
Yellow (3.16) Red (2.05) Yellow (3.00) Green (3.46) Good Alternative(2.86)
Petrale soleBrit ish ColumbiaNortheast Pacific,Bottom traw ls, Canada,soft substrate
Yellow (3.05) Red (2.05) Yellow (3.00) Green (3.46) Good Alternative(2.84)
Rex soleBrit ish ColumbiaNortheast Pacific,Bottom traw ls, Canada,soft substrate
Yellow (2.64) Red (2.05) Yellow (3.00) Green (3.46) Good Alternative(2.74)
9

SablefishBrit ish ColumbiaNortheast Pacific,Bottom traw ls, Canada,soft substrate
Green (3.83) Red (2.05) Yellow (3.00) Green (3.46) Good Alternative(3.01)
LingcodBrit ish ColumbiaNortheast Pacific, Setlonglines, Canada,Inside Rockfish
Green (4.47) Green (4.75) Yellow (3.00) Green (4.12) Best Choice(4.02)
Canary rockfishBrit ish ColumbiaNortheast Pacific,Midwater traw ls,Canada
Green (4.47) Red (1.34) Yellow (3.00) Green (3.61) Good Alternative(2.84)
Darkblotched rockfishBrit ish ColumbiaNortheast Pacific,Midwater traw ls,Canada
Red (2.16) Red (1.34) Yellow (3.00) Green (3.61) Avoid (2.37)
Greenstriped rockfishBrit ish ColumbiaNortheast Pacific,Midwater traw ls,Canada
Yellow (2.64) Red (1.34) Yellow (3.00) Green (3.61) Good Alternative(2.49)
LingcodBrit ish ColumbiaNortheast Pacific,Midwater traw ls,Canada
Green (4.47) Red (1.34) Yellow (3.00) Green (3.61) Good Alternative(2.84)
Arrowtooth flounderBrit ish ColumbiaNortheast Pacific,Midwater traw ls,Canada
Green (5.00) Red (1.34) Yellow (3.00) Green (3.61) Good Alternative(2.92)
Pacific Ocean perchBrit ish ColumbiaNortheast Pacific,Midwater traw ls,Canada
Yellow (3.05) Red (1.34) Yellow (3.00) Green (3.61) Good Alternative(2.58)
10

Redbanded rockfishBrit ish ColumbiaNortheast Pacific,Midwater traw ls,Canada
Red (2.16) Red (1.34) Yellow (3.00) Green (3.61) Avoid (2.37)
Redstripe rockfishBrit ish ColumbiaNortheast Pacific,Midwater traw ls,Canada
Red (2.16) Red (1.34) Yellow (3.00) Green (3.61) Avoid (2.37)
Rougheye rockfishBrit ish ColumbiaNortheast Pacific,Midwater traw ls,Canada
Red (2.16) Red (1.34) Yellow (3.00) Green (3.61) Avoid (2.37)
Shortraker rockfishBrit ish ColumbiaNortheast Pacific,Midwater traw ls,Canada
Red (2.16) Red (1.34) Yellow (3.00) Green (3.61) Avoid (2.37)
Silvergray rockfishBrit ish ColumbiaNortheast Pacific,Midwater traw ls,Canada
Green (5.00) Red (1.34) Yellow (3.00) Green (3.61) Good Alternative(2.92)
Southern Rock soleBrit ish ColumbiaNortheast Pacific,Midwater traw ls,Canada
Green (5.00) Red (1.34) Yellow (3.00) Green (3.61) Good Alternative(2.92)
Widow rockfishBrit ish ColumbiaNortheast Pacific,Midwater traw ls,Canada
Red (2.16) Red (1.34) Yellow (3.00) Green (3.61) Avoid (2.37)
Yellowmouth rockfishBrit ish ColumbiaNortheast Pacific,Midwater traw ls,Canada
Green (4.47) Red (1.34) Yellow (3.00) Green (3.61) Good Alternative(2.84)
11
Yellowtail rockfishBrit ish ColumbiaNortheast Pacific,Midwater traw ls,Canada
Green (5.00) Red (1.34) Yellow (3.00) Green (3.61) Good Alternative(2.92)
Tiger rockfishBrit ish ColumbiaNortheast Pacific, Jig,Canada, OutsideRockfish
Red (2.16) Red (2.05) Yellow (3.00) Green (3.61) Avoid (2.63)
Shortraker rockfishBrit ish ColumbiaNortheast Pacific, Jig,Canada, OutsideRockfish
Red (2.16) Red (2.05) Yellow (3.00) Green (3.61) Avoid (2.63)
Rougheye rockfishBrit ish ColumbiaNortheast Pacific, Jig,Canada, OutsideRockfish
Red (2.16) Red (2.05) Yellow (3.00) Green (3.61) Avoid (2.63)
Copper rockfishBrit ish ColumbiaNortheast Pacific, Jig,Canada, OutsideRockfish
Red (2.16) Red (2.05) Yellow (3.00) Green (3.61) Avoid (2.63)
LingcodBrit ish ColumbiaNortheast Pacific, Jig,Canada, OutsideRockfish
Green (4.47) Red (2.05) Yellow (3.00) Green (3.61) Good Alternative(3.16)
Quillback rockfishBrit ish ColumbiaNortheast Pacific, Jig,Canada, OutsideRockfish
Yellow (2.71) Red (2.05) Yellow (3.00) Green (3.61) Good Alternative(2.79)
Redbanded rockfishBrit ish ColumbiaNortheast Pacific, Jig,Canada, OutsideRockfish
Red (2.16) Red (2.05) Yellow (3.00) Green (3.61) Avoid (2.63)
12

China rockfishBrit ish ColumbiaNortheast Pacific, Jig,Canada, OutsideRockfish
Red (2.16) Red (2.05) Yellow (3.00) Green (3.61) Avoid (2.63)
Rougheye rockfishBrit ish ColumbiaNortheast Pacific, Setlonglines, Canada,Outside Rockfish
Red (2.16) Red (2.05) Yellow (3.00) Green (3.61) Avoid (2.63)
Redbanded rockfishBrit ish ColumbiaNortheast Pacific, Setlonglines, Canada,Outside Rockfish
Red (2.16) Red (2.05) Yellow (3.00) Green (3.61) Avoid (2.63)
Quillback rockfishBrit ish ColumbiaNortheast Pacific, Setlonglines, Canada,Outside Rockfish
Yellow (2.71) Red (2.05) Yellow (3.00) Green (3.61) Good Alternative(2.79)
SablefishBrit ish ColumbiaNortheast Pacific, Setlonglines, Canada,Outside Rockfish
Green (3.83) Red (2.05) Yellow (3.00) Green (3.61) Good Alternative(3.04)
Shortraker rockfishBrit ish ColumbiaNortheast Pacific, Setlonglines, Canada,Outside Rockfish
Red (2.16) Red (2.05) Yellow (3.00) Green (3.61) Avoid (2.63)
Big skateBrit ish ColumbiaNortheast Pacific, Setlonglines, Canada,Outside Rockfish
Green (3.32) Red (2.05) Yellow (3.00) Green (3.61) Good Alternative(2.93)
Tiger rockfishBrit ish ColumbiaNortheast Pacific, Setlonglines, Canada,Outside Rockfish
Red (2.16) Red (2.05) Yellow (3.00) Green (3.61) Avoid (2.63)
13
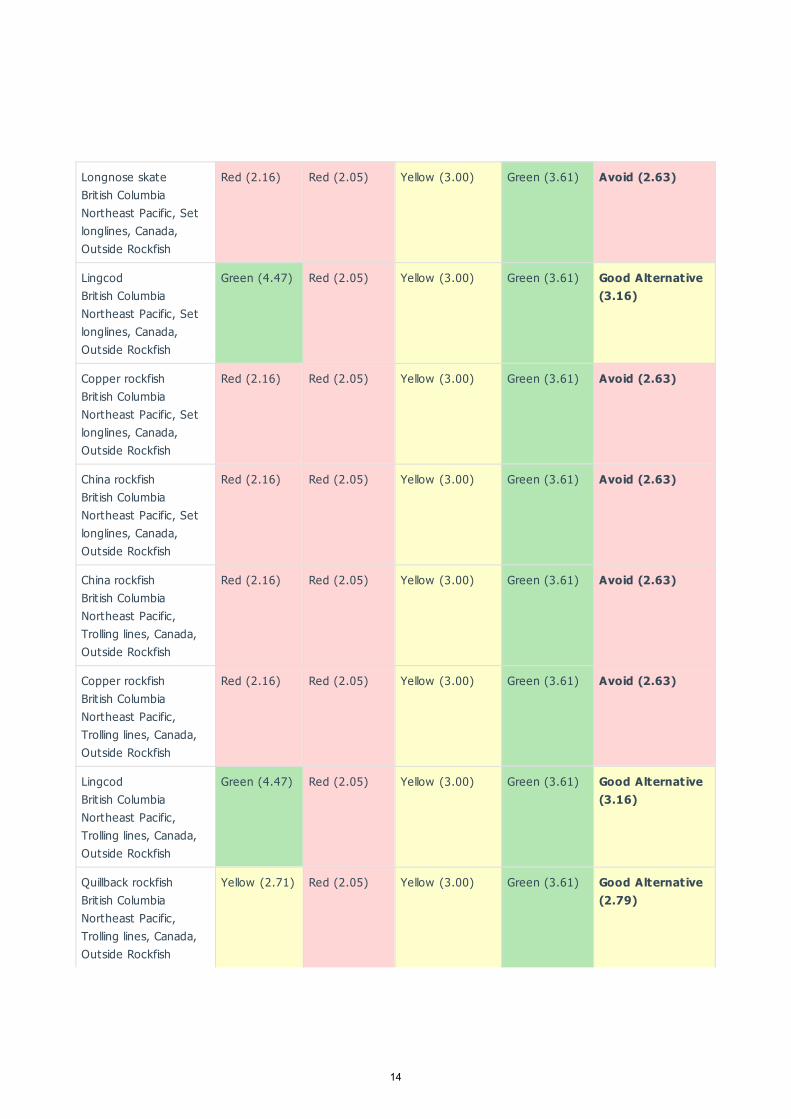
Longnose skateBrit ish ColumbiaNortheast Pacific, Setlonglines, Canada,Outside Rockfish
Red (2.16) Red (2.05) Yellow (3.00) Green (3.61) Avoid (2.63)
LingcodBrit ish ColumbiaNortheast Pacific, Setlonglines, Canada,Outside Rockfish
Green (4.47) Red (2.05) Yellow (3.00) Green (3.61) Good Alternative(3.16)
Copper rockfishBrit ish ColumbiaNortheast Pacific, Setlonglines, Canada,Outside Rockfish
Red (2.16) Red (2.05) Yellow (3.00) Green (3.61) Avoid (2.63)
China rockfishBrit ish ColumbiaNortheast Pacific, Setlonglines, Canada,Outside Rockfish
Red (2.16) Red (2.05) Yellow (3.00) Green (3.61) Avoid (2.63)
China rockfishBrit ish ColumbiaNortheast Pacific,Trolling lines, Canada,Outside Rockfish
Red (2.16) Red (2.05) Yellow (3.00) Green (3.61) Avoid (2.63)
Copper rockfishBrit ish ColumbiaNortheast Pacific,Trolling lines, Canada,Outside Rockfish
Red (2.16) Red (2.05) Yellow (3.00) Green (3.61) Avoid (2.63)
LingcodBrit ish ColumbiaNortheast Pacific,Trolling lines, Canada,Outside Rockfish
Green (4.47) Red (2.05) Yellow (3.00) Green (3.61) Good Alternative(3.16)
Quillback rockfishBrit ish ColumbiaNortheast Pacific,Trolling lines, Canada,Outside Rockfish
Yellow (2.71) Red (2.05) Yellow (3.00) Green (3.61) Good Alternative(2.79)
14

Redbanded rockfishBrit ish ColumbiaNortheast Pacific,Trolling lines, Canada,Outside Rockfish
Red (2.16) Red (2.05) Yellow (3.00) Green (3.61) Avoid (2.63)
Rougheye rockfishBrit ish ColumbiaNortheast Pacific,Trolling lines, Canada,Outside Rockfish
Red (2.16) Red (2.05) Yellow (3.00) Green (3.61) Avoid (2.63)
Shortraker rockfishBrit ish ColumbiaNortheast Pacific,Trolling lines, Canada,Outside Rockfish
Red (2.16) Red (2.05) Yellow (3.00) Green (3.61) Avoid (2.63)
Tiger rockfishBrit ish ColumbiaNortheast Pacific,Trolling lines, Canada,Outside Rockfish
Red (2.16) Red (2.05) Yellow (3.00) Green (3.61) Avoid (2.63)
Yellowtail rockfishBrit ish ColumbiaNortheast Pacific,Trolling lines, Canada,Outside Rockfish
Green (5.00) Red (2.05) Yellow (3.00) Green (3.61) Good Alternative(3.25)
Quillback rockfishBrit ish ColumbiaNortheast Pacific,Trolling lines, Canada,Inside Rockfish
Yellow (2.71) Red (2.05) Yellow (3.00) Green (3.61) Good Alternative(2.79)
Tiger rockfishBrit ish ColumbiaNortheast Pacific,Trolling lines, Canada,Inside Rockfish
Red (2.16) Yellow (2.57) Yellow (3.00) Green (3.61) Good Alternative(2.79)
Yellowtail rockfishBrit ish ColumbiaNortheast Pacific,Trolling lines, Canada,Inside Rockfish
Green (5.00) Red (2.05) Yellow (3.00) Green (3.61) Good Alternative(3.25)
15

Yelloweye rockfishBrit ish ColumbiaNortheast Pacific, Jig,Canada, Inside Rockfish
Yellow (2.71) Red (2.05) Yellow (3.00) Green (3.61) Good Alternative(2.79)
Yelloweye rockfishBrit ish ColumbiaNortheast Pacific, Jig,Canada, OutsideRockfish
Red (2.16) Red (2.05) Yellow (3.00) Green (3.61) Avoid (2.63)
Yelloweye rockfishBrit ish ColumbiaNortheast Pacific,Longline (deep-set),Canada
Red (2.16) Red (2.05) Yellow (3.00) Green (3.61) Avoid (2.63)
Yelloweye rockfishBrit ish ColumbiaNortheast Pacific,Longline (shallow-set),Canada
Yellow (2.71) Red (2.05) Yellow (3.00) Green (3.61) Good Alternative(2.79)
Yelloweye rockfishBrit ish ColumbiaNortheast Pacific, Setlonglines, Canada,Outside Rockfish
Red (2.16) Red (2.05) Yellow (3.00) Green (3.61) Avoid (2.63)
Yelloweye rockfishBrit ish ColumbiaNortheast Pacific,Trolling lines, Canada,Inside Rockfish
Yellow (2.71) Red (2.05) Yellow (3.00) Green (3.61) Good Alternative(2.79)
Yelloweye rockfishBrit ish ColumbiaNortheast Pacific,Trolling lines, Canada,Outside Rockfish
Red (2.16) Red (2.05) Yellow (3.00) Green (3.61) Avoid (2.63)
Yellowtail rockfishBrit ish ColumbiaNortheast Pacific, Jig,Canada, OutsideRockfish
Green (5.00) Red (2.05) Yellow (3.00) Green (3.61) Good Alternative(3.25)
16
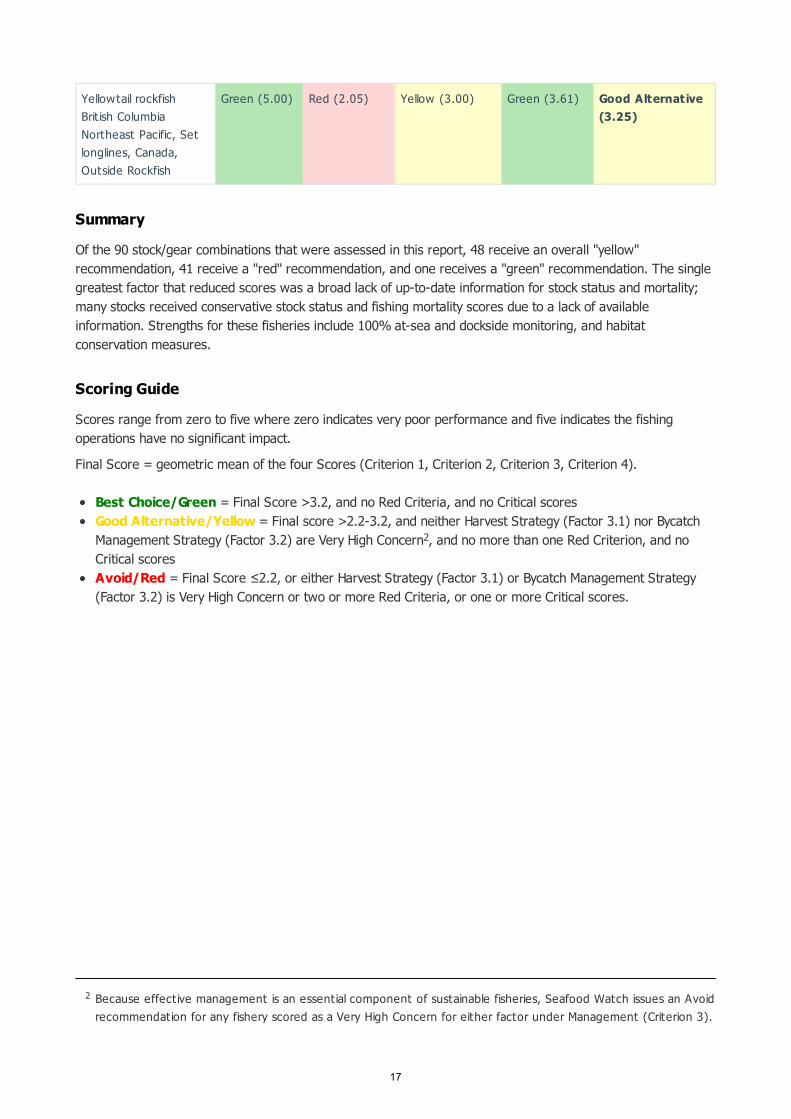
Summary
Of the 90 stock/gear combinations that were assessed in this report, 48 receive an overall "yellow"recommendation, 41 receive a "red" recommendation, and one receives a "green" recommendation. The singlegreatest factor that reduced scores was a broad lack of up-to-date information for stock status and mortality;many stocks received conservative stock status and fishing mortality scores due to a lack of availableinformation. Strengths for these fisheries include 100% at-sea and dockside monitoring, and habitatconservation measures.
Scoring Guide
Scores range from zero to five where zero indicates very poor performance and five indicates the fishingoperations have no significant impact.
Final Score = geometric mean of the four Scores (Criterion 1, Criterion 2, Criterion 3, Criterion 4).
Best Choice/Green = Final Score >3.2, and no Red Criteria, and no Critical scoresGood Alternative/Yellow = Final score >2.2-3.2, and neither Harvest Strategy (Factor 3.1) nor BycatchManagement Strategy (Factor 3.2) are Very High Concern , and no more than one Red Criterion, and noCritical scoresAvoid/Red = Final Score ≤2.2, or either Harvest Strategy (Factor 3.1) or Bycatch Management Strategy(Factor 3.2) is Very High Concern or two or more Red Criteria, or one or more Critical scores.
Because effect ive management is an essent ial component of sustainable fisheries, Seafood Watch issues an Avoidrecommendation for any fishery scored as a Very High Concern for either factor under Management (Criterion 3).
Yellowtail rockfishBrit ish ColumbiaNortheast Pacific, Setlonglines, Canada,Outside Rockfish
Green (5.00) Red (2.05) Yellow (3.00) Green (3.61) Good Alternative(3.25)
2
2
17

Introduction
Scope of the analysis and ensuing recommendation
This analysis encompasses the major commercial groundfish species that are caught in the seven integratedcommercial groundfish fisheries off of the coast of British Columbia. The species addressed in this analysisinclude a variety of flatfish, rockfish, and other roundfish. The midwater trawl fishery for Pacific hake and thesmall (Option A) trawl fishery are not addressed in this report.
Species Overview
The seven fisheries addressed in this assessment are the groundfish bottom trawl fishery and the hook and linefisheries for dogfish, halibut, lingcod, rockfish (inside) and rockfish (outside), and sablefish. The sevenintegrated groundfish fisheries use trawl, longline, jig, troll, handline, and pot gears to catch a variety ofrockfish, flatfish, and roundfish species. These fisheries are unique in that they are managed separately, but inan integrated manner, with one integrated management plan. Key features of this integrated fishery include:- Individual accountability for all catch of quota species (retained and released),
- An Individual Vessel Quota (IVQ) system,
- Reallocation of IVQs between vessels and fisheries as necessary, and
- 100% at-sea and dockside monitoring
The allocation of TAC to the trawl and hook and line fisheries is depicted in Figure 1.
Allocation of TAC between fisheries, 2013 (DFO 2013a).
18

Production Statistics
In 2012, the total landed value of B.C.’s non-hake groundfish landings was $104.2 million (Figure 2) (Ministry ofAgriculture 2013)). Pacific halibut, sablefish, and rockfish landings are particularly valuable, accounting forapproximately 83% of the landed value of the 2012 groundfish landings (Figure 2) (Ministry of Agriculture2013).
Landed value of non-hake groundfish in B.C., 2001-2012. Data from (Ministry of Agriculture 2013)(Ministry of Environment 2014).(Ministry of Environment 2014).}
Importance to the US/North American market.
Much of the seafood produced by the groundfish fisheries is destined for export. Fresh and frozen fillets andwhole fish are exported to markets along the “I-5 Highway Corridor” that runs along the U.S. west coast(GSGislason & Associates 2010). Rockfish are primarily exported to the U.S., where they are sold as fresh andfrozen fillets (BCSeafood 2014); a market for live rockfish exists in the Vancouver region, as well (GSGislason &Associates 2010)(BCSeafood 2014)). The primary market for sablefish is Japan (BCSeafood.ca 2014). Halibutand lingcod are primarily destined for domestic markets and for export to the U.S. (BCSeafood 2014). Lingcodare sold as fresh and frozen fillets, while halibut are sold in a variety of products. Dogfish are exported,primarily to the United Kingdom, Europe, and Asia (BCSeafood 2014). Other notable export markets includeChina (flounder), Russia (sablefish, dogfish), and Ukraine (pollock, flounder) (Ministry of Agriculture 2012). In2012, B.C.’s non-hake groundfish exports were valued at approximately $84.2 million, which represented a 16%decline from 2011 (Ministry of Agriculture 2012).
Common and market names.
Table 1. Common, market, and vernacular names of non-rockfish commercial groundfish species (as
19

used in the US) (FDA 2012).
Table 2. Common and vernacular names for rockfish species (as used in the US) (FDA 2012)
Common nameAcceptable market names
Vernacular name(s)
Arrowtooth flounderFlounder, Arrowtooth Turbot
Dover sole Sole Slime sole, Slippery sole
English sole Sole Lemon sole
Lingcod LingcodCultus cod, Blue cod, Buffalo cod, Ling
Pacific cod Cod, Alaska cod Alaska cod, Grey cod, True cod
Pacific sanddab Sanddab Mottled sanddab, Soft flounder
Petrale sole Sole or Flounder California sole, Brill
Rex sole Sole or Flounder Longfin sole, Witch
Rock sole Sole or Flounder Rock flounder
Sablefish SablefishBlack cod, Butterfish, Skil, Skilfish, Coalfish
Spiny dogfishShark, dogfish or shark, cape Spring dogfish, Spiked dogfish, Spur Dog
Common nameAcceptable marketnames Vernacular name(s)
Canary rockfish Rockfish Pacific red snapper, Orange rockfish
China rockfish Rockfish Yellowspotted rockcod
Copper rockfish Rockfish NA
Darkblotched rockfishRockfish Blackmouth rockfish
Greenstriped rockfishRockfish NA
Longspinethornyhead Thornyhead
Longspine channel rockfish, spinycheek rockfish
Pacific Ocean perch Ocean perch, rockfishNA
Quillback rockfishRockfish
Yellowback rockcod, Brown rockcod, Orangespottedrockcod
Redbanded rockfishRockfish NA
20

Table 3. Common, market, and vernacular names of non-rockfish commercial groundfish species (asused in the US) (FDA 2012).
Redstripe rockfishRockfish NA
Rougheye rockfishRockfish NA
Sharpchin rockfishRockfish Bigeyed rockfish
Shortraker rockfishRockfish NA
Shortspinethornyhead Thornyhead
Shortspine channel rockfish, spinycheek rockfish
Silvergray rockfishRockfish NA
Tiger rockfish Rockfish Blackbanded rockcod
Widow rockfish Rockfish Pacific red snapper
Yelloweye rockfishRockfish Pacific red snapper, Rasphead rockfish
Yellowmouth rockfishRockfish NA
Yellowtail rockfishRockfish
Pacific red snapper
Common nameAcceptable market names
Vernacular name(s)
Arrowtooth flounderFlounder, Arrowtooth Turbot
Dover sole Sole Slime sole, Slippery sole
English sole Sole Lemon sole
Lingcod LingcodCultus cod, Blue cod, Buffalo cod, Ling
Pacific cod Cod, Alaska cod Alaska cod, Grey cod, True cod
Pacific sanddab Sanddab Mottled sanddab, Soft flounder
Petrale sole Sole or Flounder California sole, Brill
21

Table 4. Common and vernacular names for rockfish species (as used in the US) (FDA 2012).
Rex sole Sole or Flounder Longfin sole, Witch
Rock sole Sole or Flounder Rock flounder
Sablefish SablefishBlack cod, Butterfish, Skil, Skilfish, Coalfish
Spiny dogfishShark, dogfish or shark, cape Spring dogfish, Spiked dogfish, Spur Dog
Common nameAcceptable marketnames Vernacular name(s)
Canary rockfish Rockfish Pacific red snapper, Orange rockfish
China rockfish Rockfish Yellowspotted rockcod
Copper rockfish Rockfish NA
Darkblotched rockfishRockfish Blackmouth rockfish
Greenstriped rockfishRockfish NA
Longspinethornyhead Thornyhead
Longspine channel rockfish, spinycheek rockfish
Pacific Ocean perch Ocean perch, rockfishNA
Quillback rockfishRockfish
Yellowback rockcod, Brown rockcod, Orangespottedrockcod
Redbanded rockfishRockfish NA
Redstripe rockfishRockfish NA
Rougheye rockfishRockfish NA
Sharpchin rockfishRockfish Bigeyed rockfish
Shortraker rockfishRockfish NA
Shortspinethornyhead Thornyhead
Shortspine channel rockfish, spinycheek rockfish
Silvergray rockfishRockfish NA
22

Primary product forms
See "Importance to the US/North American market".
Tiger rockfish Rockfish Blackbanded rockcod
Widow rockfish Rockfish Pacific red snapper
Yelloweye rockfishRockfish Pacific red snapper, Rasphead rockfish
Yellowmouth rockfishRockfish NA
Yellowtail rockfishRockfish
Pacific red snapper
23

AssessmentThis section assesses the sustainability of the fishery(s) relative to the Seafood Watch Criteria for Fisheries,available at http://www.seafoodwatch.org.
Criterion 1: Impacts on the species under assessmentThis criterion evaluates the impact of fishing mortality on the species, given its current abundance. The inherentvulnerability to fishing rating influences how abundance is scored, when abundance is unknown.
The final Criterion 1 score is determined by taking the geometric mean of the abundance and fishing mortalityscores. The Criterion 1 rating is determined as follows:
Score >3.2=Green or Low ConcernScore >2.2 and ≤3.2=Yellow or Moderate ConcernScore ≤2.2=Red or High Concern
Rating is Critical if Factor 1.3 (Fishing Mortality) is Critical
Criterion 1 Summary
ARROWTOOTH FLOUNDER
Region | MethodInherentVulnerability Abundance Fishing Mortality Score
BritishColumbia/NortheastPacific Bottom trawls |Canada | hard substrate
2.00: Medium 5.00: Very LowConcern
5.00: Very LowConcern
Green (5.00)
BritishColumbia/NortheastPacific Midwater trawls |Canada
2.00: Medium 5.00: Very LowConcern
5.00: Very LowConcern
Green (5.00)
BIG SKATE
Region | MethodInherentVulnerability Abundance Fishing Mortality Score
BritishColumbia/NortheastPacific Bottom trawls |Canada | soft substrate
1.00: High 3.00: ModerateConcern
3.67: Low Concern Green (3.32)
BritishColumbia/NortheastPacific Set longlines |Canada | OutsideRockfish
1.00: High 3.00: ModerateConcern
3.67: Low Concern Green (3.32)
24
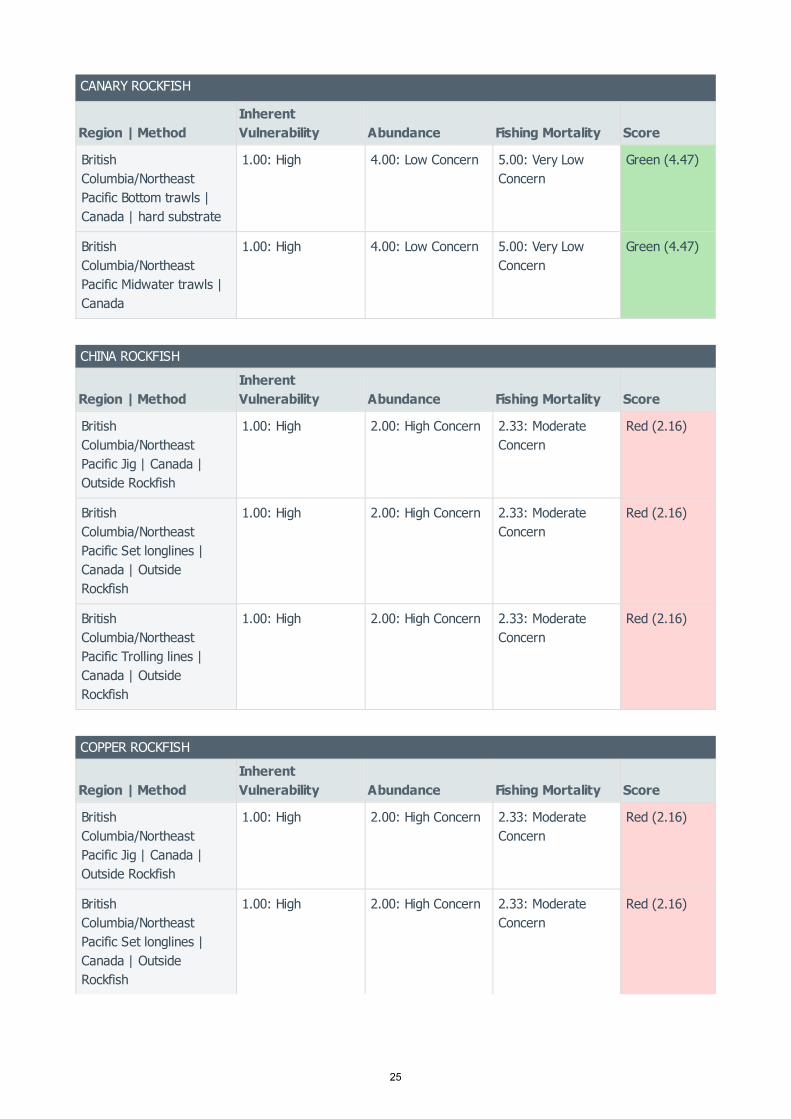
CANARY ROCKFISH
Region | MethodInherentVulnerability Abundance Fishing Mortality Score
BritishColumbia/NortheastPacific Bottom trawls |Canada | hard substrate
1.00: High 4.00: Low Concern 5.00: Very LowConcern
Green (4.47)
BritishColumbia/NortheastPacific Midwater trawls |Canada
1.00: High 4.00: Low Concern 5.00: Very LowConcern
Green (4.47)
CHINA ROCKFISH
Region | MethodInherentVulnerability Abundance Fishing Mortality Score
BritishColumbia/NortheastPacific Jig | Canada |Outside Rockfish
1.00: High 2.00: High Concern 2.33: ModerateConcern
Red (2.16)
BritishColumbia/NortheastPacific Set longlines |Canada | OutsideRockfish
1.00: High 2.00: High Concern 2.33: ModerateConcern
Red (2.16)
BritishColumbia/NortheastPacific Trolling lines |Canada | OutsideRockfish
1.00: High 2.00: High Concern 2.33: ModerateConcern
Red (2.16)
COPPER ROCKFISH
Region | MethodInherentVulnerability Abundance Fishing Mortality Score
BritishColumbia/NortheastPacific Jig | Canada |Outside Rockfish
1.00: High 2.00: High Concern 2.33: ModerateConcern
Red (2.16)
BritishColumbia/NortheastPacific Set longlines |Canada | OutsideRockfish
1.00: High 2.00: High Concern 2.33: ModerateConcern
Red (2.16)
25
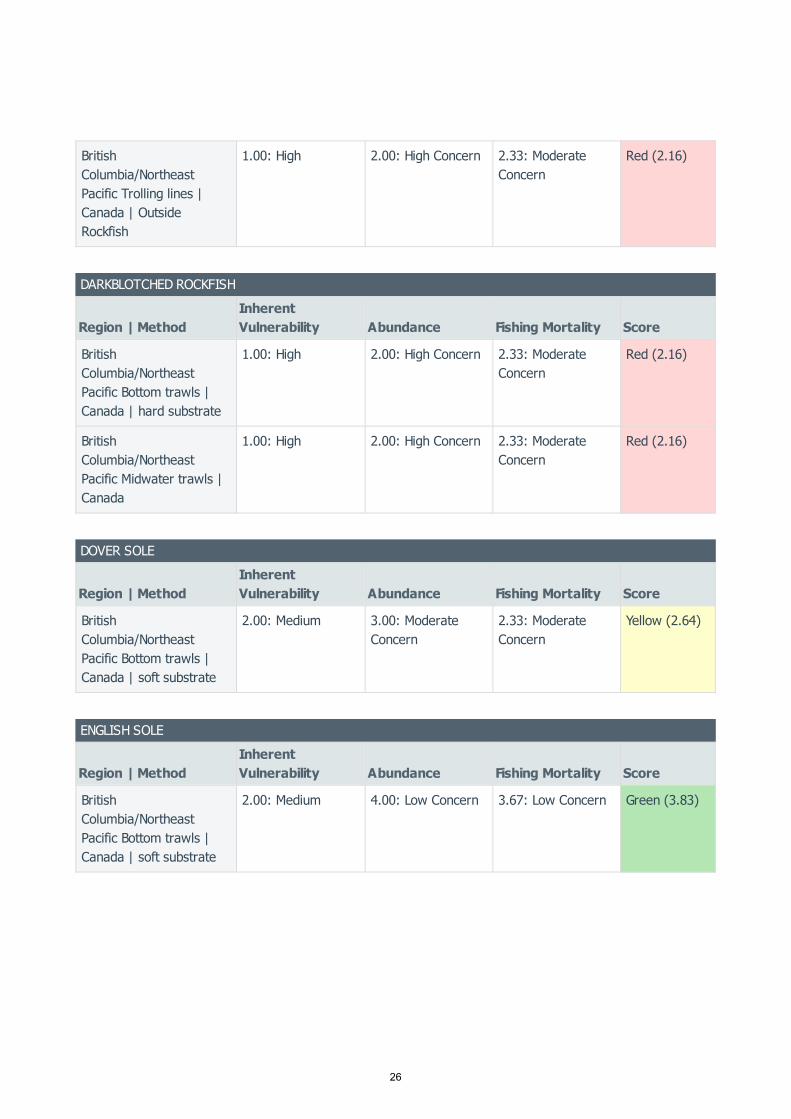
BritishColumbia/NortheastPacific Trolling lines |Canada | OutsideRockfish
1.00: High 2.00: High Concern 2.33: ModerateConcern
Red (2.16)
DARKBLOTCHED ROCKFISH
Region | MethodInherentVulnerability Abundance Fishing Mortality Score
BritishColumbia/NortheastPacific Bottom trawls |Canada | hard substrate
1.00: High 2.00: High Concern 2.33: ModerateConcern
Red (2.16)
BritishColumbia/NortheastPacific Midwater trawls |Canada
1.00: High 2.00: High Concern 2.33: ModerateConcern
Red (2.16)
DOVER SOLE
Region | MethodInherentVulnerability Abundance Fishing Mortality Score
BritishColumbia/NortheastPacific Bottom trawls |Canada | soft substrate
2.00: Medium 3.00: ModerateConcern
2.33: ModerateConcern
Yellow (2.64)
ENGLISH SOLE
Region | MethodInherentVulnerability Abundance Fishing Mortality Score
BritishColumbia/NortheastPacific Bottom trawls |Canada | soft substrate
2.00: Medium 4.00: Low Concern 3.67: Low Concern Green (3.83)
26

GREENSTRIPED ROCKFISH
Region | MethodInherentVulnerability Abundance Fishing Mortality Score
BritishColumbia/NortheastPacific Bottom trawls |Canada | hard substrate
1.00: High 3.00: ModerateConcern
2.33: ModerateConcern
Yellow (2.64)
BritishColumbia/NortheastPacific Midwater trawls |Canada
1.00: High 3.00: ModerateConcern
2.33: ModerateConcern
Yellow (2.64)
LINGCOD
Region | MethodInherentVulnerability Abundance Fishing Mortality Score
BritishColumbia/NortheastPacific Bottom trawls |Canada | hard substrate
2.00: Medium 4.00: Low Concern 5.00: Very LowConcern
Green (4.47)
BritishColumbia/NortheastPacific Set longlines |Canada | Inside Rockfish
2.00: Medium 4.00: Low Concern 5.00: Very LowConcern
Green (4.47)
BritishColumbia/NortheastPacific Midwater trawls |Canada
2.00: Medium 4.00: Low Concern 5.00: Very LowConcern
Green (4.47)
BritishColumbia/NortheastPacific Jig | Canada |Outside Rockfish
2.00: Medium 4.00: Low Concern 5.00: Very LowConcern
Green (4.47)
BritishColumbia/NortheastPacific Set longlines |Canada | OutsideRockfish
2.00: Medium 4.00: Low Concern 5.00: Very LowConcern
Green (4.47)
BritishColumbia/NortheastPacific Trolling lines |Canada | OutsideRockfish
2.00: Medium 4.00: Low Concern 5.00: Very LowConcern
Green (4.47)
27

LONGNOSE SKATE
Region | MethodInherentVulnerability Abundance Fishing Mortality Score
BritishColumbia/NortheastPacific Longline (shallow-set) | Canada
1.00: High 2.00: High Concern 2.33: ModerateConcern
Red (2.16)
BritishColumbia/NortheastPacific Bottom trawls |Canada | soft substrate
1.00: High 2.00: High Concern 2.33: ModerateConcern
Red (2.16)
BritishColumbia/NortheastPacific Set longlines |Canada | OutsideRockfish
1.00: High 2.00: High Concern 2.33: ModerateConcern
Red (2.16)
LONGSPINE THORNYHEAD
Region | MethodInherentVulnerability Abundance Fishing Mortality Score
BritishColumbia/NortheastPacific Bottom trawls |Canada | soft substrate
1.00: High 2.00: High Concern 3.67: Low Concern Yellow (2.71)
PACIFIC COD
Region | MethodInherentVulnerability Abundance Fishing Mortality Score
BritishColumbia/NortheastPacific Bottom trawls |Canada | soft substrate
2.00: Medium 2.00: High Concern 5.00: Very LowConcern
Yellow (3.16)
PACIFIC OCEAN PERCH
Region | MethodInherentVulnerability Abundance Fishing Mortality Score
BritishColumbia/NortheastPacific Bottom trawls |Canada | hard substrate
1.00: High 4.00: Low Concern 2.33: ModerateConcern
Yellow (3.05)
28
BritishColumbia/NortheastPacific Midwater trawls |Canada
1.00: High 4.00: Low Concern 2.33: ModerateConcern
Yellow (3.05)

PETRALE SOLE
Region | MethodInherentVulnerability Abundance Fishing Mortality Score
BritishColumbia/NortheastPacific Bottom trawls |Canada | soft substrate
2.00: Medium 4.00: Low Concern 2.33: ModerateConcern
Yellow (3.05)
QUILLBACK ROCKFISH
Region | MethodInherentVulnerability Abundance Fishing Mortality Score
BritishColumbia/NortheastPacific Jig | Canada |Inside Rockfish
1.00: High 2.00: High Concern 3.67: Low Concern Yellow (2.71)
BritishColumbia/NortheastPacific Jig | Canada |Outside Rockfish
1.00: High 2.00: High Concern 3.67: Low Concern Yellow (2.71)
BritishColumbia/NortheastPacific Set longlines |Canada | OutsideRockfish
1.00: High 2.00: High Concern 3.67: Low Concern Yellow (2.71)
BritishColumbia/NortheastPacific Trolling lines |Canada | OutsideRockfish
1.00: High 2.00: High Concern 3.67: Low Concern Yellow (2.71)
BritishColumbia/NortheastPacific Trolling lines |Canada | Inside Rockfish
1.00: High 2.00: High Concern 3.67: Low Concern Yellow (2.71)
29

REDBANDED ROCKFISH
Region | MethodInherentVulnerability Abundance Fishing Mortality Score
BritishColumbia/NortheastPacific Bottom trawls |Canada | hard substrate
1.00: High 2.00: High Concern 2.33: ModerateConcern
Red (2.16)
BritishColumbia/NortheastPacific Longline (deep-set) | Canada
1.00: High 2.00: High Concern 2.33: ModerateConcern
Red (2.16)
BritishColumbia/NortheastPacific Midwater trawls |Canada
1.00: High 2.00: High Concern 2.33: ModerateConcern
Red (2.16)
BritishColumbia/NortheastPacific Jig | Canada |Outside Rockfish
1.00: High 2.00: High Concern 2.33: ModerateConcern
Red (2.16)
BritishColumbia/NortheastPacific Set longlines |Canada | OutsideRockfish
1.00: High 2.00: High Concern 2.33: ModerateConcern
Red (2.16)
BritishColumbia/NortheastPacific Trolling lines |Canada | OutsideRockfish
1.00: High 2.00: High Concern 2.33: ModerateConcern
Red (2.16)
REDSTRIPE ROCKFISH
Region | MethodInherentVulnerability Abundance Fishing Mortality Score
BritishColumbia/NortheastPacific Bottom trawls |Canada | hard substrate
1.00: High 2.00: High Concern 2.33: ModerateConcern
Red (2.16)
BritishColumbia/NortheastPacific Midwater trawls |Canada
1.00: High 2.00: High Concern 2.33: ModerateConcern
Red (2.16)
30

REX SOLE
Region | MethodInherentVulnerability Abundance Fishing Mortality Score
BritishColumbia/NortheastPacific Bottom trawls |Canada | soft substrate
2.00: Medium 3.00: ModerateConcern
2.33: ModerateConcern
Yellow (2.64)
ROUGHEYE ROCKFISH
Region | MethodInherentVulnerability Abundance Fishing Mortality Score
BritishColumbia/NortheastPacific Bottom trawls |Canada | hard substrate
1.00: High 2.00: High Concern 2.33: ModerateConcern
Red (2.16)
BritishColumbia/NortheastPacific Longline (deep-set) | Canada
1.00: High 2.00: High Concern 2.33: ModerateConcern
Red (2.16)
BritishColumbia/NortheastPacific Midwater trawls |Canada
1.00: High 2.00: High Concern 2.33: ModerateConcern
Red (2.16)
BritishColumbia/NortheastPacific Jig | Canada |Outside Rockfish
1.00: High 2.00: High Concern 2.33: ModerateConcern
Red (2.16)
BritishColumbia/NortheastPacific Set longlines |Canada | OutsideRockfish
1.00: High 2.00: High Concern 2.33: ModerateConcern
Red (2.16)
BritishColumbia/NortheastPacific Trolling lines |Canada | OutsideRockfish
1.00: High 2.00: High Concern 2.33: ModerateConcern
Red (2.16)
31

SABLEFISH
Region | MethodInherentVulnerability Abundance Fishing Mortality Score
BritishColumbia/NortheastPacific Longline (deep-set) | Canada
1.00: High 4.00: Low Concern 3.67: Low Concern Green (3.83)
BritishColumbia/NortheastPacific Bottom trawls |Canada | soft substrate
1.00: High 4.00: Low Concern 3.67: Low Concern Green (3.83)
BritishColumbia/NortheastPacific Set longlines |Canada | OutsideRockfish
1.00: High 4.00: Low Concern 3.67: Low Concern Green (3.83)
SHORTRAKER ROCKFISH
Region | MethodInherentVulnerability Abundance Fishing Mortality Score
BritishColumbia/NortheastPacific Bottom trawls |Canada | hard substrate
1.00: High 2.00: High Concern 2.33: ModerateConcern
Red (2.16)
BritishColumbia/NortheastPacific Longline (deep-set) | Canada
1.00: High 2.00: High Concern 2.33: ModerateConcern
Red (2.16)
BritishColumbia/NortheastPacific Midwater trawls |Canada
1.00: High 2.00: High Concern 2.33: ModerateConcern
Red (2.16)
BritishColumbia/NortheastPacific Jig | Canada |Outside Rockfish
1.00: High 2.00: High Concern 2.33: ModerateConcern
Red (2.16)
BritishColumbia/NortheastPacific Set longlines |Canada | OutsideRockfish
1.00: High 2.00: High Concern 2.33: ModerateConcern
Red (2.16)
32

BritishColumbia/NortheastPacific Trolling lines |Canada | OutsideRockfish
1.00: High 2.00: High Concern 2.33: ModerateConcern
Red (2.16)
SHORTSPINE THORNYHEAD
Region | MethodInherentVulnerability Abundance Fishing Mortality Score
BritishColumbia/NortheastPacific Bottom trawls |Canada | soft substrate
1.00: High 2.00: High Concern 2.33: ModerateConcern
Red (2.16)
SILVERGRAY ROCKFISH
Region | MethodInherentVulnerability Abundance Fishing Mortality Score
BritishColumbia/NortheastPacific Bottom trawls |Canada | hard substrate
1.00: High 5.00: Very LowConcern
5.00: Very LowConcern
Green (5.00)
BritishColumbia/NortheastPacific Midwater trawls |Canada
1.00: High 5.00: Very LowConcern
5.00: Very LowConcern
Green (5.00)
SOUTHERN ROCK SOLE
Region | MethodInherentVulnerability Abundance Fishing Mortality Score
BritishColumbia/NortheastPacific Bottom trawls |Canada | hard substrate
2.00: Medium 5.00: Very LowConcern
5.00: Very LowConcern
Green (5.00)
BritishColumbia/NortheastPacific Midwater trawls |Canada
2.00: Medium 5.00: Very LowConcern
5.00: Very LowConcern
Green (5.00)
33
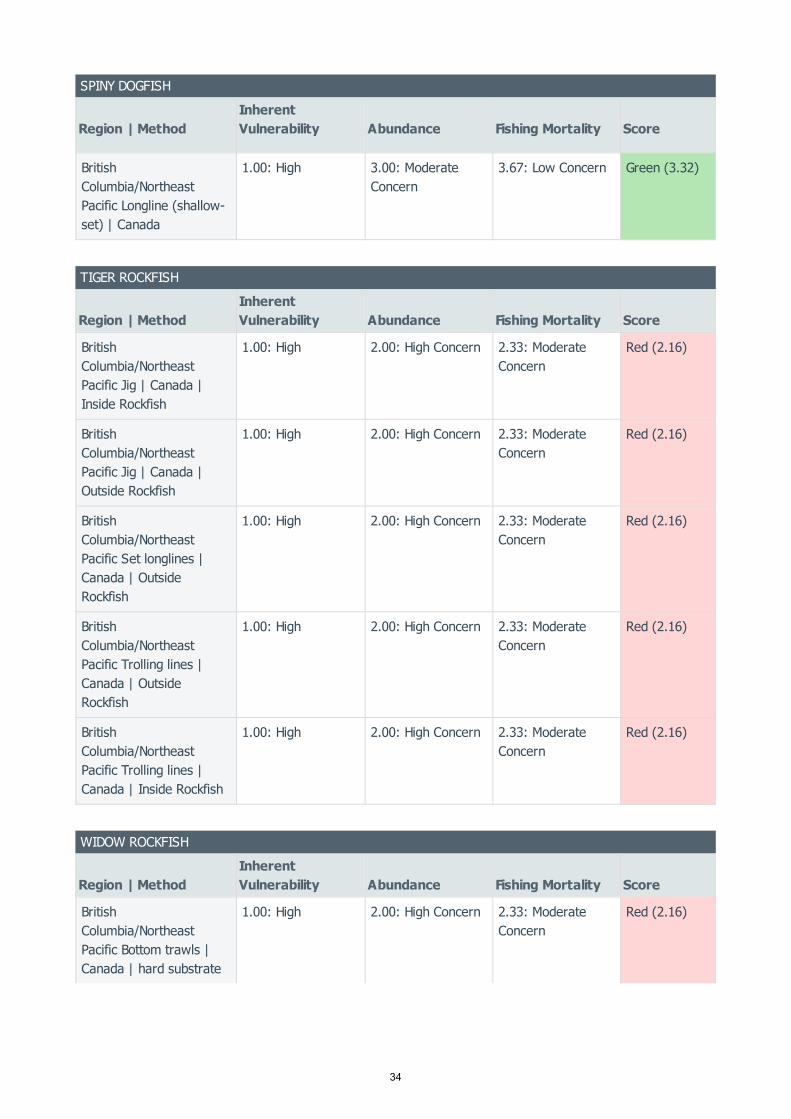
SPINY DOGFISH
Region | MethodInherentVulnerability Abundance Fishing Mortality Score
BritishColumbia/NortheastPacific Longline (shallow-set) | Canada
1.00: High 3.00: ModerateConcern
3.67: Low Concern Green (3.32)
TIGER ROCKFISH
Region | MethodInherentVulnerability Abundance Fishing Mortality Score
BritishColumbia/NortheastPacific Jig | Canada |Inside Rockfish
1.00: High 2.00: High Concern 2.33: ModerateConcern
Red (2.16)
BritishColumbia/NortheastPacific Jig | Canada |Outside Rockfish
1.00: High 2.00: High Concern 2.33: ModerateConcern
Red (2.16)
BritishColumbia/NortheastPacific Set longlines |Canada | OutsideRockfish
1.00: High 2.00: High Concern 2.33: ModerateConcern
Red (2.16)
BritishColumbia/NortheastPacific Trolling lines |Canada | OutsideRockfish
1.00: High 2.00: High Concern 2.33: ModerateConcern
Red (2.16)
BritishColumbia/NortheastPacific Trolling lines |Canada | Inside Rockfish
1.00: High 2.00: High Concern 2.33: ModerateConcern
Red (2.16)
WIDOW ROCKFISH
Region | MethodInherentVulnerability Abundance Fishing Mortality Score
BritishColumbia/NortheastPacific Bottom trawls |Canada | hard substrate
1.00: High 2.00: High Concern 2.33: ModerateConcern
Red (2.16)
34

BritishColumbia/NortheastPacific Midwater trawls |Canada
1.00: High 2.00: High Concern 2.33: ModerateConcern
Red (2.16)
YELLOWEYE ROCKFISH
Region | MethodInherentVulnerability Abundance Fishing Mortality Score
BritishColumbia/NortheastPacific Jig | Canada |Inside Rockfish
1.00: High 2.00: High Concern 3.67: Low Concern Yellow (2.71)
BritishColumbia/NortheastPacific Jig | Canada |Outside Rockfish
1.00: High 2.00: High Concern 2.33: ModerateConcern
Red (2.16)
BritishColumbia/NortheastPacific Longline (deep-set) | Canada
1.00: High 2.00: High Concern 2.33: ModerateConcern
Red (2.16)
BritishColumbia/NortheastPacific Longline (shallow-set) | Canada
1.00: High 2.00: High Concern 3.67: Low Concern Yellow (2.71)
BritishColumbia/NortheastPacific Set longlines |Canada | OutsideRockfish
1.00: High 2.00: High Concern 2.33: ModerateConcern
Red (2.16)
BritishColumbia/NortheastPacific Trolling lines |Canada | Inside Rockfish
1.00: High 2.00: High Concern 3.67: Low Concern Yellow (2.71)
BritishColumbia/NortheastPacific Trolling lines |Canada | OutsideRockfish
1.00: High 2.00: High Concern 2.33: ModerateConcern
Red (2.16)
35
BritishColumbia/NortheastPacific Set longlines |Canada | OutsideRockfish
1.00: High 5.00: Very LowConcern
5.00: Very LowConcern
Green (5.00)
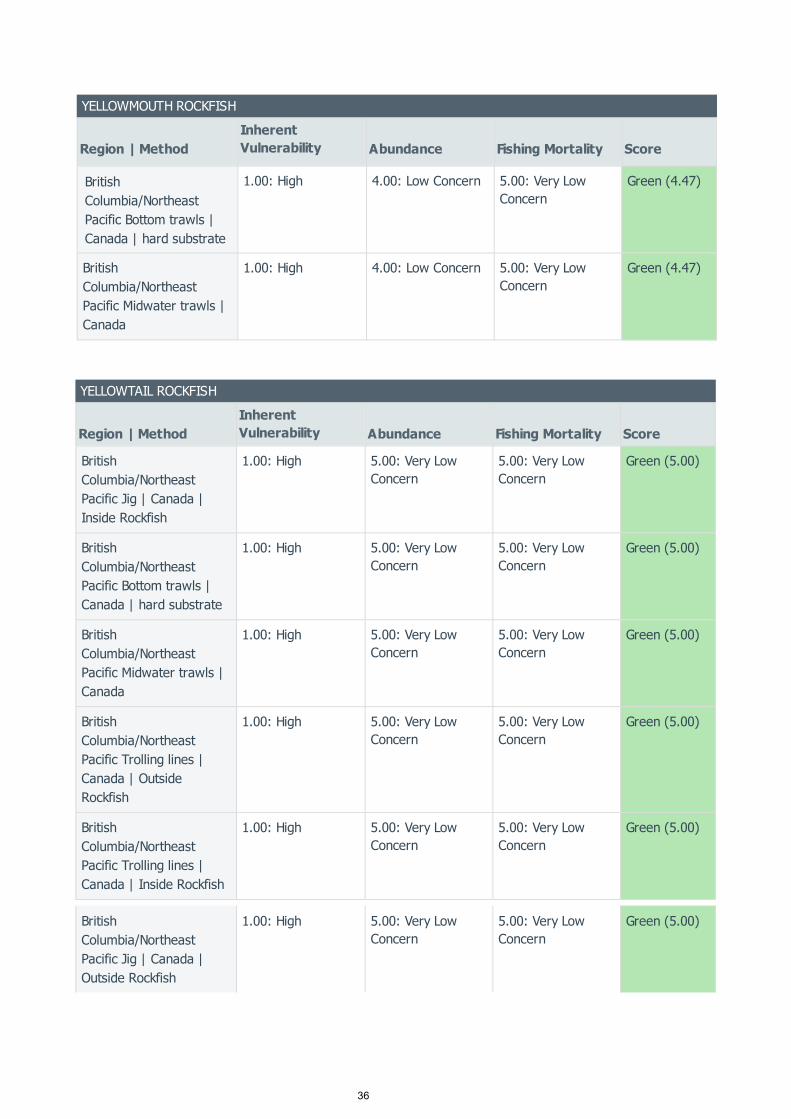
YELLOWMOUTH ROCKFISH
Region | MethodInherent Vulnerability Abundance Fishing Mortality Score
BritishColumbia/Northeast Pacific Bottom trawls |Canada | hard substrate
1.00: High 4.00: Low Concern 5.00: Very Low Concern
Green (4.47)
BritishColumbia/Northeast Pacific Midwater trawls |Canada
1.00: High 4.00: Low Concern 5.00: Very Low Concern
Green (4.47)
YELLOWTAIL ROCKFISH
Region | MethodInherent Vulnerability Abundance Fishing Mortality Score
BritishColumbia/Northeast Pacific Jig | Canada |Inside Rockfish
1.00: High 5.00: Very Low Concern
5.00: Very Low Concern
Green (5.00)
BritishColumbia/Northeast Pacific Bottom trawls |Canada | hard substrate
1.00: High 5.00: Very Low Concern
5.00: Very Low Concern
Green (5.00)
BritishColumbia/Northeast Pacific Midwater trawls |Canada
1.00: High 5.00: Very Low Concern
5.00: Very Low Concern
Green (5.00)
BritishColumbia/Northeast Pacific Trolling lines |Canada | Outside Rockfish
1.00: High 5.00: Very Low Concern
5.00: Very Low Concern
Green (5.00)
BritishColumbia/Northeast Pacific Trolling lines |Canada | Inside Rockfish
1.00: High 5.00: Very Low Concern
5.00: Very Low Concern
Green (5.00)
BritishColumbia/Northeast Pacific Jig | Canada |Outside Rockfish
1.00: High 5.00: Very Low Concern
5.00: Very Low Concern
Green (5.00)
36

Inherent Vulnerability
Throughout this report, the inherent vulnerability of assessed stocks is informed by the productivity scorespresented in Table 1 {Cope et al. 2011}. The vulnerability scores presented in Cope et al. (2011) were not used,as those scores are informed by susceptibility-to-fisheries information that is specific to the U.S. west coastgroundfish fisheries. The manner in which these productivity scores are interpreted is described below.
Cope and colleagues scored each species for 10 productivity attributes; for each attribute, the species was putinto one of three "bins" based on its species-specific information for that attribute. Each bin had a scoreassociated with it, and the three bins were: low productivity (score of 1), medium productivity (2), and highproductivity (3) (Table 2 in Cope et al. 2011). The species' overall productivity score was then derived from itsscores on these 10 specific attributes. Since a species' productivity score could range between 1.0 and 3.0 (i.e.,no species could have an overall productivity score of less than 1 or more than 3), the "distance" over which aspecies' productivity score could range was 2. If this distance (i.e., 2) is divided equally between the three bins,we can say that the low productivity bin includes productivity scores of 1 to 1.67, the medium bin has scores of1.68-2.33, and the high bin has scores of 2.34-3.0. To inform this report's assessment of inherent vulnerability(rather than resilience), these scores are reversed to reflect vulnerability, so that high vulnerability is indicatedby a productivity score of 1.0-1.67, medium vulnerability is a score of 1.68-2.33, and low vulnerability is a scoreof 2.34-3.0. These scores are presented alongside FishBase vulnerability scores, which are interpreted inaccordance with Seafood Watch criteria. Where there was a discrepancy between the productivity scores andthe FishBase vulnerability scores, the productivity scores were the final determinant of the inherent vulnerabilityscore.
Management Reference Points
In this assessment, B and SB are the biomass and spawning biomass at maximum sustainable yield,while B or SB are estimates of a stock’s biomass and spawning biomass in the absence of fishing, atequilibrium with long-term average recruitment.
Fisheries and Oceans Canada (also known by their previous acronym of DFO) is tasked with managingcommercial fisheries in Canada’s Pacific waters. DFO recently implemented a harvest strategy that usesreference points to define the status of a given stock and thereby guide decisions regarding allowable removals.The two reference points are the upper stock reference point (USRP) and the limit reference point (LRP). TheUSRP is not necessarily the management target; a target reference point may be higher than the USRP {DFO2009a}. DFO suggests that if stock-specific data are not available, 0.80*B may be used as the USRP, and0.40*B may be used as the LRP (Annex 1b in DFO 2009a). A third reference, the removal reference, governsallowable mortality rates; the removal rate declines between the USRP and the LRP. In this assessment, theacronyms USRP and LRP will refer to the two biomass reference points. For more information on theprecautionary harvest strategy, see the ‘Harvest Strategy’ section.
BritishColumbia/NortheastPacific Set longlines |Canada | OutsideRockfish
1.00: High 5.00: Very LowConcern
5.00: Very LowConcern
Green (5.00)
MSY MSY
0 0
MSY
MSY
37
Trawl Survey Indices
Throughout this assessment, indices of relative abundance are referenced to inform stock status evaluations.These indices are generally derived from multi-species trawl surveys, but can be based on commercial catchand effort data in the absence of reliable survey estimates. The purpose of the trawl survey biomass indices isto monitor changes in relative abundance. To that end, the index values are not estimates of absoluteabundance, but instead should be interpreted relative to the other points in the relevant time series.
The trawl survey biomass indices are derived from multispecies trawl surveys that take place in four areas:West Coast Vancouver Island (WCVI), West Coast Haida Gwaii (WCHG), Queen Charlotte Sound (QCS), andHecate Strait (HS). These surveys follow a random depth stratified design {Sinclair et al. 2003}. While thesesurvey indices provide the best available information for many species, there are several caveats that precludedthis assessment’s use of the indices for some stock/area combinations. For one, certain stock/areacombinations yield survey biomass estimates with relative errors that are too high to allow for reliableinterpretation of trends from survey to survey. In other situations, an area may simply not be a center ofabundance for a given stock; trends for such areas say little about the overall abundance of the stock in BritishColumbia’s waters. For these reasons, this report does not use trawl survey biomass index information insituations where the relative error for some index values is too high to allow for confident interpretation oftrends in the index, or where the stock being assessed is clearly not abundant in a given survey area.
Interpretation of Fishing Mortality Information
Throughout this assessment, several sources of information are used to evaluate fishing mortality. Where it isavailable, information from recent stock assessments takes priority over other sources of information. Manystocks in this report have TACs but lack regularly updated stock assessments. In such a situation, the TAC isadjusted by DFO based on trends in survey indices and fishery-dependent data; the metrics and methods forsuch decisions are not made public. Thus, for stocks with TACs but without recent stock status information, thisassessment takes a conservative approach: catches that are less than TACs are generally scored ’moderate’ forfishing mortality, unless there is other information to suggest lesser or greater concern (e.g., recent catcheswell over historic catches, etc.). For stocks without TACs, a fishing mortality score of ’unknown’ is the generalstarting point; this may be revised upwards or downwards based on other sources of information. It should alsobe noted that data presented for rockfish catches during the late 1980s and early 1990s is considered to beuncertain, as there existed at that time an incentive to misreport catches.
Catch and TAC data
Finally, the origin of catch and TAC data requires explanation. While DFO provided the author with official catchdata for the 2012-2013 fishing year, the author uses publically available quota report data for catches and TACsthroughout this report (see Appendix A). While the quota report data may, in some cases, vary from datapresented in stock assessments, and may not be the "best" data source (A. Sinclair, pers. comm.), the authorchose to use quota reports as a primary data source because they offer:
- Consistency across species (i.e., quota reports offer data for species without stock assessments as well asthose with stock assessments)
- Area-specific catch and TAC data- Multiple years of data, rather than data for just one year
Summary of findings for Criterion 1
Of the 68 stock/fishery combinations assessed under Criterion 1, 23 have a Criterion 1 rating of green, 14 havea rating of yellow, and 31 have a red rating. Up-to-date and reliable information is essential for a green rating.
38

For many of the stocks with yellow and red ratings, the primary issue is one of data availability: many stockshave never been assessed, or have out-of-date assessments and, as such, have received conservative ratingsfor Criterion 1.
Criterion 1 Assessment
SCORING GUIDELINES
Factor 1.1 - Inherent Vulnerability
Low—The FishBase vulnerability score for species is 0-35, OR species exhibits life history characteristics thatmake it resilient to fishing, (e.g., early maturing).Medium—The FishBase vulnerability score for species is 36-55, OR species exhibits life historycharacteristics that make it neither particularly vulnerable nor resilient to fishing, (e.g., moderate age atsexual maturity (5-15 years), moderate maximum age (10-25 years), moderate maximum size, and middleof food chain).High—The FishBase vulnerability score for species is 56-100, OR species exhibits life history characteristicsthat make is particularly vulnerable to fishing, (e.g., long-lived (>25 years), late maturing (>15 years), lowreproduction rate, large body size, and top-predator). Note: The FishBase vulnerability scores is an index ofthe inherent vulnerability of marine fishes to fishing based on life history parameters: maximum length, ageat first maturity, longevity, growth rate, natural mortality rate, fecundity, spatial behaviors (e.g., schooling,aggregating for breeding, or consistently returning to the same sites for feeding or reproduction) andgeographic range.
Factor 1.2 - Abundance
5 (Very Low Concern)—Strong evidence exists that the population is above target abundance level (e.g.,biomass at maximum sustainable yield, BMSY) or near virgin biomass.4 (Low Concern)—Population may be below target abundance level, but it is considered not overfished3 (Moderate Concern) —Abundance level is unknown and the species has a low or medium inherentvulnerability to fishing.2 (High Concern)—Population is overfished, depleted, or a species of concern, OR abundance is unknownand the species has a high inherent vulnerability to fishing.1 (Very High Concern)—Population is listed as threatened or endangered.
Factor 1.3 - Fishing Mortality
5 (Very Low Concern)—Highly likely that fishing mortality is below a sustainable level (e.g., below fishingmortality at maximum sustainable yield, FMSY), OR fishery does not target species and its contribution to themortality of species is negligible (≤ 5% of a sustainable level of fishing mortality).3.67 (Low Concern)—Probable (>50%) chance that fishing mortality is at or below a sustainable level, butsome uncertainty exists, OR fishery does not target species and does not adversely affect species, but itscontribution to mortality is not negligible, OR fishing mortality is unknown, but the population is healthy andthe species has a low susceptibility to the fishery (low chance of being caught).2.33 (Moderate Concern)—Fishing mortality is fluctuating around sustainable levels, OR fishing mortality isunknown and species has a moderate-high susceptibility to the fishery and, if species is depleted,reasonable management is in place.1 (High Concern)—Overfishing is occurring, but management is in place to curtail overfishing, OR fishingmortality is unknown, species is depleted, and no management is in place.0 (Critical)—Overfishing is known to be occurring and no reasonable management is in place to curtailoverfishing.
39

ARROWTOOTH FLOUNDER
Factor 1.1 - Inherent Vulnerability
Factor 1.2 - Abundance
Factor 1.3 - Fishing Mortality
BRITISH COLUMBIA/NORTHEAST PACIFIC, BOTTOM TRAWLS, CANADA, HARD SUBSTRATEBRITISH COLUMBIA/NORTHEAST PACIFIC, MIDWATER TRAWLS, CANADA
Medium
The FishBase vulnerability score for arrowtooth flounder is 64, but the species’ productivity rating is 1.95(Table 1 in (Cope et al. 2011). Arrowtooth flounder inherent resilience is therefore scored "medium".
BRITISH COLUMBIA/NORTHEAST PACIFIC, BOTTOM TRAWLS, CANADA, HARD SUBSTRATEBRITISH COLUMBIA/NORTHEAST PACIFIC, MIDWATER TRAWLS, CANADA
Very Low Concern
In a draft assessment, arrowtooth flounder biomass was recently estimated to be well above an estimate ofSBMSY and to be approximately 60% of SB0 (CSAS 2015a). The stock status of arrowtooth flounder in WCVI,QCS, HS, and WCHG is therefore scored “very low” concern.
Justification:
A recent stock assessment assessed the status of the arrowtooth flounder stock for the entire coast of B.C.,with the exception of the area between Vancouver Island and the mainland (CSAS 2015a). The assessmentgenerated a median estimate of SB2015 (296,271 t; 2.5-97.5 percentiles = 146,337-760,905 t) that wasapproximately 2.5 times greater than estimated SBMSY (117,828 t; 2.5-97.5% = 56,340-302,674 t) and thatwas approximately 60% of estimated SB0 (495,407 t, 2.5-97.5% = 244,064-1,257,780 t) (Table 2 inCSAS 2015a).
BRITISH COLUMBIA/NORTHEAST PACIFIC, BOTTOM TRAWLS, CANADA, HARD SUBSTRATEBRITISH COLUMBIA/NORTHEAST PACIFIC, MIDWATER TRAWLS, CANADA
Very Low Concern
The trawl fishery is allocated 100% of the arrowtooth flounder TAC (DFO 2013a). For 2014, estimated fishingmortality is below an estimate of FMSY. Furthermore, age composition data suggest that female arrowtoothflounder spawn for several years before becoming susceptible to the fishery. The fishing mortality ofarrowtooth flounder is scored “very low” concern.
Justification:
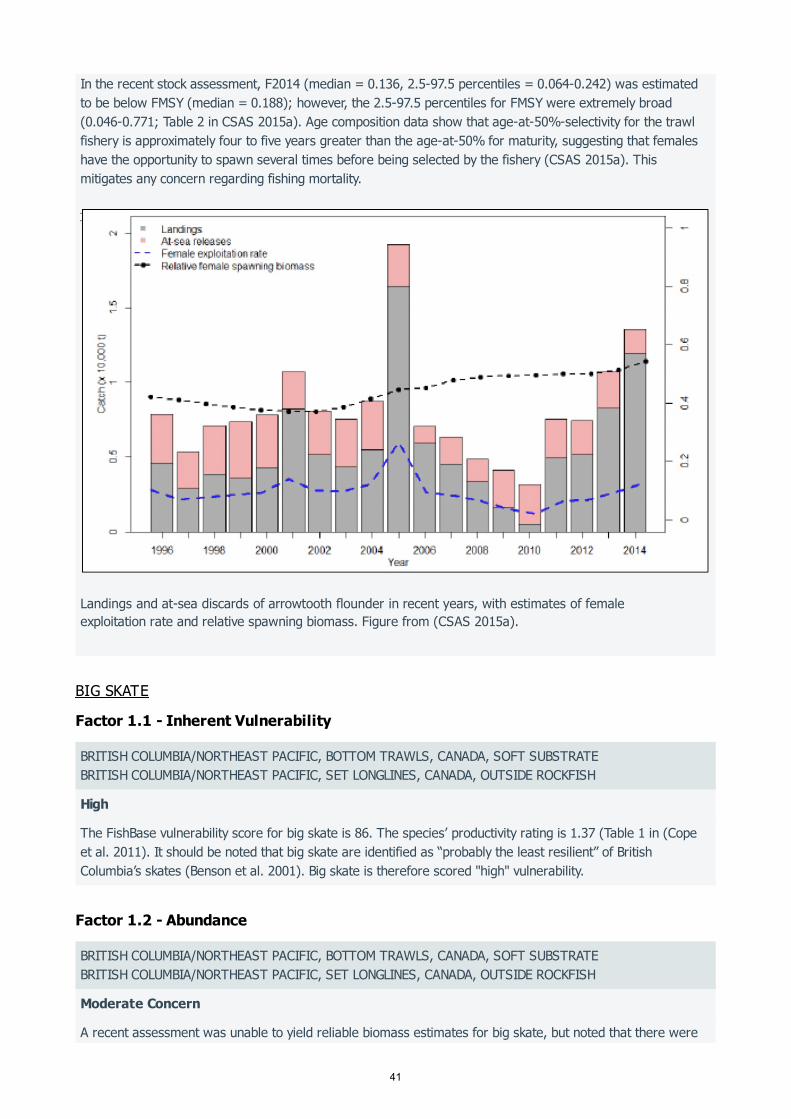
Until recently, arrowtooth flounder was discarded in substantial quantities, as its marketability wascompromised by the fact that its flesh can degrade rapidly after being caught (CSAS 2015a). However, amarket has developed in the past five years, and arrowtooth flounder landings have increased (Figure 3; notethat there are no reliable data for arrowtooth catch prior to the onset of at-sea observer coverage in1996) (CSAS 2015a). For 2014, the total catch of arrowtooth flounder was 13,570 t (Table 1 in Grandin &Forrest 2015), while the TAC was 15,000 t (Grandin & Forrest 2015).
40
BIG SKATE
Factor 1.1 - Inherent Vulnerability
Factor 1.2 - Abundance
In the recent stock assessment, F2014 (median = 0.136, 2.5-97.5 percentiles = 0.064-0.242) was estimatedto be below FMSY (median = 0.188); however, the 2.5-97.5 percentiles for FMSY were extremely broad(0.046-0.771; Table 2 in CSAS 2015a). Age composition data show that age-at-50%-selectivity for the trawlfishery is approximately four to five years greater than the age-at-50% for maturity, suggesting that femaleshave the opportunity to spawn several times before being selected by the fishery (CSAS 2015a). Thismitigates any concern regarding fishing mortality.
Landings and at-sea discards of arrowtooth flounder in recent years, with estimates of female exploitation rate and relative spawning biomass. Figure from (CSAS 2015a).
BRITISH COLUMBIA/NORTHEAST PACIFIC, BOTTOM TRAWLS, CANADA, SOFT SUBSTRATEBRITISH COLUMBIA/NORTHEAST PACIFIC, SET LONGLINES, CANADA, OUTSIDE ROCKFISH
High
The FishBase vulnerability score for big skate is 86. The species’ productivity rating is 1.37 (Table 1 in (Copeet al. 2011). It should be noted that big skate are identified as “probably the least resilient” of BritishColumbia’s skates (Benson et al. 2001). Big skate is therefore scored "high" vulnerability.
BRITISH COLUMBIA/NORTHEAST PACIFIC, BOTTOM TRAWLS, CANADA, SOFT SUBSTRATEBRITISH COLUMBIA/NORTHEAST PACIFIC, SET LONGLINES, CANADA, OUTSIDE ROCKFISH
Moderate Concern
A recent assessment was unable to yield reliable biomass estimates for big skate, but noted that there were
41

Factor 1.3 - Fishing Mortality
CANARY ROCKFISH
Factor 1.1 - Inherent Vulnerability
Factor 1.2 - Abundance
no significant trends in survey abundance indices (CSAS 2014a). The stock’s status is thereforescored "moderate" concern.
BRITISH COLUMBIA/NORTHEAST PACIFIC, BOTTOM TRAWLS, CANADA, SOFT SUBSTRATEBRITISH COLUMBIA/NORTHEAST PACIFIC, SET LONGLINES, CANADA, OUTSIDE ROCKFISH
Low Concern
The 2012 catch of Area 5C/D big skate in the trawl fishery was 321.7 t, while the Area 5C/D big skate trawlTAC was 724.9 t (Appendix A). The halibut fishery was also responsible for approximately 7% of big skatecatch in groundfish fisheries in 2012 (DFO Pacific Region 2013). Recent catches of big skate have been within,or less than, ranges of MSY estimated from historical catch (Table 1 in (CSAS 2014a)). While the recentassessment suggests that overfishing is not occurring, it does not provide a reliable estimate of sustainablemortality. Fishing mortality of big skate is therefore scored "low" concern.
BRITISH COLUMBIA/NORTHEAST PACIFIC, BOTTOM TRAWLS, CANADA, HARD SUBSTRATEBRITISH COLUMBIA/NORTHEAST PACIFIC, MIDWATER TRAWLS, CANADA
High
The Fishbase vulnerability score for canary rockfish is 62. The species’ productivity rating in Cope et al. 2011is 1.28 (Table 1 in (Cope et al. 2011)). Canary rockfish therefore have "high" inherent vulnerability.
BRITISH COLUMBIA/NORTHEAST PACIFIC, BOTTOM TRAWLS, CANADA, HARD SUBSTRATEBRITISH COLUMBIA/NORTHEAST PACIFIC, MIDWATER TRAWLS, CANADA
Low Concern
After declining for at least six decades, canary rockfish biomass apparently began to rebuild in 2004. Whilecanary rockfish were listed as "Threatened" by COSEWIC in 2007, a more recent estimate of B fell withinDFO’s “Healthy Zone”. The COSEWIC status would usually confer a Factor 1.2 score of "very high" concern,but the information presented in the recent stock assessment moderates concern. The stock status of canaryrockfish is therefore scored "low" concern.
2010
Justification:
Canary rockfish were listed as “Threatened” by COSEWIC in 2007 (Appendix D; (COSEWIC 2007a)), butwere declined for listing under SARA (Canada Gazette 2011).
Prior to 2004, canary rockfish biomass had been declining for many decades. The decline started in the 1940sand continued through 2004, with only two brief periods of minor increases during that period (Figure 12 in(DFO 2009c)). By 2004, the stock’s spawning biomass was estimated to be approximately 20% of B (DFO2009c). Since 2004, the stock’s spawning biomass is estimated to have increased in each year, such that thespawning biomass at the time of the last stock assessment was estimated to be 31% of B (DFO 2009c). While the post-2004 period of rebuilding is brief when compared to the lengthy decline, it appears to
0
0
42
Factor 1.3 - Fishing Mortality
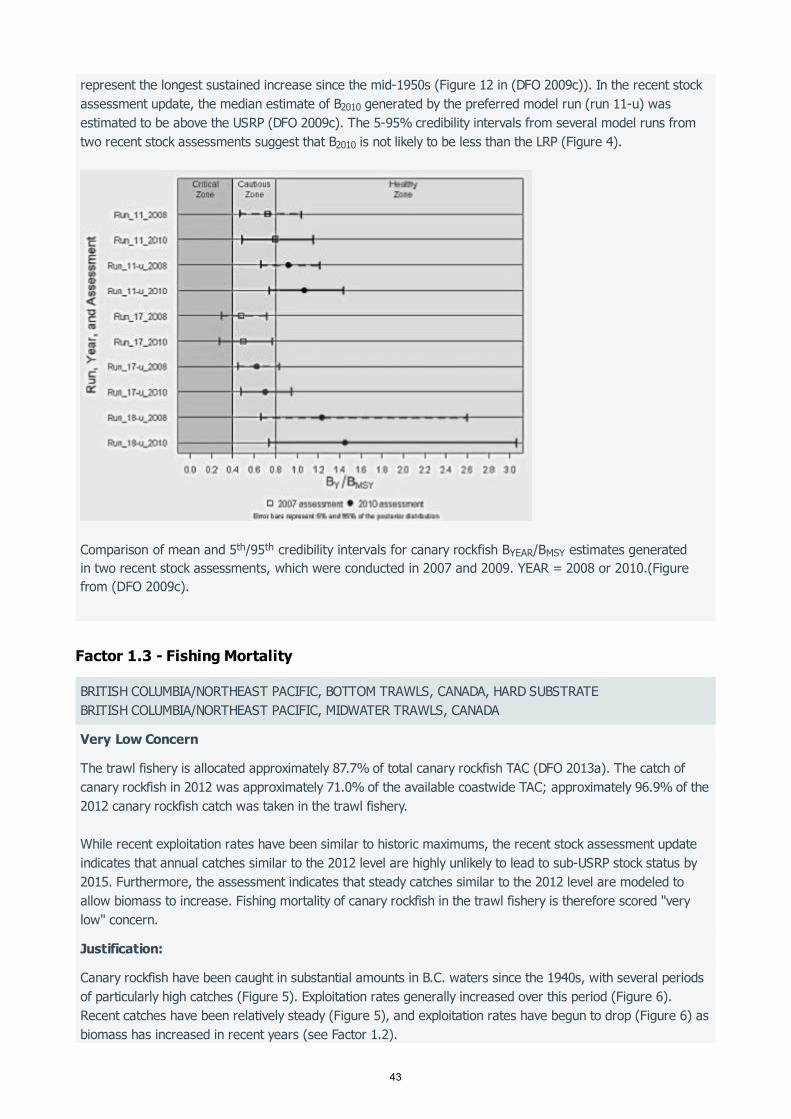
represent the longest sustained increase since the mid-1950s (Figure 12 in (DFO 2009c)). In the recent stockassessment update, the median estimate of B generated by the preferred model run (run 11-u) wasestimated to be above the USRP (DFO 2009c). The 5-95% credibility intervals from several model runs fromtwo recent stock assessments suggest that B is not likely to be less than the LRP (Figure 4).
Comparison of mean and 5th/95th credibility intervals for canary rockfish BYEAR/BMSY estimates generated in two recent stock assessments, which were conducted in 2007 and 2009. YEAR = 2008 or 2010.(Figure from (DFO 2009c).
2010
2010
BRITISH COLUMBIA/NORTHEAST PACIFIC, BOTTOM TRAWLS, CANADA, HARD SUBSTRATEBRITISH COLUMBIA/NORTHEAST PACIFIC, MIDWATER TRAWLS, CANADA
Very Low Concern
The trawl fishery is allocated approximately 87.7% of total canary rockfish TAC (DFO 2013a). The catch ofcanary rockfish in 2012 was approximately 71.0% of the available coastwide TAC; approximately 96.9% of the2012 canary rockfish catch was taken in the trawl fishery.
While recent exploitation rates have been similar to historic maximums, the recent stock assessment updateindicates that annual catches similar to the 2012 level are highly unlikely to lead to sub-USRP stock status by2015. Furthermore, the assessment indicates that steady catches similar to the 2012 level are modeled toallow biomass to increase. Fishing mortality of canary rockfish in the trawl fishery is therefore scored "verylow" concern.
Justification:
Canary rockfish have been caught in substantial amounts in B.C. waters since the 1940s, with several periodsof particularly high catches (Figure 5). Exploitation rates generally increased over this period (Figure 6).Recent catches have been relatively steady (Figure 5), and exploitation rates have begun to drop (Figure 6) asbiomass has increased in recent years (see Factor 1.2).
43

Estimated historical catch of canary rockfish in B.C. waters, with average 1945-2009 catch indicated by dashed line. Catch by hook and line is indicated by solid black area, the remainder is trawl catch. Recent TACs are indicated by the dotted line. (Figure from (DFO 2009b).
Modeled exploitation rates from the reference run (Run 11-u) in the recent stock assessment update for canary rockfish. (Figure from (DFO 2009b).
The 2012 coastwide catch of canary rockfish was 761.9 t, while the total TAC was 1,072.5 t (Appendix A). Thetrawl fishery, which is allocated approximately 87.7% of total canary rockfish TAC (DFO 2013a), accounted for738.4 t of the 2012 total catch (Appendix A). The preferred model run from the recent stock assessmentupdate (run 11-u) estimates that annual catches of 800 t are associated with probabilities of 1.0 and 0.98 thatSB will exceed the LRP and USRP, respectively (Table 14 in (DFO 2009c)). The preferred model run alsoestimates that spawning biomass will increase over a multi-decade timeframe if annual catches are heldconstant at 800 t/year (Table 18 in (DFO 2009c)).
2015
44
CHINA ROCKFISH
Factor 1.1 - Inherent Vulnerability
Factor 1.2 - Abundance
Factor 1.3 - Fishing Mortality
The lingcod and dogfish fisheries slightly exceeded their 2012 Area 5C/5D TACs for canary rockfish; no otherarea-specific TACs were exceeded in 2012 (DFO 2013c).
BRITISH COLUMBIA/NORTHEAST PACIFIC, JIG, CANADA, OUTSIDE ROCKFISHBRITISH COLUMBIA/NORTHEAST PACIFIC, SET LONGLINES, CANADA, OUTSIDE ROCKFISHBRITISH COLUMBIA/NORTHEAST PACIFIC, TROLLING LINES, CANADA, OUTSIDE ROCKFISH
High
The Fishbase vulnerability scores for china rockfish is 56. The species’ productivity rating in Table 1 of (Copeet al. 2011) is 1.33, which likewise indicates “high" inherent vulnerability.
BRITISH COLUMBIA/NORTHEAST PACIFIC, JIG, CANADA, OUTSIDE ROCKFISHBRITISH COLUMBIA/NORTHEAST PACIFIC, SET LONGLINES, CANADA, OUTSIDE ROCKFISHBRITISH COLUMBIA/NORTHEAST PACIFIC, TROLLING LINES, CANADA, OUTSIDE ROCKFISH
High Concern
There is no up-to-date stock assessment for china rockfish. In light of this species' high inherentvulnerability, stock status is scored "high" concern.
BRITISH COLUMBIA/NORTHEAST PACIFIC, JIG, CANADA, OUTSIDE ROCKFISHBRITISH COLUMBIA/NORTHEAST PACIFIC, SET LONGLINES, CANADA, OUTSIDE ROCKFISHBRITISH COLUMBIA/NORTHEAST PACIFIC, TROLLING LINES, CANADA, OUTSIDE ROCKFISH
Moderate Concern
There are no estimates of sustainable mortality for China, copper, or tiger rockfish. However, theestablishment of Rockfish Conservation Areas (RCAs) has set aside substantial amounts of habitat for thesespecies. Fishing mortality is scored “moderate” concern for the china, copper, and tiger rockfish in the halibutand outside rockfish fisheries, and for tiger rockfish catch in the inside rockfish fishery.
Justification:
Note: Quillback, copper, china, and tiger (QCCT) rockfish are managed with one TAC. Mortality of QCCTrockfish is discussed here as one unit, but quillback mortality is addressed in more specific terms in thedetailed rationale for that species. The following information informs fishing mortality scores for copper, china,and tiger rockfish.
In 2012, the total catch of QCCT rockfish was 183.8 t, while the total TAC was 257.2 t (Appendix A). Linefisheries dominated the catch of QCCT species; the trawl fishery was responsible for relatively little QCCTcatch (Figure 52). The halibut and outside rockfish fisheries were the primary fisheries for all four QCCTspecies in 2012, and the inside rockfish fishery was responsible for substantial proportions of quillback andtiger rockfish catches (Figure 7).
The 2012 catch can be broken down by catch taken from inside (Area 4B) and outside (remaining areas)
45

COPPER ROCKFISH
Factor 1.1 - Inherent Vulnerability
Factor 1.2 - Abundance
waters. The inside rockfish fishery accounted for 96.3% of the 2012 QCCT rockfish catch in inside waters, butzero percent of the outside catch (DFO 2013d). Conversely, catch of QCCT rockfish in outside waters wasdominated by the outside rockfish fishery (69.5% of outside QCCT catch) and the halibut fishery (25.8%) (DFO2013d).
Area-specific TACs have been exceeded by some fisheries during recent years. In particular, the halibut fisheryexceeded its inside (Area 4B) TAC each year from 2009-2012, and the dogfish fishery exceeded numerousarea-specific TACs during this same period (DFO 2013d). In 2012, the lingcod fishery slightly exceeded itsArea 5B TAC (DFO 2013d).
Total catch of QCCT rockfish in 2012 groundfish fisheries (DFO Pacific Region 2013).
BRITISH COLUMBIA/NORTHEAST PACIFIC, JIG, CANADA, OUTSIDE ROCKFISHBRITISH COLUMBIA/NORTHEAST PACIFIC, SET LONGLINES, CANADA, OUTSIDE ROCKFISHBRITISH COLUMBIA/NORTHEAST PACIFIC, TROLLING LINES, CANADA, OUTSIDE ROCKFISH
High
The Fishbase vulnerability score for copper rockfish is 58. The species’ productivity rating in Table 1 of (Copeet al. 2011) is 1.36, which likewise indicates “high" inherent vulnerability.
BRITISH COLUMBIA/NORTHEAST PACIFIC, JIG, CANADA, OUTSIDE ROCKFISHBRITISH COLUMBIA/NORTHEAST PACIFIC, SET LONGLINES, CANADA, OUTSIDE ROCKFISHBRITISH COLUMBIA/NORTHEAST PACIFIC, TROLLING LINES, CANADA, OUTSIDE ROCKFISH
High Concern
There is no up-to-date stock assessment for copper rockfish. In light of this species' high inherentvulnerability, stock status is scored "high" concern.
46

Factor 1.3 - Fishing Mortality
BRITISH COLUMBIA/NORTHEAST PACIFIC, JIG, CANADA, OUTSIDE ROCKFISHBRITISH COLUMBIA/NORTHEAST PACIFIC, SET LONGLINES, CANADA, OUTSIDE ROCKFISHBRITISH COLUMBIA/NORTHEAST PACIFIC, TROLLING LINES, CANADA, OUTSIDE ROCKFISH
Moderate Concern
There are no estimates of sustainable mortality for China, copper, or tiger rockfish. However, theestablishment of Rockfish Conservation Areas (RCAs) has set aside substantial amounts of habitat for thesespecies. Fishing mortality is scored “moderate” concern for the china, copper, and tiger rockfish in the halibutand outside rockfish fisheries, and for tiger rockfish catch in the inside rockfish fishery.
Justification:
Note: Quillback, copper, china, and tiger (QCCT) rockfish are managed with one TAC. Mortality of QCCTrockfish is discussed here as one unit, but quillback mortality is addressed in more specific terms in thedetailed rationale for that species. The following information informs fishing mortality scores for copper, china,and tiger rockfish.
In 2012, the total catch of QCCT rockfish was 183.8 t, while the total TAC was 257.2 t (Appendix A). Linefisheries dominated the catch of QCCT species; the trawl fishery was responsible for relatively little QCCTcatch (Figure 52). The halibut and outside rockfish fisheries were the primary fisheries for all four QCCTspecies in 2012, and the inside rockfish fishery was responsible for substantial proportions of quillback andtiger rockfish catches (Figure 7).
The 2012 catch can be broken down by catch taken from inside (Area 4B) and outside (remaining areas)waters. The inside rockfish fishery accounted for 96.3% of the 2012 QCCT rockfish catch in inside waters, butzero percent of the outside catch (DFO 2013d). Conversely, catch of QCCT rockfish in outside waters wasdominated by the outside rockfish fishery (69.5% of outside QCCT catch) and the halibut fishery (25.8%) (DFO2013d).
Area-specific TACs have been exceeded by some fisheries during recent years. In particular, the halibut fisheryexceeded its inside (Area 4B) TAC each year from 2009-2012, and the dogfish fishery exceeded numerousarea-specific TACs during this same period (DFO 2013d). In 2012, the lingcod fishery slightly exceeded itsArea 5B TAC (DFO 2013d).
Total catch of QCCT rockfish in 2012 groundfish fisheries (DFO Pacific Region 2013).
47

DARKBLOTCHED ROCKFISH
Factor 1.1 - Inherent Vulnerability
Factor 1.2 - Abundance
Factor 1.3 - Fishing Mortality
BRITISH COLUMBIA/NORTHEAST PACIFIC, BOTTOM TRAWLS, CANADA, HARD SUBSTRATEBRITISH COLUMBIA/NORTHEAST PACIFIC, MIDWATER TRAWLS, CANADA
High
The Fishbase vulnerability score for darkblotched rockfish is 69. The species’ productivity rating in Table 1of (Cope et al. 2011) is 1.39 (Table 1 in Cope et al. 2011), which confirms the species’ "high" vulnerability.
BRITISH COLUMBIA/NORTHEAST PACIFIC, BOTTOM TRAWLS, CANADA, HARD SUBSTRATEBRITISH COLUMBIA/NORTHEAST PACIFIC, MIDWATER TRAWLS, CANADA
High Concern
There is no stock assessment for darkblotched rockfish, and the stock is listed as “special concern” byCOSEWIC. Trawl survey biomass indices are characterized by high relative error, and are not used by thisassessment. Due to the COSEWIC status, the lack of information regarding stock status, and the "high"inherent vulnerability of the species (see Factor 1.1), darkblotched rockfish are scored "high" concern forFactor 1.2.
Justification:
Darkblotched rockfish are listed as “special concern” by COSEWIC (Appendix D) (COSEWIC 2009). While asummary of available information is available (Haigh & Starr 2008), there is no assessment of the status ofthe stock. Reliable interpretation of darkblotched rockfish trawl survey biomass index estimates is complicatedby the estimates’ high relative error (generally >0.40) (DFO 2013b), and therefore the trawl survey biomassindices are not used in this assessment.
BRITISH COLUMBIA/NORTHEAST PACIFIC, BOTTOM TRAWLS, CANADA, HARD SUBSTRATEBRITISH COLUMBIA/NORTHEAST PACIFIC, MIDWATER TRAWLS, CANADA
Moderate Concern
In 2012, the total catch of darkblotched rockfish was 65.47 t; 98.7% of this catch was taken in the trawlfishery (DFO Pacific Region 2013). The 2012 catch is roughly similar to catches in recent years (Figure 9).There is no TAC for darkblotched rockfish, and there is no information regarding the appropriateness ofcurrent levels of fishing mortality. Fishing mortality of darkblotched rockfish in the trawl fishery is thereforescored "moderate" concern.
Justification:
48
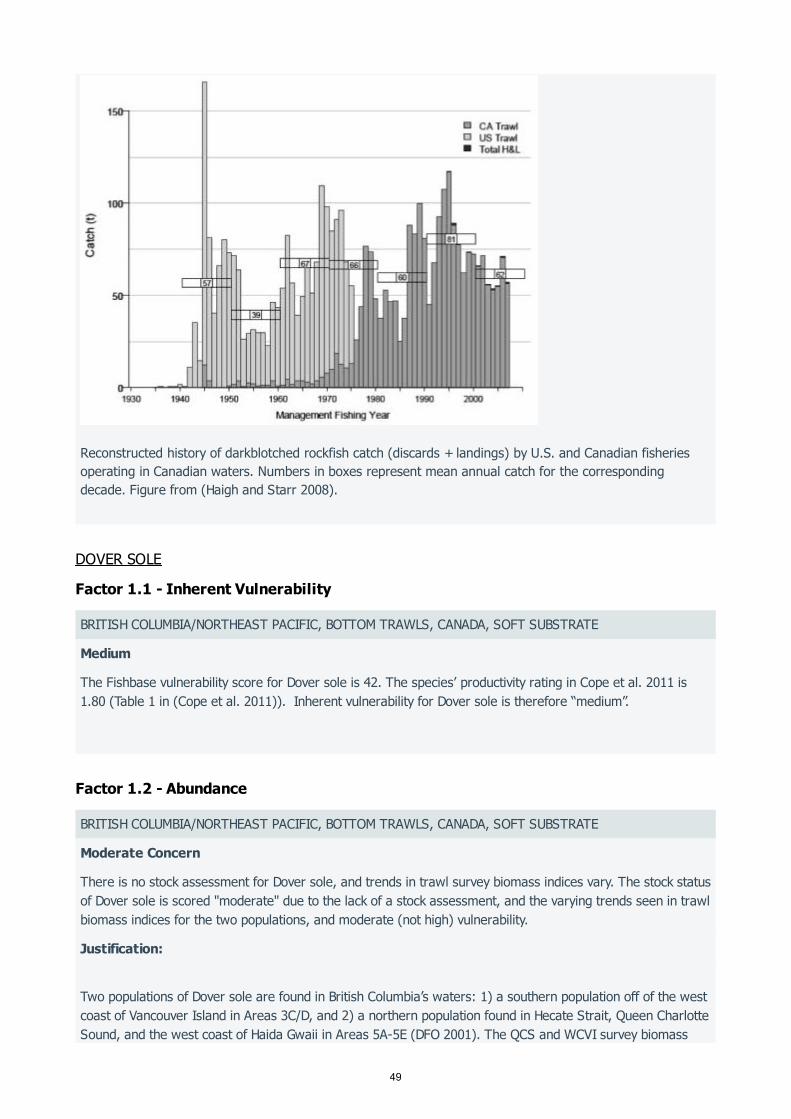
DOVER SOLE
Factor 1.1 - Inherent Vulnerability
Factor 1.2 - Abundance
Reconstructed history of darkblotched rockfish catch (discards + landings) by U.S. and Canadian fisheries operating in Canadian waters. Numbers in boxes represent mean annual catch for the corresponding decade. Figure from (Haigh and Starr 2008).
BRITISH COLUMBIA/NORTHEAST PACIFIC, BOTTOM TRAWLS, CANADA, SOFT SUBSTRATE
Medium
The Fishbase vulnerability score for Dover sole is 42. The species’ productivity rating in Cope et al. 2011 is1.80 (Table 1 in (Cope et al. 2011)). Inherent vulnerability for Dover sole is therefore “medium”.
BRITISH COLUMBIA/NORTHEAST PACIFIC, BOTTOM TRAWLS, CANADA, SOFT SUBSTRATE
Moderate Concern
There is no stock assessment for Dover sole, and trends in trawl survey biomass indices vary. The stock statusof Dover sole is scored "moderate" due to the lack of a stock assessment, and the varying trends seen in trawlbiomass indices for the two populations, and moderate (not high) vulnerability.
Justification:
Two populations of Dover sole are found in British Columbia’s waters: 1) a southern population off of the westcoast of Vancouver Island in Areas 3C/D, and 2) a northern population found in Hecate Strait, Queen CharlotteSound, and the west coast of Haida Gwaii in Areas 5A-5E (DFO 2001). The QCS and WCVI survey biomass
49

Factor 1.3 - Fishing Mortality
indices show declining trends, and the index for HS shows an increasing trend (Figure 10).
Trawl survey biomass indices for Dover sole. Data from (DFO 2013b).
BRITISH COLUMBIA/NORTHEAST PACIFIC, BOTTOM TRAWLS, CANADA, SOFT SUBSTRATE
Moderate Concern
The trawl fishery is allocated 100% of the dover sole TAC (DFO 2013a). In 2012, the trawl fishery’s catches ofDover sole in Areas 3C/D and Areas 5A-E were approximately 71.8% and 53.3% of the Areas 3C/D and 5A-ETACs, respectively. The 2012 catches (landings + discards) in Areas 3C/D and 5C-E were broadly similar tohistorical landings levels; this comparison, while not perfect, is conservative in that it compares recent catches(including discards) to historical landings (which exclude discards). The lack of a stock assessment precludesa more detailed analysis of fishing mortality, and therefore, fishing mortality of Dover sole is scored"moderate" concern for the trawl fishery.
Justification:
Trawl catch did not exceed any area-specific TACs during any years of the 2000-2012 period (DFO 2013c).The trawl fishery’s catches of Dover sole in Areas 3C/D and 5A-E generally declined from 2002 through 2009despite increasing TACs; catches have somewhat increased in recent years (Figure 11).
In 2012, the trawl catch in Areas 3C/D (1,236 t) was approximately 71.8% of the Areas 3C/D TAC (1,722 t;Appendix C). In Areas 5A-E, the 2012 catch (1,166 t) was approximately 53.3% of the TAC (2,186 t; AppendixC).
50

Dover sole catch and TACs in the trawl fishery, 2000-2012 (see Appendix C for data).
Due to the lack of a stock assessment, there are few references against which these catches may beassessed. One point of reference is historical landings: from 1970 to 1997, the average annual Dover solelandings were 863.9 t (± 279.4 t) in Areas 5C-E (Table 1.9 in (Fargo 1999)). For Areas 3C/D, the averageannual landings during the period 1988-1997 was 1,199 t (± 412.3 t; Table 1.4 in (Fargo 1999)) (the period1988-1997 is used for comparison as Areas 3C/D landings were minimal in the years immediately preceding1988; see Table 1.4 in (Fargo 1999)). It should be noted that these historical data represent only landings,whereas the more recent data represent total catch.
Another potential reference is advice on yield options that, while outdated, may provide an idea of maximumyields. Fargo (1999) presented yield options for Dover sole; the low-risk and high-risk yield options were 1,000and 1,500 t, respectively, for Areas 3C/D, and 800 and 1,200 t, respectively, t for Areas 5C-E (Fargo 1999).The author of those yield estimates suggested that both populations were likely to be fully exploited (Fargo1999). While these yield options are obviously not up-to-date, they represent the most recent yield estimatesthat are available to the public. Due to the lack of up-to-date stock status information (see Factor 1.2), itcannot be assumed that the stock can support higher yields than those presented by Fargo (1999).
While the aforementioned caveats prevent direct comparison of the 2012 catches with the references derivedfrom Fargo (1999), a general comparison suggests that the 2012 catches in Areas 3C/D and Areas 5C-E arebetween the 1999 low and high-risk yield estimates, and are broadly similar to historical catches and landings(Figure 12).
2012 Dover sole catch and various references. All units are tons. 2012 catch and 2000-2011 average catch: Appendix C; historical average landings and low/high risk yields: (Fargo 1999)
51
ENGLISH SOLE
Factor 1.1 - Inherent Vulnerability
Factor 1.2 - Abundance
BRITISH COLUMBIA/NORTHEAST PACIFIC, BOTTOM TRAWLS, CANADA, SOFT SUBSTRATE
Medium
The Fishbase vulnerability score for English sole is 43, and the species’ productivity rating in Cope et al.(2011) is 2.25 (Table 1 in (Cope et al. 2011)). English sole inherent vulnerability is therefore scored “medium”.
BRITISH COLUMBIA/NORTHEAST PACIFIC, BOTTOM TRAWLS, CANADA, SOFT SUBSTRATE
Low Concern
Information from the most recent stock assessment and recent trawl survey biomass indices suggests that thetwo English sole stocks may be increasing; however, the assessment’s age and methodological challengesreduce confidence in its current applicability. The stock status of English sole is scored "low" concern due tothe lack of a recent and reliable estimate of stock status, and the species' "medium" inherent vulnerability.
Justification:
There are two stocks of English sole found in British Columbia’s waters: one stock is found in Hecate Strait(Areas 5C/D), and the other is found in the waters off of the west coast of Vancouver Island and in QueenCharlotte Sound (Areas 3C/D and 5A/B) (Starr 2009a). The most recent assessment of the English sole stockswas conducted for the 2007/08 year (Starr 2009a).
In the most recent stock assessment, the recommended model’s estimates of HS female biomass showed astrong increase since approximately 2000 and resulted in an estimated 2005 biomass that exceeded any otherpoint on the figure; a slight decline was noted for years 2006 and 2007 (Figure D.34 in (Starr 2009a)). Thetrend for the WCVI/QCS female biomass was similar (Figure D.38 in (Starr 2009a)). It should be noted that adifferent model run, which differed only in its treatment of catch per unit effort (CPUE), produced results thatshowed biomass in those same years to have increased, but to have still been less than at several points inthe recent past (Figures D.31 and D.36, respectively, in (Starr 2009a)).
The survey biomass indices do not show strong trends, with a slightly increasing trend seen in HS, a slightdecline in WCVI, and essentially no change in QCS (Figure 13).
52

Factor 1.3 - Fishing Mortality
Trawl survey biomass indices for English sole. Data from (DFO 2013b).
BRITISH COLUMBIA/NORTHEAST PACIFIC, BOTTOM TRAWLS, CANADA, SOFT SUBSTRATE
Low Concern
The trawl fishery is allocated 100% of English sole TAC (DFO 2013a). Recent catches of English sole havebeen some of the lowest of the past several decades. Modeled probabilities presented in an assessment of the2006/2007 stock suggest that catches during the period 2007-2011 were more likely to have allowed the twostocks’ biomasses to increase rather than decrease by the end of that period. Fishing mortality of English soleis scored “low", as the age of the assessment precludes a higher score. However, this score should berevisited if catches begin to increase towards TACs, as TACs have been much higher than recent catches.
Justification:
Catches have generally declined since 2005 (Figure 13), and in recent years have been comparable to thelowest catches recorded during the 1980s and 1990s (compare to Table B.1 in (Starr 2009a)). During theperiod 2000-2012, no area-specific trawl TACs were exceeded (Figure 14; Appendix A).
In 2012, the trawl fishery’s English sole catches were 86.7 t in Areas 3C/D and 5A/B, and 431.5 t in Areas 5C-E (Appendix A). The TACs for these areas were 231.5 t for Areas 3C/D and 5A/B, and 796.3 t for Areas 5C-E(Appendix A).
53

English sole catch and TACs in the trawl fishery, 2000-2012 (see Appendix C for data).
The author of the most recent stock assessment modeled the probabilities of various 2007-2011 catch levelsresulting in a B that exceeded various references (Starr 2009a). The mean annual catch during the period2007-2011 was 79.9 t in Areas 3C/D and 5A/B, and 432.5 t in Areas 5C-E (Appendix C). The approximatemodeled probabilities associated with similar catch levels are shown in Figure 15. (Note that the probabilitiesare shown for Areas 5C/D, while the average 2007-2011 catch is for Areas 5C-E. However, the annualcontribution of catches from Area 5E to the total Areas 5C-E catch has been <1 t since 2000, as shown inTable B.1. in (Starr 2009a).
Modeled probabilities of B2012 exceeding various reference points after application of the catches similar to the 2007-2011 mean annual catch. Modeled catch amounts and probabilities from Tables D.9 and D.11 in (Starr 2009a). For this table, BMIN = the minimum biomass over the 1966-2006 period, and BREF = mean biomass during the period 1978-1988 for Areas 5C/D and 1974-1986 Areas 3C/D and 5A/B.
While the modeled probabilities presented in Table 2 indicate that the mean catches of the 2007-2011 periodlikely allowed the two stocks to increase relative to 2007 levels and were not likely to cause either stock todecline below historical reference points, it should be noted that the same cannot be said for the two stocks’mean 2007-2011 TACs. Modeled probabilities (Figure 16) suggest that catches equal to the 2007-2011 TACsfor the two stocks would have had substantially lower probabilities of resulting in B values that exceededthose of B or the modeled reference points.
2012
2012
2007
54
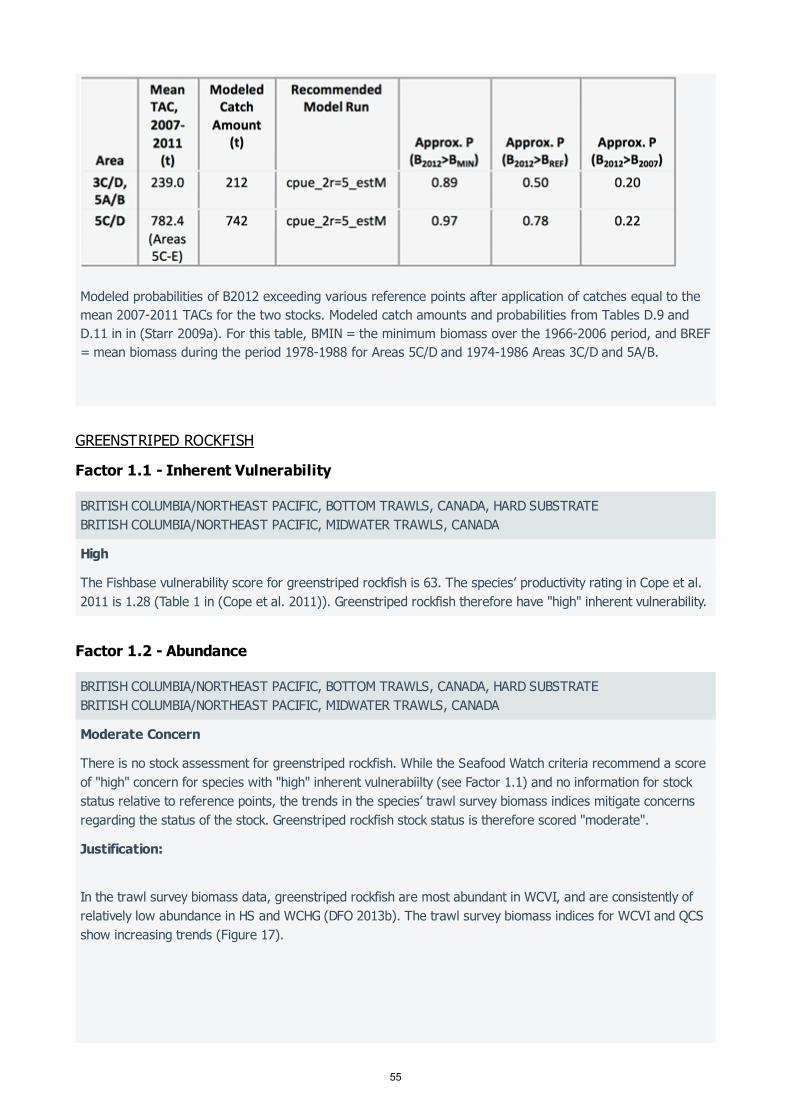
GREENSTRIPED ROCKFISH
Factor 1.1 - Inherent Vulnerability
Factor 1.2 - Abundance
Modeled probabilities of B2012 exceeding various reference points after application of catches equal to the mean 2007-2011 TACs for the two stocks. Modeled catch amounts and probabilities from Tables D.9 and D.11 in in (Starr 2009a). For this table, BMIN = the minimum biomass over the 1966-2006 period, and BREF = mean biomass during the period 1978-1988 for Areas 5C/D and 1974-1986 Areas 3C/D and 5A/B.
BRITISH COLUMBIA/NORTHEAST PACIFIC, BOTTOM TRAWLS, CANADA, HARD SUBSTRATEBRITISH COLUMBIA/NORTHEAST PACIFIC, MIDWATER TRAWLS, CANADA
High
The Fishbase vulnerability score for greenstriped rockfish is 63. The species’ productivity rating in Cope et al.2011 is 1.28 (Table 1 in (Cope et al. 2011)). Greenstriped rockfish therefore have "high" inherent vulnerability.
BRITISH COLUMBIA/NORTHEAST PACIFIC, BOTTOM TRAWLS, CANADA, HARD SUBSTRATEBRITISH COLUMBIA/NORTHEAST PACIFIC, MIDWATER TRAWLS, CANADA
Moderate Concern
There is no stock assessment for greenstriped rockfish. While the Seafood Watch criteria recommend a scoreof "high" concern for species with "high" inherent vulnerabiilty (see Factor 1.1) and no information for stockstatus relative to reference points, the trends in the species’ trawl survey biomass indices mitigate concernsregarding the status of the stock. Greenstriped rockfish stock status is therefore scored "moderate".
Justification:
In the trawl survey biomass data, greenstriped rockfish are most abundant in WCVI, and are consistently ofrelatively low abundance in HS and WCHG (DFO 2013b). The trawl survey biomass indices for WCVI and QCSshow increasing trends (Figure 17).
55
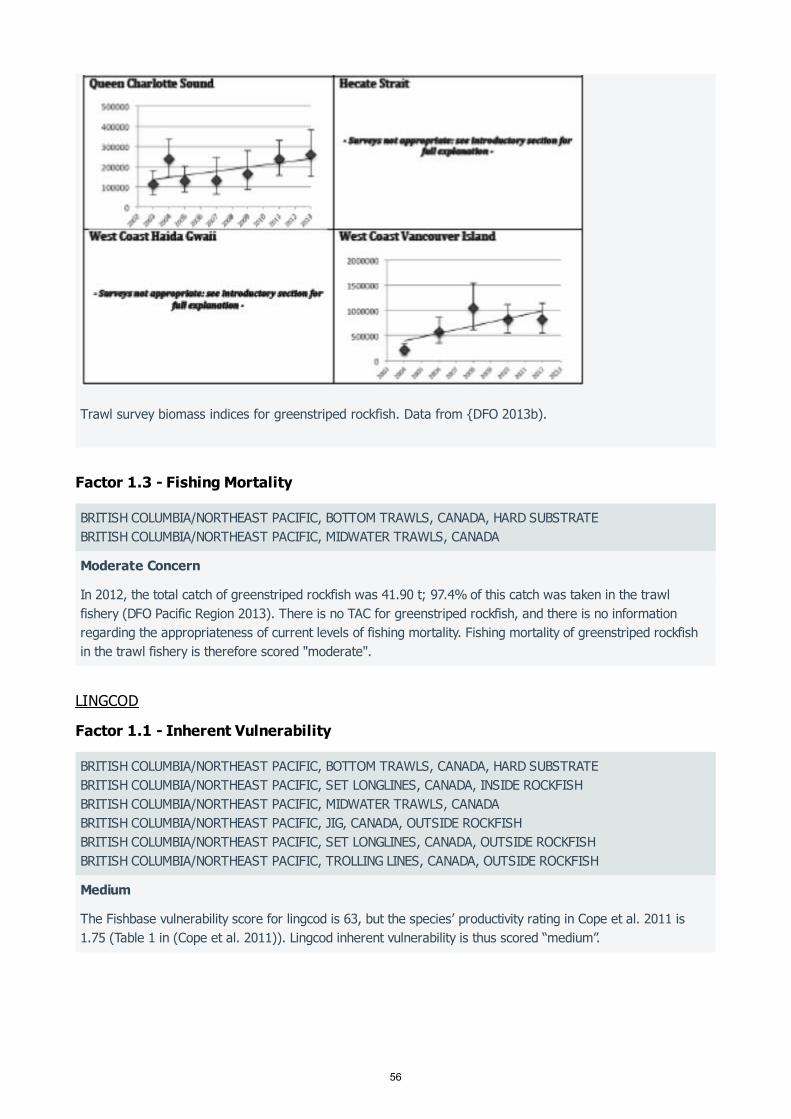
Factor 1.3 - Fishing Mortality
LINGCOD
Factor 1.1 - Inherent Vulnerability
Trawl survey biomass indices for greenstriped rockfish. Data from {DFO 2013b).
BRITISH COLUMBIA/NORTHEAST PACIFIC, BOTTOM TRAWLS, CANADA, HARD SUBSTRATEBRITISH COLUMBIA/NORTHEAST PACIFIC, MIDWATER TRAWLS, CANADA
Moderate Concern
In 2012, the total catch of greenstriped rockfish was 41.90 t; 97.4% of this catch was taken in the trawlfishery (DFO Pacific Region 2013). There is no TAC for greenstriped rockfish, and there is no informationregarding the appropriateness of current levels of fishing mortality. Fishing mortality of greenstriped rockfishin the trawl fishery is therefore scored "moderate".
BRITISH COLUMBIA/NORTHEAST PACIFIC, BOTTOM TRAWLS, CANADA, HARD SUBSTRATEBRITISH COLUMBIA/NORTHEAST PACIFIC, SET LONGLINES, CANADA, INSIDE ROCKFISHBRITISH COLUMBIA/NORTHEAST PACIFIC, MIDWATER TRAWLS, CANADABRITISH COLUMBIA/NORTHEAST PACIFIC, JIG, CANADA, OUTSIDE ROCKFISHBRITISH COLUMBIA/NORTHEAST PACIFIC, SET LONGLINES, CANADA, OUTSIDE ROCKFISHBRITISH COLUMBIA/NORTHEAST PACIFIC, TROLLING LINES, CANADA, OUTSIDE ROCKFISH
Medium
The Fishbase vulnerability score for lingcod is 63, but the species’ productivity rating in Cope et al. 2011 is1.75 (Table 1 in (Cope et al. 2011)). Lingcod inherent vulnerability is thus scored “medium”.
56

BRITISH COLUMBIA/NORTHEAST PACIFIC, BOTTOM TRAWLS, CANADA, HARD SUBSTRATEBRITISH COLUMBIA/NORTHEAST PACIFIC, SET LONGLINES, CANADA, INSIDE ROCKFISHBRITISH COLUMBIA/NORTHEAST PACIFIC, MIDWATER TRAWLS, CANADABRITISH COLUMBIA/NORTHEAST PACIFIC, JIG, CANADA, OUTSIDE ROCKFISHBRITISH COLUMBIA/NORTHEAST PACIFIC, SET LONGLINES, CANADA, OUTSIDE ROCKFISHBRITISH COLUMBIA/NORTHEAST PACIFIC, TROLLING LINES, CANADA, OUTSIDE ROCKFISH
Low Concern
For lingcod in “outside” waters (Areas 3C, 3D, 5A/B, and 5C/D/E), biomass has generally declined over thecourse of several decades and has recently been assessed at the lowest values since the late 1920s. Despitethe long decline of lingcod biomass in outside waters, each area’s estimated B exceeded the USRP. However, there was substantial uncertainty regarding this result for Areas 3C and 5AB. The stock status oflingcod in outside waters is therefore scored "low" concern.
2010
Justification:
The four discrete lingcod stocks in ‘outside’ waters (Areas 3C, 3D, 5A/B, and 5C/D/E) were assessed in 2011(DFO 2011c)(CSAS 2011). For all of these stocks, estimated B was lower than in any year since 1927(Figure 18).
Estimates of median biomass for outside lingcod. Figure from (DFO 2011b).
Despite the long-term declining trend noted for each stock’s estimated lingcod biomass, each stock’s estimatedB was above the USRP (0.8*B ) and thus qualified as being within DFO’s ‘healthy zone’ (Table 1 in (DFO2011c); Figure 19). Due to greater uncertainty in the stock status for Areas 3C and 5A/B, the 90% probabilityintervals extend through the cautious zone into the critical zone (e.g., B <0.4*B ) for these two areas(Figure 20). The probabilities that B exceeded the USRP were 0.67, 0.95, 0.67, and 0.88 for Areas 3C, 3D,5A/B, and 5C/D/E, respectively (Table 1 in (DFO 2011c)). The probabilities that B exceeded the LRP were0.90, >0.99, 0.95, and >0.99 for these same areas, respectively (Table 1 in (DFO 2011c)).
2010
2010 MSY
2010 MSY
2010
2010
57
Factor 1.2 - Abundance

Factor 1.3 - Fishing Mortality
Estimates of B2010 vs. reference points for outside lingcod. Dots are the posterior median of the ratio B2010:BMSY, and error bars are the 90% probability intervals of this ratio. Figure from (DFO 2011b).
BRITISH COLUMBIA/NORTHEAST PACIFIC, BOTTOM TRAWLS, CANADA, HARD SUBSTRATEBRITISH COLUMBIA/NORTHEAST PACIFIC, SET LONGLINES, CANADA, INSIDE ROCKFISHBRITISH COLUMBIA/NORTHEAST PACIFIC, MIDWATER TRAWLS, CANADABRITISH COLUMBIA/NORTHEAST PACIFIC, JIG, CANADA, OUTSIDE ROCKFISHBRITISH COLUMBIA/NORTHEAST PACIFIC, SET LONGLINES, CANADA, OUTSIDE ROCKFISHBRITISH COLUMBIA/NORTHEAST PACIFIC, TROLLING LINES, CANADA, OUTSIDE ROCKFISH
Very Low Concern
The trawl fishery is allocated 74.0% of the lingcod TAC for 2013, and the hook and line fisheries are allocatedthe remaining 26% (DFO 2013a). Total lingcod catch in 2012 was approximately 33.8% of total available TAC.The trawl, lingcod, and halibut fisheries accounted for 44.8%, 32.7%, and 14.6% of the 2012 lingcod catch,respectively.
In a recent assessment, median estimates of F were less than F for all areas, but these estimateswere characterized by substantial uncertainty for Areas 3C, 5A/B, and 5C/D/E. Modeled probabilities indicatethat constant application of area-specific TACs similar to the 2012 catches would have probabilities of 69% to93% of resulting in area-specific B >USRP, depending on the area; these probabilities are not substantiallylower than those associated with zero harvest scenarios. For these reasons, fishing mortality of lingcod isscored "very low" concern for the trawl, lingcod, halibut, and inside and outside rockfish fisheries. However,this score should be revisited if annual catches begin to increase toward the TAC.
2010 MSY
2016
Justification:
Total lingcod catch in 2012 was approximately 1,528 t across all fisheries, while the total TAC was 4,517 t(Appendix A). The trawl, lingcod, and halibut fisheries caught 685, 499, and 223 t, respectively (Appendix A).
Historically, the trawl fishery has been responsible for most of the coastwide catch of lingcod in outsidewaters, but the catch in hook and line fisheries has increased since the late 1980s (Figure 2 in (DFO 2011c)).
58

LONGNOSE SKATE
Factor 1.1 - Inherent Vulnerability
During the period 2007-2012, the trawl fishery’s catch of lingcod declined by 55%, while catch in the lingcodand halibut hook and line fisheries remained relatively steady; the total catch of lingcod stayed well below thetotal TAC during this period (Figure 20). No area-specific TACs were exceeded for the trawl fishery during theperiod 2000-2012, or for hook and line fisheries during the period 2007-2012 (DFO 2013c)(DFO 2013d).
Lingcod catches by fishery and total TAC, 2007-2012. Data from (DFO 2013b)(DFO 2013d).
The recent stock assessment generated estimates of F :F . Median estimates were 0.39 (5-95% =0.059-2.165) for Area 3C, 0.11 (0.03-0.85) for Area 3D, 0.51 (0.08-2.18) for Area 5A/B, and 0.31 (0.08-1.42)for Area 5C/D/E (Tables 2-5 in (DFO 2011c)).
Lingcod are managed with area-specific TACs for Areas 3C, 3D, 5A/B, 4B (Area 12 only), and 5C/D/E (DFO2013a). The recent stock assessment projects a variety of area-specific TACs into the future and presentsprobabilities of B exceeding various stock status indicators when each modeled TAC is held constant (Table2 in (DFO 2011c)). The probabilities that area-specific TACs held constant at 500 t (which is slightly greaterthan any of the area-specific catches in 2012) will result in B >USRP are 0.69, 0.93, 0.69, and 0.84 for thestocks in Areas 3C, 3D, 5A/B, and 5C/D/E, respectively; these probability values are approximately 2.1-10.4%lower than the probability values associated with zero harvest for the same areas (Table 2 in (DFO 2011c)).The probabilities that these same area-specific TACs will result in B <LRP are 0.11, 0.01, 0.07, and 0.03 forthese same stocks (Table 2 in (DFO 2011c)).
In addition to the catches in the trawl, halibut, and lingcod fisheries, the catch of lingcod in the 2012 insideand outside rockfish fisheries was sufficient to compose >5% of those fisheries’ total catch (DFO PacificRegion 2013). This qualifies this species as a “main” species for the inside and outside rockfish fisheries.
2010 MSY
2016
2016
2016
BRITISH COLUMBIA/NORTHEAST PACIFIC, LONGLINE (SHALLOW-SET), CANADABRITISH COLUMBIA/NORTHEAST PACIFIC, BOTTOM TRAWLS, CANADA, SOFT SUBSTRATEBRITISH COLUMBIA/NORTHEAST PACIFIC, SET LONGLINES, CANADA, OUTSIDE ROCKFISH
High
59

Factor 1.2 - Abundance
Factor 1.3 - Fishing Mortality
LONGSPINE THORNYHEAD
Factor 1.1 - Inherent Vulnerability
Factor 1.2 - Abundance
The Fishbase vulnerability score for longnose skate is 55, and the species’ productivity rating in Cope et al.2011 is 1.53 (Table 1 in (Cope et al. 2011)). Longnose skate inherent vulnerability is therefore scored "high”.
BRITISH COLUMBIA/NORTHEAST PACIFIC, LONGLINE (SHALLOW-SET), CANADABRITISH COLUMBIA/NORTHEAST PACIFIC, BOTTOM TRAWLS, CANADA, SOFT SUBSTRATEBRITISH COLUMBIA/NORTHEAST PACIFIC, SET LONGLINES, CANADA, OUTSIDE ROCKFISH
High Concern
A recent stock assessment was not able to generate reliable estimates of longnose skate biomass relative toreference points (CSAS 2014a). That assessment, however, analyzed trawl survey data and found statisticallysignificant declines in longnose skate abundance (CSAS 2014a). Longnose skate stock status is thereforescored "high" concern due to the species' "high" inherent vulnerability (see Factor 1.1) and unknown stockstatus relative to reference points; the declines in survey abundances noted in the stock assessment supportthis score.
BRITISH COLUMBIA/NORTHEAST PACIFIC, LONGLINE (SHALLOW-SET), CANADABRITISH COLUMBIA/NORTHEAST PACIFIC, BOTTOM TRAWLS, CANADA, SOFT SUBSTRATEBRITISH COLUMBIA/NORTHEAST PACIFIC, SET LONGLINES, CANADA, OUTSIDE ROCKFISH
Moderate Concern
The recent stock assessment found that both short-term and long-term catch levels of longnose skate havebeen above the maximum values presented in a range of catch-based MSY estimates; coastwide, the meanannual catch during the period 2007-2011 was 45.6% greater than the maximum catch-based MSY estimate(Table 1 in (CSAS 2014a)). At the time of this report, DFO has developed preliminary, area-specific TACs forthe commercial fishery; these TACs are within the range of values determined by the catch-based MSYmethod in the assessment (DFO 2014b). As this fishery has a good record of not exceeding TACs (see"Enforcement" section), fishing mortality of longnose skate is scored "moderate" concern under the conditionthat the TACs do not exceed the MSY estimates presented in the recent assessment.
BRITISH COLUMBIA/NORTHEAST PACIFIC, BOTTOM TRAWLS, CANADA, SOFT SUBSTRATE
High
The Fishbase vulnerability score for longspine thornyhead is 60. The species’ productivity rating in Cope et al.2011 is 1.47 (Table 1 in (Cope et al., 2011)). Longspine thornyhead therefore have “high" inherentvulnerability.
BRITISH COLUMBIA/NORTHEAST PACIFIC, BOTTOM TRAWLS, CANADA, SOFT SUBSTRATE
High Concern
60

Factor 1.3 - Fishing Mortality
There is no stock assessment for longspine thornyhead, and trawl survey biomass indices are unreliable dueto instances of high relative error. Declining catch per unit effort (CPUE) trends have been noted for each ofthe areas that recently hosted the directed fishery. The species was assessed as "Special Concern" byCOSEWIC and is listed as "Special Concern" under SARA. For these reasons, longspine thornyhead stockstatus is scored “high" concern.
Justification:
Longspine thornyhead was assessed as "Special Concern" by COSEWIC (Appendix D), and is listed as "SpecialConcern" under SARA (Appendix D; (Canada Gazette 2009)).
A directed fishery for longspine thornyhead began in 1996 (Haigh, R., et al., 2005a). The fishery thatdeveloped focused primarily on Areas 3C/D, and subsequently and to a lesser extent, on Areas 5A/B and 5E(Haigh et al. 2005a). The CPUE in Areas 3C/D declined by approximately 49% between 1996 and 2004 (Figure21); CPUE declines of 31% and 65% were also noted for Areas 5A/B and 5E, respectively, over the 2000-2004period (Haigh et al. 2005a).
Three Areas 3C/D longspine thornyhead CPUE series from the initiation of the directed fishery (1996) through 2004. Figure from (Haigh et al. 2005).
Several issues preclude reliable interpretation of trends in trawl survey biomass indices for longspinethornyhead. There are no records of longspine thornyhead in the HS survey, and for the QCS and WCVIsurvey indices, the relative error of the biomass estimates is high (>0.40) (DFO 2013b). While the relativeerrors for the WCHG survey’s biomass estimates have been <0.30, interpretation of the trend is complicatedby a sampling issue: in 2007, the WCHG trawl survey did not access the deepest stratum due to timelimitations (N. Olsen, pers. comm.). This likely affected that year’s index for species found at deeper depths,such as longspine thornyhead.
61

PACIFIC COD
Factor 1.1 - Inherent Vulnerability
BRITISH COLUMBIA/NORTHEAST PACIFIC, BOTTOM TRAWLS, CANADA, SOFT SUBSTRATE
Low Concern
The trawl fishery is allocated 95.35% of the 2013 longspine thornyhead TAC (DFO 2013a). For this reason,only the trawl fishery’s catch of longspine thornyhead is considered in this assessment. There is no stockassessment-based estimate of sustainable yield for longspine thornyhead, but due to unfavorable marketconditions, recent catches of longspine thornyhead have been low relative to past years. The 2012 catch oflongspine thornyhead in the trawl fishery was approximately 19.0% of the available trawl TAC. Longspinethornyhead fishing mortality is scored “low" concern, as the low catch relative to TAC, and a recent closure oflarge amounts of deep-water habitat, moderates concern. This score should be revisisted if catches increasein the future.
Justification:
Prior to 1996, landings of longspine thornyhead were virtually nil (Haigh et al. 2005a). In 1996, a directedtrawl fishery emerged, and landings increased from approximately 5 t in 1995 to over 1,029 t in 1996 (Table 5in (Haigh et al. 2005a)). From 1997 through 2002, landings remained above 496 t/year (Table 6 in (Haigh etal. 2005a)). Catches then began to decline as less-favorable market conditions emerged (Haigh et al. 2005a),and since 2008, total catches have been less than 100 t/year (Figure 22; Appendix A). The stock was listed as"Special Concern" under SARA in 2009 (Canada Gazette 2009), but the TAC was not reduced after thisdecision (Appendix A).
For 2012, the total trawl catch of longspine thornyhead (98.3 t) was approximately 19.0% of the availabletrawl TAC (518.5 t; Appendix C).
It should be noted that a recent management change to the trawl fishery reduced the fishery's access todeep-water habitat such as that in which longspine thornyhead are fished; 64% of waters between 800-999meters and 95% of waters between 1,000 and 1,199 meters are now off-limits to the bottom trawlfishery (Bodtker et al. 2013).
Longspine thornyhead catch and TACs in the trawl fishery, 2000-2012 (Appendix B).
62

Factor 1.2 - Abundance
BRITISH COLUMBIA/NORTHEAST PACIFIC, BOTTOM TRAWLS, CANADA, SOFT SUBSTRATE
Medium
The Fishbase vulnerability score for Pacific cod is 50, and the species’ productivity rating in Cope et al. 2011 is2.11 (Table 1 in (Cope et al. 2011)). Pacific cod inherent vulnerability is therefore scored “medium”.
BRITISH COLUMBIA/NORTHEAST PACIFIC, BOTTOM TRAWLS, CANADA, SOFT SUBSTRATE
High Concern
A recent stock assessment of Pacific cod in Area 5CD (HS) was characterized by substantial uncertainty anddid not generate estimates of MSY or B -based reference points. However, that assessment indicates thatPacific cod biomass may have increased in recent years, relative to a recent historical low, and thatSB was likely to be less than an alternative USR but greater than an alternative LRP.
A recent stock assessment of Pacific cod in Area 5AB (QCS) was characterized by substantial uncertainty anddid not generate estimates of MSY or B -based reference points. Alternative historical reference points werealso rejected. The biomass estimate for Area 5AB Pacific cod is characterized by high uncertainty, andindicates that biomass has remained relatively steady in recent years at a level well below historical averages.Pacific cod stock status is scored “high” concern.
0
2014
0
Justification:
The recent Area 5CD stock assessment, which was characterized by substantial uncertainty, suggests thatPacific cod biomass in Area 5CD may be slowly increasing after reaching a historical minimum in the early2000s (CSAS, 2015b) (Figure 23).
63
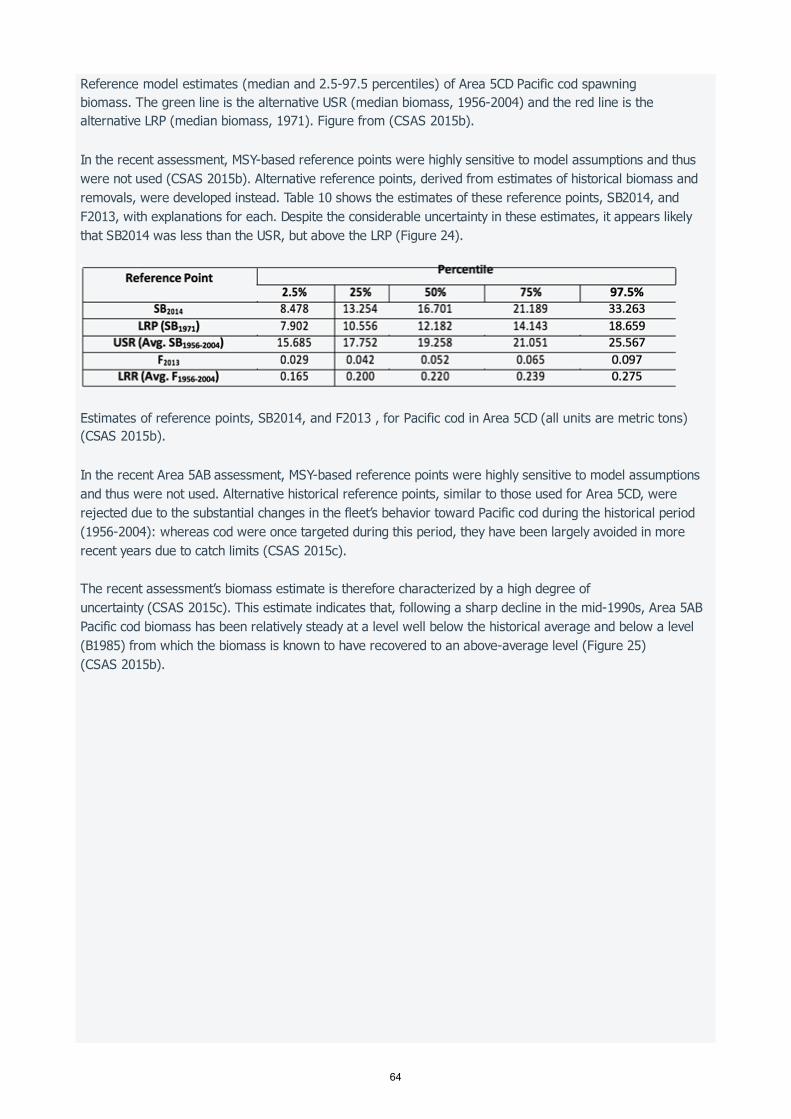
Reference model estimates (median and 2.5-97.5 percentiles) of Area 5CD Pacific cod spawning biomass. The green line is the alternative USR (median biomass, 1956-2004) and the red line is the alternative LRP (median biomass, 1971). Figure from (CSAS 2015b).
In the recent assessment, MSY-based reference points were highly sensitive to model assumptions and thuswere not used (CSAS 2015b). Alternative reference points, derived from estimates of historical biomass andremovals, were developed instead. Table 10 shows the estimates of these reference points, SB2014, andF2013, with explanations for each. Despite the considerable uncertainty in these estimates, it appears likelythat SB2014 was less than the USR, but above the LRP (Figure 24).
Estimates of reference points, SB2014, and F2013 , for Pacific cod in Area 5CD (all units are metric tons) (CSAS 2015b).
In the recent Area 5AB assessment, MSY-based reference points were highly sensitive to model assumptionsand thus were not used. Alternative historical reference points, similar to those used for Area 5CD, wererejected due to the substantial changes in the fleet’s behavior toward Pacific cod during the historical period(1956-2004): whereas cod were once targeted during this period, they have been largely avoided in morerecent years due to catch limits (CSAS 2015c).
The recent assessment’s biomass estimate is therefore characterized by a high degree ofuncertainty (CSAS 2015c). This estimate indicates that, following a sharp decline in the mid-1990s, Area 5ABPacific cod biomass has been relatively steady at a level well below the historical average and below a level(B1985) from which the biomass is known to have recovered to an above-average level (Figure 25)(CSAS 2015b).
64
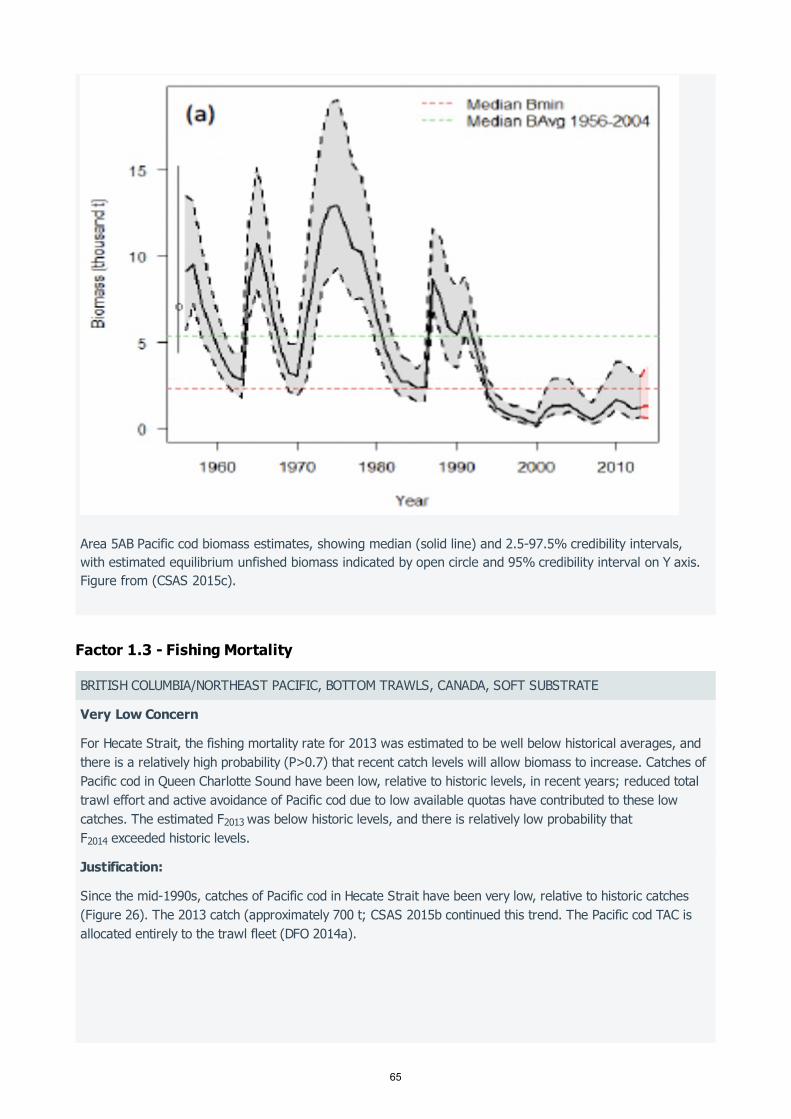
Factor 1.3 - Fishing Mortality
Area 5AB Pacific cod biomass estimates, showing median (solid line) and 2.5-97.5% credibility intervals, with estimated equilibrium unfished biomass indicated by open circle and 95% credibility interval on Y axis. Figure from (CSAS 2015c).
BRITISH COLUMBIA/NORTHEAST PACIFIC, BOTTOM TRAWLS, CANADA, SOFT SUBSTRATE
Very Low Concern
For Hecate Strait, the fishing mortality rate for 2013 was estimated to be well below historical averages, andthere is a relatively high probability (P>0.7) that recent catch levels will allow biomass to increase. Catches ofPacific cod in Queen Charlotte Sound have been low, relative to historic levels, in recent years; reduced totaltrawl effort and active avoidance of Pacific cod due to low available quotas have contributed to these lowcatches. The estimated F was below historic levels, and there is relatively low probability thatF exceeded historic levels.
2013
2014
Justification:
Since the mid-1990s, catches of Pacific cod in Hecate Strait have been very low, relative to historic catches(Figure 26). The 2013 catch (approximately 700 t; CSAS 2015b continued this trend. The Pacific cod TAC isallocated entirely to the trawl fleet (DFO 2014a).
65
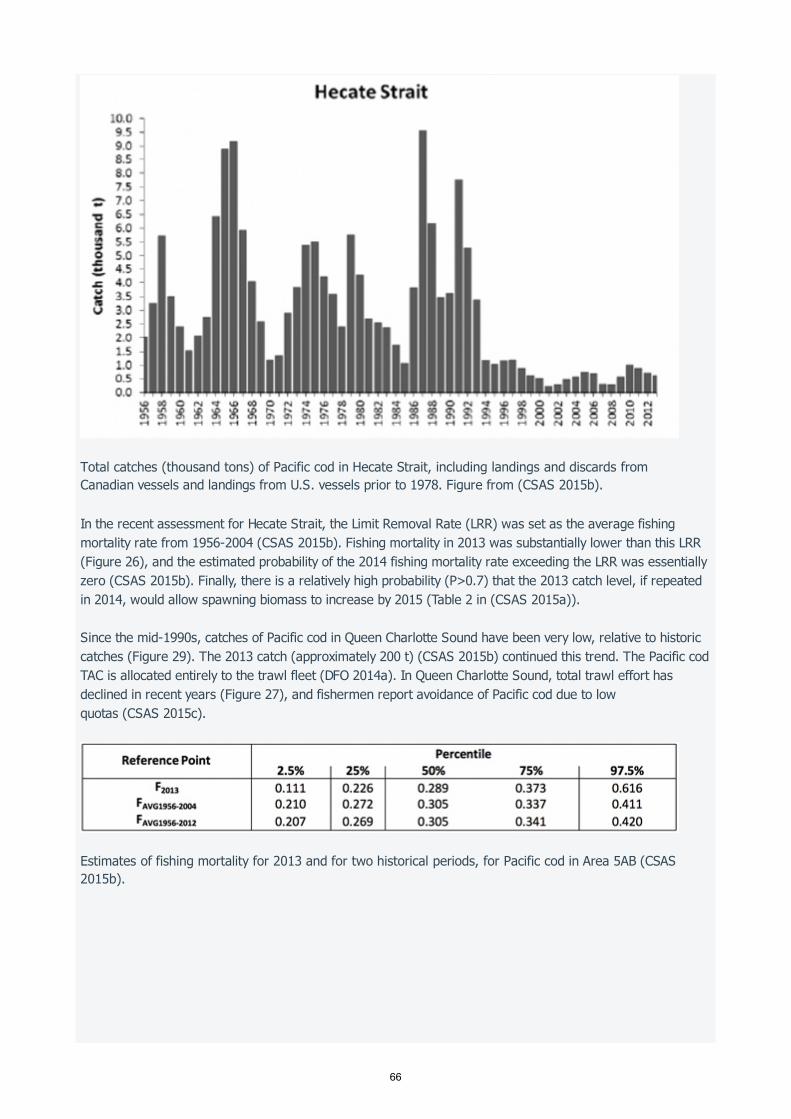
Total catches (thousand tons) of Pacific cod in Hecate Strait, including landings and discards from Canadian vessels and landings from U.S. vessels prior to 1978. Figure from (CSAS 2015b).
In the recent assessment for Hecate Strait, the Limit Removal Rate (LRR) was set as the average fishingmortality rate from 1956-2004 (CSAS 2015b). Fishing mortality in 2013 was substantially lower than this LRR(Figure 26), and the estimated probability of the 2014 fishing mortality rate exceeding the LRR was essentiallyzero (CSAS 2015b). Finally, there is a relatively high probability (P>0.7) that the 2013 catch level, if repeatedin 2014, would allow spawning biomass to increase by 2015 (Table 2 in (CSAS 2015a)).
Since the mid-1990s, catches of Pacific cod in Queen Charlotte Sound have been very low, relative to historiccatches (Figure 29). The 2013 catch (approximately 200 t) (CSAS 2015b) continued this trend. The Pacific codTAC is allocated entirely to the trawl fleet (DFO 2014a). In Queen Charlotte Sound, total trawl effort hasdeclined in recent years (Figure 27), and fishermen report avoidance of Pacific cod due to lowquotas (CSAS 2015c).
Estimates of fishing mortality for 2013 and for two historical periods, for Pacific cod in Area 5AB (CSAS 2015b).
66
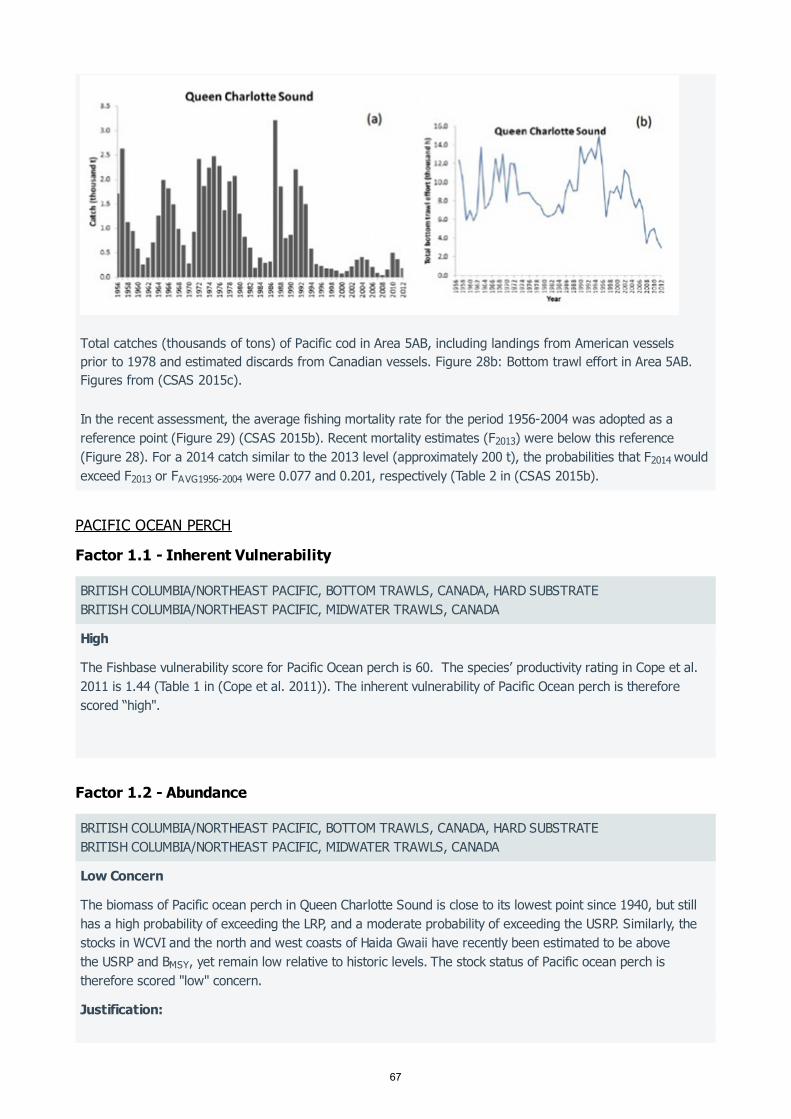
PACIFIC OCEAN PERCH
Factor 1.1 - Inherent Vulnerability
Factor 1.2 - Abundance
Total catches (thousands of tons) of Pacific cod in Area 5AB, including landings from American vessels prior to 1978 and estimated discards from Canadian vessels. Figure 28b: Bottom trawl effort in Area 5AB. Figures from (CSAS 2015c).
In the recent assessment, the average fishing mortality rate for the period 1956-2004 was adopted as areference point (Figure 29) (CSAS 2015b). Recent mortality estimates (F ) were below this reference(Figure 28). For a 2014 catch similar to the 2013 level (approximately 200 t), the probabilities that F wouldexceed F or F were 0.077 and 0.201, respectively (Table 2 in (CSAS 2015b).
2013
2014
2013 AVG1956-2004
BRITISH COLUMBIA/NORTHEAST PACIFIC, BOTTOM TRAWLS, CANADA, HARD SUBSTRATEBRITISH COLUMBIA/NORTHEAST PACIFIC, MIDWATER TRAWLS, CANADA
High
The Fishbase vulnerability score for Pacific Ocean perch is 60. The species’ productivity rating in Cope et al.2011 is 1.44 (Table 1 in (Cope et al. 2011)). The inherent vulnerability of Pacific Ocean perch is thereforescored “high".
BRITISH COLUMBIA/NORTHEAST PACIFIC, BOTTOM TRAWLS, CANADA, HARD SUBSTRATEBRITISH COLUMBIA/NORTHEAST PACIFIC, MIDWATER TRAWLS, CANADA
Low Concern
The biomass of Pacific ocean perch in Queen Charlotte Sound is close to its lowest point since 1940, but stillhas a high probability of exceeding the LRP, and a moderate probability of exceeding the USRP. Similarly, thestocks in WCVI and the north and west coasts of Haida Gwaii have recently been estimated to be abovethe USRP and B , yet remain low relative to historic levels. The stock status of Pacific ocean perch istherefore scored "low" concern.
MSY
Justification:
67
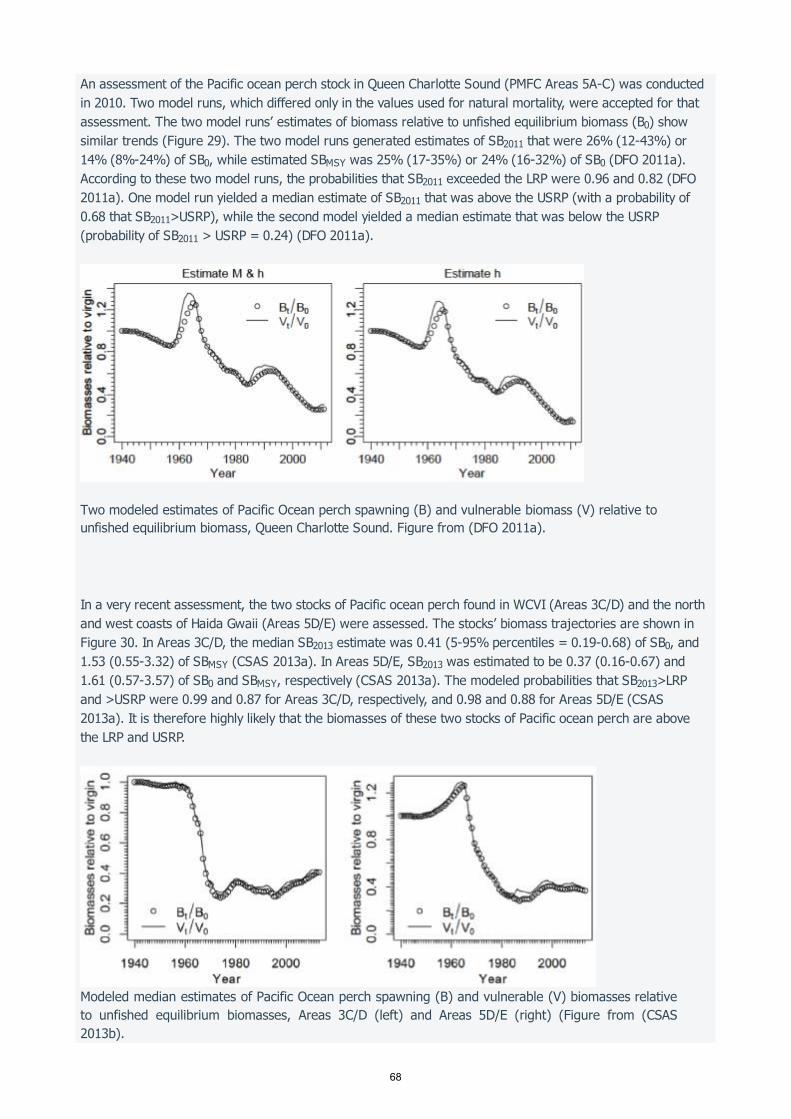
An assessment of the Pacific ocean perch stock in Queen Charlotte Sound (PMFC Areas 5A-C) was conductedin 2010. Two model runs, which differed only in the values used for natural mortality, were accepted for thatassessment. The two model runs’ estimates of biomass relative to unfished equilibrium biomass (B ) showsimilar trends (Figure 29). The two model runs generated estimates of SB that were 26% (12-43%) or14% (8%-24%) of SB , while estimated SB was 25% (17-35%) or 24% (16-32%) of SB (DFO 2011a).According to these two model runs, the probabilities that SB exceeded the LRP were 0.96 and 0.82 (DFO2011a). One model run yielded a median estimate of SB that was above the USRP (with a probability of0.68 that SB >USRP), while the second model yielded a median estimate that was below the USRP(probability of SB > USRP = 0.24) (DFO 2011a).
Two modeled estimates of Pacific Ocean perch spawning (B) and vulnerable biomass (V) relative to unfished equilibrium biomass, Queen Charlotte Sound. Figure from (DFO 2011a).
In a very recent assessment, the two stocks of Pacific ocean perch found in WCVI (Areas 3C/D) and the northand west coasts of Haida Gwaii (Areas 5D/E) were assessed. The stocks’ biomass trajectories are shown inFigure 30. In Areas 3C/D, the median SB estimate was 0.41 (5-95% percentiles = 0.19-0.68) of SB , and1.53 (0.55-3.32) of SB (CSAS 2013a). In Areas 5D/E, SB was estimated to be 0.37 (0.16-0.67) and1.61 (0.57-3.57) of SB and SB , respectively (CSAS 2013a). The modeled probabilities that SB >LRPand >USRP were 0.99 and 0.87 for Areas 3C/D, respectively, and 0.98 and 0.88 for Areas 5D/E (CSAS2013a). It is therefore highly likely that the biomasses of these two stocks of Pacific ocean perch are abovethe LRP and USRP.
Modeled median estimates of Pacific Ocean perch spawning (B) and vulnerable (V) biomasses relative to unfished equilibrium biomasses, Areas 3C/D (left) and Areas 5D/E (right) (Figure from (CSAS 2013b).
0
2011
0 MSY 0
2011
2011
2011
2011
2013 0
MSY 2013
0 MSY 2013
68

Factor 1.3 - Fishing Mortality
In summary, the Areas 3C/D and 5D/E stocks have recently been estimated to be above the USRP, while oneof the two model runs used in the recent assessment of the 5A-C stock shows that stock to be above theUSRP (Figure 31).
Recent estimates of three Pacific Ocean perch stocks’ B:BMSY ratios, relative to biomass reference points. Figure from (CSAS 2013b).
BRITISH COLUMBIA/NORTHEAST PACIFIC, BOTTOM TRAWLS, CANADA, HARD SUBSTRATEBRITISH COLUMBIA/NORTHEAST PACIFIC, MIDWATER TRAWLS, CANADA
Moderate Concern
The trawl fishery is allocated 99.98% of the Pacific ocean perch TAC (DFO 2013a). The coast-wide 2012Pacific ocean perch catch was 70.7% of available coast-wide quota; no area-specific quotas were exceeded.
Approximately 75% of the 2012 catch was taken in Areas 5A/B and 5C/D. Estimated exploitation rates for QCSPacific ocean perch have generally increased over the past 2+ decades, and are now similar to the ratesestimated for the peak of the foreign fishery years. When compared to probabilities presented in a recentstock assessment, it is apparent that catches similar to the 2012 Areas 5A-D catch may lead to sub-USRP andpossibly sub-LRP stock status within several years. As a result of the recent stock assessment, the TAC forAreas 5ABC has been reduced for 2013. This action mitigates concern, and as such the Factor 1.3 score forPacific ocean perch is "moderate" concern.
Justification:
In 2012, the total catch of Pacific ocean perch was 1,674.89 t in Areas 5A/B, and 1,450.25 t in Areas 5C/5D(Appendix C). These catches were 75.3% and 60.0% of the Areas 5A/B and 5C/D quotas, respectively(Appendix C). Coast-wide, the 2012 Pacific ocean perch catch (4,168.6 t) was 70.7% of available quota(Appendix C).
In QCS (PMFC Areas 5A-C), two recent stock assessment model runs show that exploitation rates (U) have
69

increased since the 1990s and are similar to historical high levels that occurred during the era of foreignfishing in the 1960s (Figure 32) (DFO 2011a). The ‘estimate M & h’ and ‘estimate h’ runs yield median Uvalues that are approximately 0.8 and 1.5 of U , respectively (DFO 2011a). These two runs therefore showthat recent exploitation rates in QCS are close to, and may be surpassing, U .
Two modeled estimates of annual exploitation rates for Pacific Ocean perch in Queen Charlotte Sound. Figure from (DFO 2011).
The 2011 assessment of the PMFC Areas 5A-C stock includes decision tables that show modeled probabilitiesof different catch levels reducing biomass to less than the LRP or USRP by a given year. The probabilitiesassociated with annual catches of 3,000 and 3,500 t in PMFC Areas 5A-C (which bookend the total 2012 GMAs5A-D catch of 3,125.15 t) are shown in Figure 34. Note that GMAs 5A-C and PMFC Areas 5A-C cover similarareas (see Figure 2 in (DFO 2011a)), and that relatively little Pacific Ocean perch is caught in GMA 5D (TableB3 in 2011 (Edwards et al. 2011)). Therefore the comparison of 2012 GMA 5A-D catches to PMFC Area 5A-Cprobabilities (Figure 33) is valid.
Two model runs' probabilities of QCS Pacific Ocean perch spawning biomass being above the LRP and USRP for a given year, assuming constant catches of 2,000, 3,000 or 3,500 t/year, from 2011 onwards (from Tables 1 and 2 in (DFO 2011b).
The recent assessment of the Areas 3C/D and 5D/E stocks estimates that recent exploitation rates have been
2010
MSY
MSY
70

PETRALE SOLE
Factor 1.1 - Inherent Vulnerability
Factor 1.2 - Abundance
lower than historical levels and lower than estimates of U (CSAS 2013a). For Areas 3C/D, the recentassessment’s estimate of U /U was 0.384 (5 and 95 percentiles = 0.134-1.434), and 0.482 (0.168-1.697) for Areas 5D/E (Table 1 in (CSAS 2013a). The probabilities of U <U were 0.89 and 0.84 forAreas 3C/D and 5D/E, respectively (CSAS 2013a). The two model runs, which differ only in the valuesassociated with natural mortality (M), show very different probabilities associated with catch levels similar tothe 2012 catch. Still, the stock assessment states that "projections suggest a declining stock if current catchesare maintained". It should be noted that the Area 5ABC TAC was reduced in 2013 due to this stockassessment, and catches are expected to be closer to 2,000 t (A. Sinclair, pers. comm.), hence the inclusion ofprobabilities for this catch level in the above figure.
MSY
2012 MSY th th
2012 MSY
BRITISH COLUMBIA/NORTHEAST PACIFIC, BOTTOM TRAWLS, CANADA, SOFT SUBSTRATE
Medium
The Fishbase vulnerability score for petrale sole is 55. The species’ productivity rating in Cope et al. 2011 is1.70 (Table 1 in (Cope et al. 2011)). Petrale sole therefore have “medium” inherent vulnerability.
BRITISH COLUMBIA/NORTHEAST PACIFIC, BOTTOM TRAWLS, CANADA, SOFT SUBSTRATE
Low Concern
In the most recent stock assessment, northwest Vancouver Island/QCS/HS petrale sole biomass was modeledto be greater than at any time since at least the late 1960s. Recent trends in trawl biomass indices alsosuggest that petrale sole biomass has increased over the past several years. The stock status of petrale soleis scored "low" concern, as the lack of a recent stock assessment precludes a score of "very low" concern.
Justification:
Two discrete populations of Petrale sole are found in British Columbia’s waters: one off of southwestVancouver Island (Area 3C), and one in the waters off of northwest Vancouver Island, Queen Charlotte Sound,and Hecate Strait (Areas 3D and 5A-D; (DFO 2001)). The most recent stock assessment for the northwestVancouver Island/QCS/HS population was conducted for 2006 (Starr 2009b).
The 2006 stock assessment (which was published in 2009) presented several modeled population trajectoriesfor the northwest Vancouver Island/QCS/HS population. The trajectory modeled by a recommended model run(Figure D.11 in (Starr 2009b)) shows petrale sole biomass increasing substantially since the early 1990s, andB exceeding biomass at any other time since at least 1966. Conversely, model runs that used a differentassumption for catchability show a general decline from the late 1960s through the late 1990s, and amoderate increase in the years since (Figures D.7 and D.8 in (Starr 2009b)). The more pessimistic model runsassumed constant catchability for the past 40 years, whereas the runs with the more optimistic outputsassumed that a decrease in catchability occurred between 1995 and 1996 due to the introduction ofincreasingly tight management measures. Recent trends in petrale sole trawl survey biomass indices supportthe conclusion that petrale sole biomass is increasing (Figure 34).
2006
71

Factor 1.3 - Fishing Mortality
Trawl survey biomass indices for petrale sole. Data from (DFO 2013b).
BRITISH COLUMBIA/NORTHEAST PACIFIC, BOTTOM TRAWLS, CANADA, SOFT SUBSTRATE
Moderate Concern
The trawl fishery is allocated 100% of the petrale sole TAC. Petrale sole catches have steadily increased since2000. In 2012, the trawl fishery’s catch of petrale sole was 98.7% of the available TAC. Modeled probabilitiesfrom a 2006/2007 stock assessment suggest that the 2006-2011 mean annual catch was not likely to havedriven B below historical minimum or mean levels, but it may have driven B to below the B level.Fishing mortality of petrale sole is considered a “moderate” conservation concern.
2012 2012 2007
Justification:
Petrale sole landings averaged approximately 513 t during the 1980s and 540 t in the 1990s (Table B.1 in(Starr 2009b)). Catches have steadily increased since 2000: the mean annual catch (landings + discards) was470.4 t during the 2000-2003 period, 573.7 t during the 2004-2008 period, and 758.1 during the 2009-2012period (Appendix C). While landings exceeded 700 t on only three occasions from 1979 through 2009 (TableB.1 in (Starr 2009b)), total catches (including discards) have been above 700 t in each year during the 2010-2012 period (Appendix C).
The trawl fishery is allocated 100% of the petrale sole TAC, and this fishery’s catch of petrale sole has beentightly linked with available TAC in recent years (Figure 35). Since 2000, the trawl fishery has caught, onaverage, 87% of available TAC (Appendix C). No TACs were exceeded during this period. In 2012, the catchof petrale sole in the trawl fishery was 758 t, while the TAC was 768 t (Appendix C).
72

QUILLBACK ROCKFISH
Factor 1.1 - Inherent Vulnerability
Petrale sole catch and TACs in the trawl fishery, 2000-2012. Data from (DFO 2013b).
The recent assessment of the Areas 3C/D and 5D/E stocks estimates that recent exploitation rates have beenlower than historical levels and lower than estimates of UMSY (CSAS 2013a). For Areas 3C/D, the recentassessment’s estimate of U2012/UMSY was 0.384 (5th and 95th percentiles = 0.134-1.434), and 0.482(0.168-1.697) for Areas 5D/E (Table 1 in CSAS 2013a). The probabilities of U2012<UMSY were 0.89 and 0.84for Areas 3C/D and 5D/E, respectively (CSAS 2013a).
The most recent stock assessment presents the results of a modeling effort from which the application ofvarious constant-catch levels during the period 2007-2011 was modeled, along with the resulting probabilitiesof B exceeding various reference points (Figures 2 through 11 in Starr 2009b). A comparison of the 2007-2011 mean annual catch with those probabilities and reference points is shown in Figure 36.
Recommended model runs' probabilities of B2012 exceeding various reference points after constant application of a catch level (700 t) similar to the 2007-2011 mean annual catch (678.0 t) for the period 2007- 2011. For this table, BMIN = the minimum biomass over the 1966-2006 period, and BREF = mean biomass during the period 1977-1984. Probabilities are from Tables D.10 and D.11 in (Starr, P.J. 2009b).
2012
73

Factor 1.2 - Abundance
Factor 1.3 - Fishing Mortality
BRITISH COLUMBIA/NORTHEAST PACIFIC, JIG, CANADA, INSIDE ROCKFISHBRITISH COLUMBIA/NORTHEAST PACIFIC, JIG, CANADA, OUTSIDE ROCKFISHBRITISH COLUMBIA/NORTHEAST PACIFIC, SET LONGLINES, CANADA, OUTSIDE ROCKFISHBRITISH COLUMBIA/NORTHEAST PACIFIC, TROLLING LINES, CANADA, OUTSIDE ROCKFISHBRITISH COLUMBIA/NORTHEAST PACIFIC, TROLLING LINES, CANADA, INSIDE ROCKFISH
High
The Fishbase vulnerability score for quillback rockfish is 64. The species’ productivity rating in Table 1 of (Copeet al. 2011) is 1.31, which likewise indicates "high" inherent vulnerability.
BRITISH COLUMBIA/NORTHEAST PACIFIC, JIG, CANADA, INSIDE ROCKFISHBRITISH COLUMBIA/NORTHEAST PACIFIC, JIG, CANADA, OUTSIDE ROCKFISHBRITISH COLUMBIA/NORTHEAST PACIFIC, SET LONGLINES, CANADA, OUTSIDE ROCKFISHBRITISH COLUMBIA/NORTHEAST PACIFIC, TROLLING LINES, CANADA, OUTSIDE ROCKFISHBRITISH COLUMBIA/NORTHEAST PACIFIC, TROLLING LINES, CANADA, INSIDE ROCKFISH
High Concern
Quillback rockfish have been designated as “Threatened” by COSEWIC. In a recent stock assessment,estimates of inside and outside quillback rockfish B : B ratios were less than the USRP, but greater thanthe LRP. In light of the species’ COSEWIC status and the uncertainty regarding the recent biomass estimates(especially for the outside management unit), quillback rockfish stock status is scored "high" concern.
2010 MSY
Justification:
Quillback rockfish have been designated as “Threatened” by COSEWIC (Appendix D) and are currently beingconsidered for listing under SARA (DFO 2013a). In a recent assessment of the “inside” and “outside” quillbackrockfish management units, the outside unit’s B :B ratio was 0.736 (95% confidence intervals = 0.266-1.814), and the inside unit’s B :B ratio was 0.493 (0.252-0.945) (Yamanaka et al, 2011).
2010 MSY
2010 MSY
BRITISH COLUMBIA/NORTHEAST PACIFIC, JIG, CANADA, INSIDE ROCKFISHBRITISH COLUMBIA/NORTHEAST PACIFIC, JIG, CANADA, OUTSIDE ROCKFISHBRITISH COLUMBIA/NORTHEAST PACIFIC, SET LONGLINES, CANADA, OUTSIDE ROCKFISHBRITISH COLUMBIA/NORTHEAST PACIFIC, TROLLING LINES, CANADA, OUTSIDE ROCKFISHBRITISH COLUMBIA/NORTHEAST PACIFIC, TROLLING LINES, CANADA, INSIDE ROCKFISH
Low Concern
A recent stock assessment suggests that the commercial groundfish fishery catch of quillback rockfish in 2010was at a level that will permit a gradual rebuilding of the stock. Fishing mortality of quillback rockfish istherefore scored “low” concern for the halibut and inside and outside rockfish fisheries.
Justification:
Commercial groundfish fishery catches of both outside and inside quillback rockfish were minimal for many
74

REDBANDED ROCKFISH
Factor 1.1 - Inherent Vulnerability
Factor 1.2 - Abundance
years, but sharply increased during the 1980s and early 1990s (Tables 1 and 2 in (Yamanaka et al. 2011)).Fishing mortality rates also increased sharply during this time, and at some points during the late 1980s andearly 1990s, estimates of F were more than 3 and 6 times the estimates of F for outside and insidequillback rockfish, respectively (Figures 5 and 6 in (Yamanaka et al. 2011)). Catches of both inside and outsidequillback began to decline after the mid-1990s (Figures 3 and 4 in (Yamanaka et al. 2011)), and mortalityrates have recently dropped below the units’ respective F estimates (Figures 5 and 6 in (Yamanaka et al.2011)). The catches of outside and inside quillback rockfish in commercial groundfish fisheries in 2010 were116.5 and 24.8 t, respectively (Tables 1 and 2 in (Yamanaka et al. 2011)). These catch levels, if kept constant,are similar to those projected to allow for gradual rebuilding of the stock (Figures 7 and 8 in (Yamanaka et al.2011)). For the start of the 2015/2016 season, quillback rockfish will be removed from the quillback, copper,China and tiger rockfish aggregate, and will instead be managed with a species-specific TAC (DFO 2014a).
MSY
MSY
BRITISH COLUMBIA/NORTHEAST PACIFIC, BOTTOM TRAWLS, CANADA, HARD SUBSTRATEBRITISH COLUMBIA/NORTHEAST PACIFIC, LONGLINE (DEEP-SET), CANADABRITISH COLUMBIA/NORTHEAST PACIFIC, MIDWATER TRAWLS, CANADABRITISH COLUMBIA/NORTHEAST PACIFIC, JIG, CANADA, OUTSIDE ROCKFISHBRITISH COLUMBIA/NORTHEAST PACIFIC, SET LONGLINES, CANADA, OUTSIDE ROCKFISHBRITISH COLUMBIA/NORTHEAST PACIFIC, TROLLING LINES, CANADA, OUTSIDE ROCKFISH
High
The Fishbase vulnerability score for redbanded rockfish is 54. However, the species’ productivity rating in Copeet al. 2011 is 1.28 (Table 1 in (Cope et al. 2011)). Redbanded rockfish therefore have “high" inherentvulnerability.
BRITISH COLUMBIA/NORTHEAST PACIFIC, BOTTOM TRAWLS, CANADA, HARD SUBSTRATEBRITISH COLUMBIA/NORTHEAST PACIFIC, LONGLINE (DEEP-SET), CANADABRITISH COLUMBIA/NORTHEAST PACIFIC, MIDWATER TRAWLS, CANADABRITISH COLUMBIA/NORTHEAST PACIFIC, JIG, CANADA, OUTSIDE ROCKFISHBRITISH COLUMBIA/NORTHEAST PACIFIC, SET LONGLINES, CANADA, OUTSIDE ROCKFISHBRITISH COLUMBIA/NORTHEAST PACIFIC, TROLLING LINES, CANADA, OUTSIDE ROCKFISH
High Concern
There is no information regarding redbanded rockfish biomass or stock status relative to reference points.Trends in trawl survey biomass indices are somewhat variable between the four regions, but do not indicatesubstantial increases or decreases in any area. Redbanded rockfish stock status is scored "high" concern.
Justification:
There is no stock assessment for redbanded rockfish, and the stock’s biomass is not known (Haigh & Starr2006). Trawl survey biomass indices do not show discinerable trends for any of the four survey areas (Figure37).
75

Factor 1.3 - Fishing Mortality
REDSTRIPE ROCKFISH
Factor 1.1 - Inherent Vulnerability
Trawl survey biomass indices for redbanded rockfish. Data from (DFO 2013b).
BRITISH COLUMBIA/NORTHEAST PACIFIC, BOTTOM TRAWLS, CANADA, HARD SUBSTRATEBRITISH COLUMBIA/NORTHEAST PACIFIC, LONGLINE (DEEP-SET), CANADABRITISH COLUMBIA/NORTHEAST PACIFIC, MIDWATER TRAWLS, CANADABRITISH COLUMBIA/NORTHEAST PACIFIC, JIG, CANADA, OUTSIDE ROCKFISHBRITISH COLUMBIA/NORTHEAST PACIFIC, SET LONGLINES, CANADA, OUTSIDE ROCKFISHBRITISH COLUMBIA/NORTHEAST PACIFIC, TROLLING LINES, CANADA, OUTSIDE ROCKFISH
Moderate Concern
The trawl fishery is allocated 50.0% of the redbanded rockfish TAC (DFO 2013a). The total 2012 catch ofredbanded rockfish was approximately 69.4% of the total TAC. The trawl fishery accounted for 69.3% of the2012 redbanded rockfish catch, and the fisheries for halibut (13.5%), outside rockfish (8.6%), and sablefish(8.2%) accounted for most of the remainder. Given the lack of a stock assessment for this stock (see Factor1.2), fishing mortality is scored "moderate" concern.
Justification:
In 2012, the total catch of redbanded rockfish was approximately 509.2 t, while the total TAC was 734.2 t(Appendix C). The 2012 catch of redbanded rockfish was primarily taken in the trawl fishery (353.1 t), withsubstantial amounts also taken in the fisheries for halibut (68.6 t), outside rockfish (43.8 t), and sablefish(42.1 t; Appendix C). The 2012 redbanded rockfish catch was similar to the 1986-2005 average catch (542t; Table 8 in (Haigh & Starr 2006)). In 2011, a coastwide TAC was introduced for redbanded rockfish, withequal amounts assigned to the trawl and hook & line sectors (DFO 2012a).
76

Factor 1.2 - Abundance
Factor 1.3 - Fishing Mortality
BRITISH COLUMBIA/NORTHEAST PACIFIC, BOTTOM TRAWLS, CANADA, HARD SUBSTRATEBRITISH COLUMBIA/NORTHEAST PACIFIC, MIDWATER TRAWLS, CANADA
High
The Fishbase vulnerability score for redstripe rockfish is 58, and the species’ productivity rating in Cope et al.2011 is 1.31 (Table 1 in (Cope et al. 2011)). Redstripe rockfish therefore have “high" inherent vulnerability.
BRITISH COLUMBIA/NORTHEAST PACIFIC, BOTTOM TRAWLS, CANADA, HARD SUBSTRATEBRITISH COLUMBIA/NORTHEAST PACIFIC, MIDWATER TRAWLS, CANADA
High Concern
There is no assessment of the redstripe rockfish stock. Trawl survey biomass indices indicate a slightlyincreasing trend for QCS and WCVI (Figure 39), but high relative errors complicates interpretation of thesetrends. The stock status of redstripe rockfish is therefore scored “high" concern due to the lack of anassessment and the species' "high" inherent vulnerability (see Factor 1.1).
Justification:
Interpretation of trends in trawl survey biomass indices (Figure 38) is complicated by the high relative errorsfor the WCVI and QCS biomass estimates (DFO 2013b). The mean relative error for the five WCVI biomassestimates is 0.50, and the four highest QCS survey biomass estimates (2003, 2007, 2011, and 2013) have thefour highest relative errors in the series (DFO 2013b).
Trawl survey biomass indices for redstripe rockfish. Data from (DFO 2013b).
BRITISH COLUMBIA/NORTHEAST PACIFIC, BOTTOM TRAWLS, CANADA, HARD SUBSTRATEBRITISH COLUMBIA/NORTHEAST PACIFIC, MIDWATER TRAWLS, CANADA
77

REX SOLE
Factor 1.1 - Inherent Vulnerability
Factor 1.2 - Abundance
Moderate Concern
The trawl fishery is allocated approximately 97.3% of coastwide redstripe rockfish TAC (DFO 2013a). For thisreason, only trawl-caught redstripe rockfish are considered in this assessment. The trawl fishery’s catch ofredstripe rockfish in 2012 was approximately 50.4% of the available TAC. The 2012 catch was broadly similarto the average catch during the period 2000-2011 and was substantially less than the maximum catches of thelate 1980s and early 1990s. Fishing mortality of redstripe rockfish is scored “moderate" concern for the trawlfishery.
Justification:
Annual catches of redstripe rockfish in domestic trawl fisheries were minimal until approximately 1977, andwere <500 t through 1984 (DFO 1999a). Catches increased in 1985, and from 1985 through 1993, annualtrawl catches of restripe rockfish were >1,000 t (DFO 1999a). The trawl fishery’s catch of redstripe rockfishdeclined from approximately 1,000 t in 2003 to 407 t in 2008, but has increased in recent years (Appendix C).In 2012, the catch of redstripe rockfish in the trawl fishery was approximately 898.6 t, while the total trawlTAC was 1,781.6 t (Appendix C). The 2012 catch was slightly greater than the average catch during the period2000-2011 (808.0 t; Appendix C) but was substantially less than the maximum trawl catches of approximately3,000 t that occurred during the late 1980s and early 1990s (DFO 1999a).No area-specific TACs were exceeded by the trawl fishery during the period 2000-2011 (DFO 2013c). Duringthis period, the average catch (808.0 t) was approximately 42% of the average total TAC (1,921 t; AppendixC).
BRITISH COLUMBIA/NORTHEAST PACIFIC, BOTTOM TRAWLS, CANADA, SOFT SUBSTRATE
Medium
The Fishbase vulnerability score for rex sole is 65. However, the species’ productivity rating in Cope et al. 2011is 2.05 (Table 1 in (Cope et al. 2011)). Rex sole therefore has “medium” inherent vulnerability.
BRITISH COLUMBIA/NORTHEAST PACIFIC, BOTTOM TRAWLS, CANADA, SOFT SUBSTRATE
Moderate Concern
There is no stock assessment for rex sole. In the trawl survey biomass data, rex sole are consistently ofrelatively low abundance in WCHG (DFO 2013b). Trawl survey biomass indices show a slightly increasing trendin HS, and have increased for four consecutive surveys in QCS (Figure 39). The lack of a stock assessment,the species' "medium" inherent vulnerability, and the variable trends noted in the survey biomass indicescompel a score of "moderate" concern.
Justification:
78
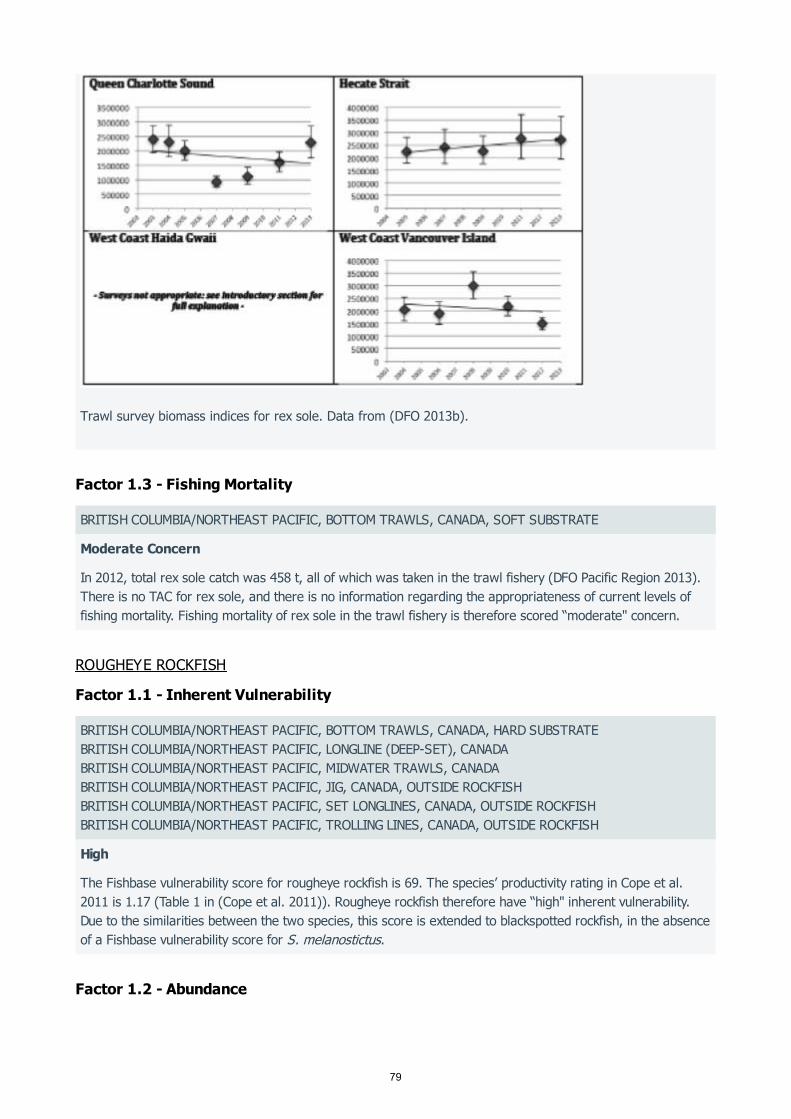
Factor 1.3 - Fishing Mortality
ROUGHEYE ROCKFISH
Factor 1.1 - Inherent Vulnerability
Factor 1.2 - Abundance
Trawl survey biomass indices for rex sole. Data from (DFO 2013b).
BRITISH COLUMBIA/NORTHEAST PACIFIC, BOTTOM TRAWLS, CANADA, SOFT SUBSTRATE
Moderate Concern
In 2012, total rex sole catch was 458 t, all of which was taken in the trawl fishery (DFO Pacific Region 2013).There is no TAC for rex sole, and there is no information regarding the appropriateness of current levels offishing mortality. Fishing mortality of rex sole in the trawl fishery is therefore scored “moderate" concern.
BRITISH COLUMBIA/NORTHEAST PACIFIC, BOTTOM TRAWLS, CANADA, HARD SUBSTRATEBRITISH COLUMBIA/NORTHEAST PACIFIC, LONGLINE (DEEP-SET), CANADABRITISH COLUMBIA/NORTHEAST PACIFIC, MIDWATER TRAWLS, CANADABRITISH COLUMBIA/NORTHEAST PACIFIC, JIG, CANADA, OUTSIDE ROCKFISHBRITISH COLUMBIA/NORTHEAST PACIFIC, SET LONGLINES, CANADA, OUTSIDE ROCKFISHBRITISH COLUMBIA/NORTHEAST PACIFIC, TROLLING LINES, CANADA, OUTSIDE ROCKFISH
High
The Fishbase vulnerability score for rougheye rockfish is 69. The species’ productivity rating in Cope et al.2011 is 1.17 (Table 1 in (Cope et al. 2011)). Rougheye rockfish therefore have “high" inherent vulnerability.Due to the similarities between the two species, this score is extended to blackspotted rockfish, in the absenceof a Fishbase vulnerability score for S. melanostictus.
79
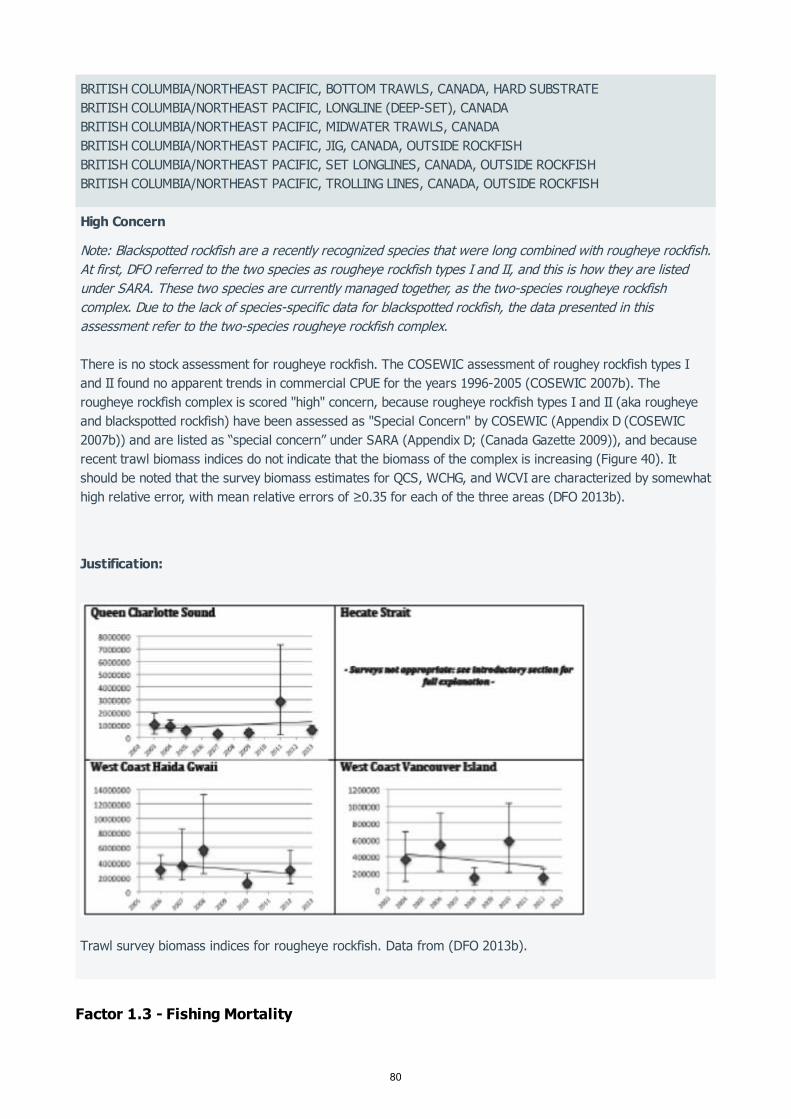
Factor 1.3 - Fishing Mortality
BRITISH COLUMBIA/NORTHEAST PACIFIC, BOTTOM TRAWLS, CANADA, HARD SUBSTRATEBRITISH COLUMBIA/NORTHEAST PACIFIC, LONGLINE (DEEP-SET), CANADABRITISH COLUMBIA/NORTHEAST PACIFIC, MIDWATER TRAWLS, CANADABRITISH COLUMBIA/NORTHEAST PACIFIC, JIG, CANADA, OUTSIDE ROCKFISHBRITISH COLUMBIA/NORTHEAST PACIFIC, SET LONGLINES, CANADA, OUTSIDE ROCKFISHBRITISH COLUMBIA/NORTHEAST PACIFIC, TROLLING LINES, CANADA, OUTSIDE ROCKFISH
High Concern
Note: Blackspotted rockfish are a recently recognized species that were long combined with rougheye rockfish.At first, DFO referred to the two species as rougheye rockfish types I and II, and this is how they are listedunder SARA. These two species are currently managed together, as the two-species rougheye rockfishcomplex. Due to the lack of species-specific data for blackspotted rockfish, the data presented in thisassessment refer to the two-species rougheye rockfish complex.
There is no stock assessment for rougheye rockfish. The COSEWIC assessment of roughey rockfish types Iand II found no apparent trends in commercial CPUE for the years 1996-2005 (COSEWIC 2007b). Therougheye rockfish complex is scored "high" concern, because rougheye rockfish types I and II (aka rougheyeand blackspotted rockfish) have been assessed as "Special Concern" by COSEWIC (Appendix D (COSEWIC2007b)) and are listed as “special concern” under SARA (Appendix D; (Canada Gazette 2009)), and becauserecent trawl biomass indices do not indicate that the biomass of the complex is increasing (Figure 40). Itshould be noted that the survey biomass estimates for QCS, WCHG, and WCVI are characterized by somewhathigh relative error, with mean relative errors of ≥0.35 for each of the three areas (DFO 2013b).
Justification:
Trawl survey biomass indices for rougheye rockfish. Data from (DFO 2013b).
80
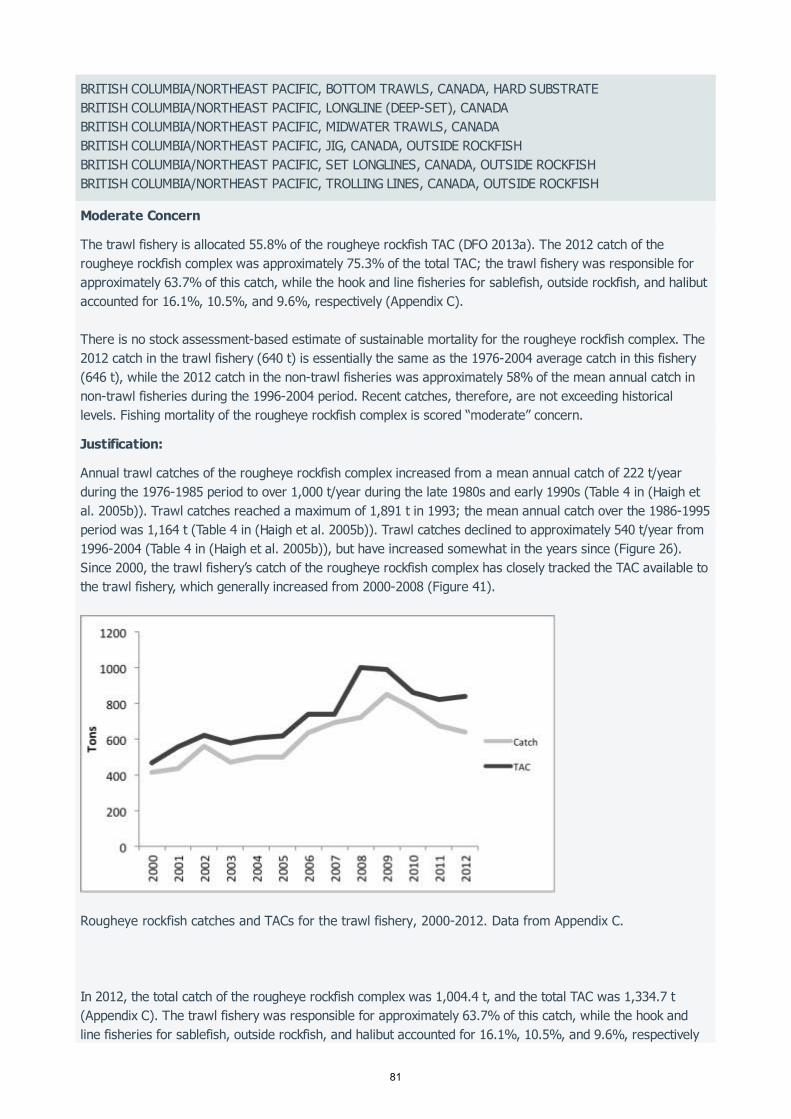
BRITISH COLUMBIA/NORTHEAST PACIFIC, BOTTOM TRAWLS, CANADA, HARD SUBSTRATEBRITISH COLUMBIA/NORTHEAST PACIFIC, LONGLINE (DEEP-SET), CANADABRITISH COLUMBIA/NORTHEAST PACIFIC, MIDWATER TRAWLS, CANADABRITISH COLUMBIA/NORTHEAST PACIFIC, JIG, CANADA, OUTSIDE ROCKFISHBRITISH COLUMBIA/NORTHEAST PACIFIC, SET LONGLINES, CANADA, OUTSIDE ROCKFISHBRITISH COLUMBIA/NORTHEAST PACIFIC, TROLLING LINES, CANADA, OUTSIDE ROCKFISH
Moderate Concern
The trawl fishery is allocated 55.8% of the rougheye rockfish TAC (DFO 2013a). The 2012 catch of therougheye rockfish complex was approximately 75.3% of the total TAC; the trawl fishery was responsible forapproximately 63.7% of this catch, while the hook and line fisheries for sablefish, outside rockfish, and halibutaccounted for 16.1%, 10.5%, and 9.6%, respectively (Appendix C).
There is no stock assessment-based estimate of sustainable mortality for the rougheye rockfish complex. The2012 catch in the trawl fishery (640 t) is essentially the same as the 1976-2004 average catch in this fishery(646 t), while the 2012 catch in the non-trawl fisheries was approximately 58% of the mean annual catch innon-trawl fisheries during the 1996-2004 period. Recent catches, therefore, are not exceeding historicallevels. Fishing mortality of the rougheye rockfish complex is scored “moderate” concern.
Justification:
Annual trawl catches of the rougheye rockfish complex increased from a mean annual catch of 222 t/yearduring the 1976-1985 period to over 1,000 t/year during the late 1980s and early 1990s (Table 4 in (Haigh etal. 2005b)). Trawl catches reached a maximum of 1,891 t in 1993; the mean annual catch over the 1986-1995period was 1,164 t (Table 4 in (Haigh et al. 2005b)). Trawl catches declined to approximately 540 t/year from1996-2004 (Table 4 in (Haigh et al. 2005b)), but have increased somewhat in the years since (Figure 26).Since 2000, the trawl fishery’s catch of the rougheye rockfish complex has closely tracked the TAC available tothe trawl fishery, which generally increased from 2000-2008 (Figure 41).
Rougheye rockfish catches and TACs for the trawl fishery, 2000-2012. Data from Appendix C.
In 2012, the total catch of the rougheye rockfish complex was 1,004.4 t, and the total TAC was 1,334.7 t(Appendix C). The trawl fishery was responsible for approximately 63.7% of this catch, while the hook andline fisheries for sablefish, outside rockfish, and halibut accounted for 16.1%, 10.5%, and 9.6%, respectively
81

SABLEFISH
Factor 1.1 - Inherent Vulnerability
Factor 1.2 - Abundance
Factor 1.3 - Fishing Mortality
(Appendix C). The 2012 catch in the trawl fishery (640 t) is essentially the same as the 1976-2004 averagecatch in this fishery (646 t; Table 4 in (Haigh et al. 2005b)). The total catch in the non-trawl fisheries in 2012(364.4 t) was approximately 58% of the mean annual non-trawl catch during the period 1996-2004 (Table 2 in(COSEWIC 2007b)).
BRITISH COLUMBIA/NORTHEAST PACIFIC, LONGLINE (DEEP-SET), CANADABRITISH COLUMBIA/NORTHEAST PACIFIC, BOTTOM TRAWLS, CANADA, SOFT SUBSTRATEBRITISH COLUMBIA/NORTHEAST PACIFIC, SET LONGLINES, CANADA, OUTSIDE ROCKFISH
High
The Fishbase vulnerability score for sablefish is 49, but the species’ productivity rating in Cope et al. 2011 is1.61 (Table 1 in (Cope et al. 2011)). Sablefish inherent vulnerability is therefore scored "high".
BRITISH COLUMBIA/NORTHEAST PACIFIC, LONGLINE (DEEP-SET), CANADABRITISH COLUMBIA/NORTHEAST PACIFIC, BOTTOM TRAWLS, CANADA, SOFT SUBSTRATEBRITISH COLUMBIA/NORTHEAST PACIFIC, SET LONGLINES, CANADA, OUTSIDE ROCKFISH
Low Concern
In a recent assessment, sablefish biomass was estimated to be less than B , greater than the LRP, andpotentially above the USRP (DFO 2011d). The stock status of sablefish is therefore scored “low" concern.
MSY
BRITISH COLUMBIA/NORTHEAST PACIFIC, LONGLINE (DEEP-SET), CANADABRITISH COLUMBIA/NORTHEAST PACIFIC, BOTTOM TRAWLS, CANADA, SOFT SUBSTRATEBRITISH COLUMBIA/NORTHEAST PACIFIC, SET LONGLINES, CANADA, OUTSIDE ROCKFISH
Low Concern
The 2012 sablefish catch was 82.4% of available TAC. Sablefish were primarily caught in the directedsablefish fishery (84.2% of 2012 sablefish catch), with the trawl fishery (9.0%) and halibut fishery (5.0%)catching lesser amounts. Modeled sablefish harvest rates (U) have exceeded U in recent years, with themost recent year (2010) modeled to be very near U (Figure 42). However, the 2012 catch wasapproximately 83.1% of the annual catch level that was recently identified as being likely to be ≤USablefish fishing mortality is therefore scored “low” concern for the sablefish, trawl, and halibut fisheries.
MSY
MSY
MSY.
Justification:
In 2012, the total sablefish catch was 1,970.6 t, while the total TAC was 2,390.2 t (Appendix C). In a recentsablefish management evaluation, the average annual catch level associated with the chosen managementprocedure was 2,370 t (DFO 2011d). This catch level was found to have a high probability of maintainingharvest rates ≤U , even when several sources of uncertainty were taken into account.
The 2012 catch was primarily taken in the sablefish fishery (1,660.4 t), with the trawl fishery (177.4 t) andhalibut fishery (100.4 t) also catching substantial amounts (Appendix C).
MSY
82

SHORTRAKER ROCKFISH
Factor 1.1 - Inherent Vulnerability
Factor 1.2 - Abundance
Four modeled estimates of sablefish B:BMSY and U:UMSY, with lighter shading being earlier years, darker shading representing later years, and the most recent modeled year (2010) represented by crosshairs. Figure from (DFO 2011d).
BRITISH COLUMBIA/NORTHEAST PACIFIC, BOTTOM TRAWLS, CANADA, HARD SUBSTRATEBRITISH COLUMBIA/NORTHEAST PACIFIC, LONGLINE (DEEP-SET), CANADABRITISH COLUMBIA/NORTHEAST PACIFIC, MIDWATER TRAWLS, CANADABRITISH COLUMBIA/NORTHEAST PACIFIC, JIG, CANADA, OUTSIDE ROCKFISHBRITISH COLUMBIA/NORTHEAST PACIFIC, SET LONGLINES, CANADA, OUTSIDE ROCKFISHBRITISH COLUMBIA/NORTHEAST PACIFIC, TROLLING LINES, CANADA, OUTSIDE ROCKFISH
High
The Fishbase vulnerability score for shortraker rockfish is 71. The species’ productivity rating in Cope et al.2011 is 1.22 (Table 1 in (Cope et al. 2011)). Shortraker rockfish inherent vulnerability is therefore scored"high".
83
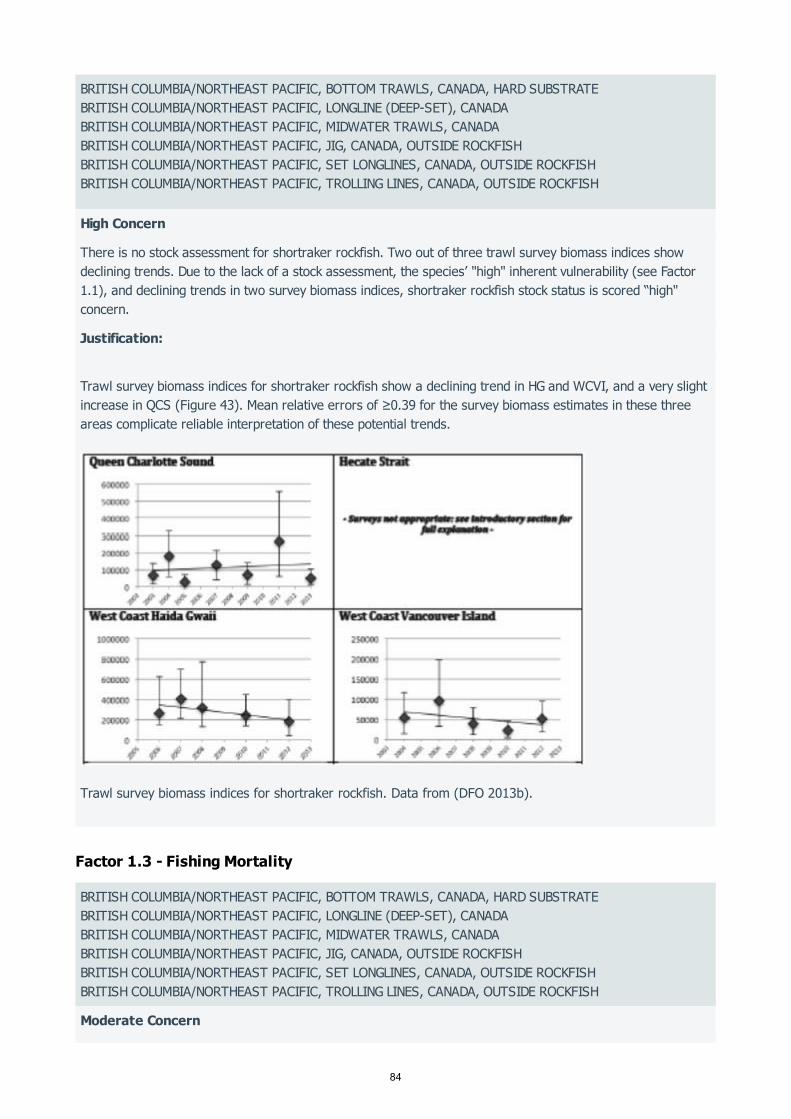
Factor 1.3 - Fishing Mortality
BRITISH COLUMBIA/NORTHEAST PACIFIC, BOTTOM TRAWLS, CANADA, HARD SUBSTRATEBRITISH COLUMBIA/NORTHEAST PACIFIC, LONGLINE (DEEP-SET), CANADABRITISH COLUMBIA/NORTHEAST PACIFIC, MIDWATER TRAWLS, CANADABRITISH COLUMBIA/NORTHEAST PACIFIC, JIG, CANADA, OUTSIDE ROCKFISHBRITISH COLUMBIA/NORTHEAST PACIFIC, SET LONGLINES, CANADA, OUTSIDE ROCKFISHBRITISH COLUMBIA/NORTHEAST PACIFIC, TROLLING LINES, CANADA, OUTSIDE ROCKFISH
High Concern
There is no stock assessment for shortraker rockfish. Two out of three trawl survey biomass indices showdeclining trends. Due to the lack of a stock assessment, the species’ "high" inherent vulnerability (see Factor1.1), and declining trends in two survey biomass indices, shortraker rockfish stock status is scored “high"concern.
Justification:
Trawl survey biomass indices for shortraker rockfish show a declining trend in HG and WCVI, and a very slightincrease in QCS (Figure 43). Mean relative errors of ≥0.39 for the survey biomass estimates in these threeareas complicate reliable interpretation of these potential trends.
Trawl survey biomass indices for shortraker rockfish. Data from (DFO 2013b).
BRITISH COLUMBIA/NORTHEAST PACIFIC, BOTTOM TRAWLS, CANADA, HARD SUBSTRATEBRITISH COLUMBIA/NORTHEAST PACIFIC, LONGLINE (DEEP-SET), CANADABRITISH COLUMBIA/NORTHEAST PACIFIC, MIDWATER TRAWLS, CANADABRITISH COLUMBIA/NORTHEAST PACIFIC, JIG, CANADA, OUTSIDE ROCKFISHBRITISH COLUMBIA/NORTHEAST PACIFIC, SET LONGLINES, CANADA, OUTSIDE ROCKFISHBRITISH COLUMBIA/NORTHEAST PACIFIC, TROLLING LINES, CANADA, OUTSIDE ROCKFISH
Moderate Concern
84
SHORTSPINE THORNYHEAD
Factor 1.1 - Inherent Vulnerability
Factor 1.2 - Abundance
There is no stock assessment-based estimate of sustainable fishing mortality for the shortraker rockfish stock.The 2012 catch was approximately 44.9% of the TAC, and was caught in the trawl fishery (28.1% of totalcatch) and the fisheries for sablefish (43.3%), halibut (20.9%), and outside rockfish (7.6%). The 2012 catchwas the most since at least 2007. Due to the lack of an assessment-based estimate of sustainable mortalityand the fact that the 2012 catch was not insignificant relative to recent levels, the fishing mortality ofshortraker rockfish is scored “moderate" concern.
Justification:
Annual catches of shortraker rockfish by the domestic trawl fishery were <60 t until 1990 (Table 2.6.8 in(Schnute et al. 1999)). Catches substantially increased during the early 1990s, reached a maximum of 549 t in1994, and declined thereafter to 56 t in 1997 (Table 2.6.8 in (Schnute et al. 1999)). Total catches of shortrakerrockfish have increased in recent years, from approximately 71 t in 2007 to nearly 137 t in 2012; total TACshave remained relatively steady during this period (Appendix C). The increased total catch has largely beendriven by increased catch in the sablefish fishery (Appendix C). No fishery-specific TACs were exceeded duringthe 2007-2012 period (Appendix C).
In 2012, the total catch of shortraker rockfish was approximately 136.9 t, while the total TAC was 305.0 t(Appendix C). Shortraker catch was primarily taken in the fisheries for sablefish (43.3% of total shortrakerrockfish catch), halibut (20.9%), and outside rockfish (7.6%), and the trawl fishery (28.1%) (Appendix C). The2012 catch was the highest of the 2007-2012 period (Appendix B).
BRITISH COLUMBIA/NORTHEAST PACIFIC, BOTTOM TRAWLS, CANADA, SOFT SUBSTRATE
High
The Fishbase vulnerability score for shortspine thornyhead is 70. The species’ productivity rating in Cope et al.2011 is 1.33 (Table 1 in (Cope et al. 2011)). Shortspine thornyhead are therefore scored "high" for inherentvulnerability.
BRITISH COLUMBIA/NORTHEAST PACIFIC, BOTTOM TRAWLS, CANADA, SOFT SUBSTRATE
High Concern
There is no stock assessment for shortspine thornyhead. Trawl survey biomass indices do not indicate aconsistent coastwide trend, as the trends in the two survey areas that yield the highest estimates areessentially flat in QCS and a decline in WCHG (Figure 44). Shortspine thornyhead stock status is scored "high"concern due to its "high" inherent vulnerability and unknown stock status.
Justification:
85

Factor 1.3 - Fishing Mortality
Trawl survey biomass indices for shortspine thornyhead. Data from (DFO 2013b).
BRITISH COLUMBIA/NORTHEAST PACIFIC, BOTTOM TRAWLS, CANADA, SOFT SUBSTRATE
Moderate Concern
There is no stock assessment-based estimate of sustainable mortality for shortspine thornyhead. In 2012, thecatch of shortspine thornyhead was approximately 73.2% of total TAC. The trawl fishery accounted for 88.8%of the 2012 catch. The 2012 catch in the trawl fishery was the highest since 2002 and is comparable to someof the higher historical catches. Due to the lack of a stock assessment-based estimate of sustainable mortalityand the relatively high 2012 catch, fishing mortality of shortspine thornyhead is scored "moderate" concern.
Justification:
Domestic landings of shortspine thornyhead in the trawl fishery were essentially nil until the early 1980s (DFO1999b). Catches in this fishery increased rapidly during the early 1990s (DFO 1999b).
In 2012, the total catch of shortspine thornyhead was 721.1 t, while the total TAC was 984.5 t (Appendix C).Catch in the trawl fishery accounted for 659.8 t, with the sablefish (35.9 t) and halibut (22.3 t) fisheriescontributing lesser amounts (Appendix C). Shortspine thornyhead catches have been well below the TAC sinceat least 2007, but the catch in the 2012 trawl fishery represented an increase from recent years (Figure 45)and was the highest trawl catch since 2002 (DFO 2013c). The 2012 trawl catch was similar to the third-highest single-year catch for the 1967-1998 period (DFO 1999b).
86

SILVERGRAY ROCKFISH
Factor 1.1 - Inherent Vulnerability
Factor 1.2 - Abundance
Shortspine thornyhead catches and TACs, 2007-2012. Data from (DFO 2013b)(DFO 2013c).
BRITISH COLUMBIA/NORTHEAST PACIFIC, BOTTOM TRAWLS, CANADA, HARD SUBSTRATEBRITISH COLUMBIA/NORTHEAST PACIFIC, MIDWATER TRAWLS, CANADA
High
The Fishbase vulnerability score for silvergray rockfish is 68, and the species’ productivity rating in Cope et al.2011 is 1.22 (Table 1 in (Cope et al. 2011)). Silvergray rockfish therefore have "high" inherent vulnerability.
BRITISH COLUMBIA/NORTHEAST PACIFIC, BOTTOM TRAWLS, CANADA, HARD SUBSTRATEBRITISH COLUMBIA/NORTHEAST PACIFIC, MIDWATER TRAWLS, CANADA
Very Low Concern
Since 1940, silvergray rockfish spawning biomass has not been less than the USRP, and SB is estimated tobe well above SB . Silvergray rockfish stock status is therefore scored “very low" concern.
2014
MSY
Justification:
Silvergray rockfish spawning biomass declined from the late 1960s through the end of the 1980s, but hasremained relatively stable in the years since (Figure 30) (Starr et al. 2013). In the recent assessment,SB :SB is estimated to be 0.559 (5-95% range = 0.405-0.698; (Starr et al. 2013)). Silvergray rockfishSB :SB is 2.035 (1.223-2.997), and spawning biomass has not been less than the USRP point since1940 (Figure 46) (Starr et al. 2013).
2014 0
2014 MSY
87

Factor 1.3 - Fishing Mortality
Posterior median estimates of silvergray rockfish spawning biomass, and 80% credibility intervals, relative to posterior median estimates and 80% credibility intervals for the USRP and the LRP. Figure from (Starr et al. 2013).
BRITISH COLUMBIA/NORTHEAST PACIFIC, BOTTOM TRAWLS, CANADA, HARD SUBSTRATEBRITISH COLUMBIA/NORTHEAST PACIFIC, MIDWATER TRAWLS, CANADA
Very Low Concern
The trawl fishery is allocated 88.43% of the silvergray rockfish TAC for 2013, and the ZN hook and line fisheryis allocated 10.97% (DFO 2013a).Catches of silvergray rockfish have closely tracked available TAC in recentyears, and in 2012, the catch of silvergray rockfish in the trawl fishery was approximately 90.1% of theavailable trawl TAC. The estimated exploitation rate for silvergray rockfish in 2013 was approximately 30% ofthe exploitation rate associated with MSY. Recent catch levels, when projected into the next decade, have avery low probability of resulting in sub-target stock status. For these reasons, fishing mortality of silvergrayrockfish is scored “very low" concern.
Justification:
The silvergray rockfish exploitation rate in 2013 was 0.044 (5-95% range = 0.030-0.068), while theexploitation rate associated with MSY was estimated to be 0.145 (0.064-0.300) (Table 3 in (Starr et al.2013)).
Silvergray rockfish catches in the trawl fishery have closely tracked available TAC in recent years (Figure 47),with an average of 88% of available trawl TAC caught each year during the period 2000-2012 (Appendix C).The average catch of silvergray rockfish during the period 2008-2012 was 1,408 t, with the trawl fisheryresponsible for approximately 96% of annual catches during this period (Starr et al. 2013).
88
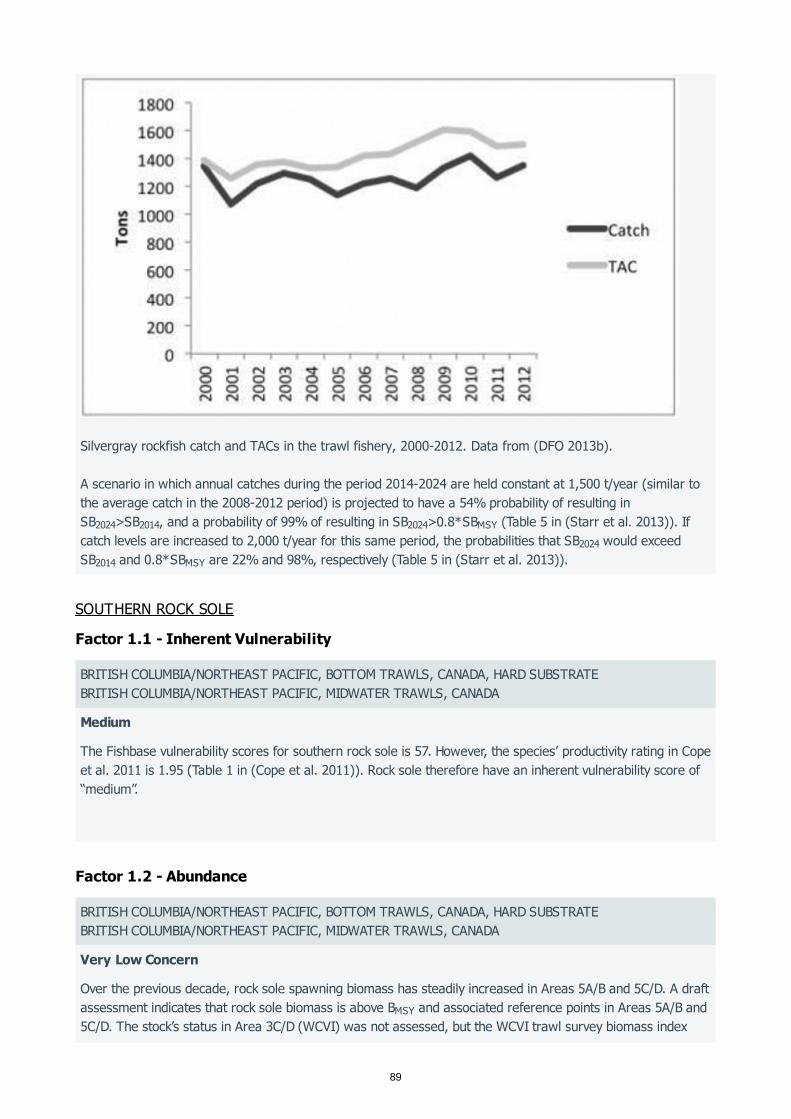
SOUTHERN ROCK SOLE
Factor 1.1 - Inherent Vulnerability
Factor 1.2 - Abundance
Silvergray rockfish catch and TACs in the trawl fishery, 2000-2012. Data from (DFO 2013b).
A scenario in which annual catches during the period 2014-2024 are held constant at 1,500 t/year (similar tothe average catch in the 2008-2012 period) is projected to have a 54% probability of resulting inSB >SB , and a probability of 99% of resulting in SB >0.8*SB (Table 5 in (Starr et al. 2013)). Ifcatch levels are increased to 2,000 t/year for this same period, the probabilities that SB would exceedSB and 0.8*SB are 22% and 98%, respectively (Table 5 in (Starr et al. 2013)).
2024 2014 2024 MSY
2024
2014 MSY
BRITISH COLUMBIA/NORTHEAST PACIFIC, BOTTOM TRAWLS, CANADA, HARD SUBSTRATEBRITISH COLUMBIA/NORTHEAST PACIFIC, MIDWATER TRAWLS, CANADA
Medium
The Fishbase vulnerability scores for southern rock sole is 57. However, the species’ productivity rating in Copeet al. 2011 is 1.95 (Table 1 in (Cope et al. 2011)). Rock sole therefore have an inherent vulnerability score of“medium”.
BRITISH COLUMBIA/NORTHEAST PACIFIC, BOTTOM TRAWLS, CANADA, HARD SUBSTRATEBRITISH COLUMBIA/NORTHEAST PACIFIC, MIDWATER TRAWLS, CANADA
Very Low Concern
Over the previous decade, rock sole spawning biomass has steadily increased in Areas 5A/B and 5C/D. A draftassessment indicates that rock sole biomass is above B and associated reference points in Areas 5A/B and5C/D. The stock’s status in Area 3C/D (WCVI) was not assessed, but the WCVI trawl survey biomass index
MSY
89
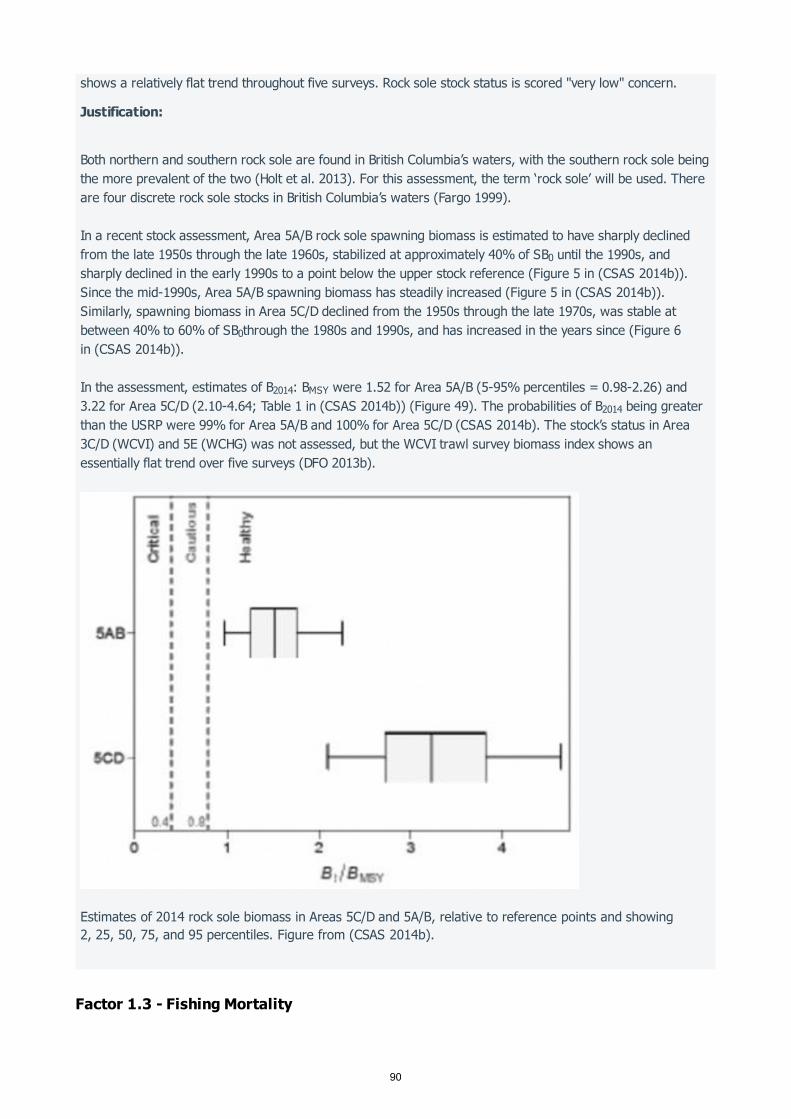
Factor 1.3 - Fishing Mortality
shows a relatively flat trend throughout five surveys. Rock sole stock status is scored "very low" concern.
Justification:
Both northern and southern rock sole are found in British Columbia’s waters, with the southern rock sole beingthe more prevalent of the two (Holt et al. 2013). For this assessment, the term ‘rock sole’ will be used. Thereare four discrete rock sole stocks in British Columbia’s waters (Fargo 1999).
In a recent stock assessment, Area 5A/B rock sole spawning biomass is estimated to have sharply declinedfrom the late 1950s through the late 1960s, stabilized at approximately 40% of SB until the 1990s, andsharply declined in the early 1990s to a point below the upper stock reference (Figure 5 in (CSAS 2014b)).Since the mid-1990s, Area 5A/B spawning biomass has steadily increased (Figure 5 in (CSAS 2014b)).Similarly, spawning biomass in Area 5C/D declined from the 1950s through the late 1970s, was stable atbetween 40% to 60% of SB through the 1980s and 1990s, and has increased in the years since (Figure 6in (CSAS 2014b)).
In the assessment, estimates of B : B were 1.52 for Area 5A/B (5-95% percentiles = 0.98-2.26) and3.22 for Area 5C/D (2.10-4.64; Table 1 in (CSAS 2014b)) (Figure 49). The probabilities of B being greaterthan the USRP were 99% for Area 5A/B and 100% for Area 5C/D (CSAS 2014b). The stock’s status in Area3C/D (WCVI) and 5E (WCHG) was not assessed, but the WCVI trawl survey biomass index shows anessentially flat trend over five surveys (DFO 2013b).
Estimates of 2014 rock sole biomass in Areas 5C/D and 5A/B, relative to reference points and showing 2, 25, 50, 75, and 95 percentiles. Figure from (CSAS 2014b).
0
0
2014 MSY
2014
90

SPINY DOGFISH
Factor 1.1 - Inherent Vulnerability
Factor 1.2 - Abundance
BRITISH COLUMBIA/NORTHEAST PACIFIC, BOTTOM TRAWLS, CANADA, HARD SUBSTRATEBRITISH COLUMBIA/NORTHEAST PACIFIC, MIDWATER TRAWLS, CANADA
Very Low Concern
The trawl fishery is allocated 100% of rock sole coastwide TAC (DFO 2013a). In 2012, the catches of rock solein the two most important regions (Areas 5A/B and Areas 5C/D) were 43.3% and 60.5% of their respectiveTACs. For 2013, exploitation rates for Areas 5A/B and 5C/D were less than the exploitation rates associatedwith MSY. Due to the low catch relative to TACs and the analysis of recent exploitation presented in the up-to-date stock assessment, fishing mortality of rock sole is scored "very low" concern.
Justification:
Rock sole catches have generally declined since 2000, and have not exceeded any area-specific TACs duringthe 2000-2012 period (Appendix C). In 2012, the coastwide catch of rock sole in the trawl fishery was 872.9 t(Appendix C). Approximately 58.0% of this catch was taken in Areas 5C/D, 39.2% in Areas 5A/B, and 2.9% inAreas 3C/D (Appendix C).For Area 5A/B, the estimated exploitation rate for 2013 was 46.3% of the exploitation rate associated withMSY (5-95 percentiles = 29.9-72.4%; Table 1 in (CSAS 2014b)). For Area 5C/D, this ratio was 7.7% (3.7-16.3%; Table 1 in (CSAS 2014b)).
BRITISH COLUMBIA/NORTHEAST PACIFIC, LONGLINE (SHALLOW-SET), CANADA
High
The Fishbase vulnerability score for S. acanthias is 69. The species’ productivity rating in Cope et al. 2011 is1.11 (Table 1 in (Cope et al. 2011)). Spiny dogfish inherent vulnerability is therefore scored "high".
BRITISH COLUMBIA/NORTHEAST PACIFIC, LONGLINE (SHALLOW-SET), CANADA
Moderate Concern
North Pacific dogfish have been assessed by multiple bodies. The IUCN assessed the stock in 2006 and havesince listed it as ‘vulnerable.’ This finding is disregarded here as more recent assessments are available. Themost recent stock assessment was in 2010, and concluded 'that there is no immediate conservation concernfor either the inside or outside stocks of Pacific spiny dogfish and that, given the perceptions of the currentstock status, it is unlikely that deleterious or irreversible declines in stock abundance are likely to occur overthe five year time frame established for the next assessment at the current (2000-2009) level ofremovals" (CSAS 2010). More recently, COSEWIC found the stocks to be ‘relatively abundant in BC waters’and that the population did not meet any of the criteria for listing, but that concerns exist because of thebiology of the species and the level of uncertainty and so deemed the population a “SpecialConcern” (COSEWIC 2011). The stock status of spiny dogfish is scored ’moderate’ concern due to theuncertainties regarding stock status and the species' COSEWIC status.
Justification:
91

Factor 1.3 - Fishing Mortality
North Pacific dogfish have been assessed by multiple bodies. The IUCN assessed the stock in 2006 and havesince listed it as ‘vulnerable.’ In 2010, the Canadian stock assessment did not yield reliable estimates of thestock's status, but the assessment’s authors concluded that “there is no immediate conservation concern foreither the inside or outside stocks of Pacific spiny dogfish and that, given the perceptions of the current stockstatus, it is unlikely that deleterious or irreversible declines in stock abundance are likely to occur over thefive-year time frame established for the next assessment at the current (2000-2009) level of removals” (CSAS2010). In 2011/2012, the COSEWIC assessment found that the population did not meet any of the criteria forlisting, but concerns exist because of the biology of the species and the level of uncertainty. For these reasons,COSEWIC listed the stock as ”Special Concern.” (Appendix D) (COSEWIC 2011). Spiny dogfish were recentlyassessed by COSEWIC to be a "Special Concern," and spiny dogfish in the Northeast Pacific are classified as"Vulnerable" by the IUCN (Appendix D). One potential issue noted in the 2010 stock assessment is a potentialshift in size distributions of males and females in the inside stock. For this stock, the modal length interval formales caught in longline research surveys declined between the 1980s and the early 2000s (CSAS 2010). Forinside females, a shift in size distribution over the same period was apparent in a reduction in the number oflarge (>100 cm) females, and an increase in smaller individuals (CSAS 2010). The decline in mean size mayhave been due, in part, to a movement of juvenile dogfish to the seafloor (CSAS 2010).
BRITISH COLUMBIA/NORTHEAST PACIFIC, LONGLINE (SHALLOW-SET), CANADA
Low Concern
The 2012 catches of inside and outside dogfish were approximately 9.8% and 5.7% of the total available TAC,respectively. The dogfish hook and line fishery was responsible for 83.5% and 48.7% of the catch of insideand outside dogfish, respectively, while the trawl fishery (16.1% and 11.4% of the inside and outside catches,respectively), halibut fishery (29.8% of outside dogfish catch), and outside rockfish fishery (6.9% of outsidedogfish catch) also accounted for substantial catches. Recent catches of both inside and outside dogfish havebeen low, relative to recent levels, and the recent stock assessment considered it "unlikely" that deleterious orirreversible declines in abundance were to occur over the period 2010-2015 (CSAS 2010). However, there areno model-derived estimates of sustainable yield, and total fishing mortality has likely beenunderestimated (CSAS 2010). Fishing mortality of spiny dogfish is therefore scored "low" concern for theaforementioned fisheries.
Justification:
A period of very high exploitation occurred from the late 1930s through the 1940s (Figure 49), as B.C. dogfishwere targeted due to the use of their livers in the procurement of Vitamin A. After the ‘liver’ fishery ended,dogfish became the target of a food fishery in the late 1970s (Galluci et al. 2011).
92

Estimated historical fishing mortality of inside (top) and outside (bottom) stocks of spiny dogfish. Figure from (Galluci et al. 2011).
In 2012, the total catches of inside and outside dogfish were approximately 200 and 699 t, respectively, whilethe total available TACs for inside and outside dogfish were 2,044 and 12,358 t, respectively (Appendix C).Catches of both dogfish stocks have declined since 2009 (Figures 50 and 51). In 2012, the directed dogfishhook and line fishery was responsible for 83.5% and 48.7% of the catch of inside and outside dogfish,respectively (Appendix C). The trawl fishery caught 16.1% and 11.4% of the inside and outside catches,respectively, and the halibut and outside rockfish fisheries accounted for 29.8% and 6.9% of outside dogfishcatch, respectively (Appendix C).
93

TIGER ROCKFISH
Factor 1.1 - Inherent Vulnerability
Inside (Area 4B) dogfish TACs (black line) and catches by fishery (shaded areas), 2007-2012. Data from (DFO 2013b)(DFO 2013d).
Outside (Area 3C, 3D, 5A/B, 5C/D/E) dogfish TACs (black line) and catches by fishery (shaded areas), 2007-2012. Data from (DFO 2013b)(DFO 2013d).
BRITISH COLUMBIA/NORTHEAST PACIFIC, JIG, CANADA, INSIDE ROCKFISHBRITISH COLUMBIA/NORTHEAST PACIFIC, JIG, CANADA, OUTSIDE ROCKFISHBRITISH COLUMBIA/NORTHEAST PACIFIC, SET LONGLINES, CANADA, OUTSIDE ROCKFISHBRITISH COLUMBIA/NORTHEAST PACIFIC, TROLLING LINES, CANADA, OUTSIDE ROCKFISHBRITISH COLUMBIA/NORTHEAST PACIFIC, TROLLING LINES, CANADA, INSIDE ROCKFISH
High
The Fishbase vulnerability score for tiger rockfish is 71. The species’ productivity rating in Table 1 of (Cope etal. 2011) is 1.25, which likewise indicates “high" inherent vulnerability.
94

Factor 1.2 - Abundance
Factor 1.3 - Fishing Mortality
BRITISH COLUMBIA/NORTHEAST PACIFIC, JIG, CANADA, INSIDE ROCKFISHBRITISH COLUMBIA/NORTHEAST PACIFIC, JIG, CANADA, OUTSIDE ROCKFISHBRITISH COLUMBIA/NORTHEAST PACIFIC, SET LONGLINES, CANADA, OUTSIDE ROCKFISHBRITISH COLUMBIA/NORTHEAST PACIFIC, TROLLING LINES, CANADA, OUTSIDE ROCKFISHBRITISH COLUMBIA/NORTHEAST PACIFIC, TROLLING LINES, CANADA, INSIDE ROCKFISH
High Concern
There is no up-to-date stock assessment for tiger rockfish. In light of this species' high inherentvulnerability, stock status is scored "high" concern.
BRITISH COLUMBIA/NORTHEAST PACIFIC, JIG, CANADA, INSIDE ROCKFISHBRITISH COLUMBIA/NORTHEAST PACIFIC, JIG, CANADA, OUTSIDE ROCKFISHBRITISH COLUMBIA/NORTHEAST PACIFIC, SET LONGLINES, CANADA, OUTSIDE ROCKFISHBRITISH COLUMBIA/NORTHEAST PACIFIC, TROLLING LINES, CANADA, OUTSIDE ROCKFISHBRITISH COLUMBIA/NORTHEAST PACIFIC, TROLLING LINES, CANADA, INSIDE ROCKFISH
Moderate Concern
There are no estimates of sustainable mortality for China, copper, or tiger rockfish. However, theestablishment of Rockfish Conservation Areas (RCAs) has set aside substantial amounts of habitat for thesespecies. Fishing mortality is scored “moderate” concern for the china, copper, and tiger rockfish in the halibutand outside rockfish fisheries, and for tiger rockfish catch in the inside rockfish fishery.
Justification:
Note: Quillback, copper, china, and tiger (QCCT) rockfish are managed with one TAC. Mortality of QCCTrockfish is discussed here as one unit, but quillback mortality is addressed in more specific terms in thedetailed rationale for that species. The following information informs fishing mortality scores for copper, china,and tiger rockfish.
In 2012, the total catch of QCCT rockfish was 183.8 t, while the total TAC was 257.2 t (Appendix A). Linefisheries dominated the catch of QCCT species; the trawl fishery was responsible for relatively little QCCTcatch (Figure 52). The halibut and outside rockfish fisheries were the primary fisheries for all four QCCTspecies in 2012, and the inside rockfish fishery was responsible for substantial proportions of quillback andtiger rockfish catches (Figure 7).
The 2012 catch can be broken down by catch taken from inside (Area 4B) and outside (remaining areas)waters. The inside rockfish fishery accounted for 96.3% of the 2012 QCCT rockfish catch in inside waters, butzero percent of the outside catch (DFO 2013d). Conversely, catch of QCCT rockfish in outside waters wasdominated by the outside rockfish fishery (69.5% of outside QCCT catch) and the halibut fishery (25.8%) (DFO2013d).
Area-specific TACs have been exceeded by some fisheries during recent years. In particular, the halibut fisheryexceeded its inside (Area 4B) TAC each year from 2009-2012, and the dogfish fishery exceeded numerousarea-specific TACs during this same period (DFO 2013d). In 2012, the lingcod fishery slightly exceeded itsArea 5B TAC (DFO 2013d).
95

WIDOW ROCKFISH
Factor 1.1 - Inherent Vulnerability
Factor 1.2 - Abundance
Factor 1.3 - Fishing Mortality
Total catch of QCCT rockfish in 2012 groundfish fisheries (DFO Pacific Region 2013).
BRITISH COLUMBIA/NORTHEAST PACIFIC, BOTTOM TRAWLS, CANADA, HARD SUBSTRATEBRITISH COLUMBIA/NORTHEAST PACIFIC, MIDWATER TRAWLS, CANADA
High
The Fishbase vulnerability score for widow rockfish is 65. The species’ productivity rating in Cope et al. 2011is 1.31 (Table 1 in (Cope et al. 2011)). Widow rockfish therefore have "high" inherent vulnerability.
BRITISH COLUMBIA/NORTHEAST PACIFIC, BOTTOM TRAWLS, CANADA, HARD SUBSTRATEBRITISH COLUMBIA/NORTHEAST PACIFIC, MIDWATER TRAWLS, CANADA
High Concern
There is no recent stock assessment for widow rockfish. Due to their semi-pelagic nature, widow rockfish maynot be well-sampled by the trawl surveys (P. Starr, pers. comm.), and as such the survey abundance indicesare not used here. Due to the lack of a stock assessment and the species’ “high" inherent vulnerability, widowrockfish stock status is scored “high" concern.
BRITISH COLUMBIA/NORTHEAST PACIFIC, BOTTOM TRAWLS, CANADA, HARD SUBSTRATEBRITISH COLUMBIA/NORTHEAST PACIFIC, MIDWATER TRAWLS, CANADA
Moderate Concern
96

YELLOWEYE ROCKFISH
Factor 1.1 - Inherent Vulnerability
Factor 1.2 - Abundance
In the 2013 IFMP, the trawl fishery is allocated 98.21% of widow rockfish TAC (DFO 2013a).Widow rockfishlandings (excluding discards) reached a maximum of over 4,000 t in the early 1990s, and catches haveaveraged approximately 1,843 t since 2000. The 2012 catch of widow rockfish in the trawl fishery wasapproximately 67.3% of the available TAC. There is no stock assessment-based estimate of sustainablemortality for widow rockfish, but at the time of the last stock status review in 1999 (DFO 1999c), fishingmortality was thought to be “close to maximum exploitation”. Fishing mortality of widow rockfish is thereforescored “moderate" for the trawl fishery.
Justification:
Widow rockfish landings in B.C. were minimal until the start of a commercial trawl fishery in the mid-1980s,whereupon landings increased rapidly to a maximum of over 4,000 t/y in the early 1990s (DFO 1999c). Since2000, annual catches of widow rockfish have fluctuated between approximately 1,270 t and 2,350 t; there isno apparent trend in the catches, and widow rockfish TACs have remained steady at 2,747 t – 3,076 tthroughout this period (Appendix C). Catches did not exceed TACs during the 2000-2012 period (Appendix C).The 2012 catch of widow rockfish was 1,932 t, while the TAC was 2,871 t (Appendix C). The 2012 catch wasslightly greater than the 2000-2012 average (1,843 t; Appendix C).At the time of the 1999 stock status report, the stock was considered to be "probably close to maximumexploitation" at 1,137 t caught in 1997 (DFO 1999c).
BRITISH COLUMBIA/NORTHEAST PACIFIC, JIG, CANADA, INSIDE ROCKFISHBRITISH COLUMBIA/NORTHEAST PACIFIC, JIG, CANADA, OUTSIDE ROCKFISHBRITISH COLUMBIA/NORTHEAST PACIFIC, LONGLINE (DEEP-SET), CANADABRITISH COLUMBIA/NORTHEAST PACIFIC, LONGLINE (SHALLOW-SET), CANADABRITISH COLUMBIA/NORTHEAST PACIFIC, SET LONGLINES, CANADA, OUTSIDE ROCKFISHBRITISH COLUMBIA/NORTHEAST PACIFIC, TROLLING LINES, CANADA, INSIDE ROCKFISHBRITISH COLUMBIA/NORTHEAST PACIFIC, TROLLING LINES, CANADA, OUTSIDE ROCKFISH
High
The Fishbase vulnerability score for yelloweye rockfish is 73, and their productivity rating in Cope et al. 2011 is1.22 (Table 1 in (Cope et al. 2011)). Yelloweye rockfish therefore have “high" inherent vulnerability.
BRITISH COLUMBIA/NORTHEAST PACIFIC, JIG, CANADA, INSIDE ROCKFISHBRITISH COLUMBIA/NORTHEAST PACIFIC, LONGLINE (SHALLOW-SET), CANADABRITISH COLUMBIA/NORTHEAST PACIFIC, TROLLING LINES, CANADA, INSIDE ROCKFISH
High Concern
A recent assessment of the “inside” yelloweye rockfish population estimated a 90% probability that B wasless than the LRP (DFO 2011b); the median biomass estimate and associated confidence intervals are shownalong with the LRP and URSP in Figure 54. The inside population has been assessed as "special concern" byCOSEWIC (COSEWIC 2008), and yelloweye rockfish are listed as "Special Concern" under SARA (CanadaGazette 2011b) (Appendix D). Stock status is scored “high" concern for the “inside” population.
2009
Justification:
97

Reference case median estimate for "inside" yelloweye rockfish biomass in 2009, and associated 90% confidence intervals, with the LRP and USRP represented as dashed lines. Figure from (DFO 2011b).
BRITISH COLUMBIA/NORTHEAST PACIFIC, JIG, CANADA, OUTSIDE ROCKFISHBRITISH COLUMBIA/NORTHEAST PACIFIC, LONGLINE (DEEP-SET), CANADABRITISH COLUMBIA/NORTHEAST PACIFIC, SET LONGLINES, CANADA, OUTSIDE ROCKFISHBRITISH COLUMBIA/NORTHEAST PACIFIC, TROLLING LINES, CANADA, OUTSIDE ROCKFISH
High Concern
There is no recent stock assessment of the "outside" population. A review of information relating to “outside”yelloweye, including analyses of commercial fishery and survey CPUE data, was done in 2006 (Yamanaka et al.2006). The analyses of CPUE data did not reveal clear trends (Yamanaka et al. 2006). The outside stock hasbeen assessed as "special concern" by COSEWIC (COSEWIC 2008), and yelloweye rockfish are listed as"Special Concern" under SARA (Canada Gazette 2011b) (Appendix D). Trawl survey biomass indices in WCVIand HS show a flat trend, while there is a slight decline in the QCS index (Figure 56). Stock status is scored“high” concern for the “outside” population of yelloweye rockfish.
Justification:
98

Factor 1.3 - Fishing Mortality
Trawl survey biomass indices for yelloweye rockfish. Data from (DFO 2013b).
BRITISH COLUMBIA/NORTHEAST PACIFIC, JIG, CANADA, INSIDE ROCKFISHBRITISH COLUMBIA/NORTHEAST PACIFIC, LONGLINE (SHALLOW-SET), CANADABRITISH COLUMBIA/NORTHEAST PACIFIC, TROLLING LINES, CANADA, INSIDE ROCKFISH
Low Concern
Recent annual catches of “inside” rockfish have been steady at approximately 4.0 t/year, primarily caught bythe dogfish and inside rockfish fisheries. This level of mortality is projected to allow the stock’s biomass torebuild, with probabilities of attaining certain reference points that are similar to zero-harvest options.Therefore, the fishing mortality of inside rockfish is scored “low" concern for the dogfish and inside rockfishfisheries.
Justification:
Annual catches of both “inside” and “outside” populations of yelloweye rockfish were relatively steady andminimal for most of the 1950s, 1960s, and 1970s (Figure 55). Catches of both populations increased rapidlyduring the early 1980s, and remained high until the early to mid-1990s (Figure 55).
99

Historical catches of "outside" and "inside" populations of yelloweye rockfish, by gear type (solid line = hook and line, dash-dot = trawl, light dots = recreational fisheries). Figure from (Yamanaka et al. 2006).
Catches of “inside” yelloweye rockfish have been very steady since 2007, varying only between 3.440 and 4.73t over the 2007-2012 period (Appendix C). The 2012 catch of ‘”inside” yelloweye was 3.97 t, with the dogfish(2.14 t) and inside rockfish (1.60 t) fisheries accounting for approximately 94% of the total catch (AppendixC). The inside TAC was 6.30 t (Appendix C). In the recent assessment of the “inside” stock, annual catches of5 t are projected to allow “inside” yelloweye rockfish biomass to increase (Table 2 in (DFO 2011b)). Forreference, the probability that B will exceed the LRP after 20 years of zero harvest is only 4.8% greaterthan the probability that B >LRP after constant annual catches of 5 over the same period (Table 2 in (DFO2011b)).
2029
2029
BRITISH COLUMBIA/NORTHEAST PACIFIC, JIG, CANADA, OUTSIDE ROCKFISHBRITISH COLUMBIA/NORTHEAST PACIFIC, LONGLINE (DEEP-SET), CANADABRITISH COLUMBIA/NORTHEAST PACIFIC, SET LONGLINES, CANADA, OUTSIDE ROCKFISHBRITISH COLUMBIA/NORTHEAST PACIFIC, TROLLING LINES, CANADA, OUTSIDE ROCKFISH
Moderate Concern
The total catch of “outside” yelloweye rockfish in 2012 was 69.9% of the available TAC. The 2012 “outside”catch was primarily taken in the fisheries for halibut (55.7% of total “outside” yelloweye catch), outsiderockfish (27.9%), and sablefish (7.8%). There is no current, stock assessment-based estimate of sustainablemortality for the “outside” population. Recent catches are substantially lower than the maximum levels seenduring the 1980s and 1990s, but they are above the annual catch levels of the 1950s, 1960s, and 1970s.Fishing mortality of the “outside” population of yelloweye rockfish is scored "moderate" concern.
Justification:
Annual catches of both “inside” and “outside” populations of yelloweye rockfish were relatively steady andminimal for most of the 1950s, 1960s, and 1970s (Figure 33). Catches of both populations increased rapidlyduring the early 1980s, and remained high until the early to mid-1990s (Figure 55).
100

YELLOWMOUTH ROCKFISH
Factor 1.1 - Inherent Vulnerability
Factor 1.2 - Abundance
During the period 2007-2012, the commercial fisheries mean annual catch of “outside” yelloweye rockfish was225.1 t, while the mean annual TAC was 322.0 t (Appendix C). The 2012 commercial catch of “outside”yelloweye rockfish was approximately 244.2 t, and was primarily caught in the fisheries for halibut (55.7% oftotal outside yelloweye catch), outside rockfish (27.9%), and sablefish (7.8%) (Appendix C). The total 2012TAC for outside yelloweye rockfish was approximately 329.1 t, of which 322.1 t was allocated to the hook andline fisheries (Appendix C). The 2007-2012 mean annual catch is much less than the maximum catches of the1980s and 1990s, but is greater than the annual catches of the 1950s, 1960s, and 1970s (Figure 55).
BRITISH COLUMBIA/NORTHEAST PACIFIC, BOTTOM TRAWLS, CANADA, HARD SUBSTRATEBRITISH COLUMBIA/NORTHEAST PACIFIC, MIDWATER TRAWLS, CANADA
High
The Fishbase vulnerability score for yellowmouth rockfish is 63, and their productivity rating in Cope et al.2011 is 1.61 (Table 1 in (Cope et al. 2011)). Yellowmouth rockfish therefore have ”high” inherent vulnerabiity.
BRITISH COLUMBIA/NORTHEAST PACIFIC, BOTTOM TRAWLS, CANADA, HARD SUBSTRATEBRITISH COLUMBIA/NORTHEAST PACIFIC, MIDWATER TRAWLS, CANADA
Low Concern
Yellowmouth rockfish biomass sharply increased during the 1990s as a result of strong recruitment, but hassteadily declined since approximately 2000. Despite the decline, yellowmouth rockfish stock is considered to bein DFO’s “healthy zone”, as the recent stock and recovery potential assessment’s modeled estimates of SB :SB (2.62 and 1.90) are above the USRP (0.8*SB ). Yellowmouth rockfish have been assessedas "Threatened" by COSEWIC and are being considered for SARA designation. While the Seafood Watchcriteria require a stock status score of “very high" concern for a species that has been assessed as"threatened" by a national scientific body such as COSEWIC, it should be recognized that a new stockassessment, conducted since the COSEWIC designation, indicates that yellowmouth rockfish biomass is abovethe USRP, though there is considerable uncertainty. The rating of ‘low’ concern is based primarily on the stockassessment but with added precaution because fo the COSEWIC assessment.
2011
MSY MSY
Justification:
Yellowmouth rockfish have been assessed as "Threatened" by COSEWIC (Appendix D), and are beingconsidered for listing under SARA (DFO 2013a).
In a recent assessment of stock status and recovery potential, two stock assessment model runs (whichdiffered only in whether M was estimated or fixed) show similar patterns of increases and declines, relative tovirgin biomass, over the decades (Figures 57, 58). Declines in the 1960s and 1970s/1980s are attributed toheavy catches by foreign and domestic fleets, respectively, while the brief recovery in the early 1970s isattributed to cessation of foreign fishing and strong recruitment, and the substantial recovery in the 1990s isattributed to a “major recruitment event” (Edwards et al. 2012). The gains made during the 1990s recoverywere largely erased by a steady decline in the subsequent years, however, and the 2012 stock assessmentestimated that SB :SB was 0.614 (0.431-0.829) and 0.409 (0.289-0.547) for the ‘Estimate M’ and ‘Fix M’2011 0
101
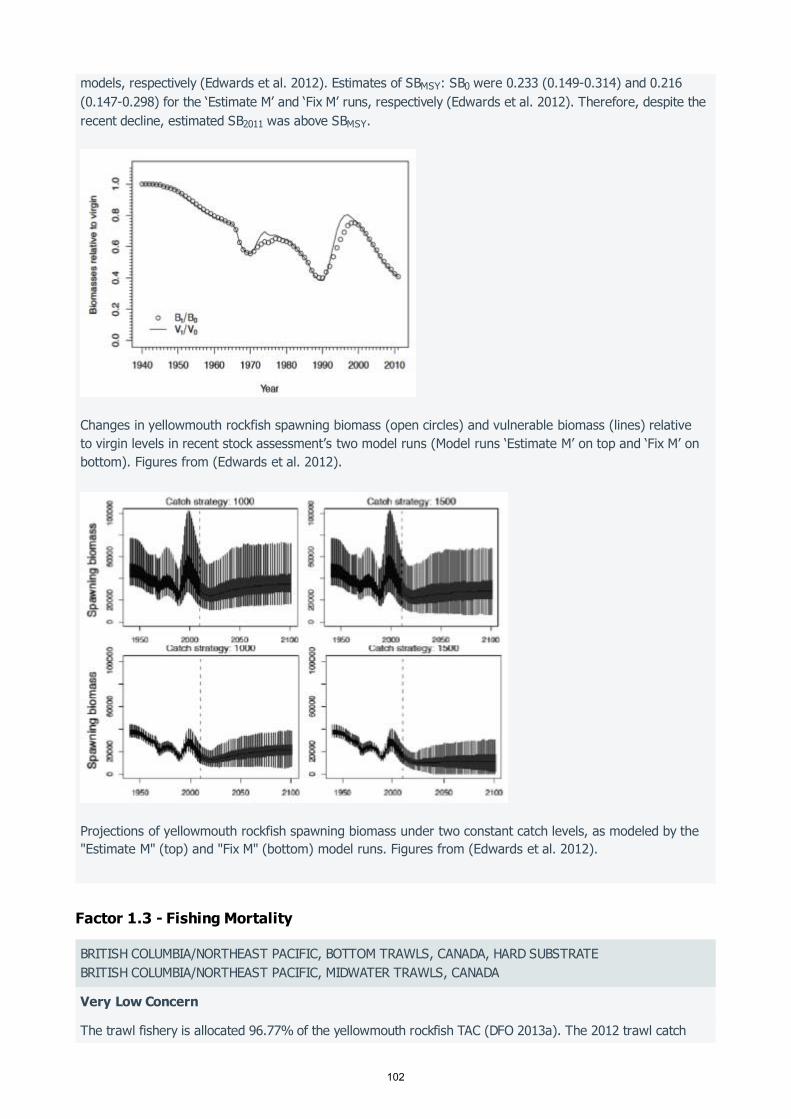
Factor 1.3 - Fishing Mortality
models, respectively (Edwards et al. 2012). Estimates of SB : SB were 0.233 (0.149-0.314) and 0.216(0.147-0.298) for the ‘Estimate M’ and ‘Fix M’ runs, respectively (Edwards et al. 2012). Therefore, despite therecent decline, estimated SB was above SB .
Changes in yellowmouth rockfish spawning biomass (open circles) and vulnerable biomass (lines) relative to virgin levels in recent stock assessment’s two model runs (Model runs ‘Estimate M’ on top and ‘Fix M’ on bottom). Figures from (Edwards et al. 2012).
Projections of yellowmouth rockfish spawning biomass under two constant catch levels, as modeled by the "Estimate M" (top) and "Fix M" (bottom) model runs. Figures from (Edwards et al. 2012).
MSY 0
2011 MSY
BRITISH COLUMBIA/NORTHEAST PACIFIC, BOTTOM TRAWLS, CANADA, HARD SUBSTRATEBRITISH COLUMBIA/NORTHEAST PACIFIC, MIDWATER TRAWLS, CANADA
Very Low Concern
The trawl fishery is allocated 96.77% of the yellowmouth rockfish TAC (DFO 2013a). The 2012 trawl catch
102
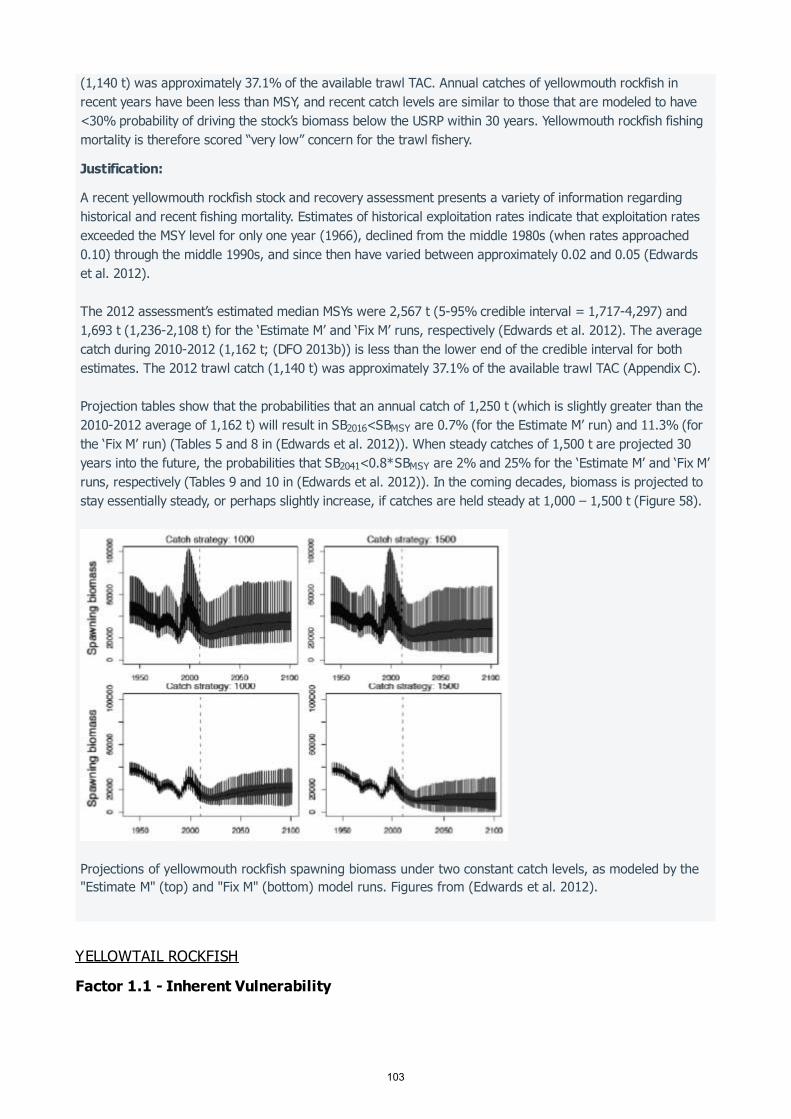
YELLOWTAIL ROCKFISH
Factor 1.1 - Inherent Vulnerability
(1,140 t) was approximately 37.1% of the available trawl TAC. Annual catches of yellowmouth rockfish inrecent years have been less than MSY, and recent catch levels are similar to those that are modeled to have<30% probability of driving the stock’s biomass below the USRP within 30 years. Yellowmouth rockfish fishingmortality is therefore scored “very low” concern for the trawl fishery.
Justification:
A recent yellowmouth rockfish stock and recovery assessment presents a variety of information regardinghistorical and recent fishing mortality. Estimates of historical exploitation rates indicate that exploitation ratesexceeded the MSY level for only one year (1966), declined from the middle 1980s (when rates approached0.10) through the middle 1990s, and since then have varied between approximately 0.02 and 0.05 (Edwardset al. 2012).
The 2012 assessment’s estimated median MSYs were 2,567 t (5-95% credible interval = 1,717-4,297) and1,693 t (1,236-2,108 t) for the ‘Estimate M’ and ‘Fix M’ runs, respectively (Edwards et al. 2012). The averagecatch during 2010-2012 (1,162 t; (DFO 2013b)) is less than the lower end of the credible interval for bothestimates. The 2012 trawl catch (1,140 t) was approximately 37.1% of the available trawl TAC (Appendix C).
Projection tables show that the probabilities that an annual catch of 1,250 t (which is slightly greater than the2010-2012 average of 1,162 t) will result in SB <SB are 0.7% (for the Estimate M’ run) and 11.3% (forthe ‘Fix M’ run) (Tables 5 and 8 in (Edwards et al. 2012)). When steady catches of 1,500 t are projected 30years into the future, the probabilities that SB <0.8*SB are 2% and 25% for the ‘Estimate M’ and ‘Fix M’runs, respectively (Tables 9 and 10 in (Edwards et al. 2012)). In the coming decades, biomass is projected tostay essentially steady, or perhaps slightly increase, if catches are held steady at 1,000 – 1,500 t (Figure 58).
Projections of yellowmouth rockfish spawning biomass under two constant catch levels, as modeled by the "Estimate M" (top) and "Fix M" (bottom) model runs. Figures from (Edwards et al. 2012).
2016 MSY
2041 MSY
103
Factor 1.2 - Abundance
BRITISH COLUMBIA/NORTHEAST PACIFIC, JIG, CANADA, INSIDE ROCKFISHBRITISH COLUMBIA/NORTHEAST PACIFIC, BOTTOM TRAWLS, CANADA, HARD SUBSTRATEBRITISH COLUMBIA/NORTHEAST PACIFIC, MIDWATER TRAWLS, CANADABRITISH COLUMBIA/NORTHEAST PACIFIC, TROLLING LINES, CANADA, OUTSIDE ROCKFISHBRITISH COLUMBIA/NORTHEAST PACIFIC, TROLLING LINES, CANADA, INSIDE ROCKFISHBRITISH COLUMBIA/NORTHEAST PACIFIC, JIG, CANADA, OUTSIDE ROCKFISHBRITISH COLUMBIA/NORTHEAST PACIFIC, SET LONGLINES, CANADA, OUTSIDE ROCKFISH
High
The Fishbase vulnerability score for yellowtail rockfish is 56. The species’ productivity rating in Cope et al.2011 is 1.33 (Table 1 in (Cope et al. 2011)). Yellowtail rockfish therefore have “high" inherent vulnerability.
BRITISH COLUMBIA/NORTHEAST PACIFIC, JIG, CANADA, INSIDE ROCKFISHBRITISH COLUMBIA/NORTHEAST PACIFIC, BOTTOM TRAWLS, CANADA, HARD SUBSTRATEBRITISH COLUMBIA/NORTHEAST PACIFIC, MIDWATER TRAWLS, CANADABRITISH COLUMBIA/NORTHEAST PACIFIC, TROLLING LINES, CANADA, OUTSIDE ROCKFISHBRITISH COLUMBIA/NORTHEAST PACIFIC, TROLLING LINES, CANADA, INSIDE ROCKFISHBRITISH COLUMBIA/NORTHEAST PACIFIC, JIG, CANADA, OUTSIDE ROCKFISHBRITISH COLUMBIA/NORTHEAST PACIFIC, SET LONGLINES, CANADA, OUTSIDE ROCKFISH
Very Low Concern
For 2015, estimated yellowtail rockfish spawning biomass exceeded estimated SB , and thus exceeded theUSR. Yellowtail rockfish stock status is scored “very low” concern.
MSY
Justification:
Yellowtail rockfish abundance steadily declined during the 1960s and 1970s, reaching minimum levels in theearly 1980s and again in the mid-1990s (Figure 59). Above-average recruitment contributed to an increasingtrend in abundance from approximately 1994 through the mid-2000s, but recruitment declined in the early2000s and abundance steadily declined in the subsequent years (Figure 59) (DFO, 2015a).
In 2015, a new assessment was produced for yellowtail rockfish. The updated assessment yielded a medianestimate for SB (18,390 t) that was 49.5% (5-95 percentiles = 29.8-75.5%) of SB and approximately228% of the median estimate for SB (8,293 t) (Table 1 in (DFO, 2015a)). Thus, while yellowtail rockfishabundance has trended downwards in recent years, it remains above the USR (Figure 59). The probabilitiesthat SB was above the USR and SB were 0.995 and 0.977, respectively (Table 2 in (DFO, 2015a).
2015 0
MSY
2015 MSY
104
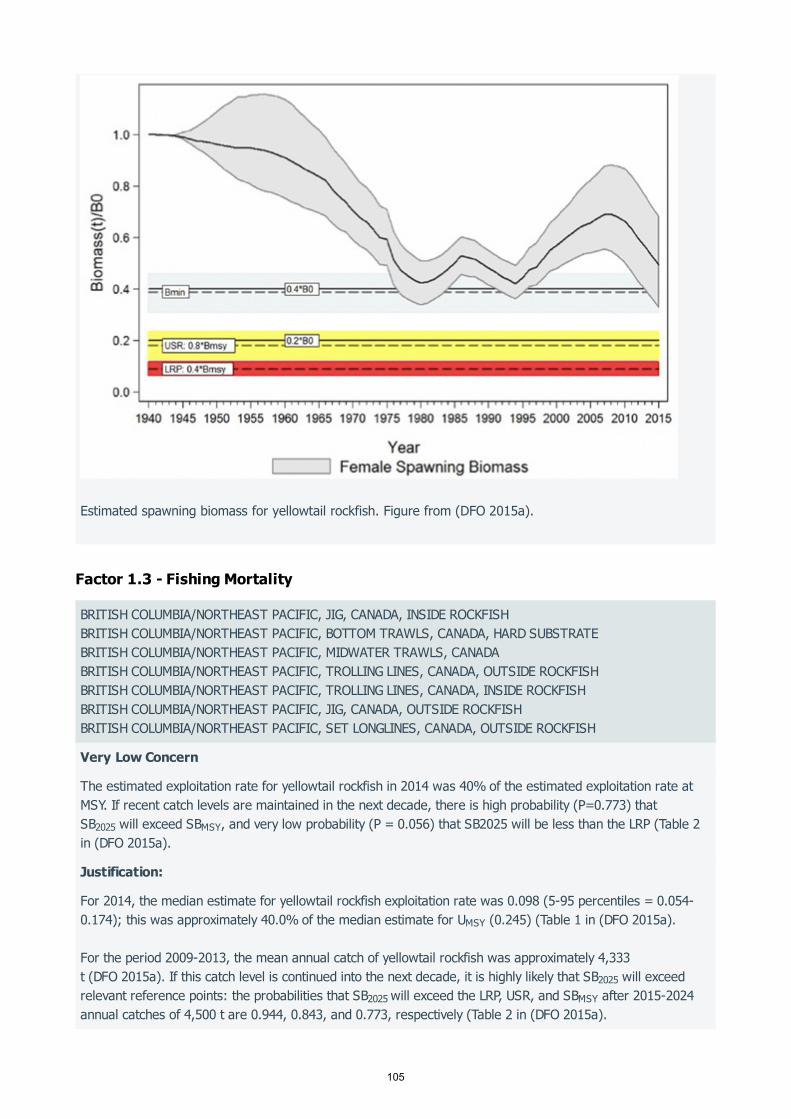
Factor 1.3 - Fishing Mortality
Estimated spawning biomass for yellowtail rockfish. Figure from (DFO 2015a).
BRITISH COLUMBIA/NORTHEAST PACIFIC, JIG, CANADA, INSIDE ROCKFISHBRITISH COLUMBIA/NORTHEAST PACIFIC, BOTTOM TRAWLS, CANADA, HARD SUBSTRATEBRITISH COLUMBIA/NORTHEAST PACIFIC, MIDWATER TRAWLS, CANADABRITISH COLUMBIA/NORTHEAST PACIFIC, TROLLING LINES, CANADA, OUTSIDE ROCKFISHBRITISH COLUMBIA/NORTHEAST PACIFIC, TROLLING LINES, CANADA, INSIDE ROCKFISHBRITISH COLUMBIA/NORTHEAST PACIFIC, JIG, CANADA, OUTSIDE ROCKFISHBRITISH COLUMBIA/NORTHEAST PACIFIC, SET LONGLINES, CANADA, OUTSIDE ROCKFISH
Very Low Concern
The estimated exploitation rate for yellowtail rockfish in 2014 was 40% of the estimated exploitation rate atMSY. If recent catch levels are maintained in the next decade, there is high probability (P=0.773) thatSB will exceed SB , and very low probability (P = 0.056) that SB2025 will be less than the LRP (Table 2in (DFO 2015a).
2025 MSY
Justification:
For 2014, the median estimate for yellowtail rockfish exploitation rate was 0.098 (5-95 percentiles = 0.054-0.174); this was approximately 40.0% of the median estimate for U (0.245) (Table 1 in (DFO 2015a).
For the period 2009-2013, the mean annual catch of yellowtail rockfish was approximately 4,333t (DFO 2015a). If this catch level is continued into the next decade, it is highly likely that SB will exceedrelevant reference points: the probabilities that SB will exceed the LRP, USR, and SB after 2015-2024annual catches of 4,500 t are 0.944, 0.843, and 0.773, respectively (Table 2 in (DFO 2015a).
MSY
2025
2025 MSY
105
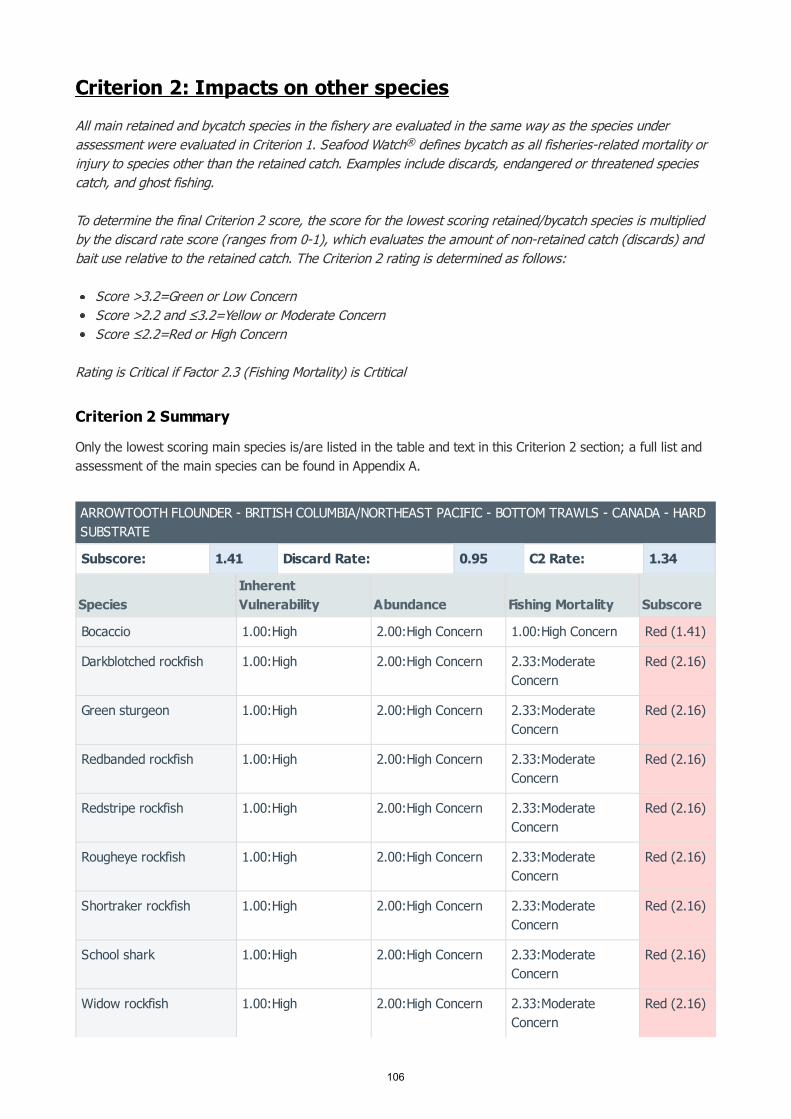
Criterion 2: Impacts on other speciesAll main retained and bycatch species in the fishery are evaluated in the same way as the species underassessment were evaluated in Criterion 1. Seafood Watch defines bycatch as all fisheries-related mortality orinjury to species other than the retained catch. Examples include discards, endangered or threatened speciescatch, and ghost fishing.
To determine the final Criterion 2 score, the score for the lowest scoring retained/bycatch species is multipliedby the discard rate score (ranges from 0-1), which evaluates the amount of non-retained catch (discards) andbait use relative to the retained catch. The Criterion 2 rating is determined as follows:
Score >3.2=Green or Low ConcernScore >2.2 and ≤3.2=Yellow or Moderate ConcernScore ≤2.2=Red or High Concern
Rating is Critical if Factor 2.3 (Fishing Mortality) is Crtitical
Criterion 2 Summary
Only the lowest scoring main species is/are listed in the table and text in this Criterion 2 section; a full list andassessment of the main species can be found in Appendix A.
®
ARROWTOOTH FLOUNDER - BRITISH COLUMBIA/NORTHEAST PACIFIC - BOTTOM TRAWLS - CANADA - HARDSUBSTRATE
Subscore: 1.41 Discard Rate: 0.95 C2 Rate: 1.34
SpeciesInherentVulnerability Abundance Fishing Mortality Subscore
Bocaccio 1.00:High 2.00:High Concern 1.00:High Concern Red (1.41)
Darkblotched rockfish 1.00:High 2.00:High Concern 2.33:ModerateConcern
Red (2.16)
Green sturgeon 1.00:High 2.00:High Concern 2.33:ModerateConcern
Red (2.16)
Redbanded rockfish 1.00:High 2.00:High Concern 2.33:ModerateConcern
Red (2.16)
Redstripe rockfish 1.00:High 2.00:High Concern 2.33:ModerateConcern
Red (2.16)
Rougheye rockfish 1.00:High 2.00:High Concern 2.33:ModerateConcern
Red (2.16)
Shortraker rockfish 1.00:High 2.00:High Concern 2.33:ModerateConcern
Red (2.16)
School shark 1.00:High 2.00:High Concern 2.33:ModerateConcern
Red (2.16)
Widow rockfish 1.00:High 2.00:High Concern 2.33:ModerateConcern
Red (2.16)
106
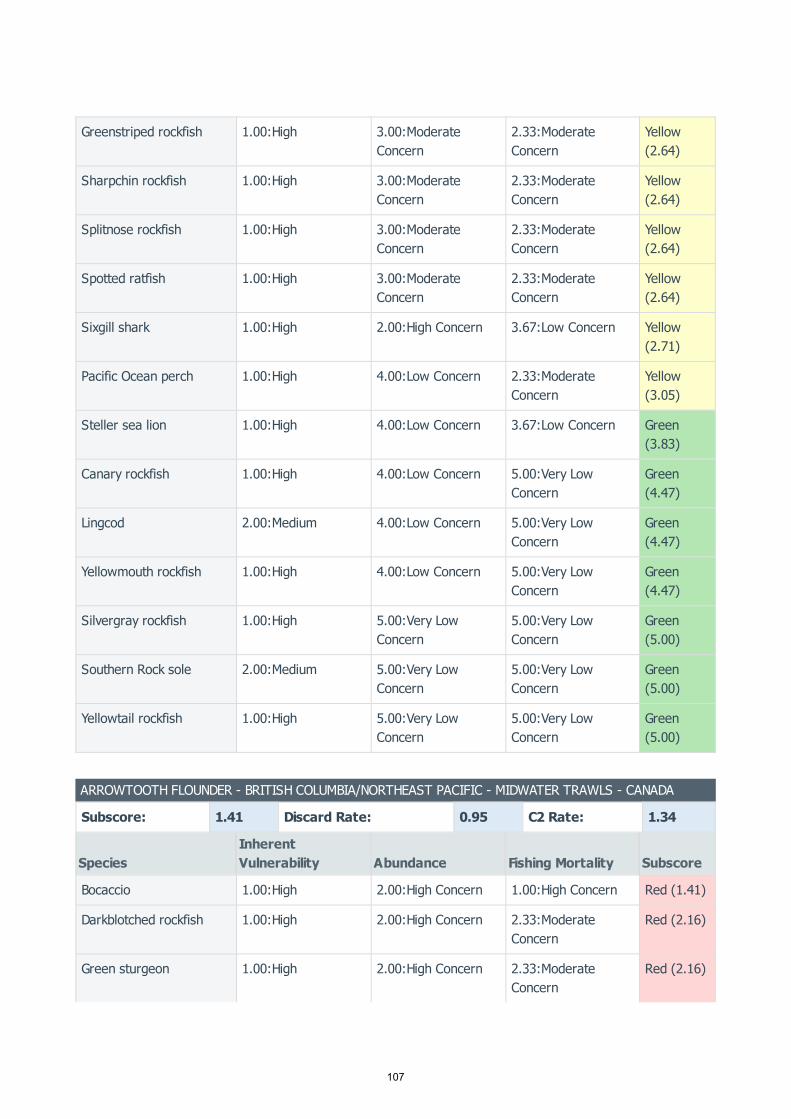
Greenstriped rockfish 1.00:High 3.00:ModerateConcern
2.33:ModerateConcern
Yellow(2.64)
Sharpchin rockfish 1.00:High 3.00:ModerateConcern
2.33:ModerateConcern
Yellow(2.64)
Splitnose rockfish 1.00:High 3.00:ModerateConcern
2.33:ModerateConcern
Yellow(2.64)
Spotted ratfish 1.00:High 3.00:ModerateConcern
2.33:ModerateConcern
Yellow(2.64)
Sixgill shark 1.00:High 2.00:High Concern 3.67:Low Concern Yellow(2.71)
Pacific Ocean perch 1.00:High 4.00:Low Concern 2.33:ModerateConcern
Yellow(3.05)
Steller sea lion 1.00:High 4.00:Low Concern 3.67:Low Concern Green(3.83)
Canary rockfish 1.00:High 4.00:Low Concern 5.00:Very LowConcern
Green(4.47)
Lingcod 2.00:Medium 4.00:Low Concern 5.00:Very LowConcern
Green(4.47)
Yellowmouth rockfish 1.00:High 4.00:Low Concern 5.00:Very LowConcern
Green(4.47)
Silvergray rockfish 1.00:High 5.00:Very LowConcern
5.00:Very LowConcern
Green(5.00)
Southern Rock sole 2.00:Medium 5.00:Very LowConcern
5.00:Very LowConcern
Green(5.00)
Yellowtail rockfish 1.00:High 5.00:Very LowConcern
5.00:Very LowConcern
Green(5.00)
ARROWTOOTH FLOUNDER - BRITISH COLUMBIA/NORTHEAST PACIFIC - MIDWATER TRAWLS - CANADA
Subscore: 1.41 Discard Rate: 0.95 C2 Rate: 1.34
SpeciesInherentVulnerability Abundance Fishing Mortality Subscore
Bocaccio 1.00:High 2.00:High Concern 1.00:High Concern Red (1.41)
Darkblotched rockfish 1.00:High 2.00:High Concern 2.33:ModerateConcern
Red (2.16)
Green sturgeon 1.00:High 2.00:High Concern 2.33:ModerateConcern
Red (2.16)
107
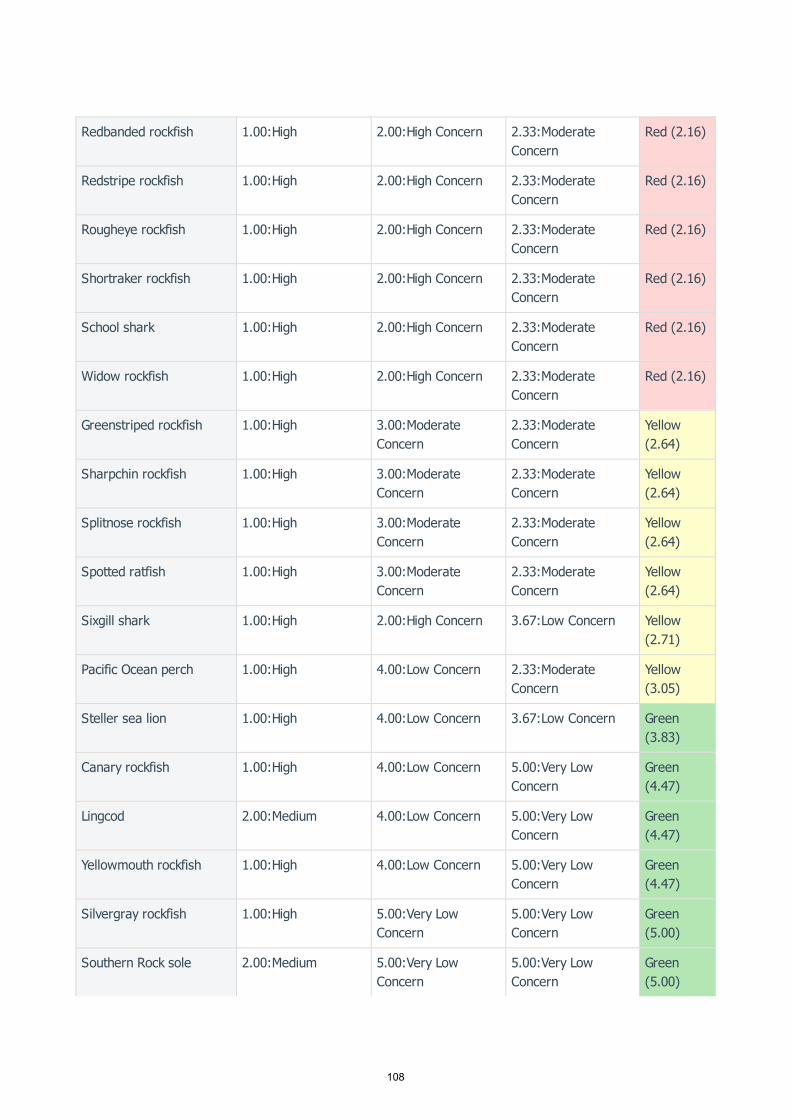
Redbanded rockfish 1.00:High 2.00:High Concern 2.33:ModerateConcern
Red (2.16)
Redstripe rockfish 1.00:High 2.00:High Concern 2.33:ModerateConcern
Red (2.16)
Rougheye rockfish 1.00:High 2.00:High Concern 2.33:ModerateConcern
Red (2.16)
Shortraker rockfish 1.00:High 2.00:High Concern 2.33:ModerateConcern
Red (2.16)
School shark 1.00:High 2.00:High Concern 2.33:ModerateConcern
Red (2.16)
Widow rockfish 1.00:High 2.00:High Concern 2.33:ModerateConcern
Red (2.16)
Greenstriped rockfish 1.00:High 3.00:ModerateConcern
2.33:ModerateConcern
Yellow(2.64)
Sharpchin rockfish 1.00:High 3.00:ModerateConcern
2.33:ModerateConcern
Yellow(2.64)
Splitnose rockfish 1.00:High 3.00:ModerateConcern
2.33:ModerateConcern
Yellow(2.64)
Spotted ratfish 1.00:High 3.00:ModerateConcern
2.33:ModerateConcern
Yellow(2.64)
Sixgill shark 1.00:High 2.00:High Concern 3.67:Low Concern Yellow(2.71)
Pacific Ocean perch 1.00:High 4.00:Low Concern 2.33:ModerateConcern
Yellow(3.05)
Steller sea lion 1.00:High 4.00:Low Concern 3.67:Low Concern Green(3.83)
Canary rockfish 1.00:High 4.00:Low Concern 5.00:Very LowConcern
Green(4.47)
Lingcod 2.00:Medium 4.00:Low Concern 5.00:Very LowConcern
Green(4.47)
Yellowmouth rockfish 1.00:High 4.00:Low Concern 5.00:Very LowConcern
Green(4.47)
Silvergray rockfish 1.00:High 5.00:Very LowConcern
5.00:Very LowConcern
Green(5.00)
Southern Rock sole 2.00:Medium 5.00:Very LowConcern
5.00:Very LowConcern
Green(5.00)
108

Yellowtail rockfish 1.00:High 5.00:Very LowConcern
5.00:Very LowConcern
Green(5.00)
BIG SKATE - BRITISH COLUMBIA/NORTHEAST PACIFIC - BOTTOM TRAWLS - CANADA - SOFT SUBSTRATE
Subscore: 2.16 Discard Rate: 0.95 C2 Rate: 2.05
SpeciesInherentVulnerability Abundance Fishing Mortality Subscore
Giant rattail 1.00:High 2.00:High Concern 2.33:ModerateConcern
Red (2.16)
Green sturgeon 1.00:High 2.00:High Concern 2.33:ModerateConcern
Red (2.16)
Longnose skate 1.00:High 2.00:High Concern 2.33:ModerateConcern
Red (2.16)
Shortspine thornyhead 1.00:High 2.00:High Concern 2.33:ModerateConcern
Red (2.16)
Pacific grenadier 1.00:High 2.00:High Concern 2.33:ModerateConcern
Red (2.16)
School shark 1.00:High 2.00:High Concern 2.33:ModerateConcern
Red (2.16)
Dover sole 2.00:Medium 3.00:ModerateConcern
2.33:ModerateConcern
Yellow(2.64)
Flathead sole 2.00:Medium 3.00:ModerateConcern
2.33:ModerateConcern
Yellow(2.64)
Rex sole 2.00:Medium 3.00:ModerateConcern
2.33:ModerateConcern
Yellow(2.64)
Spotted ratfish 1.00:High 3.00:ModerateConcern
2.33:ModerateConcern
Yellow(2.64)
Longspine thornyhead 1.00:High 2.00:High Concern 3.67:Low Concern Yellow(2.71)
Sixgill shark 1.00:High 2.00:High Concern 3.67:Low Concern Yellow(2.71)
Petrale sole 2.00:Medium 4.00:Low Concern 2.33:ModerateConcern
Yellow(3.05)
Pacific cod 2.00:Medium 2.00:High Concern 5.00:Very LowConcern
Yellow(3.16)
Spiny dogfish 1.00:High 3.00:ModerateConcern
3.67:Low Concern Green(3.32)
109
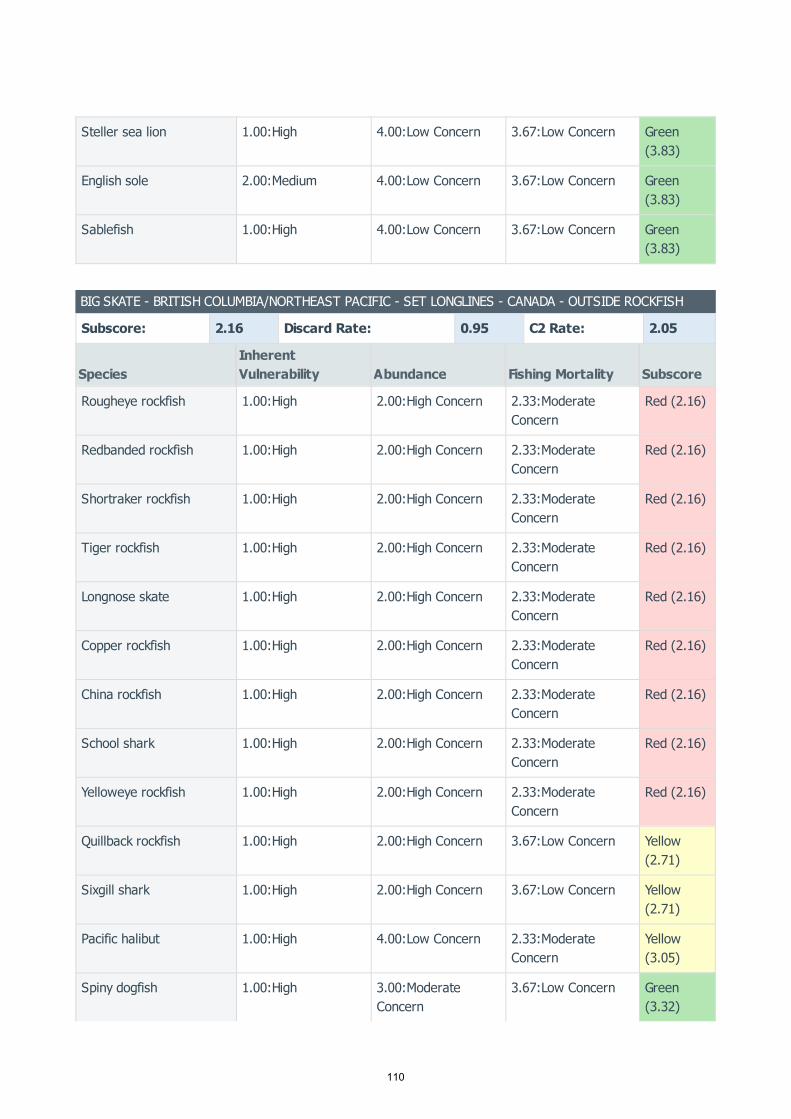
Steller sea lion 1.00:High 4.00:Low Concern 3.67:Low Concern Green(3.83)
English sole 2.00:Medium 4.00:Low Concern 3.67:Low Concern Green(3.83)
Sablefish 1.00:High 4.00:Low Concern 3.67:Low Concern Green(3.83)
BIG SKATE - BRITISH COLUMBIA/NORTHEAST PACIFIC - SET LONGLINES - CANADA - OUTSIDE ROCKFISH
Subscore: 2.16 Discard Rate: 0.95 C2 Rate: 2.05
SpeciesInherentVulnerability Abundance Fishing Mortality Subscore
Rougheye rockfish 1.00:High 2.00:High Concern 2.33:ModerateConcern
Red (2.16)
Redbanded rockfish 1.00:High 2.00:High Concern 2.33:ModerateConcern
Red (2.16)
Shortraker rockfish 1.00:High 2.00:High Concern 2.33:ModerateConcern
Red (2.16)
Tiger rockfish 1.00:High 2.00:High Concern 2.33:ModerateConcern
Red (2.16)
Longnose skate 1.00:High 2.00:High Concern 2.33:ModerateConcern
Red (2.16)
Copper rockfish 1.00:High 2.00:High Concern 2.33:ModerateConcern
Red (2.16)
China rockfish 1.00:High 2.00:High Concern 2.33:ModerateConcern
Red (2.16)
School shark 1.00:High 2.00:High Concern 2.33:ModerateConcern
Red (2.16)
Yelloweye rockfish 1.00:High 2.00:High Concern 2.33:ModerateConcern
Red (2.16)
Quillback rockfish 1.00:High 2.00:High Concern 3.67:Low Concern Yellow(2.71)
Sixgill shark 1.00:High 2.00:High Concern 3.67:Low Concern Yellow(2.71)
Pacific halibut 1.00:High 4.00:Low Concern 2.33:ModerateConcern
Yellow(3.05)
Spiny dogfish 1.00:High 3.00:ModerateConcern
3.67:Low Concern Green(3.32)
110

Sablefish 1.00:High 4.00:Low Concern 3.67:Low Concern Green(3.83)
Lingcod 2.00:Medium 4.00:Low Concern 5.00:Very LowConcern
Green(4.47)
Yellowtail rockfish 1.00:High 5.00:Very LowConcern
5.00:Very LowConcern
Green(5.00)
CANARY ROCKFISH - BRITISH COLUMBIA/NORTHEAST PACIFIC - BOTTOM TRAWLS - CANADA - HARDSUBSTRATE
Subscore: 1.41 Discard Rate: 0.95 C2 Rate: 1.34
SpeciesInherentVulnerability Abundance Fishing Mortality Subscore
Bocaccio 1.00:High 2.00:High Concern 1.00:High Concern Red (1.41)
Darkblotched rockfish 1.00:High 2.00:High Concern 2.33:ModerateConcern
Red (2.16)
Green sturgeon 1.00:High 2.00:High Concern 2.33:ModerateConcern
Red (2.16)
Redbanded rockfish 1.00:High 2.00:High Concern 2.33:ModerateConcern
Red (2.16)
Redstripe rockfish 1.00:High 2.00:High Concern 2.33:ModerateConcern
Red (2.16)
Rougheye rockfish 1.00:High 2.00:High Concern 2.33:ModerateConcern
Red (2.16)
Shortraker rockfish 1.00:High 2.00:High Concern 2.33:ModerateConcern
Red (2.16)
School shark 1.00:High 2.00:High Concern 2.33:ModerateConcern
Red (2.16)
Widow rockfish 1.00:High 2.00:High Concern 2.33:ModerateConcern
Red (2.16)
Greenstriped rockfish 1.00:High 3.00:ModerateConcern
2.33:ModerateConcern
Yellow(2.64)
Sharpchin rockfish 1.00:High 3.00:ModerateConcern
2.33:ModerateConcern
Yellow(2.64)
Splitnose rockfish 1.00:High 3.00:ModerateConcern
2.33:ModerateConcern
Yellow(2.64)
Spotted ratfish 1.00:High 3.00:ModerateConcern
2.33:ModerateConcern
Yellow(2.64)
111
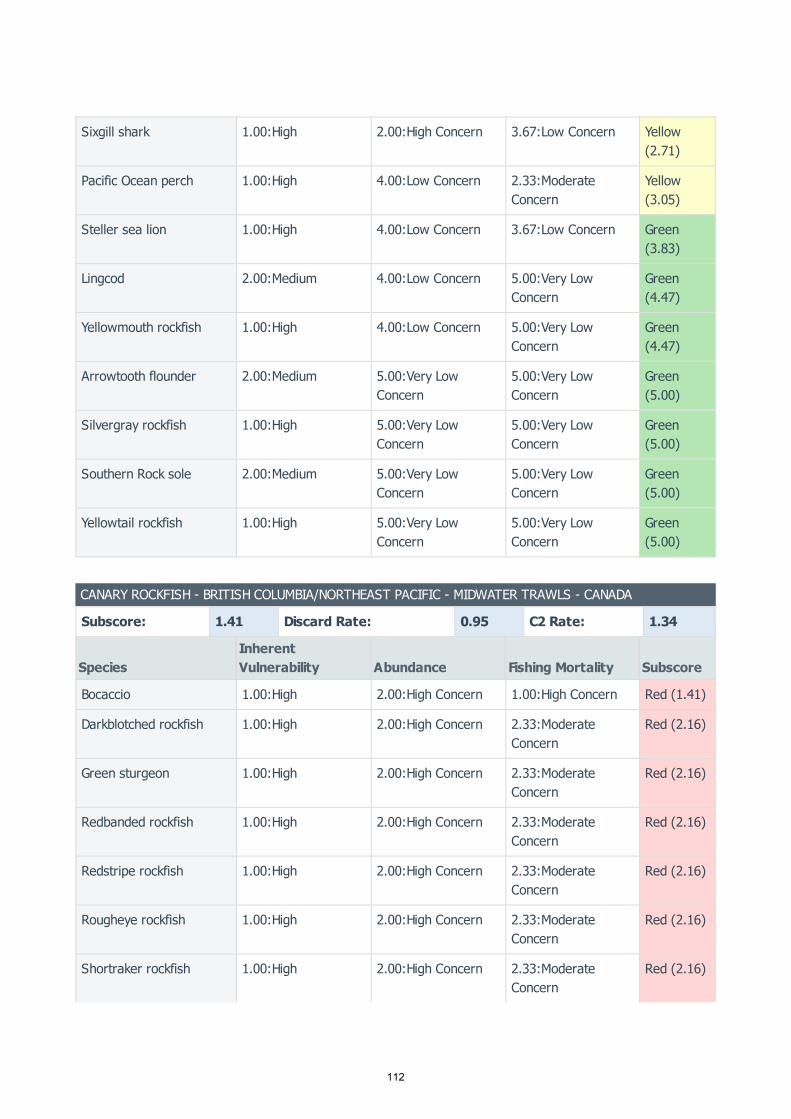
Sixgill shark 1.00:High 2.00:High Concern 3.67:Low Concern Yellow(2.71)
Pacific Ocean perch 1.00:High 4.00:Low Concern 2.33:ModerateConcern
Yellow(3.05)
Steller sea lion 1.00:High 4.00:Low Concern 3.67:Low Concern Green(3.83)
Lingcod 2.00:Medium 4.00:Low Concern 5.00:Very LowConcern
Green(4.47)
Yellowmouth rockfish 1.00:High 4.00:Low Concern 5.00:Very LowConcern
Green(4.47)
Arrowtooth flounder 2.00:Medium 5.00:Very LowConcern
5.00:Very LowConcern
Green(5.00)
Silvergray rockfish 1.00:High 5.00:Very LowConcern
5.00:Very LowConcern
Green(5.00)
Southern Rock sole 2.00:Medium 5.00:Very LowConcern
5.00:Very LowConcern
Green(5.00)
Yellowtail rockfish 1.00:High 5.00:Very LowConcern
5.00:Very LowConcern
Green(5.00)
CANARY ROCKFISH - BRITISH COLUMBIA/NORTHEAST PACIFIC - MIDWATER TRAWLS - CANADA
Subscore: 1.41 Discard Rate: 0.95 C2 Rate: 1.34
SpeciesInherentVulnerability Abundance Fishing Mortality Subscore
Bocaccio 1.00:High 2.00:High Concern 1.00:High Concern Red (1.41)
Darkblotched rockfish 1.00:High 2.00:High Concern 2.33:ModerateConcern
Red (2.16)
Green sturgeon 1.00:High 2.00:High Concern 2.33:ModerateConcern
Red (2.16)
Redbanded rockfish 1.00:High 2.00:High Concern 2.33:ModerateConcern
Red (2.16)
Redstripe rockfish 1.00:High 2.00:High Concern 2.33:ModerateConcern
Red (2.16)
Rougheye rockfish 1.00:High 2.00:High Concern 2.33:ModerateConcern
Red (2.16)
Shortraker rockfish 1.00:High 2.00:High Concern 2.33:ModerateConcern
Red (2.16)
112
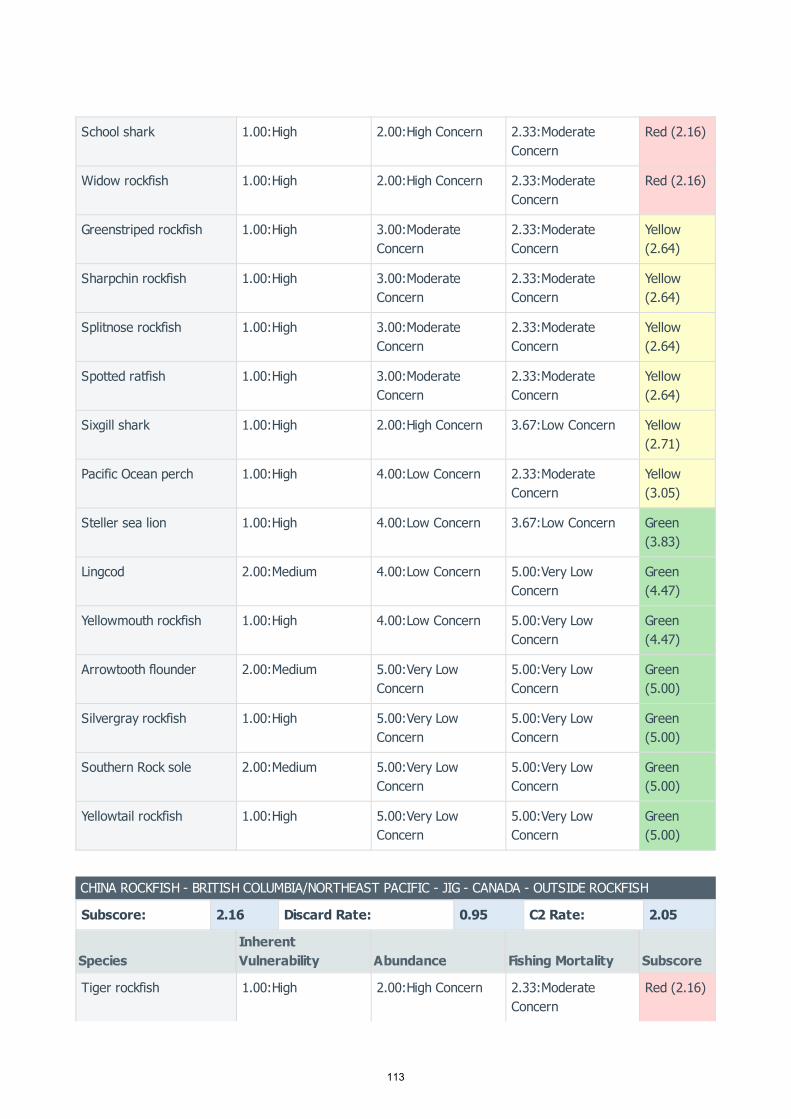
School shark 1.00:High 2.00:High Concern 2.33:ModerateConcern
Red (2.16)
Widow rockfish 1.00:High 2.00:High Concern 2.33:ModerateConcern
Red (2.16)
Greenstriped rockfish 1.00:High 3.00:ModerateConcern
2.33:ModerateConcern
Yellow(2.64)
Sharpchin rockfish 1.00:High 3.00:ModerateConcern
2.33:ModerateConcern
Yellow(2.64)
Splitnose rockfish 1.00:High 3.00:ModerateConcern
2.33:ModerateConcern
Yellow(2.64)
Spotted ratfish 1.00:High 3.00:ModerateConcern
2.33:ModerateConcern
Yellow(2.64)
Sixgill shark 1.00:High 2.00:High Concern 3.67:Low Concern Yellow(2.71)
Pacific Ocean perch 1.00:High 4.00:Low Concern 2.33:ModerateConcern
Yellow(3.05)
Steller sea lion 1.00:High 4.00:Low Concern 3.67:Low Concern Green(3.83)
Lingcod 2.00:Medium 4.00:Low Concern 5.00:Very LowConcern
Green(4.47)
Yellowmouth rockfish 1.00:High 4.00:Low Concern 5.00:Very LowConcern
Green(4.47)
Arrowtooth flounder 2.00:Medium 5.00:Very LowConcern
5.00:Very LowConcern
Green(5.00)
Silvergray rockfish 1.00:High 5.00:Very LowConcern
5.00:Very LowConcern
Green(5.00)
Southern Rock sole 2.00:Medium 5.00:Very LowConcern
5.00:Very LowConcern
Green(5.00)
Yellowtail rockfish 1.00:High 5.00:Very LowConcern
5.00:Very LowConcern
Green(5.00)
CHINA ROCKFISH - BRITISH COLUMBIA/NORTHEAST PACIFIC - JIG - CANADA - OUTSIDE ROCKFISH
Subscore: 2.16 Discard Rate: 0.95 C2 Rate: 2.05
SpeciesInherentVulnerability Abundance Fishing Mortality Subscore
Tiger rockfish 1.00:High 2.00:High Concern 2.33:ModerateConcern
Red (2.16)
113

Shortraker rockfish 1.00:High 2.00:High Concern 2.33:ModerateConcern
Red (2.16)
Rougheye rockfish 1.00:High 2.00:High Concern 2.33:ModerateConcern
Red (2.16)
Copper rockfish 1.00:High 2.00:High Concern 2.33:ModerateConcern
Red (2.16)
Redbanded rockfish 1.00:High 2.00:High Concern 2.33:ModerateConcern
Red (2.16)
Yelloweye rockfish 1.00:High 2.00:High Concern 2.33:ModerateConcern
Red (2.16)
Sixgill shark 1.00:High 2.00:High Concern 3.67:Low Concern Yellow(2.71)
Quillback rockfish 1.00:High 2.00:High Concern 3.67:Low Concern Yellow(2.71)
Spiny dogfish 1.00:High 3.00:ModerateConcern
3.67:Low Concern Green(3.32)
Lingcod 2.00:Medium 4.00:Low Concern 5.00:Very LowConcern
Green(4.47)
Yellowtail rockfish 1.00:High 5.00:Very LowConcern
5.00:Very LowConcern
Green(5.00)
CHINA ROCKFISH - BRITISH COLUMBIA/NORTHEAST PACIFIC - SET LONGLINES - CANADA - OUTSIDEROCKFISH
Subscore: 2.16 Discard Rate: 0.95 C2 Rate: 2.05
SpeciesInherentVulnerability Abundance Fishing Mortality Subscore
Rougheye rockfish 1.00:High 2.00:High Concern 2.33:ModerateConcern
Red (2.16)
Redbanded rockfish 1.00:High 2.00:High Concern 2.33:ModerateConcern
Red (2.16)
Shortraker rockfish 1.00:High 2.00:High Concern 2.33:ModerateConcern
Red (2.16)
Tiger rockfish 1.00:High 2.00:High Concern 2.33:ModerateConcern
Red (2.16)
Longnose skate 1.00:High 2.00:High Concern 2.33:ModerateConcern
Red (2.16)
Copper rockfish 1.00:High 2.00:High Concern 2.33:ModerateConcern
Red (2.16)
114
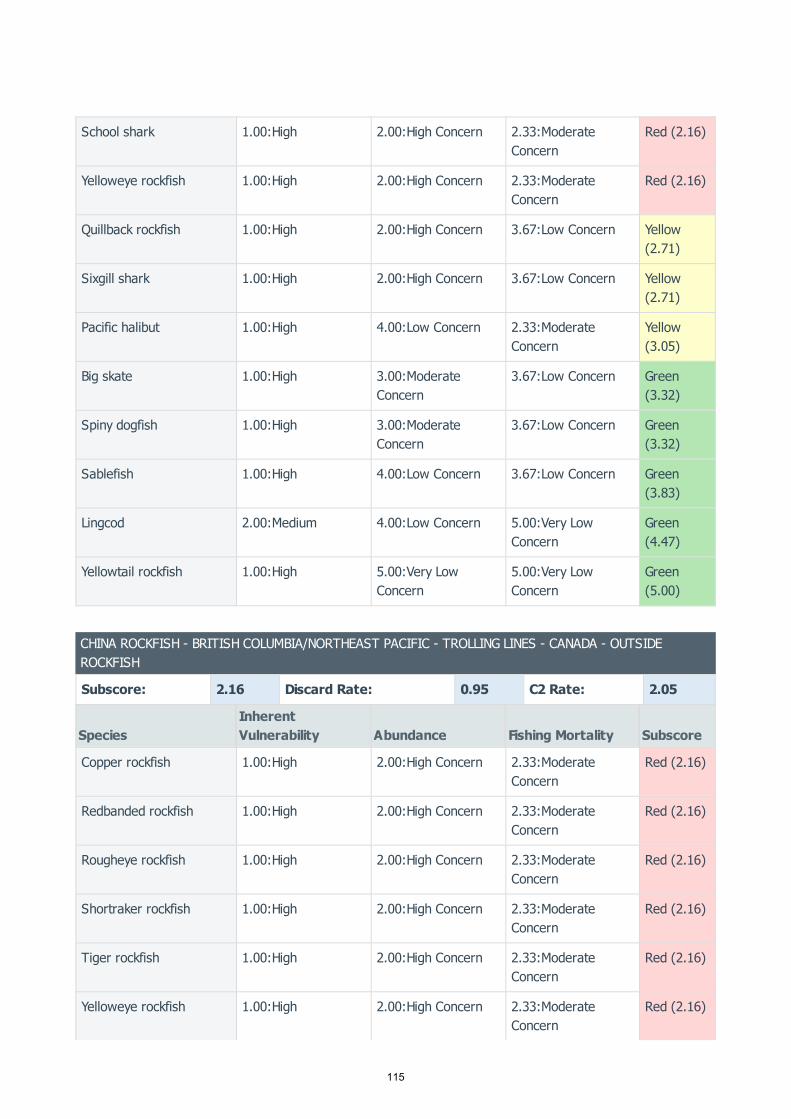
School shark 1.00:High 2.00:High Concern 2.33:ModerateConcern
Red (2.16)
Yelloweye rockfish 1.00:High 2.00:High Concern 2.33:ModerateConcern
Red (2.16)
Quillback rockfish 1.00:High 2.00:High Concern 3.67:Low Concern Yellow(2.71)
Sixgill shark 1.00:High 2.00:High Concern 3.67:Low Concern Yellow(2.71)
Pacific halibut 1.00:High 4.00:Low Concern 2.33:ModerateConcern
Yellow(3.05)
Big skate 1.00:High 3.00:ModerateConcern
3.67:Low Concern Green(3.32)
Spiny dogfish 1.00:High 3.00:ModerateConcern
3.67:Low Concern Green(3.32)
Sablefish 1.00:High 4.00:Low Concern 3.67:Low Concern Green(3.83)
Lingcod 2.00:Medium 4.00:Low Concern 5.00:Very LowConcern
Green(4.47)
Yellowtail rockfish 1.00:High 5.00:Very LowConcern
5.00:Very LowConcern
Green(5.00)
CHINA ROCKFISH - BRITISH COLUMBIA/NORTHEAST PACIFIC - TROLLING LINES - CANADA - OUTSIDEROCKFISH
Subscore: 2.16 Discard Rate: 0.95 C2 Rate: 2.05
SpeciesInherentVulnerability Abundance Fishing Mortality Subscore
Copper rockfish 1.00:High 2.00:High Concern 2.33:ModerateConcern
Red (2.16)
Redbanded rockfish 1.00:High 2.00:High Concern 2.33:ModerateConcern
Red (2.16)
Rougheye rockfish 1.00:High 2.00:High Concern 2.33:ModerateConcern
Red (2.16)
Shortraker rockfish 1.00:High 2.00:High Concern 2.33:ModerateConcern
Red (2.16)
Tiger rockfish 1.00:High 2.00:High Concern 2.33:ModerateConcern
Red (2.16)
Yelloweye rockfish 1.00:High 2.00:High Concern 2.33:ModerateConcern
Red (2.16)
115
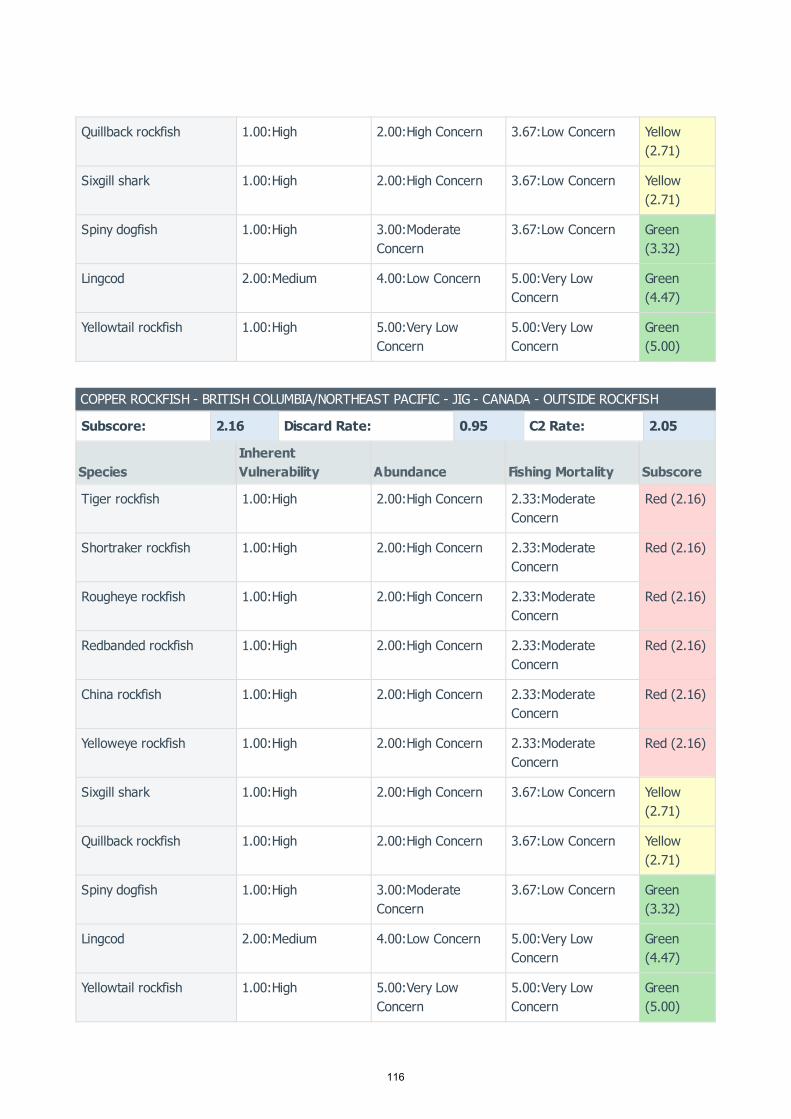
Quillback rockfish 1.00:High 2.00:High Concern 3.67:Low Concern Yellow(2.71)
Sixgill shark 1.00:High 2.00:High Concern 3.67:Low Concern Yellow(2.71)
Spiny dogfish 1.00:High 3.00:ModerateConcern
3.67:Low Concern Green(3.32)
Lingcod 2.00:Medium 4.00:Low Concern 5.00:Very LowConcern
Green(4.47)
Yellowtail rockfish 1.00:High 5.00:Very LowConcern
5.00:Very LowConcern
Green(5.00)
COPPER ROCKFISH - BRITISH COLUMBIA/NORTHEAST PACIFIC - JIG - CANADA - OUTSIDE ROCKFISH
Subscore: 2.16 Discard Rate: 0.95 C2 Rate: 2.05
SpeciesInherentVulnerability Abundance Fishing Mortality Subscore
Tiger rockfish 1.00:High 2.00:High Concern 2.33:ModerateConcern
Red (2.16)
Shortraker rockfish 1.00:High 2.00:High Concern 2.33:ModerateConcern
Red (2.16)
Rougheye rockfish 1.00:High 2.00:High Concern 2.33:ModerateConcern
Red (2.16)
Redbanded rockfish 1.00:High 2.00:High Concern 2.33:ModerateConcern
Red (2.16)
China rockfish 1.00:High 2.00:High Concern 2.33:ModerateConcern
Red (2.16)
Yelloweye rockfish 1.00:High 2.00:High Concern 2.33:ModerateConcern
Red (2.16)
Sixgill shark 1.00:High 2.00:High Concern 3.67:Low Concern Yellow(2.71)
Quillback rockfish 1.00:High 2.00:High Concern 3.67:Low Concern Yellow(2.71)
Spiny dogfish 1.00:High 3.00:ModerateConcern
3.67:Low Concern Green(3.32)
Lingcod 2.00:Medium 4.00:Low Concern 5.00:Very LowConcern
Green(4.47)
Yellowtail rockfish 1.00:High 5.00:Very LowConcern
5.00:Very LowConcern
Green(5.00)
116

COPPER ROCKFISH - BRITISH COLUMBIA/NORTHEAST PACIFIC - SET LONGLINES - CANADA - OUTSIDEROCKFISH
Subscore: 2.16 Discard Rate: 0.95 C2 Rate: 2.05
SpeciesInherentVulnerability Abundance Fishing Mortality Subscore
Rougheye rockfish 1.00:High 2.00:High Concern 2.33:ModerateConcern
Red (2.16)
Redbanded rockfish 1.00:High 2.00:High Concern 2.33:ModerateConcern
Red (2.16)
Shortraker rockfish 1.00:High 2.00:High Concern 2.33:ModerateConcern
Red (2.16)
Tiger rockfish 1.00:High 2.00:High Concern 2.33:ModerateConcern
Red (2.16)
Longnose skate 1.00:High 2.00:High Concern 2.33:ModerateConcern
Red (2.16)
China rockfish 1.00:High 2.00:High Concern 2.33:ModerateConcern
Red (2.16)
School shark 1.00:High 2.00:High Concern 2.33:ModerateConcern
Red (2.16)
Yelloweye rockfish 1.00:High 2.00:High Concern 2.33:ModerateConcern
Red (2.16)
Quillback rockfish 1.00:High 2.00:High Concern 3.67:Low Concern Yellow(2.71)
Sixgill shark 1.00:High 2.00:High Concern 3.67:Low Concern Yellow(2.71)
Pacific halibut 1.00:High 4.00:Low Concern 2.33:ModerateConcern
Yellow(3.05)
Big skate 1.00:High 3.00:ModerateConcern
3.67:Low Concern Green(3.32)
Spiny dogfish 1.00:High 3.00:ModerateConcern
3.67:Low Concern Green(3.32)
Sablefish 1.00:High 4.00:Low Concern 3.67:Low Concern Green(3.83)
Lingcod 2.00:Medium 4.00:Low Concern 5.00:Very LowConcern
Green(4.47)
Yellowtail rockfish 1.00:High 5.00:Very LowConcern
5.00:Very LowConcern
Green(5.00)
117
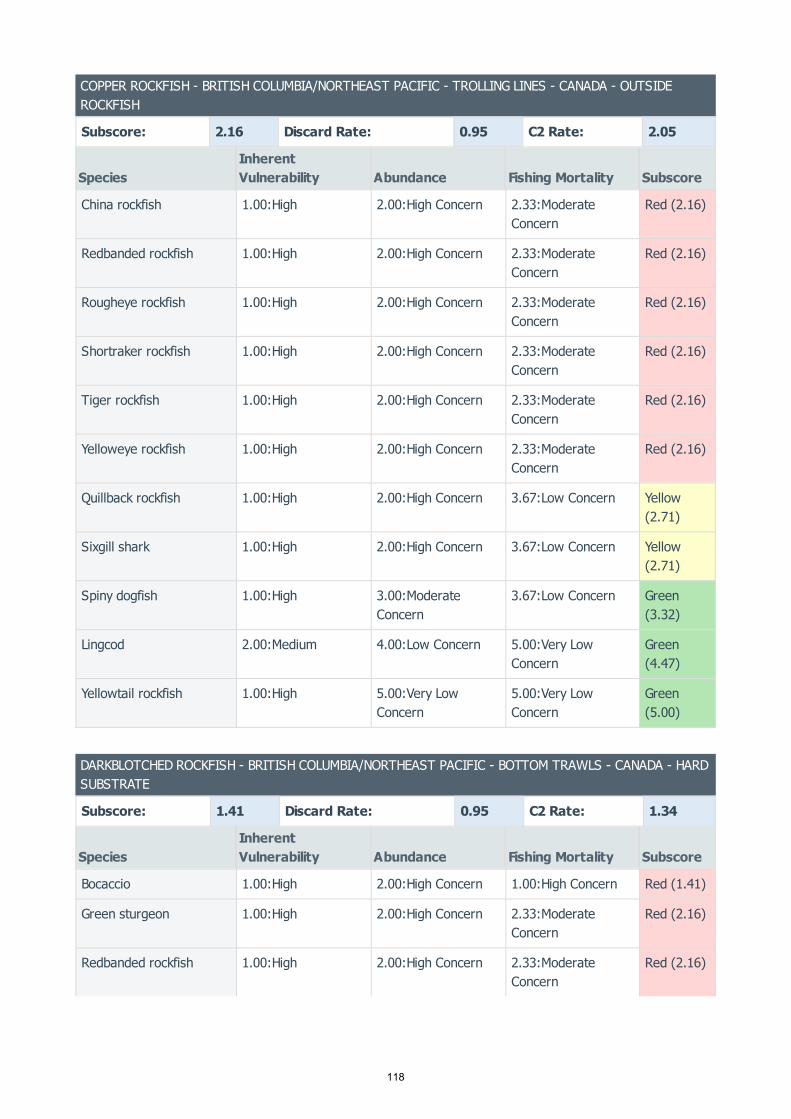
COPPER ROCKFISH - BRITISH COLUMBIA/NORTHEAST PACIFIC - TROLLING LINES - CANADA - OUTSIDEROCKFISH
Subscore: 2.16 Discard Rate: 0.95 C2 Rate: 2.05
SpeciesInherentVulnerability Abundance Fishing Mortality Subscore
China rockfish 1.00:High 2.00:High Concern 2.33:ModerateConcern
Red (2.16)
Redbanded rockfish 1.00:High 2.00:High Concern 2.33:ModerateConcern
Red (2.16)
Rougheye rockfish 1.00:High 2.00:High Concern 2.33:ModerateConcern
Red (2.16)
Shortraker rockfish 1.00:High 2.00:High Concern 2.33:ModerateConcern
Red (2.16)
Tiger rockfish 1.00:High 2.00:High Concern 2.33:ModerateConcern
Red (2.16)
Yelloweye rockfish 1.00:High 2.00:High Concern 2.33:ModerateConcern
Red (2.16)
Quillback rockfish 1.00:High 2.00:High Concern 3.67:Low Concern Yellow(2.71)
Sixgill shark 1.00:High 2.00:High Concern 3.67:Low Concern Yellow(2.71)
Spiny dogfish 1.00:High 3.00:ModerateConcern
3.67:Low Concern Green(3.32)
Lingcod 2.00:Medium 4.00:Low Concern 5.00:Very LowConcern
Green(4.47)
Yellowtail rockfish 1.00:High 5.00:Very LowConcern
5.00:Very LowConcern
Green(5.00)
DARKBLOTCHED ROCKFISH - BRITISH COLUMBIA/NORTHEAST PACIFIC - BOTTOM TRAWLS - CANADA - HARDSUBSTRATE
Subscore: 1.41 Discard Rate: 0.95 C2 Rate: 1.34
SpeciesInherentVulnerability Abundance Fishing Mortality Subscore
Bocaccio 1.00:High 2.00:High Concern 1.00:High Concern Red (1.41)
Green sturgeon 1.00:High 2.00:High Concern 2.33:ModerateConcern
Red (2.16)
Redbanded rockfish 1.00:High 2.00:High Concern 2.33:ModerateConcern
Red (2.16)
118

Redstripe rockfish 1.00:High 2.00:High Concern 2.33:ModerateConcern
Red (2.16)
Rougheye rockfish 1.00:High 2.00:High Concern 2.33:ModerateConcern
Red (2.16)
Shortraker rockfish 1.00:High 2.00:High Concern 2.33:ModerateConcern
Red (2.16)
School shark 1.00:High 2.00:High Concern 2.33:ModerateConcern
Red (2.16)
Widow rockfish 1.00:High 2.00:High Concern 2.33:ModerateConcern
Red (2.16)
Greenstriped rockfish 1.00:High 3.00:ModerateConcern
2.33:ModerateConcern
Yellow(2.64)
Sharpchin rockfish 1.00:High 3.00:ModerateConcern
2.33:ModerateConcern
Yellow(2.64)
Splitnose rockfish 1.00:High 3.00:ModerateConcern
2.33:ModerateConcern
Yellow(2.64)
Spotted ratfish 1.00:High 3.00:ModerateConcern
2.33:ModerateConcern
Yellow(2.64)
Sixgill shark 1.00:High 2.00:High Concern 3.67:Low Concern Yellow(2.71)
Pacific Ocean perch 1.00:High 4.00:Low Concern 2.33:ModerateConcern
Yellow(3.05)
Steller sea lion 1.00:High 4.00:Low Concern 3.67:Low Concern Green(3.83)
Canary rockfish 1.00:High 4.00:Low Concern 5.00:Very LowConcern
Green(4.47)
Lingcod 2.00:Medium 4.00:Low Concern 5.00:Very LowConcern
Green(4.47)
Yellowmouth rockfish 1.00:High 4.00:Low Concern 5.00:Very LowConcern
Green(4.47)
Arrowtooth flounder 2.00:Medium 5.00:Very LowConcern
5.00:Very LowConcern
Green(5.00)
Silvergray rockfish 1.00:High 5.00:Very LowConcern
5.00:Very LowConcern
Green(5.00)
Southern Rock sole 2.00:Medium 5.00:Very LowConcern
5.00:Very LowConcern
Green(5.00)
119
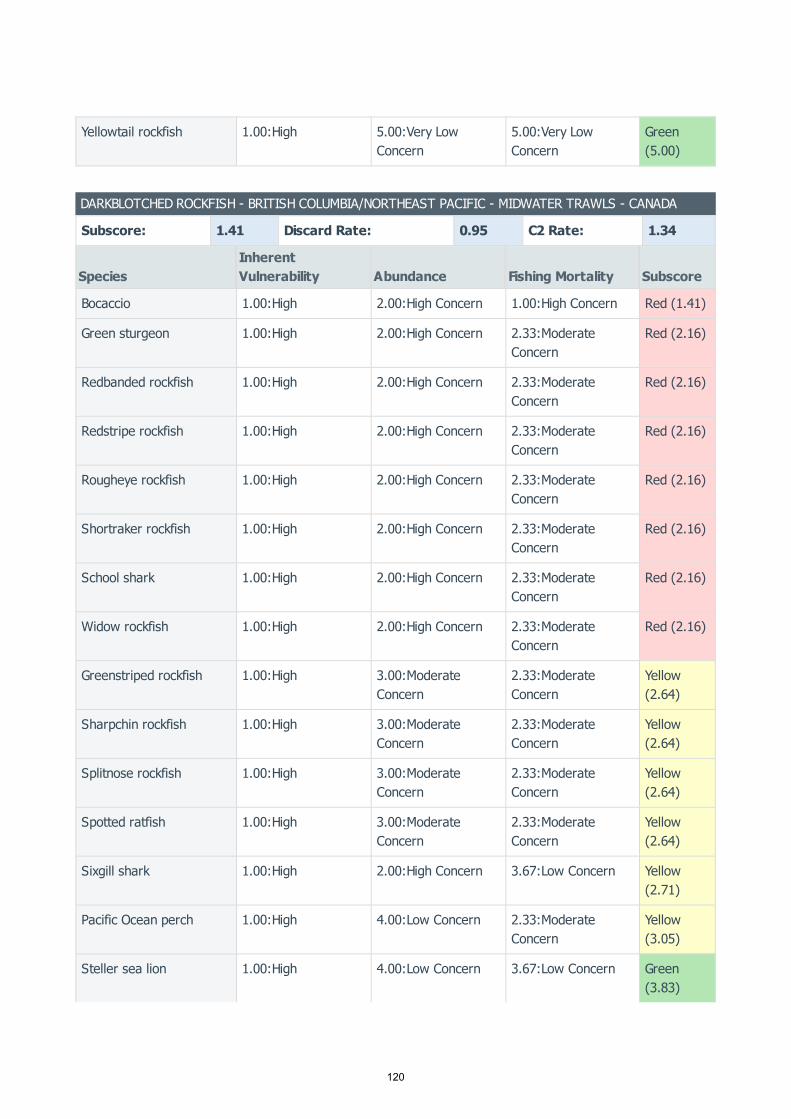
Yellowtail rockfish 1.00:High 5.00:Very LowConcern
5.00:Very LowConcern
Green(5.00)
DARKBLOTCHED ROCKFISH - BRITISH COLUMBIA/NORTHEAST PACIFIC - MIDWATER TRAWLS - CANADA
Subscore: 1.41 Discard Rate: 0.95 C2 Rate: 1.34
SpeciesInherentVulnerability Abundance Fishing Mortality Subscore
Bocaccio 1.00:High 2.00:High Concern 1.00:High Concern Red (1.41)
Green sturgeon 1.00:High 2.00:High Concern 2.33:ModerateConcern
Red (2.16)
Redbanded rockfish 1.00:High 2.00:High Concern 2.33:ModerateConcern
Red (2.16)
Redstripe rockfish 1.00:High 2.00:High Concern 2.33:ModerateConcern
Red (2.16)
Rougheye rockfish 1.00:High 2.00:High Concern 2.33:ModerateConcern
Red (2.16)
Shortraker rockfish 1.00:High 2.00:High Concern 2.33:ModerateConcern
Red (2.16)
School shark 1.00:High 2.00:High Concern 2.33:ModerateConcern
Red (2.16)
Widow rockfish 1.00:High 2.00:High Concern 2.33:ModerateConcern
Red (2.16)
Greenstriped rockfish 1.00:High 3.00:ModerateConcern
2.33:ModerateConcern
Yellow(2.64)
Sharpchin rockfish 1.00:High 3.00:ModerateConcern
2.33:ModerateConcern
Yellow(2.64)
Splitnose rockfish 1.00:High 3.00:ModerateConcern
2.33:ModerateConcern
Yellow(2.64)
Spotted ratfish 1.00:High 3.00:ModerateConcern
2.33:ModerateConcern
Yellow(2.64)
Sixgill shark 1.00:High 2.00:High Concern 3.67:Low Concern Yellow(2.71)
Pacific Ocean perch 1.00:High 4.00:Low Concern 2.33:ModerateConcern
Yellow(3.05)
Steller sea lion 1.00:High 4.00:Low Concern 3.67:Low Concern Green(3.83)
120

Canary rockfish 1.00:High 4.00:Low Concern 5.00:Very LowConcern
Green(4.47)
Lingcod 2.00:Medium 4.00:Low Concern 5.00:Very LowConcern
Green(4.47)
Yellowmouth rockfish 1.00:High 4.00:Low Concern 5.00:Very LowConcern
Green(4.47)
Arrowtooth flounder 2.00:Medium 5.00:Very LowConcern
5.00:Very LowConcern
Green(5.00)
Silvergray rockfish 1.00:High 5.00:Very LowConcern
5.00:Very LowConcern
Green(5.00)
Southern Rock sole 2.00:Medium 5.00:Very LowConcern
5.00:Very LowConcern
Green(5.00)
Yellowtail rockfish 1.00:High 5.00:Very LowConcern
5.00:Very LowConcern
Green(5.00)
DOVER SOLE - BRITISH COLUMBIA/NORTHEAST PACIFIC - BOTTOM TRAWLS - CANADA - SOFT SUBSTRATE
Subscore: 2.16 Discard Rate: 0.95 C2 Rate: 2.05
SpeciesInherentVulnerability Abundance Fishing Mortality Subscore
Giant rattail 1.00:High 2.00:High Concern 2.33:ModerateConcern
Red (2.16)
Green sturgeon 1.00:High 2.00:High Concern 2.33:ModerateConcern
Red (2.16)
Longnose skate 1.00:High 2.00:High Concern 2.33:ModerateConcern
Red (2.16)
Shortspine thornyhead 1.00:High 2.00:High Concern 2.33:ModerateConcern
Red (2.16)
Pacific grenadier 1.00:High 2.00:High Concern 2.33:ModerateConcern
Red (2.16)
School shark 1.00:High 2.00:High Concern 2.33:ModerateConcern
Red (2.16)
Flathead sole 2.00:Medium 3.00:ModerateConcern
2.33:ModerateConcern
Yellow(2.64)
Rex sole 2.00:Medium 3.00:ModerateConcern
2.33:ModerateConcern
Yellow(2.64)
Spotted ratfish 1.00:High 3.00:ModerateConcern
2.33:ModerateConcern
Yellow(2.64)
121

Longspine thornyhead 1.00:High 2.00:High Concern 3.67:Low Concern Yellow(2.71)
Sixgill shark 1.00:High 2.00:High Concern 3.67:Low Concern Yellow(2.71)
Petrale sole 2.00:Medium 4.00:Low Concern 2.33:ModerateConcern
Yellow(3.05)
Pacific cod 2.00:Medium 2.00:High Concern 5.00:Very LowConcern
Yellow(3.16)
Big skate 1.00:High 3.00:ModerateConcern
3.67:Low Concern Green(3.32)
Spiny dogfish 1.00:High 3.00:ModerateConcern
3.67:Low Concern Green(3.32)
Steller sea lion 1.00:High 4.00:Low Concern 3.67:Low Concern Green(3.83)
English sole 2.00:Medium 4.00:Low Concern 3.67:Low Concern Green(3.83)
Sablefish 1.00:High 4.00:Low Concern 3.67:Low Concern Green(3.83)
ENGLISH SOLE - BRITISH COLUMBIA/NORTHEAST PACIFIC - BOTTOM TRAWLS - CANADA - SOFT SUBSTRATE
Subscore: 2.16 Discard Rate: 0.95 C2 Rate: 2.05
SpeciesInherentVulnerability Abundance Fishing Mortality Subscore
Giant rattail 1.00:High 2.00:High Concern 2.33:ModerateConcern
Red (2.16)
Green sturgeon 1.00:High 2.00:High Concern 2.33:ModerateConcern
Red (2.16)
Longnose skate 1.00:High 2.00:High Concern 2.33:ModerateConcern
Red (2.16)
Shortspine thornyhead 1.00:High 2.00:High Concern 2.33:ModerateConcern
Red (2.16)
Pacific grenadier 1.00:High 2.00:High Concern 2.33:ModerateConcern
Red (2.16)
School shark 1.00:High 2.00:High Concern 2.33:ModerateConcern
Red (2.16)
Dover sole 2.00:Medium 3.00:ModerateConcern
2.33:ModerateConcern
Yellow(2.64)
122
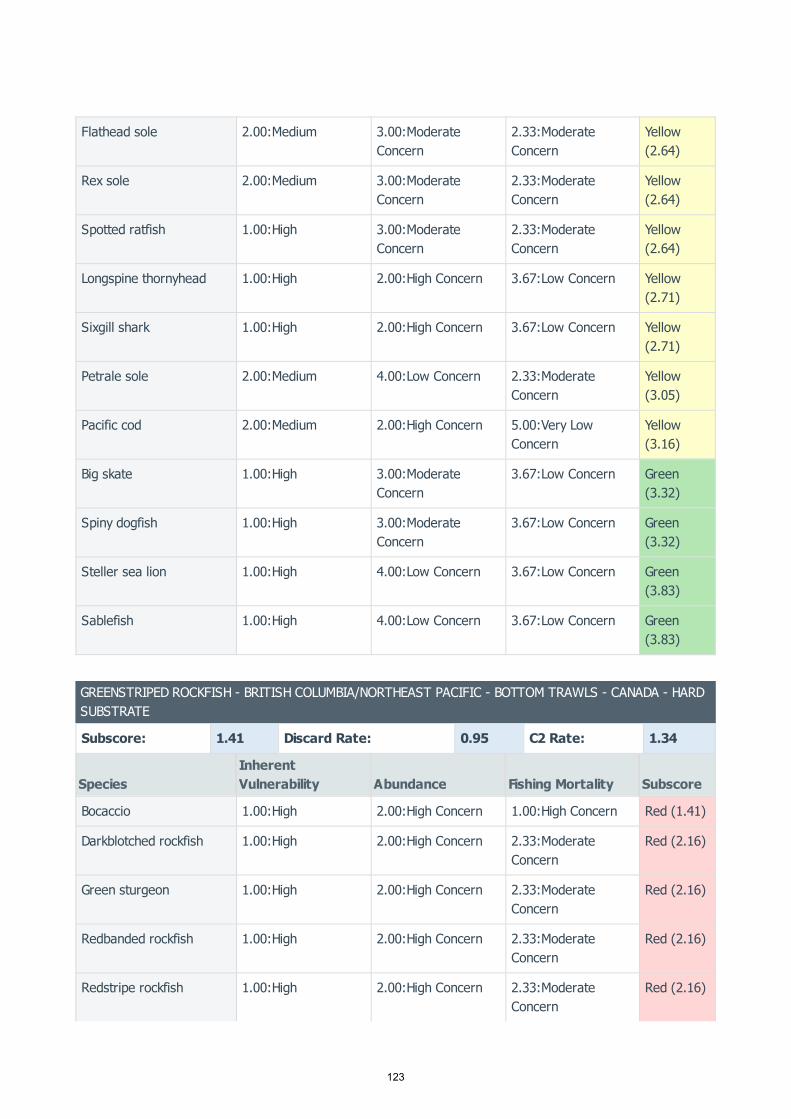
Flathead sole 2.00:Medium 3.00:ModerateConcern
2.33:ModerateConcern
Yellow(2.64)
Rex sole 2.00:Medium 3.00:ModerateConcern
2.33:ModerateConcern
Yellow(2.64)
Spotted ratfish 1.00:High 3.00:ModerateConcern
2.33:ModerateConcern
Yellow(2.64)
Longspine thornyhead 1.00:High 2.00:High Concern 3.67:Low Concern Yellow(2.71)
Sixgill shark 1.00:High 2.00:High Concern 3.67:Low Concern Yellow(2.71)
Petrale sole 2.00:Medium 4.00:Low Concern 2.33:ModerateConcern
Yellow(3.05)
Pacific cod 2.00:Medium 2.00:High Concern 5.00:Very LowConcern
Yellow(3.16)
Big skate 1.00:High 3.00:ModerateConcern
3.67:Low Concern Green(3.32)
Spiny dogfish 1.00:High 3.00:ModerateConcern
3.67:Low Concern Green(3.32)
Steller sea lion 1.00:High 4.00:Low Concern 3.67:Low Concern Green(3.83)
Sablefish 1.00:High 4.00:Low Concern 3.67:Low Concern Green(3.83)
GREENSTRIPED ROCKFISH - BRITISH COLUMBIA/NORTHEAST PACIFIC - BOTTOM TRAWLS - CANADA - HARDSUBSTRATE
Subscore: 1.41 Discard Rate: 0.95 C2 Rate: 1.34
SpeciesInherentVulnerability Abundance Fishing Mortality Subscore
Bocaccio 1.00:High 2.00:High Concern 1.00:High Concern Red (1.41)
Darkblotched rockfish 1.00:High 2.00:High Concern 2.33:ModerateConcern
Red (2.16)
Green sturgeon 1.00:High 2.00:High Concern 2.33:ModerateConcern
Red (2.16)
Redbanded rockfish 1.00:High 2.00:High Concern 2.33:ModerateConcern
Red (2.16)
Redstripe rockfish 1.00:High 2.00:High Concern 2.33:ModerateConcern
Red (2.16)
123

Rougheye rockfish 1.00:High 2.00:High Concern 2.33:ModerateConcern
Red (2.16)
Shortraker rockfish 1.00:High 2.00:High Concern 2.33:ModerateConcern
Red (2.16)
School shark 1.00:High 2.00:High Concern 2.33:ModerateConcern
Red (2.16)
Widow rockfish 1.00:High 2.00:High Concern 2.33:ModerateConcern
Red (2.16)
Sharpchin rockfish 1.00:High 3.00:ModerateConcern
2.33:ModerateConcern
Yellow(2.64)
Splitnose rockfish 1.00:High 3.00:ModerateConcern
2.33:ModerateConcern
Yellow(2.64)
Spotted ratfish 1.00:High 3.00:ModerateConcern
2.33:ModerateConcern
Yellow(2.64)
Sixgill shark 1.00:High 2.00:High Concern 3.67:Low Concern Yellow(2.71)
Pacific Ocean perch 1.00:High 4.00:Low Concern 2.33:ModerateConcern
Yellow(3.05)
Steller sea lion 1.00:High 4.00:Low Concern 3.67:Low Concern Green(3.83)
Canary rockfish 1.00:High 4.00:Low Concern 5.00:Very LowConcern
Green(4.47)
Lingcod 2.00:Medium 4.00:Low Concern 5.00:Very LowConcern
Green(4.47)
Yellowmouth rockfish 1.00:High 4.00:Low Concern 5.00:Very LowConcern
Green(4.47)
Arrowtooth flounder 2.00:Medium 5.00:Very LowConcern
5.00:Very LowConcern
Green(5.00)
Silvergray rockfish 1.00:High 5.00:Very LowConcern
5.00:Very LowConcern
Green(5.00)
Southern Rock sole 2.00:Medium 5.00:Very LowConcern
5.00:Very LowConcern
Green(5.00)
Yellowtail rockfish 1.00:High 5.00:Very LowConcern
5.00:Very LowConcern
Green(5.00)
GREENSTRIPED ROCKFISH - BRITISH COLUMBIA/NORTHEAST PACIFIC - MIDWATER TRAWLS - CANADA
Subscore: 1.41 Discard Rate: 0.95 C2 Rate: 1.34
124

Species
InherentVulnerability
Abundance Fishing Mortality Subscore
Bocaccio 1.00:High 2.00:High Concern 1.00:High Concern Red (1.41)
Darkblotched rockfish 1.00:High 2.00:High Concern 2.33:ModerateConcern
Red (2.16)
Green sturgeon 1.00:High 2.00:High Concern 2.33:ModerateConcern
Red (2.16)
Redbanded rockfish 1.00:High 2.00:High Concern 2.33:ModerateConcern
Red (2.16)
Redstripe rockfish 1.00:High 2.00:High Concern 2.33:ModerateConcern
Red (2.16)
Rougheye rockfish 1.00:High 2.00:High Concern 2.33:ModerateConcern
Red (2.16)
Shortraker rockfish 1.00:High 2.00:High Concern 2.33:ModerateConcern
Red (2.16)
School shark 1.00:High 2.00:High Concern 2.33:ModerateConcern
Red (2.16)
Widow rockfish 1.00:High 2.00:High Concern 2.33:ModerateConcern
Red (2.16)
Sharpchin rockfish 1.00:High 3.00:ModerateConcern
2.33:ModerateConcern
Yellow(2.64)
Splitnose rockfish 1.00:High 3.00:ModerateConcern
2.33:ModerateConcern
Yellow(2.64)
Spotted ratfish 1.00:High 3.00:ModerateConcern
2.33:ModerateConcern
Yellow(2.64)
Sixgill shark 1.00:High 2.00:High Concern 3.67:Low Concern Yellow(2.71)
Pacific Ocean perch 1.00:High 4.00:Low Concern 2.33:ModerateConcern
Yellow(3.05)
Steller sea lion 1.00:High 4.00:Low Concern 3.67:Low Concern Green(3.83)
Canary rockfish 1.00:High 4.00:Low Concern 5.00:Very LowConcern
Green(4.47)
Lingcod 2.00:Medium 4.00:Low Concern 5.00:Very LowConcern
Green(4.47)
Yellowmouth rockfish 1.00:High 4.00:Low Concern 5.00:Very LowConcern
Green(4.47)
Arrowtooth flounder 2.00:Medium 5.00:Very LowConcern
5.00:Very LowConcern
Green(5.00)
125
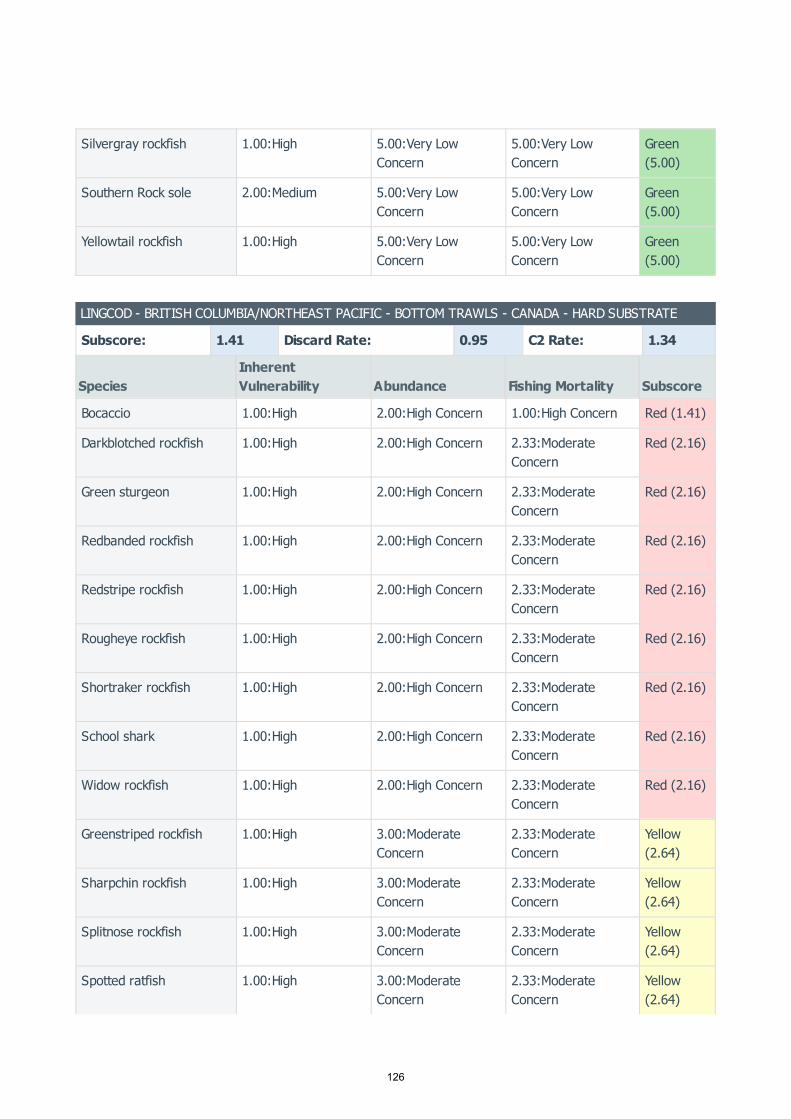
Silvergray rockfish 1.00:High 5.00:Very LowConcern
5.00:Very LowConcern
Green(5.00)
Southern Rock sole 2.00:Medium 5.00:Very LowConcern
5.00:Very LowConcern
Green(5.00)
Yellowtail rockfish 1.00:High 5.00:Very LowConcern
5.00:Very LowConcern
Green(5.00)
LINGCOD - BRITISH COLUMBIA/NORTHEAST PACIFIC - BOTTOM TRAWLS - CANADA - HARD SUBSTRATE
Subscore: 1.41 Discard Rate: 0.95 C2 Rate: 1.34
SpeciesInherentVulnerability Abundance Fishing Mortality Subscore
Bocaccio 1.00:High 2.00:High Concern 1.00:High Concern Red (1.41)
Darkblotched rockfish 1.00:High 2.00:High Concern 2.33:ModerateConcern
Red (2.16)
Green sturgeon 1.00:High 2.00:High Concern 2.33:ModerateConcern
Red (2.16)
Redbanded rockfish 1.00:High 2.00:High Concern 2.33:ModerateConcern
Red (2.16)
Redstripe rockfish 1.00:High 2.00:High Concern 2.33:ModerateConcern
Red (2.16)
Rougheye rockfish 1.00:High 2.00:High Concern 2.33:ModerateConcern
Red (2.16)
Shortraker rockfish 1.00:High 2.00:High Concern 2.33:ModerateConcern
Red (2.16)
School shark 1.00:High 2.00:High Concern 2.33:ModerateConcern
Red (2.16)
Widow rockfish 1.00:High 2.00:High Concern 2.33:ModerateConcern
Red (2.16)
Greenstriped rockfish 1.00:High 3.00:ModerateConcern
2.33:ModerateConcern
Yellow(2.64)
Sharpchin rockfish 1.00:High 3.00:ModerateConcern
2.33:ModerateConcern
Yellow(2.64)
Splitnose rockfish 1.00:High 3.00:ModerateConcern
2.33:ModerateConcern
Yellow(2.64)
Spotted ratfish 1.00:High 3.00:ModerateConcern
2.33:ModerateConcern
Yellow(2.64)
126

Sixgill shark 1.00:High 2.00:High Concern 3.67:Low Concern Yellow(2.71)
Pacific Ocean perch 1.00:High 4.00:Low Concern 2.33:ModerateConcern
Yellow(3.05)
Steller sea lion 1.00:High 4.00:Low Concern 3.67:Low Concern Green(3.83)
Canary rockfish 1.00:High 4.00:Low Concern 5.00:Very LowConcern
Green(4.47)
Yellowmouth rockfish 1.00:High 4.00:Low Concern 5.00:Very LowConcern
Green(4.47)
Arrowtooth flounder 2.00:Medium 5.00:Very LowConcern
5.00:Very LowConcern
Green(5.00)
Silvergray rockfish 1.00:High 5.00:Very LowConcern
5.00:Very LowConcern
Green(5.00)
Southern Rock sole 2.00:Medium 5.00:Very LowConcern
5.00:Very LowConcern
Green(5.00)
Yellowtail rockfish 1.00:High 5.00:Very LowConcern
5.00:Very LowConcern
Green(5.00)
LINGCOD - BRITISH COLUMBIA/NORTHEAST PACIFIC - JIG - CANADA - OUTSIDE ROCKFISH
Subscore: 2.16 Discard Rate: 0.95 C2 Rate: 2.05
SpeciesInherentVulnerability Abundance Fishing Mortality Subscore
Tiger rockfish 1.00:High 2.00:High Concern 2.33:ModerateConcern
Red (2.16)
Shortraker rockfish 1.00:High 2.00:High Concern 2.33:ModerateConcern
Red (2.16)
Rougheye rockfish 1.00:High 2.00:High Concern 2.33:ModerateConcern
Red (2.16)
Copper rockfish 1.00:High 2.00:High Concern 2.33:ModerateConcern
Red (2.16)
Redbanded rockfish 1.00:High 2.00:High Concern 2.33:ModerateConcern
Red (2.16)
China rockfish 1.00:High 2.00:High Concern 2.33:ModerateConcern
Red (2.16)
Yelloweye rockfish 1.00:High 2.00:High Concern 2.33:ModerateConcern
Red (2.16)
127

Sixgill shark 1.00:High 2.00:High Concern 3.67:Low Concern Yellow(2.71)
Quillback rockfish 1.00:High 2.00:High Concern 3.67:Low Concern Yellow(2.71)
Spiny dogfish 1.00:High 3.00:ModerateConcern
3.67:Low Concern Green(3.32)
Yellowtail rockfish 1.00:High 5.00:Very LowConcern
5.00:Very LowConcern
Green(5.00)
LINGCOD - BRITISH COLUMBIA/NORTHEAST PACIFIC - MIDWATER TRAWLS - CANADA
Subscore: 1.41 Discard Rate: 0.95 C2 Rate: 1.34
SpeciesInherentVulnerability Abundance Fishing Mortality Subscore
Bocaccio 1.00:High 2.00:High Concern 1.00:High Concern Red (1.41)
Darkblotched rockfish 1.00:High 2.00:High Concern 2.33:ModerateConcern
Red (2.16)
Green sturgeon 1.00:High 2.00:High Concern 2.33:ModerateConcern
Red (2.16)
Redbanded rockfish 1.00:High 2.00:High Concern 2.33:ModerateConcern
Red (2.16)
Redstripe rockfish 1.00:High 2.00:High Concern 2.33:ModerateConcern
Red (2.16)
Rougheye rockfish 1.00:High 2.00:High Concern 2.33:ModerateConcern
Red (2.16)
Shortraker rockfish 1.00:High 2.00:High Concern 2.33:ModerateConcern
Red (2.16)
School shark 1.00:High 2.00:High Concern 2.33:ModerateConcern
Red (2.16)
Widow rockfish 1.00:High 2.00:High Concern 2.33:ModerateConcern
Red (2.16)
Greenstriped rockfish 1.00:High 3.00:ModerateConcern
2.33:ModerateConcern
Yellow(2.64)
Sharpchin rockfish 1.00:High 3.00:ModerateConcern
2.33:ModerateConcern
Yellow(2.64)
Splitnose rockfish 1.00:High 3.00:ModerateConcern
2.33:ModerateConcern
Yellow(2.64)
128
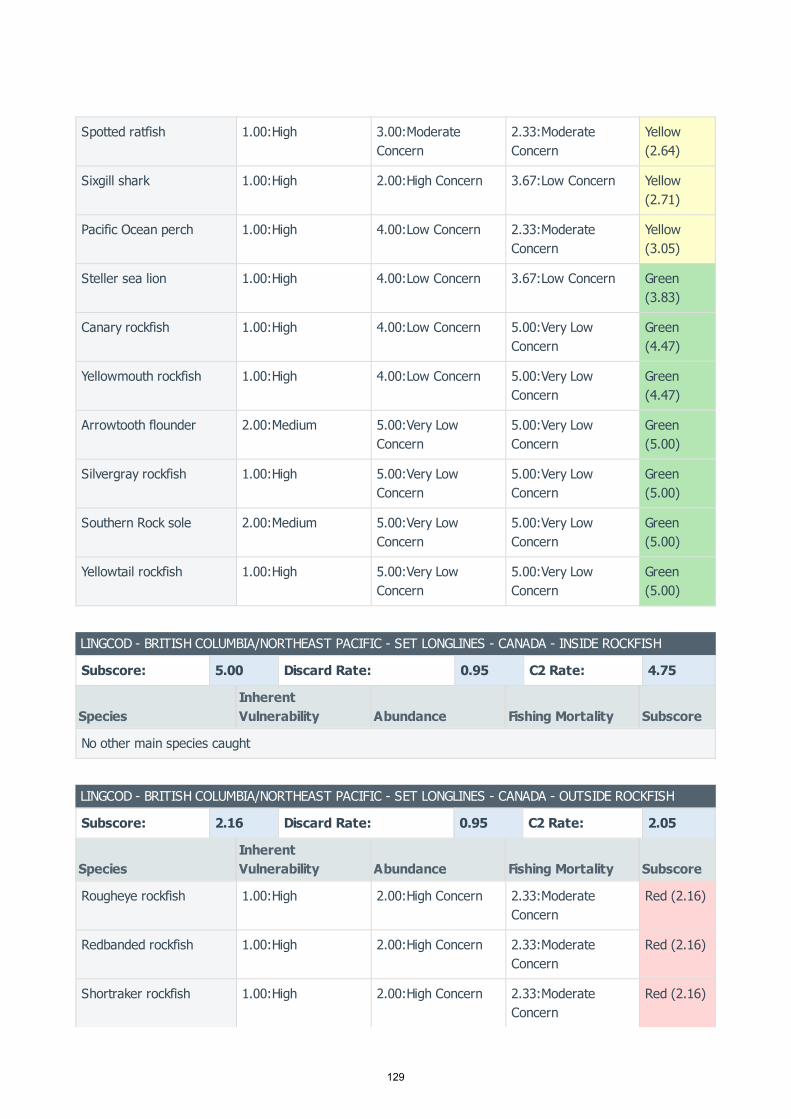
Spotted ratfish 1.00:High 3.00:ModerateConcern
2.33:ModerateConcern
Yellow(2.64)
Sixgill shark 1.00:High 2.00:High Concern 3.67:Low Concern Yellow(2.71)
Pacific Ocean perch 1.00:High 4.00:Low Concern 2.33:ModerateConcern
Yellow(3.05)
Steller sea lion 1.00:High 4.00:Low Concern 3.67:Low Concern Green(3.83)
Canary rockfish 1.00:High 4.00:Low Concern 5.00:Very LowConcern
Green(4.47)
Yellowmouth rockfish 1.00:High 4.00:Low Concern 5.00:Very LowConcern
Green(4.47)
Arrowtooth flounder 2.00:Medium 5.00:Very LowConcern
5.00:Very LowConcern
Green(5.00)
Silvergray rockfish 1.00:High 5.00:Very LowConcern
5.00:Very LowConcern
Green(5.00)
Southern Rock sole 2.00:Medium 5.00:Very LowConcern
5.00:Very LowConcern
Green(5.00)
Yellowtail rockfish 1.00:High 5.00:Very LowConcern
5.00:Very LowConcern
Green(5.00)
LINGCOD - BRITISH COLUMBIA/NORTHEAST PACIFIC - SET LONGLINES - CANADA - INSIDE ROCKFISH
Subscore: 5.00 Discard Rate: 0.95 C2 Rate: 4.75
SpeciesInherentVulnerability Abundance Fishing Mortality Subscore
No other main species caught
LINGCOD - BRITISH COLUMBIA/NORTHEAST PACIFIC - SET LONGLINES - CANADA - OUTSIDE ROCKFISH
Subscore: 2.16 Discard Rate: 0.95 C2 Rate: 2.05
SpeciesInherentVulnerability Abundance Fishing Mortality Subscore
Rougheye rockfish 1.00:High 2.00:High Concern 2.33:ModerateConcern
Red (2.16)
Redbanded rockfish 1.00:High 2.00:High Concern 2.33:ModerateConcern
Red (2.16)
Shortraker rockfish 1.00:High 2.00:High Concern 2.33:ModerateConcern
Red (2.16)
129
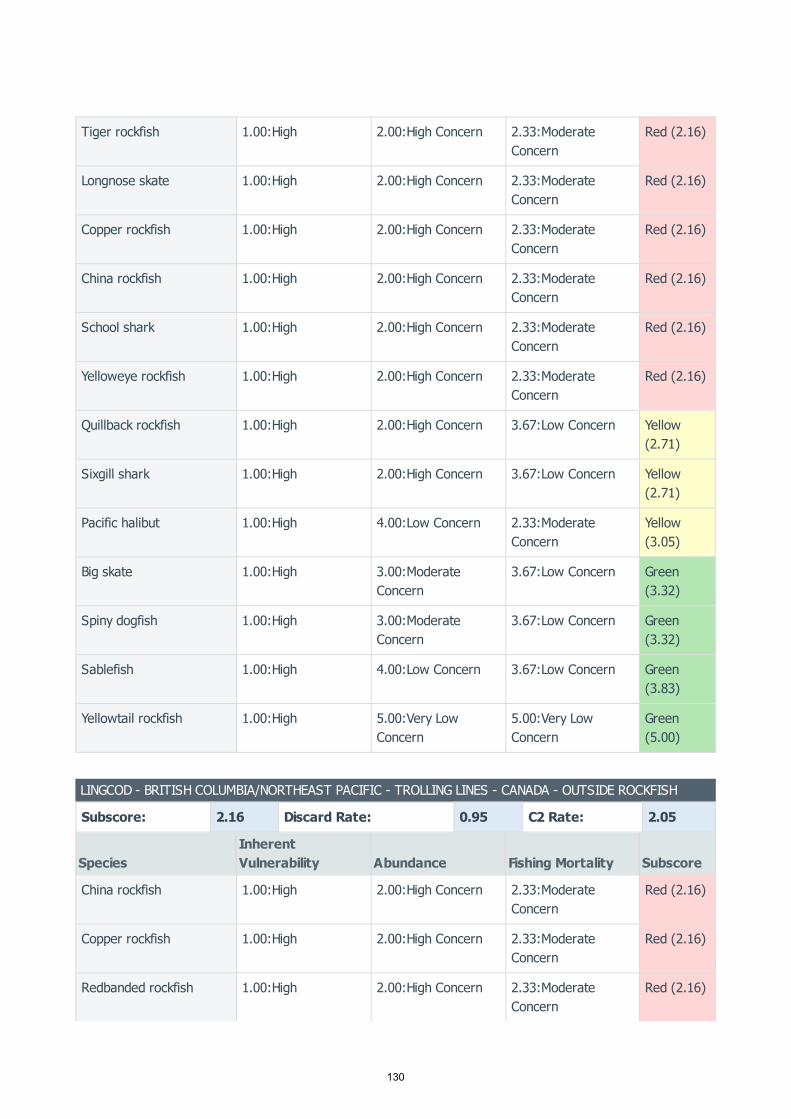
Tiger rockfish 1.00:High 2.00:High Concern 2.33:ModerateConcern
Red (2.16)
Longnose skate 1.00:High 2.00:High Concern 2.33:ModerateConcern
Red (2.16)
Copper rockfish 1.00:High 2.00:High Concern 2.33:ModerateConcern
Red (2.16)
China rockfish 1.00:High 2.00:High Concern 2.33:ModerateConcern
Red (2.16)
School shark 1.00:High 2.00:High Concern 2.33:ModerateConcern
Red (2.16)
Yelloweye rockfish 1.00:High 2.00:High Concern 2.33:ModerateConcern
Red (2.16)
Quillback rockfish 1.00:High 2.00:High Concern 3.67:Low Concern Yellow(2.71)
Sixgill shark 1.00:High 2.00:High Concern 3.67:Low Concern Yellow(2.71)
Pacific halibut 1.00:High 4.00:Low Concern 2.33:ModerateConcern
Yellow(3.05)
Big skate 1.00:High 3.00:ModerateConcern
3.67:Low Concern Green(3.32)
Spiny dogfish 1.00:High 3.00:ModerateConcern
3.67:Low Concern Green(3.32)
Sablefish 1.00:High 4.00:Low Concern 3.67:Low Concern Green(3.83)
Yellowtail rockfish 1.00:High 5.00:Very LowConcern
5.00:Very LowConcern
Green(5.00)
LINGCOD - BRITISH COLUMBIA/NORTHEAST PACIFIC - TROLLING LINES - CANADA - OUTSIDE ROCKFISH
Subscore: 2.16 Discard Rate: 0.95 C2 Rate: 2.05
SpeciesInherentVulnerability Abundance Fishing Mortality Subscore
China rockfish 1.00:High 2.00:High Concern 2.33:ModerateConcern
Red (2.16)
Copper rockfish 1.00:High 2.00:High Concern 2.33:ModerateConcern
Red (2.16)
Redbanded rockfish 1.00:High 2.00:High Concern 2.33:ModerateConcern
Red (2.16)
130

Rougheye rockfish 1.00:High 2.00:High Concern 2.33:ModerateConcern
Red (2.16)
Shortraker rockfish 1.00:High 2.00:High Concern 2.33:ModerateConcern
Red (2.16)
Tiger rockfish 1.00:High 2.00:High Concern 2.33:ModerateConcern
Red (2.16)
Yelloweye rockfish 1.00:High 2.00:High Concern 2.33:ModerateConcern
Red (2.16)
Quillback rockfish 1.00:High 2.00:High Concern 3.67:Low Concern Yellow(2.71)
Sixgill shark 1.00:High 2.00:High Concern 3.67:Low Concern Yellow(2.71)
Spiny dogfish 1.00:High 3.00:ModerateConcern
3.67:Low Concern Green(3.32)
Yellowtail rockfish 1.00:High 5.00:Very LowConcern
5.00:Very LowConcern
Green(5.00)
LONGNOSE SKATE - BRITISH COLUMBIA/NORTHEAST PACIFIC - BOTTOM TRAWLS - CANADA - SOFTSUBSTRATE
Subscore: 2.16 Discard Rate: 0.95 C2 Rate: 2.05
SpeciesInherentVulnerability Abundance Fishing Mortality Subscore
Giant rattail 1.00:High 2.00:High Concern 2.33:ModerateConcern
Red (2.16)
Green sturgeon 1.00:High 2.00:High Concern 2.33:ModerateConcern
Red (2.16)
Shortspine thornyhead 1.00:High 2.00:High Concern 2.33:ModerateConcern
Red (2.16)
Pacific grenadier 1.00:High 2.00:High Concern 2.33:ModerateConcern
Red (2.16)
School shark 1.00:High 2.00:High Concern 2.33:ModerateConcern
Red (2.16)
Dover sole 2.00:Medium 3.00:ModerateConcern
2.33:ModerateConcern
Yellow(2.64)
Flathead sole 2.00:Medium 3.00:ModerateConcern
2.33:ModerateConcern
Yellow(2.64)
Rex sole 2.00:Medium 3.00:ModerateConcern
2.33:ModerateConcern
Yellow(2.64)
131

Spotted ratfish 1.00:High 3.00:ModerateConcern
2.33:ModerateConcern
Yellow(2.64)
Longspine thornyhead 1.00:High 2.00:High Concern 3.67:Low Concern Yellow(2.71)
Sixgill shark 1.00:High 2.00:High Concern 3.67:Low Concern Yellow(2.71)
Petrale sole 2.00:Medium 4.00:Low Concern 2.33:ModerateConcern
Yellow(3.05)
Pacific cod 2.00:Medium 2.00:High Concern 5.00:Very LowConcern
Yellow(3.16)
Big skate 1.00:High 3.00:ModerateConcern
3.67:Low Concern Green(3.32)
Spiny dogfish 1.00:High 3.00:ModerateConcern
3.67:Low Concern Green(3.32)
Steller sea lion 1.00:High 4.00:Low Concern 3.67:Low Concern Green(3.83)
English sole 2.00:Medium 4.00:Low Concern 3.67:Low Concern Green(3.83)
Sablefish 1.00:High 4.00:Low Concern 3.67:Low Concern Green(3.83)
LONGNOSE SKATE - BRITISH COLUMBIA/NORTHEAST PACIFIC - LONGLINE (SHALLOW-SET) - CANADA
Subscore: 2.16 Discard Rate: 0.95 C2 Rate: 2.05
SpeciesInherentVulnerability Abundance Fishing Mortality Subscore
School shark 1.00:High 2.00:High Concern 2.33:ModerateConcern
Red (2.16)
Sixgill shark 1.00:High 2.00:High Concern 3.67:Low Concern Yellow(2.71)
Yelloweye rockfish 1.00:High 2.00:High Concern 3.67:Low Concern Yellow(2.71)
Spiny dogfish 1.00:High 3.00:ModerateConcern
3.67:Low Concern Green(3.32)
LONGNOSE SKATE - BRITISH COLUMBIA/NORTHEAST PACIFIC - SET LONGLINES - CANADA - OUTSIDEROCKFISH
Subscore: 2.16 Discard Rate: 0.95 C2 Rate: 2.05
132

SpeciesInherentVulnerability Abundance Fishing Mortality Subscore
Rougheye rockfish 1.00:High 2.00:High Concern 2.33:ModerateConcern
Red (2.16)
Redbanded rockfish 1.00:High 2.00:High Concern 2.33:ModerateConcern
Red (2.16)
Shortraker rockfish 1.00:High 2.00:High Concern 2.33:ModerateConcern
Red (2.16)
Tiger rockfish 1.00:High 2.00:High Concern 2.33:ModerateConcern
Red (2.16)
Copper rockfish 1.00:High 2.00:High Concern 2.33:ModerateConcern
Red (2.16)
China rockfish 1.00:High 2.00:High Concern 2.33:ModerateConcern
Red (2.16)
School shark 1.00:High 2.00:High Concern 2.33:ModerateConcern
Red (2.16)
Yelloweye rockfish 1.00:High 2.00:High Concern 2.33:ModerateConcern
Red (2.16)
Quillback rockfish 1.00:High 2.00:High Concern 3.67:Low Concern Yellow(2.71)
Sixgill shark 1.00:High 2.00:High Concern 3.67:Low Concern Yellow(2.71)
Pacific halibut 1.00:High 4.00:Low Concern 2.33:ModerateConcern
Yellow(3.05)
Big skate 1.00:High 3.00:ModerateConcern
3.67:Low Concern Green(3.32)
Spiny dogfish 1.00:High 3.00:ModerateConcern
3.67:Low Concern Green(3.32)
Sablefish 1.00:High 4.00:Low Concern 3.67:Low Concern Green(3.83)
Lingcod 2.00:Medium 4.00:Low Concern 5.00:Very LowConcern
Green(4.47)
Yellowtail rockfish 1.00:High 5.00:Very LowConcern
5.00:Very LowConcern
Green(5.00)
LONGSPINE THORNYHEAD - BRITISH COLUMBIA/NORTHEAST PACIFIC - BOTTOM TRAWLS - CANADA - SOFTSUBSTRATE
Subscore: 2.16 Discard Rate: 0.95 C2 Rate: 2.05
133

SpeciesInherentVulnerability Abundance Fishing Mortality Subscore
Giant rattail 1.00:High 2.00:High Concern 2.33:ModerateConcern
Red (2.16)
Green sturgeon 1.00:High 2.00:High Concern 2.33:ModerateConcern
Red (2.16)
Longnose skate 1.00:High 2.00:High Concern 2.33:ModerateConcern
Red (2.16)
Shortspine thornyhead 1.00:High 2.00:High Concern 2.33:ModerateConcern
Red (2.16)
Pacific grenadier 1.00:High 2.00:High Concern 2.33:ModerateConcern
Red (2.16)
School shark 1.00:High 2.00:High Concern 2.33:ModerateConcern
Red (2.16)
Dover sole 2.00:Medium 3.00:ModerateConcern
2.33:ModerateConcern
Yellow(2.64)
Flathead sole 2.00:Medium 3.00:ModerateConcern
2.33:ModerateConcern
Yellow(2.64)
Rex sole 2.00:Medium 3.00:ModerateConcern
2.33:ModerateConcern
Yellow(2.64)
Spotted ratfish 1.00:High 3.00:ModerateConcern
2.33:ModerateConcern
Yellow(2.64)
Sixgill shark 1.00:High 2.00:High Concern 3.67:Low Concern Yellow(2.71)
Petrale sole 2.00:Medium 4.00:Low Concern 2.33:ModerateConcern
Yellow(3.05)
Pacific cod 2.00:Medium 2.00:High Concern 5.00:Very LowConcern
Yellow(3.16)
Big skate 1.00:High 3.00:ModerateConcern
3.67:Low Concern Green(3.32)
Spiny dogfish 1.00:High 3.00:ModerateConcern
3.67:Low Concern Green(3.32)
Steller sea lion 1.00:High 4.00:Low Concern 3.67:Low Concern Green(3.83)
English sole 2.00:Medium 4.00:Low Concern 3.67:Low Concern Green(3.83)
Sablefish 1.00:High 4.00:Low Concern 3.67:Low Concern Green(3.83)
134

PACIFIC COD - BRITISH COLUMBIA/NORTHEAST PACIFIC - BOTTOM TRAWLS - CANADA - SOFT SUBSTRATE
Subscore: 2.16 Discard Rate: 0.95 C2 Rate: 2.05
SpeciesInherentVulnerability Abundance Fishing Mortality Subscore
Giant rattail 1.00:High 2.00:High Concern 2.33:ModerateConcern
Red (2.16)
Green sturgeon 1.00:High 2.00:High Concern 2.33:ModerateConcern
Red (2.16)
Longnose skate 1.00:High 2.00:High Concern 2.33:ModerateConcern
Red (2.16)
Shortspine thornyhead 1.00:High 2.00:High Concern 2.33:ModerateConcern
Red (2.16)
Pacific grenadier 1.00:High 2.00:High Concern 2.33:ModerateConcern
Red (2.16)
School shark 1.00:High 2.00:High Concern 2.33:ModerateConcern
Red (2.16)
Dover sole 2.00:Medium 3.00:ModerateConcern
2.33:ModerateConcern
Yellow(2.64)
Flathead sole 2.00:Medium 3.00:ModerateConcern
2.33:ModerateConcern
Yellow(2.64)
Rex sole 2.00:Medium 3.00:ModerateConcern
2.33:ModerateConcern
Yellow(2.64)
Spotted ratfish 1.00:High 3.00:ModerateConcern
2.33:ModerateConcern
Yellow(2.64)
Longspine thornyhead 1.00:High 2.00:High Concern 3.67:Low Concern Yellow(2.71)
Sixgill shark 1.00:High 2.00:High Concern 3.67:Low Concern Yellow(2.71)
Petrale sole 2.00:Medium 4.00:Low Concern 2.33:ModerateConcern
Yellow(3.05)
Big skate 1.00:High 3.00:ModerateConcern
3.67:Low Concern Green(3.32)
Spiny dogfish 1.00:High 3.00:ModerateConcern
3.67:Low Concern Green(3.32)
Steller sea lion 1.00:High 4.00:Low Concern 3.67:Low Concern Green(3.83)
English sole 2.00:Medium 4.00:Low Concern 3.67:Low Concern Green(3.83)
135

Sablefish 1.00:High 4.00:Low Concern 3.67:Low Concern Green(3.83)
PACIFIC OCEAN PERCH - BRITISH COLUMBIA/NORTHEAST PACIFIC - BOTTOM TRAWLS - CANADA - HARDSUBSTRATE
Subscore: 1.41 Discard Rate: 0.95 C2 Rate: 1.34
SpeciesInherentVulnerability Abundance Fishing Mortality Subscore
Bocaccio 1.00:High 2.00:High Concern 1.00:High Concern Red (1.41)
Darkblotched rockfish 1.00:High 2.00:High Concern 2.33:ModerateConcern
Red (2.16)
Green sturgeon 1.00:High 2.00:High Concern 2.33:ModerateConcern
Red (2.16)
Redbanded rockfish 1.00:High 2.00:High Concern 2.33:ModerateConcern
Red (2.16)
Redstripe rockfish 1.00:High 2.00:High Concern 2.33:ModerateConcern
Red (2.16)
Rougheye rockfish 1.00:High 2.00:High Concern 2.33:ModerateConcern
Red (2.16)
Shortraker rockfish 1.00:High 2.00:High Concern 2.33:ModerateConcern
Red (2.16)
School shark 1.00:High 2.00:High Concern 2.33:ModerateConcern
Red (2.16)
Widow rockfish 1.00:High 2.00:High Concern 2.33:ModerateConcern
Red (2.16)
Greenstriped rockfish 1.00:High 3.00:ModerateConcern
2.33:ModerateConcern
Yellow(2.64)
Sharpchin rockfish 1.00:High 3.00:ModerateConcern
2.33:ModerateConcern
Yellow(2.64)
Splitnose rockfish 1.00:High 3.00:ModerateConcern
2.33:ModerateConcern
Yellow(2.64)
Spotted ratfish 1.00:High 3.00:ModerateConcern
2.33:ModerateConcern
Yellow(2.64)
Sixgill shark 1.00:High 2.00:High Concern 3.67:Low Concern Yellow(2.71)
Steller sea lion 1.00:High 4.00:Low Concern 3.67:Low Concern Green(3.83)
136

Canary rockfish 1.00:High 4.00:Low Concern 5.00:Very LowConcern
Green(4.47)
Lingcod 2.00:Medium 4.00:Low Concern 5.00:Very LowConcern
Green(4.47)
Yellowmouth rockfish 1.00:High 4.00:Low Concern 5.00:Very LowConcern
Green(4.47)
Arrowtooth flounder 2.00:Medium 5.00:Very LowConcern
5.00:Very LowConcern
Green(5.00)
Silvergray rockfish 1.00:High 5.00:Very LowConcern
5.00:Very LowConcern
Green(5.00)
Southern Rock sole 2.00:Medium 5.00:Very LowConcern
5.00:Very LowConcern
Green(5.00)
Yellowtail rockfish 1.00:High 5.00:Very LowConcern
5.00:Very LowConcern
Green(5.00)
PACIFIC OCEAN PERCH - BRITISH COLUMBIA/NORTHEAST PACIFIC - MIDWATER TRAWLS - CANADA
Subscore: 1.41 Discard Rate: 0.95 C2 Rate: 1.34
SpeciesInherentVulnerability Abundance Fishing Mortality Subscore
Bocaccio 1.00:High 2.00:High Concern 1.00:High Concern Red (1.41)
Darkblotched rockfish 1.00:High 2.00:High Concern 2.33:ModerateConcern
Red (2.16)
Green sturgeon 1.00:High 2.00:High Concern 2.33:ModerateConcern
Red (2.16)
Redbanded rockfish 1.00:High 2.00:High Concern 2.33:ModerateConcern
Red (2.16)
Redstripe rockfish 1.00:High 2.00:High Concern 2.33:ModerateConcern
Red (2.16)
Rougheye rockfish 1.00:High 2.00:High Concern 2.33:ModerateConcern
Red (2.16)
Shortraker rockfish 1.00:High 2.00:High Concern 2.33:ModerateConcern
Red (2.16)
School shark 1.00:High 2.00:High Concern 2.33:ModerateConcern
Red (2.16)
Widow rockfish 1.00:High 2.00:High Concern 2.33:ModerateConcern
Red (2.16)
137
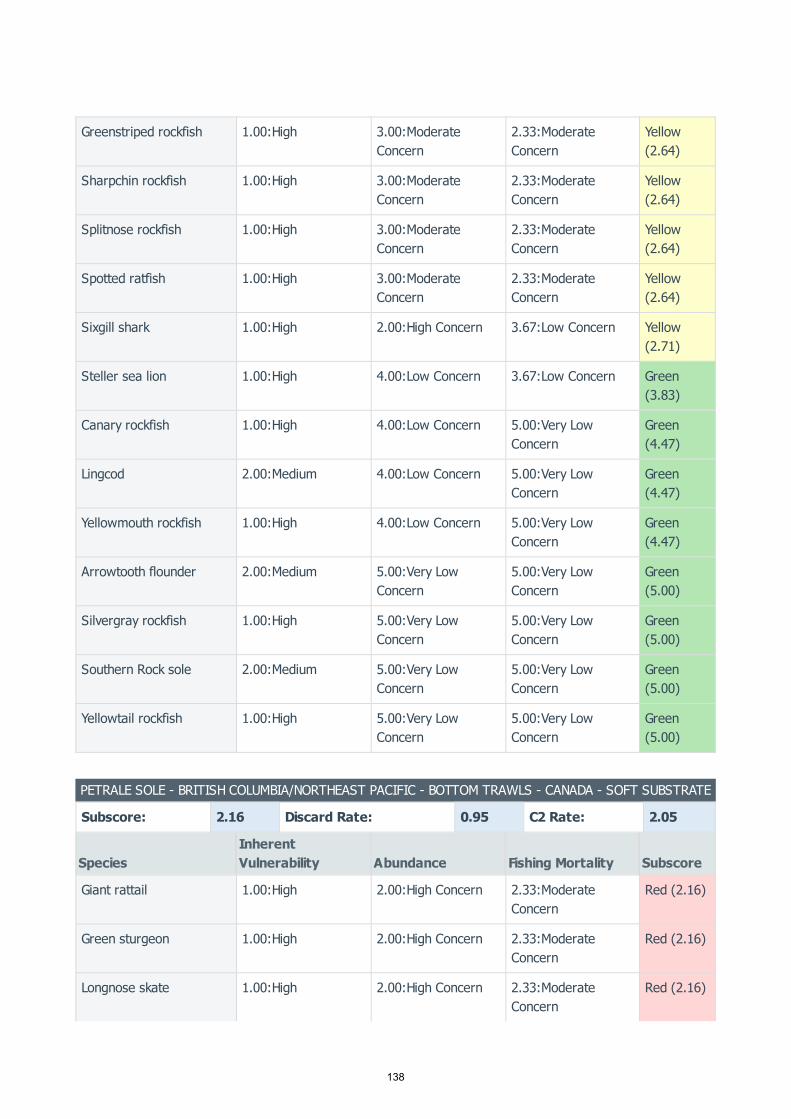
Greenstriped rockfish 1.00:High 3.00:ModerateConcern
2.33:ModerateConcern
Yellow(2.64)
Sharpchin rockfish 1.00:High 3.00:ModerateConcern
2.33:ModerateConcern
Yellow(2.64)
Splitnose rockfish 1.00:High 3.00:ModerateConcern
2.33:ModerateConcern
Yellow(2.64)
Spotted ratfish 1.00:High 3.00:ModerateConcern
2.33:ModerateConcern
Yellow(2.64)
Sixgill shark 1.00:High 2.00:High Concern 3.67:Low Concern Yellow(2.71)
Steller sea lion 1.00:High 4.00:Low Concern 3.67:Low Concern Green(3.83)
Canary rockfish 1.00:High 4.00:Low Concern 5.00:Very LowConcern
Green(4.47)
Lingcod 2.00:Medium 4.00:Low Concern 5.00:Very LowConcern
Green(4.47)
Yellowmouth rockfish 1.00:High 4.00:Low Concern 5.00:Very LowConcern
Green(4.47)
Arrowtooth flounder 2.00:Medium 5.00:Very LowConcern
5.00:Very LowConcern
Green(5.00)
Silvergray rockfish 1.00:High 5.00:Very LowConcern
5.00:Very LowConcern
Green(5.00)
Southern Rock sole 2.00:Medium 5.00:Very LowConcern
5.00:Very LowConcern
Green(5.00)
Yellowtail rockfish 1.00:High 5.00:Very LowConcern
5.00:Very LowConcern
Green(5.00)
PETRALE SOLE - BRITISH COLUMBIA/NORTHEAST PACIFIC - BOTTOM TRAWLS - CANADA - SOFT SUBSTRATE
Subscore: 2.16 Discard Rate: 0.95 C2 Rate: 2.05
SpeciesInherentVulnerability Abundance Fishing Mortality Subscore
Giant rattail 1.00:High 2.00:High Concern 2.33:ModerateConcern
Red (2.16)
Green sturgeon 1.00:High 2.00:High Concern 2.33:ModerateConcern
Red (2.16)
Longnose skate 1.00:High 2.00:High Concern 2.33:ModerateConcern
Red (2.16)
138
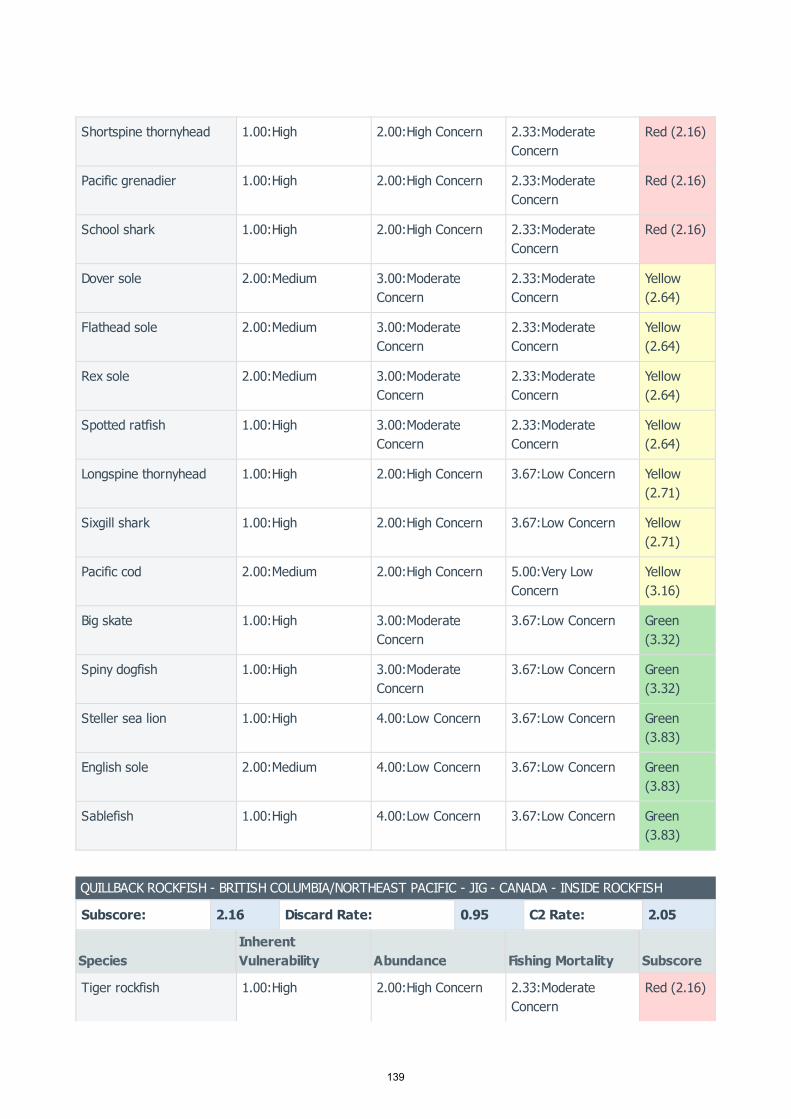
Shortspine thornyhead 1.00:High 2.00:High Concern 2.33:ModerateConcern
Red (2.16)
Pacific grenadier 1.00:High 2.00:High Concern 2.33:ModerateConcern
Red (2.16)
School shark 1.00:High 2.00:High Concern 2.33:ModerateConcern
Red (2.16)
Dover sole 2.00:Medium 3.00:ModerateConcern
2.33:ModerateConcern
Yellow(2.64)
Flathead sole 2.00:Medium 3.00:ModerateConcern
2.33:ModerateConcern
Yellow(2.64)
Rex sole 2.00:Medium 3.00:ModerateConcern
2.33:ModerateConcern
Yellow(2.64)
Spotted ratfish 1.00:High 3.00:ModerateConcern
2.33:ModerateConcern
Yellow(2.64)
Longspine thornyhead 1.00:High 2.00:High Concern 3.67:Low Concern Yellow(2.71)
Sixgill shark 1.00:High 2.00:High Concern 3.67:Low Concern Yellow(2.71)
Pacific cod 2.00:Medium 2.00:High Concern 5.00:Very LowConcern
Yellow(3.16)
Big skate 1.00:High 3.00:ModerateConcern
3.67:Low Concern Green(3.32)
Spiny dogfish 1.00:High 3.00:ModerateConcern
3.67:Low Concern Green(3.32)
Steller sea lion 1.00:High 4.00:Low Concern 3.67:Low Concern Green(3.83)
English sole 2.00:Medium 4.00:Low Concern 3.67:Low Concern Green(3.83)
Sablefish 1.00:High 4.00:Low Concern 3.67:Low Concern Green(3.83)
QUILLBACK ROCKFISH - BRITISH COLUMBIA/NORTHEAST PACIFIC - JIG - CANADA - INSIDE ROCKFISH
Subscore: 2.16 Discard Rate: 0.95 C2 Rate: 2.05
SpeciesInherentVulnerability Abundance Fishing Mortality Subscore
Tiger rockfish 1.00:High 2.00:High Concern 2.33:ModerateConcern
Red (2.16)
139
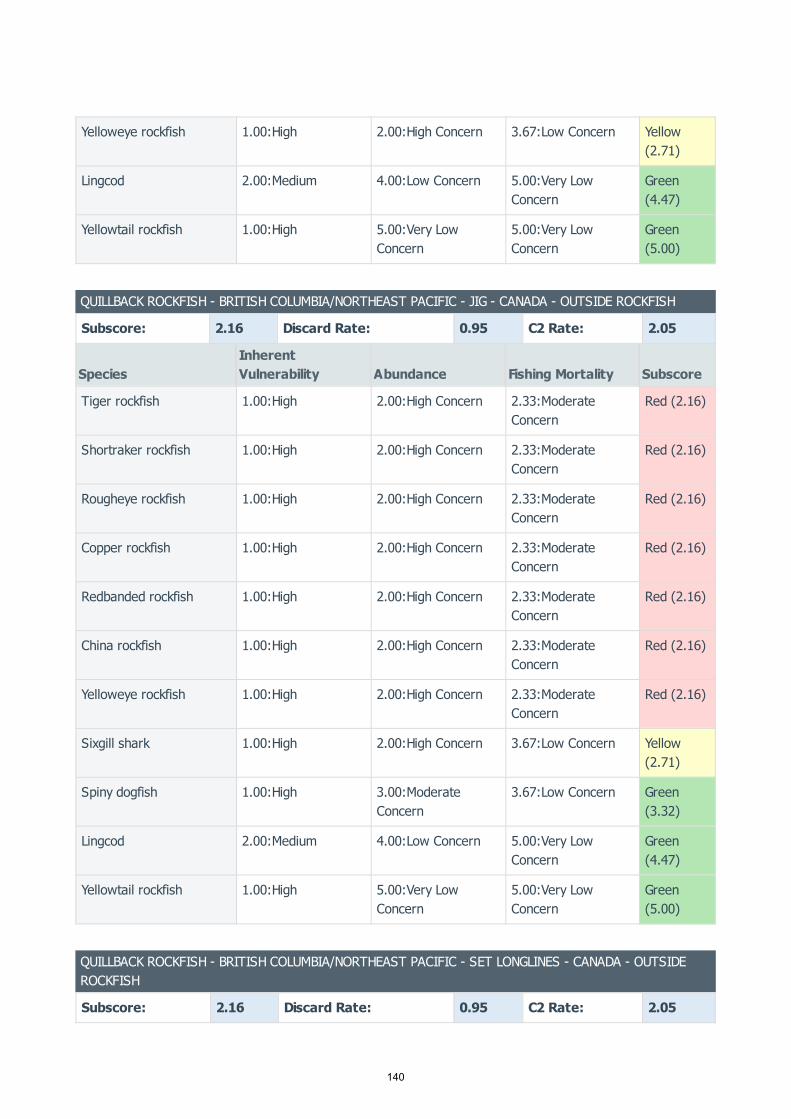
Yelloweye rockfish 1.00:High 2.00:High Concern 3.67:Low Concern Yellow(2.71)
Lingcod 2.00:Medium 4.00:Low Concern 5.00:Very LowConcern
Green(4.47)
Yellowtail rockfish 1.00:High 5.00:Very LowConcern
5.00:Very LowConcern
Green(5.00)
QUILLBACK ROCKFISH - BRITISH COLUMBIA/NORTHEAST PACIFIC - JIG - CANADA - OUTSIDE ROCKFISH
Subscore: 2.16 Discard Rate: 0.95 C2 Rate: 2.05
SpeciesInherentVulnerability Abundance Fishing Mortality Subscore
Tiger rockfish 1.00:High 2.00:High Concern 2.33:ModerateConcern
Red (2.16)
Shortraker rockfish 1.00:High 2.00:High Concern 2.33:ModerateConcern
Red (2.16)
Rougheye rockfish 1.00:High 2.00:High Concern 2.33:ModerateConcern
Red (2.16)
Copper rockfish 1.00:High 2.00:High Concern 2.33:ModerateConcern
Red (2.16)
Redbanded rockfish 1.00:High 2.00:High Concern 2.33:ModerateConcern
Red (2.16)
China rockfish 1.00:High 2.00:High Concern 2.33:ModerateConcern
Red (2.16)
Yelloweye rockfish 1.00:High 2.00:High Concern 2.33:ModerateConcern
Red (2.16)
Sixgill shark 1.00:High 2.00:High Concern 3.67:Low Concern Yellow(2.71)
Spiny dogfish 1.00:High 3.00:ModerateConcern
3.67:Low Concern Green(3.32)
Lingcod 2.00:Medium 4.00:Low Concern 5.00:Very LowConcern
Green(4.47)
Yellowtail rockfish 1.00:High 5.00:Very LowConcern
5.00:Very LowConcern
Green(5.00)
QUILLBACK ROCKFISH - BRITISH COLUMBIA/NORTHEAST PACIFIC - SET LONGLINES - CANADA - OUTSIDEROCKFISH
Subscore: 2.16 Discard Rate: 0.95 C2 Rate: 2.05
140
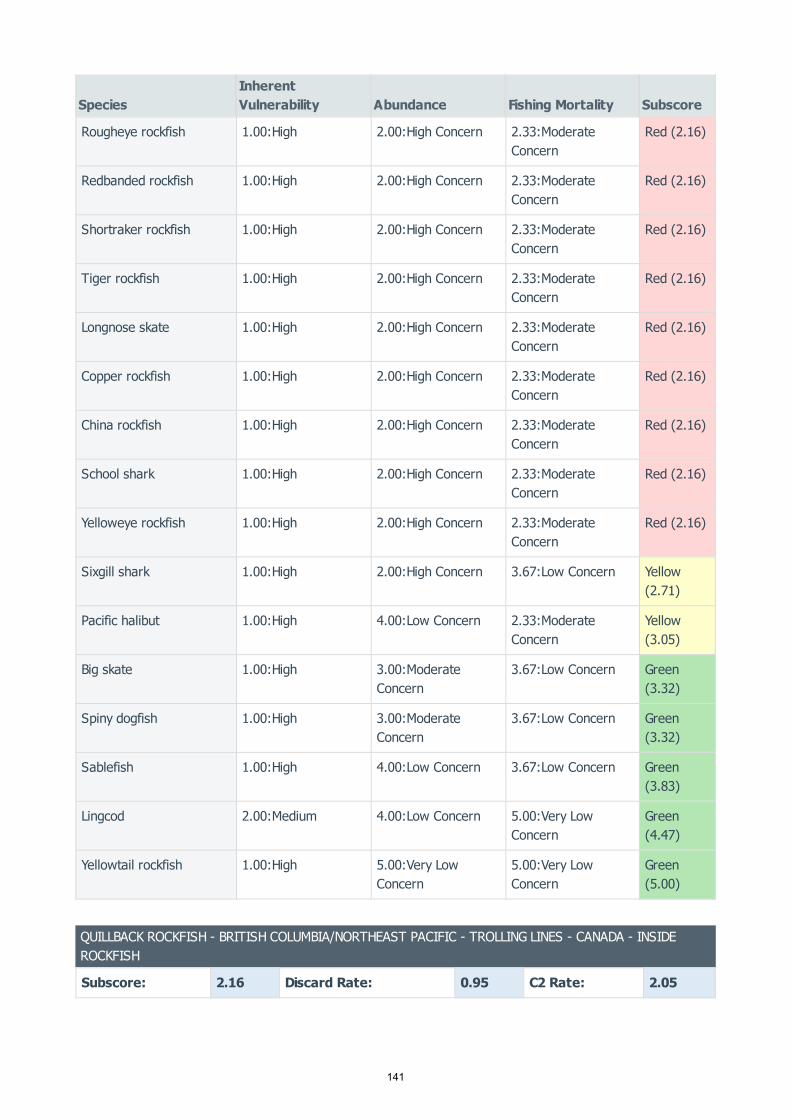
SpeciesInherentVulnerability Abundance Fishing Mortality Subscore
Rougheye rockfish 1.00:High 2.00:High Concern 2.33:ModerateConcern
Red (2.16)
Redbanded rockfish 1.00:High 2.00:High Concern 2.33:ModerateConcern
Red (2.16)
Shortraker rockfish 1.00:High 2.00:High Concern 2.33:ModerateConcern
Red (2.16)
Tiger rockfish 1.00:High 2.00:High Concern 2.33:ModerateConcern
Red (2.16)
Longnose skate 1.00:High 2.00:High Concern 2.33:ModerateConcern
Red (2.16)
Copper rockfish 1.00:High 2.00:High Concern 2.33:ModerateConcern
Red (2.16)
China rockfish 1.00:High 2.00:High Concern 2.33:ModerateConcern
Red (2.16)
School shark 1.00:High 2.00:High Concern 2.33:ModerateConcern
Red (2.16)
Yelloweye rockfish 1.00:High 2.00:High Concern 2.33:ModerateConcern
Red (2.16)
Sixgill shark 1.00:High 2.00:High Concern 3.67:Low Concern Yellow(2.71)
Pacific halibut 1.00:High 4.00:Low Concern 2.33:ModerateConcern
Yellow(3.05)
Big skate 1.00:High 3.00:ModerateConcern
3.67:Low Concern Green(3.32)
Spiny dogfish 1.00:High 3.00:ModerateConcern
3.67:Low Concern Green(3.32)
Sablefish 1.00:High 4.00:Low Concern 3.67:Low Concern Green(3.83)
Lingcod 2.00:Medium 4.00:Low Concern 5.00:Very LowConcern
Green(4.47)
Yellowtail rockfish 1.00:High 5.00:Very LowConcern
5.00:Very LowConcern
Green(5.00)
QUILLBACK ROCKFISH - BRITISH COLUMBIA/NORTHEAST PACIFIC - TROLLING LINES - CANADA - INSIDEROCKFISH
Subscore: 2.16 Discard Rate: 0.95 C2 Rate: 2.05
141

SpeciesInherentVulnerability Abundance Fishing Mortality Subscore
Tiger rockfish 1.00:High 2.00:High Concern 2.33:ModerateConcern
Red (2.16)
Yelloweye rockfish 1.00:High 2.00:High Concern 3.67:Low Concern Yellow(2.71)
Lingcod 2.00:Medium 4.00:Low Concern 5.00:Very LowConcern
Green(4.47)
Yellowtail rockfish 1.00:High 5.00:Very LowConcern
5.00:Very LowConcern
Green(5.00)
QUILLBACK ROCKFISH - BRITISH COLUMBIA/NORTHEAST PACIFIC - TROLLING LINES - CANADA - OUTSIDEROCKFISH
Subscore: 2.16 Discard Rate: 0.95 C2 Rate: 2.05
SpeciesInherentVulnerability Abundance Fishing Mortality Subscore
China rockfish 1.00:High 2.00:High Concern 2.33:ModerateConcern
Red (2.16)
Copper rockfish 1.00:High 2.00:High Concern 2.33:ModerateConcern
Red (2.16)
Redbanded rockfish 1.00:High 2.00:High Concern 2.33:ModerateConcern
Red (2.16)
Rougheye rockfish 1.00:High 2.00:High Concern 2.33:ModerateConcern
Red (2.16)
Shortraker rockfish 1.00:High 2.00:High Concern 2.33:ModerateConcern
Red (2.16)
Tiger rockfish 1.00:High 2.00:High Concern 2.33:ModerateConcern
Red (2.16)
Yelloweye rockfish 1.00:High 2.00:High Concern 2.33:ModerateConcern
Red (2.16)
Sixgill shark 1.00:High 2.00:High Concern 3.67:Low Concern Yellow(2.71)
Spiny dogfish 1.00:High 3.00:ModerateConcern
3.67:Low Concern Green(3.32)
Lingcod 2.00:Medium 4.00:Low Concern 5.00:Very LowConcern
Green(4.47)
Yellowtail rockfish 1.00:High 5.00:Very LowConcern
5.00:Very LowConcern
Green(5.00)
142
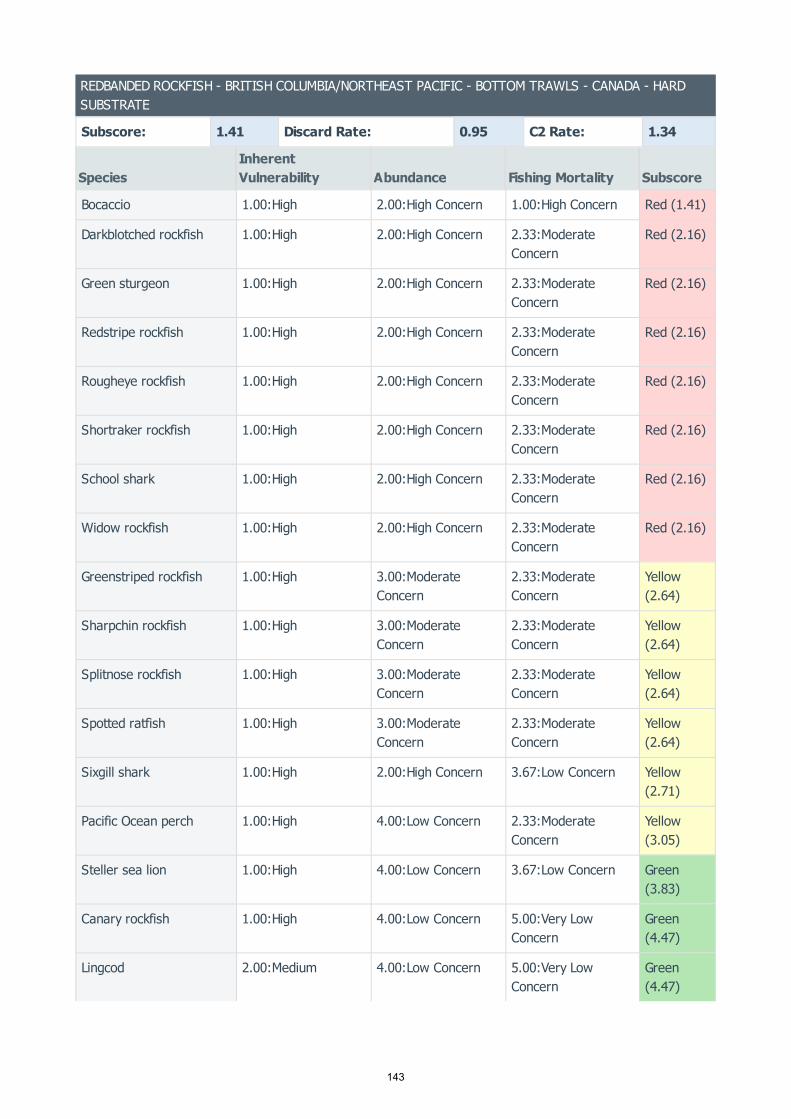
REDBANDED ROCKFISH - BRITISH COLUMBIA/NORTHEAST PACIFIC - BOTTOM TRAWLS - CANADA - HARDSUBSTRATE
Subscore: 1.41 Discard Rate: 0.95 C2 Rate: 1.34
SpeciesInherentVulnerability Abundance Fishing Mortality Subscore
Bocaccio 1.00:High 2.00:High Concern 1.00:High Concern Red (1.41)
Darkblotched rockfish 1.00:High 2.00:High Concern 2.33:ModerateConcern
Red (2.16)
Green sturgeon 1.00:High 2.00:High Concern 2.33:ModerateConcern
Red (2.16)
Redstripe rockfish 1.00:High 2.00:High Concern 2.33:ModerateConcern
Red (2.16)
Rougheye rockfish 1.00:High 2.00:High Concern 2.33:ModerateConcern
Red (2.16)
Shortraker rockfish 1.00:High 2.00:High Concern 2.33:ModerateConcern
Red (2.16)
School shark 1.00:High 2.00:High Concern 2.33:ModerateConcern
Red (2.16)
Widow rockfish 1.00:High 2.00:High Concern 2.33:ModerateConcern
Red (2.16)
Greenstriped rockfish 1.00:High 3.00:ModerateConcern
2.33:ModerateConcern
Yellow(2.64)
Sharpchin rockfish 1.00:High 3.00:ModerateConcern
2.33:ModerateConcern
Yellow(2.64)
Splitnose rockfish 1.00:High 3.00:ModerateConcern
2.33:ModerateConcern
Yellow(2.64)
Spotted ratfish 1.00:High 3.00:ModerateConcern
2.33:ModerateConcern
Yellow(2.64)
Sixgill shark 1.00:High 2.00:High Concern 3.67:Low Concern Yellow(2.71)
Pacific Ocean perch 1.00:High 4.00:Low Concern 2.33:ModerateConcern
Yellow(3.05)
Steller sea lion 1.00:High 4.00:Low Concern 3.67:Low Concern Green(3.83)
Canary rockfish 1.00:High 4.00:Low Concern 5.00:Very LowConcern
Green(4.47)
Lingcod 2.00:Medium 4.00:Low Concern 5.00:Very LowConcern
Green(4.47)
143

Yellowmouth rockfish 1.00:High 4.00:Low Concern 5.00:Very LowConcern
Green(4.47)
Arrowtooth flounder 2.00:Medium 5.00:Very LowConcern
5.00:Very LowConcern
Green(5.00)
Silvergray rockfish 1.00:High 5.00:Very LowConcern
5.00:Very LowConcern
Green(5.00)
Southern Rock sole 2.00:Medium 5.00:Very LowConcern
5.00:Very LowConcern
Green(5.00)
Yellowtail rockfish 1.00:High 5.00:Very LowConcern
5.00:Very LowConcern
Green(5.00)
REDBANDED ROCKFISH - BRITISH COLUMBIA/NORTHEAST PACIFIC - JIG - CANADA - OUTSIDE ROCKFISH
Subscore: 2.16 Discard Rate: 0.95 C2 Rate: 2.05
SpeciesInherentVulnerability Abundance Fishing Mortality Subscore
Tiger rockfish 1.00:High 2.00:High Concern 2.33:ModerateConcern
Red (2.16)
Shortraker rockfish 1.00:High 2.00:High Concern 2.33:ModerateConcern
Red (2.16)
Rougheye rockfish 1.00:High 2.00:High Concern 2.33:ModerateConcern
Red (2.16)
Copper rockfish 1.00:High 2.00:High Concern 2.33:ModerateConcern
Red (2.16)
China rockfish 1.00:High 2.00:High Concern 2.33:ModerateConcern
Red (2.16)
Yelloweye rockfish 1.00:High 2.00:High Concern 2.33:ModerateConcern
Red (2.16)
Sixgill shark 1.00:High 2.00:High Concern 3.67:Low Concern Yellow(2.71)
Quillback rockfish 1.00:High 2.00:High Concern 3.67:Low Concern Yellow(2.71)
Spiny dogfish 1.00:High 3.00:ModerateConcern
3.67:Low Concern Green(3.32)
Lingcod 2.00:Medium 4.00:Low Concern 5.00:Very LowConcern
Green(4.47)
Yellowtail rockfish 1.00:High 5.00:Very LowConcern
5.00:Very LowConcern
Green(5.00)
144

REDBANDED ROCKFISH - BRITISH COLUMBIA/NORTHEAST PACIFIC - LONGLINE (DEEP-SET) - CANADA
Subscore: 2.16 Discard Rate: 0.95 C2 Rate: 2.05
SpeciesInherentVulnerability Abundance Fishing Mortality Subscore
Rougheye rockfish 1.00:High 2.00:High Concern 2.33:ModerateConcern
Red (2.16)
Shortraker rockfish 1.00:High 2.00:High Concern 2.33:ModerateConcern
Red (2.16)
Yelloweye rockfish 1.00:High 2.00:High Concern 2.33:ModerateConcern
Red (2.16)
Sixgill shark 1.00:High 2.00:High Concern 3.67:Low Concern Yellow(2.71)
Sablefish 1.00:High 4.00:Low Concern 3.67:Low Concern Green(3.83)
REDBANDED ROCKFISH - BRITISH COLUMBIA/NORTHEAST PACIFIC - MIDWATER TRAWLS - CANADA
Subscore: 1.41 Discard Rate: 0.95 C2 Rate: 1.34
SpeciesInherentVulnerability Abundance Fishing Mortality Subscore
Bocaccio 1.00:High 2.00:High Concern 1.00:High Concern Red (1.41)
Darkblotched rockfish 1.00:High 2.00:High Concern 2.33:ModerateConcern
Red (2.16)
Green sturgeon 1.00:High 2.00:High Concern 2.33:ModerateConcern
Red (2.16)
Redstripe rockfish 1.00:High 2.00:High Concern 2.33:ModerateConcern
Red (2.16)
Rougheye rockfish 1.00:High 2.00:High Concern 2.33:ModerateConcern
Red (2.16)
Shortraker rockfish 1.00:High 2.00:High Concern 2.33:ModerateConcern
Red (2.16)
School shark 1.00:High 2.00:High Concern 2.33:ModerateConcern
Red (2.16)
Widow rockfish 1.00:High 2.00:High Concern 2.33:ModerateConcern
Red (2.16)
Greenstriped rockfish 1.00:High 3.00:ModerateConcern
2.33:ModerateConcern
Yellow(2.64)
Sharpchin rockfish 1.00:High 3.00:ModerateConcern
2.33:ModerateConcern
Yellow(2.64)
145
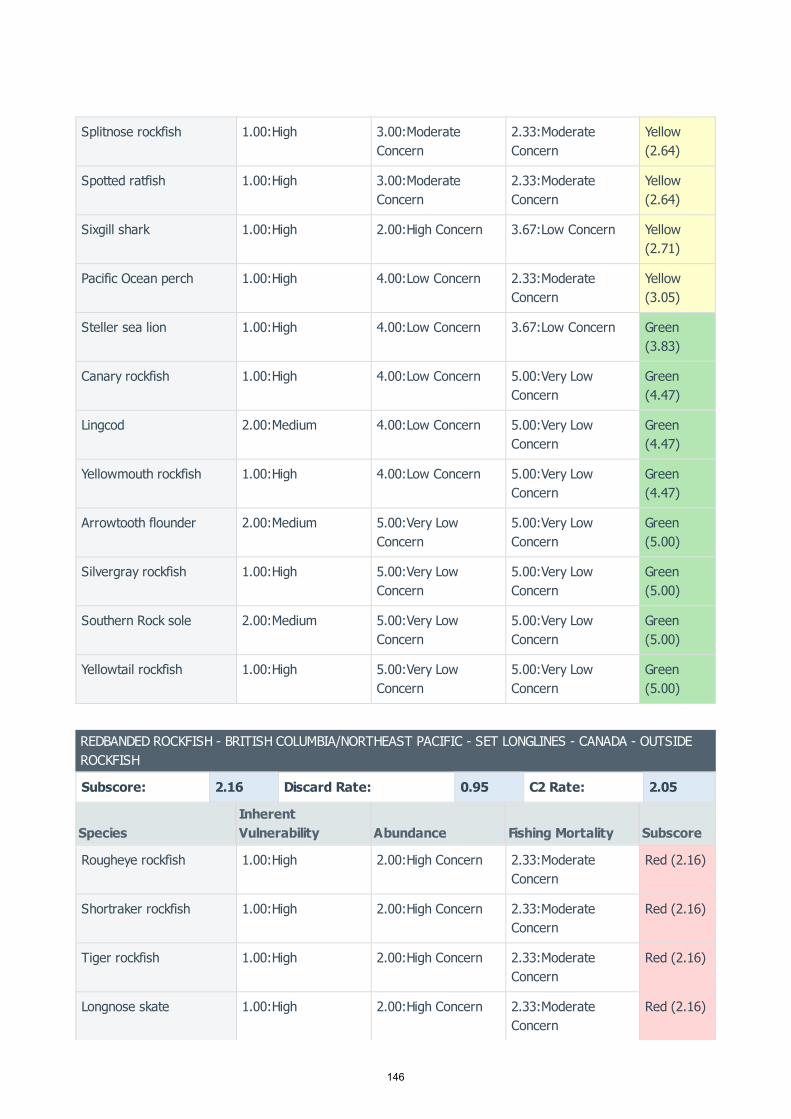
Splitnose rockfish 1.00:High 3.00:ModerateConcern
2.33:ModerateConcern
Yellow(2.64)
Spotted ratfish 1.00:High 3.00:ModerateConcern
2.33:ModerateConcern
Yellow(2.64)
Sixgill shark 1.00:High 2.00:High Concern 3.67:Low Concern Yellow(2.71)
Pacific Ocean perch 1.00:High 4.00:Low Concern 2.33:ModerateConcern
Yellow(3.05)
Steller sea lion 1.00:High 4.00:Low Concern 3.67:Low Concern Green(3.83)
Canary rockfish 1.00:High 4.00:Low Concern 5.00:Very LowConcern
Green(4.47)
Lingcod 2.00:Medium 4.00:Low Concern 5.00:Very LowConcern
Green(4.47)
Yellowmouth rockfish 1.00:High 4.00:Low Concern 5.00:Very LowConcern
Green(4.47)
Arrowtooth flounder 2.00:Medium 5.00:Very LowConcern
5.00:Very LowConcern
Green(5.00)
Silvergray rockfish 1.00:High 5.00:Very LowConcern
5.00:Very LowConcern
Green(5.00)
Southern Rock sole 2.00:Medium 5.00:Very LowConcern
5.00:Very LowConcern
Green(5.00)
Yellowtail rockfish 1.00:High 5.00:Very LowConcern
5.00:Very LowConcern
Green(5.00)
REDBANDED ROCKFISH - BRITISH COLUMBIA/NORTHEAST PACIFIC - SET LONGLINES - CANADA - OUTSIDEROCKFISH
Subscore: 2.16 Discard Rate: 0.95 C2 Rate: 2.05
SpeciesInherentVulnerability Abundance Fishing Mortality Subscore
Rougheye rockfish 1.00:High 2.00:High Concern 2.33:ModerateConcern
Red (2.16)
Shortraker rockfish 1.00:High 2.00:High Concern 2.33:ModerateConcern
Red (2.16)
Tiger rockfish 1.00:High 2.00:High Concern 2.33:ModerateConcern
Red (2.16)
Longnose skate 1.00:High 2.00:High Concern 2.33:ModerateConcern
Red (2.16)
146

Copper rockfish 1.00:High 2.00:High Concern 2.33:ModerateConcern
Red (2.16)
China rockfish 1.00:High 2.00:High Concern 2.33:ModerateConcern
Red (2.16)
School shark 1.00:High 2.00:High Concern 2.33:ModerateConcern
Red (2.16)
Yelloweye rockfish 1.00:High 2.00:High Concern 2.33:ModerateConcern
Red (2.16)
Quillback rockfish 1.00:High 2.00:High Concern 3.67:Low Concern Yellow(2.71)
Sixgill shark 1.00:High 2.00:High Concern 3.67:Low Concern Yellow(2.71)
Pacific halibut 1.00:High 4.00:Low Concern 2.33:ModerateConcern
Yellow(3.05)
Big skate 1.00:High 3.00:ModerateConcern
3.67:Low Concern Green(3.32)
Spiny dogfish 1.00:High 3.00:ModerateConcern
3.67:Low Concern Green(3.32)
Sablefish 1.00:High 4.00:Low Concern 3.67:Low Concern Green(3.83)
Lingcod 2.00:Medium 4.00:Low Concern 5.00:Very LowConcern
Green(4.47)
Yellowtail rockfish 1.00:High 5.00:Very LowConcern
5.00:Very LowConcern
Green(5.00)
REDBANDED ROCKFISH - BRITISH COLUMBIA/NORTHEAST PACIFIC - TROLLING LINES - CANADA - OUTSIDEROCKFISH
Subscore: 2.16 Discard Rate: 0.95 C2 Rate: 2.05
SpeciesInherentVulnerability Abundance Fishing Mortality Subscore
China rockfish 1.00:High 2.00:High Concern 2.33:ModerateConcern
Red (2.16)
Copper rockfish 1.00:High 2.00:High Concern 2.33:ModerateConcern
Red (2.16)
Rougheye rockfish 1.00:High 2.00:High Concern 2.33:ModerateConcern
Red (2.16)
Shortraker rockfish 1.00:High 2.00:High Concern 2.33:ModerateConcern
Red (2.16)
147

Tiger rockfish 1.00:High 2.00:High Concern 2.33:ModerateConcern
Red (2.16)
Yelloweye rockfish 1.00:High 2.00:High Concern 2.33:ModerateConcern
Red (2.16)
Quillback rockfish 1.00:High 2.00:High Concern 3.67:Low Concern Yellow(2.71)
Sixgill shark 1.00:High 2.00:High Concern 3.67:Low Concern Yellow(2.71)
Spiny dogfish 1.00:High 3.00:ModerateConcern
3.67:Low Concern Green(3.32)
Lingcod 2.00:Medium 4.00:Low Concern 5.00:Very LowConcern
Green(4.47)
Yellowtail rockfish 1.00:High 5.00:Very LowConcern
5.00:Very LowConcern
Green(5.00)
REDSTRIPE ROCKFISH - BRITISH COLUMBIA/NORTHEAST PACIFIC - BOTTOM TRAWLS - CANADA - HARDSUBSTRATE
Subscore: 1.41 Discard Rate: 0.95 C2 Rate: 1.34
SpeciesInherentVulnerability Abundance Fishing Mortality Subscore
Bocaccio 1.00:High 2.00:High Concern 1.00:High Concern Red (1.41)
Darkblotched rockfish 1.00:High 2.00:High Concern 2.33:ModerateConcern
Red (2.16)
Green sturgeon 1.00:High 2.00:High Concern 2.33:ModerateConcern
Red (2.16)
Redbanded rockfish 1.00:High 2.00:High Concern 2.33:ModerateConcern
Red (2.16)
Rougheye rockfish 1.00:High 2.00:High Concern 2.33:ModerateConcern
Red (2.16)
Shortraker rockfish 1.00:High 2.00:High Concern 2.33:ModerateConcern
Red (2.16)
School shark 1.00:High 2.00:High Concern 2.33:ModerateConcern
Red (2.16)
Widow rockfish 1.00:High 2.00:High Concern 2.33:ModerateConcern
Red (2.16)
Greenstriped rockfish 1.00:High 3.00:ModerateConcern
2.33:ModerateConcern
Yellow(2.64)
148

Sharpchin rockfish 1.00:High 3.00:ModerateConcern
2.33:ModerateConcern
Yellow(2.64)
Splitnose rockfish 1.00:High 3.00:ModerateConcern
2.33:ModerateConcern
Yellow(2.64)
Spotted ratfish 1.00:High 3.00:ModerateConcern
2.33:ModerateConcern
Yellow(2.64)
Sixgill shark 1.00:High 2.00:High Concern 3.67:Low Concern Yellow(2.71)
Pacific Ocean perch 1.00:High 4.00:Low Concern 2.33:ModerateConcern
Yellow(3.05)
Steller sea lion 1.00:High 4.00:Low Concern 3.67:Low Concern Green(3.83)
Canary rockfish 1.00:High 4.00:Low Concern 5.00:Very LowConcern
Green(4.47)
Lingcod 2.00:Medium 4.00:Low Concern 5.00:Very LowConcern
Green(4.47)
Yellowmouth rockfish 1.00:High 4.00:Low Concern 5.00:Very LowConcern
Green(4.47)
Arrowtooth flounder 2.00:Medium 5.00:Very LowConcern
5.00:Very LowConcern
Green(5.00)
Silvergray rockfish 1.00:High 5.00:Very LowConcern
5.00:Very LowConcern
Green(5.00)
Southern Rock sole 2.00:Medium 5.00:Very LowConcern
5.00:Very LowConcern
Green(5.00)
Yellowtail rockfish 1.00:High 5.00:Very LowConcern
5.00:Very LowConcern
Green(5.00)
REDSTRIPE ROCKFISH - BRITISH COLUMBIA/NORTHEAST PACIFIC - MIDWATER TRAWLS - CANADA
Subscore: 1.41 Discard Rate: 0.95 C2 Rate: 1.34
SpeciesInherentVulnerability Abundance Fishing Mortality Subscore
Bocaccio 1.00:High 2.00:High Concern 1.00:High Concern Red (1.41)
Darkblotched rockfish 1.00:High 2.00:High Concern 2.33:ModerateConcern
Red (2.16)
Green sturgeon 1.00:High 2.00:High Concern 2.33:ModerateConcern
Red (2.16)
149

Redbanded rockfish 1.00:High 2.00:High Concern 2.33:ModerateConcern
Red (2.16)
Rougheye rockfish 1.00:High 2.00:High Concern 2.33:ModerateConcern
Red (2.16)
Shortraker rockfish 1.00:High 2.00:High Concern 2.33:ModerateConcern
Red (2.16)
School shark 1.00:High 2.00:High Concern 2.33:ModerateConcern
Red (2.16)
Widow rockfish 1.00:High 2.00:High Concern 2.33:ModerateConcern
Red (2.16)
Greenstriped rockfish 1.00:High 3.00:ModerateConcern
2.33:ModerateConcern
Yellow(2.64)
Sharpchin rockfish 1.00:High 3.00:ModerateConcern
2.33:ModerateConcern
Yellow(2.64)
Splitnose rockfish 1.00:High 3.00:ModerateConcern
2.33:ModerateConcern
Yellow(2.64)
Spotted ratfish 1.00:High 3.00:ModerateConcern
2.33:ModerateConcern
Yellow(2.64)
Sixgill shark 1.00:High 2.00:High Concern 3.67:Low Concern Yellow(2.71)
Pacific Ocean perch 1.00:High 4.00:Low Concern 2.33:ModerateConcern
Yellow(3.05)
Steller sea lion 1.00:High 4.00:Low Concern 3.67:Low Concern Green(3.83)
Canary rockfish 1.00:High 4.00:Low Concern 5.00:Very LowConcern
Green(4.47)
Lingcod 2.00:Medium 4.00:Low Concern 5.00:Very LowConcern
Green(4.47)
Yellowmouth rockfish 1.00:High 4.00:Low Concern 5.00:Very LowConcern
Green(4.47)
Arrowtooth flounder 2.00:Medium 5.00:Very LowConcern
5.00:Very LowConcern
Green(5.00)
Silvergray rockfish 1.00:High 5.00:Very LowConcern
5.00:Very LowConcern
Green(5.00)
Southern Rock sole 2.00:Medium 5.00:Very LowConcern
5.00:Very LowConcern
Green(5.00)
150

Yellowtail rockfish 1.00:High 5.00:Very LowConcern
5.00:Very LowConcern
Green(5.00)
REX SOLE - BRITISH COLUMBIA/NORTHEAST PACIFIC - BOTTOM TRAWLS - CANADA - SOFT SUBSTRATE
Subscore: 2.16 Discard Rate: 0.95 C2 Rate: 2.05
SpeciesInherentVulnerability Abundance Fishing Mortality Subscore
Giant rattail 1.00:High 2.00:High Concern 2.33:ModerateConcern
Red (2.16)
Green sturgeon 1.00:High 2.00:High Concern 2.33:ModerateConcern
Red (2.16)
Longnose skate 1.00:High 2.00:High Concern 2.33:ModerateConcern
Red (2.16)
Shortspine thornyhead 1.00:High 2.00:High Concern 2.33:ModerateConcern
Red (2.16)
Pacific grenadier 1.00:High 2.00:High Concern 2.33:ModerateConcern
Red (2.16)
School shark 1.00:High 2.00:High Concern 2.33:ModerateConcern
Red (2.16)
Dover sole 2.00:Medium 3.00:ModerateConcern
2.33:ModerateConcern
Yellow(2.64)
Flathead sole 2.00:Medium 3.00:ModerateConcern
2.33:ModerateConcern
Yellow(2.64)
Spotted ratfish 1.00:High 3.00:ModerateConcern
2.33:ModerateConcern
Yellow(2.64)
Longspine thornyhead 1.00:High 2.00:High Concern 3.67:Low Concern Yellow(2.71)
Sixgill shark 1.00:High 2.00:High Concern 3.67:Low Concern Yellow(2.71)
Petrale sole 2.00:Medium 4.00:Low Concern 2.33:ModerateConcern
Yellow(3.05)
Pacific cod 2.00:Medium 2.00:High Concern 5.00:Very LowConcern
Yellow(3.16)
Big skate 1.00:High 3.00:ModerateConcern
3.67:Low Concern Green(3.32)
Spiny dogfish 1.00:High 3.00:ModerateConcern
3.67:Low Concern Green(3.32)
151

Steller sea lion 1.00:High 4.00:Low Concern 3.67:Low Concern Green(3.83)
English sole 2.00:Medium 4.00:Low Concern 3.67:Low Concern Green(3.83)
Sablefish 1.00:High 4.00:Low Concern 3.67:Low Concern Green(3.83)
ROUGHEYE ROCKFISH - BRITISH COLUMBIA/NORTHEAST PACIFIC - BOTTOM TRAWLS - CANADA - HARDSUBSTRATE
Subscore: 1.41 Discard Rate: 0.95 C2 Rate: 1.34
SpeciesInherentVulnerability Abundance Fishing Mortality Subscore
Bocaccio 1.00:High 2.00:High Concern 1.00:High Concern Red (1.41)
Darkblotched rockfish 1.00:High 2.00:High Concern 2.33:ModerateConcern
Red (2.16)
Green sturgeon 1.00:High 2.00:High Concern 2.33:ModerateConcern
Red (2.16)
Redbanded rockfish 1.00:High 2.00:High Concern 2.33:ModerateConcern
Red (2.16)
Redstripe rockfish 1.00:High 2.00:High Concern 2.33:ModerateConcern
Red (2.16)
Shortraker rockfish 1.00:High 2.00:High Concern 2.33:ModerateConcern
Red (2.16)
School shark 1.00:High 2.00:High Concern 2.33:ModerateConcern
Red (2.16)
Widow rockfish 1.00:High 2.00:High Concern 2.33:ModerateConcern
Red (2.16)
Greenstriped rockfish 1.00:High 3.00:ModerateConcern
2.33:ModerateConcern
Yellow(2.64)
Sharpchin rockfish 1.00:High 3.00:ModerateConcern
2.33:ModerateConcern
Yellow(2.64)
Splitnose rockfish 1.00:High 3.00:ModerateConcern
2.33:ModerateConcern
Yellow(2.64)
Spotted ratfish 1.00:High 3.00:ModerateConcern
2.33:ModerateConcern
Yellow(2.64)
Sixgill shark 1.00:High 2.00:High Concern 3.67:Low Concern Yellow(2.71)
152
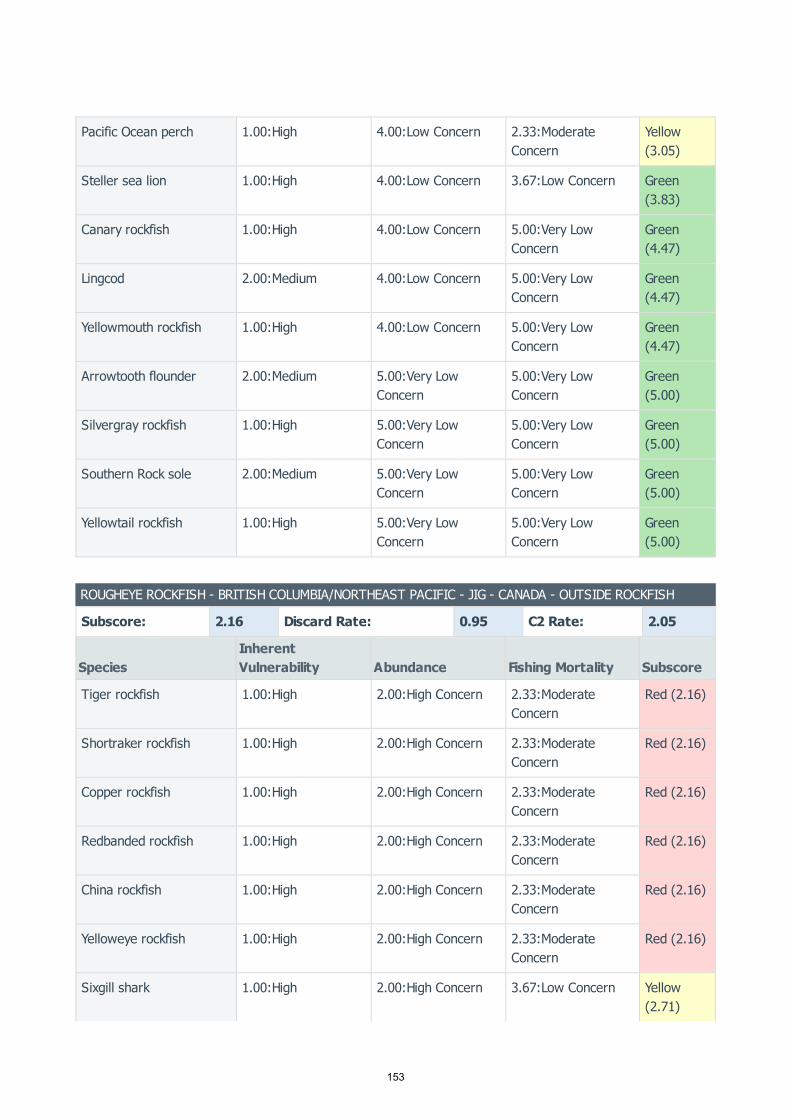
Pacific Ocean perch 1.00:High 4.00:Low Concern 2.33:ModerateConcern
Yellow(3.05)
Steller sea lion 1.00:High 4.00:Low Concern 3.67:Low Concern Green(3.83)
Canary rockfish 1.00:High 4.00:Low Concern 5.00:Very LowConcern
Green(4.47)
Lingcod 2.00:Medium 4.00:Low Concern 5.00:Very LowConcern
Green(4.47)
Yellowmouth rockfish 1.00:High 4.00:Low Concern 5.00:Very LowConcern
Green(4.47)
Arrowtooth flounder 2.00:Medium 5.00:Very LowConcern
5.00:Very LowConcern
Green(5.00)
Silvergray rockfish 1.00:High 5.00:Very LowConcern
5.00:Very LowConcern
Green(5.00)
Southern Rock sole 2.00:Medium 5.00:Very LowConcern
5.00:Very LowConcern
Green(5.00)
Yellowtail rockfish 1.00:High 5.00:Very LowConcern
5.00:Very LowConcern
Green(5.00)
ROUGHEYE ROCKFISH - BRITISH COLUMBIA/NORTHEAST PACIFIC - JIG - CANADA - OUTSIDE ROCKFISH
Subscore: 2.16 Discard Rate: 0.95 C2 Rate: 2.05
SpeciesInherentVulnerability Abundance Fishing Mortality Subscore
Tiger rockfish 1.00:High 2.00:High Concern 2.33:ModerateConcern
Red (2.16)
Shortraker rockfish 1.00:High 2.00:High Concern 2.33:ModerateConcern
Red (2.16)
Copper rockfish 1.00:High 2.00:High Concern 2.33:ModerateConcern
Red (2.16)
Redbanded rockfish 1.00:High 2.00:High Concern 2.33:ModerateConcern
Red (2.16)
China rockfish 1.00:High 2.00:High Concern 2.33:ModerateConcern
Red (2.16)
Yelloweye rockfish 1.00:High 2.00:High Concern 2.33:ModerateConcern
Red (2.16)
Sixgill shark 1.00:High 2.00:High Concern 3.67:Low Concern Yellow(2.71)
153
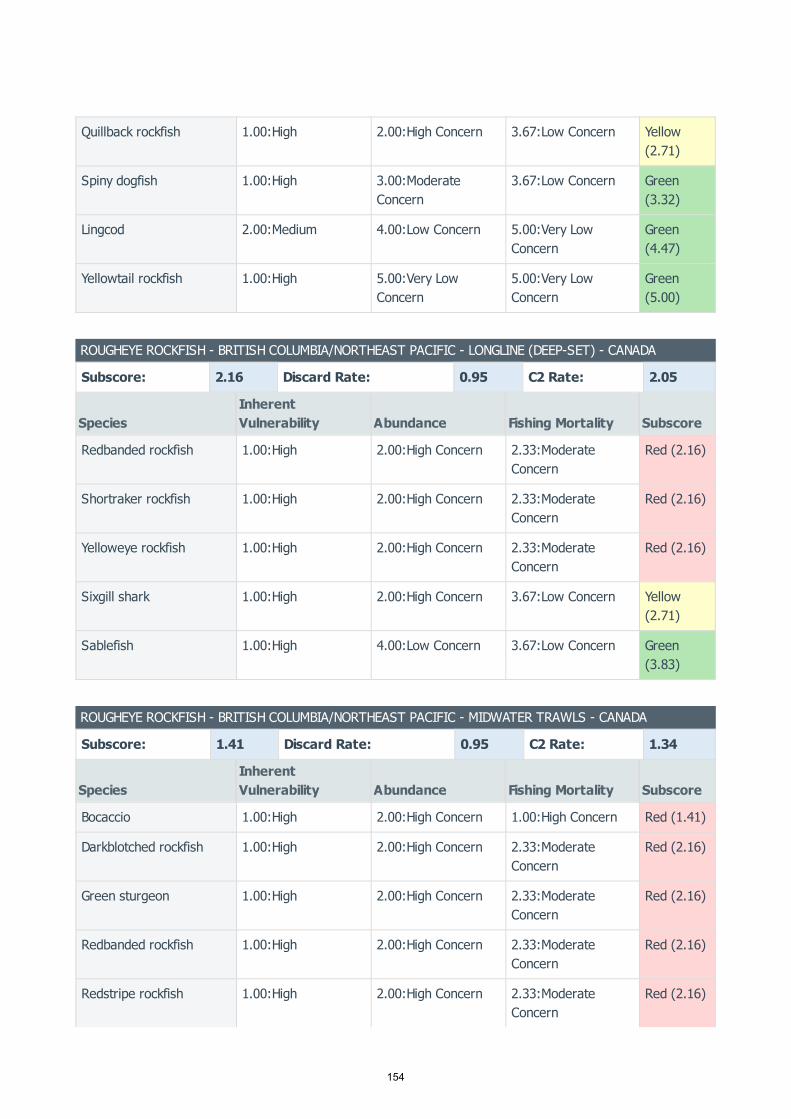
Quillback rockfish 1.00:High 2.00:High Concern 3.67:Low Concern Yellow(2.71)
Spiny dogfish 1.00:High 3.00:ModerateConcern
3.67:Low Concern Green(3.32)
Lingcod 2.00:Medium 4.00:Low Concern 5.00:Very LowConcern
Green(4.47)
Yellowtail rockfish 1.00:High 5.00:Very LowConcern
5.00:Very LowConcern
Green(5.00)
ROUGHEYE ROCKFISH - BRITISH COLUMBIA/NORTHEAST PACIFIC - LONGLINE (DEEP-SET) - CANADA
Subscore: 2.16 Discard Rate: 0.95 C2 Rate: 2.05
SpeciesInherentVulnerability Abundance Fishing Mortality Subscore
Redbanded rockfish 1.00:High 2.00:High Concern 2.33:ModerateConcern
Red (2.16)
Shortraker rockfish 1.00:High 2.00:High Concern 2.33:ModerateConcern
Red (2.16)
Yelloweye rockfish 1.00:High 2.00:High Concern 2.33:ModerateConcern
Red (2.16)
Sixgill shark 1.00:High 2.00:High Concern 3.67:Low Concern Yellow(2.71)
Sablefish 1.00:High 4.00:Low Concern 3.67:Low Concern Green(3.83)
ROUGHEYE ROCKFISH - BRITISH COLUMBIA/NORTHEAST PACIFIC - MIDWATER TRAWLS - CANADA
Subscore: 1.41 Discard Rate: 0.95 C2 Rate: 1.34
SpeciesInherentVulnerability Abundance Fishing Mortality Subscore
Bocaccio 1.00:High 2.00:High Concern 1.00:High Concern Red (1.41)
Darkblotched rockfish 1.00:High 2.00:High Concern 2.33:ModerateConcern
Red (2.16)
Green sturgeon 1.00:High 2.00:High Concern 2.33:ModerateConcern
Red (2.16)
Redbanded rockfish 1.00:High 2.00:High Concern 2.33:ModerateConcern
Red (2.16)
Redstripe rockfish 1.00:High 2.00:High Concern 2.33:ModerateConcern
Red (2.16)
154

Shortraker rockfish 1.00:High 2.00:High Concern 2.33:ModerateConcern
Red (2.16)
School shark 1.00:High 2.00:High Concern 2.33:ModerateConcern
Red (2.16)
Widow rockfish 1.00:High 2.00:High Concern 2.33:ModerateConcern
Red (2.16)
Greenstriped rockfish 1.00:High 3.00:ModerateConcern
2.33:ModerateConcern
Yellow(2.64)
Sharpchin rockfish 1.00:High 3.00:ModerateConcern
2.33:ModerateConcern
Yellow(2.64)
Splitnose rockfish 1.00:High 3.00:ModerateConcern
2.33:ModerateConcern
Yellow(2.64)
Spotted ratfish 1.00:High 3.00:ModerateConcern
2.33:ModerateConcern
Yellow(2.64)
Sixgill shark 1.00:High 2.00:High Concern 3.67:Low Concern Yellow(2.71)
Pacific Ocean perch 1.00:High 4.00:Low Concern 2.33:ModerateConcern
Yellow(3.05)
Steller sea lion 1.00:High 4.00:Low Concern 3.67:Low Concern Green(3.83)
Canary rockfish 1.00:High 4.00:Low Concern 5.00:Very LowConcern
Green(4.47)
Lingcod 2.00:Medium 4.00:Low Concern 5.00:Very LowConcern
Green(4.47)
Yellowmouth rockfish 1.00:High 4.00:Low Concern 5.00:Very LowConcern
Green(4.47)
Arrowtooth flounder 2.00:Medium 5.00:Very LowConcern
5.00:Very LowConcern
Green(5.00)
Silvergray rockfish 1.00:High 5.00:Very LowConcern
5.00:Very LowConcern
Green(5.00)
Southern Rock sole 2.00:Medium 5.00:Very LowConcern
5.00:Very LowConcern
Green(5.00)
Yellowtail rockfish 1.00:High 5.00:Very LowConcern
5.00:Very LowConcern
Green(5.00)
155
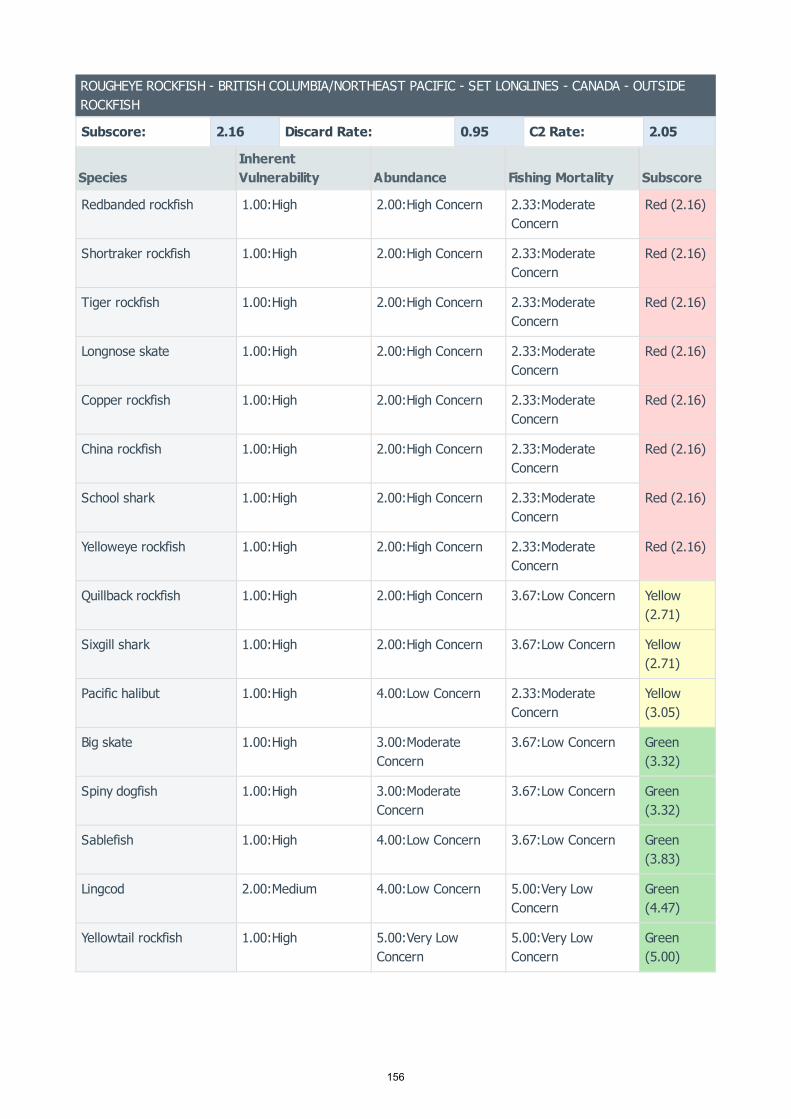
ROUGHEYE ROCKFISH - BRITISH COLUMBIA/NORTHEAST PACIFIC - SET LONGLINES - CANADA - OUTSIDEROCKFISH
Subscore: 2.16 Discard Rate: 0.95 C2 Rate: 2.05
SpeciesInherentVulnerability Abundance Fishing Mortality Subscore
Redbanded rockfish 1.00:High 2.00:High Concern 2.33:ModerateConcern
Red (2.16)
Shortraker rockfish 1.00:High 2.00:High Concern 2.33:ModerateConcern
Red (2.16)
Tiger rockfish 1.00:High 2.00:High Concern 2.33:ModerateConcern
Red (2.16)
Longnose skate 1.00:High 2.00:High Concern 2.33:ModerateConcern
Red (2.16)
Copper rockfish 1.00:High 2.00:High Concern 2.33:ModerateConcern
Red (2.16)
China rockfish 1.00:High 2.00:High Concern 2.33:ModerateConcern
Red (2.16)
School shark 1.00:High 2.00:High Concern 2.33:ModerateConcern
Red (2.16)
Yelloweye rockfish 1.00:High 2.00:High Concern 2.33:ModerateConcern
Red (2.16)
Quillback rockfish 1.00:High 2.00:High Concern 3.67:Low Concern Yellow(2.71)
Sixgill shark 1.00:High 2.00:High Concern 3.67:Low Concern Yellow(2.71)
Pacific halibut 1.00:High 4.00:Low Concern 2.33:ModerateConcern
Yellow(3.05)
Big skate 1.00:High 3.00:ModerateConcern
3.67:Low Concern Green(3.32)
Spiny dogfish 1.00:High 3.00:ModerateConcern
3.67:Low Concern Green(3.32)
Sablefish 1.00:High 4.00:Low Concern 3.67:Low Concern Green(3.83)
Lingcod 2.00:Medium 4.00:Low Concern 5.00:Very LowConcern
Green(4.47)
Yellowtail rockfish 1.00:High 5.00:Very LowConcern
5.00:Very LowConcern
Green(5.00)
156

ROUGHEYE ROCKFISH - BRITISH COLUMBIA/NORTHEAST PACIFIC - TROLLING LINES - CANADA - OUTSIDEROCKFISH
Subscore: 2.16 Discard Rate: 0.95 C2 Rate: 2.05
SpeciesInherentVulnerability Abundance Fishing Mortality Subscore
China rockfish 1.00:High 2.00:High Concern 2.33:ModerateConcern
Red (2.16)
Copper rockfish 1.00:High 2.00:High Concern 2.33:ModerateConcern
Red (2.16)
Redbanded rockfish 1.00:High 2.00:High Concern 2.33:ModerateConcern
Red (2.16)
Shortraker rockfish 1.00:High 2.00:High Concern 2.33:ModerateConcern
Red (2.16)
Tiger rockfish 1.00:High 2.00:High Concern 2.33:ModerateConcern
Red (2.16)
Yelloweye rockfish 1.00:High 2.00:High Concern 2.33:ModerateConcern
Red (2.16)
Quillback rockfish 1.00:High 2.00:High Concern 3.67:Low Concern Yellow(2.71)
Sixgill shark 1.00:High 2.00:High Concern 3.67:Low Concern Yellow(2.71)
Spiny dogfish 1.00:High 3.00:ModerateConcern
3.67:Low Concern Green(3.32)
Lingcod 2.00:Medium 4.00:Low Concern 5.00:Very LowConcern
Green(4.47)
Yellowtail rockfish 1.00:High 5.00:Very LowConcern
5.00:Very LowConcern
Green(5.00)
SABLEFISH - BRITISH COLUMBIA/NORTHEAST PACIFIC - BOTTOM TRAWLS - CANADA - SOFT SUBSTRATE
Subscore: 2.16 Discard Rate: 0.95 C2 Rate: 2.05
SpeciesInherentVulnerability Abundance Fishing Mortality Subscore
Giant rattail 1.00:High 2.00:High Concern 2.33:ModerateConcern
Red (2.16)
Green sturgeon 1.00:High 2.00:High Concern 2.33:ModerateConcern
Red (2.16)
Longnose skate 1.00:High 2.00:High Concern 2.33:ModerateConcern
Red (2.16)
157
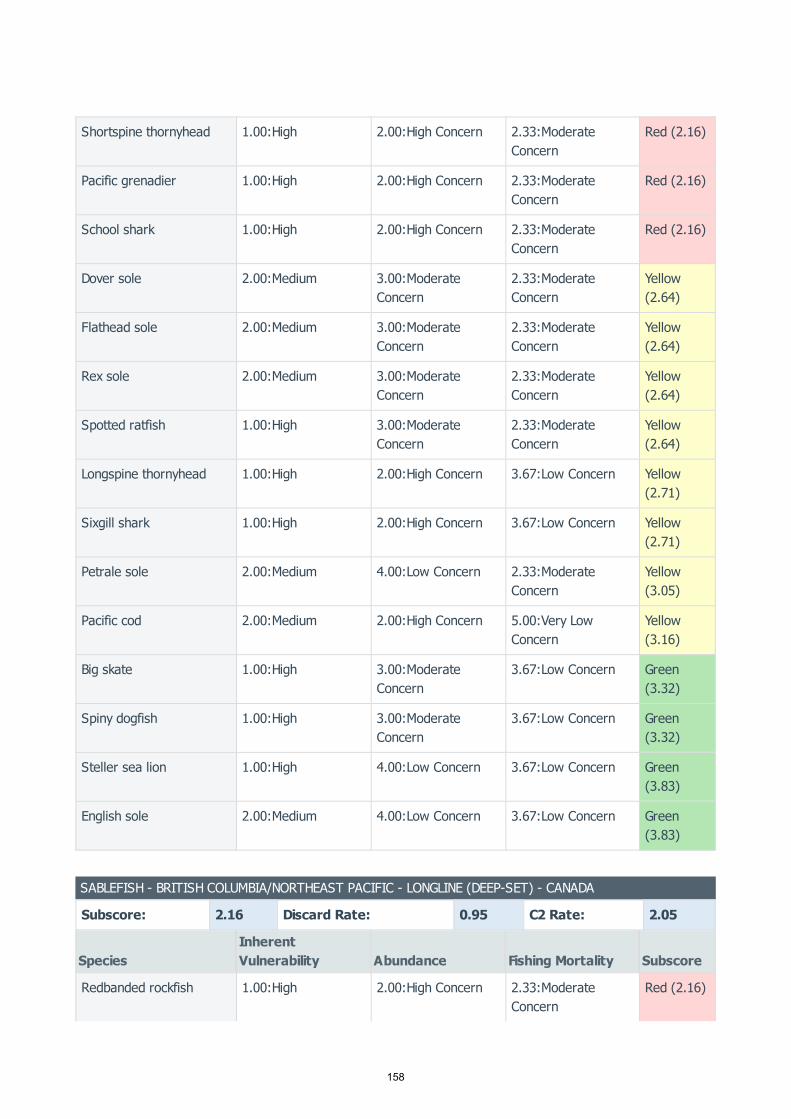
Shortspine thornyhead 1.00:High 2.00:High Concern 2.33:ModerateConcern
Red (2.16)
Pacific grenadier 1.00:High 2.00:High Concern 2.33:ModerateConcern
Red (2.16)
School shark 1.00:High 2.00:High Concern 2.33:ModerateConcern
Red (2.16)
Dover sole 2.00:Medium 3.00:ModerateConcern
2.33:ModerateConcern
Yellow(2.64)
Flathead sole 2.00:Medium 3.00:ModerateConcern
2.33:ModerateConcern
Yellow(2.64)
Rex sole 2.00:Medium 3.00:ModerateConcern
2.33:ModerateConcern
Yellow(2.64)
Spotted ratfish 1.00:High 3.00:ModerateConcern
2.33:ModerateConcern
Yellow(2.64)
Longspine thornyhead 1.00:High 2.00:High Concern 3.67:Low Concern Yellow(2.71)
Sixgill shark 1.00:High 2.00:High Concern 3.67:Low Concern Yellow(2.71)
Petrale sole 2.00:Medium 4.00:Low Concern 2.33:ModerateConcern
Yellow(3.05)
Pacific cod 2.00:Medium 2.00:High Concern 5.00:Very LowConcern
Yellow(3.16)
Big skate 1.00:High 3.00:ModerateConcern
3.67:Low Concern Green(3.32)
Spiny dogfish 1.00:High 3.00:ModerateConcern
3.67:Low Concern Green(3.32)
Steller sea lion 1.00:High 4.00:Low Concern 3.67:Low Concern Green(3.83)
English sole 2.00:Medium 4.00:Low Concern 3.67:Low Concern Green(3.83)
SABLEFISH - BRITISH COLUMBIA/NORTHEAST PACIFIC - LONGLINE (DEEP-SET) - CANADA
Subscore: 2.16 Discard Rate: 0.95 C2 Rate: 2.05
SpeciesInherentVulnerability Abundance Fishing Mortality Subscore
Redbanded rockfish 1.00:High 2.00:High Concern 2.33:ModerateConcern
Red (2.16)
158
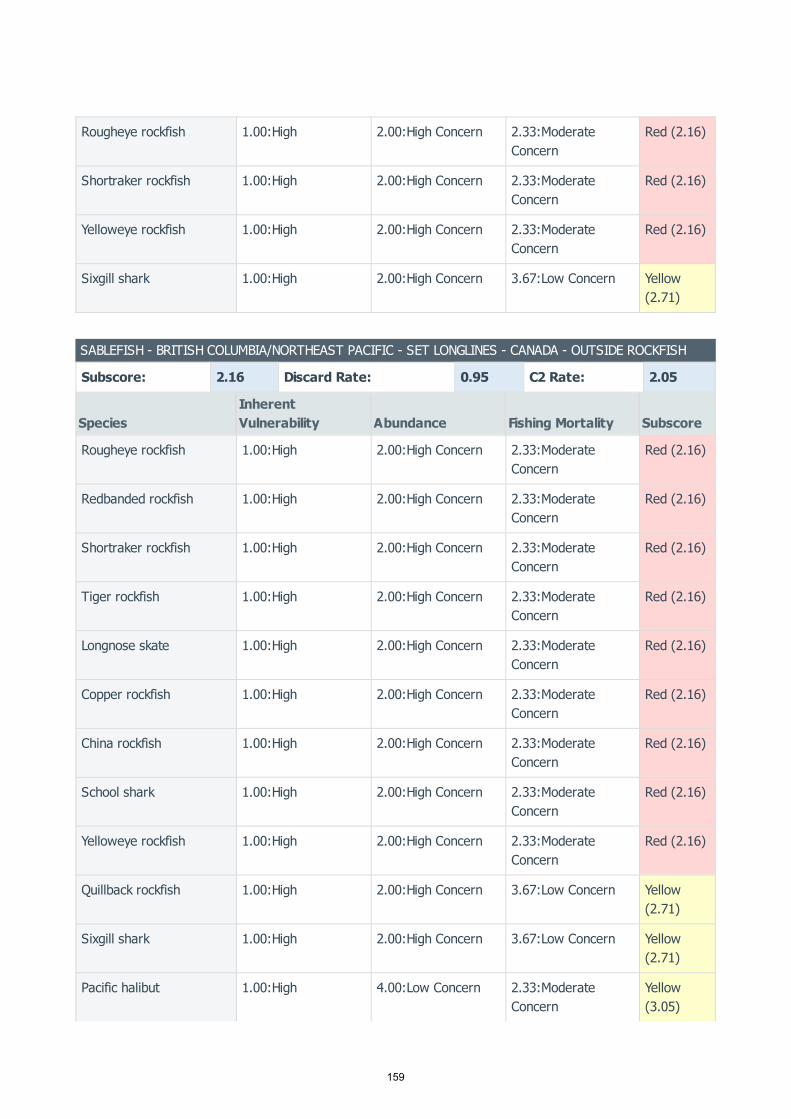
Rougheye rockfish 1.00:High 2.00:High Concern 2.33:ModerateConcern
Red (2.16)
Shortraker rockfish 1.00:High 2.00:High Concern 2.33:ModerateConcern
Red (2.16)
Yelloweye rockfish 1.00:High 2.00:High Concern 2.33:ModerateConcern
Red (2.16)
Sixgill shark 1.00:High 2.00:High Concern 3.67:Low Concern Yellow(2.71)
SABLEFISH - BRITISH COLUMBIA/NORTHEAST PACIFIC - SET LONGLINES - CANADA - OUTSIDE ROCKFISH
Subscore: 2.16 Discard Rate: 0.95 C2 Rate: 2.05
SpeciesInherentVulnerability Abundance Fishing Mortality Subscore
Rougheye rockfish 1.00:High 2.00:High Concern 2.33:ModerateConcern
Red (2.16)
Redbanded rockfish 1.00:High 2.00:High Concern 2.33:ModerateConcern
Red (2.16)
Shortraker rockfish 1.00:High 2.00:High Concern 2.33:ModerateConcern
Red (2.16)
Tiger rockfish 1.00:High 2.00:High Concern 2.33:ModerateConcern
Red (2.16)
Longnose skate 1.00:High 2.00:High Concern 2.33:ModerateConcern
Red (2.16)
Copper rockfish 1.00:High 2.00:High Concern 2.33:ModerateConcern
Red (2.16)
China rockfish 1.00:High 2.00:High Concern 2.33:ModerateConcern
Red (2.16)
School shark 1.00:High 2.00:High Concern 2.33:ModerateConcern
Red (2.16)
Yelloweye rockfish 1.00:High 2.00:High Concern 2.33:ModerateConcern
Red (2.16)
Quillback rockfish 1.00:High 2.00:High Concern 3.67:Low Concern Yellow(2.71)
Sixgill shark 1.00:High 2.00:High Concern 3.67:Low Concern Yellow(2.71)
Pacific halibut 1.00:High 4.00:Low Concern 2.33:ModerateConcern
Yellow(3.05)
159

Big skate 1.00:High 3.00:ModerateConcern
3.67:Low Concern Green(3.32)
Spiny dogfish 1.00:High 3.00:ModerateConcern
3.67:Low Concern Green(3.32)
Lingcod 2.00:Medium 4.00:Low Concern 5.00:Very LowConcern
Green(4.47)
Yellowtail rockfish 1.00:High 5.00:Very LowConcern
5.00:Very LowConcern
Green(5.00)
SHORTRAKER ROCKFISH - BRITISH COLUMBIA/NORTHEAST PACIFIC - BOTTOM TRAWLS - CANADA - HARDSUBSTRATE
Subscore: 1.41 Discard Rate: 0.95 C2 Rate: 1.34
SpeciesInherentVulnerability Abundance Fishing Mortality Subscore
Bocaccio 1.00:High 2.00:High Concern 1.00:High Concern Red (1.41)
Darkblotched rockfish 1.00:High 2.00:High Concern 2.33:ModerateConcern
Red (2.16)
Green sturgeon 1.00:High 2.00:High Concern 2.33:ModerateConcern
Red (2.16)
Redbanded rockfish 1.00:High 2.00:High Concern 2.33:ModerateConcern
Red (2.16)
Redstripe rockfish 1.00:High 2.00:High Concern 2.33:ModerateConcern
Red (2.16)
Rougheye rockfish 1.00:High 2.00:High Concern 2.33:ModerateConcern
Red (2.16)
School shark 1.00:High 2.00:High Concern 2.33:ModerateConcern
Red (2.16)
Widow rockfish 1.00:High 2.00:High Concern 2.33:ModerateConcern
Red (2.16)
Greenstriped rockfish 1.00:High 3.00:ModerateConcern
2.33:ModerateConcern
Yellow(2.64)
Sharpchin rockfish 1.00:High 3.00:ModerateConcern
2.33:ModerateConcern
Yellow(2.64)
Splitnose rockfish 1.00:High 3.00:ModerateConcern
2.33:ModerateConcern
Yellow(2.64)
Spotted ratfish 1.00:High 3.00:ModerateConcern
2.33:ModerateConcern
Yellow(2.64)
160

Sixgill shark 1.00:High 2.00:High Concern 3.67:Low Concern Yellow(2.71)
Pacific Ocean perch 1.00:High 4.00:Low Concern 2.33:ModerateConcern
Yellow(3.05)
Steller sea lion 1.00:High 4.00:Low Concern 3.67:Low Concern Green(3.83)
Canary rockfish 1.00:High 4.00:Low Concern 5.00:Very LowConcern
Green(4.47)
Lingcod 2.00:Medium 4.00:Low Concern 5.00:Very LowConcern
Green(4.47)
Yellowmouth rockfish 1.00:High 4.00:Low Concern 5.00:Very LowConcern
Green(4.47)
Arrowtooth flounder 2.00:Medium 5.00:Very LowConcern
5.00:Very LowConcern
Green(5.00)
Silvergray rockfish 1.00:High 5.00:Very LowConcern
5.00:Very LowConcern
Green(5.00)
Southern Rock sole 2.00:Medium 5.00:Very LowConcern
5.00:Very LowConcern
Green(5.00)
Yellowtail rockfish 1.00:High 5.00:Very LowConcern
5.00:Very LowConcern
Green(5.00)
SHORTRAKER ROCKFISH - BRITISH COLUMBIA/NORTHEAST PACIFIC - JIG - CANADA - OUTSIDE ROCKFISH
Subscore: 2.16 Discard Rate: 0.95 C2 Rate: 2.05
SpeciesInherentVulnerability Abundance Fishing Mortality Subscore
Tiger rockfish 1.00:High 2.00:High Concern 2.33:ModerateConcern
Red (2.16)
Rougheye rockfish 1.00:High 2.00:High Concern 2.33:ModerateConcern
Red (2.16)
Copper rockfish 1.00:High 2.00:High Concern 2.33:ModerateConcern
Red (2.16)
Redbanded rockfish 1.00:High 2.00:High Concern 2.33:ModerateConcern
Red (2.16)
China rockfish 1.00:High 2.00:High Concern 2.33:ModerateConcern
Red (2.16)
Yelloweye rockfish 1.00:High 2.00:High Concern 2.33:ModerateConcern
Red (2.16)
161

Sixgill shark 1.00:High 2.00:High Concern 3.67:Low Concern Yellow(2.71)
Quillback rockfish 1.00:High 2.00:High Concern 3.67:Low Concern Yellow(2.71)
Spiny dogfish 1.00:High 3.00:ModerateConcern
3.67:Low Concern Green(3.32)
Lingcod 2.00:Medium 4.00:Low Concern 5.00:Very LowConcern
Green(4.47)
Yellowtail rockfish 1.00:High 5.00:Very LowConcern
5.00:Very LowConcern
Green(5.00)
SHORTRAKER ROCKFISH - BRITISH COLUMBIA/NORTHEAST PACIFIC - LONGLINE (DEEP-SET) - CANADA
Subscore: 2.16 Discard Rate: 0.95 C2 Rate: 2.05
SpeciesInherentVulnerability Abundance Fishing Mortality Subscore
Redbanded rockfish 1.00:High 2.00:High Concern 2.33:ModerateConcern
Red (2.16)
Rougheye rockfish 1.00:High 2.00:High Concern 2.33:ModerateConcern
Red (2.16)
Yelloweye rockfish 1.00:High 2.00:High Concern 2.33:ModerateConcern
Red (2.16)
Sixgill shark 1.00:High 2.00:High Concern 3.67:Low Concern Yellow(2.71)
Sablefish 1.00:High 4.00:Low Concern 3.67:Low Concern Green(3.83)
SHORTRAKER ROCKFISH - BRITISH COLUMBIA/NORTHEAST PACIFIC - MIDWATER TRAWLS - CANADA
Subscore: 1.41 Discard Rate: 0.95 C2 Rate: 1.34
SpeciesInherentVulnerability Abundance Fishing Mortality Subscore
Bocaccio 1.00:High 2.00:High Concern 1.00:High Concern Red (1.41)
Darkblotched rockfish 1.00:High 2.00:High Concern 2.33:ModerateConcern
Red (2.16)
Green sturgeon 1.00:High 2.00:High Concern 2.33:ModerateConcern
Red (2.16)
Redbanded rockfish 1.00:High 2.00:High Concern 2.33:ModerateConcern
Red (2.16)
162

Redstripe rockfish 1.00:High 2.00:High Concern 2.33:ModerateConcern
Red (2.16)
Rougheye rockfish 1.00:High 2.00:High Concern 2.33:ModerateConcern
Red (2.16)
School shark 1.00:High 2.00:High Concern 2.33:ModerateConcern
Red (2.16)
Widow rockfish 1.00:High 2.00:High Concern 2.33:ModerateConcern
Red (2.16)
Greenstriped rockfish 1.00:High 3.00:ModerateConcern
2.33:ModerateConcern
Yellow(2.64)
Sharpchin rockfish 1.00:High 3.00:ModerateConcern
2.33:ModerateConcern
Yellow(2.64)
Splitnose rockfish 1.00:High 3.00:ModerateConcern
2.33:ModerateConcern
Yellow(2.64)
Spotted ratfish 1.00:High 3.00:ModerateConcern
2.33:ModerateConcern
Yellow(2.64)
Sixgill shark 1.00:High 2.00:High Concern 3.67:Low Concern Yellow(2.71)
Pacific Ocean perch 1.00:High 4.00:Low Concern 2.33:ModerateConcern
Yellow(3.05)
Steller sea lion 1.00:High 4.00:Low Concern 3.67:Low Concern Green(3.83)
Canary rockfish 1.00:High 4.00:Low Concern 5.00:Very LowConcern
Green(4.47)
Lingcod 2.00:Medium 4.00:Low Concern 5.00:Very LowConcern
Green(4.47)
Yellowmouth rockfish 1.00:High 4.00:Low Concern 5.00:Very LowConcern
Green(4.47)
Arrowtooth flounder 2.00:Medium 5.00:Very LowConcern
5.00:Very LowConcern
Green(5.00)
Silvergray rockfish 1.00:High 5.00:Very LowConcern
5.00:Very LowConcern
Green(5.00)
Southern Rock sole 2.00:Medium 5.00:Very LowConcern
5.00:Very LowConcern
Green(5.00)
Yellowtail rockfish 1.00:High 5.00:Very LowConcern
5.00:Very LowConcern
Green(5.00)
163

SHORTRAKER ROCKFISH - BRITISH COLUMBIA/NORTHEAST PACIFIC - SET LONGLINES - CANADA - OUTSIDEROCKFISH
Subscore: 2.16 Discard Rate: 0.95 C2 Rate: 2.05
SpeciesInherentVulnerability Abundance Fishing Mortality Subscore
Rougheye rockfish 1.00:High 2.00:High Concern 2.33:ModerateConcern
Red (2.16)
Redbanded rockfish 1.00:High 2.00:High Concern 2.33:ModerateConcern
Red (2.16)
Tiger rockfish 1.00:High 2.00:High Concern 2.33:ModerateConcern
Red (2.16)
Longnose skate 1.00:High 2.00:High Concern 2.33:ModerateConcern
Red (2.16)
Copper rockfish 1.00:High 2.00:High Concern 2.33:ModerateConcern
Red (2.16)
China rockfish 1.00:High 2.00:High Concern 2.33:ModerateConcern
Red (2.16)
School shark 1.00:High 2.00:High Concern 2.33:ModerateConcern
Red (2.16)
Yelloweye rockfish 1.00:High 2.00:High Concern 2.33:ModerateConcern
Red (2.16)
Quillback rockfish 1.00:High 2.00:High Concern 3.67:Low Concern Yellow(2.71)
Sixgill shark 1.00:High 2.00:High Concern 3.67:Low Concern Yellow(2.71)
Pacific halibut 1.00:High 4.00:Low Concern 2.33:ModerateConcern
Yellow(3.05)
Big skate 1.00:High 3.00:ModerateConcern
3.67:Low Concern Green(3.32)
Spiny dogfish 1.00:High 3.00:ModerateConcern
3.67:Low Concern Green(3.32)
Sablefish 1.00:High 4.00:Low Concern 3.67:Low Concern Green(3.83)
Lingcod 2.00:Medium 4.00:Low Concern 5.00:Very LowConcern
Green(4.47)
Yellowtail rockfish 1.00:High 5.00:Very LowConcern
5.00:Very LowConcern
Green(5.00)
164
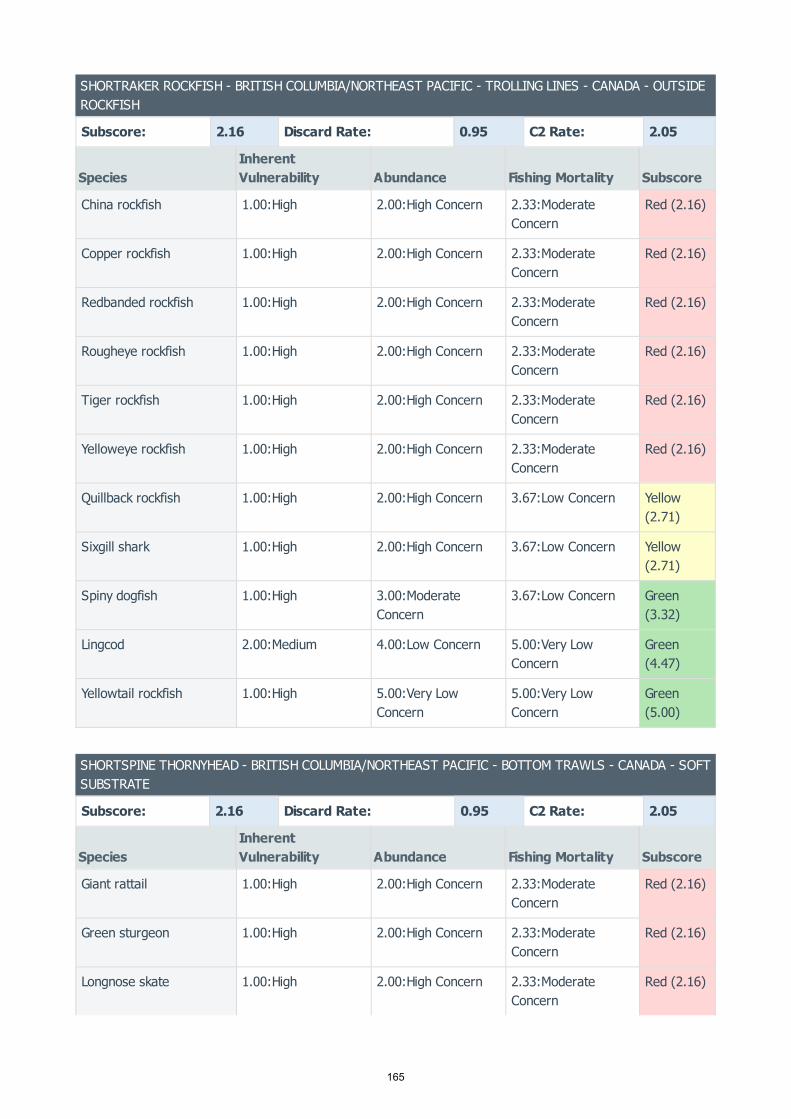
SHORTRAKER ROCKFISH - BRITISH COLUMBIA/NORTHEAST PACIFIC - TROLLING LINES - CANADA - OUTSIDEROCKFISH
Subscore: 2.16 Discard Rate: 0.95 C2 Rate: 2.05
SpeciesInherentVulnerability Abundance Fishing Mortality Subscore
China rockfish 1.00:High 2.00:High Concern 2.33:ModerateConcern
Red (2.16)
Copper rockfish 1.00:High 2.00:High Concern 2.33:ModerateConcern
Red (2.16)
Redbanded rockfish 1.00:High 2.00:High Concern 2.33:ModerateConcern
Red (2.16)
Rougheye rockfish 1.00:High 2.00:High Concern 2.33:ModerateConcern
Red (2.16)
Tiger rockfish 1.00:High 2.00:High Concern 2.33:ModerateConcern
Red (2.16)
Yelloweye rockfish 1.00:High 2.00:High Concern 2.33:ModerateConcern
Red (2.16)
Quillback rockfish 1.00:High 2.00:High Concern 3.67:Low Concern Yellow(2.71)
Sixgill shark 1.00:High 2.00:High Concern 3.67:Low Concern Yellow(2.71)
Spiny dogfish 1.00:High 3.00:ModerateConcern
3.67:Low Concern Green(3.32)
Lingcod 2.00:Medium 4.00:Low Concern 5.00:Very LowConcern
Green(4.47)
Yellowtail rockfish 1.00:High 5.00:Very LowConcern
5.00:Very LowConcern
Green(5.00)
SHORTSPINE THORNYHEAD - BRITISH COLUMBIA/NORTHEAST PACIFIC - BOTTOM TRAWLS - CANADA - SOFTSUBSTRATE
Subscore: 2.16 Discard Rate: 0.95 C2 Rate: 2.05
SpeciesInherentVulnerability Abundance Fishing Mortality Subscore
Giant rattail 1.00:High 2.00:High Concern 2.33:ModerateConcern
Red (2.16)
Green sturgeon 1.00:High 2.00:High Concern 2.33:ModerateConcern
Red (2.16)
Longnose skate 1.00:High 2.00:High Concern 2.33:ModerateConcern
Red (2.16)
165
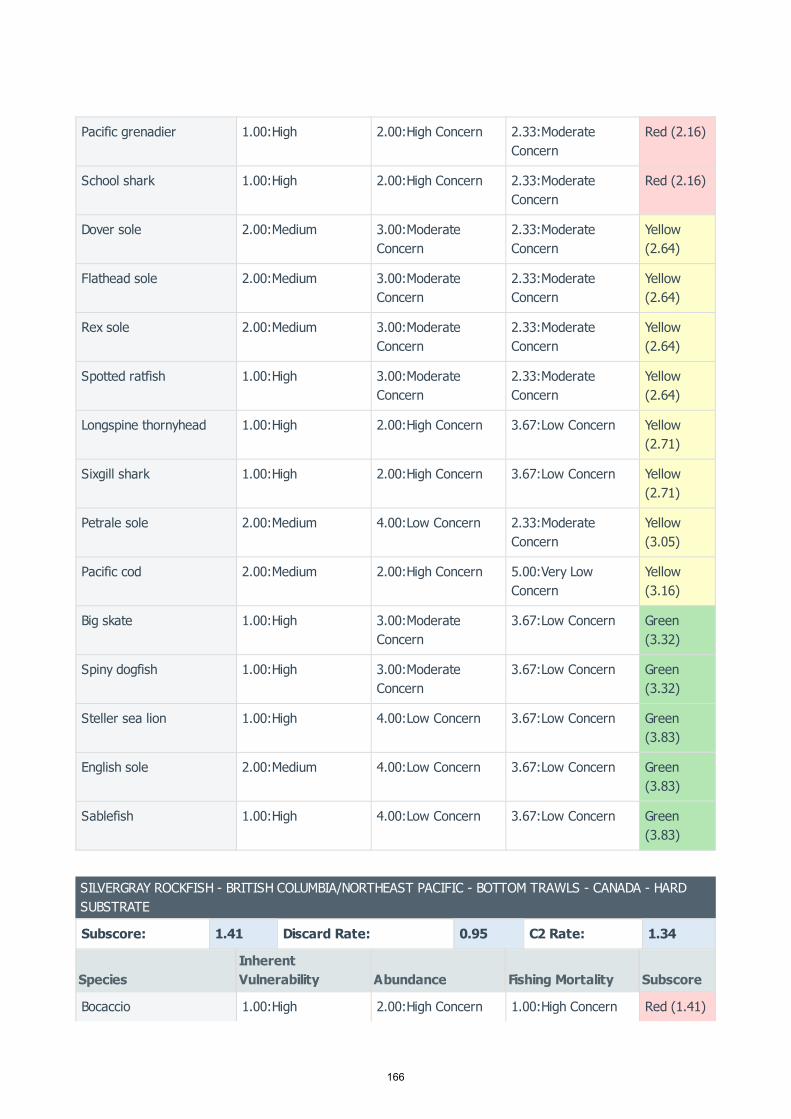
Pacific grenadier 1.00:High 2.00:High Concern 2.33:ModerateConcern
Red (2.16)
School shark 1.00:High 2.00:High Concern 2.33:ModerateConcern
Red (2.16)
Dover sole 2.00:Medium 3.00:ModerateConcern
2.33:ModerateConcern
Yellow(2.64)
Flathead sole 2.00:Medium 3.00:ModerateConcern
2.33:ModerateConcern
Yellow(2.64)
Rex sole 2.00:Medium 3.00:ModerateConcern
2.33:ModerateConcern
Yellow(2.64)
Spotted ratfish 1.00:High 3.00:ModerateConcern
2.33:ModerateConcern
Yellow(2.64)
Longspine thornyhead 1.00:High 2.00:High Concern 3.67:Low Concern Yellow(2.71)
Sixgill shark 1.00:High 2.00:High Concern 3.67:Low Concern Yellow(2.71)
Petrale sole 2.00:Medium 4.00:Low Concern 2.33:ModerateConcern
Yellow(3.05)
Pacific cod 2.00:Medium 2.00:High Concern 5.00:Very LowConcern
Yellow(3.16)
Big skate 1.00:High 3.00:ModerateConcern
3.67:Low Concern Green(3.32)
Spiny dogfish 1.00:High 3.00:ModerateConcern
3.67:Low Concern Green(3.32)
Steller sea lion 1.00:High 4.00:Low Concern 3.67:Low Concern Green(3.83)
English sole 2.00:Medium 4.00:Low Concern 3.67:Low Concern Green(3.83)
Sablefish 1.00:High 4.00:Low Concern 3.67:Low Concern Green(3.83)
SILVERGRAY ROCKFISH - BRITISH COLUMBIA/NORTHEAST PACIFIC - BOTTOM TRAWLS - CANADA - HARDSUBSTRATE
Subscore: 1.41 Discard Rate: 0.95 C2 Rate: 1.34
SpeciesInherentVulnerability Abundance Fishing Mortality Subscore
Bocaccio 1.00:High 2.00:High Concern 1.00:High Concern Red (1.41)
166

Darkblotched rockfish 1.00:High 2.00:High Concern 2.33:ModerateConcern
Red (2.16)
Green sturgeon 1.00:High 2.00:High Concern 2.33:ModerateConcern
Red (2.16)
Redbanded rockfish 1.00:High 2.00:High Concern 2.33:ModerateConcern
Red (2.16)
Redstripe rockfish 1.00:High 2.00:High Concern 2.33:ModerateConcern
Red (2.16)
Rougheye rockfish 1.00:High 2.00:High Concern 2.33:ModerateConcern
Red (2.16)
Shortraker rockfish 1.00:High 2.00:High Concern 2.33:ModerateConcern
Red (2.16)
School shark 1.00:High 2.00:High Concern 2.33:ModerateConcern
Red (2.16)
Widow rockfish 1.00:High 2.00:High Concern 2.33:ModerateConcern
Red (2.16)
Greenstriped rockfish 1.00:High 3.00:ModerateConcern
2.33:ModerateConcern
Yellow(2.64)
Sharpchin rockfish 1.00:High 3.00:ModerateConcern
2.33:ModerateConcern
Yellow(2.64)
Splitnose rockfish 1.00:High 3.00:ModerateConcern
2.33:ModerateConcern
Yellow(2.64)
Spotted ratfish 1.00:High 3.00:ModerateConcern
2.33:ModerateConcern
Yellow(2.64)
Sixgill shark 1.00:High 2.00:High Concern 3.67:Low Concern Yellow(2.71)
Pacific Ocean perch 1.00:High 4.00:Low Concern 2.33:ModerateConcern
Yellow(3.05)
Steller sea lion 1.00:High 4.00:Low Concern 3.67:Low Concern Green(3.83)
Canary rockfish 1.00:High 4.00:Low Concern 5.00:Very LowConcern
Green(4.47)
Lingcod 2.00:Medium 4.00:Low Concern 5.00:Very LowConcern
Green(4.47)
Yellowmouth rockfish 1.00:High 4.00:Low Concern 5.00:Very LowConcern
Green(4.47)
167

Arrowtooth flounder 2.00:Medium 5.00:Very LowConcern
5.00:Very LowConcern
Green(5.00)
Southern Rock sole 2.00:Medium 5.00:Very LowConcern
5.00:Very LowConcern
Green(5.00)
Yellowtail rockfish 1.00:High 5.00:Very LowConcern
5.00:Very LowConcern
Green(5.00)
SILVERGRAY ROCKFISH - BRITISH COLUMBIA/NORTHEAST PACIFIC - MIDWATER TRAWLS - CANADA
Subscore: 1.41 Discard Rate: 0.95 C2 Rate: 1.34
SpeciesInherentVulnerability Abundance Fishing Mortality Subscore
Bocaccio 1.00:High 2.00:High Concern 1.00:High Concern Red (1.41)
Darkblotched rockfish 1.00:High 2.00:High Concern 2.33:ModerateConcern
Red (2.16)
Green sturgeon 1.00:High 2.00:High Concern 2.33:ModerateConcern
Red (2.16)
Redbanded rockfish 1.00:High 2.00:High Concern 2.33:ModerateConcern
Red (2.16)
Redstripe rockfish 1.00:High 2.00:High Concern 2.33:ModerateConcern
Red (2.16)
Rougheye rockfish 1.00:High 2.00:High Concern 2.33:ModerateConcern
Red (2.16)
Shortraker rockfish 1.00:High 2.00:High Concern 2.33:ModerateConcern
Red (2.16)
School shark 1.00:High 2.00:High Concern 2.33:ModerateConcern
Red (2.16)
Widow rockfish 1.00:High 2.00:High Concern 2.33:ModerateConcern
Red (2.16)
Greenstriped rockfish 1.00:High 3.00:ModerateConcern
2.33:ModerateConcern
Yellow(2.64)
Sharpchin rockfish 1.00:High 3.00:ModerateConcern
2.33:ModerateConcern
Yellow(2.64)
Splitnose rockfish 1.00:High 3.00:ModerateConcern
2.33:ModerateConcern
Yellow(2.64)
Spotted ratfish 1.00:High 3.00:ModerateConcern
2.33:ModerateConcern
Yellow(2.64)
168

Sixgill shark 1.00:High 2.00:High Concern 3.67:Low Concern Yellow(2.71)
Pacific Ocean perch 1.00:High 4.00:Low Concern 2.33:ModerateConcern
Yellow(3.05)
Steller sea lion 1.00:High 4.00:Low Concern 3.67:Low Concern Green(3.83)
Canary rockfish 1.00:High 4.00:Low Concern 5.00:Very LowConcern
Green(4.47)
Lingcod 2.00:Medium 4.00:Low Concern 5.00:Very LowConcern
Green(4.47)
Yellowmouth rockfish 1.00:High 4.00:Low Concern 5.00:Very LowConcern
Green(4.47)
Arrowtooth flounder 2.00:Medium 5.00:Very LowConcern
5.00:Very LowConcern
Green(5.00)
Southern Rock sole 2.00:Medium 5.00:Very LowConcern
5.00:Very LowConcern
Green(5.00)
Yellowtail rockfish 1.00:High 5.00:Very LowConcern
5.00:Very LowConcern
Green(5.00)
SOUTHERN ROCK SOLE - BRITISH COLUMBIA/NORTHEAST PACIFIC - BOTTOM TRAWLS - CANADA - HARDSUBSTRATE
Subscore: 1.41 Discard Rate: 0.95 C2 Rate: 1.34
SpeciesInherentVulnerability Abundance Fishing Mortality Subscore
Bocaccio 1.00:High 2.00:High Concern 1.00:High Concern Red (1.41)
Darkblotched rockfish 1.00:High 2.00:High Concern 2.33:ModerateConcern
Red (2.16)
Green sturgeon 1.00:High 2.00:High Concern 2.33:ModerateConcern
Red (2.16)
Redbanded rockfish 1.00:High 2.00:High Concern 2.33:ModerateConcern
Red (2.16)
Redstripe rockfish 1.00:High 2.00:High Concern 2.33:ModerateConcern
Red (2.16)
Rougheye rockfish 1.00:High 2.00:High Concern 2.33:ModerateConcern
Red (2.16)
Shortraker rockfish 1.00:High 2.00:High Concern 2.33:ModerateConcern
Red (2.16)
169

School shark 1.00:High 2.00:High Concern 2.33:ModerateConcern
Red (2.16)
Widow rockfish 1.00:High 2.00:High Concern 2.33:ModerateConcern
Red (2.16)
Greenstriped rockfish 1.00:High 3.00:ModerateConcern
2.33:ModerateConcern
Yellow(2.64)
Sharpchin rockfish 1.00:High 3.00:ModerateConcern
2.33:ModerateConcern
Yellow(2.64)
Splitnose rockfish 1.00:High 3.00:ModerateConcern
2.33:ModerateConcern
Yellow(2.64)
Spotted ratfish 1.00:High 3.00:ModerateConcern
2.33:ModerateConcern
Yellow(2.64)
Sixgill shark 1.00:High 2.00:High Concern 3.67:Low Concern Yellow(2.71)
Pacific Ocean perch 1.00:High 4.00:Low Concern 2.33:ModerateConcern
Yellow(3.05)
Steller sea lion 1.00:High 4.00:Low Concern 3.67:Low Concern Green(3.83)
Canary rockfish 1.00:High 4.00:Low Concern 5.00:Very LowConcern
Green(4.47)
Lingcod 2.00:Medium 4.00:Low Concern 5.00:Very LowConcern
Green(4.47)
Yellowmouth rockfish 1.00:High 4.00:Low Concern 5.00:Very LowConcern
Green(4.47)
Arrowtooth flounder 2.00:Medium 5.00:Very LowConcern
5.00:Very LowConcern
Green(5.00)
Silvergray rockfish 1.00:High 5.00:Very LowConcern
5.00:Very LowConcern
Green(5.00)
Yellowtail rockfish 1.00:High 5.00:Very LowConcern
5.00:Very LowConcern
Green(5.00)
SOUTHERN ROCK SOLE - BRITISH COLUMBIA/NORTHEAST PACIFIC - MIDWATER TRAWLS - CANADA
Subscore: 1.41 Discard Rate: 0.95 C2 Rate: 1.34
SpeciesInherentVulnerability Abundance Fishing Mortality Subscore
Bocaccio 1.00:High 2.00:High Concern 1.00:High Concern Red (1.41)
170

Darkblotched rockfish 1.00:High 2.00:High Concern 2.33:ModerateConcern
Red (2.16)
Green sturgeon 1.00:High 2.00:High Concern 2.33:ModerateConcern
Red (2.16)
Redbanded rockfish 1.00:High 2.00:High Concern 2.33:ModerateConcern
Red (2.16)
Redstripe rockfish 1.00:High 2.00:High Concern 2.33:ModerateConcern
Red (2.16)
Rougheye rockfish 1.00:High 2.00:High Concern 2.33:ModerateConcern
Red (2.16)
Shortraker rockfish 1.00:High 2.00:High Concern 2.33:ModerateConcern
Red (2.16)
School shark 1.00:High 2.00:High Concern 2.33:ModerateConcern
Red (2.16)
Widow rockfish 1.00:High 2.00:High Concern 2.33:ModerateConcern
Red (2.16)
Greenstriped rockfish 1.00:High 3.00:ModerateConcern
2.33:ModerateConcern
Yellow(2.64)
Sharpchin rockfish 1.00:High 3.00:ModerateConcern
2.33:ModerateConcern
Yellow(2.64)
Splitnose rockfish 1.00:High 3.00:ModerateConcern
2.33:ModerateConcern
Yellow(2.64)
Spotted ratfish 1.00:High 3.00:ModerateConcern
2.33:ModerateConcern
Yellow(2.64)
Sixgill shark 1.00:High 2.00:High Concern 3.67:Low Concern Yellow(2.71)
Pacific Ocean perch 1.00:High 4.00:Low Concern 2.33:ModerateConcern
Yellow(3.05)
Steller sea lion 1.00:High 4.00:Low Concern 3.67:Low Concern Green(3.83)
Canary rockfish 1.00:High 4.00:Low Concern 5.00:Very LowConcern
Green(4.47)
Lingcod 2.00:Medium 4.00:Low Concern 5.00:Very LowConcern
Green(4.47)
Yellowmouth rockfish 1.00:High 4.00:Low Concern 5.00:Very LowConcern
Green(4.47)
171

Arrowtooth flounder 2.00:Medium 5.00:Very LowConcern
5.00:Very LowConcern
Green(5.00)
Silvergray rockfish 1.00:High 5.00:Very LowConcern
5.00:Very LowConcern
Green(5.00)
Yellowtail rockfish 1.00:High 5.00:Very LowConcern
5.00:Very LowConcern
Green(5.00)
SPINY DOGFISH - BRITISH COLUMBIA/NORTHEAST PACIFIC - LONGLINE (SHALLOW-SET) - CANADA
Subscore: 2.16 Discard Rate: 0.95 C2 Rate: 2.05
SpeciesInherentVulnerability Abundance Fishing Mortality Subscore
Longnose skate 1.00:High 2.00:High Concern 2.33:ModerateConcern
Red (2.16)
School shark 1.00:High 2.00:High Concern 2.33:ModerateConcern
Red (2.16)
Sixgill shark 1.00:High 2.00:High Concern 3.67:Low Concern Yellow(2.71)
Yelloweye rockfish 1.00:High 2.00:High Concern 3.67:Low Concern Yellow(2.71)
TIGER ROCKFISH - BRITISH COLUMBIA/NORTHEAST PACIFIC - JIG - CANADA - INSIDE ROCKFISH
Subscore: 2.71 Discard Rate: 0.95 C2 Rate: 2.57
SpeciesInherentVulnerability Abundance Fishing Mortality Subscore
Quillback rockfish 1.00:High 2.00:High Concern 3.67:Low Concern Yellow(2.71)
Yelloweye rockfish 1.00:High 2.00:High Concern 3.67:Low Concern Yellow(2.71)
Lingcod 2.00:Medium 4.00:Low Concern 5.00:Very LowConcern
Green(4.47)
Yellowtail rockfish 1.00:High 5.00:Very LowConcern
5.00:Very LowConcern
Green(5.00)
TIGER ROCKFISH - BRITISH COLUMBIA/NORTHEAST PACIFIC - JIG - CANADA - OUTSIDE ROCKFISH
Subscore: 2.16 Discard Rate: 0.95 C2 Rate: 2.05
172
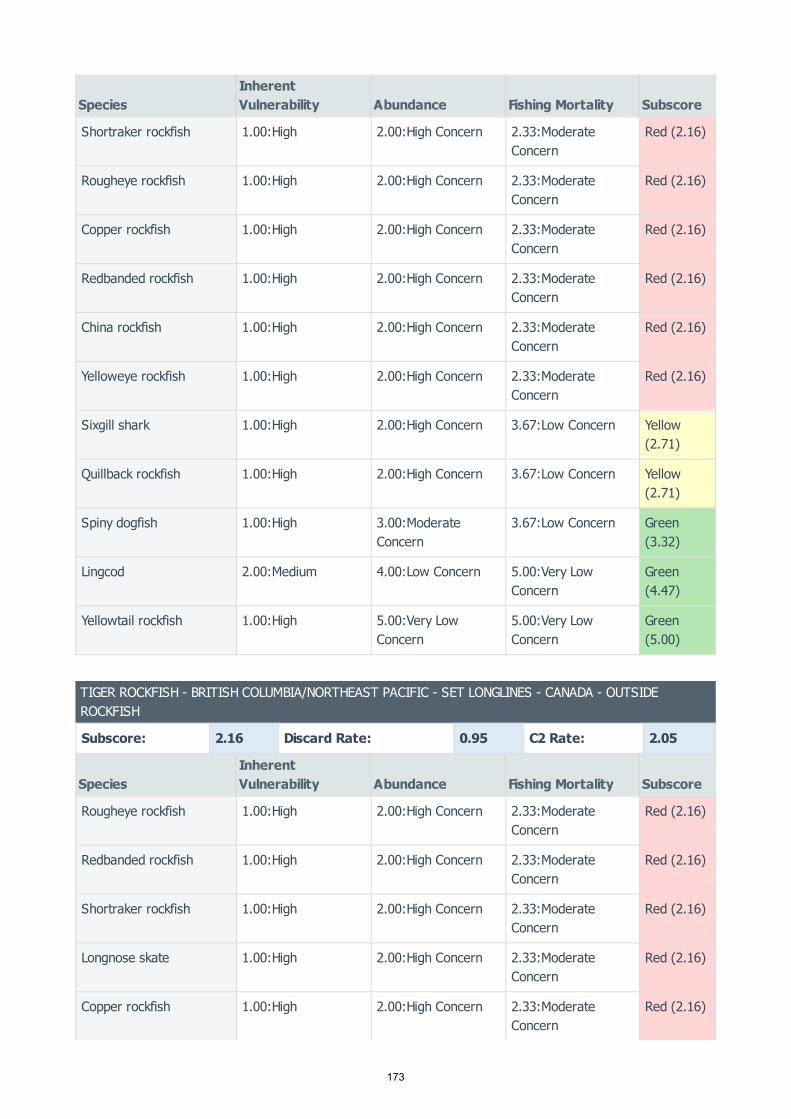
SpeciesInherentVulnerability Abundance Fishing Mortality Subscore
Shortraker rockfish 1.00:High 2.00:High Concern 2.33:ModerateConcern
Red (2.16)
Rougheye rockfish 1.00:High 2.00:High Concern 2.33:ModerateConcern
Red (2.16)
Copper rockfish 1.00:High 2.00:High Concern 2.33:ModerateConcern
Red (2.16)
Redbanded rockfish 1.00:High 2.00:High Concern 2.33:ModerateConcern
Red (2.16)
China rockfish 1.00:High 2.00:High Concern 2.33:ModerateConcern
Red (2.16)
Yelloweye rockfish 1.00:High 2.00:High Concern 2.33:ModerateConcern
Red (2.16)
Sixgill shark 1.00:High 2.00:High Concern 3.67:Low Concern Yellow(2.71)
Quillback rockfish 1.00:High 2.00:High Concern 3.67:Low Concern Yellow(2.71)
Spiny dogfish 1.00:High 3.00:ModerateConcern
3.67:Low Concern Green(3.32)
Lingcod 2.00:Medium 4.00:Low Concern 5.00:Very LowConcern
Green(4.47)
Yellowtail rockfish 1.00:High 5.00:Very LowConcern
5.00:Very LowConcern
Green(5.00)
TIGER ROCKFISH - BRITISH COLUMBIA/NORTHEAST PACIFIC - SET LONGLINES - CANADA - OUTSIDEROCKFISH
Subscore: 2.16 Discard Rate: 0.95 C2 Rate: 2.05
SpeciesInherentVulnerability Abundance Fishing Mortality Subscore
Rougheye rockfish 1.00:High 2.00:High Concern 2.33:ModerateConcern
Red (2.16)
Redbanded rockfish 1.00:High 2.00:High Concern 2.33:ModerateConcern
Red (2.16)
Shortraker rockfish 1.00:High 2.00:High Concern 2.33:ModerateConcern
Red (2.16)
Longnose skate 1.00:High 2.00:High Concern 2.33:ModerateConcern
Red (2.16)
Copper rockfish 1.00:High 2.00:High Concern 2.33:ModerateConcern
Red (2.16)
173
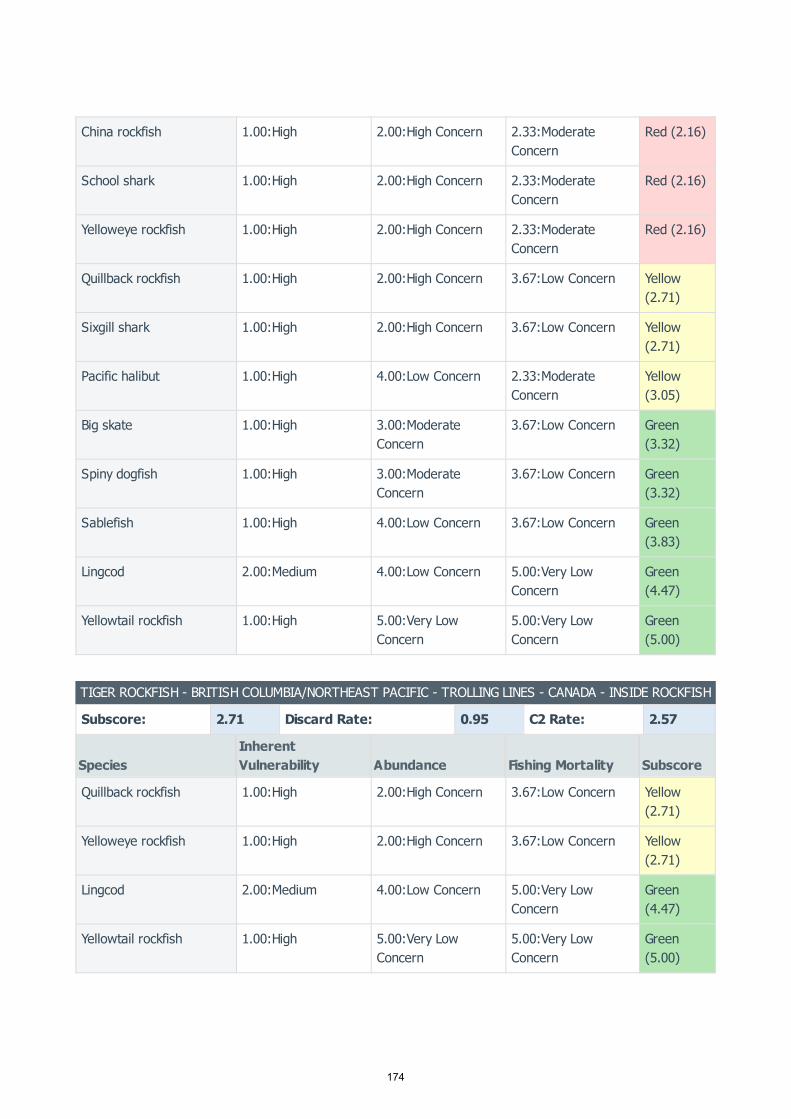
China rockfish 1.00:High 2.00:High Concern 2.33:ModerateConcern
Red (2.16)
School shark 1.00:High 2.00:High Concern 2.33:ModerateConcern
Red (2.16)
Yelloweye rockfish 1.00:High 2.00:High Concern 2.33:ModerateConcern
Red (2.16)
Quillback rockfish 1.00:High 2.00:High Concern 3.67:Low Concern Yellow(2.71)
Sixgill shark 1.00:High 2.00:High Concern 3.67:Low Concern Yellow(2.71)
Pacific halibut 1.00:High 4.00:Low Concern 2.33:ModerateConcern
Yellow(3.05)
Big skate 1.00:High 3.00:ModerateConcern
3.67:Low Concern Green(3.32)
Spiny dogfish 1.00:High 3.00:ModerateConcern
3.67:Low Concern Green(3.32)
Sablefish 1.00:High 4.00:Low Concern 3.67:Low Concern Green(3.83)
Lingcod 2.00:Medium 4.00:Low Concern 5.00:Very LowConcern
Green(4.47)
Yellowtail rockfish 1.00:High 5.00:Very LowConcern
5.00:Very LowConcern
Green(5.00)
TIGER ROCKFISH - BRITISH COLUMBIA/NORTHEAST PACIFIC - TROLLING LINES - CANADA - INSIDE ROCKFISH
Subscore: 2.71 Discard Rate: 0.95 C2 Rate: 2.57
SpeciesInherentVulnerability Abundance Fishing Mortality Subscore
Quillback rockfish 1.00:High 2.00:High Concern 3.67:Low Concern Yellow(2.71)
Yelloweye rockfish 1.00:High 2.00:High Concern 3.67:Low Concern Yellow(2.71)
Lingcod 2.00:Medium 4.00:Low Concern 5.00:Very LowConcern
Green(4.47)
Yellowtail rockfish 1.00:High 5.00:Very LowConcern
5.00:Very LowConcern
Green(5.00)
174
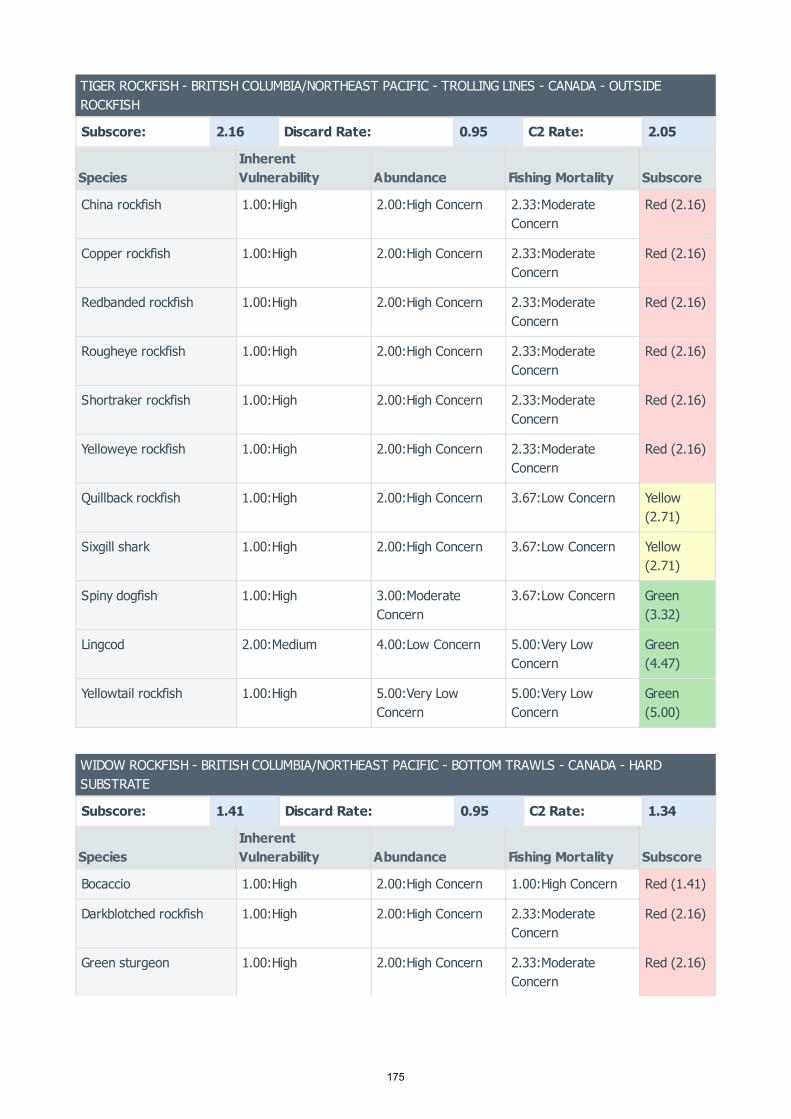
TIGER ROCKFISH - BRITISH COLUMBIA/NORTHEAST PACIFIC - TROLLING LINES - CANADA - OUTSIDEROCKFISH
Subscore: 2.16 Discard Rate: 0.95 C2 Rate: 2.05
SpeciesInherentVulnerability Abundance Fishing Mortality Subscore
China rockfish 1.00:High 2.00:High Concern 2.33:ModerateConcern
Red (2.16)
Copper rockfish 1.00:High 2.00:High Concern 2.33:ModerateConcern
Red (2.16)
Redbanded rockfish 1.00:High 2.00:High Concern 2.33:ModerateConcern
Red (2.16)
Rougheye rockfish 1.00:High 2.00:High Concern 2.33:ModerateConcern
Red (2.16)
Shortraker rockfish 1.00:High 2.00:High Concern 2.33:ModerateConcern
Red (2.16)
Yelloweye rockfish 1.00:High 2.00:High Concern 2.33:ModerateConcern
Red (2.16)
Quillback rockfish 1.00:High 2.00:High Concern 3.67:Low Concern Yellow(2.71)
Sixgill shark 1.00:High 2.00:High Concern 3.67:Low Concern Yellow(2.71)
Spiny dogfish 1.00:High 3.00:ModerateConcern
3.67:Low Concern Green(3.32)
Lingcod 2.00:Medium 4.00:Low Concern 5.00:Very LowConcern
Green(4.47)
Yellowtail rockfish 1.00:High 5.00:Very LowConcern
5.00:Very LowConcern
Green(5.00)
WIDOW ROCKFISH - BRITISH COLUMBIA/NORTHEAST PACIFIC - BOTTOM TRAWLS - CANADA - HARDSUBSTRATE
Subscore: 1.41 Discard Rate: 0.95 C2 Rate: 1.34
SpeciesInherentVulnerability Abundance Fishing Mortality Subscore
Bocaccio 1.00:High 2.00:High Concern 1.00:High Concern Red (1.41)
Darkblotched rockfish 1.00:High 2.00:High Concern 2.33:ModerateConcern
Red (2.16)
Green sturgeon 1.00:High 2.00:High Concern 2.33:ModerateConcern
Red (2.16)
175

Redbanded rockfish 1.00:High 2.00:High Concern 2.33:ModerateConcern
Red (2.16)
Redstripe rockfish 1.00:High 2.00:High Concern 2.33:ModerateConcern
Red (2.16)
Rougheye rockfish 1.00:High 2.00:High Concern 2.33:ModerateConcern
Red (2.16)
Shortraker rockfish 1.00:High 2.00:High Concern 2.33:ModerateConcern
Red (2.16)
School shark 1.00:High 2.00:High Concern 2.33:ModerateConcern
Red (2.16)
Greenstriped rockfish 1.00:High 3.00:ModerateConcern
2.33:ModerateConcern
Yellow(2.64)
Sharpchin rockfish 1.00:High 3.00:ModerateConcern
2.33:ModerateConcern
Yellow(2.64)
Splitnose rockfish 1.00:High 3.00:ModerateConcern
2.33:ModerateConcern
Yellow(2.64)
Spotted ratfish 1.00:High 3.00:ModerateConcern
2.33:ModerateConcern
Yellow(2.64)
Sixgill shark 1.00:High 2.00:High Concern 3.67:Low Concern Yellow(2.71)
Pacific Ocean perch 1.00:High 4.00:Low Concern 2.33:ModerateConcern
Yellow(3.05)
Steller sea lion 1.00:High 4.00:Low Concern 3.67:Low Concern Green(3.83)
Canary rockfish 1.00:High 4.00:Low Concern 5.00:Very LowConcern
Green(4.47)
Lingcod 2.00:Medium 4.00:Low Concern 5.00:Very LowConcern
Green(4.47)
Yellowmouth rockfish 1.00:High 4.00:Low Concern 5.00:Very LowConcern
Green(4.47)
Arrowtooth flounder 2.00:Medium 5.00:Very LowConcern
5.00:Very LowConcern
Green(5.00)
Silvergray rockfish 1.00:High 5.00:Very LowConcern
5.00:Very LowConcern
Green(5.00)
Southern Rock sole 2.00:Medium 5.00:Very LowConcern
5.00:Very LowConcern
Green(5.00)
176

Yellowtail rockfish 1.00:High 5.00:Very LowConcern
5.00:Very LowConcern
Green(5.00)
WIDOW ROCKFISH - BRITISH COLUMBIA/NORTHEAST PACIFIC - MIDWATER TRAWLS - CANADA
Subscore: 1.41 Discard Rate: 0.95 C2 Rate: 1.34
SpeciesInherentVulnerability Abundance Fishing Mortality Subscore
Bocaccio 1.00:High 2.00:High Concern 1.00:High Concern Red (1.41)
Darkblotched rockfish 1.00:High 2.00:High Concern 2.33:ModerateConcern
Red (2.16)
Green sturgeon 1.00:High 2.00:High Concern 2.33:ModerateConcern
Red (2.16)
Redbanded rockfish 1.00:High 2.00:High Concern 2.33:ModerateConcern
Red (2.16)
Redstripe rockfish 1.00:High 2.00:High Concern 2.33:ModerateConcern
Red (2.16)
Rougheye rockfish 1.00:High 2.00:High Concern 2.33:ModerateConcern
Red (2.16)
Shortraker rockfish 1.00:High 2.00:High Concern 2.33:ModerateConcern
Red (2.16)
School shark 1.00:High 2.00:High Concern 2.33:ModerateConcern
Red (2.16)
Greenstriped rockfish 1.00:High 3.00:ModerateConcern
2.33:ModerateConcern
Yellow(2.64)
Sharpchin rockfish 1.00:High 3.00:ModerateConcern
2.33:ModerateConcern
Yellow(2.64)
Splitnose rockfish 1.00:High 3.00:ModerateConcern
2.33:ModerateConcern
Yellow(2.64)
Spotted ratfish 1.00:High 3.00:ModerateConcern
2.33:ModerateConcern
Yellow(2.64)
Sixgill shark 1.00:High 2.00:High Concern 3.67:Low Concern Yellow(2.71)
Pacific Ocean perch 1.00:High 4.00:Low Concern 2.33:ModerateConcern
Yellow(3.05)
Steller sea lion 1.00:High 4.00:Low Concern 3.67:Low Concern Green(3.83)
177

Canary rockfish 1.00:High 4.00:Low Concern 5.00:Very LowConcern
Green(4.47)
Lingcod 2.00:Medium 4.00:Low Concern 5.00:Very LowConcern
Green(4.47)
Yellowmouth rockfish 1.00:High 4.00:Low Concern 5.00:Very LowConcern
Green(4.47)
Arrowtooth flounder 2.00:Medium 5.00:Very LowConcern
5.00:Very LowConcern
Green(5.00)
Silvergray rockfish 1.00:High 5.00:Very LowConcern
5.00:Very LowConcern
Green(5.00)
Southern Rock sole 2.00:Medium 5.00:Very LowConcern
5.00:Very LowConcern
Green(5.00)
Yellowtail rockfish 1.00:High 5.00:Very LowConcern
5.00:Very LowConcern
Green(5.00)
YELLOWEYE ROCKFISH - BRITISH COLUMBIA/NORTHEAST PACIFIC - JIG - CANADA - INSIDE ROCKFISH
Subscore: 2.16 Discard Rate: 0.95 C2 Rate: 2.05
SpeciesInherentVulnerability Abundance Fishing Mortality Subscore
Tiger rockfish 1.00:High 2.00:High Concern 2.33:ModerateConcern
Red (2.16)
Quillback rockfish 1.00:High 2.00:High Concern 3.67:Low Concern Yellow(2.71)
Lingcod 2.00:Medium 4.00:Low Concern 5.00:Very LowConcern
Green(4.47)
Yellowtail rockfish 1.00:High 5.00:Very LowConcern
5.00:Very LowConcern
Green(5.00)
YELLOWEYE ROCKFISH - BRITISH COLUMBIA/NORTHEAST PACIFIC - JIG - CANADA - OUTSIDE ROCKFISH
Subscore: 2.16 Discard Rate: 0.95 C2 Rate: 2.05
SpeciesInherentVulnerability Abundance Fishing Mortality Subscore
Tiger rockfish 1.00:High 2.00:High Concern 2.33:ModerateConcern
Red (2.16)
Shortraker rockfish 1.00:High 2.00:High Concern 2.33:ModerateConcern
Red (2.16)
178

Rougheye rockfish 1.00:High 2.00:High Concern 2.33:ModerateConcern
Red (2.16)
Copper rockfish 1.00:High 2.00:High Concern 2.33:ModerateConcern
Red (2.16)
Redbanded rockfish 1.00:High 2.00:High Concern 2.33:ModerateConcern
Red (2.16)
China rockfish 1.00:High 2.00:High Concern 2.33:ModerateConcern
Red (2.16)
Sixgill shark 1.00:High 2.00:High Concern 3.67:Low Concern Yellow(2.71)
Quillback rockfish 1.00:High 2.00:High Concern 3.67:Low Concern Yellow(2.71)
Spiny dogfish 1.00:High 3.00:ModerateConcern
3.67:Low Concern Green(3.32)
Lingcod 2.00:Medium 4.00:Low Concern 5.00:Very LowConcern
Green(4.47)
Yellowtail rockfish 1.00:High 5.00:Very LowConcern
5.00:Very LowConcern
Green(5.00)
YELLOWEYE ROCKFISH - BRITISH COLUMBIA/NORTHEAST PACIFIC - LONGLINE (DEEP-SET) - CANADA
Subscore: 2.16 Discard Rate: 0.95 C2 Rate: 2.05
SpeciesInherentVulnerability Abundance Fishing Mortality Subscore
Redbanded rockfish 1.00:High 2.00:High Concern 2.33:ModerateConcern
Red (2.16)
Rougheye rockfish 1.00:High 2.00:High Concern 2.33:ModerateConcern
Red (2.16)
Shortraker rockfish 1.00:High 2.00:High Concern 2.33:ModerateConcern
Red (2.16)
Sixgill shark 1.00:High 2.00:High Concern 3.67:Low Concern Yellow(2.71)
Sablefish 1.00:High 4.00:Low Concern 3.67:Low Concern Green(3.83)
YELLOWEYE ROCKFISH - BRITISH COLUMBIA/NORTHEAST PACIFIC - LONGLINE (SHALLOW-SET) - CANADA
Subscore: 2.16 Discard Rate: 0.95 C2 Rate: 2.05
179

SpeciesInherentVulnerability Abundance Fishing Mortality Subscore
Longnose skate 1.00:High 2.00:High Concern 2.33:ModerateConcern
Red (2.16)
School shark 1.00:High 2.00:High Concern 2.33:ModerateConcern
Red (2.16)
Sixgill shark 1.00:High 2.00:High Concern 3.67:Low Concern Yellow(2.71)
Spiny dogfish 1.00:High 3.00:ModerateConcern
3.67:Low Concern Green(3.32)
YELLOWEYE ROCKFISH - BRITISH COLUMBIA/NORTHEAST PACIFIC - SET LONGLINES - CANADA - OUTSIDEROCKFISH
Subscore: 2.16 Discard Rate: 0.95 C2 Rate: 2.05
SpeciesInherentVulnerability Abundance Fishing Mortality Subscore
Rougheye rockfish 1.00:High 2.00:High Concern 2.33:ModerateConcern
Red (2.16)
Redbanded rockfish 1.00:High 2.00:High Concern 2.33:ModerateConcern
Red (2.16)
Shortraker rockfish 1.00:High 2.00:High Concern 2.33:ModerateConcern
Red (2.16)
Tiger rockfish 1.00:High 2.00:High Concern 2.33:ModerateConcern
Red (2.16)
Longnose skate 1.00:High 2.00:High Concern 2.33:ModerateConcern
Red (2.16)
Copper rockfish 1.00:High 2.00:High Concern 2.33:ModerateConcern
Red (2.16)
China rockfish 1.00:High 2.00:High Concern 2.33:ModerateConcern
Red (2.16)
School shark 1.00:High 2.00:High Concern 2.33:ModerateConcern
Red (2.16)
Quillback rockfish 1.00:High 2.00:High Concern 3.67:Low Concern Yellow(2.71)
Sixgill shark 1.00:High 2.00:High Concern 3.67:Low Concern Yellow(2.71)
Pacific halibut 1.00:High 4.00:Low Concern 2.33:ModerateConcern
Yellow(3.05)
Big skate 1.00:High 3.00:ModerateConcern
3.67:Low Concern Green(3.32)
180
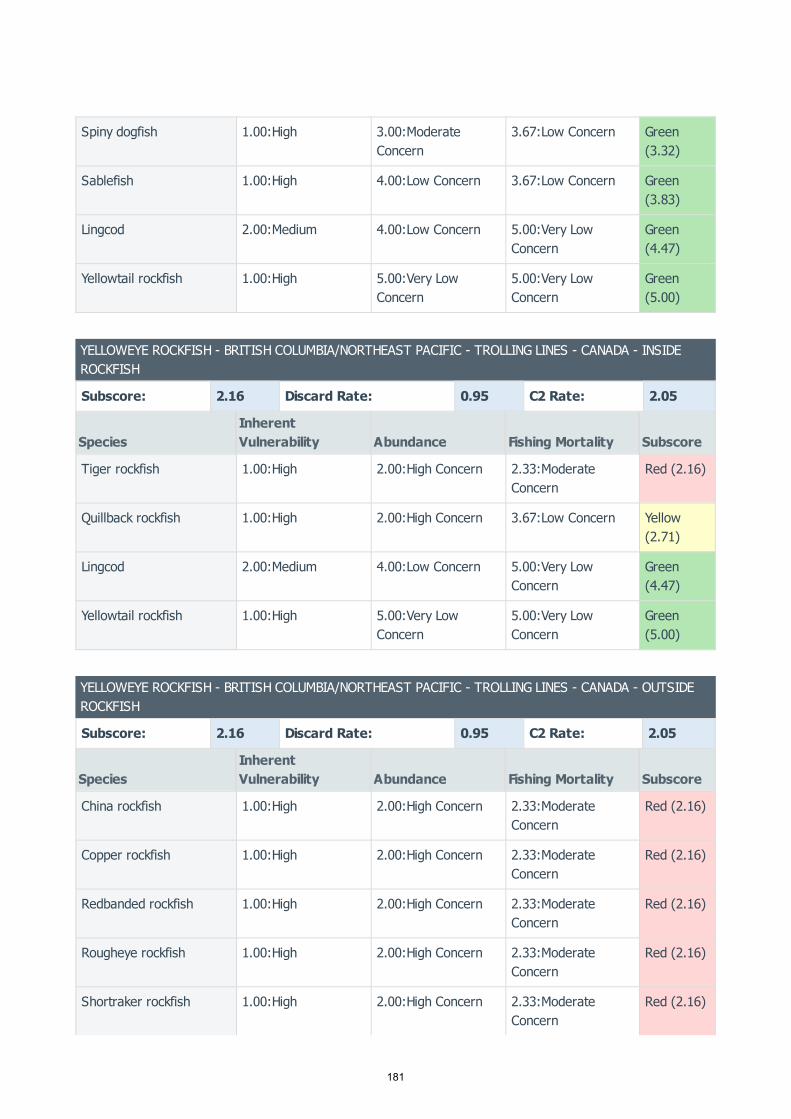
Spiny dogfish 1.00:High 3.00:ModerateConcern
3.67:Low Concern Green(3.32)
Sablefish 1.00:High 4.00:Low Concern 3.67:Low Concern Green(3.83)
Lingcod 2.00:Medium 4.00:Low Concern 5.00:Very LowConcern
Green(4.47)
Yellowtail rockfish 1.00:High 5.00:Very LowConcern
5.00:Very LowConcern
Green(5.00)
YELLOWEYE ROCKFISH - BRITISH COLUMBIA/NORTHEAST PACIFIC - TROLLING LINES - CANADA - INSIDEROCKFISH
Subscore: 2.16 Discard Rate: 0.95 C2 Rate: 2.05
SpeciesInherentVulnerability Abundance Fishing Mortality Subscore
Tiger rockfish 1.00:High 2.00:High Concern 2.33:ModerateConcern
Red (2.16)
Quillback rockfish 1.00:High 2.00:High Concern 3.67:Low Concern Yellow(2.71)
Lingcod 2.00:Medium 4.00:Low Concern 5.00:Very LowConcern
Green(4.47)
Yellowtail rockfish 1.00:High 5.00:Very LowConcern
5.00:Very LowConcern
Green(5.00)
YELLOWEYE ROCKFISH - BRITISH COLUMBIA/NORTHEAST PACIFIC - TROLLING LINES - CANADA - OUTSIDEROCKFISH
Subscore: 2.16 Discard Rate: 0.95 C2 Rate: 2.05
SpeciesInherentVulnerability Abundance Fishing Mortality Subscore
China rockfish 1.00:High 2.00:High Concern 2.33:ModerateConcern
Red (2.16)
Copper rockfish 1.00:High 2.00:High Concern 2.33:ModerateConcern
Red (2.16)
Redbanded rockfish 1.00:High 2.00:High Concern 2.33:ModerateConcern
Red (2.16)
Rougheye rockfish 1.00:High 2.00:High Concern 2.33:ModerateConcern
Red (2.16)
Shortraker rockfish 1.00:High 2.00:High Concern 2.33:ModerateConcern
Red (2.16)
181

Tiger rockfish 1.00:High 2.00:High Concern 2.33:ModerateConcern
Red (2.16)
Quillback rockfish 1.00:High 2.00:High Concern 3.67:Low Concern Yellow(2.71)
Sixgill shark 1.00:High 2.00:High Concern 3.67:Low Concern Yellow(2.71)
Spiny dogfish 1.00:High 3.00:ModerateConcern
3.67:Low Concern Green(3.32)
Lingcod 2.00:Medium 4.00:Low Concern 5.00:Very LowConcern
Green(4.47)
Yellowtail rockfish 1.00:High 5.00:Very LowConcern
5.00:Very LowConcern
Green(5.00)
YELLOWMOUTH ROCKFISH - BRITISH COLUMBIA/NORTHEAST PACIFIC - BOTTOM TRAWLS - CANADA - HARDSUBSTRATE
Subscore: 1.41 Discard Rate: 0.95 C2 Rate: 1.34
SpeciesInherentVulnerability Abundance Fishing Mortality Subscore
Bocaccio 1.00:High 2.00:High Concern 1.00:High Concern Red (1.41)
Darkblotched rockfish 1.00:High 2.00:High Concern 2.33:ModerateConcern
Red (2.16)
Green sturgeon 1.00:High 2.00:High Concern 2.33:ModerateConcern
Red (2.16)
Redbanded rockfish 1.00:High 2.00:High Concern 2.33:ModerateConcern
Red (2.16)
Redstripe rockfish 1.00:High 2.00:High Concern 2.33:ModerateConcern
Red (2.16)
Rougheye rockfish 1.00:High 2.00:High Concern 2.33:ModerateConcern
Red (2.16)
Shortraker rockfish 1.00:High 2.00:High Concern 2.33:ModerateConcern
Red (2.16)
School shark 1.00:High 2.00:High Concern 2.33:ModerateConcern
Red (2.16)
Widow rockfish 1.00:High 2.00:High Concern 2.33:ModerateConcern
Red (2.16)
Greenstriped rockfish 1.00:High 3.00:ModerateConcern
2.33:ModerateConcern
Yellow(2.64)
182
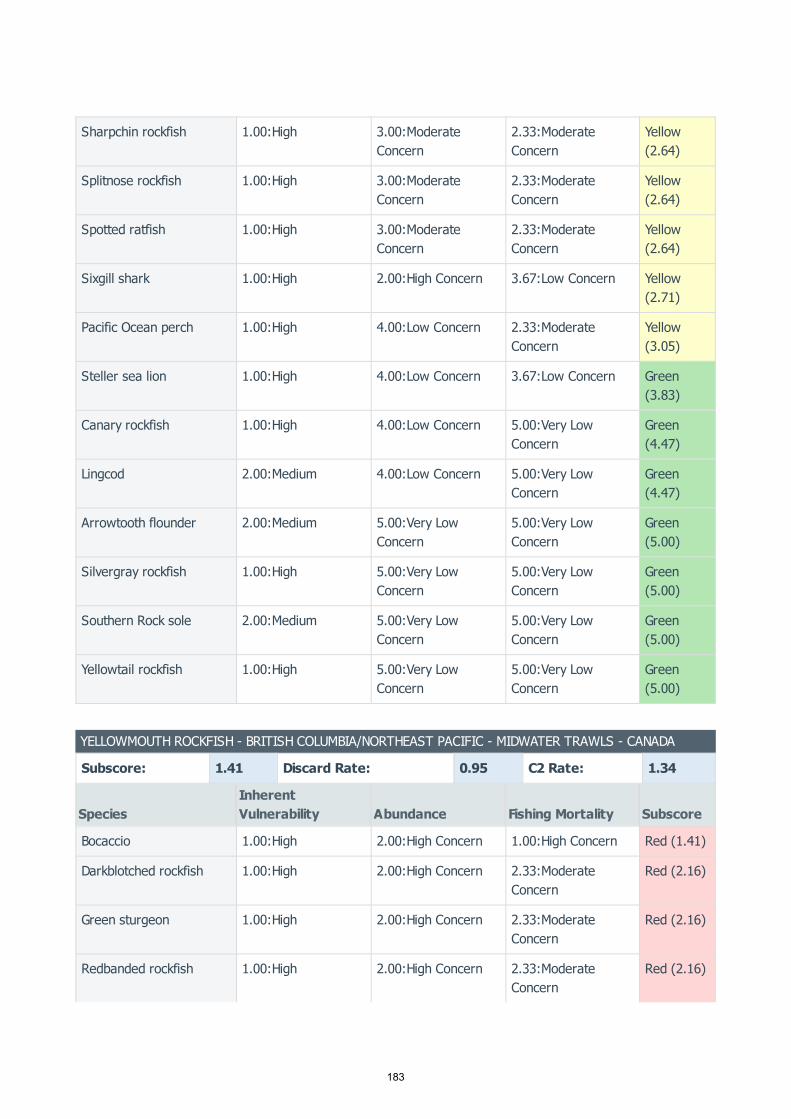
Sharpchin rockfish 1.00:High 3.00:ModerateConcern
2.33:ModerateConcern
Yellow(2.64)
Splitnose rockfish 1.00:High 3.00:ModerateConcern
2.33:ModerateConcern
Yellow(2.64)
Spotted ratfish 1.00:High 3.00:ModerateConcern
2.33:ModerateConcern
Yellow(2.64)
Sixgill shark 1.00:High 2.00:High Concern 3.67:Low Concern Yellow(2.71)
Pacific Ocean perch 1.00:High 4.00:Low Concern 2.33:ModerateConcern
Yellow(3.05)
Steller sea lion 1.00:High 4.00:Low Concern 3.67:Low Concern Green(3.83)
Canary rockfish 1.00:High 4.00:Low Concern 5.00:Very LowConcern
Green(4.47)
Lingcod 2.00:Medium 4.00:Low Concern 5.00:Very LowConcern
Green(4.47)
Arrowtooth flounder 2.00:Medium 5.00:Very LowConcern
5.00:Very LowConcern
Green(5.00)
Silvergray rockfish 1.00:High 5.00:Very LowConcern
5.00:Very LowConcern
Green(5.00)
Southern Rock sole 2.00:Medium 5.00:Very LowConcern
5.00:Very LowConcern
Green(5.00)
Yellowtail rockfish 1.00:High 5.00:Very LowConcern
5.00:Very LowConcern
Green(5.00)
YELLOWMOUTH ROCKFISH - BRITISH COLUMBIA/NORTHEAST PACIFIC - MIDWATER TRAWLS - CANADA
Subscore: 1.41 Discard Rate: 0.95 C2 Rate: 1.34
SpeciesInherentVulnerability Abundance Fishing Mortality Subscore
Bocaccio 1.00:High 2.00:High Concern 1.00:High Concern Red (1.41)
Darkblotched rockfish 1.00:High 2.00:High Concern 2.33:ModerateConcern
Red (2.16)
Green sturgeon 1.00:High 2.00:High Concern 2.33:ModerateConcern
Red (2.16)
Redbanded rockfish 1.00:High 2.00:High Concern 2.33:ModerateConcern
Red (2.16)
183
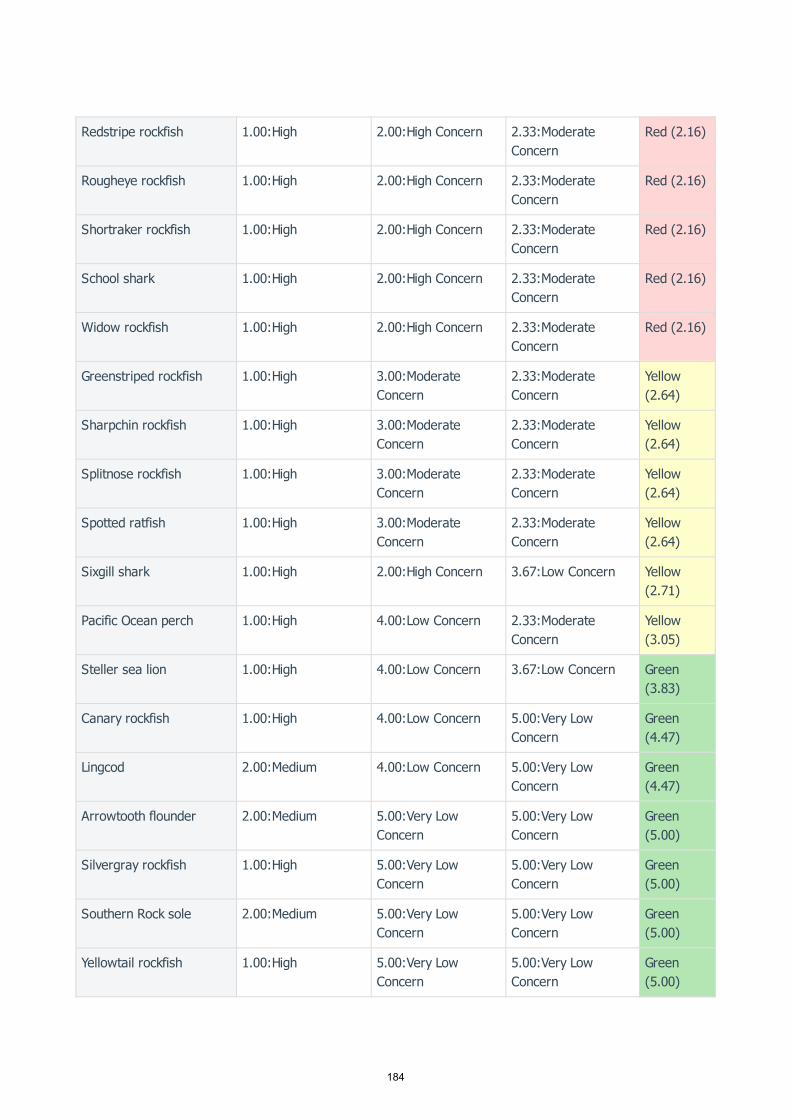
Redstripe rockfish 1.00:High 2.00:High Concern 2.33:ModerateConcern
Red (2.16)
Rougheye rockfish 1.00:High 2.00:High Concern 2.33:ModerateConcern
Red (2.16)
Shortraker rockfish 1.00:High 2.00:High Concern 2.33:ModerateConcern
Red (2.16)
School shark 1.00:High 2.00:High Concern 2.33:ModerateConcern
Red (2.16)
Widow rockfish 1.00:High 2.00:High Concern 2.33:ModerateConcern
Red (2.16)
Greenstriped rockfish 1.00:High 3.00:ModerateConcern
2.33:ModerateConcern
Yellow(2.64)
Sharpchin rockfish 1.00:High 3.00:ModerateConcern
2.33:ModerateConcern
Yellow(2.64)
Splitnose rockfish 1.00:High 3.00:ModerateConcern
2.33:ModerateConcern
Yellow(2.64)
Spotted ratfish 1.00:High 3.00:ModerateConcern
2.33:ModerateConcern
Yellow(2.64)
Sixgill shark 1.00:High 2.00:High Concern 3.67:Low Concern Yellow(2.71)
Pacific Ocean perch 1.00:High 4.00:Low Concern 2.33:ModerateConcern
Yellow(3.05)
Steller sea lion 1.00:High 4.00:Low Concern 3.67:Low Concern Green(3.83)
Canary rockfish 1.00:High 4.00:Low Concern 5.00:Very LowConcern
Green(4.47)
Lingcod 2.00:Medium 4.00:Low Concern 5.00:Very LowConcern
Green(4.47)
Arrowtooth flounder 2.00:Medium 5.00:Very LowConcern
5.00:Very LowConcern
Green(5.00)
Silvergray rockfish 1.00:High 5.00:Very LowConcern
5.00:Very LowConcern
Green(5.00)
Southern Rock sole 2.00:Medium 5.00:Very LowConcern
5.00:Very LowConcern
Green(5.00)
Yellowtail rockfish 1.00:High 5.00:Very LowConcern
5.00:Very LowConcern
Green(5.00)
184
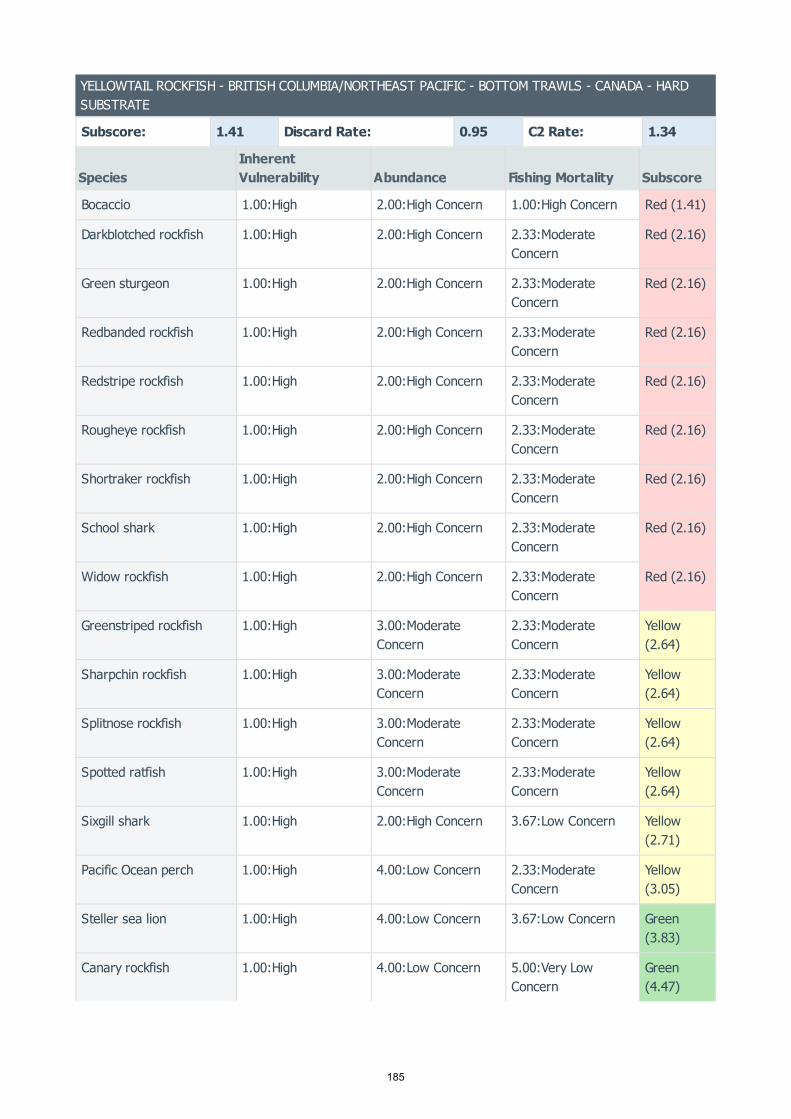
YELLOWTAIL ROCKFISH - BRITISH COLUMBIA/NORTHEAST PACIFIC - BOTTOM TRAWLS - CANADA - HARDSUBSTRATE
Subscore: 1.41 Discard Rate: 0.95 C2 Rate: 1.34
SpeciesInherentVulnerability Abundance Fishing Mortality Subscore
Bocaccio 1.00:High 2.00:High Concern 1.00:High Concern Red (1.41)
Darkblotched rockfish 1.00:High 2.00:High Concern 2.33:ModerateConcern
Red (2.16)
Green sturgeon 1.00:High 2.00:High Concern 2.33:ModerateConcern
Red (2.16)
Redbanded rockfish 1.00:High 2.00:High Concern 2.33:ModerateConcern
Red (2.16)
Redstripe rockfish 1.00:High 2.00:High Concern 2.33:ModerateConcern
Red (2.16)
Rougheye rockfish 1.00:High 2.00:High Concern 2.33:ModerateConcern
Red (2.16)
Shortraker rockfish 1.00:High 2.00:High Concern 2.33:ModerateConcern
Red (2.16)
School shark 1.00:High 2.00:High Concern 2.33:ModerateConcern
Red (2.16)
Widow rockfish 1.00:High 2.00:High Concern 2.33:ModerateConcern
Red (2.16)
Greenstriped rockfish 1.00:High 3.00:ModerateConcern
2.33:ModerateConcern
Yellow(2.64)
Sharpchin rockfish 1.00:High 3.00:ModerateConcern
2.33:ModerateConcern
Yellow(2.64)
Splitnose rockfish 1.00:High 3.00:ModerateConcern
2.33:ModerateConcern
Yellow(2.64)
Spotted ratfish 1.00:High 3.00:ModerateConcern
2.33:ModerateConcern
Yellow(2.64)
Sixgill shark 1.00:High 2.00:High Concern 3.67:Low Concern Yellow(2.71)
Pacific Ocean perch 1.00:High 4.00:Low Concern 2.33:ModerateConcern
Yellow(3.05)
Steller sea lion 1.00:High 4.00:Low Concern 3.67:Low Concern Green(3.83)
Canary rockfish 1.00:High 4.00:Low Concern 5.00:Very LowConcern
Green(4.47)
185

Lingcod 2.00:Medium 4.00:Low Concern 5.00:Very LowConcern
Green(4.47)
Yellowmouth rockfish 1.00:High 4.00:Low Concern 5.00:Very LowConcern
Green(4.47)
Arrowtooth flounder 2.00:Medium 5.00:Very LowConcern
5.00:Very LowConcern
Green(5.00)
Silvergray rockfish 1.00:High 5.00:Very LowConcern
5.00:Very LowConcern
Green(5.00)
Southern Rock sole 2.00:Medium 5.00:Very LowConcern
5.00:Very LowConcern
Green(5.00)
YELLOWTAIL ROCKFISH - BRITISH COLUMBIA/NORTHEAST PACIFIC - JIG - CANADA - INSIDE ROCKFISH
Subscore: 2.16 Discard Rate: 0.95 C2 Rate: 2.05
SpeciesInherentVulnerability Abundance Fishing Mortality Subscore
Tiger rockfish 1.00:High 2.00:High Concern 2.33:ModerateConcern
Red (2.16)
Quillback rockfish 1.00:High 2.00:High Concern 3.67:Low Concern Yellow(2.71)
Yelloweye rockfish 1.00:High 2.00:High Concern 3.67:Low Concern Yellow(2.71)
Lingcod 2.00:Medium 4.00:Low Concern 5.00:Very LowConcern
Green(4.47)
YELLOWTAIL ROCKFISH - BRITISH COLUMBIA/NORTHEAST PACIFIC - JIG - CANADA - OUTSIDE ROCKFISH
Subscore: 2.16 Discard Rate: 0.95 C2 Rate: 2.05
SpeciesInherentVulnerability Abundance Fishing Mortality Subscore
Tiger rockfish 1.00:High 2.00:High Concern 2.33:ModerateConcern
Red (2.16)
Shortraker rockfish 1.00:High 2.00:High Concern 2.33:ModerateConcern
Red (2.16)
Rougheye rockfish 1.00:High 2.00:High Concern 2.33:ModerateConcern
Red (2.16)
Copper rockfish 1.00:High 2.00:High Concern 2.33:ModerateConcern
Red (2.16)
186

Redbanded rockfish 1.00:High 2.00:High Concern 2.33:ModerateConcern
Red (2.16)
China rockfish 1.00:High 2.00:High Concern 2.33:ModerateConcern
Red (2.16)
Yelloweye rockfish 1.00:High 2.00:High Concern 2.33:ModerateConcern
Red (2.16)
Sixgill shark 1.00:High 2.00:High Concern 3.67:Low Concern Yellow(2.71)
Quillback rockfish 1.00:High 2.00:High Concern 3.67:Low Concern Yellow(2.71)
Spiny dogfish 1.00:High 3.00:ModerateConcern
3.67:Low Concern Green(3.32)
Lingcod 2.00:Medium 4.00:Low Concern 5.00:Very LowConcern
Green(4.47)
YELLOWTAIL ROCKFISH - BRITISH COLUMBIA/NORTHEAST PACIFIC - MIDWATER TRAWLS - CANADA
Subscore: 1.41 Discard Rate: 0.95 C2 Rate: 1.34
SpeciesInherentVulnerability Abundance Fishing Mortality Subscore
Bocaccio 1.00:High 2.00:High Concern 1.00:High Concern Red (1.41)
Darkblotched rockfish 1.00:High 2.00:High Concern 2.33:ModerateConcern
Red (2.16)
Green sturgeon 1.00:High 2.00:High Concern 2.33:ModerateConcern
Red (2.16)
Redbanded rockfish 1.00:High 2.00:High Concern 2.33:ModerateConcern
Red (2.16)
Redstripe rockfish 1.00:High 2.00:High Concern 2.33:ModerateConcern
Red (2.16)
Rougheye rockfish 1.00:High 2.00:High Concern 2.33:ModerateConcern
Red (2.16)
Shortraker rockfish 1.00:High 2.00:High Concern 2.33:ModerateConcern
Red (2.16)
School shark 1.00:High 2.00:High Concern 2.33:ModerateConcern
Red (2.16)
Widow rockfish 1.00:High 2.00:High Concern 2.33:ModerateConcern
Red (2.16)
187
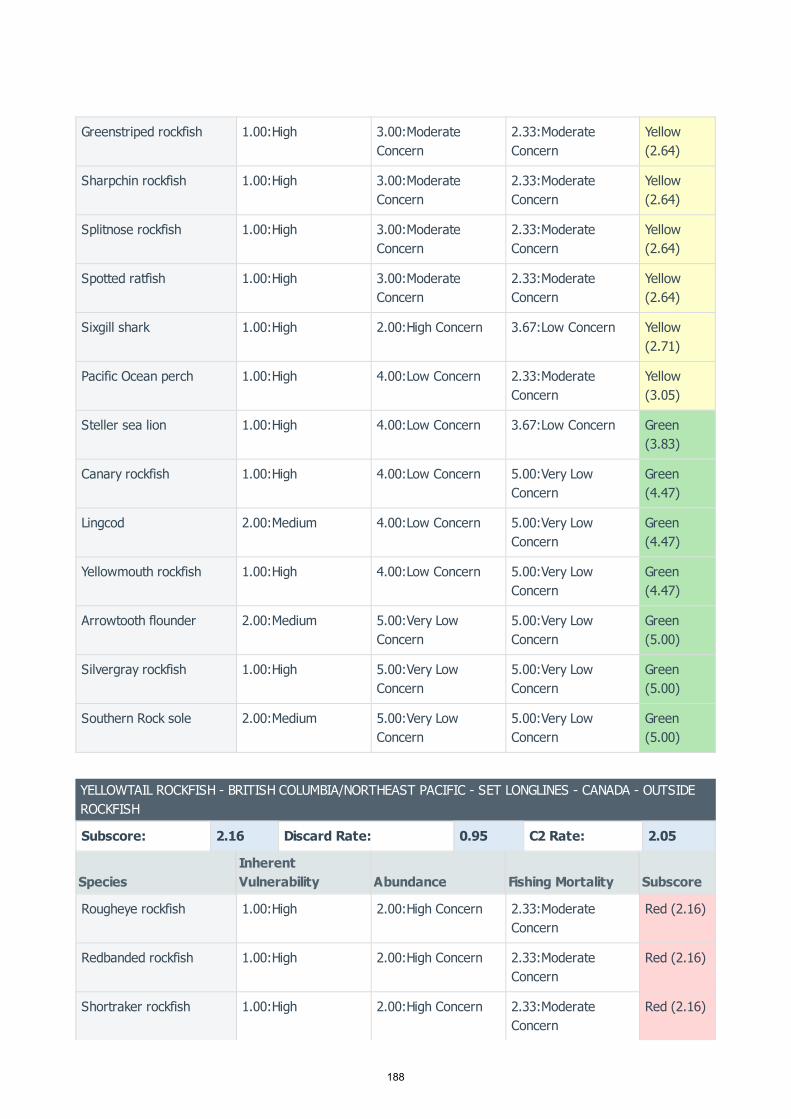
Greenstriped rockfish 1.00:High 3.00:ModerateConcern
2.33:ModerateConcern
Yellow(2.64)
Sharpchin rockfish 1.00:High 3.00:ModerateConcern
2.33:ModerateConcern
Yellow(2.64)
Splitnose rockfish 1.00:High 3.00:ModerateConcern
2.33:ModerateConcern
Yellow(2.64)
Spotted ratfish 1.00:High 3.00:ModerateConcern
2.33:ModerateConcern
Yellow(2.64)
Sixgill shark 1.00:High 2.00:High Concern 3.67:Low Concern Yellow(2.71)
Pacific Ocean perch 1.00:High 4.00:Low Concern 2.33:ModerateConcern
Yellow(3.05)
Steller sea lion 1.00:High 4.00:Low Concern 3.67:Low Concern Green(3.83)
Canary rockfish 1.00:High 4.00:Low Concern 5.00:Very LowConcern
Green(4.47)
Lingcod 2.00:Medium 4.00:Low Concern 5.00:Very LowConcern
Green(4.47)
Yellowmouth rockfish 1.00:High 4.00:Low Concern 5.00:Very LowConcern
Green(4.47)
Arrowtooth flounder 2.00:Medium 5.00:Very LowConcern
5.00:Very LowConcern
Green(5.00)
Silvergray rockfish 1.00:High 5.00:Very LowConcern
5.00:Very LowConcern
Green(5.00)
Southern Rock sole 2.00:Medium 5.00:Very LowConcern
5.00:Very LowConcern
Green(5.00)
YELLOWTAIL ROCKFISH - BRITISH COLUMBIA/NORTHEAST PACIFIC - SET LONGLINES - CANADA - OUTSIDEROCKFISH
Subscore: 2.16 Discard Rate: 0.95 C2 Rate: 2.05
SpeciesInherentVulnerability Abundance Fishing Mortality Subscore
Rougheye rockfish 1.00:High 2.00:High Concern 2.33:ModerateConcern
Red (2.16)
Redbanded rockfish 1.00:High 2.00:High Concern 2.33:ModerateConcern
Red (2.16)
Shortraker rockfish 1.00:High 2.00:High Concern 2.33:ModerateConcern
Red (2.16)
188

Tiger rockfish 1.00:High 2.00:High Concern 2.33:ModerateConcern
Red (2.16)
Longnose skate 1.00:High 2.00:High Concern 2.33:ModerateConcern
Red (2.16)
Copper rockfish 1.00:High 2.00:High Concern 2.33:ModerateConcern
Red (2.16)
China rockfish 1.00:High 2.00:High Concern 2.33:ModerateConcern
Red (2.16)
School shark 1.00:High 2.00:High Concern 2.33:ModerateConcern
Red (2.16)
Yelloweye rockfish 1.00:High 2.00:High Concern 2.33:ModerateConcern
Red (2.16)
Quillback rockfish 1.00:High 2.00:High Concern 3.67:Low Concern Yellow(2.71)
Sixgill shark 1.00:High 2.00:High Concern 3.67:Low Concern Yellow(2.71)
Pacific halibut 1.00:High 4.00:Low Concern 2.33:ModerateConcern
Yellow(3.05)
Big skate 1.00:High 3.00:ModerateConcern
3.67:Low Concern Green(3.32)
Spiny dogfish 1.00:High 3.00:ModerateConcern
3.67:Low Concern Green(3.32)
Sablefish 1.00:High 4.00:Low Concern 3.67:Low Concern Green(3.83)
Lingcod 2.00:Medium 4.00:Low Concern 5.00:Very LowConcern
Green(4.47)
YELLOWTAIL ROCKFISH - BRITISH COLUMBIA/NORTHEAST PACIFIC - TROLLING LINES - CANADA - INSIDEROCKFISH
Subscore: 2.16 Discard Rate: 0.95 C2 Rate: 2.05
SpeciesInherentVulnerability Abundance Fishing Mortality Subscore
Tiger rockfish 1.00:High 2.00:High Concern 2.33:ModerateConcern
Red (2.16)
Quillback rockfish 1.00:High 2.00:High Concern 3.67:Low Concern Yellow(2.71)
Yelloweye rockfish 1.00:High 2.00:High Concern 3.67:Low Concern Yellow(2.71)
189
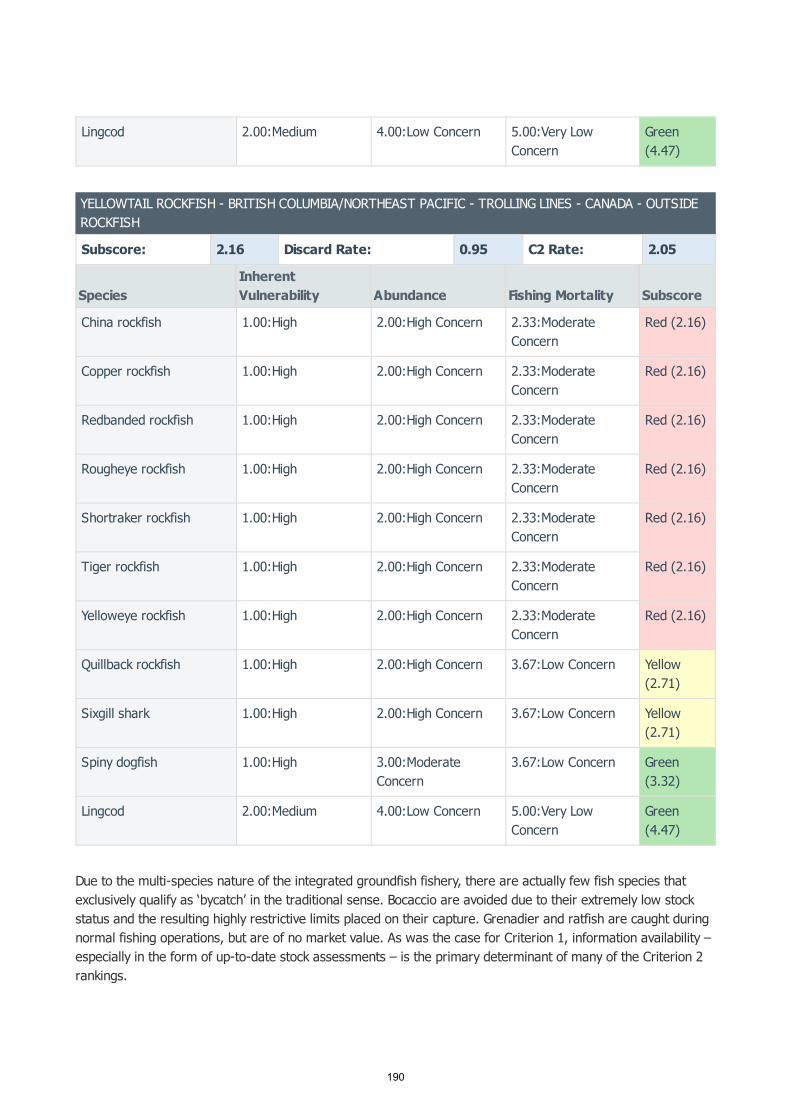
Due to the multi-species nature of the integrated groundfish fishery, there are actually few fish species thatexclusively qualify as ‘bycatch’ in the traditional sense. Bocaccio are avoided due to their extremely low stockstatus and the resulting highly restrictive limits placed on their capture. Grenadier and ratfish are caught duringnormal fishing operations, but are of no market value. As was the case for Criterion 1, information availability –especially in the form of up-to-date stock assessments – is the primary determinant of many of the Criterion 2rankings.
Lingcod 2.00:Medium 4.00:Low Concern 5.00:Very LowConcern
Green(4.47)
YELLOWTAIL ROCKFISH - BRITISH COLUMBIA/NORTHEAST PACIFIC - TROLLING LINES - CANADA - OUTSIDEROCKFISH
Subscore: 2.16 Discard Rate: 0.95 C2 Rate: 2.05
SpeciesInherentVulnerability Abundance Fishing Mortality Subscore
China rockfish 1.00:High 2.00:High Concern 2.33:ModerateConcern
Red (2.16)
Copper rockfish 1.00:High 2.00:High Concern 2.33:ModerateConcern
Red (2.16)
Redbanded rockfish 1.00:High 2.00:High Concern 2.33:ModerateConcern
Red (2.16)
Rougheye rockfish 1.00:High 2.00:High Concern 2.33:ModerateConcern
Red (2.16)
Shortraker rockfish 1.00:High 2.00:High Concern 2.33:ModerateConcern
Red (2.16)
Tiger rockfish 1.00:High 2.00:High Concern 2.33:ModerateConcern
Red (2.16)
Yelloweye rockfish 1.00:High 2.00:High Concern 2.33:ModerateConcern
Red (2.16)
Quillback rockfish 1.00:High 2.00:High Concern 3.67:Low Concern Yellow(2.71)
Sixgill shark 1.00:High 2.00:High Concern 3.67:Low Concern Yellow(2.71)
Spiny dogfish 1.00:High 3.00:ModerateConcern
3.67:Low Concern Green(3.32)
Lingcod 2.00:Medium 4.00:Low Concern 5.00:Very LowConcern
Green(4.47)
190

Criterion 2 Assessment
SCORING GUIDELINES
Factor 2.1 - Inherent Vulnerability(same as Factor 1.1 above)
Factor 2.2 - Abundance(same as Factor 1.2 above)
Factor 2.3 - Fishing Mortality(same as Factor 1.3 above)
BOCACCIO
Factor 2.1 - Inherent Vulnerability
Factor 2.2 - Abundance
Factor 2.3 - Fishing Mortality
BRITISH COLUMBIA/NORTHEAST PACIFIC, BOTTOM TRAWLS, CANADA, HARD SUBSTRATEBRITISH COLUMBIA/NORTHEAST PACIFIC, MIDWATER TRAWLS, CANADA
High
The Fishbase vulnerability score for bocaccio is 63, and the species’ productivity rating in Cope et al. 2011 is1.28 (Table 1 in (Cope et al. 2011)). Bocaccio inherent vulnerability is therefore scored “high".
BRITISH COLUMBIA/NORTHEAST PACIFIC, BOTTOM TRAWLS, CANADA, HARD SUBSTRATEBRITISH COLUMBIA/NORTHEAST PACIFIC, MIDWATER TRAWLS, CANADA
High Concern
In the most recent assessment of the bocaccio stock, the median estimate of B was 7.0% (90% confidenceintervals = 2.9-18.2%) of B , and 3.5% (90% C.I. = 1.4-9.1%) of B (DFO 2012b). That assessment alsofound that the probability of B being less than the LRP is 99% (DFO 2012b); the stock is thus within DFO's"critical zone" (Figure 18 in (Stanley, R.D., et al., 2012)). Furthermore, the 2012 assessment indicated aprobability of >90% that the stock's abundance had declined over the previous decade, despite low catches(DFO 2012b). COSEWIC recently moved bocaccio from its original risk category of "Threatened"to "Endangered"; this change was done as a result of a review of updated information that indicated a 28%decline in abundance since the initial assessment (COSEWIC 2014a). Finally, bocaccio is listed as “criticallyendangered” by the IUCN (Appendix B; (IUCN 2012)). For these reasons, bocaccio stock status is scored "high"concern.
2012
MSY 0
2012
BRITISH COLUMBIA/NORTHEAST PACIFIC, BOTTOM TRAWLS, CANADA, HARD SUBSTRATEBRITISH COLUMBIA/NORTHEAST PACIFIC, MIDWATER TRAWLS, CANADA
High Concern
In British Columbia, bocaccio are primarily caught by the trawl fishery (Figure 4 in (DFO 2012a)).
In the recent assessment, the median estimate of F /F was 1.90 (10 and 90 percentiles = 1.03 and2012 MSY th th
191

Factor 2.4 - Discard Rate
SCHOOL SHARK
Factor 2.1 - Inherent Vulnerability
Factor 2.2 - Abundance
3.58, respectively) (Table 1 in (DFO 2012a)). The ratio of catch to the replacement yield (the yield required tomaintain the biomass) was estimated at 0.990 (10 and 90 percentiles = 0.570 and 1.811) (Table 1 in (DFO2012a)). Beginning in 2013, a trawl fleet-wide cap on bocaccio and individual vessel license allocations for thespecies were implemented; these measures are in addition to a decade-old voluntary program in whichproceeds of bocaccio landings were donated for groundfish research (DFO 2013a). Bocaccio fishing mortalityis scored "high" concern for the trawl fishery.
th th
BRITISH COLUMBIA/NORTHEAST PACIFIC, BOTTOM TRAWLS, CANADA, HARD SUBSTRATEBRITISH COLUMBIA/NORTHEAST PACIFIC, MIDWATER TRAWLS, CANADA
20-40%
The discard: landings ratio for the bottom trawl fishery was 20.9% in 2012 (DFO Pacific Region 2013).
Discard rates (i.e., the ratio of at-sea discards to landings) are challenging to determine for the hook and linegroundfish fisheries. This is because some of the available logbook data record certain releases as piececounts, rather than by weight. Furthermore, the Seafood Watch criteria require that the bait used in fishingoperations be added to the weight of the discards, so that the final ratio is (bait+ discards)/landings. There isno information regarding the quantities of bait used in the groundfish hook and line fisheries. Therefore, forthe hook and line fisheries, a proxy (bait+ discards)/landings ratio of 0.20-0.40 is used.
BRITISH COLUMBIA/NORTHEAST PACIFIC, LONGLINE (SHALLOW-SET), CANADABRITISH COLUMBIA/NORTHEAST PACIFIC, BOTTOM TRAWLS, CANADA, HARD SUBSTRATEBRITISH COLUMBIA/NORTHEAST PACIFIC, BOTTOM TRAWLS, CANADA, SOFT SUBSTRATEBRITISH COLUMBIA/NORTHEAST PACIFIC, MIDWATER TRAWLS, CANADABRITISH COLUMBIA/NORTHEAST PACIFIC, SET LONGLINES, CANADA, OUTSIDE ROCKFISH
High
The Fishbase vulnerability score for tope (aka soupfin) shark is 74, and the species' productivity score in(Cope, J.M., et al., 2011) is 1.11. The species’ inherent vulnerability is scored "high".
BRITISH COLUMBIA/NORTHEAST PACIFIC, LONGLINE (SHALLOW-SET), CANADABRITISH COLUMBIA/NORTHEAST PACIFIC, BOTTOM TRAWLS, CANADA, HARD SUBSTRATEBRITISH COLUMBIA/NORTHEAST PACIFIC, BOTTOM TRAWLS, CANADA, SOFT SUBSTRATEBRITISH COLUMBIA/NORTHEAST PACIFIC, MIDWATER TRAWLS, CANADABRITISH COLUMBIA/NORTHEAST PACIFIC, SET LONGLINES, CANADA, OUTSIDE ROCKFISH
High Concern
There is no estimate of the current abundance of tope in British Columbia’s waters (DFO 2012c). The specieswas assessed as "Special Concern" by COSEWIC and is listed as "Special Concern" under SARA, and is listedas "Vulnerable" by the IUCN (Appendix E). In accordance with the Seafood Watch criteria, the stock status oftope is scored "high” concern, due to its COSEWIC, SARA, and IUCN statuses.
192

Factor 2.3 - Fishing Mortality
Factor 2.4 - Discard Rate
BRITISH COLUMBIA/NORTHEAST PACIFIC, LONGLINE (SHALLOW-SET), CANADABRITISH COLUMBIA/NORTHEAST PACIFIC, BOTTOM TRAWLS, CANADA, HARD SUBSTRATEBRITISH COLUMBIA/NORTHEAST PACIFIC, BOTTOM TRAWLS, CANADA, SOFT SUBSTRATEBRITISH COLUMBIA/NORTHEAST PACIFIC, MIDWATER TRAWLS, CANADABRITISH COLUMBIA/NORTHEAST PACIFIC, SET LONGLINES, CANADA, OUTSIDE ROCKFISH
Moderate Concern
Catches of tope shark in the 2012 halibut and spiny dogfish fisheries were abnormally high relative to catchesin previous years. Catches in the trawl fishery slightly exceeded recent averages. Together, the catch in thesethree fisheries exceeded a level that is considered to be “unlikely” to cause significant impacts to the stock.Fishing mortality is scored "moderate" concern.
Justification:
In the SARA management plan for tope shark, bycatch mortality in fishing activities is identified as the primarythreat (DFO 2012c). In this plan, it is reported that the average annual bycatch of tope shark in the groundfishtrawl fishery was 0.48 t/year during the period 2001 and 2009 (DFO 2012c). The amount of tope shark caughtas bycatch in the 2012 trawl fishery (0.546 t; Appendix E) exceeded this average, and exceeded tope sharkbycatch in this fishery for but one year during the period 1997-2009 (Table 3 in (DFO 2012c)). In addition to the catch of tope sharks in the trawl fishery, a total of 217 instances of tope sharks being caughtand released in the hook and line fisheries were reported for 2012 (Appendix E). These catches occurred inthe fisheries for halibut (105 releases), halibut/sablefish trips (58 releases), and spiny dogfish (53 releases);the outside rockfish fishery also had one release (DFO Pacific Region 2013). The total number of tope sharkscaught in the 2012 hook and line fisheries substantially exceeds the 2001-2009 average (18 instances/year;Table 5 in (DFO 2012c)), and in fact exceeds the total estimated number caught by hook and line fisheriesfrom 2001 through 2009 (Table 5 in (DFO 2012c)). The catch of tope sharks in the 2012 hook and linefisheries is also significantly greater than the catches in any year from 2009-2011 (none of which exceeded 25releases/year; (DFO Pacific Region 2013)).
The management plan for tope sharks states that approximately 85 sharks are caught in total in the trawl andhook and line fisheries on an annual basis, and that catches at that level are “unlikely” to result in significantimpacts on the tope shark population (DFO 2012c). The total 2012 catch of tope shark in the trawl and hookand line fisheries was nearly 3 times greater than this level, however.
BRITISH COLUMBIA/NORTHEAST PACIFIC, LONGLINE (SHALLOW-SET), CANADABRITISH COLUMBIA/NORTHEAST PACIFIC, BOTTOM TRAWLS, CANADA, HARD SUBSTRATEBRITISH COLUMBIA/NORTHEAST PACIFIC, BOTTOM TRAWLS, CANADA, SOFT SUBSTRATEBRITISH COLUMBIA/NORTHEAST PACIFIC, MIDWATER TRAWLS, CANADABRITISH COLUMBIA/NORTHEAST PACIFIC, SET LONGLINES, CANADA, OUTSIDE ROCKFISH
20-40%
The discard: landings ratio for the bottom trawl fishery was 20.9% in 2012 (DFO Pacific Region 2013).
Discard rates (i.e., the ratio of at-sea discards to landings) are challenging to determine for the hook and linegroundfish fisheries. This is because some of the available logbook data record certain releases as piececounts, rather than by weight. Furthermore, the Seafood Watch criteria require that the bait used in fishingoperations be added to the weight of the discards, so that the final ratio is (bait+ discards)/landings. There is
193

GREEN STURGEON
Factor 2.1 - Inherent Vulnerability
Factor 2.2 - Abundance
Factor 2.3 - Fishing Mortality
Factor 2.4 - Discard Rate
no information regarding the quantities of bait used in the groundfish hook and line fisheries. Therefore, forthe hook and line fisheries, a proxy (bait+ discards)/landings ratio of 0.20-0.40 is used.
BRITISH COLUMBIA/NORTHEAST PACIFIC, BOTTOM TRAWLS, CANADA, HARD SUBSTRATEBRITISH COLUMBIA/NORTHEAST PACIFIC, BOTTOM TRAWLS, CANADA, SOFT SUBSTRATEBRITISH COLUMBIA/NORTHEAST PACIFIC, MIDWATER TRAWLS, CANADA
High
The Fishbase vulnerability score for green sturgeon is 80. Green sturgeon inherent vulnerability is thereforescored “high".
BRITISH COLUMBIA/NORTHEAST PACIFIC, BOTTOM TRAWLS, CANADA, HARD SUBSTRATEBRITISH COLUMBIA/NORTHEAST PACIFIC, BOTTOM TRAWLS, CANADA, SOFT SUBSTRATEBRITISH COLUMBIA/NORTHEAST PACIFIC, MIDWATER TRAWLS, CANADA
High Concern
Green sturgeon have been assessed as "Special Concern" by COSEWIC, are listed as "Special Concern" underSARA, and are listed as "Near Threatened" by the IUCN (Appendix E). Stock status for green sturgeon istherefore scored “high" concern.
BRITISH COLUMBIA/NORTHEAST PACIFIC, BOTTOM TRAWLS, CANADA, HARD SUBSTRATEBRITISH COLUMBIA/NORTHEAST PACIFIC, BOTTOM TRAWLS, CANADA, SOFT SUBSTRATEBRITISH COLUMBIA/NORTHEAST PACIFIC, MIDWATER TRAWLS, CANADA
Moderate Concern
In 2012, approximately 0.50 t of green sturgeon were noted as bycatch in the trawl fishery (Appendix E).While there is no estimate of sustainable mortality for this species in Canadian waters, the 2012 bycatchamount is less than 1/3 of the average annual bycatch in the trawl fishery during the period 1996-2002 (Table3 in (COSEWIC 2004)). Fishing mortality associated with green sturgeon bycatch in the trawl fishery is scored“moderate" concern.
BRITISH COLUMBIA/NORTHEAST PACIFIC, BOTTOM TRAWLS, CANADA, HARD SUBSTRATEBRITISH COLUMBIA/NORTHEAST PACIFIC, BOTTOM TRAWLS, CANADA, SOFT SUBSTRATEBRITISH COLUMBIA/NORTHEAST PACIFIC, MIDWATER TRAWLS, CANADA
20-40%
The discard: landings ratio for the bottom trawl fishery was 20.9% in 2012 (DFO Pacific Region 2013).
Discard rates (i.e., the ratio of at-sea discards to landings) are challenging to determine for the hook and line
194
LINGCOD
Factor 2.1 - Inherent Vulnerability
Factor 2.2 - Abundance
groundfish fisheries. This is because some of the available logbook data record certain releases as piececounts, rather than by weight. Furthermore, the Seafood Watch criteria require that the bait used in fishingoperations be added to the weight of the discards, so that the final ratio is (bait+ discards)/landings. There isno information regarding the quantities of bait used in the groundfish hook and line fisheries. Therefore, forthe hook and line fisheries, a proxy (bait+ discards)/landings ratio of 0.20-0.40 is used.
BRITISH COLUMBIA/NORTHEAST PACIFIC, BOTTOM TRAWLS, CANADA, HARD SUBSTRATEBRITISH COLUMBIA/NORTHEAST PACIFIC, JIG, CANADA, INSIDE ROCKFISHBRITISH COLUMBIA/NORTHEAST PACIFIC, SET LONGLINES, CANADA, INSIDE ROCKFISHBRITISH COLUMBIA/NORTHEAST PACIFIC, MIDWATER TRAWLS, CANADABRITISH COLUMBIA/NORTHEAST PACIFIC, JIG, CANADA, OUTSIDE ROCKFISHBRITISH COLUMBIA/NORTHEAST PACIFIC, SET LONGLINES, CANADA, OUTSIDE ROCKFISHBRITISH COLUMBIA/NORTHEAST PACIFIC, TROLLING LINES, CANADA, OUTSIDE ROCKFISHBRITISH COLUMBIA/NORTHEAST PACIFIC, TROLLING LINES, CANADA, INSIDE ROCKFISH
Medium
The Fishbase vulnerability score for lingcod is 63, but the species’ productivity rating in Cope et al. 2011 is1.75 (Table 1 in (Cope et al. 2011)). Lingcod inherent vulnerability is thus scored “medium”.
BRITISH COLUMBIA/NORTHEAST PACIFIC, BOTTOM TRAWLS, CANADA, HARD SUBSTRATEBRITISH COLUMBIA/NORTHEAST PACIFIC, JIG, CANADA, INSIDE ROCKFISHBRITISH COLUMBIA/NORTHEAST PACIFIC, SET LONGLINES, CANADA, INSIDE ROCKFISHBRITISH COLUMBIA/NORTHEAST PACIFIC, MIDWATER TRAWLS, CANADABRITISH COLUMBIA/NORTHEAST PACIFIC, JIG, CANADA, OUTSIDE ROCKFISHBRITISH COLUMBIA/NORTHEAST PACIFIC, SET LONGLINES, CANADA, OUTSIDE ROCKFISHBRITISH COLUMBIA/NORTHEAST PACIFIC, TROLLING LINES, CANADA, OUTSIDE ROCKFISHBRITISH COLUMBIA/NORTHEAST PACIFIC, TROLLING LINES, CANADA, INSIDE ROCKFISH
Low Concern
For lingcod in “outside” waters (Areas 3C, 3D, 5A/B, and 5C/D/E), biomass has generally declined over thecourse of several decades and has recently been assessed at the lowest values since the late 1920s. Despitethe long decline of lingcod biomass in outside waters, each area’s estimated B exceeded the USRP. However, there was substantial uncertainty regarding this result for Areas 3C and 5AB. The stock status oflingcod in outside waters is therefore scored "low" concern.
2010
Justification:
The four discrete lingcod stocks in ‘outside’ waters (Areas 3C, 3D, 5A/B, and 5C/D/E) were assessed in 2011(DFO 2011c)(CSAS 2011). For all of these stocks, estimated B was lower than in any year since 1927(Figure 18).
2010
195
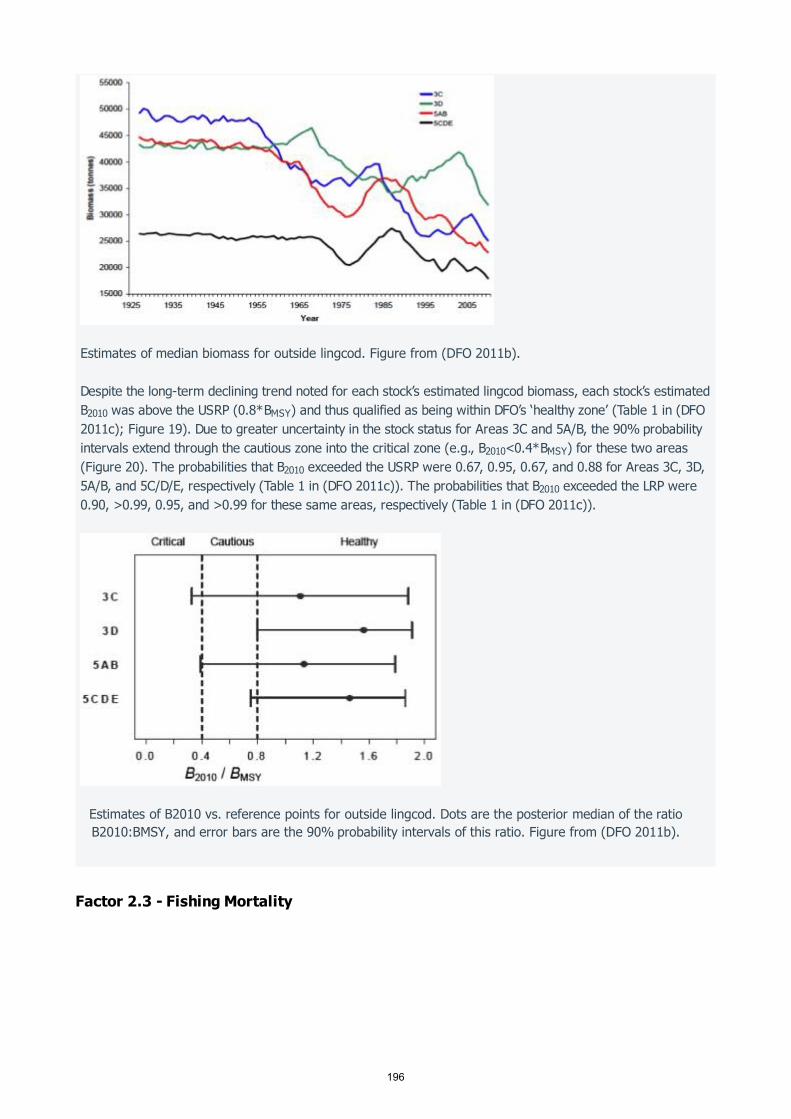
Factor 2.3 - Fishing Mortality
Estimates of median biomass for outside lingcod. Figure from (DFO 2011b).
Despite the long-term declining trend noted for each stock’s estimated lingcod biomass, each stock’s estimatedB was above the USRP (0.8*B ) and thus qualified as being within DFO’s ‘healthy zone’ (Table 1 in (DFO2011c); Figure 19). Due to greater uncertainty in the stock status for Areas 3C and 5A/B, the 90% probabilityintervals extend through the cautious zone into the critical zone (e.g., B <0.4*B ) for these two areas(Figure 20). The probabilities that B exceeded the USRP were 0.67, 0.95, 0.67, and 0.88 for Areas 3C, 3D,5A/B, and 5C/D/E, respectively (Table 1 in (DFO 2011c)). The probabilities that B exceeded the LRP were0.90, >0.99, 0.95, and >0.99 for these same areas, respectively (Table 1 in (DFO 2011c)).
Estimates of B2010 vs. reference points for outside lingcod. Dots are the posterior median of the ratio B2010:BMSY, and error bars are the 90% probability intervals of this ratio. Figure from (DFO 2011b).
2010 MSY
2010 MSY
2010
2010
196

BRITISH COLUMBIA/NORTHEAST PACIFIC, BOTTOM TRAWLS, CANADA, HARD SUBSTRATEBRITISH COLUMBIA/NORTHEAST PACIFIC, JIG, CANADA, INSIDE ROCKFISHBRITISH COLUMBIA/NORTHEAST PACIFIC, SET LONGLINES, CANADA, INSIDE ROCKFISHBRITISH COLUMBIA/NORTHEAST PACIFIC, MIDWATER TRAWLS, CANADABRITISH COLUMBIA/NORTHEAST PACIFIC, JIG, CANADA, OUTSIDE ROCKFISHBRITISH COLUMBIA/NORTHEAST PACIFIC, SET LONGLINES, CANADA, OUTSIDE ROCKFISHBRITISH COLUMBIA/NORTHEAST PACIFIC, TROLLING LINES, CANADA, OUTSIDE ROCKFISHBRITISH COLUMBIA/NORTHEAST PACIFIC, TROLLING LINES, CANADA, INSIDE ROCKFISH
Very Low Concern
The trawl fishery is allocated 74.0% of the lingcod TAC for 2013, and the hook and line fisheries are allocatedthe remaining 26% (DFO 2013a). Total lingcod catch in 2012 was approximately 33.8% of total available TAC.The trawl, lingcod, and halibut fisheries accounted for 44.8%, 32.7%, and 14.6% of the 2012 lingcod catch,respectively.
In a recent assessment, median estimates of F were less than F for all areas, but these estimateswere characterized by substantial uncertainty for Areas 3C, 5A/B, and 5C/D/E. Modeled probabilities indicatethat constant application of area-specific TACs similar to the 2012 catches would have probabilities of 69% to93% of resulting in area-specific B >USRP, depending on the area; these probabilities are not substantiallylower than those associated with zero harvest scenarios. For these reasons, fishing mortality of lingcod isscored "very low" concern for the trawl, lingcod, halibut, and inside and outside rockfish fisheries. However,this score should be revisited if annual catches begin to increase toward the TAC.
2010 MSY
2016
Justification:
Total lingcod catch in 2012 was approximately 1,528 t across all fisheries, while the total TAC was 4,517 t(Appendix A). The trawl, lingcod, and halibut fisheries caught 685, 499, and 223 t, respectively (Appendix A).
Historically, the trawl fishery has been responsible for most of the coastwide catch of lingcod in outsidewaters, but the catch in hook and line fisheries has increased since the late 1980s (Figure 2 in (DFO 2011c)).During the period 2007-2012, the trawl fishery’s catch of lingcod declined by 55%, while catch in the lingcodand halibut hook and line fisheries remained relatively steady; the total catch of lingcod stayed well below thetotal TAC during this period (Figure 20). No area-specific TACs were exceeded for the trawl fishery during theperiod 2000-2012, or for hook and line fisheries during the period 2007-2012 (DFO 2013c)(DFO 2013d).
Lingcod catches by fishery and total TAC, 2007-2012. Data from (DFO 2013b)(DFO 2013d).
197

Factor 2.4 - Discard Rate
GIANT RATTAIL
Factor 2.1 - Inherent Vulnerability
Factor 2.2 - Abundance
The recent stock assessment generated estimates of F :F . Median estimates were 0.39 (5-95% =0.059-2.165) for Area 3C, 0.11 (0.03-0.85) for Area 3D, 0.51 (0.08-2.18) for Area 5A/B, and 0.31 (0.08-1.42)for Area 5C/D/E (Tables 2-5 in (DFO 2011c)).
Lingcod are managed with area-specific TACs for Areas 3C, 3D, 5A/B, 4B (Area 12 only), and 5C/D/E (DFO2013a). The recent stock assessment projects a variety of area-specific TACs into the future and presentsprobabilities of B exceeding various stock status indicators when each modeled TAC is held constant (Table2 in (DFO 2011c)). The probabilities that area-specific TACs held constant at 500 t (which is slightly greaterthan any of the area-specific catches in 2012) will result in B >USRP are 0.69, 0.93, 0.69, and 0.84 for thestocks in Areas 3C, 3D, 5A/B, and 5C/D/E, respectively; these probability values are approximately 2.1-10.4%lower than the probability values associated with zero harvest for the same areas (Table 2 in (DFO 2011c)).The probabilities that these same area-specific TACs will result in B <LRP are 0.11, 0.01, 0.07, and 0.03 forthese same stocks (Table 2 in (DFO 2011c)).
In addition to the catches in the trawl, halibut, and lingcod fisheries, the catch of lingcod in the 2012 insideand outside rockfish fisheries was sufficient to compose >5% of those fisheries’ total catch (DFO PacificRegion 2013). This qualifies this species as a “main” species for the inside and outside rockfish fisheries.
2010 MSY
2016
2016
2016
BRITISH COLUMBIA/NORTHEAST PACIFIC, JIG, CANADA, INSIDE ROCKFISHBRITISH COLUMBIA/NORTHEAST PACIFIC, TROLLING LINES, CANADA, INSIDE ROCKFISH
20-40%
The discard: landings ratio for the bottom trawl fishery was 20.9% in 2012 (DFO Pacific Region 2013).
Discard rates (i.e., the ratio of at-sea discards to landings) are challenging to determine for the hook and linegroundfish fisheries. This is because some of the available logbook data record certain releases as piececounts, rather than by weight. Furthermore, the Seafood Watch criteria require that the bait used in fishingoperations be added to the weight of the discards, so that the final ratio is (bait+ discards)/landings. There isno information regarding the quantities of bait used in the groundfish hook and line fisheries. Therefore, forthe hook and line fisheries, a proxy (bait+ discards)/landings ratio of 0.20-0.40 is used.
BRITISH COLUMBIA/NORTHEAST PACIFIC, BOTTOM TRAWLS, CANADA, SOFT SUBSTRATE
High
The Fishbase vulnerability sores for giant and Pacific grenadiers/rattails are 70 and 79, respectively. Pacificgrenadier’s productivity rating in Cope et al. 2011 is 1.44 (Table 1 in (Cope et al. 2011)). Inherent vulnerabilityscores for these two species are therefore scored "high".
198
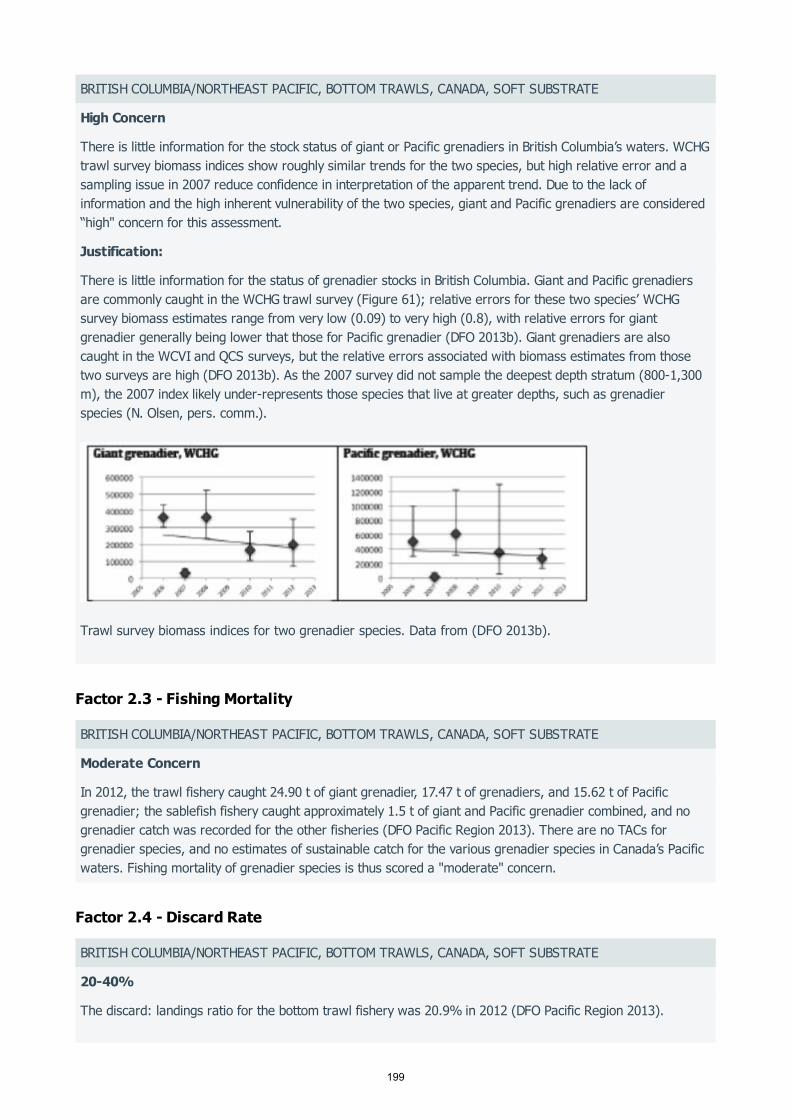
Factor 2.3 - Fishing Mortality
Factor 2.4 - Discard Rate
BRITISH COLUMBIA/NORTHEAST PACIFIC, BOTTOM TRAWLS, CANADA, SOFT SUBSTRATE
High Concern
There is little information for the stock status of giant or Pacific grenadiers in British Columbia’s waters. WCHGtrawl survey biomass indices show roughly similar trends for the two species, but high relative error and asampling issue in 2007 reduce confidence in interpretation of the apparent trend. Due to the lack ofinformation and the high inherent vulnerability of the two species, giant and Pacific grenadiers are considered“high" concern for this assessment.
Justification:
There is little information for the status of grenadier stocks in British Columbia. Giant and Pacific grenadiersare commonly caught in the WCHG trawl survey (Figure 61); relative errors for these two species’ WCHGsurvey biomass estimates range from very low (0.09) to very high (0.8), with relative errors for giantgrenadier generally being lower that those for Pacific grenadier (DFO 2013b). Giant grenadiers are alsocaught in the WCVI and QCS surveys, but the relative errors associated with biomass estimates from thosetwo surveys are high (DFO 2013b). As the 2007 survey did not sample the deepest depth stratum (800-1,300m), the 2007 index likely under-represents those species that live at greater depths, such as grenadierspecies (N. Olsen, pers. comm.).
Trawl survey biomass indices for two grenadier species. Data from (DFO 2013b).
BRITISH COLUMBIA/NORTHEAST PACIFIC, BOTTOM TRAWLS, CANADA, SOFT SUBSTRATE
Moderate Concern
In 2012, the trawl fishery caught 24.90 t of giant grenadier, 17.47 t of grenadiers, and 15.62 t of Pacificgrenadier; the sablefish fishery caught approximately 1.5 t of giant and Pacific grenadier combined, and nogrenadier catch was recorded for the other fisheries (DFO Pacific Region 2013). There are no TACs forgrenadier species, and no estimates of sustainable catch for the various grenadier species in Canada’s Pacificwaters. Fishing mortality of grenadier species is thus scored a "moderate" concern.
BRITISH COLUMBIA/NORTHEAST PACIFIC, BOTTOM TRAWLS, CANADA, SOFT SUBSTRATE
20-40%
The discard: landings ratio for the bottom trawl fishery was 20.9% in 2012 (DFO Pacific Region 2013).
199
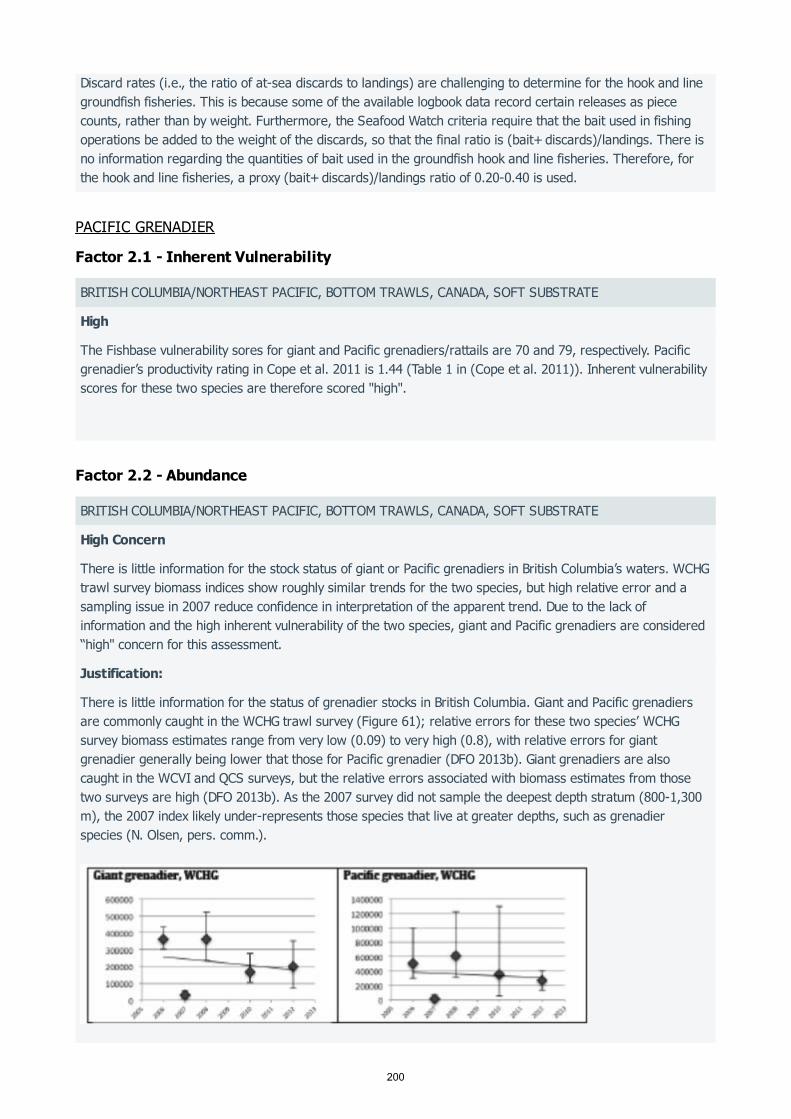
PACIFIC GRENADIER
Factor 2.1 - Inherent Vulnerability
Factor 2.2 - Abundance
Discard rates (i.e., the ratio of at-sea discards to landings) are challenging to determine for the hook and linegroundfish fisheries. This is because some of the available logbook data record certain releases as piececounts, rather than by weight. Furthermore, the Seafood Watch criteria require that the bait used in fishingoperations be added to the weight of the discards, so that the final ratio is (bait+ discards)/landings. There isno information regarding the quantities of bait used in the groundfish hook and line fisheries. Therefore, forthe hook and line fisheries, a proxy (bait+ discards)/landings ratio of 0.20-0.40 is used.
BRITISH COLUMBIA/NORTHEAST PACIFIC, BOTTOM TRAWLS, CANADA, SOFT SUBSTRATE
High
The Fishbase vulnerability sores for giant and Pacific grenadiers/rattails are 70 and 79, respectively. Pacificgrenadier’s productivity rating in Cope et al. 2011 is 1.44 (Table 1 in (Cope et al. 2011)). Inherent vulnerabilityscores for these two species are therefore scored "high".
BRITISH COLUMBIA/NORTHEAST PACIFIC, BOTTOM TRAWLS, CANADA, SOFT SUBSTRATE
High Concern
There is little information for the stock status of giant or Pacific grenadiers in British Columbia’s waters. WCHGtrawl survey biomass indices show roughly similar trends for the two species, but high relative error and asampling issue in 2007 reduce confidence in interpretation of the apparent trend. Due to the lack ofinformation and the high inherent vulnerability of the two species, giant and Pacific grenadiers are considered“high" concern for this assessment.
Justification:
There is little information for the status of grenadier stocks in British Columbia. Giant and Pacific grenadiersare commonly caught in the WCHG trawl survey (Figure 61); relative errors for these two species’ WCHGsurvey biomass estimates range from very low (0.09) to very high (0.8), with relative errors for giantgrenadier generally being lower that those for Pacific grenadier (DFO 2013b). Giant grenadiers are alsocaught in the WCVI and QCS surveys, but the relative errors associated with biomass estimates from thosetwo surveys are high (DFO 2013b). As the 2007 survey did not sample the deepest depth stratum (800-1,300m), the 2007 index likely under-represents those species that live at greater depths, such as grenadierspecies (N. Olsen, pers. comm.).
200

Factor 2.3 - Fishing Mortality
Factor 2.4 - Discard Rate
SPINY DOGFISH
Factor 2.1 - Inherent Vulnerability
Factor 2.2 - Abundance
Trawl survey biomass indices for two grenadier species. Data from (DFO 2013b).
BRITISH COLUMBIA/NORTHEAST PACIFIC, BOTTOM TRAWLS, CANADA, SOFT SUBSTRATE
Moderate Concern
In 2012, the trawl fishery caught 24.90 t of giant grenadier, 17.47 t of grenadiers, and 15.62 t of Pacificgrenadier; the sablefish fishery caught approximately 1.5 t of giant and Pacific grenadier combined, and nogrenadier catch was recorded for the other fisheries (DFO Pacific Region 2013). There are no TACs forgrenadier species, and no estimates of sustainable catch for the various grenadier species in Canada’s Pacificwaters. Fishing mortality of grenadier species is thus scored a "moderate" concern.
BRITISH COLUMBIA/NORTHEAST PACIFIC, BOTTOM TRAWLS, CANADA, SOFT SUBSTRATE
20-40%
The discard: landings ratio for the bottom trawl fishery was 20.9% in 2012 (DFO Pacific Region 2013).
Discard rates (i.e., the ratio of at-sea discards to landings) are challenging to determine for the hook and linegroundfish fisheries. This is because some of the available logbook data record certain releases as piececounts, rather than by weight. Furthermore, the Seafood Watch criteria require that the bait used in fishingoperations be added to the weight of the discards, so that the final ratio is (bait+ discards)/landings. There isno information regarding the quantities of bait used in the groundfish hook and line fisheries. Therefore, forthe hook and line fisheries, a proxy (bait+ discards)/landings ratio of 0.20-0.40 is used.
BRITISH COLUMBIA/NORTHEAST PACIFIC, LONGLINE (SHALLOW-SET), CANADABRITISH COLUMBIA/NORTHEAST PACIFIC, BOTTOM TRAWLS, CANADA, SOFT SUBSTRATEBRITISH COLUMBIA/NORTHEAST PACIFIC, JIG, CANADA, OUTSIDE ROCKFISHBRITISH COLUMBIA/NORTHEAST PACIFIC, SET LONGLINES, CANADA, OUTSIDE ROCKFISHBRITISH COLUMBIA/NORTHEAST PACIFIC, TROLLING LINES, CANADA, OUTSIDE ROCKFISH
High
The Fishbase vulnerability score for S. acanthias is 69. The species’ productivity rating in Cope et al. 2011 is1.11 (Table 1 in (Cope et al. 2011)). Spiny dogfish inherent vulnerability is therefore scored "high".
BRITISH COLUMBIA/NORTHEAST PACIFIC, LONGLINE (SHALLOW-SET), CANADABRITISH COLUMBIA/NORTHEAST PACIFIC, BOTTOM TRAWLS, CANADA, SOFT SUBSTRATEBRITISH COLUMBIA/NORTHEAST PACIFIC, JIG, CANADA, OUTSIDE ROCKFISHBRITISH COLUMBIA/NORTHEAST PACIFIC, SET LONGLINES, CANADA, OUTSIDE ROCKFISHBRITISH COLUMBIA/NORTHEAST PACIFIC, TROLLING LINES, CANADA, OUTSIDE ROCKFISH
201
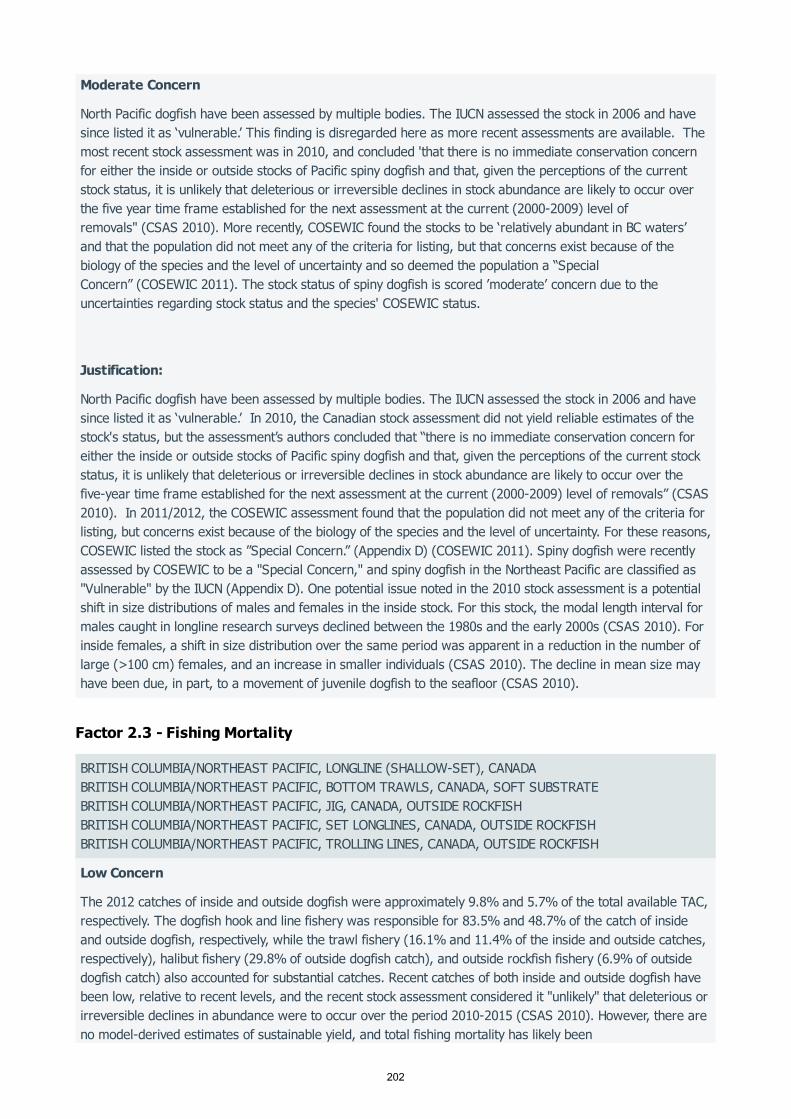
Factor 2.3 - Fishing Mortality
Moderate Concern
North Pacific dogfish have been assessed by multiple bodies. The IUCN assessed the stock in 2006 and havesince listed it as ‘vulnerable.’ This finding is disregarded here as more recent assessments are available. Themost recent stock assessment was in 2010, and concluded 'that there is no immediate conservation concernfor either the inside or outside stocks of Pacific spiny dogfish and that, given the perceptions of the currentstock status, it is unlikely that deleterious or irreversible declines in stock abundance are likely to occur overthe five year time frame established for the next assessment at the current (2000-2009) level ofremovals" (CSAS 2010). More recently, COSEWIC found the stocks to be ‘relatively abundant in BC waters’and that the population did not meet any of the criteria for listing, but that concerns exist because of thebiology of the species and the level of uncertainty and so deemed the population a “SpecialConcern” (COSEWIC 2011). The stock status of spiny dogfish is scored ’moderate’ concern due to theuncertainties regarding stock status and the species' COSEWIC status.
Justification:
North Pacific dogfish have been assessed by multiple bodies. The IUCN assessed the stock in 2006 and havesince listed it as ‘vulnerable.’ In 2010, the Canadian stock assessment did not yield reliable estimates of thestock's status, but the assessment’s authors concluded that “there is no immediate conservation concern foreither the inside or outside stocks of Pacific spiny dogfish and that, given the perceptions of the current stockstatus, it is unlikely that deleterious or irreversible declines in stock abundance are likely to occur over thefive-year time frame established for the next assessment at the current (2000-2009) level of removals” (CSAS2010). In 2011/2012, the COSEWIC assessment found that the population did not meet any of the criteria forlisting, but concerns exist because of the biology of the species and the level of uncertainty. For these reasons,COSEWIC listed the stock as ”Special Concern.” (Appendix D) (COSEWIC 2011). Spiny dogfish were recentlyassessed by COSEWIC to be a "Special Concern," and spiny dogfish in the Northeast Pacific are classified as"Vulnerable" by the IUCN (Appendix D). One potential issue noted in the 2010 stock assessment is a potentialshift in size distributions of males and females in the inside stock. For this stock, the modal length interval formales caught in longline research surveys declined between the 1980s and the early 2000s (CSAS 2010). Forinside females, a shift in size distribution over the same period was apparent in a reduction in the number oflarge (>100 cm) females, and an increase in smaller individuals (CSAS 2010). The decline in mean size mayhave been due, in part, to a movement of juvenile dogfish to the seafloor (CSAS 2010).
BRITISH COLUMBIA/NORTHEAST PACIFIC, LONGLINE (SHALLOW-SET), CANADABRITISH COLUMBIA/NORTHEAST PACIFIC, BOTTOM TRAWLS, CANADA, SOFT SUBSTRATEBRITISH COLUMBIA/NORTHEAST PACIFIC, JIG, CANADA, OUTSIDE ROCKFISHBRITISH COLUMBIA/NORTHEAST PACIFIC, SET LONGLINES, CANADA, OUTSIDE ROCKFISHBRITISH COLUMBIA/NORTHEAST PACIFIC, TROLLING LINES, CANADA, OUTSIDE ROCKFISH
Low Concern
The 2012 catches of inside and outside dogfish were approximately 9.8% and 5.7% of the total available TAC,respectively. The dogfish hook and line fishery was responsible for 83.5% and 48.7% of the catch of insideand outside dogfish, respectively, while the trawl fishery (16.1% and 11.4% of the inside and outside catches,respectively), halibut fishery (29.8% of outside dogfish catch), and outside rockfish fishery (6.9% of outsidedogfish catch) also accounted for substantial catches. Recent catches of both inside and outside dogfish havebeen low, relative to recent levels, and the recent stock assessment considered it "unlikely" that deleterious orirreversible declines in abundance were to occur over the period 2010-2015 (CSAS 2010). However, there areno model-derived estimates of sustainable yield, and total fishing mortality has likely been
202
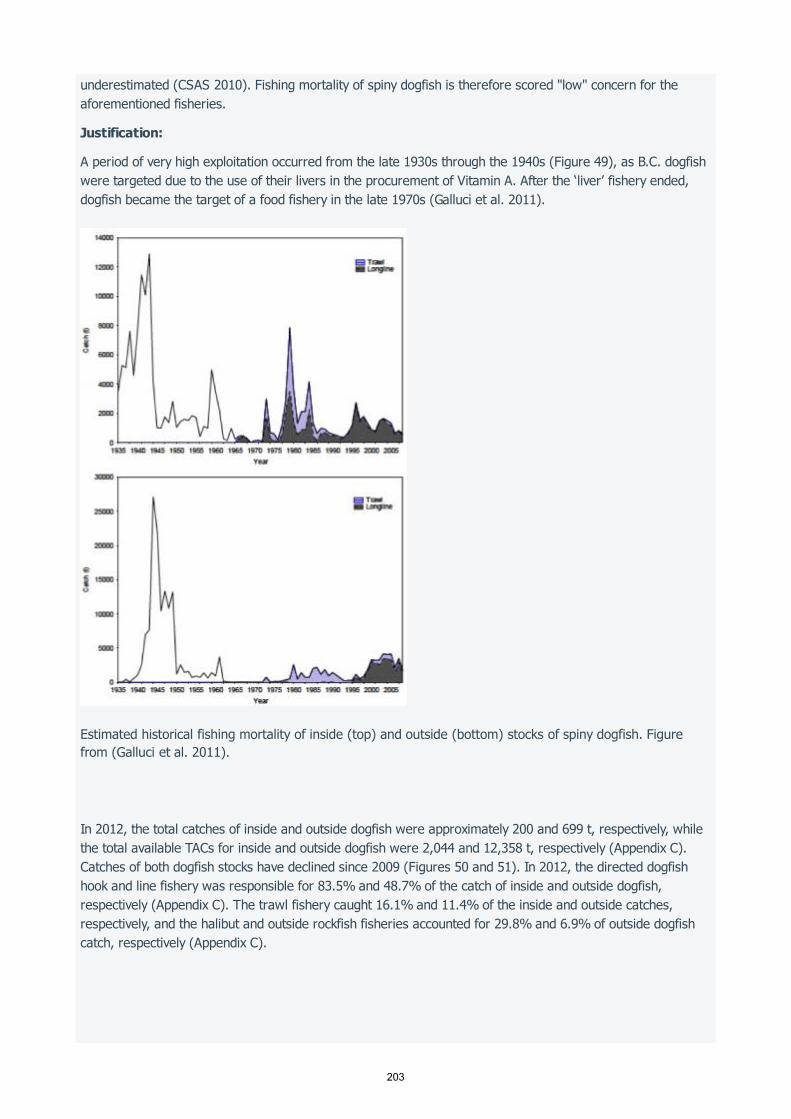
underestimated (CSAS 2010). Fishing mortality of spiny dogfish is therefore scored "low" concern for theaforementioned fisheries.
Justification:
A period of very high exploitation occurred from the late 1930s through the 1940s (Figure 49), as B.C. dogfishwere targeted due to the use of their livers in the procurement of Vitamin A. After the ‘liver’ fishery ended,dogfish became the target of a food fishery in the late 1970s (Galluci et al. 2011).
Estimated historical fishing mortality of inside (top) and outside (bottom) stocks of spiny dogfish. Figure from (Galluci et al. 2011).
In 2012, the total catches of inside and outside dogfish were approximately 200 and 699 t, respectively, whilethe total available TACs for inside and outside dogfish were 2,044 and 12,358 t, respectively (Appendix C).Catches of both dogfish stocks have declined since 2009 (Figures 50 and 51). In 2012, the directed dogfishhook and line fishery was responsible for 83.5% and 48.7% of the catch of inside and outside dogfish,respectively (Appendix C). The trawl fishery caught 16.1% and 11.4% of the inside and outside catches,respectively, and the halibut and outside rockfish fisheries accounted for 29.8% and 6.9% of outside dogfishcatch, respectively (Appendix C).
203
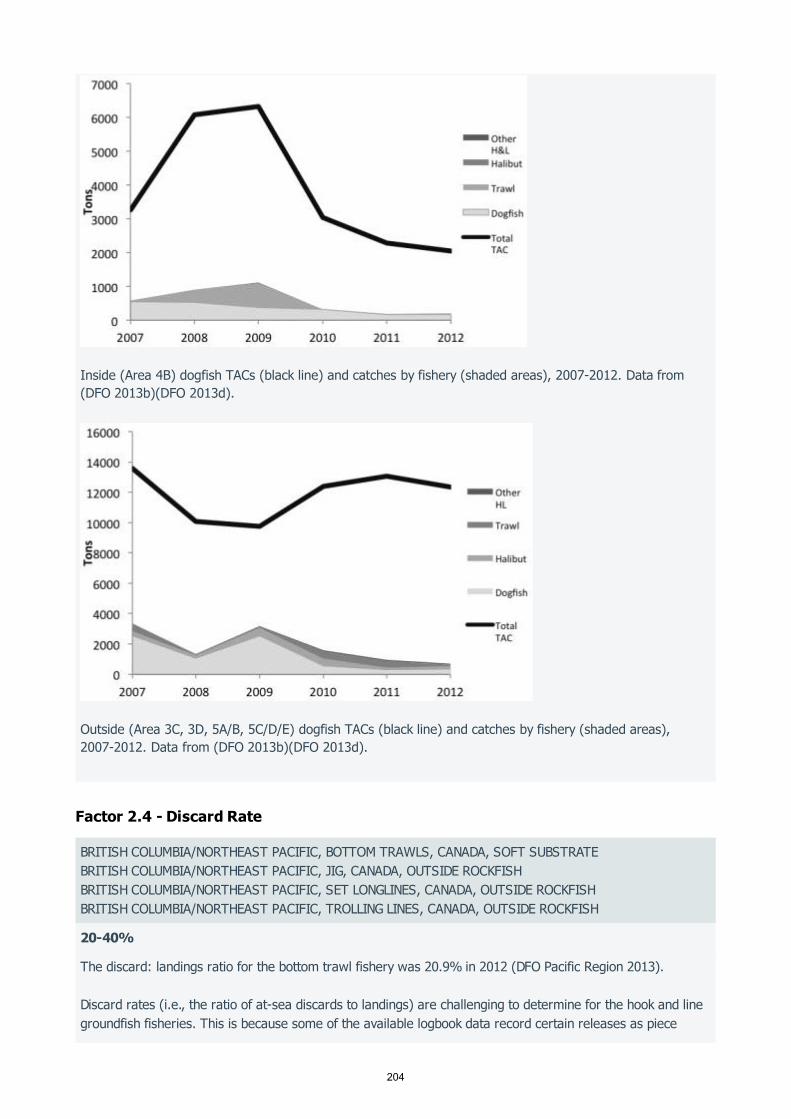
Factor 2.4 - Discard Rate
Inside (Area 4B) dogfish TACs (black line) and catches by fishery (shaded areas), 2007-2012. Data from (DFO 2013b)(DFO 2013d).
Outside (Area 3C, 3D, 5A/B, 5C/D/E) dogfish TACs (black line) and catches by fishery (shaded areas), 2007-2012. Data from (DFO 2013b)(DFO 2013d).
BRITISH COLUMBIA/NORTHEAST PACIFIC, BOTTOM TRAWLS, CANADA, SOFT SUBSTRATEBRITISH COLUMBIA/NORTHEAST PACIFIC, JIG, CANADA, OUTSIDE ROCKFISHBRITISH COLUMBIA/NORTHEAST PACIFIC, SET LONGLINES, CANADA, OUTSIDE ROCKFISHBRITISH COLUMBIA/NORTHEAST PACIFIC, TROLLING LINES, CANADA, OUTSIDE ROCKFISH
20-40%
The discard: landings ratio for the bottom trawl fishery was 20.9% in 2012 (DFO Pacific Region 2013).
Discard rates (i.e., the ratio of at-sea discards to landings) are challenging to determine for the hook and linegroundfish fisheries. This is because some of the available logbook data record certain releases as piece
204

counts, rather than by weight. Furthermore, the Seafood Watch criteria require that the bait used in fishingoperations be added to the weight of the discards, so that the final ratio is (bait+ discards)/landings. There isno information regarding the quantities of bait used in the groundfish hook and line fisheries. Therefore, forthe hook and line fisheries, a proxy (bait+ discards)/landings ratio of 0.20-0.40 is used.
205
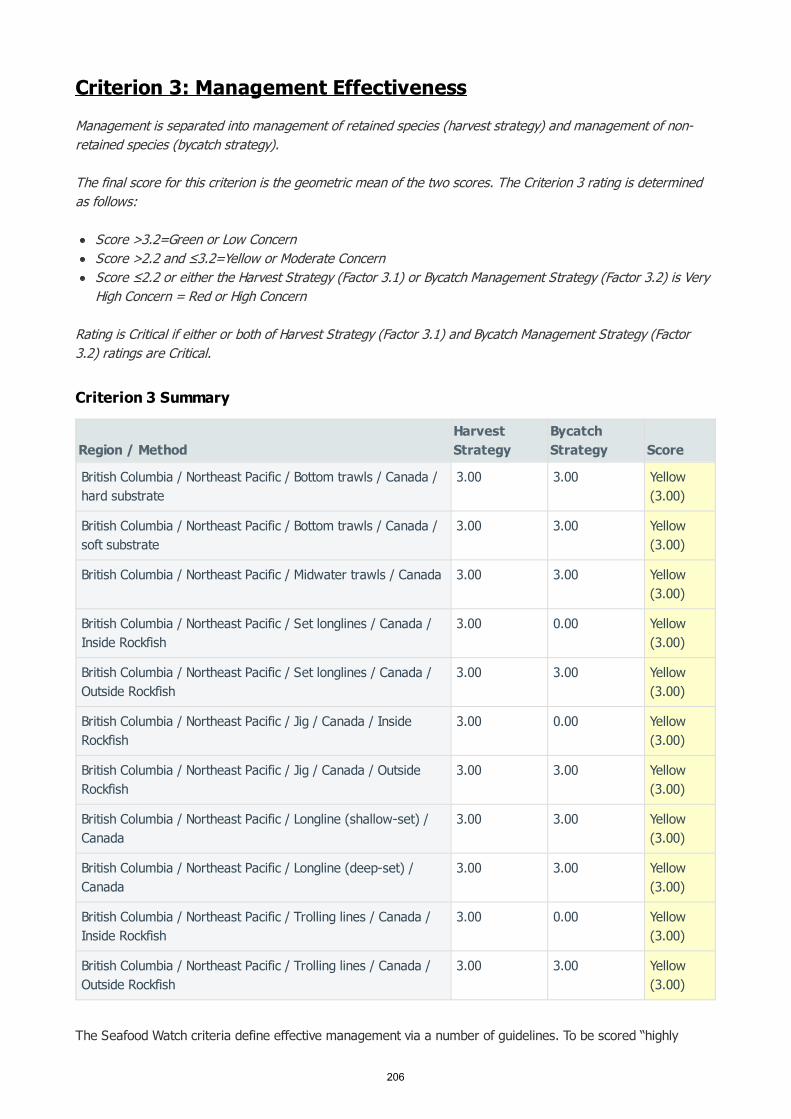
Criterion 3: Management EffectivenessManagement is separated into management of retained species (harvest strategy) and management of non-retained species (bycatch strategy).
The final score for this criterion is the geometric mean of the two scores. The Criterion 3 rating is determinedas follows:
Score >3.2=Green or Low ConcernScore >2.2 and ≤3.2=Yellow or Moderate ConcernScore ≤2.2 or either the Harvest Strategy (Factor 3.1) or Bycatch Management Strategy (Factor 3.2) is VeryHigh Concern = Red or High Concern
Rating is Critical if either or both of Harvest Strategy (Factor 3.1) and Bycatch Management Strategy (Factor3.2) ratings are Critical.
Criterion 3 Summary
The Seafood Watch criteria define effective management via a number of guidelines. To be scored “highly
Region / MethodHarvestStrategy
BycatchStrategy Score
British Columbia / Northeast Pacific / Bottom trawls / Canada /hard substrate
3.00 3.00 Yellow(3.00)
British Columbia / Northeast Pacific / Bottom trawls / Canada /soft substrate
3.00 3.00 Yellow(3.00)
British Columbia / Northeast Pacific / Midwater trawls / Canada 3.00 3.00 Yellow(3.00)
British Columbia / Northeast Pacific / Set longlines / Canada /Inside Rockfish
3.00 0.00 Yellow(3.00)
British Columbia / Northeast Pacific / Set longlines / Canada /Outside Rockfish
3.00 3.00 Yellow(3.00)
British Columbia / Northeast Pacific / Jig / Canada / InsideRockfish
3.00 0.00 Yellow(3.00)
British Columbia / Northeast Pacific / Jig / Canada / OutsideRockfish
3.00 3.00 Yellow(3.00)
British Columbia / Northeast Pacific / Longline (shallow-set) /Canada
3.00 3.00 Yellow(3.00)
British Columbia / Northeast Pacific / Longline (deep-set) /Canada
3.00 3.00 Yellow(3.00)
British Columbia / Northeast Pacific / Trolling lines / Canada /Inside Rockfish
3.00 0.00 Yellow(3.00)
British Columbia / Northeast Pacific / Trolling lines / Canada /Outside Rockfish
3.00 3.00 Yellow(3.00)
206

effective” for any of the guidelines, a fishery must achieve all of that guideline’s requirements. Due to the multi-species nature of these fisheries, achieving all of the requirements for the ‘management strategy andimplementation’ guidelines is challenging. Certain aspects of these fisheries’ management regime are verystrong. This is especially true for the at-sea and dockside monitoring requirements that are in place. However,challenges noted in “management strategy and implementation” and “recovery of stocks of concern” preclude ahigher score for Criterion 3.
Criterion 3 Assessment
SCORING GUIDELINES
Factor 3.1 - Harvest Strategy
Seven subfactors are evaluated: Management Strategy, Recovery of Species of Concern, ScientificResearch/Monitoring, Following of Scientific Advice, Enforcement of Regulations, Management Track Record,and Inclusion of Stakeholders. Each is rated as ‘ineffective,’ ‘moderately effective,’ or ‘highly effective.’
5 (Very Low Concern)—Rated as ‘highly effective’ for all seven subfactors considered4 (Low Concern)—Management Strategy and Recovery of Species of Concern rated ‘highly effective’ and allother subfactors rated at least ‘moderately effective.’3 (Moderate Concern)—All subfactors rated at least ‘moderately effective.’2 (High Concern)—At minimum, meets standards for ‘moderately effective’ for Management Strategy andRecovery of Species of Concern, but at least one other subfactor rated ‘ineffective.’1 (Very High Concern)—Management exists, but Management Strategy and/or Recovery of Species ofConcern rated ‘ineffective.’0 (Critical)—No management exists when there is a clear need for management (i.e., fishery catchesthreatened, endangered, or high concern species), OR there is a high level of Illegal, unregulated, andunreported fishing occurring.
Factor 3.1 Summary
FACTOR 3.1 - MANAGEMENT OF FISHING IMPACTS ON RETAINED SPECIESRegion / Method Strategy Recovery Research Advice Enforce Track Inclusion
British Columbia /Northeast Pacific /Bottom trawls / Canada/ hard substrate
ModeratelyEffective
ModeratelyEffective
ModeratelyEffective
ModeratelyEffective
HighlyEffective
ModeratelyEffective
HighlyEffective
British Columbia /Northeast Pacific /Bottom trawls / Canada/ soft substrate
ModeratelyEffective
ModeratelyEffective
ModeratelyEffective
ModeratelyEffective
HighlyEffective
ModeratelyEffective
HighlyEffective
British Columbia /Northeast Pacific /Midwater trawls /Canada
ModeratelyEffective
ModeratelyEffective
ModeratelyEffective
ModeratelyEffective
HighlyEffective
ModeratelyEffective
HighlyEffective
British Columbia /Northeast Pacific / Setlonglines / Canada /Inside Rockfish
HighlyEffective
ModeratelyEffective
ModeratelyEffective
ModeratelyEffective
HighlyEffective
ModeratelyEffective
HighlyEffective
207

Subfactor 3.1.1 – Management Strategy and Implementation
Considerations: What type of management measures are in place? Are there appropriate management goals,and is there evidence that management goals are being met? To achieve a highly effective rating, there must beappropriate management goals, and evidence that the measures in place have been successful atmaintaining/rebuilding species.
British Columbia /Northeast Pacific / Setlonglines / Canada /Outside Rockfish
ModeratelyEffective
ModeratelyEffective
ModeratelyEffective
ModeratelyEffective
HighlyEffective
ModeratelyEffective
HighlyEffective
British Columbia /Northeast Pacific / Jig /Canada / InsideRockfish
ModeratelyEffective
ModeratelyEffective
ModeratelyEffective
ModeratelyEffective
HighlyEffective
ModeratelyEffective
HighlyEffective
British Columbia /Northeast Pacific / Jig /Canada / OutsideRockfish
ModeratelyEffective
ModeratelyEffective
ModeratelyEffective
ModeratelyEffective
HighlyEffective
ModeratelyEffective
HighlyEffective
British Columbia /Northeast Pacific /Longline (shallow-set) /Canada
ModeratelyEffective
ModeratelyEffective
ModeratelyEffective
ModeratelyEffective
HighlyEffective
ModeratelyEffective
HighlyEffective
British Columbia /Northeast Pacific /Longline (deep-set) /Canada
ModeratelyEffective
ModeratelyEffective
ModeratelyEffective
ModeratelyEffective
HighlyEffective
ModeratelyEffective
HighlyEffective
British Columbia /Northeast Pacific /Trolling lines / Canada /Inside Rockfish
ModeratelyEffective
ModeratelyEffective
ModeratelyEffective
ModeratelyEffective
HighlyEffective
ModeratelyEffective
HighlyEffective
British Columbia /Northeast Pacific /Trolling lines / Canada /Outside Rockfish
ModeratelyEffective
ModeratelyEffective
ModeratelyEffective
ModeratelyEffective
HighlyEffective
ModeratelyEffective
HighlyEffective
208

BRITISH COLUMBIA / NORTHEAST PACIFIC, BOTTOM TRAWLS, CANADA, HARD SUBSTRATEBRITISH COLUMBIA / NORTHEAST PACIFIC, BOTTOM TRAWLS, CANADA, SOFT SUBSTRATEBRITISH COLUMBIA / NORTHEAST PACIFIC, MIDWATER TRAWLS, CANADABRITISH COLUMBIA / NORTHEAST PACIFIC, SET LONGLINES, CANADA, OUTSIDE ROCKFISHBRITISH COLUMBIA / NORTHEAST PACIFIC, JIG, CANADA, INSIDE ROCKFISHBRITISH COLUMBIA / NORTHEAST PACIFIC, JIG, CANADA, OUTSIDE ROCKFISHBRITISH COLUMBIA / NORTHEAST PACIFIC, LONGLINE (SHALLOW-SET), CANADABRITISH COLUMBIA / NORTHEAST PACIFIC, LONGLINE (DEEP-SET), CANADABRITISH COLUMBIA / NORTHEAST PACIFIC, TROLLING LINES, CANADA, INSIDE ROCKFISHBRITISH COLUMBIA / NORTHEAST PACIFIC, TROLLING LINES, CANADA, OUTSIDE ROCKFISH
Moderately Effective
Three important factors that inform the score for “management strategy and implementation” are 1) theapplication of appropriate biomass reference points, 2) an associated harvest control rule, and 3) the degreeto which uncertainty and risk are addressed in management decisions. While a framework for the integrationof reference points and an harvest control rule exists, it has not been widely applied and many stocks aremanaged without reference points or a harvest control rule. The overall score for management strategy andimplementation is “moderately effective”; the rationale is below.
Justification:
Reference PointsIn “A Fishery Decision-making Framework Incorporating the Precautionary Approach” (hereafter referred to as“the Framework”), DFO outlines an approach to the management of harvest rates based on stock statusrelative to reference points (DFO 2009a). The approach uses two reference points, an Upper Stock ReferencePoint (USRP) and a Limit Reference Point (LRP), to define stock status into one of three zones: Healthy(B>USRP), Cautious (LRP<B<USRP), and Critical (B<LRP) (Figure 65). The maximum allowable removal rateis set at ≤F while the stock is in the Healthy Zone, is reduced when the stock enters the Cautious Zone,continues to be reduced as the stock approaches the LRP, and becomes zero if the stock falls into the CriticalZone (Figure 65). Importantly, the USRP may not necessarily be a target reference point (DFO 2009a): thetarget may be set higher than the USRP, but it is the USRP that represents the stock status below which theremoval rates is reduced.
DFO precautionary harvest strategy, showing reference points and removal reference. Figure from (DFO 2006).
MSY
209
Subfactor 3.1.2 – Recovery of Species of Concern
Considerations: When needed, are recovery strategies/management measures in place to rebuildoverfished/threatened/ endangered species or to limit fishery’s impact on these species and what is theirlikelihood of success? To achieve a rating of Highly Effective, rebuilding strategies that have a high likelihood ofsuccess in an appropriate timeframe must be in place when needed, as well as measures to minimize mortalityfor any overfished/threatened/endangered species.
The Framework specifies that (0.8*B ) and (0.4*B ) may be used as proxies for the USRP and LRP,respectively (Annex 1b in (DFO 2009c)). The Seafood Watch criteria suggest that target and limit referencepoints should generally not be lower than B and (0.5*B ), respectively, and require strong scientificjustification when lower reference points are used. In the section of the Framework that specifies the USRPand LRP proxy reference points, no reference is made to specific scientific research to support their selection(Annex 1b in (DFO 2009a)). One issue of concern, therefore, is the appropriateness of the proxy referencepoints for B.C. groundfish species, especially for those that are long-lived (e.g., rockfish). (For comparison,rockfish in the U.S. west coast fishery are managed with target and limit reference points of 40% and 25% ofequilibrium unfished spawning biomass, respectively (PFMC 2011).
Risk aversion and buffering against uncertaintyOne avenue through which uncertainty and/or risk are presented is through the use of decision tables, whichare included in newer stock assessments. In a decision table, a range of potential outcomes, and theprobability associated with each outcome, are given for each potential harvest strategy. This allows managersto weigh the risks and benefits of different strategies throughout time. The degree to which specific harvestdecisions are informed by risk aversion and buffering against uncertainty is not made public, however.
Harvest control ruleSee “Reference Points” above. An example of the harvest control rule in action is the reduced 2013 sablefishTAC, which resulted from a reduced biomass estimate (which itself was the result of a continued declinenoted in sablefish survey CPUE) (DFO 2009a). Many stocks, however, are managed without reference pointsand the associated harvest control rule.
MSY MSY
MSY MSY
BRITISH COLUMBIA / NORTHEAST PACIFIC, SET LONGLINES, CANADA, INSIDE ROCKFISH
Highly Effective
Three important factors that inform the score for “management strategy and implementation” are theapplication of appropriate biomass reference points and an associated harvest control rule, and the degree towhich uncertainty and risk are addressed in management decisions. Biomass reference points exist forlingcod, and these reference points inform projections for harvest decision tables (e.g., Table 2 in (DFO2011c)). As there are no other main species caught in the lingcod fishery, the measures applied to the lingcodstock warrant a score of "highly effective" for the directed lingcod fishery.
210

Subfactor 3.1.3 – Scientific Research and Monitoring
Considerations: How much and what types of data are collected to evaluate the health of the population and thefishery’s impact on the species? To achieve a Highly Effective rating, population assessments must be conductedregularly and they must be robust enough to reliably determine the population status.
BRITISH COLUMBIA / NORTHEAST PACIFIC, BOTTOM TRAWLS, CANADA, HARD SUBSTRATEBRITISH COLUMBIA / NORTHEAST PACIFIC, BOTTOM TRAWLS, CANADA, SOFT SUBSTRATEBRITISH COLUMBIA / NORTHEAST PACIFIC, MIDWATER TRAWLS, CANADABRITISH COLUMBIA / NORTHEAST PACIFIC, SET LONGLINES, CANADA, INSIDE ROCKFISHBRITISH COLUMBIA / NORTHEAST PACIFIC, SET LONGLINES, CANADA, OUTSIDE ROCKFISHBRITISH COLUMBIA / NORTHEAST PACIFIC, JIG, CANADA, INSIDE ROCKFISHBRITISH COLUMBIA / NORTHEAST PACIFIC, JIG, CANADA, OUTSIDE ROCKFISHBRITISH COLUMBIA / NORTHEAST PACIFIC, LONGLINE (SHALLOW-SET), CANADABRITISH COLUMBIA / NORTHEAST PACIFIC, LONGLINE (DEEP-SET), CANADABRITISH COLUMBIA / NORTHEAST PACIFIC, TROLLING LINES, CANADA, INSIDE ROCKFISHBRITISH COLUMBIA / NORTHEAST PACIFIC, TROLLING LINES, CANADA, OUTSIDE ROCKFISH
Moderately Effective
To date, DFO has lacked a consistent and proactive approach for the identification of stocks of concern in thegroundfish fishery. Formal identification of stocks of concern has often fallen outside of DFO to COSEWIC,which has identified several groundfish stocks of concern (DFO 2013a). Longspine thornyhead, rougheye andblackspotted rockfish, and yelloweye rockfish have also been listed under SARA (DFO 2013a). In the case oflongspine thornyhead, approximately one decade lapsed between the first indications of significant declines inCPUE (Figure 22) and the production of the SARA-mandated management plan (DFO 2012d). While catchesduring this time were relatively low due to declining economic viability of the fishery (Haigh et al. 2005a), thefact remains that there is still has been no formal assessment of the longspine thornyhead stock.
A policy framework that will allow DFO to effectively identify and set about rebuilding stocks of concern is nowin place, as DFO’s Precautionary Framework both sets out the criteria for identifying a stock in the ‘CriticalZone’ (see Figure 65 above), and requires that rebuilding plans be developed for stocks that fall in this zone.This approach, if implemented across managed stocks, would represent a significant improvement in themanagement of stocks of concern. However, this approach is data-intensive, and the relatively unevenprovision of stock assessment information for B.C. groundfish species would seem to present a challenge to itsimplementation across all managed stocks.
The recovery of stocks of concern is scored “moderately effective” for all fisheries.
211
Subfactor 3.1.4 – Management Record of Following Scientific Advice
Considerations: How often (always, sometimes, rarely) do managers of the fishery follow scientificrecommendations/advice (e.g. do they set catch limits at recommended levels)? A Highly Effective rating isgiven if managers nearly always follow scientific advice.
Subfactor 3.1.5 – Enforcement of Management Regulations
Considerations: Do fishermen comply with regulations, and how is this monitored? To achieve a Highly Effectiverating, there must be regular enforcement of regulations and verification of compliance.
BRITISH COLUMBIA / NORTHEAST PACIFIC, BOTTOM TRAWLS, CANADA, HARD SUBSTRATEBRITISH COLUMBIA / NORTHEAST PACIFIC, BOTTOM TRAWLS, CANADA, SOFT SUBSTRATEBRITISH COLUMBIA / NORTHEAST PACIFIC, MIDWATER TRAWLS, CANADABRITISH COLUMBIA / NORTHEAST PACIFIC, SET LONGLINES, CANADA, INSIDE ROCKFISHBRITISH COLUMBIA / NORTHEAST PACIFIC, SET LONGLINES, CANADA, OUTSIDE ROCKFISHBRITISH COLUMBIA / NORTHEAST PACIFIC, JIG, CANADA, INSIDE ROCKFISHBRITISH COLUMBIA / NORTHEAST PACIFIC, JIG, CANADA, OUTSIDE ROCKFISHBRITISH COLUMBIA / NORTHEAST PACIFIC, LONGLINE (SHALLOW-SET), CANADABRITISH COLUMBIA / NORTHEAST PACIFIC, LONGLINE (DEEP-SET), CANADABRITISH COLUMBIA / NORTHEAST PACIFIC, TROLLING LINES, CANADA, INSIDE ROCKFISHBRITISH COLUMBIA / NORTHEAST PACIFIC, TROLLING LINES, CANADA, OUTSIDE ROCKFISH
Moderately Effective
The score for "scientific research and monitoring" is “moderately effective", due to the relatively unevenprovision of stock assessments for target species.
BRITISH COLUMBIA / NORTHEAST PACIFIC, BOTTOM TRAWLS, CANADA, HARD SUBSTRATEBRITISH COLUMBIA / NORTHEAST PACIFIC, BOTTOM TRAWLS, CANADA, SOFT SUBSTRATEBRITISH COLUMBIA / NORTHEAST PACIFIC, MIDWATER TRAWLS, CANADABRITISH COLUMBIA / NORTHEAST PACIFIC, SET LONGLINES, CANADA, INSIDE ROCKFISHBRITISH COLUMBIA / NORTHEAST PACIFIC, SET LONGLINES, CANADA, OUTSIDE ROCKFISHBRITISH COLUMBIA / NORTHEAST PACIFIC, JIG, CANADA, INSIDE ROCKFISHBRITISH COLUMBIA / NORTHEAST PACIFIC, JIG, CANADA, OUTSIDE ROCKFISHBRITISH COLUMBIA / NORTHEAST PACIFIC, LONGLINE (SHALLOW-SET), CANADABRITISH COLUMBIA / NORTHEAST PACIFIC, LONGLINE (DEEP-SET), CANADABRITISH COLUMBIA / NORTHEAST PACIFIC, TROLLING LINES, CANADA, INSIDE ROCKFISHBRITISH COLUMBIA / NORTHEAST PACIFIC, TROLLING LINES, CANADA, OUTSIDE ROCKFISH
Moderately Effective
It is difficult to ascertain the degree to which scientific advice is followed by managers, as the decision-makingprocesses that guide TAC development are not published and, increasingly, yield advice is being presented inthe form of decision tables, with multiple possible choices and probable outcomes. While there is no evidenceof scientific advice being routinely overruled, neither is there publicly available evidence of TACs beingconsistently set equal to or less than the levels recommended by science. Scientific advice is therefore scored“moderately effective”.
212

Subfactor 3.1.6 – Management Track Record
Considerations: Does management have a history of successfully maintaining populations at sustainable levelsor a history of failing to maintain populations at sustainable levels? A Highly Effective rating is given if measuresenacted by management have been shown to result in the long-term maintenance of species overtime.
BRITISH COLUMBIA / NORTHEAST PACIFIC, BOTTOM TRAWLS, CANADA, HARD SUBSTRATEBRITISH COLUMBIA / NORTHEAST PACIFIC, BOTTOM TRAWLS, CANADA, SOFT SUBSTRATEBRITISH COLUMBIA / NORTHEAST PACIFIC, MIDWATER TRAWLS, CANADABRITISH COLUMBIA / NORTHEAST PACIFIC, SET LONGLINES, CANADA, INSIDE ROCKFISHBRITISH COLUMBIA / NORTHEAST PACIFIC, SET LONGLINES, CANADA, OUTSIDE ROCKFISHBRITISH COLUMBIA / NORTHEAST PACIFIC, JIG, CANADA, INSIDE ROCKFISHBRITISH COLUMBIA / NORTHEAST PACIFIC, JIG, CANADA, OUTSIDE ROCKFISHBRITISH COLUMBIA / NORTHEAST PACIFIC, LONGLINE (SHALLOW-SET), CANADABRITISH COLUMBIA / NORTHEAST PACIFIC, LONGLINE (DEEP-SET), CANADABRITISH COLUMBIA / NORTHEAST PACIFIC, TROLLING LINES, CANADA, INSIDE ROCKFISHBRITISH COLUMBIA / NORTHEAST PACIFIC, TROLLING LINES, CANADA, OUTSIDE ROCKFISH
Highly Effective
Enforcement is provided by fisheries officers, who take part in vessel patrols and air surveillance of fishingoperations. The management system is apparently effective in its ability to limit catches to the TACs that itsets, as shown in Figure 66. Enforcement is scored “highly effective”.
Justification:
Comparison of catches to TACs, across all fisheries, for selected species. Data from Appendix C.
213

Subfactor 3.1.7 – Stakeholder Inclusion
Considerations: Are stakeholders involved/included in the decision-making process? Stakeholders areindividuals/groups/organizations that have an interest in the fishery or that may be affected by the managementof the fishery (e.g., fishermen, conservation groups, etc.). A Highly Effective rating is given if the managementprocess is transparent and includes stakeholder input.
Factor 3.2 - Bycatch Strategy
SCORING GUIDELINES
Four subfactors are evaluated: Management Strategy and Implementation, Scientific Research and Monitoring,Record of Following Scientific Advice, and Enforcement of Regulations. Each is rated as ‘ineffective,’ ‘moderatelyeffective,’ or ‘highly effective.’ Unless reason exists to rate Scientific Research and Monitoring, Record ofFollowing Scientific Advice, and Enforcement of Regulations differently, these rating are the same as in 3.1.
BRITISH COLUMBIA / NORTHEAST PACIFIC, BOTTOM TRAWLS, CANADA, HARD SUBSTRATEBRITISH COLUMBIA / NORTHEAST PACIFIC, BOTTOM TRAWLS, CANADA, SOFT SUBSTRATEBRITISH COLUMBIA / NORTHEAST PACIFIC, MIDWATER TRAWLS, CANADABRITISH COLUMBIA / NORTHEAST PACIFIC, SET LONGLINES, CANADA, INSIDE ROCKFISHBRITISH COLUMBIA / NORTHEAST PACIFIC, SET LONGLINES, CANADA, OUTSIDE ROCKFISHBRITISH COLUMBIA / NORTHEAST PACIFIC, JIG, CANADA, INSIDE ROCKFISHBRITISH COLUMBIA / NORTHEAST PACIFIC, JIG, CANADA, OUTSIDE ROCKFISHBRITISH COLUMBIA / NORTHEAST PACIFIC, LONGLINE (SHALLOW-SET), CANADABRITISH COLUMBIA / NORTHEAST PACIFIC, LONGLINE (DEEP-SET), CANADABRITISH COLUMBIA / NORTHEAST PACIFIC, TROLLING LINES, CANADA, INSIDE ROCKFISHBRITISH COLUMBIA / NORTHEAST PACIFIC, TROLLING LINES, CANADA, OUTSIDE ROCKFISH
Moderately Effective
Due to the uneven provision of stock assessments, the track record for this fishery's management regime isnot known, and is scored "moderately effective."
BRITISH COLUMBIA / NORTHEAST PACIFIC, BOTTOM TRAWLS, CANADA, HARD SUBSTRATEBRITISH COLUMBIA / NORTHEAST PACIFIC, BOTTOM TRAWLS, CANADA, SOFT SUBSTRATEBRITISH COLUMBIA / NORTHEAST PACIFIC, MIDWATER TRAWLS, CANADABRITISH COLUMBIA / NORTHEAST PACIFIC, SET LONGLINES, CANADA, INSIDE ROCKFISHBRITISH COLUMBIA / NORTHEAST PACIFIC, SET LONGLINES, CANADA, OUTSIDE ROCKFISHBRITISH COLUMBIA / NORTHEAST PACIFIC, JIG, CANADA, INSIDE ROCKFISHBRITISH COLUMBIA / NORTHEAST PACIFIC, JIG, CANADA, OUTSIDE ROCKFISHBRITISH COLUMBIA / NORTHEAST PACIFIC, LONGLINE (SHALLOW-SET), CANADABRITISH COLUMBIA / NORTHEAST PACIFIC, LONGLINE (DEEP-SET), CANADABRITISH COLUMBIA / NORTHEAST PACIFIC, TROLLING LINES, CANADA, INSIDE ROCKFISHBRITISH COLUMBIA / NORTHEAST PACIFIC, TROLLING LINES, CANADA, OUTSIDE ROCKFISH
Highly Effective
The management of the fisheries in question is informed by consultations with a number of advisory bodies.The advisory body with the greatest diversity of stakeholders is the Groundfish Integrated Advisory Board(GIAB), which includes representatives from commercial fisheries, processors, unions, various levels ofgovernment, First Nations, recreational fisheries, coastal communities, and environmental organizations.Stakeholder inclusion is scored “highly effective”.
214

5 (Very Low Concern)—Rated as ‘highly effective’ for all four subfactors considered4 (Low Concern)—Management Strategy rated ‘highly effective’ and all other subfactors rated at least‘moderately effective.’3 (Moderate Concern)—All subfactors rated at least ‘moderately effective.’2 (High Concern)—At minimum, meets standards for ‘moderately effective’ for Management Strategy butsome other factors rated ‘ineffective.’1 (Very High Concern)—Management exists, but Management Strategy rated ‘ineffective.’0 (Critical)—No bycatch management even when overfished, depleted, endangered or threatened speciesare known to be regular components of bycatch and are substatntially impacted by the fishery
Subfactor 3.2.2 – Management Strategy and Implementation
Considerations: What type of management strategy/measures are in place to reduce the impacts of the fisheryon bycatch species and how successful are these management measures? To achieve a Highly Effective rating,the primary bycatch species must be known and there must be clear goals and measures in place to minimizethe impacts on bycatch species (e.g., catch limits, use of proven mitigation measures, etc.).
FACTOR 3.2 - BYCATCH STRATEGY
Region / MethodAllKept Critical Strategy Research Advice Enforce
British Columbia / Northeast Pacific / Bottomtrawls / Canada / hard substrate
No No ModeratelyEffective
HighlyEffective
ModeratelyEffective
HighlyEffective
British Columbia / Northeast Pacific / Bottomtrawls / Canada / soft substrate
No No ModeratelyEffective
HighlyEffective
ModeratelyEffective
HighlyEffective
British Columbia / Northeast Pacific / Midwatertrawls / Canada
No No ModeratelyEffective
HighlyEffective
ModeratelyEffective
HighlyEffective
British Columbia / Northeast Pacific / Setlonglines / Canada / Inside Rockfish
Yes All Species Retained
British Columbia / Northeast Pacific / Setlonglines / Canada / Outside Rockfish
No No ModeratelyEffective
HighlyEffective
ModeratelyEffective
HighlyEffective
British Columbia / Northeast Pacific / Jig /Canada / Inside Rockfish
Yes All Species Retained
British Columbia / Northeast Pacific / Jig /Canada / Outside Rockfish
No No ModeratelyEffective
HighlyEffective
ModeratelyEffective
HighlyEffective
British Columbia / Northeast Pacific / Longline(shallow-set) / Canada
No No ModeratelyEffective
HighlyEffective
ModeratelyEffective
HighlyEffective
British Columbia / Northeast Pacific / Longline(deep-set) / Canada
No No ModeratelyEffective
HighlyEffective
ModeratelyEffective
HighlyEffective
British Columbia / Northeast Pacific / Trollinglines / Canada / Inside Rockfish
Yes All Species Retained
British Columbia / Northeast Pacific / Trollinglines / Canada / Outside Rockfish
No No ModeratelyEffective
HighlyEffective
ModeratelyEffective
HighlyEffective
215

Subfactor 3.2.3 – Scientific Research and Monitoring
Considerations: Is bycatch in the fishery recorded/documented and is there adequate monitoring of bycatch tomeasure fishery’s impact on bycatch species? To achieve a Highly Effective rating, assessments must beconducted to determine the impact of the fishery on species of concern, and an adequate bycatch datacollection program must be in place to ensure bycatch management goals are being met
BRITISH COLUMBIA / NORTHEAST PACIFIC, BOTTOM TRAWLS, CANADA, HARD SUBSTRATEBRITISH COLUMBIA / NORTHEAST PACIFIC, BOTTOM TRAWLS, CANADA, SOFT SUBSTRATEBRITISH COLUMBIA / NORTHEAST PACIFIC, MIDWATER TRAWLS, CANADABRITISH COLUMBIA / NORTHEAST PACIFIC, SET LONGLINES, CANADA, OUTSIDE ROCKFISHBRITISH COLUMBIA / NORTHEAST PACIFIC, JIG, CANADA, OUTSIDE ROCKFISHBRITISH COLUMBIA / NORTHEAST PACIFIC, LONGLINE (SHALLOW-SET), CANADABRITISH COLUMBIA / NORTHEAST PACIFIC, LONGLINE (DEEP-SET), CANADABRITISH COLUMBIA / NORTHEAST PACIFIC, TROLLING LINES, CANADA, OUTSIDE ROCKFISH
Moderately Effective
Two important factors behind the scores for “management strategy and implementation” are biomassreference points and an associated harvest control rule. To date, bocaccio is the only non-target “bycatch”species that has biomass reference points and an associated harvest control rule. Management strategy andimplementation is scored “moderately effective” for the five fisheries scored under Factor 3.2.
Justification:
Reference pointsThe dogfish, halibut, outside rockfish, sablefish, and trawl fisheries each caught bycatch species that did nothave estimates of biomass relative to reference points.
Harvest control ruleThe dogfish, halibut, outside rockfish, sablefish, and trawl fisheries each caught bycatch species that do nothave the reference points to allow for application of DFO’s harvest strategy (Figure 65) (see “Referencepoints” above).
Risk aversion and buffering against uncertaintyThe rationale is the same as presented for “risk aversion and buffering against uncertainty” for Factor 3.1.
BRITISH COLUMBIA / NORTHEAST PACIFIC, BOTTOM TRAWLS, CANADA, HARD SUBSTRATEBRITISH COLUMBIA / NORTHEAST PACIFIC, BOTTOM TRAWLS, CANADA, SOFT SUBSTRATEBRITISH COLUMBIA / NORTHEAST PACIFIC, MIDWATER TRAWLS, CANADABRITISH COLUMBIA / NORTHEAST PACIFIC, SET LONGLINES, CANADA, OUTSIDE ROCKFISHBRITISH COLUMBIA / NORTHEAST PACIFIC, JIG, CANADA, OUTSIDE ROCKFISHBRITISH COLUMBIA / NORTHEAST PACIFIC, LONGLINE (SHALLOW-SET), CANADABRITISH COLUMBIA / NORTHEAST PACIFIC, LONGLINE (DEEP-SET), CANADABRITISH COLUMBIA / NORTHEAST PACIFIC, TROLLING LINES, CANADA, OUTSIDE ROCKFISH
Highly Effective
All fisheries have 100% at-sea and 100% dockside monitoring, with 100% observer coverage for the trawlfleet and a combination of observer and electronic monitoring coverage in the remaining fisheries.
216

Subfactor 3.2.4 – Management Record of Following Scientific Advice
Considerations: How often (always, sometimes, rarely) do managers of the fishery follow scientificrecommendations/advice (e.g., do they set catch limits at recommended levels)? A Highly Effective rating isgiven if managers nearly always follow scientific advice.
Subfactor 3.2.5 – Enforcement of Management Regulations
Considerations: Is there a monitoring/enforcement system in place to ensure fishermen follow managementregulations and what is the level of fishermen’s compliance with regulations? To achieve a Highly Effectiverating, there must be consistent enforcement of regulations and verification of compliance.
BRITISH COLUMBIA / NORTHEAST PACIFIC, BOTTOM TRAWLS, CANADA, HARD SUBSTRATEBRITISH COLUMBIA / NORTHEAST PACIFIC, BOTTOM TRAWLS, CANADA, SOFT SUBSTRATEBRITISH COLUMBIA / NORTHEAST PACIFIC, MIDWATER TRAWLS, CANADABRITISH COLUMBIA / NORTHEAST PACIFIC, SET LONGLINES, CANADA, OUTSIDE ROCKFISHBRITISH COLUMBIA / NORTHEAST PACIFIC, JIG, CANADA, OUTSIDE ROCKFISHBRITISH COLUMBIA / NORTHEAST PACIFIC, LONGLINE (SHALLOW-SET), CANADABRITISH COLUMBIA / NORTHEAST PACIFIC, LONGLINE (DEEP-SET), CANADABRITISH COLUMBIA / NORTHEAST PACIFIC, TROLLING LINES, CANADA, OUTSIDE ROCKFISH
Moderately Effective
The score and rationale are the same as presented for "Scientific Advice" in Factor 3.1.
BRITISH COLUMBIA / NORTHEAST PACIFIC, BOTTOM TRAWLS, CANADA, HARD SUBSTRATEBRITISH COLUMBIA / NORTHEAST PACIFIC, BOTTOM TRAWLS, CANADA, SOFT SUBSTRATEBRITISH COLUMBIA / NORTHEAST PACIFIC, MIDWATER TRAWLS, CANADABRITISH COLUMBIA / NORTHEAST PACIFIC, SET LONGLINES, CANADA, OUTSIDE ROCKFISHBRITISH COLUMBIA / NORTHEAST PACIFIC, JIG, CANADA, OUTSIDE ROCKFISHBRITISH COLUMBIA / NORTHEAST PACIFIC, LONGLINE (SHALLOW-SET), CANADABRITISH COLUMBIA / NORTHEAST PACIFIC, LONGLINE (DEEP-SET), CANADABRITISH COLUMBIA / NORTHEAST PACIFIC, TROLLING LINES, CANADA, OUTSIDE ROCKFISH
Highly Effective
The score and rationale are the same as presented for “Enforcement” in Factor 3.1.
217

Criterion 4: Impacts on the habitat and ecosystemThis Criterion assesses the impact of the fishery on seafloor habitats, and increases that base score if there aremeasures in place to mitigate any impacts. The fishery’s overall impact on the ecosystem and food web and theuse of ecosystem-based fisheries management (EBFM) principles is also evaluated. Ecosystem Based FisheriesManagement aims to consider the interconnections among species and all natural and human stressors on theenvironment.
The final score is the geometric mean of the impact of fishing gear on habitat score (plus the mitigation of gearimpacts score) and the Ecosystem Based Fishery Management score. The Criterion 2 rating is determined asfollows:
Score >3.2=Green or Low ConcernScore >2.2 and ≤3.2=Yellow or Moderate ConcernScore ≤2.2=Red or High Concern
Rating cannot be Critical for Criterion 4.
Criterion 4 Summary
Region / MethodGear Type andSubstrate
Mitigation ofGear Impacts EBFM Score
British Columbia / Northeast Pacific / Bottomtrawls / Canada / hard substrate
1.00: HighConcern
1.00: StrongMitigation
4.00: LowConcern
Yellow(2.83)
British Columbia / Northeast Pacific / Bottomtrawls / Canada / soft substrate
2.00: ModerateConcern
1.00: StrongMitigation
4.00: LowConcern
Green(3.46)
British Columbia / Northeast Pacific / Midwatertrawls / Canada
3.00: LowConcern
0.25: MinimalMitigation
4.00: LowConcern
Green(3.61)
British Columbia / Northeast Pacific / Setlonglines / Canada / Inside Rockfish
4.00: Very LowConcern
0.25: MinimalMitigation
4.00: LowConcern
Green(4.12)
British Columbia / Northeast Pacific / Setlonglines / Canada / Outside Rockfish
3.00: LowConcern
0.25: MinimalMitigation
4.00: LowConcern
Green(3.61)
British Columbia / Northeast Pacific / Jig /Canada / Inside Rockfish
3.00: LowConcern
0.25: MinimalMitigation
4.00: LowConcern
Green(3.61)
British Columbia / Northeast Pacific / Jig /Canada / Outside Rockfish
3.00: LowConcern
0.25: MinimalMitigation
4.00: LowConcern
Green(3.61)
British Columbia / Northeast Pacific / Longline(shallow-set) / Canada
3.00: LowConcern
0.25: MinimalMitigation
4.00: LowConcern
Green(3.61)
British Columbia / Northeast Pacific / Longline(deep-set) / Canada
3.00: LowConcern
0.25: MinimalMitigation
4.00: LowConcern
Green(3.61)
British Columbia / Northeast Pacific / Trollinglines / Canada / Inside Rockfish
3.00: LowConcern
0.25: MinimalMitigation
4.00: LowConcern
Green(3.61)
British Columbia / Northeast Pacific / Trollinglines / Canada / Outside Rockfish
3.00: LowConcern
0.25: MinimalMitigation
4.00: LowConcern
Green(3.61)
218

The groundfish fishing gears used in the British Columbia fisheries are expected to come into contact with theseafloor during their regular use. As such, the potential for disturbance and destruction of habitat is alwayspresent with these gears. The destructive potential of mobile gears is well known, and bottom longlines andpots may also cause damage. Many of the species that the groundfish fisheries pursue are known to associatewith hard substrates, which are known to be more susceptible to gear disturbance and damage than softsubstrates in high-energy areas. Spatial management measures such as the sponge reef trawl closures havehelped to minimize the potential for damage to certain habitats, and recently, in 2012, a new suite ofmanagement measures for the trawl fishery was implemented in order to minimize and manage this fishery’sbycatch of corals and sponges.
Criterion 4 Assessment
SCORING GUIDELINES
Factor 4.1 - Impact of Fishing Gear on the Habitat/Substrate
5 (None) - Fishing gear does not contact the bottom4 (Very Low) - Vertical line gear3 (Low)—Gears that contacts the bottom, but is not dragged along the bottom (e.g. gillnet, bottom longline,trap) and is not fished on sensitive habitats. Bottom seine on resilient mud/sand habitats. Midwater trawlthat is known to contact bottom occasionally (2 (Moderate)—Bottom dragging gears (dredge, trawl) fished on resilient mud/sand habitats. Gillnet, trap, orbottom longline fished on sensitive boulder or coral reef habitat. Bottom seine except on mud/sand1 (High)—Hydraulic clam dredge. Dredge or trawl gear fished on moderately sensitive habitats (e.g., cobbleor boulder)0 (Very High)—Dredge or trawl fished on biogenic habitat, (e.g., deep-sea corals, eelgrass and maerl)Note: When multiple habitat types are commonly encountered, and/or the habitat classification is uncertain,the score will be based on the most sensitive, plausible habitat type.
Factor 4.2 - Mitigation of Gear Impacts
+1 (Strong Mitigation)—Examples include large proportion of habitat protected from fishing (>50%) withgear, fishing intensity low/limited, gear specifically modified to reduce damage to seafloor and modificationsshown to be effective at reducing damage, or an effective combination of ‘moderate’ mitigation measures.+0.5 (Moderate Mitigation)—20% of habitat protected from fishing with gear or other measures in place tolimit fishing effort, fishing intensity, and spatial footprint of damage caused from fishing.+0.25 (Low Mitigation)—A few measures are in place (e.g., vulnerable habitats protected but other habitatsnot protected); there are some limits on fishing effort/intensity, but not actively being reduced0 (No Mitigation)—No effective measures are in place to limit gear impacts on habitats
Factor 4.3 - Ecosystem-Based Fisheries Management
5 (Very Low Concern)—Substantial efforts have been made to protect species’ ecological roles and ensurefishing practices do not have negative ecological effects (e.g., large proportion of fishery area is protectedwith marine reserves, and abundance is maintained at sufficient levels to provide food to predators)4 (Low Concern)—Studies are underway to assess the ecological role of species and measures are in placeto protect the ecological role of any species that plays an exceptionally large role in the ecosystem.Measures are in place to minimize potentially negative ecological effect if hatchery supplementation or fishaggregating devices (FADs) are used.3 (Moderate Concern)—Fishery does not catch species that play an exceptionally large role in theecosystem, or if it does, studies are underway to determine how to protect the ecological role of thesespecies, OR negative ecological effects from hatchery supplementation or FADs are possible and
219

management is not place to mitigate these impacts2 (High Concern)—Fishery catches species that play an exceptionally large role in the ecosystem and noefforts are being made to incorporate their ecological role into management.1 (Very High Concern)—Use of hatchery supplementation or fish aggregating devices (FADs) in the fishery ishaving serious negative ecological or genetic consequences, OR fishery has resulted in trophic cascades orother detrimental impacts to the food web.
Factor 4.1 - Impact of Fishing Gear on the Habitat/Substrate
BRITISH COLUMBIA / NORTHEAST PACIFIC, BOTTOM TRAWLS, CANADA, HARD SUBSTRATE
High Concern
The trawl fishery targets many species, some of which are known to associate with cobble, rock, boulder, orother hard habitats (Figure 15). Bycatch of corals and sponges has also long been a concern in this fishery(Ardron & Jamieson 2006). The Seafood Watch criteria require a score of “high” concern for a fishery thatuses bottom trawl gear on cobble, boulder, or deep (>60 m) gravel. The fishery’s impact on substrate whenprimarily fishing for those species only found on soft or mixed soft/hard substrate is less of a conservationconcern, and is thus deemed a “moderate” concern. This latter score is applied, via a “bottom trawl - softsubstrate” designation, to all flatfish except rock sole and arrowtooth flounder, all skates, Pacific cod, spinydogfish, thornyheads, and sablefish.
BRITISH COLUMBIA / NORTHEAST PACIFIC, BOTTOM TRAWLS, CANADA, SOFT SUBSTRATE
Moderate Concern
The trawl fishery targets many species, some of which are known to associate with cobble, rock, boulder, orother hard habitats (Figure 15). Bycatch of corals and sponges has also long been a concern in this fishery(Ardron & Jamieson 2006). The Seafood Watch criteria require a score of “high” concern for a fishery thatuses bottom trawl gear on cobble, boulder, or deep (>60 m) gravel. The fishery’s impact on substrate whenprimarily fishing for those species only found on soft or mixed soft/hard substrate is less of a conservationconcern, and is thus deemed a “moderate” concern. This latter score is applied, via a “bottom trawl - softsubstrate” designation, to all flatfish except rock sole and arrowtooth flounder, all skates, Pacific cod, spinydogfish, thornyheads, and sablefish.
BRITISH COLUMBIA / NORTHEAST PACIFIC, MIDWATER TRAWLS, CANADA
Low Concern
In recent years, trawl vessels equipped with midwater trawl gear have targeted a suite of rockfish species.The SFW criteria require a score of “low” concern for midwater trawl gear that contacts the bottom <25% oftrawling time; while the percentage of time that the midwater gear is in contact with the bottom is not knownfor this fishery, the gear is not designed for bottom contact and thus it is assumed that such contact is only“occasional” (i.e., <25% of the time). The Factor 4.1 score for midwater trawl-caught rockfish is scored “low”concern.
BRITISH COLUMBIA / NORTHEAST PACIFIC, SET LONGLINES, CANADA, INSIDE ROCKFISH
Very Low Concern
220

Factor 4.2 - Mitigation of Gear Impacts
Lingcod, which are the only major species caught in the directed lingcod fishery, are known to associate withmixed hard/rock substrates (Figure 15). The lingcod fishery is prosecuted with troll/jig gear; the use ofbottom longline gear during directed lingcod trips is not permitted (DFO 2013a). In accordance with theSeafood Watch criteria, fishing with vertical lines is considered to have a “very low” impact on substrate.
BRITISH COLUMBIA / NORTHEAST PACIFIC, SET LONGLINES, CANADA, OUTSIDE ROCKFISHBRITISH COLUMBIA / NORTHEAST PACIFIC, JIG, CANADA, OUTSIDE ROCKFISHBRITISH COLUMBIA / NORTHEAST PACIFIC, TROLLING LINES, CANADA, OUTSIDE ROCKFISH
Low Concern
The outside rockfish fishery catches redbanded rockfish, rougheye rockfish, quillback rockfish, and severalother rockfish species, along with lingcod and spiny dogfish. Several of these species associate with cobble,rock, and/or boulder habitats (Figure 15). Both longline and jig gear are used this fishery. The Factor 4.1score for this fishery is scored “low” concern.
BRITISH COLUMBIA / NORTHEAST PACIFIC, JIG, CANADA, INSIDE ROCKFISHBRITISH COLUMBIA / NORTHEAST PACIFIC, TROLLING LINES, CANADA, INSIDE ROCKFISH
Low Concern
The inside rockfish fishery uses jig and longline gear (DFO 2013a) and primarily catches quillback and lingcod,which are known to associate with rock and boulder substrates (Figure 15). The Factor 4.1 score for theinside rockfish fishery is “low" concern.
BRITISH COLUMBIA / NORTHEAST PACIFIC, LONGLINE (SHALLOW-SET), CANADA
Low Concern
Spiny dogfish are known to associate with mixed soft substrates (Figure 15). However, this fishery, which isprosecuted with bottom longline gear, also catches a substantial amount of yelloweye rockfish. Yelloweyerockfish are known to associate with a variety of hard substrates (Figure 15). The dogfish fishery is thereforegiven a score of "low" concern for Factor 4.1.
BRITISH COLUMBIA / NORTHEAST PACIFIC, LONGLINE (DEEP-SET), CANADA
Low Concern
The sablefish longline/trap fishery primarily catches sablefish, which associate with soft substrates. Thisfishery also catches redbanded, rougheye, shortraker, and yelloweye rockfish in substantial amounts; severalof these species are known to associate with hard habitats (Figure 15). The Factor 4.1 score for the sablefishfishery is “low" concern.
BRITISH COLUMBIA / NORTHEAST PACIFIC, BOTTOM TRAWLS, CANADA, HARD SUBSTRATEBRITISH COLUMBIA / NORTHEAST PACIFIC, BOTTOM TRAWLS, CANADA, SOFT SUBSTRATE
Strong Mitigation
A suite of new management measures meant to manage and reduce the trawl fishery’s impacts on coral and
221

sponge was put into place early in the 2012 fishing year. These measures froze the footprint of the fishery,reduced the area of the trawl footprint by 20% relative to historic levels, put into place fleet-wide andindividual limits on coral and sponge catch, and implemented an encounter protocol that would prioritize thecollection and dissemination of information regarding large (>20 kg) catches of coral and/or sponge. By theend of the first year of this program, the trawl fleet’s total catch of coral and sponge was approximately 57%of the amount set as the maximum management objective. Taken together, these measures, and theirapparent effectiveness, warrant a Factor 4.2 score of “strong mitigation”.
Justification:
Rockfish Conservation Areas
There are 164 Rockfish Conservation Areas (RCAs) in place in British Columbia waters, the last of which wereadded in 2007 (DFO 2013a). No commercial or recreational groundfish fishing activities are permitted withinRCAs, with the exception of midwater trawling (DFO 2013f).
Living Oceans Society, an environmental organization, analyzed the areal extent of the RCAs. This analysisfound that RCAs cover approximately 3.5% of coastwide waters at fishable depths, and 5.6% of waters >200m (LOS 2013). These coverage rates do not address the issue of habitat representation within the RCAs; itwould be expected that rockfish habitat would be better represented within the RCAs than in non-protectedareas. However, one GIS analysis found that a subset of RCAs did not consistently overlap with areas that hadbeen identified as high-value habitats by a model and/or fishermen (Ardron & Wallace 2005). Furthermore, ithas been suggested that the RCAs’ coverage of deeper habitats may not be sufficient to protect the adults ofsome species, such as yellowmouth rockfish (COSEWIC 2010) or yelloweye rockfish (Ardron & Wallace 2005).Overall, following revisions to the RCAs in 2005, the RCA network’s coverage of DFO-modeled rockfish habitathas been calculated to be between 12.8% - 20.0% of identified rockfish habitat, with habitats at depths >100m being <13.0% represented (Table 2 in (Ardron & Wallace 2005)).
For the aforementioned reasons, this assessment considers RCAs to be providing strong protection to a smallsubset of vulnerable habitats in the coast’s shallower waters.
Marine Protected AreasIn 2008, there were 161 areas that fit the "MPA" designation in British Columbia’s waters (Robb et al. 2011).The governing bodies responsible for these MPAs included federal, provincial, and municipal governments(Robb et al. 2011). A recent analysis found that some degree of commercial fishing was allowed in 160 of the161 MPAs, and that the total area that is fully off-limits to commercial fishing is approximately 3,575 km ,which is approximately 0.8% of Canada’s Pacific waters (Robb et al. 2011).
At the present time, DFO is responsible for two MPAs: Endeavour Hydrothermal Vents (EHV), andSGaan Kinghlas-Bowie Seamount MPA (SK-BS) (DFO 2013a). All commercial fisheries are currently allowed tooperate in the EHV (DFO 2009d). A limited sablefish pot fishery occurs within a defined part of the BowieSeamount MPA (DFO 2013a).
In addition to these two MPAs, a bottom trawl closure is in place around three glass sponge reefs (DFO2013a), in recognition of their global significance and their susceptibility to damage by trawl gear.
Trawl Habitat Conservation MeasuresDisclosure: the author of this assessment was one of the primary designers of the trawl habitat conservationmeasures reviewed in this section.
On April 2, 2012, a suite of management measures meant to manage and reduce the bottom trawl fishery’simpacts on habitat was implemented. These measures were developed in a collaborative effort between the
2
222

Canadian Groundfish Research and Conservation Society on behalf of the trawl fishery, and the Pacific MarineConservation Caucus on behalf of environmental organizations. There three management measures that weredeveloped in this effort are as follows.
1. Frozen trawl footprintIn order to ensure that the fishery does not disproportionately affect any particular habitat types, impact lowenergy/low productivity ecosystems in the deeper waters off of the west coast, or access previously un-trawled areas, a series of boundaries were developed for the fishery (DFO 2013a). Bottom trawling isprohibited from fishing outside the boundaries, effectively “freezing the footprint” of the fishery (Figure 67).
Map of areas open and closed to the bottom trawl fishery as of April, 2012. Figure from (DFO 2013a).
Habitat Bycatch Conservation LimitThe second management measure was the implementation of a fleet-wide Habitat Bycatch Conservation Limit(HBCL) of 4,500 kg (DFO 2013a). The HBCL acts as a fleet-wide cap on sponges and corals caught incidentallyin the fishery. The fleet-wide HBCL is allocated to vessels, and all catch of coral and sponge counts against thevessel’s individual HBCL. Any vessel that exceeds its individual HBCL is barred from trawling for the rest of thatfishing year, unless sufficient HBCL can be acquired from another vessel (DFO 2013a).
Encounter protocolThe third and final management measure is an encounter protocol. This protocol establishes a procedure thatis followed if and when a trawl vessel catches >20 kg of coral and/or sponge in a single tow. Essentially, theprotocol ensures the prioritization of data collection and the timely transmission of relevant informationregarding the incident (e.g., location, amount caught, etc.) to the rest of the trawl fleet (DFO 2013a). Thevessels in the rest of the fleet, operating under the restrictive limits of their individual HBCL holdings, willpresumably avoid trawling in the location of the catch.
Summary of effectivenessThese management measures were implemented on April 2, 2012 (DFO 2013a). For the remainder of the
223

fishing year (through February 20, 2013), a total of 0.50 t of combined corals/sponges were caughtthroughout the fleet (DFO 2013c). The stated management objective was to limit fleet-wide catch to ≤562 kgof coral and 322 kg of sponge (DFO 2013a), for a total of 0.884 t of coral and sponge combined. The 2012catch was therefore approximately 57% of the management objective for maximum coral/sponge catch.
In the process of ‘freezing’ the footprint of the trawl fishery, parts of the trawl fishery’s historic footprint wereremoved. As a result, the newly frozen footprint is approximately 20% smaller than the fishery’s historicalfootprint (Bodtker et al. 2013). The reduction in the trawl footprint is especially pronounced in deeper waters,as approximately 65% of the >1,000 m waters that the trawl fishery was previously able to access were madeoff-limits by the frozen footprint (Bodtker et al. 2013). It is also likely that the spatial distribution of the fleet’sfishing effort changed to avoid areas known to contain corals or sponges, but such an analysis has yet to beconducted.
The new trawl footprint includes <50% of the coastwide waters at depths of 0-199 m, 200-399 m, 800-999m, and 1000-1199 m (Table 1 in (Bodtker et al. 2013)). The two depth strata that are >50% represented inthe trawl footprint are 400-599 m (56% of coastwide depth is in the footprint), and 600-799 m (58%) (Table 1in (Bodtker et al. 2013)).
BRITISH COLUMBIA / NORTHEAST PACIFIC, MIDWATER TRAWLS, CANADA
Minimal Mitigation
There are few habitat-related spatial limits placed on the midwater trawl fishery. Midwater trawling is notsubject to the suite of habitat management measures implemented for bottom trawling, as describedpreviously. Furthermore, midwater trawling is allowed in Rockfish Conservation Areas (DFO 2013e).
BRITISH COLUMBIA / NORTHEAST PACIFIC, SET LONGLINES, CANADA, INSIDE ROCKFISHBRITISH COLUMBIA / NORTHEAST PACIFIC, SET LONGLINES, CANADA, OUTSIDE ROCKFISHBRITISH COLUMBIA / NORTHEAST PACIFIC, JIG, CANADA, INSIDE ROCKFISHBRITISH COLUMBIA / NORTHEAST PACIFIC, JIG, CANADA, OUTSIDE ROCKFISHBRITISH COLUMBIA / NORTHEAST PACIFIC, LONGLINE (SHALLOW-SET), CANADABRITISH COLUMBIA / NORTHEAST PACIFIC, LONGLINE (DEEP-SET), CANADABRITISH COLUMBIA / NORTHEAST PACIFIC, TROLLING LINES, CANADA, INSIDE ROCKFISHBRITISH COLUMBIA / NORTHEAST PACIFIC, TROLLING LINES, CANADA, OUTSIDE ROCKFISH
Minimal Mitigation
Hook and line/trap fisheries: There are a number of closed areas scattered throughout British Columbia’swaters. The closures that are most relevant for the groundfish hook and line and trap fisheries are the 164Rockfish Conservation Areas, or RCAs, as fishing with hook and line or trap gear is prohibited in RCAs. Despitethe high number of RCAs in place, available GIS information suggests that the areal extent of the RCAs is likely≤20% of rockfish habitat; this number decreases for those rockfish (such as yelloweye) that are found indeeper waters as adults. Furthermore, there is little information regarding the representation of differenthabitat types in the RCAs. This uncertainty precludes an assumption that the RCAs are protecting sufficientamounts of representative habitat types. For the reasons mentioned above, RCAs are interpreted in thisassessment as “strong protection” for particularly vulnerable habitats, and the hook and line and trap fisheriesare scored “minimal mitigation” for Factor 4.2.
Justification:
Rockfish Conservation Areas
224

Factor 4.3 - Ecosystem-Based Fisheries Management
There are 164 Rockfish Conservation Areas (RCAs) in place in British Columbia waters, the last of which wereadded in 2007 (DFO 2013a). No commercial or recreational groundfish fishing activities are permitted withinRCAs, with the exception of midwater trawling (DFO 2013f).
Living Oceans Society, an environmental organization, analyzed the areal extent of the RCAs. This analysisfound that RCAs cover approximately 3.5% of coastwide waters at fishable depths, and 5.6% of waters <200m (LOS 2013). These coverage rates do not address the issue of habitat representation within the RCAs; itwould be expected that rockfish habitat would be better represented within the RCAs than in non-protectedareas. However, one GIS analysis found that a subset of RCAs did not consistently overlap with areas that hadbeen identified as high-value habitats by a model and/or fishermen (Ardron & Wallace 2005). Furthermore, ithas been suggested that the RCAs’ coverage of deeper habitats may not be sufficient to protect the adults ofsome species, such as yellowmouth rockfish (COSEWIC 2010) or yelloweye rockfish (Ardron & Wallace 2005).Overall, following revisions to the RCAs in 2005, the RCA network’s coverage of DFO-modeled rockfish habitathas been calculated to be between 12.8% - 20.0% of identified rockfish habitat, with habitats at depths >100m being <13.0% represented (Table 2 in (Ardron & Wallace 2005)).
For the aforementioned reasons, this assessment considers RCAs to be providing strong protection to a smallsubset of vulnerable habitats in the coast’s shallower waters.
Marine Protected AreasIn 2008, there were 161 areas that fit the "MPA" designation in British Columbia’s waters (Robb et al. 2011).The governing bodies responsible for these MPAs included federal, provincial, and municipal governments(Robb et al. 2011). A recent analysis found that some degree of commercial fishing was allowed in 160 of the161 MPAs, and that the total area that is fully off-limits to commercial fishing is approximately 3,575 km ,which is approximately 0.8% of Canada’s Pacific waters (Robb et al. 2011).
At the present time, DFO is responsible for two MPAs: Endeavour Hydrothermal Vents (EHV), and SGaanKinghlas-Bowie Seamount MPA (SK-BS) (DFO 2013a). All commercial fisheries are currently allowed tooperate in the EHV (DFO 2009d). A limited sablefish pot fishery occurs within a defined part of the BowieSeamount MPA (DFO 2013a).
2
BRITISH COLUMBIA / NORTHEAST PACIFIC, BOTTOM TRAWLS, CANADA, HARD SUBSTRATEBRITISH COLUMBIA / NORTHEAST PACIFIC, BOTTOM TRAWLS, CANADA, SOFT SUBSTRATEBRITISH COLUMBIA / NORTHEAST PACIFIC, MIDWATER TRAWLS, CANADABRITISH COLUMBIA / NORTHEAST PACIFIC, SET LONGLINES, CANADA, INSIDE ROCKFISHBRITISH COLUMBIA / NORTHEAST PACIFIC, SET LONGLINES, CANADA, OUTSIDE ROCKFISHBRITISH COLUMBIA / NORTHEAST PACIFIC, JIG, CANADA, INSIDE ROCKFISHBRITISH COLUMBIA / NORTHEAST PACIFIC, JIG, CANADA, OUTSIDE ROCKFISHBRITISH COLUMBIA / NORTHEAST PACIFIC, LONGLINE (SHALLOW-SET), CANADABRITISH COLUMBIA / NORTHEAST PACIFIC, LONGLINE (DEEP-SET), CANADABRITISH COLUMBIA / NORTHEAST PACIFIC, TROLLING LINES, CANADA, INSIDE ROCKFISHBRITISH COLUMBIA / NORTHEAST PACIFIC, TROLLING LINES, CANADA, OUTSIDE ROCKFISH
Low Concern
There is no evidence to suggest that any of the main species caught in the seven groundfish fisheries play anoutsized (aka “keystone”) role, relative to their abundance, in ecosystem functioning or food web structureand function. While groundfish as a whole are of significant importance to food webs as predators,competitors, and prey, the diversity found in groundfish diets (e.g., (Pearsall & Fargo 2007)) and in the
225

relevant food webs themselves (DFO 2007) suggests that highly specialized relationships are not expected forany particular species. As a result, the trophic webs are thought to be more stable and resilient than thosethat have “wasp-waist” characteristics (DFO 2007).
Currently, there are no programs or management measures in place that are meant specifically to managethe groundfish fisheries’ ecosystem impacts. The development of tools for ecosystem-based management isan ongoing effort in other branches of DFO, as demonstrated in the recently completed research initiative inthe Strait of Georgia (DFO 2013g). The management of ecosystem impacts is scored "low" concern, as thereare no species of exceptional ecological importance caught in these fisheries, and ecosystem-basedmanagement tools are not yet in place but are being developed by other branches of DFO.
226

AcknowledgementsScientific review does not constitute an endorsement of the Seafood Watch program, or its seafoodrecommendations, on the part of the reviewing scientists. Seafood Watch is solely responsible for theconclusions reached in this report.
Seafood Watch would like to thank the consulting researcher and author of this report, John Driscoll, as well asseveral anonymous reviewers for graciously reviewing this report for scientific accuracy.
®
®
227

ReferencesArdron, J. & Jamieson, G.S. 2006. Reducing bycatch of corals and sponges in British Columbia's groundfish trawlfishery through trawl fishery closures. Canadian Science Advisory Secretariat Research Document 2006/061.
Ardron, J. & Wallace, S. 2005. Modelling inshore rockfish habitat in British Columbia: a pilot study. Placematters: geospatial tools for marine science. Edited by D. Wright and A. Scholtz. University of Oregon Press,Eugene, OR, 47-68.
BC Seafood. 2014. BC Fisheries Information. Available at: www.bcseafood.ca.
Benson, A.J., McFarlane, G.A. & King, J.R.. 2001. A phase "0" review of elasmobranch biology, fisheries,assessment and management. Canadian Science Advisory Secretariat Research Document 2001/129.
Bodtker, K., Robb, C. & Wallace, S. 2013. Mapping and analysis inform innovative conservation measures for theCanadian Pacific groundfish trawl fishery. CoastGIS Conference 2013: Monitoring and adapting to change on thecoast. The 11th International Symposium for GIS and Computer Cartography for Coastal Zone Management,Victoria, BC.
Canada Gazette. 2009. P.C. 2009-383 March 5, 2009. Order amending Schedule 1 to the Species at Risk Act.Vol. 143, No. 6.
Canada Gazette. 2011a. P.C. 2011-729 June 23, 2011: Order giving notice of decisions not to add certainspecies to the list of endangered species. Vol. 145, No. 14 - July 6, 2011.
Canada Gazette. 2011b. P.C. 2011-728 June 23, 2011. Order amending Schedule 1 to the Species at Risk Act.Vol. 154, No. 14 - July 6, 2011.
Cope, J.M., DeVore, J., Dick, E.J., Ames, K., Budrick, J., Erickson, D.L., Grebel, J., Hanshew, G., Jones, R., Mattes,L., Niles, C. & Williams, S.. 2011. An approach to defining stock complexes for U.S. west coast groundfishesusing vulnerabilities and ecological distributions. North American Journal of Fisheries Management, 31(4), 589-604.
COSEWIC. 2004. COSEWIC assessment and update status report on the green sturgeon Acipenser medirostrisin Canada. Committee on the Status of Endangered Wildlife in Canada.
COSEWIC. 2007b. COSEWIC Assessment and status report on the rougheye rockfish Sebastes sp. type I andSebastes sp. type II in Canada. Committee on the Status of Endangered Wildlife in Canada.
COSEWIC. 2007a. COSEWIC assessment and status report on the canary rockfish (Sebastes pinniger) inCanada. Committee on the Status of Endangered Wildlife in Canada.
COSEWIC. 2008. COSEWIC assessment and status report on the yelloweye rockfish Sebastes ruberimus, PacificOcean inside waters population and Pacific Ocean outside waters population, in Canada. Committee on theStatus of Endangered Wildlife in Canada. Ottawa.
COSEWIC. 2009. COSEWIC assessment and status report on the darkblotched rockfish Sebastes crameri inCanada. Committee on the Status of Endangered Wildlife in Canada, Ottawa.
COSEWIC. 2010. COSEWIC Assesment and status report on the yellowmouth rockfish Sebastes reedi in Canada.Committee on the Status of Endangered Wildlife in Canada.
228

COSEWIC. 2011. COSEWIC assessment and status report on the North Pacific spiny dogfish Squalus suckleyi inCanada. Committee on the Status of Endangered Wildlife in Canada. Ottawa.
COSEWIC. 2013b. Canadian Science Advisory Secretariat - Upcoming Schedule.
COSEWIC. 2014. COSEWIC Wildlife species search: bocaccio Sebastes paucispinis.
COSEWIC. 2014b. COSEWIC Wildlife Species Search: Blue shark.
CSAS. 2010. Assessment of spiny dogfish (Squalus acanthias) in British Columbia in 2010. Canadian ScienceAdvisory Report 2010/057.
CSAS. 2011. Lingcod (Ophiodon elongatus) stock assessment and yield advice for outside stocks in BritishColumbia. Canadian Science Advisory Secretariat Research Document 2011/124.
CSAS. 2013a. Pacific ocean perch (Sebastes alutus) stock assessments for the west coast of Vancouver Islandand the north and west coasts of Haida Gwaii, British Columbia. Canadian Science Advisory Secretariat ScienceAdvisory report 2013/038.
CSAS. 2014a. Big skate (Raja binoculata) and longnose skate (R. rhina) stock assessments for British Columbia.Canadian Science Advisory Secretariat SAR 2014/027.
CSAS. 2014b. Stock assessment and harvest advice for rock sole (Lepidopsetta spp.) in British Columbia.Canadian Science Advisory Secretariat Science Advisory Report 2014/039.
DFO. 1999b. Thornyheads (Shortspine and Longspine) British Columbia Coast. DFO Stock Status Report A6-12.
DFO. 1999d. Stock status report: yellowtail rockfish. DFO Stock Status Report A6-07.
DFO. 2001. Fish stocks of the Pacific coast. Fisheries and Oceans Canada. ISBN 0-662-30042-4.
DFO. 2006. A harvest strategy compliant with the precautionary approach. Canadian Science AdvisorySecretariat Science Advisory Report 2006/023.
DFO. 2007. Ecosystem overview: Pacific North Coast Integrated Management Area (PNCIMA). CanadianTechnical Report of Fisheries and Aquaculture Sciences, Report 2667. Fisheries and Oceans Canada.
DFO. 2008. Population assessment: Steller sea lion (Eumetopias jubatus). Canadian Science AdvisorySecretariat Science Advisory Report 2008/047.
DFO. 2009a. A fishery decision-making framework incorporating the precautionary approach
DFO. 2009b. Recovery potential assessment of canary rockfish in British Columbia waters. Canadian ScienceAdvisory Secretariat Science Advisory Report 2009/041.
DFO. 2009c. Stock assessment update for British Columbia canary rockfish. Canadian Science AdvisorySecretariat Science Response, 2009/019.
DFO. 2009d. Endeavour Hydrothermal Vents: Marine Protected Area Management Plan, 2010-2015. DFO/2009-1550.
229
DFO. 2010. Management plan for the Steller sea lion (Eumetopias jubatus) in Canada. Fisheries and OceansCanada.
DFO. 2011a. Stock assessment for Pacific Ocean perch (Sebastes alutus) in Queen Charlotte Sound, BritishColumba in 2010. Canadian Science Advisory Secretariat Science Advisory Report 2011/017.
DFO. 2011b. Stock assessment for the inside population of yelloweye rockfish (Sebastes ruberrimus) in BritishColumbia, Canada for 2010. Canadian Science Advisory Secretariat Science Advisory Report 2011/084.
DFO. 2011c. Lingcod (Ophiodon elongatus) stock assessment and yield advice for outside stocks in BritishColumbia. Canadian Science Advisory Secretariat Science Advisory Report 2011/051.
DFO. 2011d. Management procedures for the multi-gear sablefish (Anoplopoma fimbria) fishery in BritishColumbia, Canada. Canadian Science Advisory Secretariat Science Advisory Report 2011/025.
DFO. 2012a. Pacific Region Integrated Fisheries Management Plan: Groundfish February 21, 2011 to February20, 2013 v.2.1.
DFO. 2012c. Management plan for the bluntnose sixgill shark (Hexanchus griseus) and tope shark (Galeorhinusgaleus) in Canada. Species At Risk Act Management Plan Series.
DFO. 2012d. Management plan for the rougheye/blackspotted rockfish complex (Sebastes aleutianus and S.melanostictus) and longspine thornyhead (Sebastolobus altivelis) in Canada. Species At Risk Act ManagementPlan Series.
DFO. 2013a. Pacific Region Integrated Fisheries Management Plan: Groundfish (Effective February 21, 2013).Fisheries and Oceans Canada.
DFO. 2013b. Synoptic trawl survey data. Supplied by Norm Olsen, August 20, 2013.
DFO. 2013c. Groundfish trawl catch and TAC summaries.
DFO. 2013d. Final hook and line catch summary reports.
DFO. 2013e. 2012-2013 Groundfish trawl summary of catch vs available weight, summarized for 21-Feb-12through 20-Feb-13.
DFO. 2013f. Permitted Fishing Within Rockfish Conservation Areas | Fisheries and Oceans Canada, PacificRegion. Fisheries and Oceans Canada, Pacific Region.
DFO. 2013g. The Strait of Georgia Ecosystem Research Initiative, Fisheries and Oceans Canada, Pacific Region,Oceans and Climate.
DFO. 2014b. Big and longnose skate commercial management and allocation. Presentation to the GroundfishForum, September 10, 2014.
DFO. 1999a. Redstripe rockfish British Columbia coast. DFO Stock Status Report A6-13.
DFO. 1999c. Stock Status Report: Widow rockfish. DFO Stock Status Report A6-01.
DFO. 2012b. Stock assessment update for bocaccio (Sebastes paucispinis) in British Columbia waters for 2012.
230

Canadian Science Advisory Secretariat Science Advisory Report 2012/059.
DFO. 2014a. Changes to the commercial management of quillback, china, copper and tiger rockfish.Presentation to Groundfish Forum, 2014.
DFO Pacific Region. 2013. British Columbia groundfish fishery catch data, 2012: Dataset in fulfillment of datarequest
Edwards, A.M., Starr, P.J. & Haigh, R.. 2011. Stock assessment for Pacific Ocean perch (Sebastes alutus) inQueen Charlotte Sound, British . Canadian Science Advisory Secretariat Research Document 2011/111.
Edwards, A.M., Haigh, R. & Starr, P.J. 2012. Stock assessment and recovery potential assessment foryellowmouth rockfish (Sebastes reedi) along the Pacific coast of Canada. Canadian Science Advisory SecretariatResearch Document 2012/095.
Fargo, J. 1999. Flatfish stock assessments for the west coast of Canada for 1998 and recommended yieldoptions for 1999. Canadian Stock Assessment Secretariat Report 99/17.
Fargo, J. & Starr, P.J. 2001. Turbot stock assessment for 2001 and recommendations for management in 2002.Canadian Science Advisory Secretariat Research Document 2001/150.
FDA. 2012. Acceptable seafood market names.
Galluci, V., Taylor, I., King, J., McFarlane, G. & McPhie, R. 2011. Spiny dogfish (Squalus acanthias) assessmentand catch recommendations for 2010. Canadian Science Advisory Secretariat Research Document 2011/034.
GSGislason & Associates. 2010. Economic impacts from a reduced groundfish trawl fishery in British Columbia.
Haigh, R. & Starr, P. 2008a. A review of redbanded rockfish Sebastes babcocki along the Pacific coast ofCanada: biology, distribution, and abundance trends. Canadian Science Advisory Secretariat ResearchDocument 2008/073.
Haigh, R. & Starr, P. 2008b. A review of darkblotched rockfish (Sebastes crameri) along the Pacific coast ofCanada: biology, distribution, and abundance trends. Canadian Science Advisory Secretariat ResearchDocument 2008/056.
Haigh, R., Olsen, N. & Starr, P. 2005a. A review of longspine thornyhead Sebastolobus altivelis along the Pacificcoast of Canada: bioogy, distribution, and abundance trends. Canadian Science Advisory Secretariat ResearchDocument 2005/097.
Haigh, R., Olsen, N. & Starr, P. 2005b. A review of rougheye rockfish Sebastes aleutianus along the Pacific coastof Canada: biology, distribution, and abundance trends. Canadian Science Advisory Secretariat ResearchDocument 2005/096.
Holt, K.R., Starr, P.J., Haigh, R. & Krishka, B. 2013. Draft stock assessment and harvest advice for rock sole(Lepidopsetta spp.) in British Columbia.
Irvine, J.R. & Crawford, W.R. 2012. State of physical, biological, and selected fishery resources of PacificCanadian marine ecosystems in 2011. Canadian Science Advisory Secretariat Research Document 2012/072.
IUCN. 2012. IUCN Red List: Sebastes paucispinus (Bocaccio Rockfish).
231
IUCN. 2014. The IUCN Red List of Threatened Species. Accessed June 13, 2014.
LOS. 2013. Rockfish Conservation Area Map. Living Oceans Society.
Ministry of Agriculture. 2012. 2012 Export Highlights British Columbia Agrifoods. British Columbia Ministry ofAgriculture.
Ministry of Agriculture. 2013. British Columbia seafood industry year in review: 2012.
Ministry of Environment. 2014. Groundfish Harvest & Sales - Province of B.C.
Naughton, M.B., Romano, M.D., & Zimmerman, T.S. 2007. A conservation action plan for black-footed albatross(Phoebastria nigripes) and Laysan albatross (P. immutabilis), Ver. 1.0.
Pearsall, I.A. & Fargo, J.J. 2007. Diet composition and habitat fidelity for groundfish assemblages in HecateStrait, British Columbia. Canadian Technical Report of Fisheries and Aquaculture Sciences, 2692.
PFMC. 2011. Proposed harvest specifications and management measures for the 2011-2012 Pacific coastgroundfish fishery and Amendment 16-5 to the Pacific coast groundfish fishery management plan to updateexisting rebuilding plans and adopt a rebuilding plan for Petrale sole; Final Environmental Impact Statement.Pacific Fishery Management Council.
Robb, C.K., Bodtker, K.M., Wright, K., & Lash, J. 2011. Commercial fisheries closures in marine protected areasin Canada's Pacific coast: the exception, not the rule. Marine Policy, 35(3), 309-316.
SARA Registry. 2014. Species at Risk Public Registry: Advanced Search. Accessed June 13, 2014.
Schnute, J.T., Olsen, N. & Haigh, R. 1999. Slope rockfish assessment for the west coast of Canada in 1998.Canadian Stock Assessment Secretariat Research Document 99/16.
Sinclair, A.F. & Starr, P.J. 2005. Assessment of Pacific cod in Hecate Strait (5CD) and Queen Charlotte Sound(5AB), January, 2005. Canadian Science Advisory Secretariat Research Document 2005/026.
Sinclair, A., Schnute, J., Haigh, R., Starr, P., Stanley, R., Fargo, J. & Workman, G. 2003. Feasibility of multispeciesgroundfish bottom trawl surveys on the BC coast. Canadian Science Advisory Secretariat Research Document2003/049.
Sinclair, A., Krishka, B.A. & Fargo, J. 2007. Species trends in relative biomass, occupied area and depthdistribution for Hecate Strait assemblage surveys from 1984-2003. Canadian Technical Report of Fisheries andAquatic Sciences 2749.
Stanley, R.D., McAllister, M. & Starr, P. 2012. Updated stock assessment for bocaccio (Sebastes paucispinis) inBritish Columbia waters for 2012. Canadian Science Advisory Secretariat Research Document 2012/109.
Starr, P.J. 2009a. English sole (Parophrys vetulus) in British Columbia, Canada: stock assessment for 2006/2007and advice to managers for 2007/2008. Canadian Science Advisory Secretariat Research Document 2009/069.
Starr, P.J. 2009b. Petrale sole (Eopsetta jordani) in British Columbia, Canada: Stock assessment for 2006/07 andadvice to managers for 2007/08. Canadian Science Advisory Secretariat Research Document 2009/070.
Starr, P.J., Sinclair, A.S. & Boutillier, J. 2002. West Coast Vancouver Island Pacific cod assessment: 2002.
232
Canadian Science Advisory Secretariat Research Document 2002/113.
Starr, P.J., Haigh, R. & Grandin, C. 2013. Stock assessment for silvergray rockfish (Sebastes brevispinis) alongthe Pacific coast of Canada. Canadian Science Advisory Secretariat, CSAP Working Paper 2013/P27.
Stewart, I.J., Leaman, B., Martell, S. & Webster, R.A. 2012. Assessment of the Pacific halibut stock at the end of2012. International Pacific Halibut Commission, Seattle, WA.
USFWS. 2013. Alaska Region Migratory Bird Management Seabirds.
Wallace, S. & Ardron, J. 2005. Depth matters: submission to DFO reiterating concern regarding the lack ofadequate depth representation in the Rockfish Conservation Area Strategy.
A review of yelloweye rockfish Sebastes ruberrimus along the Pacific coast of Canada: biology, distribution andabundance trends. Canadian Science Advisory Secretariat Research Document 2006/076.
Stock assessment and recovery potential assessment for quillback rockfish (Sebastes maliger) on the Pacificcoast of Canada. Canadian Science Advisory Secretariat Research Document 2011/135.
233

Appendix A: Extra By Catch SpeciesSTELLER SEA LION
Factor 2.1 - Inherent Vulnerability
Factor 2.2 - Abundance
Factor 2.3 - Fishing Mortality
Factor 2.4 - Discard Rate
BRITISH COLUMBIA/NORTHEAST PACIFIC, BOTTOM TRAWLS, CANADA, SOFT SUBSTRATEBRITISH COLUMBIA/NORTHEAST PACIFIC, BOTTOM TRAWLS, CANADA, HARD SUBSTRATEBRITISH COLUMBIA/NORTHEAST PACIFIC, MIDWATER TRAWLS, CANADA
High
The Seafood Watch criteria assign an inherent vulnerability score of “high” to all marine mammals.
BRITISH COLUMBIA/NORTHEAST PACIFIC, BOTTOM TRAWLS, CANADA, SOFT SUBSTRATEBRITISH COLUMBIA/NORTHEAST PACIFIC, BOTTOM TRAWLS, CANADA, HARD SUBSTRATEBRITISH COLUMBIA/NORTHEAST PACIFIC, MIDWATER TRAWLS, CANADA
Low Concern
Steller sea lions in British Columbia were once subject to culls, but have been protected since 1970 (DFO2008). Since 1970s, the abundance of Steller sea lions in British Columbia is estimated to have tripled, andpup production is estimated to have quadrupled (DFO 2008). The species’ current abundance in BritishColumbia is now estimated to be “well past” known historical levels (DFO 2010). The species was assessed as"Special Concern" by COSEWIC and is listed as "Special Concern" under SARA (Appendix E). While the stock’sstatus is high relative to historical levels, its stock status score for this report is "low" concern, instead of “verylow", due to the stock’s SARA listing.
BRITISH COLUMBIA/NORTHEAST PACIFIC, BOTTOM TRAWLS, CANADA, SOFT SUBSTRATEBRITISH COLUMBIA/NORTHEAST PACIFIC, BOTTOM TRAWLS, CANADA, HARD SUBSTRATEBRITISH COLUMBIA/NORTHEAST PACIFIC, MIDWATER TRAWLS, CANADA
Low Concern
In the recent Steller sea lion management plan, incidental mortality from fisheries and aquaculture wasdetermined to have “low” population-level impacts and to be a “low” concern (Table 1 in (DFO 2010)). Whilethis management plan does not offer any estimates of sustainable annual removals, it does state that thecontinued growth of the population in British Columbia suggests that the totality of current impacts is withinsustainable limits, with the caveat that any apparently minor increase in anthropogenic mortality would havethe potential to have substantial impacts (DFO 2010). The primary source of Steller sea lion bycatch in thegroundfish fisheries is in the trawl fishery, which caught approximately 3.2 t of Steller sea lions in 2012(Appendix E). The mortality of Steller sea lions in the trawl fishery is scored “low” concern.
BRITISH COLUMBIA/NORTHEAST PACIFIC, BOTTOM TRAWLS, CANADA, SOFT SUBSTRATEBRITISH COLUMBIA/NORTHEAST PACIFIC, BOTTOM TRAWLS, CANADA, HARD SUBSTRATEBRITISH COLUMBIA/NORTHEAST PACIFIC, MIDWATER TRAWLS, CANADA
234

SIXGILL SHARK
Factor 2.1 - Inherent Vulnerability
Factor 2.2 - Abundance
Factor 2.3 - Fishing Mortality
20-40%
The discard: landings ratio for the bottom trawl fishery was 20.9% in 2012 (DFO Pacific Region 2013).
Discard rates (i.e., the ratio of at-sea discards to landings) are challenging to determine for the hook and linegroundfish fisheries. This is because some of the available logbook data record certain releases as piececounts, rather than by weight. Furthermore, the Seafood Watch criteria require that the bait used in fishingoperations be added to the weight of the discards, so that the final ratio is (bait+ discards)/landings. There isno information regarding the quantities of bait used in the groundfish hook and line fisheries. Therefore, forthe hook and line fisheries, a proxy (bait+ discards)/landings ratio of 0.20-0.40 is used.
BRITISH COLUMBIA/NORTHEAST PACIFIC, LONGLINE (SHALLOW-SET), CANADABRITISH COLUMBIA/NORTHEAST PACIFIC, BOTTOM TRAWLS, CANADA, HARD SUBSTRATEBRITISH COLUMBIA/NORTHEAST PACIFIC, LONGLINE (DEEP-SET), CANADABRITISH COLUMBIA/NORTHEAST PACIFIC, BOTTOM TRAWLS, CANADA, SOFT SUBSTRATEBRITISH COLUMBIA/NORTHEAST PACIFIC, MIDWATER TRAWLS, CANADABRITISH COLUMBIA/NORTHEAST PACIFIC, JIG, CANADA, OUTSIDE ROCKFISHBRITISH COLUMBIA/NORTHEAST PACIFIC, SET LONGLINES, CANADA, OUTSIDE ROCKFISHBRITISH COLUMBIA/NORTHEAST PACIFIC, TROLLING LINES, CANADA, OUTSIDE ROCKFISH
High
The Fishbase vulnerability score for bluntnose sixgill shark is 84. The species’ inherent vulnerability istherefore scored “high".
BRITISH COLUMBIA/NORTHEAST PACIFIC, LONGLINE (SHALLOW-SET), CANADABRITISH COLUMBIA/NORTHEAST PACIFIC, BOTTOM TRAWLS, CANADA, HARD SUBSTRATEBRITISH COLUMBIA/NORTHEAST PACIFIC, LONGLINE (DEEP-SET), CANADABRITISH COLUMBIA/NORTHEAST PACIFIC, BOTTOM TRAWLS, CANADA, SOFT SUBSTRATEBRITISH COLUMBIA/NORTHEAST PACIFIC, MIDWATER TRAWLS, CANADABRITISH COLUMBIA/NORTHEAST PACIFIC, JIG, CANADA, OUTSIDE ROCKFISHBRITISH COLUMBIA/NORTHEAST PACIFIC, SET LONGLINES, CANADA, OUTSIDE ROCKFISHBRITISH COLUMBIA/NORTHEAST PACIFIC, TROLLING LINES, CANADA, OUTSIDE ROCKFISH
High Concern
The current abundance, and trend in abundance, is not known for bluntnose sixgill shark (DFO 2012c). Thespecies was assessed as "Special Concern" by COSEWIC and is listed as "Special Concern" under SARA, andis listed as "Near Threatened" by the IUCN (Appendix E). In accordance with the Seafood Watch criteria, thestock status of bluntnose sixgill shark is scored “high” concern, due to its COSEWIC, SARA, and IUCN statuses.
235
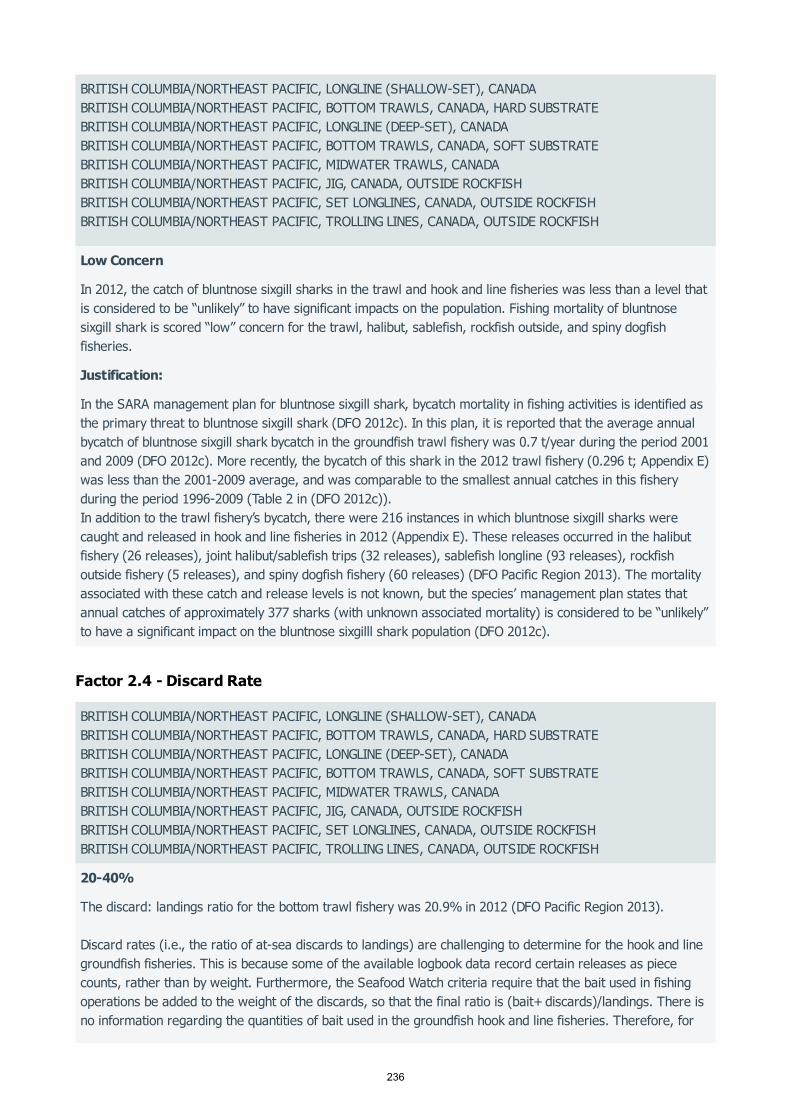
Factor 2.4 - Discard Rate
BRITISH COLUMBIA/NORTHEAST PACIFIC, LONGLINE (SHALLOW-SET), CANADABRITISH COLUMBIA/NORTHEAST PACIFIC, BOTTOM TRAWLS, CANADA, HARD SUBSTRATEBRITISH COLUMBIA/NORTHEAST PACIFIC, LONGLINE (DEEP-SET), CANADABRITISH COLUMBIA/NORTHEAST PACIFIC, BOTTOM TRAWLS, CANADA, SOFT SUBSTRATEBRITISH COLUMBIA/NORTHEAST PACIFIC, MIDWATER TRAWLS, CANADABRITISH COLUMBIA/NORTHEAST PACIFIC, JIG, CANADA, OUTSIDE ROCKFISHBRITISH COLUMBIA/NORTHEAST PACIFIC, SET LONGLINES, CANADA, OUTSIDE ROCKFISHBRITISH COLUMBIA/NORTHEAST PACIFIC, TROLLING LINES, CANADA, OUTSIDE ROCKFISH
Low Concern
In 2012, the catch of bluntnose sixgill sharks in the trawl and hook and line fisheries was less than a level thatis considered to be “unlikely” to have significant impacts on the population. Fishing mortality of bluntnosesixgill shark is scored “low” concern for the trawl, halibut, sablefish, rockfish outside, and spiny dogfishfisheries.
Justification:
In the SARA management plan for bluntnose sixgill shark, bycatch mortality in fishing activities is identified asthe primary threat to bluntnose sixgill shark (DFO 2012c). In this plan, it is reported that the average annualbycatch of bluntnose sixgill shark bycatch in the groundfish trawl fishery was 0.7 t/year during the period 2001and 2009 (DFO 2012c). More recently, the bycatch of this shark in the 2012 trawl fishery (0.296 t; Appendix E)was less than the 2001-2009 average, and was comparable to the smallest annual catches in this fisheryduring the period 1996-2009 (Table 2 in (DFO 2012c)).In addition to the trawl fishery’s bycatch, there were 216 instances in which bluntnose sixgill sharks werecaught and released in hook and line fisheries in 2012 (Appendix E). These releases occurred in the halibutfishery (26 releases), joint halibut/sablefish trips (32 releases), sablefish longline (93 releases), rockfishoutside fishery (5 releases), and spiny dogfish fishery (60 releases) (DFO Pacific Region 2013). The mortalityassociated with these catch and release levels is not known, but the species’ management plan states thatannual catches of approximately 377 sharks (with unknown associated mortality) is considered to be “unlikely”to have a significant impact on the bluntnose sixgilll shark population (DFO 2012c).
BRITISH COLUMBIA/NORTHEAST PACIFIC, LONGLINE (SHALLOW-SET), CANADABRITISH COLUMBIA/NORTHEAST PACIFIC, BOTTOM TRAWLS, CANADA, HARD SUBSTRATEBRITISH COLUMBIA/NORTHEAST PACIFIC, LONGLINE (DEEP-SET), CANADABRITISH COLUMBIA/NORTHEAST PACIFIC, BOTTOM TRAWLS, CANADA, SOFT SUBSTRATEBRITISH COLUMBIA/NORTHEAST PACIFIC, MIDWATER TRAWLS, CANADABRITISH COLUMBIA/NORTHEAST PACIFIC, JIG, CANADA, OUTSIDE ROCKFISHBRITISH COLUMBIA/NORTHEAST PACIFIC, SET LONGLINES, CANADA, OUTSIDE ROCKFISHBRITISH COLUMBIA/NORTHEAST PACIFIC, TROLLING LINES, CANADA, OUTSIDE ROCKFISH
20-40%
The discard: landings ratio for the bottom trawl fishery was 20.9% in 2012 (DFO Pacific Region 2013).
Discard rates (i.e., the ratio of at-sea discards to landings) are challenging to determine for the hook and linegroundfish fisheries. This is because some of the available logbook data record certain releases as piececounts, rather than by weight. Furthermore, the Seafood Watch criteria require that the bait used in fishingoperations be added to the weight of the discards, so that the final ratio is (bait+ discards)/landings. There isno information regarding the quantities of bait used in the groundfish hook and line fisheries. Therefore, for
236

SHARPCHIN ROCKFISH
Factor 2.1 - Inherent Vulnerability
Factor 2.2 - Abundance
the hook and line fisheries, a proxy (bait+ discards)/landings ratio of 0.20-0.40 is used.
BRITISH COLUMBIA/NORTHEAST PACIFIC, BOTTOM TRAWLS, CANADA, HARD SUBSTRATEBRITISH COLUMBIA/NORTHEAST PACIFIC, MIDWATER TRAWLS, CANADA
High
The Fishbase vulnerability score for sharpchin rockfish is 64, and the species’ productivity rating in Cope et al.2011 is 1.36 (Table 1 in (Cope et al. 2011)). Sharpchin rockfish inherent vulnerability is therefore scored“high".
BRITISH COLUMBIA/NORTHEAST PACIFIC, BOTTOM TRAWLS, CANADA, HARD SUBSTRATEBRITISH COLUMBIA/NORTHEAST PACIFIC, MIDWATER TRAWLS, CANADA
Moderate Concern
To date, the sharpchin rockfish stock in British Columbia has not been assessed. Trawl survey biomass indicessuggest a gradual increase in the three relevant survey areas (Figure 62). While the species’ "high" inherentvulnerability (see Factor 2.1) and the lack of a stock assessment suggest a Factor 2.2 score of "high"concern, the trends noted in the survey biomass indices mitigate concern. Sharpchin rockfish stock status istherefore scored “moderate" concern.
Justification:
Trawl survey biomass indices for sharpchin rockfish. Data from (DFO 2013b).
237

Factor 2.3 - Fishing Mortality
Factor 2.4 - Discard Rate
SPLITNOSE ROCKFISH
Factor 2.1 - Inherent Vulnerability
Factor 2.2 - Abundance
BRITISH COLUMBIA/NORTHEAST PACIFIC, BOTTOM TRAWLS, CANADA, HARD SUBSTRATEBRITISH COLUMBIA/NORTHEAST PACIFIC, MIDWATER TRAWLS, CANADA
Moderate Concern
In 2012, approximately 300 t of sharpchin rockfish were caught in the trawl fishery (DFO Pacific Region 2013).Of this total, 121.25 t were discarded (DFO Pacific Region 2013). There is no TAC for sharpchin rockfish, andno estimate of sustainable fishing mortality. Therefore, the Factor 2.3 score is "moderate" concern for thisstock.
BRITISH COLUMBIA/NORTHEAST PACIFIC, BOTTOM TRAWLS, CANADA, HARD SUBSTRATEBRITISH COLUMBIA/NORTHEAST PACIFIC, MIDWATER TRAWLS, CANADA
20-40%
The discard: landings ratio for the bottom trawl fishery was 20.9% in 2012 (DFO Pacific Region 2013).
Discard rates (i.e., the ratio of at-sea discards to landings) are challenging to determine for the hook and linegroundfish fisheries. This is because some of the available logbook data record certain releases as piececounts, rather than by weight. Furthermore, the Seafood Watch criteria require that the bait used in fishingoperations be added to the weight of the discards, so that the final ratio is (bait+ discards)/landings. There isno information regarding the quantities of bait used in the groundfish hook and line fisheries. Therefore, forthe hook and line fisheries, a proxy (bait+ discards)/landings ratio of 0.20-0.40 is used.
BRITISH COLUMBIA/NORTHEAST PACIFIC, BOTTOM TRAWLS, CANADA, HARD SUBSTRATEBRITISH COLUMBIA/NORTHEAST PACIFIC, MIDWATER TRAWLS, CANADA
High
The Fishbase vulnerability score for splitnose rockfish is 66, and the species’ productivity rating in Cope et al.2011 is 1.28 (Table 1 in (Cope et al. 2011)). Splitnose rockfish vulnerability is scored "high".
BRITISH COLUMBIA/NORTHEAST PACIFIC, BOTTOM TRAWLS, CANADA, HARD SUBSTRATEBRITISH COLUMBIA/NORTHEAST PACIFIC, MIDWATER TRAWLS, CANADA
Moderate Concern
There is no stock assessment for splitnose rockfish. The WCVI trawl survey biomass index for splitnoserockfish shows an increasing trend (Figure 63). While the Seafood Watch criteria suggest a Factor 2.2 score of"high” concern for a species with unknown stock status and "high" inherent vulnerability (see Factor 2.1), the
238

Factor 2.3 - Fishing Mortality
Factor 2.4 - Discard Rate
Factor 2.2 score for splitnose rockfish is moderated by the trend in the WCVI survey biomass index, andsplitnose rockfish stock status is therefore scored "moderate" concern.
Justification:
Of the four trawl surveys for which data exist, only the WCVI survey yields splitnose rockfish biomass indicesthat are appropriate for analysis; the QCS indices are characterized by high relative error (mean relative error= 0.68), and WCHG and HS surveys have yielded relatively small biomass estimates for this species (DFO2013b). The WCVI survey index shows an increased trend from 2004 through 2012 (Figure 63).
Trawl survey biomass indices for splitnose rockfish. Data from (DFO 2013b).
BRITISH COLUMBIA/NORTHEAST PACIFIC, BOTTOM TRAWLS, CANADA, HARD SUBSTRATEBRITISH COLUMBIA/NORTHEAST PACIFIC, MIDWATER TRAWLS, CANADA
Moderate Concern
There is no TAC for splitnose rockfish. In 2012, the trawl fishery caught approximately 181.5 t of splitnoserockfish, and retained approximately 48% (DFO Pacific Region 2013). The impact of this level of fishingmortality on the stock is not known. The Factor 2.3 score for splitnose rockfish caught in the trawl fishery istherefore scored “moderate" concern.
BRITISH COLUMBIA/NORTHEAST PACIFIC, BOTTOM TRAWLS, CANADA, HARD SUBSTRATEBRITISH COLUMBIA/NORTHEAST PACIFIC, MIDWATER TRAWLS, CANADA
20-40%
The discard: landings ratio for the bottom trawl fishery was 20.9% in 2012 (DFO Pacific Region 2013).
Discard rates (i.e., the ratio of at-sea discards to landings) are challenging to determine for the hook and linegroundfish fisheries. This is because some of the available logbook data record certain releases as piece
239
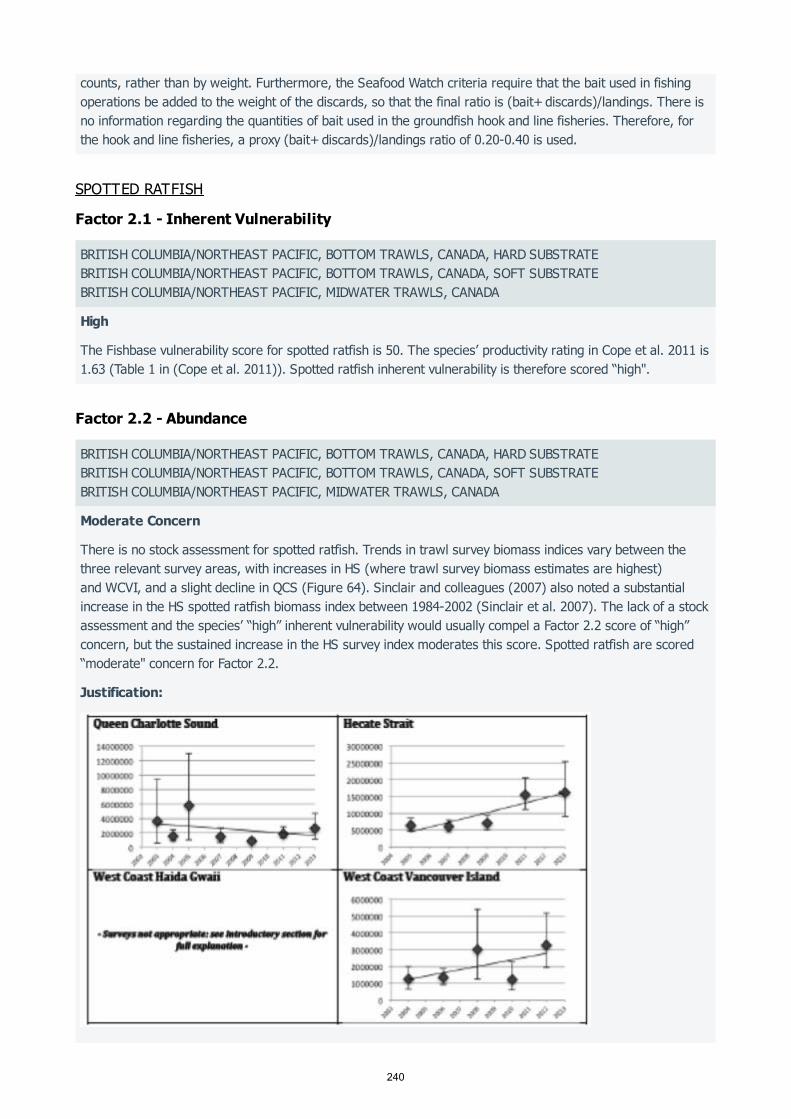
SPOTTED RATFISH
Factor 2.1 - Inherent Vulnerability
Factor 2.2 - Abundance
counts, rather than by weight. Furthermore, the Seafood Watch criteria require that the bait used in fishingoperations be added to the weight of the discards, so that the final ratio is (bait+ discards)/landings. There isno information regarding the quantities of bait used in the groundfish hook and line fisheries. Therefore, forthe hook and line fisheries, a proxy (bait+ discards)/landings ratio of 0.20-0.40 is used.
BRITISH COLUMBIA/NORTHEAST PACIFIC, BOTTOM TRAWLS, CANADA, HARD SUBSTRATEBRITISH COLUMBIA/NORTHEAST PACIFIC, BOTTOM TRAWLS, CANADA, SOFT SUBSTRATEBRITISH COLUMBIA/NORTHEAST PACIFIC, MIDWATER TRAWLS, CANADA
High
The Fishbase vulnerability score for spotted ratfish is 50. The species’ productivity rating in Cope et al. 2011 is1.63 (Table 1 in (Cope et al. 2011)). Spotted ratfish inherent vulnerability is therefore scored “high".
BRITISH COLUMBIA/NORTHEAST PACIFIC, BOTTOM TRAWLS, CANADA, HARD SUBSTRATEBRITISH COLUMBIA/NORTHEAST PACIFIC, BOTTOM TRAWLS, CANADA, SOFT SUBSTRATEBRITISH COLUMBIA/NORTHEAST PACIFIC, MIDWATER TRAWLS, CANADA
Moderate Concern
There is no stock assessment for spotted ratfish. Trends in trawl survey biomass indices vary between thethree relevant survey areas, with increases in HS (where trawl survey biomass estimates are highest)and WCVI, and a slight decline in QCS (Figure 64). Sinclair and colleagues (2007) also noted a substantialincrease in the HS spotted ratfish biomass index between 1984-2002 (Sinclair et al. 2007). The lack of a stockassessment and the species’ “high” inherent vulnerability would usually compel a Factor 2.2 score of “high”concern, but the sustained increase in the HS survey index moderates this score. Spotted ratfish are scored“moderate" concern for Factor 2.2.
Justification:
240
Factor 2.3 - Fishing Mortality
Factor 2.4 - Discard Rate
FLATHEAD SOLE
Factor 2.1 - Inherent Vulnerability
Factor 2.2 - Abundance
Trawl survey biomass indices for spotted ratfish. Data from (DFO 2013b).
BRITISH COLUMBIA/NORTHEAST PACIFIC, BOTTOM TRAWLS, CANADA, HARD SUBSTRATEBRITISH COLUMBIA/NORTHEAST PACIFIC, BOTTOM TRAWLS, CANADA, SOFT SUBSTRATEBRITISH COLUMBIA/NORTHEAST PACIFIC, MIDWATER TRAWLS, CANADA
Moderate Concern
In 2012, the trawl fishery caught 574.75 t of spotted ratfish (DFO Pacific Region 2013). Approximately 96% ofthis catch was discarded at sea (DFO Pacific Region 2013). As there is no estimate of sustainable mortality forspotted ratfish and no TAC, the Factor 2.3 score is “moderate” concern for the trawl fishery.
BRITISH COLUMBIA/NORTHEAST PACIFIC, BOTTOM TRAWLS, CANADA, HARD SUBSTRATEBRITISH COLUMBIA/NORTHEAST PACIFIC, BOTTOM TRAWLS, CANADA, SOFT SUBSTRATEBRITISH COLUMBIA/NORTHEAST PACIFIC, MIDWATER TRAWLS, CANADA
20-40%
The discard: landings ratio for the bottom trawl fishery was 20.9% in 2012 (DFO Pacific Region 2013).
Discard rates (i.e., the ratio of at-sea discards to landings) are challenging to determine for the hook and linegroundfish fisheries. This is because some of the available logbook data record certain releases as piececounts, rather than by weight. Furthermore, the Seafood Watch criteria require that the bait used in fishingoperations be added to the weight of the discards, so that the final ratio is (bait+ discards)/landings. There isno information regarding the quantities of bait used in the groundfish hook and line fisheries. Therefore, forthe hook and line fisheries, a proxy (bait+ discards)/landings ratio of 0.20-0.40 is used.
BRITISH COLUMBIA/NORTHEAST PACIFIC, BOTTOM TRAWLS, CANADA, SOFT SUBSTRATE
Medium
The Fishbase vulnerability score for flathead sole is 36, and the species’ productivity rating in Cope et al. 2011is 2.30 (Table 1 in (Cope et al. 2011)). Flathead sole vulnerability is scored “medium”.
BRITISH COLUMBIA/NORTHEAST PACIFIC, BOTTOM TRAWLS, CANADA, SOFT SUBSTRATE
Moderate Concern
There is no stock assessment for flathead sole. Flathead sole trawl survey biomass indices show increasingtrends in HS and WCVI, and a slight decline in QCS. Sinclair and colleagues (2007) also noted a substantialincrease in the HS flathead sole biomass index between 1984-2002 (Sinclair et al. 2007). While there is nostock assessment for this species, the increasing trends in the biomass indices and the species' "medium"
241
Factor 2.3 - Fishing Mortality
Factor 2.4 - Discard Rate
PACIFIC HALIBUT
Factor 2.1 - Inherent Vulnerability
Factor 2.2 - Abundance
inherent vulnerability mitigate concern. The stock status of flathead sole is scored “moderate” concern.
BRITISH COLUMBIA/NORTHEAST PACIFIC, BOTTOM TRAWLS, CANADA, SOFT SUBSTRATE
Moderate Concern
There is no quota for flathead sole. In 2012, the trawl fishery caught approximately 66.4 t of flathead sole,and retained 42% of this catch (DFO Pacific Region 2013). The effect of this level of fishing mortality on thestock is not known, and the Factor 2.3 score for flathead sole is therefore scored "moderate" concern.
BRITISH COLUMBIA/NORTHEAST PACIFIC, BOTTOM TRAWLS, CANADA, SOFT SUBSTRATE
20-40%
The discard: landings ratio for the bottom trawl fishery was 20.9% in 2012 (DFO Pacific Region 2013).
Discard rates (i.e., the ratio of at-sea discards to landings) are challenging to determine for the hook and linegroundfish fisheries. This is because some of the available logbook data record certain releases as piececounts, rather than by weight. Furthermore, the Seafood Watch criteria require that the bait used in fishingoperations be added to the weight of the discards, so that the final ratio is (bait+ discards)/landings. There isno information regarding the quantities of bait used in the groundfish hook and line fisheries. Therefore, forthe hook and line fisheries, a proxy (bait+ discards)/landings ratio of 0.20-0.40 is used.
BRITISH COLUMBIA/NORTHEAST PACIFIC, SET LONGLINES, CANADA, OUTSIDE ROCKFISH
High
The Fishbase vulnerability score for Pacific halibut is 86. Pacific halibut are therefore scored “high” forinherent vulnerability.
BRITISH COLUMBIA/NORTHEAST PACIFIC, SET LONGLINES, CANADA, OUTSIDE ROCKFISH
Low Concern
The median estimate for Pacific halibut SB is 43% of unfished equilibrium biomass, and there is lowprobability that SB is below the SB upper reference point used by the International Pacific HalibutCommission. After more than a decade of declining biomass, driven by decreasing size-at-age and reducedrecruitment, Pacific halibut spawning biomass is estimated to have stabilized and then increased in recentyears. For these reasons, the stock status of Pacific halibut is scored “low” concern.
2015
2015 30%
Justification:
At the end of 2012, a review of the model used to assess the Pacific halibut stock was undertaken. Thechanges that were made to the model as a result of the review yielded projections that show a much stronger
242
Factor 2.3 - Fishing Mortality
decline in biomass over recent years, and an estimate of exploitable biomass that was 28.3% lower in 2013than it was in 2011 (Stewart et al. 2012).
At the time of the writing of this report, an executive summary for the 2015 stock assessment was available.In this summary, the recent trend in halibut biomass shows a substantial decline from the late 1990s throughapproximately 2010, a leveling-out from 2010 through approximately 2012, and a slight increase in the yearsthereafter (Figure 4 in Stewart et al. 2015). The median estimate for SB is 43% of equilibrium unfishedbiomass (Stewart et al. 2015}. This is above the SB upper reference point that the International PacificHalibut Commission (IPHC) uses to demarcate the stock status at which reduced harvest rates are initiated.While the authors of that executive summary note that the distribution of probabilities shows a “very wideplausible interval” for SB , the probability that SB ≤SB is only approximately 3% (Stewart etal. 2015).
2015
30%
2015 2015 30%
BRITISH COLUMBIA/NORTHEAST PACIFIC, SET LONGLINES, CANADA, OUTSIDE ROCKFISH
Moderate Concern
In 2014, the British Columbia halibut longline fishery accounted for approximately 94% of both commercialhalibut TAC and catch. British Columbia’s Pacific halibut catch limits are determined by the IPHC. For 2014, theIPHC selected a coastwide harvest alternative that was less conservative than the option derived from theirstandard harvest policy. While the harvest alternative adopted for 2014 was associated with low probabilitiesof either sub-SB or sub- SB stock status in 2015, it was associated with a high probability of exceedingthe IPHC’s coastwide target harvest rate and an increased probability (relative to the standard harvest policyoption) of SB <SB . The mortality of Pacific halibut in the directed fishery is scored “moderate” concern.
30% 20%
2015 2014
Justification:
The IPHC determines the amount of Pacific halibut available for all fisheries in British Columbia by applying anarea-specific harvest rate (21.5% for Area 2B when SB>SB30%) to the amount of exploitable biomass thathas been apportioned to Area 2B (Stewart et al. N.D.). Catch limit recommendations may be lower than theresulting value, however, due to a “slow-up” policy that restricts the maximum increase in allowable catchfrom one year to the next (IPHC N.D.).
For 2014, the fishery catch limit for Area 2B was 3,107 t (IPHC 2014). This catch limit corresponded to aharvest alternative that was less conservative than the “blue line” option derived from application of the IPHC’sharvest strategy (IPHC 2014). The harvest alternative selected for 2014 was associated with relatively lowprobabilities of the coastwide SB2015 being less than SB30% (5 times out of 100) or SB20% (1 time out of100) (IPHC 2014). However, it was associated with a high probability that the coastwide 2014 harvest ratewould exceed the IPHC’s target harvest rate (89 times out of 100), and increased the probability thatSB2015<SB2014 by 11 times out of 100 (from 56 times to 67 times out of 100) (IPHC 2014).
In British Columbia, halibut are caught in the directed halibut longline fishery, as bycatch in other commercialfisheries, and in recreational fisheries. In 2014, the estimated total mortality of Pacific halibut in all BritishColumbia fisheries (3,034 t) was approximately 97.6% of the total catch limit (3,107 t), with commerciallandings (2,619 t) accounting for approximately 86.3% of total estimated mortality (Appendix I, Table 1in (IPHC 2015)). For the 2014 season, 100% of the commercial halibut TAC (2,627 t) was allocated to thehook and line fisheries (the trawl fishery has a 454 t halibut bycatch mortality cap) (DFO 2014a). During the2014 season, the halibut longline fishery accounted for approximately 93.6% of both commercial TAC andcatch (DFO 2015b).
243

Factor 2.4 - Discard Rate
BRITISH COLUMBIA/NORTHEAST PACIFIC, SET LONGLINES, CANADA, OUTSIDE ROCKFISH
20-40%
The discard: landings ratio for the bottom trawl fishery was 20.9% in 2012 (DFO Pacific Region 2013).
Discard rates (i.e., the ratio of at-sea discards to landings) are challenging to determine for the hook and linegroundfish fisheries. This is because some of the available logbook data record certain releases as piececounts, rather than by weight. Furthermore, the Seafood Watch criteria require that the bait used in fishingoperations be added to the weight of the discards, so that the final ratio is (bait+ discards)/landings. There isno information regarding the quantities of bait used in the groundfish hook and line fisheries. Therefore, forthe hook and line fisheries, a proxy (bait+ discards)/landings ratio of 0.20-0.40 is used.
244
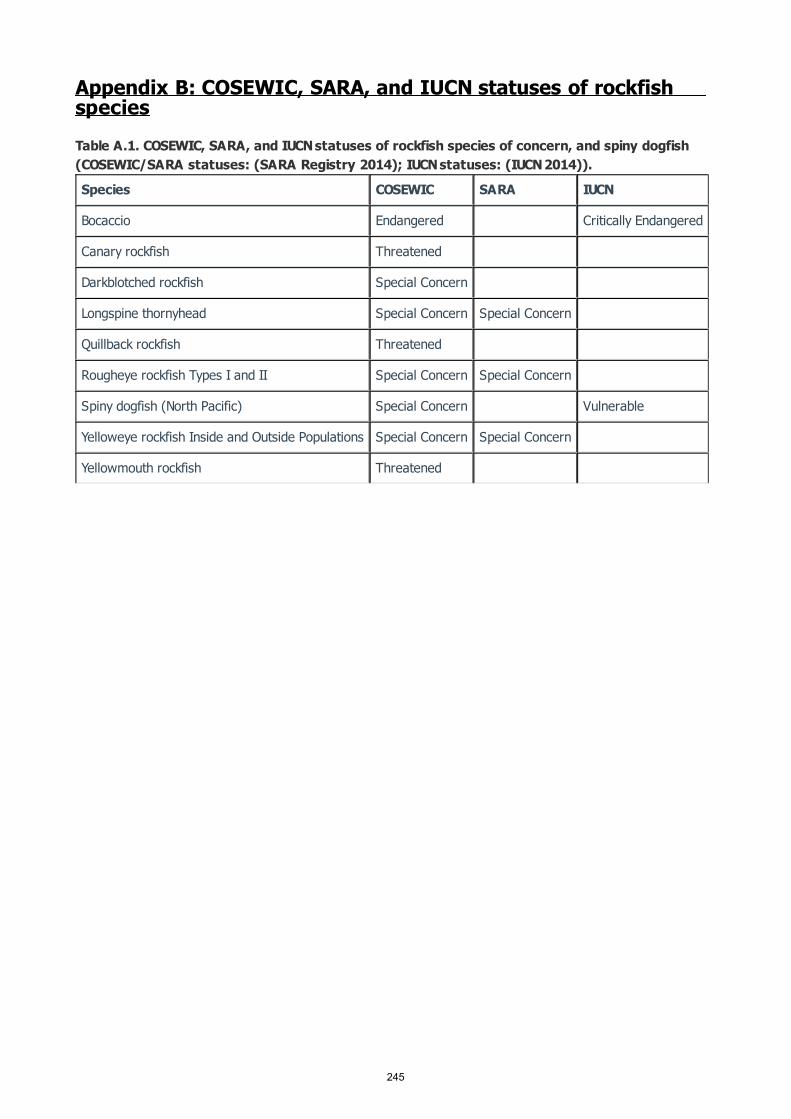
Appendix B: COSEWIC, SARA, and IUCN statuses of rockfishspeciesTable A.1. COSEWIC, SARA, and IUCN statuses of rockfish species of concern, and spiny dogfish(COSEWIC/SARA statuses: (SARA Registry 2014); IUCN statuses: (IUCN 2014)).
Species COSEWIC SARA IUCN
Bocaccio Endangered Critically Endangered
Canary rockfish Threatened
Darkblotched rockfish Special Concern
Longspine thornyhead Special Concern Special Concern
Quillback rockfish Threatened
Rougheye rockfish Types I and II Special Concern Special Concern
Spiny dogfish (North Pacific) Special Concern Vulnerable
Yelloweye rockfish Inside and Outside Populations Special Concern Special Concern
Yellowmouth rockfish Threatened
245
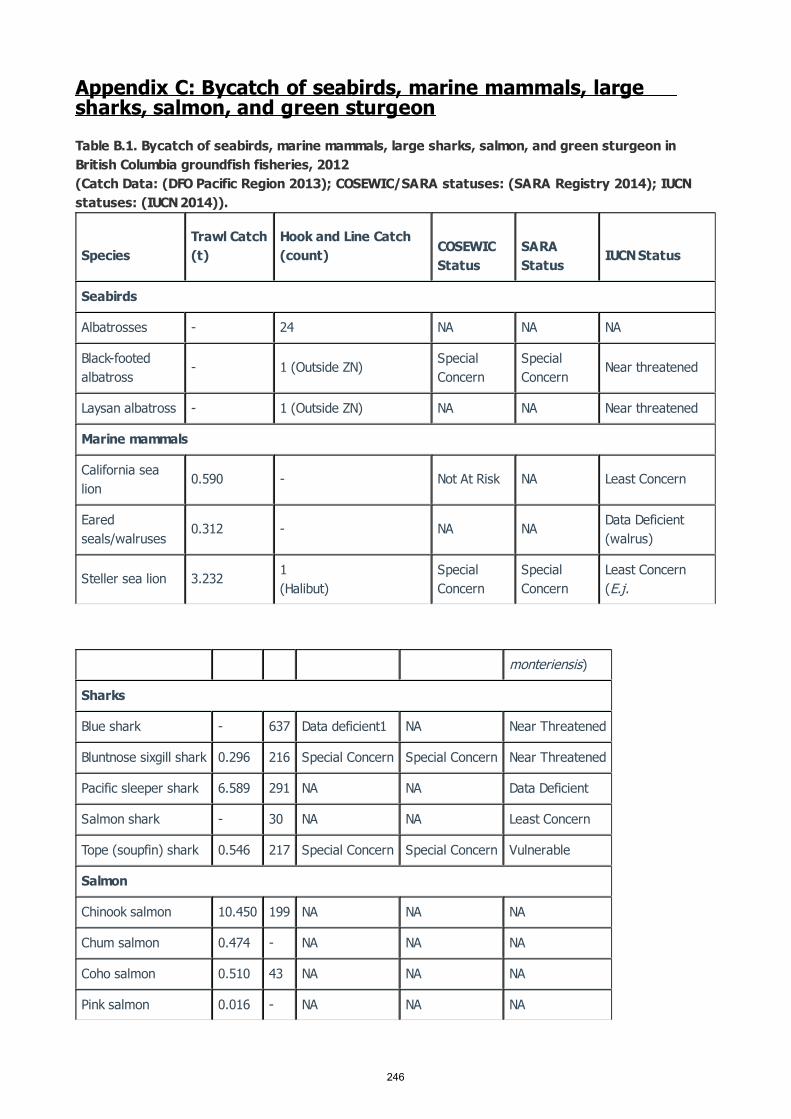
Appendix C: Bycatch of seabirds, marine mammals, largesharks, salmon, and green sturgeonTable B.1. Bycatch of seabirds, marine mammals, large sharks, salmon, and green sturgeon inBritish Columbia groundfish fisheries, 2012(Catch Data: (DFO Pacific Region 2013); COSEWIC/SARA statuses: (SARA Registry 2014); IUCNstatuses: (IUCN 2014)).
SpeciesTrawl Catch(t)
Hook and Line Catch(count) COSEWIC
StatusSARAStatus
IUCN Status
Seabirds
Albatrosses - 24 NA NA NA
Black-footedalbatross
- 1 (Outside ZN) SpecialConcern
SpecialConcern
Near threatened
Laysan albatross - 1 (Outside ZN) NA NA Near threatened
Marine mammals
California sealion
0.590 - Not At Risk NA Least Concern
Earedseals/walruses
0.312 - NA NA Data Deficient(walrus)
Steller sea lion 3.232 1(Halibut)
SpecialConcern
SpecialConcern
Least Concern(E.j.
monteriensis)
Sharks
Blue shark - 637 Data deficient1 NA Near Threatened
Bluntnose sixgill shark 0.296 216 Special Concern Special Concern Near Threatened
Pacific sleeper shark 6.589 291 NA NA Data Deficient
Salmon shark - 30 NA NA Least Concern
Tope (soupfin) shark 0.546 217 Special Concern Special Concern Vulnerable
Salmon
Chinook salmon 10.450 199 NA NA NA
Chum salmon 0.474 - NA NA NA
Coho salmon 0.510 43 NA NA NA
Pink salmon 0.016 - NA NA NA
246
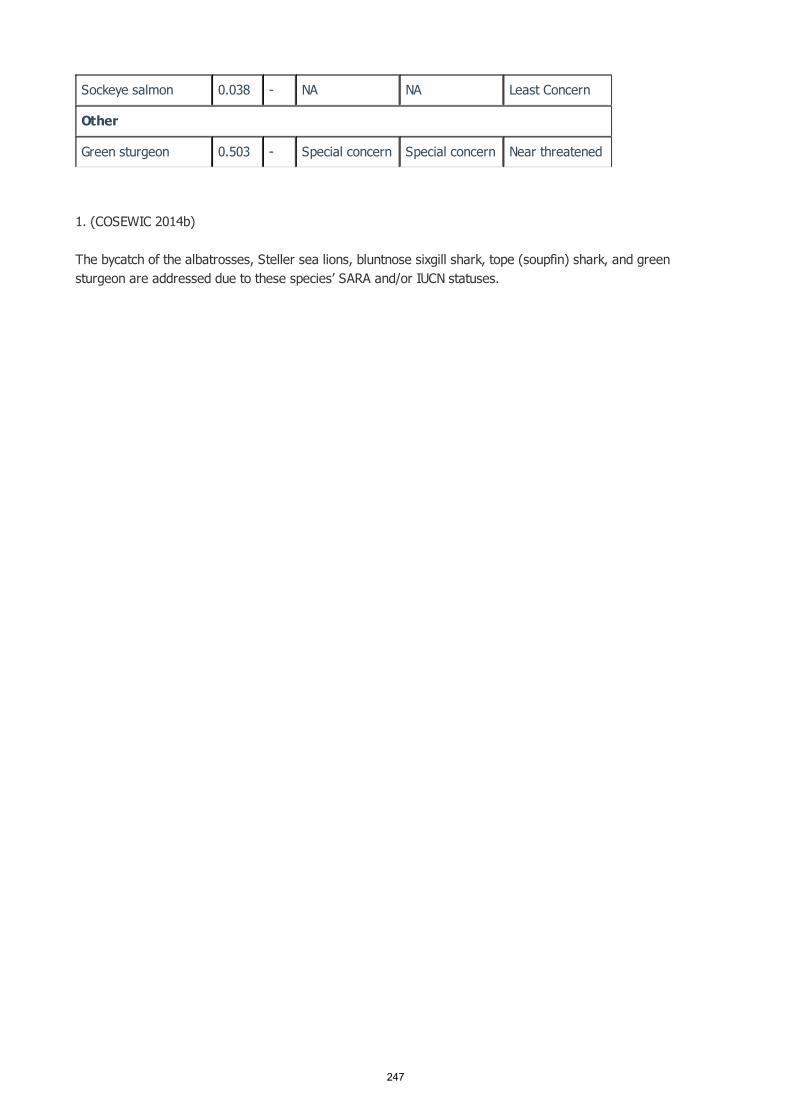
1. (COSEWIC 2014b)
The bycatch of the albatrosses, Steller sea lions, bluntnose sixgill shark, tope (soupfin) shark, and greensturgeon are addressed due to these species’ SARA and/or IUCN statuses.
Sockeye salmon 0.038 - NA NA Least Concern
Other
Green sturgeon 0.503 - Special concern Special concern Near threatened
247

Appendix D: Summary of changes made in 2016 updatereportThe 2016 update to the B.C. groundfish report consisted of the incorporation of information from new stockassessments for arrowtooth flounder, Pacific cod (Hecate Strait and Queen Charlotte Sound), Pacific halibut, andyellowtail rockfish. As a result of this new information, the Criterion 1 scores for these stocks changed as shownin Table C.1.
Table C.1. Summary of changes to relevant stock status and fishing mortality scores as a result of2016 update.
An additional gear type, midwater trawl, was also incorporated into the Criterion 4 section of the 2016 updatereport. At the time of the 2016 update, midwater trawl gear was being used to target a suite of rockfish, butcatch composition data for this gear was lacking. As a result, the “midwater trawl” fishery that was introducedin the 2016 report was assigned the same species as the “bottom trawl, hard substrate” fishery. The twofisheries differed in their Criterion 4 scores as show in Table C.2.
Table C.2. Summary of differences in Criterion 4 scores for midwater and bottom trawl (hardsubstrate) fisheries in 2016 update report.
As a result of the incorporation of the new stock status and Criterion 4 information, the overall recommendationchanged for only one stock: yellowtail rockfish, which changed from an overall “avoid” (numeric score of 2.227)to an overall “good alternative” (numeric scores 2.746 for bottom trawl and 2.919 for (midwater trawl).
StockStockstatus(2014)
Stockstatus(2016)
FishingMortality(2014)
FishingMortality(2016)
Criterion 1Ranking (2014)
Criterion 1Ranking (2016)
Arrowtoothflounder
ModerateConcern
Very LowConcern
ModerateConcern
Very LowConcern
2.64 5.00
Pacific cod ModerateConcern
HighConcern
ModerateConcern
Very LowConcern
2.64 3.16
Yellowtailrockfish
HighConcern
Very LowConcern
ModerateConcern
Very LowConcern
2.16 5.00
Pacifichalibut (C2)
LowConcern
LowConcern
Low Concern ModerateConcern
3.83 3.05
Fishery Factor 4.1 (Impacts onsubstrate)
Factor 4.2(Mitigation)
Factor 4.3(EBFM)
Criterion 4Score
Bottom trawl (hardsubstrate)
1.00 High Concern 1.00 StrongMitigation
4.00 LowConcern
2.828
Midwater trawl 3.00 Low Concern 0.25 MinimalMitigation
4.00 LowConcern
3.606
248