brink's q3 2016 earnings slides
TRANSCRIPT

October 26, 2016
Third Quarter 2016 Earnings Call
Secure Logistics. Worldwide.
2
Safe Harbor Statement & Non-GAAP Results
These materials contain forward-looking information. Words such as "anticipate," "assume," "estimate," "expect," “target” "project," "predict," "intend," "plan," "believe," "potential," "may," "should" and similar expressions may identify forward-looking information. Forward-looking information in these materials includes, but is not limited to: 2016 GAAP and non-GAAP outlook, including revenue, currency impact on revenue, organic growth, operating profit, earnings per share, currency translation impact, tax rate and capital expenditures; margin rate outlook (including for the U.S. and Mexico businesses); adjusted EBITDA and multiple; and expectations regarding future cash payments to the primary U.S. pension plan and related to UMWA liabilities; and expected cost savings from reorganization and restructuring activities. Forward-looking information in this document is subject to known and unknown risks, uncertainties and contingencies, which are difficult to predict or quantify, and which could cause actual results, performance or achievements to differ materially from those that are anticipated. These risks, uncertainties and contingencies, many of which are beyond our control, include, but are not limited to:
Our ability to improve profitability in our largest five markets; our ability to identify and execute further cost and operational improvements and efficiencies in our core businesses; our ability to improve service levels and quality in our core business; continuing market volatility and commodity price fluctuations and their impact on the demand for our services; our ability to maintain or improve volumes at favorable pricing levels and increase cost and productivity efficiencies, particularly in the United States and Mexico; investments in information technology and adjacent businesses and their impact on revenue and profit growth; our ability to develop and implement solutions for our customers and gain market acceptance of those solutions; our ability to maintain an effective IT infrastructure and safeguard confidential information; risks customarily associated with operating in foreign countries including changing labor and economic conditions, currency restrictions and devaluations, safety and security issues, political instability, restrictions on, and cost of, repatriation of earnings and capital, nationalization, expropriation and other forms of restrictive government actions; the strength of the U.S. dollar relative to foreign currencies and foreign currency exchange rates; regulatory and labor issues in many of our global operations, including negotiations with organized labor and the possibility of work stoppages; our ability to integrate successfully recently acquired companies and improve their operating profit margins; costs related to dispositions and market exits; our ability to identify evaluate and pursue acquisitions and other strategic opportunities, including those in the home security industry and emerging markets; the willingness of our customers to absorb fuel surcharges and other future price increases; our ability to obtain necessary information technology and other services at favorable pricing levels from third party service providers; variations in costs or expenses and performance delays of any public or private sector supplier, service provider or customer; our ability to obtain appropriate insurance coverage, positions taken by insurers with respect to claims made and the financial condition of insurers, safety and security performance, our loss experience, and changes in insurance costs; costs associated with the purchase and implementation of cash processing and security equipment; employee and environmental liabilities in connection with our former coal operations, including black lung claims incidence; the impact of the Patient Protection and Affordable Care Act on UMWA and black lung liability and the Company's ongoing operations; changes to estimated liabilities and assets in actuarial assumptions due to payments made, investment returns, interest rates and annual actuarial revaluations, the funding requirements, accounting treatment, investment performance and costs and expenses of our pension plans, the VEBA and other employee benefits, mandatory or voluntary pension plan contributions; the nature of our hedging relationships; counterparty risk; changes in estimates and assumptions underlying our critical accounting policies; our ability to realize deferred tax assets; the outcome of pending and future claims, litigation, and administrative proceedings; public perception of the Company's business and reputation; access to the capital and credit markets; seasonality, pricing and other competitive industry factors; and the promulgation and adoption of new accounting standards and interpretations, new government regulations and interpretation of existing regulations.
This list of risks, uncertainties and contingencies is not intended to be exhaustive. Additional factors that could cause our results to differ materially from those described in the forward-looking statements can be found under "Risk Factors" in Item 1A of our Annual Report on Form 10-K for the period ended December 31, 2015, and in our other public filings with the Securities and Exchange Commission. The forward-looking information discussed today and included in these materials is representative as of today only and The Brink's Company undertakes no obligation to update any information contained in this document.
These materials are copyrighted and may not be used without written permission from Brink's.
Today’s presentation is focused primarily on non-GAAP results. Detailed reconciliations of non-GAAP to GAAP results are provided in the appendix.

October 26, 2016
Third Quarter 2016 Earnings Call
Secure Logistics. Worldwide.
4
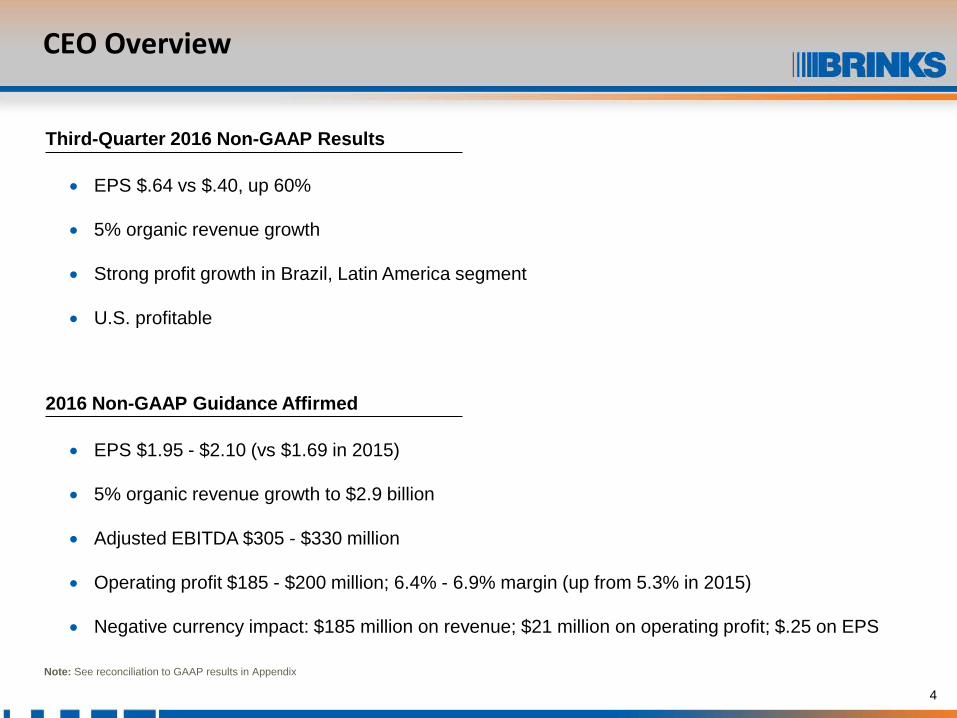
• EPS $.64 vs $.40, up 60%
• 5% organic revenue growth
• Strong profit growth in Brazil, Latin America segment
• U.S. profitable
CEO Overview
Note: See reconciliation to GAAP results in Appendix
Third-Quarter 2016 Non-GAAP Results
• EPS $1.95 - $2.10 (vs $1.69 in 2015)
• 5% organic revenue growth to $2.9 billion
• Adjusted EBITDA $305 - $330 million
• Operating profit $185 - $200 million; 6.4% - 6.9% margin (up from 5.3% in 2015)
• Negative currency impact: $185 million on revenue; $21 million on operating profit; $.25 on EPS
2016 Non-GAAP Guidance Affirmed
5
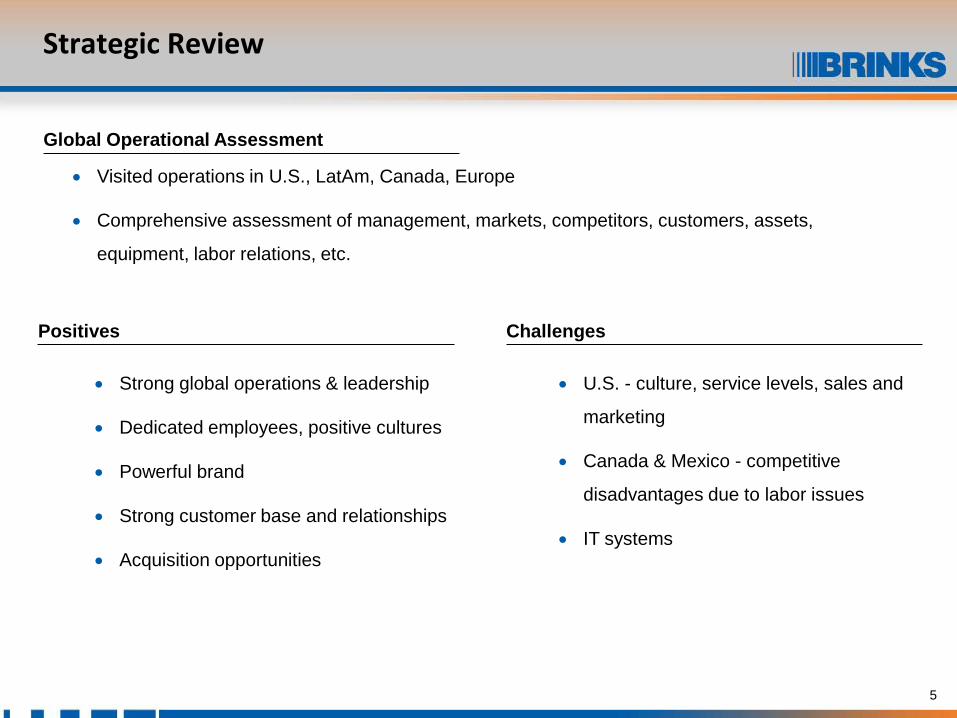
• Visited operations in U.S., LatAm, Canada, Europe
• Comprehensive assessment of management, markets, competitors, customers, assets,
equipment, labor relations, etc.
• Strong global operations & leadership
• Dedicated employees, positive cultures
• Powerful brand
• Strong customer base and relationships
• Acquisition opportunities
Strategic Review
Positives
• U.S. - culture, service levels, sales and
marketing
• Canada & Mexico - competitive
disadvantages due to labor issues
• IT systems
Challenges
Global Operational Assessment

6
• Achieve 2016 targets
• Complete strategic review and assessment
• Develop 3-year strategic plan with performance targets and metrics
• Communicate plan at Investor Day
• Execute and win
Next Steps
Restore Investor Confidence
7
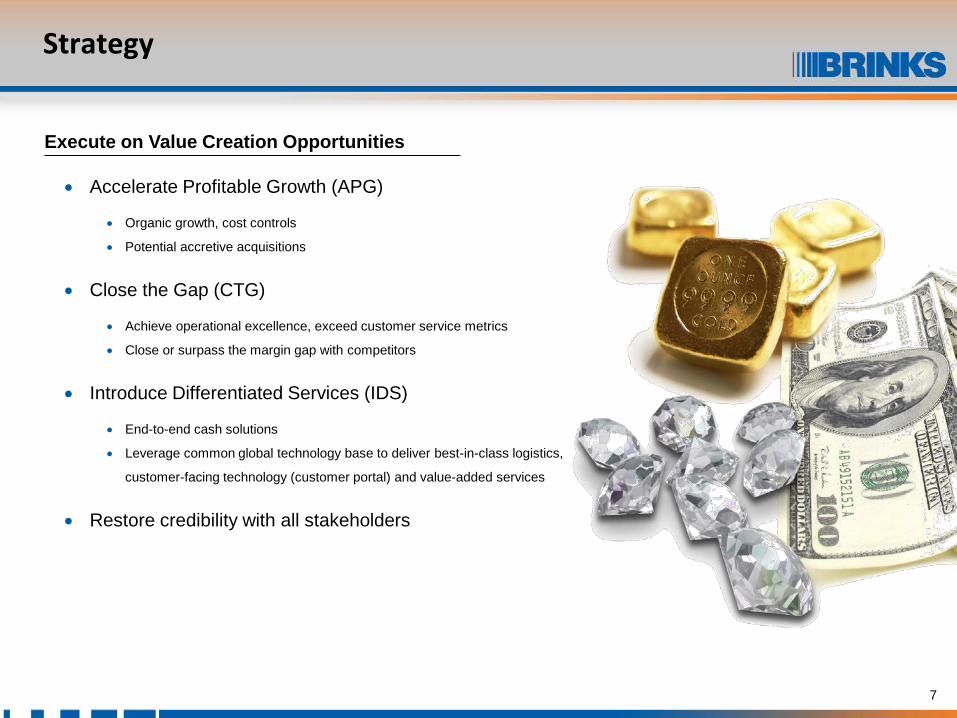
• Accelerate Profitable Growth (APG)
• Organic growth, cost controls
• Potential accretive acquisitions
• Close the Gap (CTG)
• Achieve operational excellence, exceed customer service metrics
• Close or surpass the margin gap with competitors
• Introduce Differentiated Services (IDS)
• End-to-end cash solutions
• Leverage common global technology base to deliver best-in-class logistics,
customer-facing technology (customer portal) and value-added services
• Restore credibility with all stakeholders
Strategy
Execute on Value Creation Opportunities
8
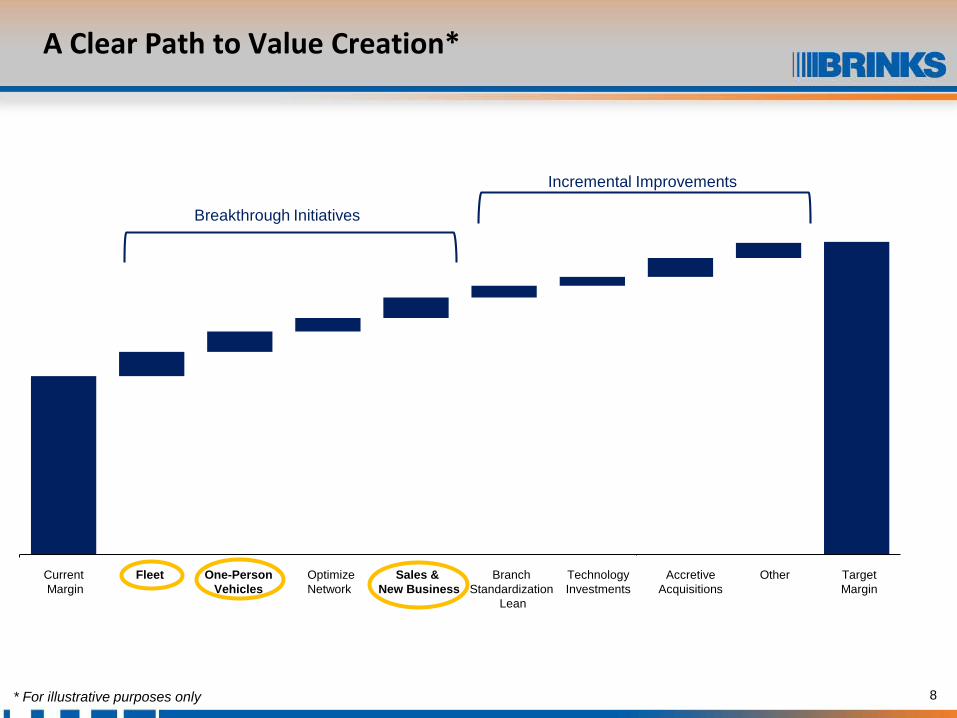
A Clear Path to Value Creation*
Incremental Improvements
Breakthrough Initiatives
Sales & New Business
Branch Standardization
Lean
TechnologyInvestments
AccretiveAcquisitions
OtherFleet One-PersonVehicles
OptimizeNetwork
Current Margin
TargetMargin
* For illustrative purposes only

Financial Review
Secure Logistics. Worldwide.

10
$740
$701
$735 ($29)
($10)
$34
Non-GAAP Revenue: 2016 vs 2015
($ Millions)
Third-Quarter
Nine Months
(4%) 5%
4%(8%)
OrganicAdjusted
2015 RevenueCurrency Acq/Disp2015
Revenue2016
Revenue
Note: See reconciliation to GAAP results in Appendix
(1%)% Change
% Change (1%)
$2,244 ($169) $2,140$94$2,047($28)
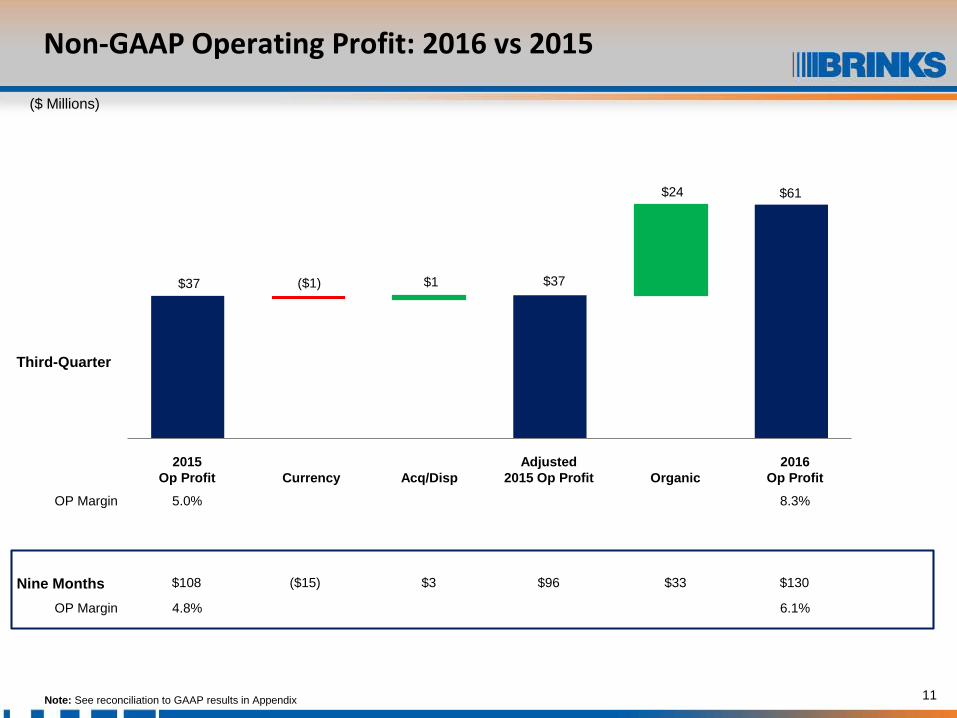
11
Non-GAAP Operating Profit: 2016 vs 2015
($ Millions)
Third-Quarter
OrganicAdjusted
2015 Op ProfitCurrency Acq/Disp2015
Op Profit2016
Op Profit
$37 $37
$61
($1) $1
$24
5.0% 8.3%
Note: See reconciliation to GAAP results in Appendix
OP Margin
Nine Months6.1%4.8%OP Margin
$108 ($15) $130$33$96$3
12
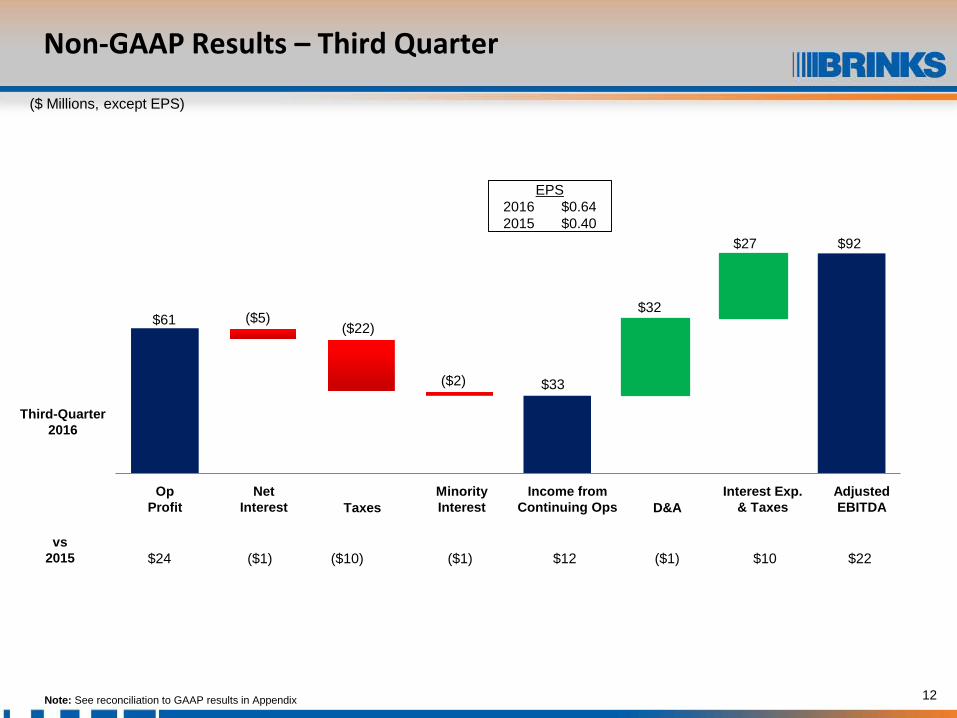
Non-GAAP Results – Third Quarter
($ Millions, except EPS)
Net Interest Taxes
Op Profit
Income from Continuing Ops D&A
MinorityInterest
AdjustedEBITDA
Interest Exp.& Taxes
($22)
($2) $33
$32
$27 $92
($5)$61
EPS2016 $0.642015 $0.40
Note: See reconciliation to GAAP results in Appendix
($1) ($10)$24 $12 ($1)($1) $22$10
Third-Quarter2016
vs2015
13
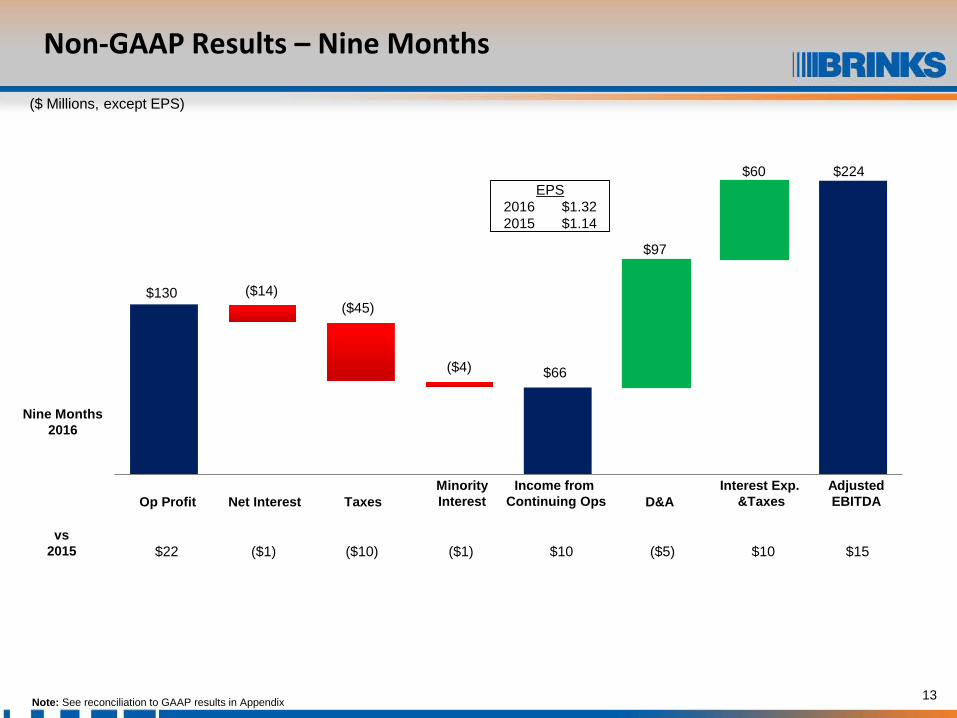
Non-GAAP Results – Nine Months
($ Millions, except EPS)
Nine Months2016
$130 ($14)($45)
($4) $66
$97
$60 $224
Net Interest TaxesOp ProfitIncome from
Continuing Ops D&AMinorityInterest
Interest Exp.&Taxes
Note: See reconciliation to GAAP results in Appendix
AdjustedEBITDA
($1) ($10)$22 $10 ($5)($1) $10 $15vs
2015
EPS2016 $1.322015 $1.14

14
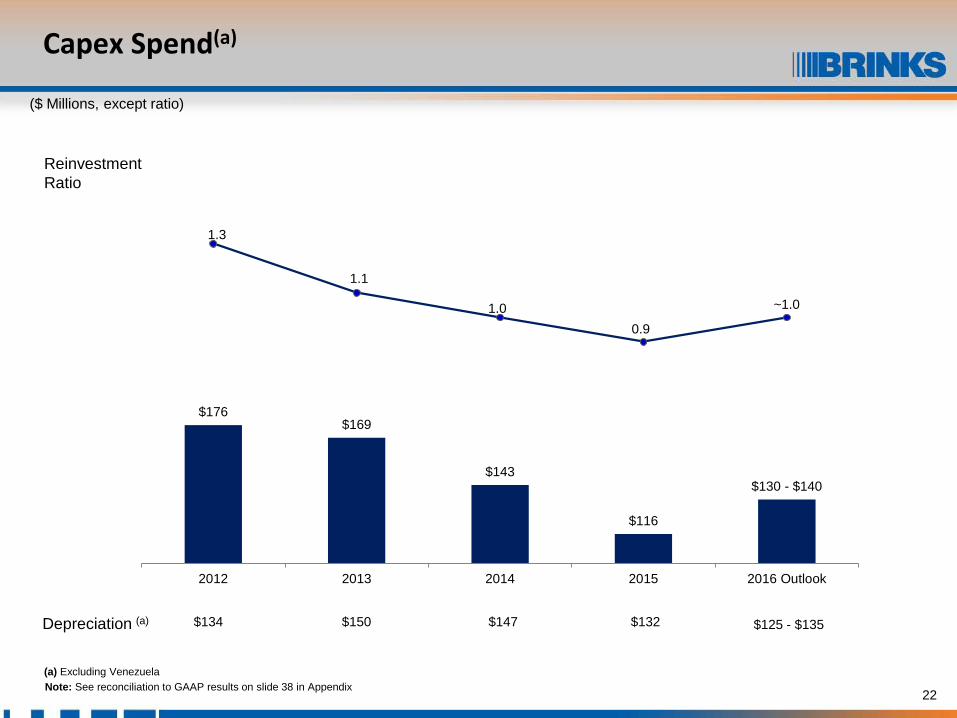
Capital Expenditures
($ Millions)
Note: See reconciliation to GAAP results in Appendix
Depreciation & Amortization $ 147 132 125-135Reinvestment Ratio 1.0 0.9 ~1.0
Cash 131 97 95-105Capital Lease 12 19 ~35 Total $ 143 116 130-140
$143
$116
$130 - $140
2014 2015 2016Outlook
Compusafe
Facility
Equipment / Other
IT
Armored Vehicle
15
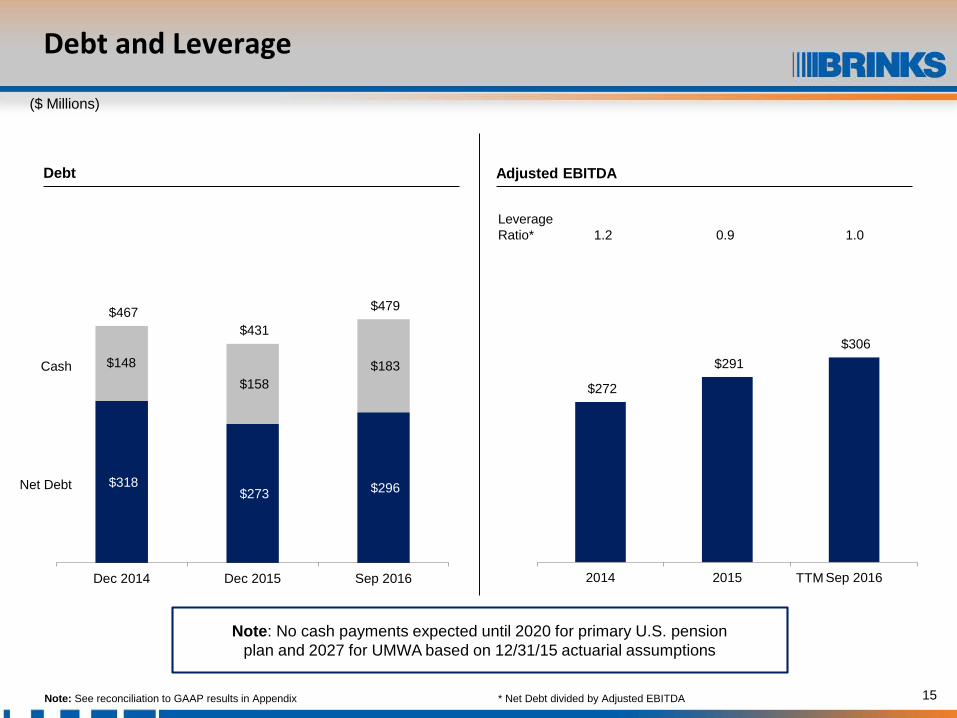
$272
$291 $306
2014 2015 Sep 2016
Debt and Leverage
($ Millions)
LeverageRatio* 1.2 0.9 1.0
Note: No cash payments expected until 2020 for primary U.S. pension plan and 2027 for UMWA based on 12/31/15 actuarial assumptions
$318 $273 $296
$148 $158
$183
$467 $431
$479
Dec 2014 Dec 2015 Sep 2016
Cash
Net Debt
Note: See reconciliation to GAAP results in Appendix
TTM
Debt Adjusted EBITDA
* Net Debt divided by Adjusted EBITDA
16
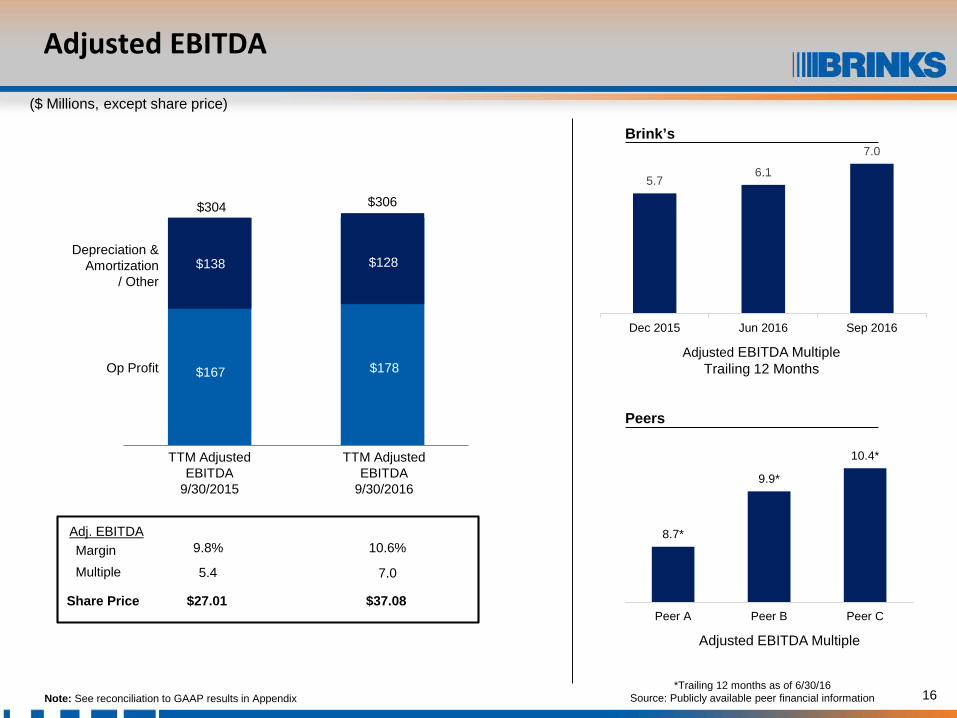
$304 $306
Adjusted EBITDA
($ Millions, except share price)
$167Adjusted EBITDA Multiple
Trailing 12 Months
Adjusted EBITDA Multiple
$178
$138 $128
9.8%Margin 10.6%
Multiple 5.4 7.0
Note: See reconciliation to GAAP results in Appendix*Trailing 12 months as of 6/30/16
Source: Publicly available peer financial information
Share Price $27.01 $37.08
Adj. EBITDA
Brink’s
Peers
8.7*
9.9*
10.4*
Peer A Peer B Peer C
5.76.1
7.0
Dec 2015 Jun 2016 Sep 2016
TTM AdjustedEBITDA
9/30/2015
TTM AdjustedEBITDA
9/30/2016
Depreciation &Amortization
/ Other
Op Profit $167 $178
$138 $128
17
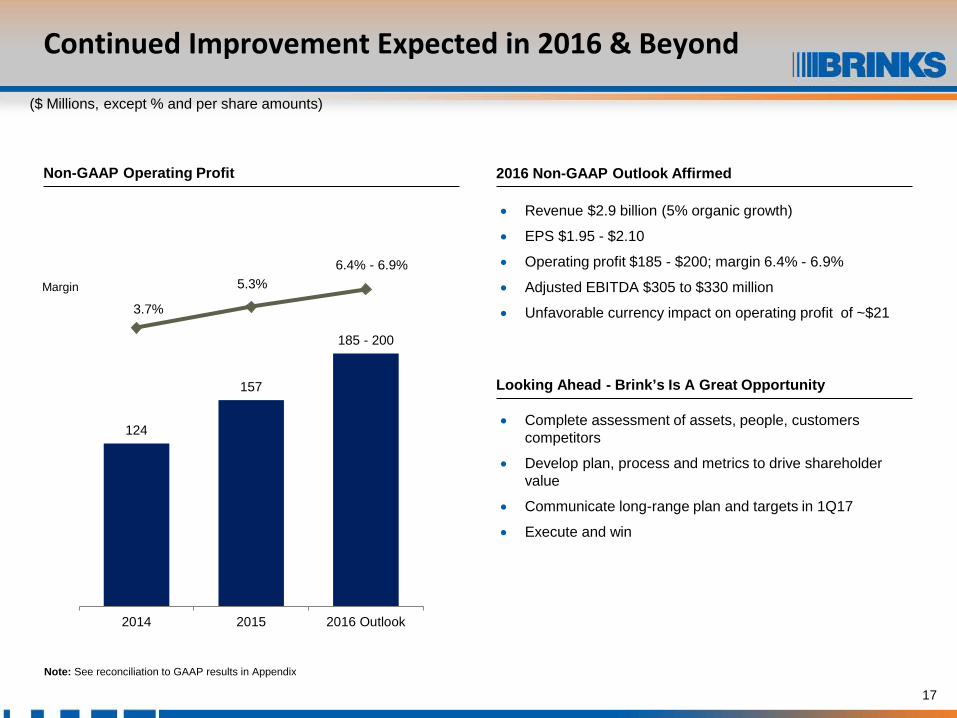
124
157
185 - 200
3.7%
5.3%6.4% - 6.9%
2014 2015 2016 Outlook
-20
-15
-10
-5
0
5
10
-25
25
75
125
175
225
275
2014 2015 2016 Outlook
Note: See reconciliation to GAAP results in Appendix
Continued Improvement Expected in 2016 & Beyond
Non-GAAP Operating Profit
Margin
2016 Non-GAAP Outlook Affirmed
• Revenue $2.9 billion (5% organic growth)
• EPS $1.95 - $2.10
• Operating profit $185 - $200; margin 6.4% - 6.9%
• Adjusted EBITDA $305 to $330 million
• Unfavorable currency impact on operating profit of ~$21
($ Millions, except % and per share amounts)
Looking Ahead - Brink’s Is A Great Opportunity
• Complete assessment of assets, people, customers competitors
• Develop plan, process and metrics to drive shareholder value
• Communicate long-range plan and targets in 1Q17
• Execute and win

October 26, 2016
Third Quarter 2016 Earnings Call
Secure Logistics. Worldwide.

Appendix

20
Note: See reconciliation to GAAP results on slides 29, 30, 32, 35-37(a) Attributable to Brink’s
Non-GAAP 2016 Outlook
201520142016
Outlook
Revenue $3,351 $2,977 ~$2,900
Op profit 124 157 185 – 200
Interest/Other Income (22) (15) (17)
Taxes (47) (52) (66– 71)
Noncontrolling interests (6) (5) (5 -7)
Income from continuing ops (a) 49 84 97– 107
EPS Range $1.01 $1.69 $1.95 – $2.10
20152016
Outlook2014
Key MetricsRevenue change
Organic $85 3% $142 5%Acq./Disp. 9 - (34) (1)%Currency (467) (14)% (185) (6)%Total $(374) (11)% $(77) (3)%
Margin 3.7% 5.3% 6.4% - 6.9%Tax rate 45.7% 37.0% ~39%
U.S. margin 3.1% 2.1% 0.7% - 2%Mexico margin 2.5% 7.3% ~6%
Adjusted EBITDA $272 $291 $305 - $330Adjusted ETBITDA % 8.1% 9.8% 10.5% - 11.4%
($ Millions, except EPS)
21
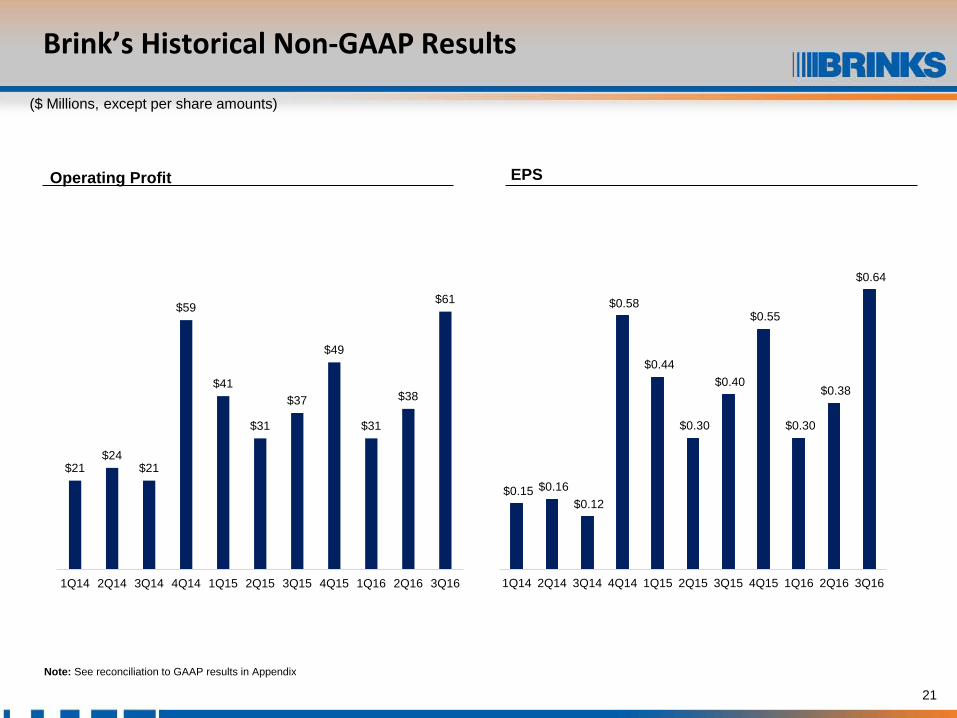
$21$24
$21
$59
$41
$31
$37
$49
$31
$38
$61
1Q14 2Q14 3Q14 4Q14 1Q15 2Q15 3Q15 4Q15 1Q16 2Q16 3Q16
$0.15 $0.16 $0.12
$0.58
$0.44
$0.30
$0.40
$0.55
$0.30
$0.38
$0.64
1Q14 2Q14 3Q14 4Q14 1Q15 2Q15 3Q15 4Q15 1Q16 2Q16 3Q16
Brink’s Historical Non-GAAP Results
($ Millions, except per share amounts)
($)
Operating Profit EPS
Note: See reconciliation to GAAP results in Appendix
22
Capex Spend(a)
($ Millions, except ratio)
(a) Excluding Venezuela
$176$169
$143
$116
$130 - $140
1.3
1.1
1.00.9
~1.0
0.000.010.020.030.040.050.060.070.080.090.100.110.120.130.140.150.160.170.180.190.200.210.220.230.240.250.260.270.280.290.300.310.320.330.340.350.360.370.380.390.400.410.420.430.440.450.460.470.480.490.500.510.520.530.540.550.560.570.580.590.600.610.620.630.640.650.660.670.680.690.700.710.720.730.740.750.760.770.780.790.800.810.820.830.840.850.860.870.880.890.900.910.920.930.940.950.960.970.980.991.001.011.021.031.041.051.061.071.081.091.101.111.121.131.141.151.161.171.181.191.201.211.221.231.241.251.261.271.281.291.301.311.321.331.341.351.361.371.381.391.401.411.421.431.441.451.461.471.481.491.501.511.521.531.541.551.561.571.581.591.601.611.621.631.641.651.661.671.681.691.70
100
150
200
250
300
2012 2013 2014 2015 2016 Outlook
Reinvestment Ratio
Depreciation (a) $150$134 $147 $132 $125 - $135
Note: See reconciliation to GAAP results on slide 38 in Appendix
23
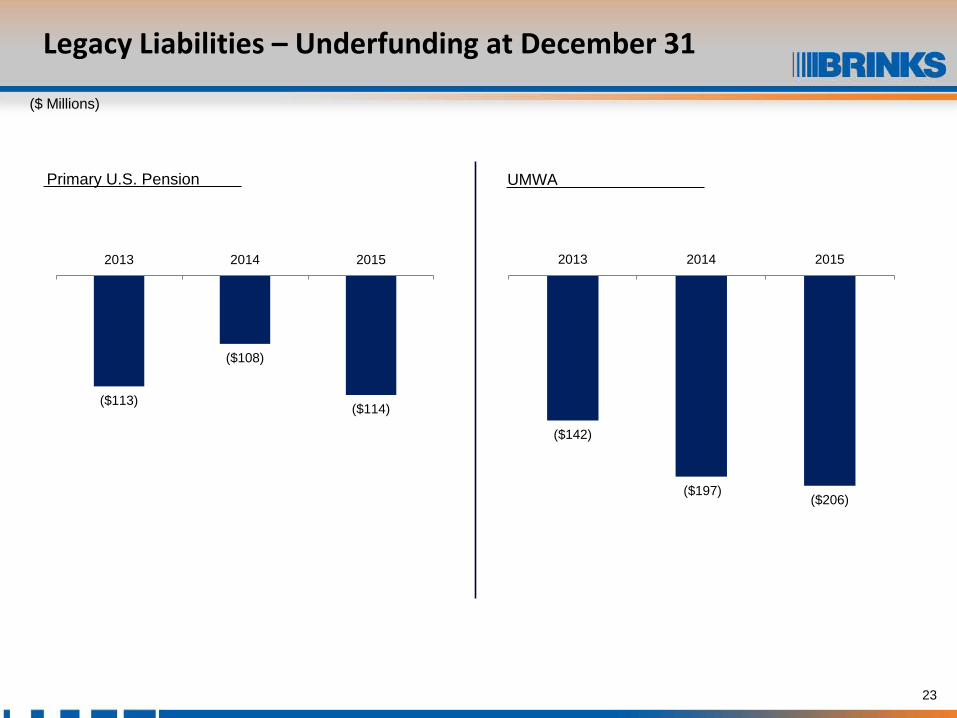
Legacy Liabilities – Underfunding at December 31
($ Millions)
Primary U.S. Pension UMWA
($113)
($108)
($114)
2013 2014 2015
Primary U.S. Pension
($142)
($197)($206)
2013 2014 2015
UMWA
24
Estimated Cash Payments: $0 to Primary U.S. Pension until 2020 $0 to UMWA until 2027
($ Millions)
Payments to Primary U.S. Pension Payments to UMWA
• Prepaid 2015 and 2016 pension payments in 3Q14 − Accelerated de-risking of invested asset allocation− Reduced PBGC premiums (current borrowing costs are lower than PBGC premiums)− No cash payments expected until 2020 based on actuarial assumptions at 12/31/2015− Remeasurement occurs every year-end with 10K filing
• No cash payments to UMWA expected until 2027
$0
$9
$21
$17
$5
2015 2020 2021 2022 2023
$0
$3
2015 2027

Segment Results and Non-GAAP Results Reconciled to GAAP

26
Other Items Not Allocated to Segments
The Brink’s Company and subsidiariesOther Items Not Allocated to Segments (Unaudited) (In millions)
Brink’s measures its segment results before income and expenses for corporate activities and for certain other items. A summary of the other items not allocated to segment results is below.
2015 2016
1Q 2Q 3Q 4Q Full Year 1Q 2Q 3QNine
Months
Revenues:Venezuela operations $ 20.5 12.2 19.3 32.5 84.5 $ 32.1 21.5 20.4 74.0 Acquisitions and dispositions - - - - - 0.8 1.5 0.5 2.8
Revenues $ 20.5 12.2 19.3 32.5 84.5 $ 32.9 23.0 20.9 76.8
Operating profit:
Venezuela operations $ (17.9) (39.1) (0.8) 10.1 (47.7) $ 1.8 0.9 1.7 4.4
Reorganization and Restructuring (1.5) 1.2 (2.9) (12.1) (15.3) (6.0) (2.1) (2.3) (10.4)
U.S. and Mexican retirement plans (8.3) (7.6) (8.0) (7.3) (31.2) (7.3) (8.1) (7.9) (23.3)
Acquisitions and dispositions - 0.3 - (6.3) (6.0) (5.8) (6.5) (2.2) (14.5)
Operating profit $ (27.7) (45.2) (11.7) (15.6) (100.2) $ (17.3) (15.8) (10.7) (43.8)
27
Other Items Not Allocated to Segments
The Brink’s Company and subsidiariesOther Items Not Allocated to Segments (Unaudited)
Venezuela operations We have excluded from our segment results all of our Venezuela operating results, including expenses related to currency devaluations of $11.2 million and $30.4 million in the first nine months of 2016 and 2015, respectively, due to management’s inability to allocate, generate or redeploy resources in-country or globally. In light of these unique circumstances, our operations in Venezuela are largely independent of the rest of our global operations. As a result, the Chief Executive Officer, the Company's Chief Operating Decision Maker ("CODM"), assesses segment performance and makes resource decisions by segment excluding Venezuela operating results. Additionally, management believes excluding Venezuela from segment results makes it possible to more effectively evaluate the company’s performance between periods.
Factors considered by management in excluding Venezuela results include: • Continued inability to repatriate cash to redeploy to other operations or dividend to shareholders • Highly inflationary environment• Fixed exchange rate policy • Continued currency devaluations and • Difficulty raising prices and controlling costs
Reorganization and Restructuring Brink’s reorganized and restructured its business in December 2014, eliminating the management roles and structures in its former Latin America and EMEA regions and implementing a plan to reduce the cost structure of various country operations by eliminating approximately 1,700 positions across its global workforce. Severance costs of $21.8 million associated with these actions were recognized in 2014. An additional $1.2 million was recognized in the first nine months of 2015 related to the 2014 restructuring. The restructuring saved annual direct costs of approximately $50 million in 2015 compared to 2014, excluding charges for severance, lease termination and accelerated depreciation. Brink's initiated an additional restructuring of its business in the third quarter of 2015. We recognized $5.3 million of costs in the first nine months of 2016 related to employee severance, contract terminations and lease terminations associated with the 2015 restructuring, which is expected to reduce the global workforce by approximately 1,100 positions and is projected to result in $20 to $25 million in 2016 cost savings. In the fourth quarter of 2015, we recognized $1.8 million in charges related to Executive Leadership and Board of Directors restructuring actions, which were announced in January 2016. We recognized $4.3 million in charges in the first nine months of 2016 related to the Executive Leadership and Board of Directors restructuring actions. Due to the unique circumstances around these charges, they have not been allocated to segment results and are excluded from non-GAAP results.
U.S. and Mexican retirement plans Because our U.S. retirement plans are frozen, costs related to these plans have not been allocated to segment results. Mexico is the only operating segment in which employee termination benefits are accounted for as retirement benefits under FASB ASC Topic 715, Compensation — Retirement Benefits. As a result, settlement charges related to these termination benefits have not been allocated to segment results.

28
Other Items Not Allocated to Segments
The Brink’s Company and subsidiariesOther Items Not Allocated to Segments (Unaudited)
Acquisitions and dispositions dispositions Certain acquisition and disposition items that are not considered part of the ongoing activities of the business and are special in nature are consistently excluded from non-GAAP results. Due to management's decision in the first quarter of 2016 to exit the Republic of Ireland, the prospective impacts of shutting down this operation are included in items not allocated to segments and are excluded from the operating segments effective March 1, 2016. This activity is also excluded from the consolidated non-GAAP results. Beginning May 1, 2016, due to management's decision to also exit Northern Ireland, the results of shutting down these operations are treated similarly to the Republic of Ireland. Revenues from both Ireland operations to be shut down in 2016 were approximately $20 million in 2015. Charges included in our GAAP results include $4.8 million in severance costs, $2.0 million in property impairment charges, lease restructuring charges of $0.5 million and an additional $5.3 million in operating and other exit costs. These costs have been excluded from our segment and our consolidated non-GAAP results. International shipments to and from Ireland will continue to be provided through Brink's Global Services ("BGS"). We also recognized a $2.0 million loss related to the sale of corporate assets in the second quarter of 2016.
29
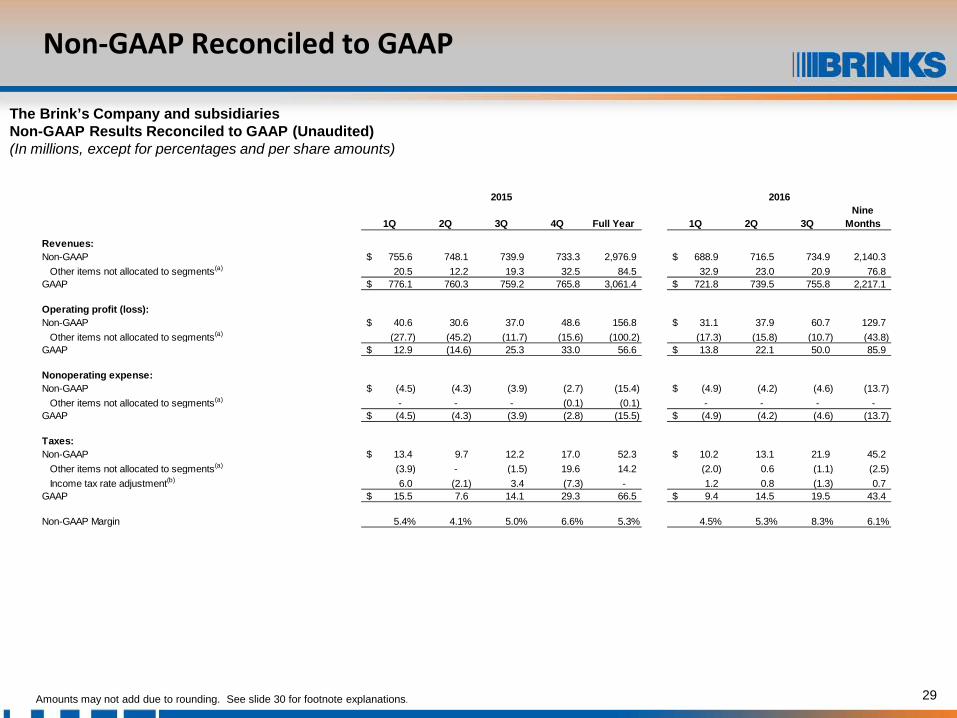
Non-GAAP Reconciled to GAAP
The Brink’s Company and subsidiariesNon-GAAP Results Reconciled to GAAP (Unaudited) (In millions, except for percentages and per share amounts)
Amounts may not add due to rounding. See slide 30 for footnote explanations.
1Q 2Q 3Q 4Q Full Year 1Q 2Q 3QNine
Months
Revenues:Non-GAAP 755.6$ 748.1 739.9 733.3 2,976.9 688.9$ 716.5 734.9 2,140.3
Other items not allocated to segments(a) 20.5 12.2 19.3 32.5 84.5 32.9 23.0 20.9 76.8 GAAP 776.1$ 760.3 759.2 765.8 3,061.4 721.8$ 739.5 755.8 2,217.1
Operating profit (loss):Non-GAAP 40.6$ 30.6 37.0 48.6 156.8 31.1$ 37.9 60.7 129.7
Other items not allocated to segments(a) (27.7) (45.2) (11.7) (15.6) (100.2) (17.3) (15.8) (10.7) (43.8) GAAP 12.9$ (14.6) 25.3 33.0 56.6 13.8$ 22.1 50.0 85.9
Nonoperating expense:Non-GAAP (4.5)$ (4.3) (3.9) (2.7) (15.4) (4.9)$ (4.2) (4.6) (13.7)
Other items not allocated to segments(a) - - - (0.1) (0.1) - - - - GAAP (4.5)$ (4.3) (3.9) (2.8) (15.5) (4.9)$ (4.2) (4.6) (13.7)
Taxes:Non-GAAP 13.4$ 9.7 12.2 17.0 52.3 10.2$ 13.1 21.9 45.2
Other items not allocated to segments(a) (3.9) - (1.5) 19.6 14.2 (2.0) 0.6 (1.1) (2.5) Income tax rate adjustment(b) 6.0 (2.1) 3.4 (7.3) - 1.2 0.8 (1.3) 0.7
GAAP 15.5$ 7.6 14.1 29.3 66.5 9.4$ 14.5 19.5 43.4
Non-GAAP Margin 5.4% 4.1% 5.0% 6.6% 5.3% 4.5% 5.3% 8.3% 6.1%
2015 2016

30
Non-GAAP Reconciled to GAAP
The Brink’s Company and subsidiariesNon-GAAP Results Reconciled to GAAP (Unaudited) (In millions, except for percentages and per share amounts)
a) See “Other Items Not Allocated To Segments” on slides 26-28 for pretax amounts and details. Other Items Not Allocated To Segments for noncontrolling interests, income from continuing operations attributable to Brink's and EPS are the effects of the same items at their respective line items of the consolidated statements of operations.
b) Non-GAAP income from continuing operations and non-GAAP EPS have been adjusted to reflect an effective income tax rate in each interim period equal to the full-year non-GAAP effective income tax rate. The full-year non-GAAP effective tax rate is estimated at 39.0% for 2016 and was 37.0% for 2015.
c) For non-GAAP EPS on a constant currency basis, EPS is calculated for the most recent period at the prior period's foreign currency rates to eliminate the currency impact on EPS.
Amounts may not add due to rounding.
1Q 2Q 3Q 4Q Full Year 1Q 2Q 3QNine
Months
Noncontrolling interests:Non-GAAP 0.8$ 1.8 0.8 1.5 4.9 1.1$ 1.6 1.7 4.4
Other items not allocated to segments(a) (6.2) (16.5) (1.4) 2.9 (21.2) 1.1 1.2 (0.2) 2.1 Income tax rate adjustment(b) (1.1) 1.2 0.2 (0.3) - 0.4 0.3 (0.1) 0.6
GAAP (6.5)$ (13.5) (0.4) 4.1 (16.3) 2.6$ 3.1 1.4 7.1
Income from continuing operations attributable to Brink's:Non-GAAP 21.9$ 14.8 20.1 27.4 84.2 14.9$ 19.0 32.5 66.4
Other items not allocated to segments(a) (17.6) (28.7) (8.8) (38.2) (93.3) (16.4) (17.6) (9.4) (43.4) Income tax rate adjustment(b) (4.9) 0.9 (3.6) 7.6 - (1.6) (1.1) 1.4 (1.3)
GAAP (0.6) (13.0) 7.7 (3.2) (9.1) (3.1) 0.3 24.5 21.7 Discontinued operations (2.4) 0.1 (0.1) (0.4) (2.8) - - - -
Net income (loss) attributable to Brink's (3.0)$ (12.9) 7.6 (3.6) (11.9) (3.1)$ 0.3 24.5 21.7
EPS:Non-GAAP 0.44$ 0.30 0.40 0.55 1.69 0.30$ 0.38 0.64 1.32
Other items not allocated to segments(a) (0.36) (0.58) (0.18) (0.77) (1.87) (0.33) (0.34) (0.20) (0.87) Income tax rate adjustment(b) (0.10) 0.02 (0.07) 0.15 - (0.03) (0.02) 0.03 (0.03)
GAAP (0.01)$ (0.26) 0.16 (0.07) (0.19) (0.06)$ 0.01 0.48 0.43
2015 2016
31
Non-GAAP Reconciled to GAAP
The Brink’s Company and subsidiariesNon-GAAP Results Reconciled to GAAP (Unaudited) (In millions, except for percentages and per share amounts)
Amounts may not add due to rounding. See slide 30 for footnote explanations.
YTD'15 YTD'16
Pre-tax TaxEffective tax
rate Pre-tax TaxEffective tax
rateEffective Income Tax Rate
Non-GAAP 95.5 35.3 37.0% 116.0 45.2 39.0%Other items not allocated to segments(a) (84.6) (5.4) (43.8) (2.5)Income tax rate adjustment(b) - 7.3 - 0.7
GAAP 10.9 37.2 341.3% 72.2 43.4 60.1%
20163Q
EPS:Constant currency basis - Non-GAAP 0.65 Effect of changes in currency exchange rates(c) (0.01)
Non-GAAP 0.64 Other items not allocated to segments(a) (0.20)Income tax rate adjustment(b) 0.03
GAAP 0.48
32
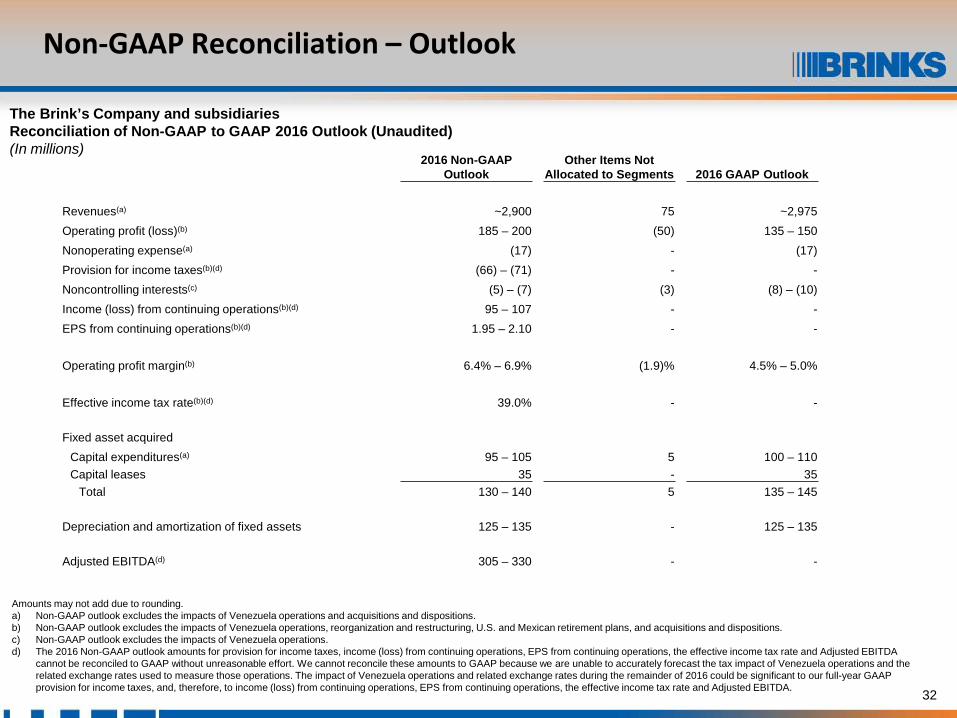
Non-GAAP Reconciliation – Outlook
The Brink’s Company and subsidiariesReconciliation of Non-GAAP to GAAP 2016 Outlook (Unaudited) (In millions)
Amounts may not add due to rounding. a) Non-GAAP outlook excludes the impacts of Venezuela operations and acquisitions and dispositions.b) Non-GAAP outlook excludes the impacts of Venezuela operations, reorganization and restructuring, U.S. and Mexican retirement plans, and acquisitions and dispositions.c) Non-GAAP outlook excludes the impacts of Venezuela operations.d) The 2016 Non-GAAP outlook amounts for provision for income taxes, income (loss) from continuing operations, EPS from continuing operations, the effective income tax rate and Adjusted EBITDA
cannot be reconciled to GAAP without unreasonable effort. We cannot reconcile these amounts to GAAP because we are unable to accurately forecast the tax impact of Venezuela operations and the related exchange rates used to measure those operations. The impact of Venezuela operations and related exchange rates during the remainder of 2016 could be significant to our full-year GAAP provision for income taxes, and, therefore, to income (loss) from continuing operations, EPS from continuing operations, the effective income tax rate and Adjusted EBITDA.
2016 Non-GAAP Outlook
Other Items Not Allocated to Segments 2016 GAAP Outlook
Revenues(a) ~2,900 75 ~2,975Operating profit (loss)(b) 185 – 200 (50) 135 – 150Nonoperating expense(a) (17) - (17)Provision for income taxes(b)(d) (66) – (71) - -Noncontrolling interests(c) (5) – (7) (3) (8) – (10)Income (loss) from continuing operations(b)(d) 95 – 107 - -EPS from continuing operations(b)(d) 1.95 – 2.10 - -
Operating profit margin(b) 6.4% – 6.9% (1.9)% 4.5% – 5.0%
Effective income tax rate(b)(d) 39.0% - -
Fixed asset acquiredCapital expenditures(a) 95 – 105 5 100 – 110Capital leases 35 - 35
Total 130 – 140 5 135 – 145
Depreciation and amortization of fixed assets 125 – 135 - 125 – 135
Adjusted EBITDA(d) 305 – 330 - -

33
Non-GAAP Reconciliation – Cash Flows
The Brink’s Company and subsidiariesNon-GAAP Reconciliations –Cash Flow (Unaudited) (In millions)
a) To adjust for the change in the balance of customer obligations related to cash received and processed in certain of our secure Cash Management Services operations. The title to this cash transfers to us for a short period of time. The cash is generally credited to customers’ accounts the following day and we do not consider it as available for general corporate purposes in the management of our liquidity and capital resources.
Non-GAAP cash flows from operating activities is a supplemental financial measure that is not required by, or presented in accordance with GAAP. The purpose of this Non-GAAP measure is to report financial information excluding cash flows from Venezuela operations, the impact of cash received and processed in certain of our Cash Management Services operations and without cash flows from discontinued operations. We believe this measure is helpful in assessing cash flows from operations, enables period-to-period comparability and is useful in predicting future operating cash flows. This Non-GAAP measure should not be considered as an alternative to cash flows from operating activities determined in accordance with GAAP and should be read in conjunction with our consolidated statements of cash flows.
2016 2015
Cash flows from operating activities - GAAP 57.0$ 90.8 Cash (inflows) outflows from Venezuela operations (14.0) (1.4) Decrease (increase) in certain customer obligations(a) 14.9 (5.1) Cash outflows related to discontinued operations - 2.0
Cash flows from operating activities - Non-GAAP basis 57.9$ 86.3
Nine Months
34
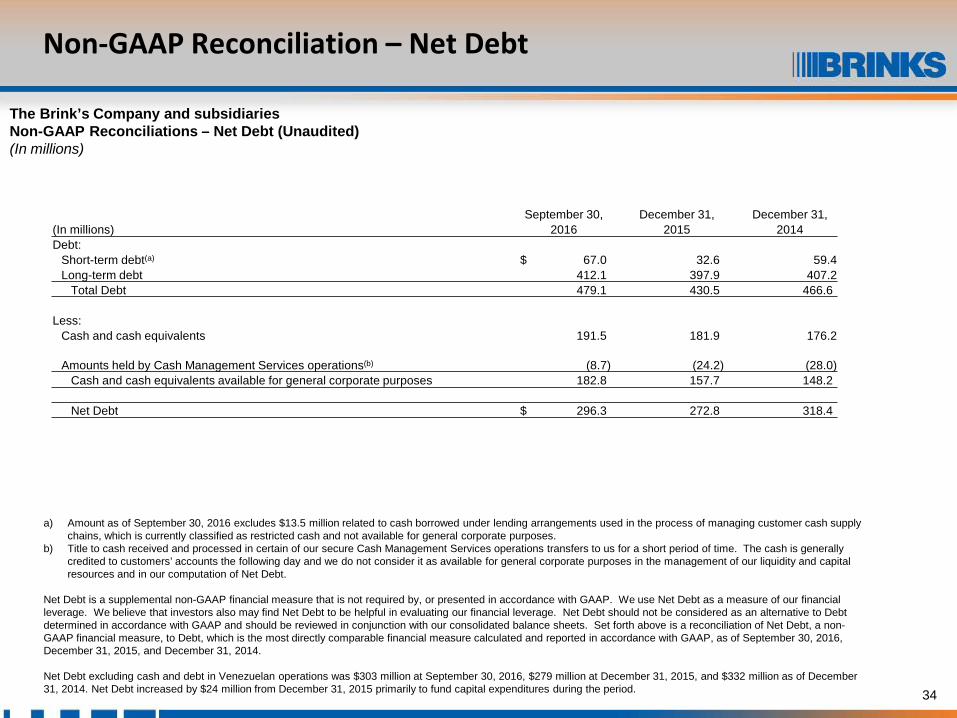
Non-GAAP Reconciliation – Net Debt
The Brink’s Company and subsidiariesNon-GAAP Reconciliations – Net Debt (Unaudited) (In millions)
a) Amount as of September 30, 2016 excludes $13.5 million related to cash borrowed under lending arrangements used in the process of managing customer cash supply chains, which is currently classified as restricted cash and not available for general corporate purposes.
b) Title to cash received and processed in certain of our secure Cash Management Services operations transfers to us for a short period of time. The cash is generally credited to customers’ accounts the following day and we do not consider it as available for general corporate purposes in the management of our liquidity and capital resources and in our computation of Net Debt.
Net Debt is a supplemental non-GAAP financial measure that is not required by, or presented in accordance with GAAP. We use Net Debt as a measure of our financial leverage. We believe that investors also may find Net Debt to be helpful in evaluating our financial leverage. Net Debt should not be considered as an alternative to Debt determined in accordance with GAAP and should be reviewed in conjunction with our consolidated balance sheets. Set forth above is a reconciliation of Net Debt, a non-GAAP financial measure, to Debt, which is the most directly comparable financial measure calculated and reported in accordance with GAAP, as of September 30, 2016, December 31, 2015, and December 31, 2014.
Net Debt excluding cash and debt in Venezuelan operations was $303 million at September 30, 2016, $279 million at December 31, 2015, and $332 million as of December 31, 2014. Net Debt increased by $24 million from December 31, 2015 primarily to fund capital expenditures during the period.
September 30, December 31, December 31,(In millions) 2016 2015 2014Debt:
Short-term debt(a) $ 67.0 32.6 59.4Long-term debt 412.1 397.9 407.2
Total Debt 479.1 430.5 466.6
Less:Cash and cash equivalents 191.5 181.9 176.2
Amounts held by Cash Management Services operations(b) (8.7) (24.2) (28.0)Cash and cash equivalents available for general corporate purposes 182.8 157.7 148.2
Net Debt $ 296.3 272.8 318.4

35
Non-GAAP Reconciliation – Items Impacting Adjusted EBITDA
The Brink’s Company and subsidiariesNon-GAAP ReconcilliationAdjusted EBITDA (Unaudited)(In millions)
a) Non-GAAP amounts exclude the impact of "Other Items Not Allocated to Segments" on the respective line items on the consolidated statements of operations. b) See slides 29-30 for reconciliation of 2015 and 2016 non-GAAP revenue and non-GAAP income from continuing operations to GAAP revenue and GAAP net income (loss).
See slide 36 and 37 for reconciliation of 2014 non-GAAP revenue and non-GAAP income from continuing operations to GAAP revenue and GAAP net income (loss).
2014 2015 2016
1Q 2Q 3Q 4QFull Year 1Q 2Q 3Q 4Q
Full Year 1Q 2Q 3Q
Nine Months
Adjusted EBITDAIncome from continuing operations - Non-GAAP(a)(b) $ 7.3 8.1 5.7 28.3 49.4 $ 21.9 14.8 20.1 27.4 84.2 $ 14.9 19.0 32.5 66.4
Interest expense - Non-GAAP(a) 5.7 5.9 6.6 5.1 23.3 4.9 4.7 4.8 4.5 18.9 4.8 4.9 5.1 14.8
Income tax provision - Non-GAAP(a) 6.9 8.5 6.7 24.8 46.9 13.4 9.7 12.2 17.0 52.3 10.2 13.1 21.9 45.2 Depreciation and amortization - Non-GAAP(a) 38.9 38.9 37.5 37.1 152.4 34.9 34.5 33.1 33.5 136.0 32.1 32.7 32.3 97.1
Adjusted EBITDA $ 58.8 61.4 56.5 95.3 272.0 $ 75.1 63.7 70.2 82.4 291.4 $ 62.0 69.7 91.8 223.5

36
Non-GAAP Reconciliation – 2014
The Brink’s Company and subsidiariesNon-GAAP Reconciliation - 2014 (Unaudited)(In millions)
Amounts may not add due to rounding. See slide 37 for footnote explanations.
1Q 2Q 3Q 4Q Full Year
Revenues:Non-GAAP 818.3$ 836.7 847.4 848.1 3,350.5 Other items not allocated to segments(a) 131.3 22.3 25.1 33.1 211.8 GAAP 949.6$ 859.0 872.5 881.2 3,562.3
Operating profit (loss):Non-GAAP 20.8$ 24.0 20.8 58.6 124.2
Other items not allocated to segments(a) (94.5) (15.3) 40.4 (82.3) (151.7) GAAP (73.7)$ 8.7 61.2 (23.7) (27.5)
Nonoperating expense:Non-GAAP (5.8)$ (5.3) (6.2) (4.2) (21.5)
Other items not allocated to segments(a) - - - - - GAAP (5.8)$ (5.3) (6.2) (4.2) (21.5)
Taxes:Non-GAAP 6.9$ 8.5 6.7 24.8 46.9
Other items not allocated to segments(a) (3.3) (1.3) 21.5 (27.1) (10.2) Income tax rate adjustment(b) 5.1 (3.1) (1.4) (0.6) -
GAAP 8.7$ 4.1 26.8 (2.9) 36.7
Non-GAAP Margin 2.5% 2.9% 2.5% 6.9% 3.7%
2014
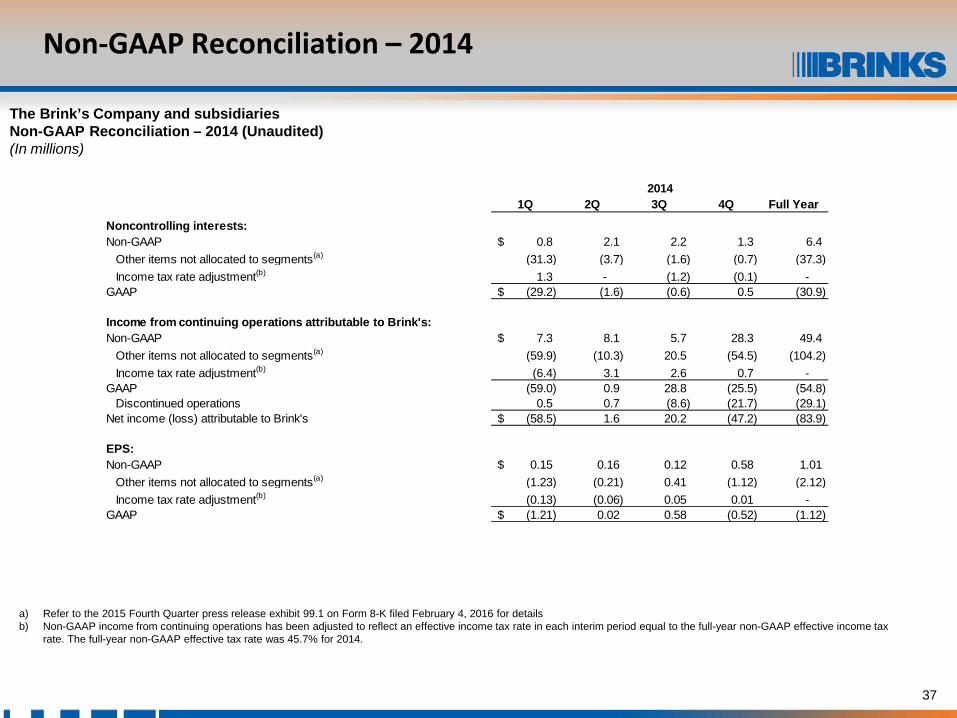
37
Non-GAAP Reconciliation – 2014
The Brink’s Company and subsidiariesNon-GAAP Reconciliation – 2014 (Unaudited)(In millions)
a) Refer to the 2015 Fourth Quarter press release exhibit 99.1 on Form 8-K filed February 4, 2016 for detailsb) Non-GAAP income from continuing operations has been adjusted to reflect an effective income tax rate in each interim period equal to the full-year non-GAAP effective income tax
rate. The full-year non-GAAP effective tax rate was 45.7% for 2014.
1Q 2Q 3Q 4Q Full Year
Noncontrolling interests:Non-GAAP 0.8$ 2.1 2.2 1.3 6.4
Other items not allocated to segments(a) (31.3) (3.7) (1.6) (0.7) (37.3) Income tax rate adjustment(b) 1.3 - (1.2) (0.1) -
GAAP (29.2)$ (1.6) (0.6) 0.5 (30.9)
Income from continuing operations attributable to Brink's:Non-GAAP 7.3$ 8.1 5.7 28.3 49.4
Other items not allocated to segments(a) (59.9) (10.3) 20.5 (54.5) (104.2) Income tax rate adjustment(b) (6.4) 3.1 2.6 0.7 -
GAAP (59.0) 0.9 28.8 (25.5) (54.8) Discontinued operations 0.5 0.7 (8.6) (21.7) (29.1)
Net income (loss) attributable to Brink's (58.5)$ 1.6 20.2 (47.2) (83.9)
EPS:Non-GAAP 0.15$ 0.16 0.12 0.58 1.01
Other items not allocated to segments(a) (1.23) (0.21) 0.41 (1.12) (2.12) Income tax rate adjustment(b) (0.13) (0.06) 0.05 0.01 -
GAAP (1.21)$ 0.02 0.58 (0.52) (1.12)
2014
38
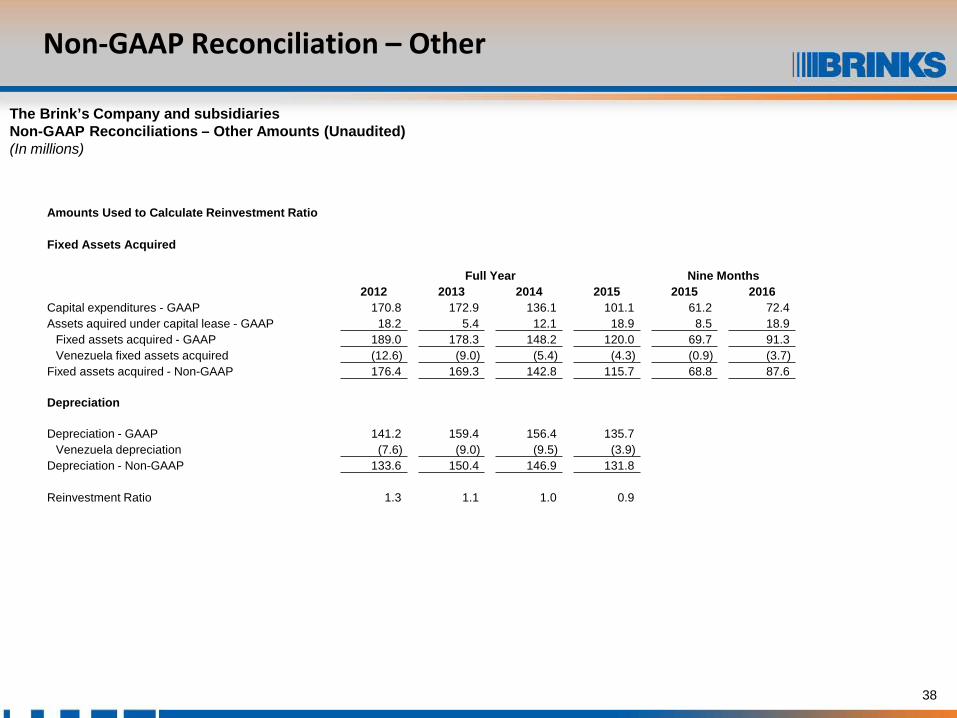
Non-GAAP Reconciliation – Other
The Brink’s Company and subsidiariesNon-GAAP Reconciliations – Other Amounts (Unaudited) (In millions)
Amounts Used to Calculate Reinvestment Ratio
Fixed Assets Acquired
Full Year Nine Months2012 2013 2014 2015 2015 2016
Capital expenditures - GAAP 170.8 172.9 136.1 101.1 61.2 72.4 Assets aquired under capital lease - GAAP 18.2 5.4 12.1 18.9 8.5 18.9
Fixed assets acquired - GAAP 189.0 178.3 148.2 120.0 69.7 91.3 Venezuela fixed assets acquired (12.6) (9.0) (5.4) (4.3) (0.9) (3.7)
Fixed assets acquired - Non-GAAP 176.4 169.3 142.8 115.7 68.8 87.6
Depreciation
Depreciation - GAAP 141.2 159.4 156.4 135.7 Venezuela depreciation (7.6) (9.0) (9.5) (3.9)
Depreciation - Non-GAAP 133.6 150.4 146.9 131.8
Reinvestment Ratio 1.3 1.1 1.0 0.9