bringing design research into engineering classrooms
TRANSCRIPT

researchteaching
Center for Engineering Learning and Teaching University of Washington
http://depts.washington.edu/celtweb/
April 2008PNW-ASEE 2008 1
Bringing Design Research into Engineering Classrooms
Jim Borgford-ParnellCindy AtmanKate DeibelCenter for Engineering Learning and TeachingUW College of Engineering

Center for Engineering Learning and Teaching University of Washington
http://depts.washington.edu/celtweb/
April 2008PNW-ASEE 2008 2
Acknowledgements
Drawn from research by:
Cindy Atman, Kate Deibel, Robin Adams, Monica Cardella, Allison Kang, Deborah Kilgore, Andrew Morozov, Susan Mosborg, Jason Saleem, Ken Yasuhara and Jim Borgford-Parnell.
This work has been supported by grants from the National Science Foundation RED-9358516, DGE-9714459, EEC-9872498, REC-012554, ESI-0227558, SBE-0354453, the LIFE Center, the GE Fund, the Ford Motor Company Fund, and the Boeing Company.

Center for Engineering Learning and Teaching University of Washington
http://depts.washington.edu/celtweb/
April 2008PNW-ASEE 2008 3
CELT Design Research
What do freshmen and senior students’ engineering design processes look like?
What do experts’ engineering design processes look like, and how do they compare with students?
When do students and experts gather information in the design process?
How much and what kinds of information do they gather?
How broadly do they scope design problems?

Center for Engineering Learning and Teaching University of Washington
http://depts.washington.edu/celtweb/
April 2008PNW-ASEE 2008 4
Engineering design is a systematic, intelligent process in which designers generate, evaluate, and specify concepts for devices, systems, or processes whose form and function achieve clients’ objectives or users’ needs while satisfying a specified set of constraints.
Source: Dym, et al. (2005). JEE 94(1).

Center for Engineering Learning and Teaching University of Washington
http://depts.washington.edu/celtweb/
April 2008PNW-ASEE 2008 5
Session Agenda
Present aspects of CELT’s Design Research.
Interact with participants on possible implications for engineering pedagogy and student learning.
Center for Engineering Learning and Teaching University of Washington
http://depts.washington.edu/celtweb/
April 2008PNW-ASEE 2008 6
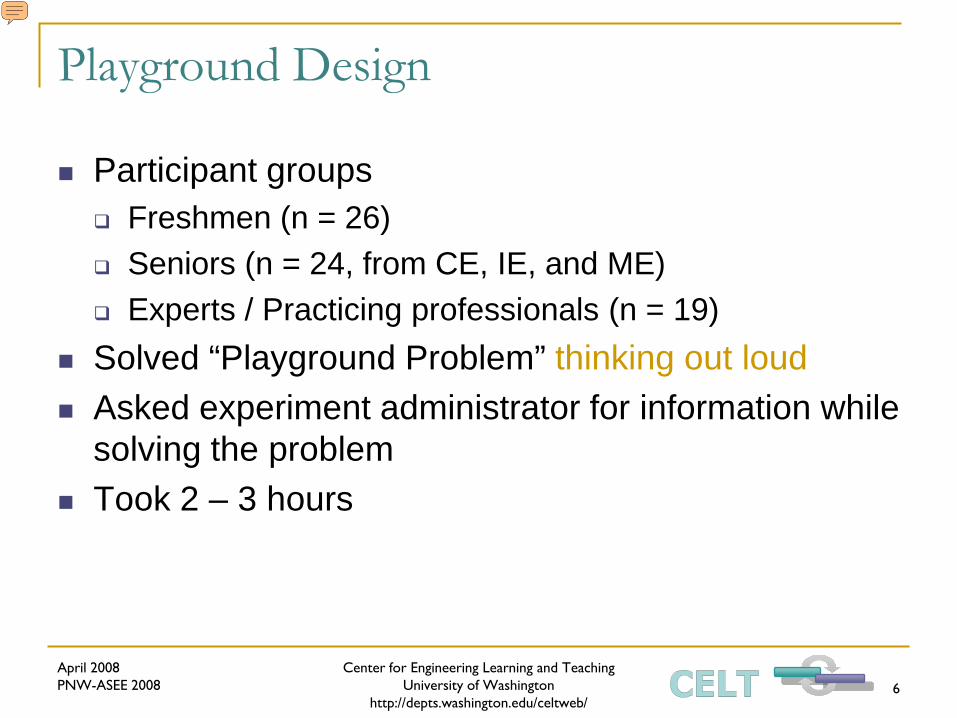
Playground Design
Participant groups Freshmen (n = 26) Seniors (n = 24, from CE, IE, and ME) Experts / Practicing professionals (n = 19)
Solved “Playground Problem” thinking out loud Asked experiment administrator for information while
solving the problem Took 2 – 3 hours

Center for Engineering Learning and Teaching University of Washington
http://depts.washington.edu/celtweb/
April 2008PNW-ASEE 2008 7
Why a playground?

Center for Engineering Learning and Teaching University of Washington
http://depts.washington.edu/celtweb/
April 2008PNW-ASEE 2008 8
Problem Statement: Design a PlaygroundYou live in a mid-size city. A local resident has recently donated a corner lot for a playground. Since you are an engineer who lives in the neighborhood, you have been asked by the city to design a playground.
You estimate that most of the children who will use the playground will range from 1 to 10 years of age. Twelve children should be kept busy at any one time. There should be at least three different types of activities for the children. Any equipment you design must be safe for the children, remain outside all year long, not cost too much, and comply with the Americans with Disabilities Act.
The neighborhood does not have the time or money to buy ready made pieces of equipment. Your design should use materials that are available at any hardware or lumber store. The playground must be ready for use in 2 months.

Center for Engineering Learning and Teaching University of Washington
http://depts.washington.edu/celtweb/
April 2008PNW-ASEE 2008 9
Verbal Protocol Analysis
1. Record audio from think-aloud protocol2. Transcribe audio3. Segment into codable “chunks” of subject
statements (reliability check)4. Code transcript (reliability check)5. Analyze to answer specific research questions

Center for Engineering Learning and Teaching University of Washington
http://depts.washington.edu/celtweb/
April 2008PNW-ASEE 2008 10
Design Process ActivitiesDerived from analysis of 7 engineering texts
(Identification of a Need)Problem DefinitionInformation Gathering
Generation of Ideas ModelingFeasibility of analysisEvaluation
DecisionCommunication(Implementation)
Problem Scoping
Developing Alternative Solutions
Project Realization
Design Activities Design Stages

Center for Engineering Learning and Teaching University of Washington
http://depts.washington.edu/celtweb/
April 2008PNW-ASEE 2008 11
Design Process Timelines
PD: Problem Definition FEAS: Feasibility AnalysisGATH: Gathering Information EVAL: EvaluationGEN: Generating Ideas DEC: Decision MakingMOD: Modeling COM: Communication
Freshman (Quality Score = 0.45)

Center for Engineering Learning and Teaching University of Washington
http://depts.washington.edu/celtweb/
April 2008PNW-ASEE 2008 12
Activity 1
Individually, take a few minutes to answer Activity 1 questions on the worksheet:
In the design process timelines shown on the worksheet, what similarities and differences do you see between the freshmen and senior engineering students?
Do these similarities also involve the quality scores? How so?

Center for Engineering Learning and Teaching University of Washington
http://depts.washington.edu/celtweb/
April 2008PNW-ASEE 2008 13
DiscussionFreshman #1 (Quality Score = 0.37) Senior One (Quality Score = 0.38)
Freshman #2 (Quality Score = 0.45) Senior Two (Quality Score = 0.53)
Freshman #3 (Quality Score = 0.62) Senior Three (Quality Score = 0.63)

Center for Engineering Learning and Teaching University of Washington
http://depts.washington.edu/celtweb/
April 2008PNW-ASEE 2008 14
When asked the same questions seniors in a capstone design course reported: Everyone spent a lot of time on modeling. The people who spent time on multiple activities generally
scored higher. The students who scored the highest did not spend large
blocks of time on only one activity. Little time was spent on decision making. Seniors spent more time on feasibility analysis and
evaluation. Seniors spent more time on project definition. For seniors, less continuous time spent modeling resulted in
increased score.

Center for Engineering Learning and Teaching University of Washington
http://depts.washington.edu/celtweb/
April 2008PNW-ASEE 2008 15
Our Findings: Freshmen vs. Seniors
Compared to freshmen, seniors… …have higher quality designs. (whew!!) …scope the problem more effectively by
considering a broader range of information categories.
…make more transitions among design activities.
…spend more time iterating. …progress farther in the design process.

Center for Engineering Learning and Teaching University of Washington
http://depts.washington.edu/celtweb/
April 2008PNW-ASEE 2008 16
Our Findings: Experts and Time
Experts spend more time solving the problems in all design stages.
Experts also tend to exhibit a ‘cascade’ pattern of transitions.

Center for Engineering Learning and Teaching University of Washington
http://depts.washington.edu/celtweb/
April 2008PNW-ASEE 2008 17
Information Categories for Playground Designseniors experts
0% 20% 40% 60% 80%
supervision concernsavailability of materials
neighborhood demographicslegal liability
technical referencesneighborhood opinionsmaintenance concerns
utilitiesbody dimensions
labor availability and costsother
information about the areamaterial specification
budgethandicapped accessibility
safetymaterial costs
freshmen
% participants

Center for Engineering Learning and Teaching University of Washington
http://depts.washington.edu/celtweb/
April 2008PNW-ASEE 2008 18
Information Categories for Playground Design Focus on Selected Differences
0% 20% 40% 60% 80%
legal liability
maintenance concerns
information about the area
budget
handicapped accessibility
safety
% participants
expertsseniorsfreshmen

Center for Engineering Learning and Teaching University of Washington
http://depts.washington.edu/celtweb/
April 2008PNW-ASEE 2008 19
Our Findings: Experts and Information Gathering
Experts “scope” the problem more effectively by… …gathering more information than seniors and
freshmen. …covering more categories of information than
seniors and freshmen.

Center for Engineering Learning and Teaching University of Washington
http://depts.washington.edu/celtweb/
April 2008PNW-ASEE 2008 20
Number of Information Requests and Categories
Freshmen = Seniors < Experts
(p = .137) (p = .048)
Freshmen < Seniors < Experts
(p = .035) (p = .028)

Center for Engineering Learning and Teaching University of Washington
http://depts.washington.edu/celtweb/
April 2008PNW-ASEE 2008 21
Activity 2: Group Discussion
1. What are some possible implications for engineering education?
2. What are some ways that this might be used in the classroom?

Center for Engineering Learning and Teaching University of Washington
http://depts.washington.edu/celtweb/
April 2008PNW-ASEE 2008 22
Reference List
Atman, C. J., Adams, R. S., Cardella, M. E., Turns, J., Mosborg, S., & Saleem, J. J. (2007). Engineering Design Processes: A Comparison of Students and Expert Practitioners. Journal of Engineering Education, 96(4), 359 -379.This paper received the 2008 William Elgin WickendenAward from the American Society of Engineering Education.Kilgore, Deborah, Cynthia J. Atman, Ken Yasuhara, Theresa J. Barker, and Andrew E. Morozov, “Considering Context: A Study of First-Year Engineering Students,” Journal of Engineering Education, vol. 96, no. 4, pp. 321-344, October 2007.Atman, C. J., Borgford-Parnell, J., Deibel, K., Kang, A., Ng, W. H., Kilgore, D., et al. (2007, September). Matters of Context in Design. In proceedings of the Design Thinking Research Symposium VII, London, England.Atman, C. J., Rhone, E., Adams, R. S., Turns, J., Barker, T., & Yasuhara, K. (2007, May). Breadth in Problem-Scoping: A Comparison of Freshman and Senior Engineering Students. In proceedings of the Mudd Design Workshop VI: Design and Engineering Education in a Flat World, Claremont, California.Adams, Robin S., Jennifer Turns and Cynthia J. Atman. “Educating Effective Engineering Designers: the Role of Reflective Practice,” Design Studies, Special Issue on Designing in Context, vol. 24, no. 3, 2003. pp. 275-294.Atman, Cynthia J., Justin R. Chimka, Karen M. Bursic, and H. L. Nachtmann, “A Comparison of Freshman and Senior Engineering Design Processes,” Design Studies, vol. 20, no. 2, pp. 131-152, March 1999.Bursic, Karen M. and Cynthia J. Atman, “Information Gathering: A critical Step for Quality in the Design Process,” Quality Management Journal, vol. 4, no. 4, pp. 60-75, July 1997.
Center for Engineering Learning and Teaching University of Washington
http://depts.washington.edu/celtweb/
April 2008PNW-ASEE 2008 23
Reflection Exercise
What did you find most interesting or important? Why?
How can this workshop be improved for future audiences?
Please take a moment to answer the reflection questions:
researchteaching
Center for Engineering Learning and Teaching University of Washington
http://depts.washington.edu/celtweb/
April 2008PNW-ASEE 2008 24
THANKS!

Bringing Design Research into Engineering Classrooms
Workshop
Notes and Handouts

Bringing Design Research into Engineering Classrooms Jim Borgford-Parnell
Workshop Goals:
1. Give a background of CELT’s Design Research Characterize how engineering students and practicing
professionals solve engineering problems.
2. Interact with participants on possible implications for engineering pedagogy and student learning.
3. Participants leave with something helpful

Design Activity Timeline
ACTIVITY: In the design process timelines shown above, what similarities and differences do you see between the freshmen and senior engineering students? Do these similarities also involve the quality scores? How so?
PD: Problem Definition MOD: Modeling DEC: Decision GATH: Gathering Information FEAS: Feasibility COM: Communication GEN: Generating Ideas EVAL: Evaluation
Senior One (Quality Score = 0.38)
Senior Two (Quality Score = 0.53)
Senior Three (Quality Score = 0.63)
Freshman #2 (Quality Score = 0.45)
Freshman #3 (Quality Score = 0.62)
Freshman #1 (Quality Score = 0.37)

Bringing Design Research into Engineering Classrooms Bibliography Atman, C. J., Adams, R. S., Cardella, M. E., Turns, J., Mosborg, S., & Saleem, J. J.
(2007). Engineering Design Processes: A Comparison of Students and Expert Practitioners. Journal of Engineering Education, 96(4), 359 -379.This paper received the 2008 William Elgin Wickenden Award from the American Society of Engineering Education.
Kilgore, Deborah, Cynthia J. Atman, Ken Yasuhara, Theresa J. Barker, and Andrew E.
Morozov, “Considering Context: A Study of First-Year Engineering Students,” Journal of Engineering Education, vol. 96, no. 4, pp. 321-344, October 2007.
Atman, C. J., Borgford-Parnell, J., Deibel, K., Kang, A., Ng, W. H., Kilgore, D., et al.
(2007, September). Matters of Context in Design. In proceedings of the Design Thinking Research Symposium VII, London, England.
Atman, C. J., Rhone, E., Adams, R. S., Turns, J., Barker, T., & Yasuhara, K. (2007,
May). Breadth in Problem-Scoping: A Comparison of Freshman and Senior Engineering Students. In proceedings of the Mudd Design Workshop VI: Design and Engineering Education in a Flat World, Claremont, California.
Adams, Robin S., Jennifer Turns and Cynthia J. Atman. “Educating Effective
Engineering Designers: the Role of Reflective Practice,” Design Studies, Special Issue on Designing in Context, vol. 24, no. 3, 2003. pp. 275-294.
Atman, Cynthia J., Justin R. Chimka, Karen M. Bursic, and H. L. Nachtmann, “A
Comparison of Freshman and Senior Engineering Design Processes,” Design Studies, vol. 20, no. 2, pp. 131-152, March 1999.
Bursic, Karen M. and Cynthia J. Atman, “Information Gathering: A critical Step for
Quality in the Design Process,” Quality Management Journal, vol. 4, no. 4, pp. 60-75, July 1997.