brighter skies: challenges and opportunities for asia ... · brighter skies: challenges and...
TRANSCRIPT

1
Brighter Skies: Challenges and Opportunities for Asia Pacific Aviation
Andrew Herdman, Director GeneralASSOCIATION OF ASIA PACIFIC AIRLINES
Royal Aeronautical SocietyEvening Lecture
MIAT, Universiti Kuala LumpurMalaysia
9 August 2005

2
• Global aviation • AAPA role• Combined strength• Management challenges• Competition and new entrants• Our competitive edge• Future outlook
Presentation outline
Global aviation: this is a great industry!
• 100 years ago the Wright brothers made their first flight
• 50 years ago: 9 million passengers
• Today: 1,800 million people flew safely last year
• Modern jet aircraft are as fuel efficient as compact cars
• Air cargo delivers 35% of global trade by value
Aviation has delivered incalculable benefits to society

3
Safe flying: global hull loss rate 1995-2004
1.321.27
1.341.27
1.11
0.94
0.78
1.05
0.87
1.20
0.40
0.60
0.80
1.00
1.20
1.40
1995 1996 1997 1998 1999 2000 2001 2002 2003 2004 2005 2006
Hul
l Los
ses/
Mill
ion
Sect
ors
Hull Loss Rate10 Year Average3-year Moving Average
IATA Target
Hull Losses per million sectors
Source: IATA Western-built jets
Safe and safer: 2004 hull loss rates by region
1.35.2
5.3 0.94Hull losses per million departures by region of operator, Western-built Jets 2004
0.520.29
World average 0.78 per million sectors

4
Aviation and the Environment
• Aircraft fuel consumption improved by 38% in the last 20 years
• Modern aircraft fuel consumption matches that of a small car– 3 litres of fuel per 100 pax-km
• Modern aircraft are 20 decibels quieter than 30 years ago
– 75% reduction in noise impact
• Despite rapid growth, aviation accounts for only 3.5% of overallglobal emissions
These achievements deserve to be more widely understood
Global industry structure
• Aviation is a mass transport business, and a key element of the modern global economy
• Highly regulated, both technically and commercially
• Outdated international bilateral regulatory framework
• Progressive liberalisation, but at a measured pace
• National ownership and control restrictions hold back global consolidation and competition
• Structural inefficiencies persist, notably uncompetitive labour costsand lack of competition amongst key service providers
Some of the many challenges for airlines and AAPA

5
AAPA Association of Asia Pacific Airlines
• Regional trade association representing 17 major international airlines based in Asia Pacific
• Committed to promoting sustainable growth of the aviation industry serving both passenger and freight needs
• Work with member airlines, governments, regulators and industry partners on issues of common concern
• Permanent secretariat headquartered in Kuala Lumpur, Malaysia
• Representation in Washington and Brussels
Global regulatory policy issues
• Airlines facing continuing onslaught of new regulations– Safety– Security– Environment– Consumer rights– Taxes and charges
• These initiatives are driven by individual governments and regulatory bodies
• As a result, international airlines are confronted by conflicting and overlapping regulations
• Complexity also compounds the cost impact on the industry and its customers

6
U.S. & EU : regulatory perspectives
• Mainly driven by US domestic political concerns– Safety, led by FAA– Security, led by DHS/TSA – Open (your) Skies
• Mainly driven by EU Domestic political concerns– Safety: EASA, Eurocontrol – Consumer rights– Environment– EC assuming lead role in aero-political process
• Insensitivity about extra-territorial impacts: unilateral actions
• Where international issues are taken into account, the focus tends to be on US-EU differences
• Insufficient recognition of Asia-Pacific role and views
Asia Pacific: regulatory perspective
• Highly diverse: multiple governments and regulators
• Need for regional co-operation on multilateral basis
• Positive bias towards consensus, but sometimes slows the process
• Harmonisation is more about sharing best practices before legislating, not about resolving differences after unilaterally imposed regulations

7
U.S. and EU: the wider impact
Asia Pacific
Need for better global harmonization and regulatory framework
AAPA Association of Asia Pacific Airlines

8
AAPA’s combined strength
• 17 airlines
• US$ 65 billion revenue
• US$ 4 billion profit
• 255 million passengers
• 10 million tonnes of cargo
• 190,000 employees
• 1,300 aircraft
JLOZ
KE
NHKA CX
BRCI
VNTG
BI
PR
GASQ
MH
QF
NZ
Global Market Share :• ~ 19% of global pax traffic• ~ 33% of global cargo traffic
Data: 2004
AAPA global passenger traffic share
Source: IATA AAPA: Association of Asia Pacific Airlines, ATA: Air Transport Association of America, AEA: Association of European Airlines
AAPA 19%
ATA 33%AEA 21%
Scheduled Systemwide Revenue Passenger Kilometres 2003
Others 27%

9
AAPA global freight traffic share
Scheduled Systemwide Freight Tonne Kilometres 2003
AAPA 33%
ATA 26%AEA 24%
Others 17%
Source: IATA AAPA: Association of Asia Pacific Airlines, ATA: Air Transport Association of America, AEA: Association of European Airlines
AAPA: fleet development
• 1,300 aircraft
• 73% of the fleet is widebody– Operating 25% of world’s widebody passenger fleet– Operating 34% of world’s B747F
• 46% of all new widebody orders for 2004
• 359 aircraft on order for delivery over the next 5 years
• Major customers for new types including A380 and B787
Source: AAPA and Airclaims’ world air fleet (as at 10 May 2005)

10
AAPA: 49 A380 orders
Source: Airbus
25% of world’s A380 orders
Emirates 43Lufthansa 15Qantas Airways 12Air France 10Federal Express 10ILFC 10Singapore Airlines 10UPS 10Malaysia Airlines 6Thai Airways Int'l 6Virgin Atlantic 6China Southern Airlines 5Kingfisher Airlines 5Korean Air 5Etihad Airways 4Qatar Airways 2Total 159
AAPA: 96 B787 orders
Source: Boeing
Mainland Chinese Carriers 60All Nippon Airways 50Japan Airlines 30Primaris Airlines 20Air Canada 14Continental Airlines 10Ethiopian Airlines 10Korean Air 10First Choice 6Blue Panorama 4Vietnam Airlines 4Air New Zealand 2Icelandair 2Total 222
43% of world’s B787 orders

11
Mainland China’s aviation market
120 million passengers
Domestic 100 million
&
International 20 million
AAPA carriers are key players in serving the rapidly growing Chinese market
Source: CAAC
AAPA: Mainland China’s destinations
Beijing
Fuzhou
ChengduShanghai
Harbin
Haikou
HangzhouNanjing
ShenyangChangchun
KunmingGuangzhou
Jinan
ChangshaChongqing
WuhanXian
Ningbo
Yanji
Tianjin
Qingdao
Shenzhen
Guilin
Yantai
Dalian
Xiamen
Sanya
Urumqi
AAPA members serve a total of 28 Mainland Chinese cities
Flights/Week1. Shanghai 280 2. Beijing 1683. Xiamen 504. Guangzhou 445. Qingdao 396. Hangzhou 367. Kunming 248. Dalian 239. Chengdu 2210. Tianjin 17
Over 800 flights per week

12
• Benefits of diverse revenue mix• Passenger demand
– Business – Leisure
• Network strength– Short haul– Long haul
• Cargo demand• Critical importance of cost management
Airline management: past lessons
AAPA: international revenue mix
Source: AAPA FY2004 = April 2003 to March 2004
AAPA Operating Revenue FY2004International Operations
First/Business Passenger 20%
Economy Passenger52%
Cargo25%
Others3%

13
AAPA’s international passenger traffic 1995-2004Scheduled International Revenue Passenger Kilometres 1995-2004
0
100
200
300
400
500
600
95 96 97 98 99 00 01 02 03 04
RPK
(Bill
ions
)
-30%
-20%
-10%
0%
10%
20%
30%
% G
row
th
Strong recovery in passenger demand
Cargo operations: key revenue contributor
Source: AAPA, IATA
Passenger 69%
Others 14%
Cargo17%
• AAPA ~ 33% of global cargo traffic
• US$ 11 billion revenue
• Belly space complemented by 112 freighters
14
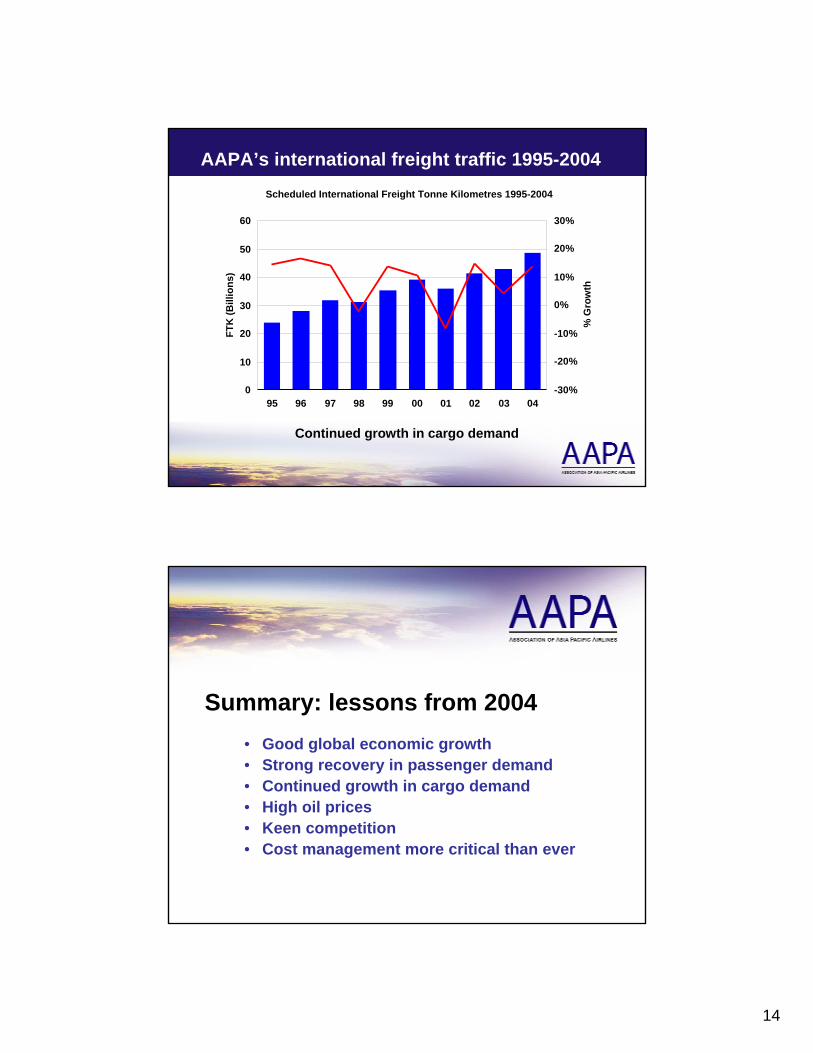
AAPA’s international freight traffic 1995-2004
Continued growth in cargo demand
Scheduled International Freight Tonne Kilometres 1995-2004
0
10
20
30
40
50
60
95 96 97 98 99 00 01 02 03 04
FTK
(Bill
ions
)
-30%
-20%
-10%
0%
10%
20%
30%
% G
row
th
• Good global economic growth• Strong recovery in passenger demand• Continued growth in cargo demand• High oil prices• Keen competition• Cost management more critical than ever
Summary: lessons from 2004

15
• How does airline performance vary in different regions of the world?
• What are the contributory factors which could explain some observed variations?
Airline profitabilitySome global comparisons
AAPA’s profitability trends: strong FY2004/5
Source: AAPA (FY 2004: April 2003 to March 2004)
AAPA Systemwide Operating & Net Profit
$(2)
$(1)
$-
$1
$2
$3
$4
FY95
FY96
FY97
FY98
FY99
FY00
FY01
FY02
FY03
FY04
FY05
USD
Bill
ions
Operating Profit Net Profit After Tax
Asia’s Financial CrisisSARS & Iraq
War
Sept 11th

16
Airline profitability: mixed picture
Airline profitability by region
-14.0-12.0-10.0-8.0-6.0-4.0-2.00.02.04.06.08.0
1999 2000 2001 2002 2003 2004 2005F
US Europe Asia
$bn
8.5 3.7
-13.0 -11.3 -7.2 -4.8 -6.0 ?
Global industry profits
Global industry losses
Source: IATA
Rising fuel costs
Source: Credit Suisse First Boston
AAPA 2004 fuel costs ~ US$12 bnor ~20% of total operating costsFurther sharp increase in 2005

17
Airline valuations 2001-2005
Asia
Europe
Japan
USA
Airlines: market capitalisation
855ATA (9)
USA
6542AAPA (12)Asia Pacific
Revenues US$ billion
Market capitalisation US$ billion
CarriersRegion
Europe6924AEA (10)
26Ryanair22easyJet
12JetBlue711Southwest
0.11AirAsia12Virgin Blue
Source: Airclaims, Bloomberg, company data and AAPA estimates Data: December 2004

18
• Highly competitive markets• Impact of new entrants• Regional variations
Competition
Airfares do not keep pace with inflation
Real Passenger Yields have fallen by a third in the past decade
50
60
70
80
90
100
110
1993 1994 1995 1996 1997 1998 1999 2000 2001 2002 2003 2004ERea
l Pas
seng
er y
ield
s, in
dexe
d to
199
3=10
0
US domestic markets
Intra-Europe markets
AAPA Systemwide

19
Impact of new entrants
Source: McKinsey & Co, BACK; IATA Data: Summer 2004
Regional seat capacity per week
45
12 6
0
20
0
5568
94
0%
10%
20%
30%
40%
50%
60%
70%
80%
90%
100%
US domestic Intra-Europe Intra-Asia-Pacific
NetworkCharterNo frills
13.1 million 15.4 million11.5 million
Proliferation of new entrants in Asia
20
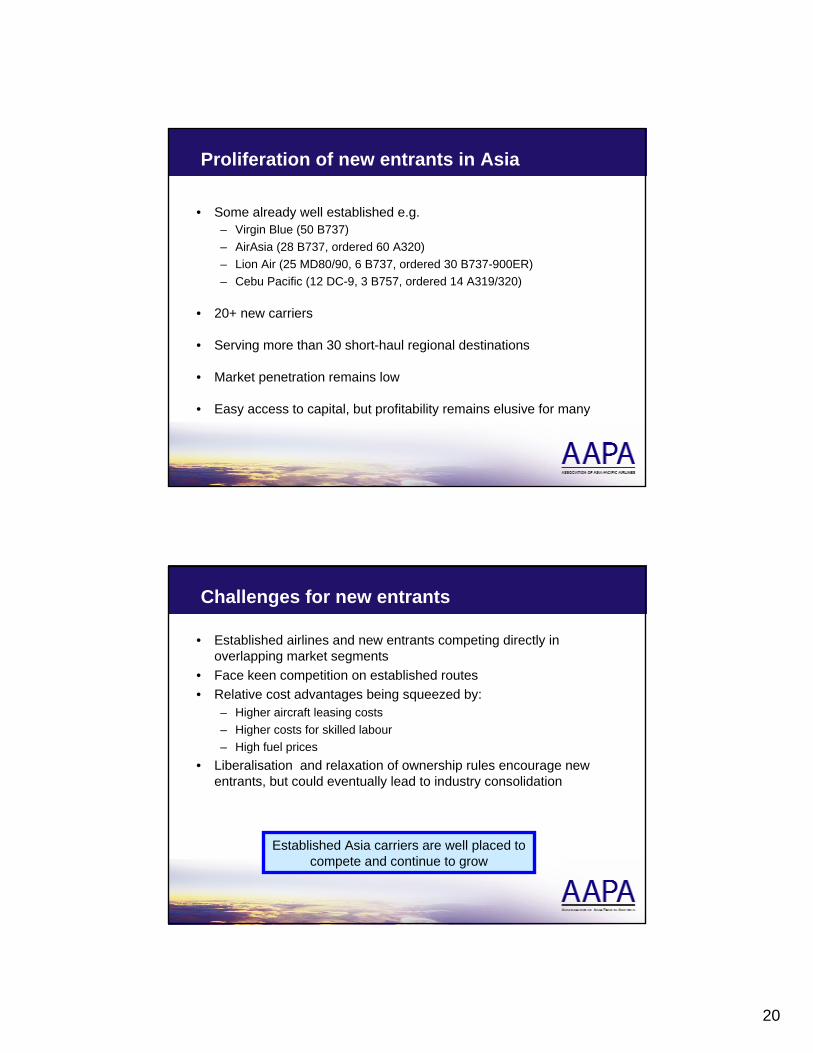
Proliferation of new entrants in Asia
• Some already well established e.g.– Virgin Blue (50 B737)– AirAsia (28 B737, ordered 60 A320)– Lion Air (25 MD80/90, 6 B737, ordered 30 B737-900ER)– Cebu Pacific (12 DC-9, 3 B757, ordered 14 A319/320)
• 20+ new carriers
• Serving more than 30 short-haul regional destinations
• Market penetration remains low
• Easy access to capital, but profitability remains elusive for many
Challenges for new entrants
• Established airlines and new entrants competing directly in overlapping market segments
• Face keen competition on established routes• Relative cost advantages being squeezed by:
– Higher aircraft leasing costs– Higher costs for skilled labour– High fuel prices
• Liberalisation and relaxation of ownership rules encourage new entrants, but could eventually lead to industry consolidation
Established Asia carriers are well placed to compete and continue to grow

21
AAPA carriers: competitive fares
Average yields: US cents/RPK
easyJet 8.1Virgin Blue 8.0Southwest 7.4Ryanair 6.8JetBlue 5.2AAPA * 4.8AirAsia 3.7
* AAPA Economy class yields
Keeping costs down: operating costs per ATK
Source: Company reports, IATA, AAPA estimates
0
10
20
30
40
50
60
70
80
90
100
0 500 1000 1500 2000 2500 3000 3500 4000 4500 5000
Average Stage Length, km
US Cents/ATK
SQBR
CX
MHBIKE
JLQF
OZGAVN
NH

22
Keeping costs down: operating costs per ATK
Source: Company reports, IATA, AAPA estimates
0
10
20
30
40
50
60
70
80
90
100
0 500 1000 1500 2000 2500 3000 3500 4000 4500 5000
Average Stage Length, km
US Cents/ATK
CODL
NW AA
UA
AF
BALH
IB
EKSQ
BRCX
MHBIKE
JLQF
OZGAVN
NH
CA
MUCZ
U2DJ
WNFR
AK
B6
• Slowing global economy• Asia Pacific should still lead, boosted by
dynamic growth of China• Persistently high oil prices may dampen
demand• Keen competition and more new entrants
Future outlook

23
Future growth – next 20 years
Source: Airbus, Boeing, IATA forecasts
FreightPassenger
-8.37.15.96.0
AAGR 2004-08
IATA
8.76.95.96.35.3
20-Year Forecast
Airbus
8.16.16.06.15.2
20-Year Forecast
Boeing
AAGR 2004-08
20-Year Forecast
20-Year Forecast
IATAAirbusBoeing
10.16.46.36.15.9
10.68.56.77.26.2
-Domestic China6.1Intra-Asia7.0Asia-Europe4.6Asia-North America6.0World
Airbus and Boeing 20-year forecast = 2004-2023
The challenge is turning growth into profitability
• A key element of a modern economy
• Good prospects for continued growth
• Progressive liberalisation will widen competition but also open up new global opportunities
Future of Asia Pacific Aviation
24
Andrew Herdman, Director GeneralASSOCIATION OF ASIA PACIFIC AIRLINES
www.aapairlines.org