bright future: update 1, july 2009
DESCRIPTION
Bright Future shows that the Northwest has ample, affordable energy conservation and renewable energy resources to serve future power needs and fulfill our climate responsibilities while reviving our economy. For negligible costs compared to continued reliance on dirty power sources, we can cover future electric demands (including those for electric-powered vehicles), help salmon survive both climate change and the hydrosystem, shut down the highly polluting coal plants now serving the region and meet state and regional greenhouse gas reduction goals. Update 1, July 2009 - This version of Bright Future is formatted for simple download and black- and-white reproduction. Minor errors in the original have been corrected.TRANSCRIPT

www.lightintheriver.org
BRIGHT FUTURE
Update 1, July 2009 - This version of Bright Future is formatted for simple download and black- and-white reproduction.Minor errors in the original have been corrected.
How to keep the Northwest’s lights on, jobs growing,goods moving and salmon swimming in the era of climate change
Staff of the NW Energy CoalitionSteven Weiss, lead author

Bright Future acknowledgments
It is impossible to acknowledge all the people and organizations that contributed to Bright Future, the second paper in the Light in the River series, so this section will inevitably be incomplete. An incomplete list, however, is better than none.
Thank you to:
The Hewlett Foundation for financial support and encouragement.••Pat Ford, executive director of Save Our •• Wild Salmon, for helping to create the Light in the River project and for hands-on help with the Bright Future paper, from editing to graphics.
Steven Weiss, senior policy associate of the NW Energy Coalition, the principal author and analyst.••NW Energy Coalition communications director Marc Krasnowsky, policy director Nancy Hirsh and executive ••director Sara Patton for editing and moral support.
Marc Krasnowsky and Save Our •• Wild Salmon communications director Natalie Brandon, NW Energy Coalition consultant Alicia Healey and outreach associate Jesse Stanley, and layout artist Karen Gibson of Orange Creative Group, for graphic and document design.
Rhett Lawrence, Save Our •• Wild Salmon policy analyst, for keeping an eye on every detail and keeping the project on-track.
Nicole Cordan, policy and legal director of Save Our •• Wild Salmon, for insight into making technical energy analyses accessible.
Dan Ritzman of the Sierra Club for financial and moral support.••And finally, the many expert reviewers who were kind and generous enough to donate their time and insights by ••critiquing draft after draft, making Bright Future a true coalition effort.
NW Energy Coalition, Original Edition, March 2009 - Update 1, July 2009
2
Executive summary...............................................
Introduction...........................................................
Part I: The shape of the challenge........................Climate changes Growing electric demandRetiring coal plantsSaving salmonSummary
Part II: Solutions...................................................Energy efficiency
What we’re doing nowGrowing opportunitiesPotential and recommendation
Combined heat and powerThe ‘smart grid’
Remote controlRemote storage
New renewable generationDeveloping renewablesIntegrating renewables into the gridPutting it all together
Part III: Costs........................................................ Collateral costs and benefitsA tale of two pathsCutting to the chase
Clean energy: Stimulating our economy and investing in our futureEssay by Dr. Thomas Power.............................
Part IV: Recommendations and conclusion.........
Endnotes.................................................................
Table of ContentsPage 3
Page 4
Page 5
Page 9
Page 16
Pages 17-20
Page 21
Page 23

A Bright Future awaits Pacific Northwest families, businesses and communities. We can reach it by taking the clean-energy path. This report shows that we can act together to:
Assure reliable, affordable, safe and coal-free ••energy.
Create thousands of new jobs and income ••opportunities in cities, towns and countryside.
Replace some hydropower to help restore salmon.••Turn our cars and trucks into clean machines that ••also store electricity.
Build tomorrow’s economies. ••Curb our dependence on foreign fuels.••Lead the fight against global warming.••
We have built the foundation by saving far more energy and money in the last 20 years than experts thought possible.We are building new renewable-energy facilities at forecast-defying speed. By ramping up current efforts we can turn our energy, transportation and salmon challenge into an opportunity for a Bright Future.
To do its part in fighting global warming, the Northwest electric system must reduce its greenhouse-gas emissions 15% below 2005 levels by 2020 and 80% by 2050. That will require not only developing more of our energy efficiency and renewable energy potential, but also – and critically – steadily retiring all the coal-fired power plants that now provide only 22% of the region’s electricity but produce 87% of the power system’s carbon-dioxide emissions.
The power system also must meet new demands as our population and economy grow, help restore endangered salmon and provide electricity to cars and trucks. To do this, we must save or develop 6,500 average megawatts
(aMW)1 of new carbon-free electricity by 2020 and another 19,100 aMW by 2050.
Energy efficiency is the powerhouse. We can save enough energy to meet all normal demand growth, roughly 60% of our total new power needs. An enforceable regionwide target to acquire 340 aMW of low-cost energy efficiency per year through 2050 is a reasonable goal given Northwest utilities’ already solid energy-saving programs and because saving energy is cheaper and creates more jobs than any other option. Energy efficiency isn’t sexy; it just works.
New clean renewable sources – wind, solar, geothermal, biomass, etc. – will provide the rest of our new power needs. Much of what we need by 2020 is already in the pipeline, mostly in the form of wind power. After 2020, falling costs will likely make solar the growth leader.
In parallel, we can create a smart grid to deliver these clean resources. A smart grid will shift from integrating fossil-fueled power with hydropower to integrating dispersed renewable sources in new ways. The transition is already underway, and will be accelerated by new policy innovations and some new transmission lines. And as our cars, trucks and buses go electric, their millions of batteries will act as a giant, dispersed storage system helping to provide back-up for the entire electric grid.
We can also build salmon and the salmon economy into our future, by replacing about 1,000 aMW of existing hydropower with new clean sources. This will allow removal of the four lower Snake River dams, or making equally effective alternative hydrosystem changes, to restore salmon and fishing and river-based jobs throughout our region.
This energy strategy creates more jobs and prosperity than any alternative. Carbon-free alternatives create up to four times as many jobs as fossil fuel options, create them in all parts of our region, employ local workers and keep millions of dollars circulating here that now leave the region or country. Lower energy bills due to efficiency measures help everyone, especially low-income families. And more salmon also means more jobs.
Some changes are needed to achieve this brighter future. To begin with, President Obama and the U.S. Congress should quickly set carbon emission limits consistent with scientists’ recommendations and establish mechanisms to meet them, along with incentives and penalties.
A megawatt – 1,000 kilowatts — is a common measure of power (or capacity). A megawatt-hour (MWh) or kilowatt-hour (kWh) is a measure of actual use over time. For example, a 1,000-watt light bulb burning for one hour uses 1 kilowatt-hour of electricity. An average megawatt (aMW) equals the total number of megawatt-hours used or produced in a year if a megawatt were generated through all the hours in a year; so, 1 aMW equals 8,760 MWh. Customers of Seattle City Light currently use about 1,100 aMW of electricity each year. In utility-speak, MW represent “capacity,” or the ability to produce power, while MWh represent “energy,” the use of that power for a period of time.
EXECUTIVE SUMMARY
3Update 1, July 2009

But the Northwest must not wait for national action. The region can adopt Bright Future’s carbon-reduction and clean-energy targets and start working toward them immediately. We need:
Regional leadership from the Bonneville Power 1. Administration. BPA should set a regional floor of acquiring 340 aMW of new energy efficiency and 270 aMW of new renewable energy a year.
A strong regional plan.2. The Northwest Power and Conservation Council’s 6th regional plan should call for enough energy efficiency and renewable energy to meet all demand growth and wean the region from coal power.
Extension of state renewable energy standards.3. The federal government or the states (including Idaho) must adopt or extend renewable portfolio standards now in place in Oregon, Montana and Washington state.
Prohibition of new coal plant construction or 4. extending the lives of existing ones. Only by weaning ourselves from coal-fueled power can we reach our greenhouse-gas reduction goals.
Working together, we can create this Bright Future for ourselves and our children. We can keep the lights on, the goods moving, the good jobs growing, the rivers running and salmon swimming in the Pacific Northwest.
The Northwest electrical power system faces immense challenges between now and 2050, the greatest of which are global warming and salmon extinction. We can leave our children a better Northwest if we meet them, and a far worse one if we do not. This paper examines these interrelated challenges and identifies means of meeting them that are clean, affordable and reliable while creating a vibrant economy and ensuring our nation’s energy independence.
Our electricity system is responsible for developing, operating and distributing power resources sufficient to meet current and future electric needs. That fundamental charge is now complicated by climate change. The system produces nearly a fourth of the region’s carbon dioxide emissions now,2 a relatively low percentage by national standards, reflecting the system’s hydro-heavy mix. But new demand will not be met with hydropower. Unless we choose clean-energy options, future generation facilities could emit nearly twice as much CO2 as the system now averages.3
Northwest utilities, overall, have been making great strides in adding new clean energy to their mix. Energy efficiency efforts have saved enough electricity in the last 30 years to power the city of Seattle three times over. More than 700 aMW of new, non-hydro renewables have come into the system in the past 10 years, and thousands more are at various stages of development.
This is the time to build on those accomplishments. To do its part in combating global warming, the system must cut overall greenhouse-gas emissions 15% below 2005 levels by 2020 and 80% or more by 2050 and still provide increasing amounts of power at reasonable costs.
Much of the new demand will come from increased population and economic activity, generally referred to as ordinary load growth. But climate concerns will create significant additional demand for electricity, particularly to replace carbon-intensive transportation fuels. And in addition to meeting those new demands, the region must progressively shut down existing coal plants to help stop global warming and to prevent and undo damage to our environment and its inhabitants.
Some of our current carbon-free power production may have to be curtailed. For example, as pools warm behind hydroelectric dams and temperatures rise in upstream spawning streams, already endangered Northwest salmon will need a larger share of basin water to escape extinction. The electric generation lost to assure salmon survival will have to be replaced.
Fortunately, our region is blessed with abundant resources and tools for meeting these challenges. Those begin with:
Enough energy-and money-saving measures to ••meet all new demand.
Opportunities to harvest both heat and electricity ••from the same unit of energy.
Vast development potential for wind, solar, ••geothermal and other renewable energy sources.
The prospect of building a “smart grid” to ••capture system-wide efficiencies and facilitate the integration of large amounts of intermittent renewable energy into the system.
Most of these solutions are available and affordable now, using off-the-shelf technologies. Others are quickly becoming both practicable and cost effective. After decades of incorporating
INTRODUCTION
4 Update 1, July 2009

new sources into the grid, power system operators are well prepared to capitalize on these opportunities.
Thus the region has the resources and know-how to meet the climate challenge. Now it comes down to will — especially political will. Northwest decision-makers must adopt and adhere to strategies that will take us from the unsustainable present to the clean-energy future.
This paper presents a blueprint for keeping the lights on, the good jobs growing, the rivers running and salmon swimming in the Pacific Northwest.
Part I outlines and quantifies our challenge:
Reduce CO2 pollution 15% by 2020 and 80% or ••more by 2050.
Reduce dependence on imported petroleum.••Meet all new electricity needs due to population ••and economic growth.
Electrify our cars, trucks and transit.••Phase out coal power.••Provide the water needed for salmon survival and ••the clean power to replace lost hydroelectricity production.
In total, the Northwest will need just over 25,000 aMW of new energy efficiency and clean renewable energy by 2050, about a fourth of that by 2020.
Part II provides the game plan for meeting the challenge. The practical solutions begin with further accelerating the pace of regional energy efficiency achievements. By taking advantage of technological evolution and co-generation opportunities, the region can save enough electricity to
cover the growth in ordinary power demands. Building the “smart grid” will help save energy, flatten demand spikes and allow thousands of “smart appliances” and electrically fueled vehicles to provide some much-needed storage for intermittently produced renewable energy. Storage will be important to help the system integrate up to 10,000 aMW of new clean renewable energy by 2050, a fraction of the region’s renewable energy potential. Least-cost wind will dominate development in the beginning, but solar, geothermal, biomass and other technologies will increasingly become cost-effective.
As clean renewables are added to the grid, inflexible coal plants will be removed. Less polluting and more flexible natural-gas plants initially will run more often, but less over time as the smart grid develops, to fill in for dips in renewable energy generation.
Part III compares the costs of these feasible clean energy solutions with those of continuing along our current energy path. We look at two scenarios: continued business-as-usual and the Bright Future described in Parts I and II. We find that the new clean-energy initiatives needed by 2050 might collectively add about two-thirds of a cent more to the price of a kilowatt-hour of electricity than continued business-as-usual, even when we exclude the near-certain and rising costs of emitting carbon. The paper also includes an article (page 17) by noted Northwest economist Dr. Thomas Power on the job, income and business benefits of the Bright Future versus the business-as-usual path.
We conclude with policy recommendations aimed at realizing this low-carbon, clean, affordable, job-producing and salmon-restoring energy future.
To do its part to stop the warming of our planet, the Northwest must reduce its greenhouse gas emissions at least 15% by 2020, and 80% or more by 2050. These targets, representing the verdict of the U.N. Intergovernmental Panel on Climate Change and consistent with the near-term goals of the Western Climate Initiative,4 must be met if our region and our planet are to escape true climate-change catastrophe. Several states, including Washington and Oregon in this region, have adopted loftier goals, at least in the short term.
With its glowing history of clean-energy achievements, the Northwest electric power system and the people who run it are well prepared to meet and even exceed these goals.
The system’s challenge is to do so while satisfying rising electricity demands, adapting to climate-forced changes in supply and demand, retiring coal plants that now serve the region, modifying hydrosystem operations to avert salmon extinction, and integrating large amounts of intermittently generated new renewable energy.
Climate changesGlobal warming will profoundly affect the regional power system in at least three interrelated ways. It will:
Alter the predictable rain and snowfall patterns on ••which the hydrosystem so fundamentally depends.
I. THE SHAPE OF THE CHALLENGE
5Update 1, July 2009

Shift the highest Northwest power demands ••from winter toward summer months, just as summertime hydropower potential is falling.
Alter and intensify the competition for river and ••water resources to meet irrigation, transportation, recreation, flood control, municipal, fish and wildlife, industrial and overall power needs.
Increase the number and severity of extreme ••weather events, including cold-weather events. The winter of 2008-09 featured record cold spells followed by quick melting and record flooding in some parts of the Northwest.
Just how these interactions play out is hard to predict; in fact, unpredictability is all that is certain. Most scientists agree that the hydrograph, or runoff pattern, is changing. Historically, slowly melting snowpack from late fall and winter precipitation, along with groundwater flows into the tributaries, have provided steady Columbia Basin river flows through summer to early fall. Salmon and steelhead migration has evolved around this pattern, as have the regional power and flood-control systems. Because of this pattern, large transmission lines were built to send excess hydropower to the Southwest in spring and summer and bring in power to meet high Northwest heating demands in winter.
Warming may not greatly affect precipitation totals, but will result in more rain and less snow.5 Much of the rain will flow directly into streams. The snow that does fall will tend to melt earlier, beginning as early as December or January, resulting in a longer low-flow period and lower summer flows. The likelihood of earlier and more rapid snowmelt will affect the dams’ flood-control operations. To guard against potential flooding, dam operators will have to lower storage reservoirs in the winter further than they currently do, decreasing the possibility of achieving 100% refill by the spring. Together these factors mean less stored water will be available for fish migration, irrigation and hydropower in some years.
Shallow run-of-the-river dams, such as the four lower Snake River dams in arid eastern Washington, will lose value as reduced water flow curtails their summer and fall electrical output. The hydrograph changes will reduce dam operators’ ability to align generation with need, most critically during summer peaks when California utilities pay top dollar for our spare power.
Changing electric demand patterns are already evident. Reduced fall and winter heating loads and rising air-conditioning use are progressively shifting electric needs – both average and peak – from winter to summer.6 Winters will still feature periods of extreme and even record cold,
but those events do not negate the overall trend — either globally or regionally.
Summer will be the time of greatest competition for river resources – just when those resources are running low. For example, warming will raise water temperatures in reservoirs behind shallower, run-of-the-river dams to levels lethal to migrating salmon and steelhead.7 In response, those dams will likely have to be run at minimum operating pool during warm months to keep the waters moving and temperatures down. Further changes could include curtailing or ending summertime navigation, extending irrigation intakes below minimum operating pools or, ultimately, removing the most problem-causing dams. All these responses will reduce the dams’ generation capacity.8
The Northwest hydroelectric power system must adapt to these climate-related changes. It must cope with altered hydrological and power-use patterns. It must adjust and in some cases reduce hydropower generation to help maintain healthy rivers and wild salmon through the era of warming. It must do all this while simultaneously reducing direct, system-wide, greenhouse-gas emissions.
Growing electric demandProjections of future electric demand vary according to assumptions about future power prices (higher prices reduce demand), new end-use technologies and the level of investment in energy efficiency. In September 2008, the region’s official power planning agency, the Northwest Power and Conservation Council, forecast electric needs increasing about 1.7% per year.9 As we will see below, current Northwest conservation programs are shaving that down to about 1% per year.
The Council’s growth projection, which is generally consistent with Northwest utilities’ estimates,10 translates to about 340 aMW of additional electric demand each year.
Thus we project that the need for electricity for traditional uses will grow by about 4,000 aMW by 2020, and by another 12,000 aMW by 2050. For comparison, total current demand is about 21,000 aMW.
Today, Northwest utilities are exceeding regional energy efficiency targets. The region is now reducing usage by more than 200 aMW of energy a year through increased efficiency. Further energy efficiency efforts can capture the remaining 140 aMW needed to more than meet yearly demand growth. Demand growth projections, however, now must also account for the electrification of cars and trucks.
6 Update 1, July 2009

Drastic reductions in carbon emissions from transportation will be needed to slow global warming, and the Northwest electricity system must assist in that endeavor by providing clean power to charge batteries in millions of electric vehicles.
About 23% of Northwest CO2 emissions come from electrical generation, and 46% from transportation.11 We can reduce transportation-related emissions by:
Cutting per-person vehicle miles traveled ••through electronic virtual transportation (videoconferencing, webinars and teleconferencing), mass transit, increased urban density and individual decisions to walk or ride bicycles.
A wholesale switch to electric and hybrid-electric ••cars and trucks. Eventually, electricity-powered vehicles should achieve the petroleum equivalent of more than 100 miles per gallon.12
The electric power system has an opportunity to extend its own clean-energy leadership into the transportation sector, and get some very important benefits in return.
The Northwest Power and Conservation Council recently studied the grid impacts of a large regional move toward plug-in electric or hybrid gas/electric vehicles.13 The study assumes that by about 2030, a fourth of the region’s cars and small trucks – about 2.5 million vehicles – will be plug-ins, adding about 500 aMW to regional power needs.14 By 2050, virtually all cars and trucks on Northwest highways – about 10 million vehicles – could be electrically powered, increasing demand about 2,000 aMW, nearly twice the electricity annually consumed by customers of Seattle City Light.
The greenhouse-gas emission reductions would be enormous. Using natural gas to generate electricity to fuel 2.5 million electric cars and small trucks would increase the electric system’s total CO2 emissions by about 4 million tons a year; using renewables would add little or no CO2. Meanwhile, annual vehicle emissions would be slashed about 12 million tons, so even in the natural gas scenario, the net reduction would be at least equal to closing down three 400-megawatt conventional coal plants.
As we’ll discuss later, the electric system would reap substantial additional benefits from the ability to remotely control the charging and discharging of electric vehicles’ batteries while they’re plugged into the grid.
Retiring coal plants Although the regional power system is dominated by hydropower, it generates significant global-warming emissions – an estimated 59 million tons in 2005.15 Most of that pollution comes from 14 conventional coal plants with a combined capacity of 7,310 megawatts.
The following list details the coal-fired power plants that serve Northwest electric needs, along with their primary owner, size and year of initial operation. Under the Bright Future scenario, almost all would be retired and replaced with affordable, carbon-free resources.16
The focus on retiring coal rather than natural gas-fired plants makes sense for two reasons. First, gas plants generate less than half the CO2 per unit of power that coal plants do, produce fewer other pollutants, and come with lower capital costs. Second, new gas plants are more flexible for meeting shifts in demand, integrating variable resources such as wind, and reliably serving severe peaks.
Meeting the 15% by 2020 reduction goal means cutting annual CO2 emissions by nearly 9 million tons, equal to the output of three average-sized coal plants. The 2050 targets translate to annual emissions 50 million tons lower than today’s, which means ending the emissions from 6,600 megawatts of coal – in other words, most of this region’s coal plants.17, 18
7Update 1, July 2009

Saving salmon Most Columbia/Snake basin wild salmon and steelhead already are endangered or at risk, and climate change is increasing the stress on their spawning, rearing and migratory habitats. Preventing their extinction and restoring their abundance will require cold water, more free-flowing water and just more water, period. That means changing and, in some cases, reducing hydropower production, and developing emissions-free replacement power.
The lower Snake River stocks hold special ecological value. Because their spawning habitats in eastern Oregon and central Idaho are by far the highest, coldest, healthiest, best protected and best connected in the lower 48 states, these species have a better chance than other stocks of surviving global warming. Thus, protecting their migratory passage is like building a Noah’s Ark for salmon survival.
The best available science indicates that the surest and perhaps only way to restore these wild salmon stocks is removing four federal dams on the lower Snake River by 2020 – an option that would reduce hydro generation by 1,075 aMW19 and somewhat lessen the hydrosystem’s ability to adjust generation to meet demand fluctuations or to capitalize on periods of high power sales prices.
As this report will show, increased energy efficiency and renewable energy development can easily replace the dams’ annual energy production. Increased reliance upon natural-gas generation may be needed initially to replace another valuable service the dams provide to the power
system: the ability to ramp up electricity production briefly either to meet spikes in demand, to smooth out variable generation from such resources as wind or solar power, or to deal with emergencies. This important service – known as “capacity” – may be performed in the short term by gas-fired combustion turbines that can vary their electrical output as rapidly as dams can. In general, existing gas turbines would be ramped up and down more often, although total annual generation might not increase. Some new gas plants may be needed for this purpose.20
The four lower Snake dams play a role – a small one relative to the regional hydroelectric system’s overall storage capacity – in helping the system incorporate intermittent power, especially from generation sources such as wind. But that role can be performed by electricity storage, including plug-in cars and trucks with storage batteries, other emerging storage technologies and smart appliances, demand-side management or existing flexible gas-fired generation. Replacing the four dams’ small contribution to renewable energy integration is part of a broader issue. To meet the region’s carbon-reduction targets, we will need thousands of megawatts of new renewable energy from wind, solar, geothermal and biomass, and probably wave and tidal later on.
SummaryThis paper looks at two benchmark years, 2020 and 2050, reflecting the timeframes used by international climate
Chart 1
Chart 2
8 Update 1, July 2009

scientists, proposed federal legislation and individual states.To meet the Northwest’s carbon dioxide emissions-reduction targets for 2020, the power system must:
Serve or avoid 4,000 aMW of new ordinary ••electricity demand.
Serve 500 aMW of electric vehicle load.••Replace a little more than 1,000 aMW of power ••plus up to 2,000 megawatts of capacity from the four lower Snake River dams.
Retire and replace with clean energy the power ••from 1,000 aMW of existing coal plants.
Assuming those goals are met, meeting the Northwest power system’s 2050 carbon dioxide emissions-reduction targets will require:
Serving or avoiding another 12,000 aMW of new ••electric demand.
Serving another 1,500 aMW of electric vehicle ••load.
Retiring and replacing with clean energy the ••power from another 5,600 aMW of existing coal plants.
As Chart 2 shows, to satisfy growing demands while slashing greenhouse-gas emissions, the Northwest power system must develop 6,500 aMW of new energy efficiency and renewables by 2020, and another 19,100 by 2050, for a total of 25,600 aMW of new carbon-free power.
Part II lays out a reasonable, responsible and achievable plan for meeting our challenge.
By 2050, the Northwest will need more new carbon-free power than the total amount of electricity the region now consumes. The power system must develop and incorporate 25,600 aMW of new energy efficiency and new clean power from renewable sources to fulfill its responsibilities for addressing climate change, keeping the lights on and recovering salmon.
We are not starting from zero, however. In the last few years, regional utilities have exceeded energy efficiency goals and significantly advanced renewable energy development. The Northwest has skilled citizen and utility problem-solvers and 30 years of experience with basic technical and policy tools to deliver energy efficiency and renewable energy resources. The states, provinces and federal governments of the United States and Canada are fashioning new policy tools, including renewable portfolio standards, emissions performance standards and carbon cap-and-trade or carbon tax systems.
These new policy tools join those we’ve plied successfully for years. We can draw on the rapidly filling regional toolbox to build a clean and affordable energy future with abundant salmon, thousands of good green jobs, a healthy economy and a stable climate. We need only the foresight and will to do so.
Energy efficiency Energy efficiency (or energy conservation21) is the first and foremost strategy for combating climate change and satisfying growing power needs. Using power more
efficiently is the surest, quickest, most reliable and least expensive way to reduce carbon emissions, and can be done without diminishing our quality of life. It’s not about shivering in a dark house and foregoing basic comforts, but doing more with the same amount of power, or using less power to do the same things. As Amory Lovins famously noted, low-cost energy efficiency is not just a free lunch, it’s the lunch you’re paid to eat.
Efficiency is a boon to the power system and its customers and climate change increases the urgency of making significant energy efficiency gains. Global-warming concerns aside, energy efficiency should be pursued for the money it saves families and businesses, its role in enhancing national security and the good, local jobs it creates. Energy-saving products and efficiency programs bring many more regional jobs per kilowatt-hour than do large fossil-fuel plants.
In addition, energy efficiency:
Often reduces loads most when system use ••is greatest. An efficient air conditioner, for example, produces the bulk of its savings on the hottest days.
Reduces the need for power system reserves ••because it never suffers outages.
Loses nothing in transmission•• 22 and, in fact, frees up valuable transmission capacity.
Most importantly, though efficiency measures ••carry a cost, they reduce consumer bills immediately.
II. SOLUTIONS
9Update 1, July 2009

It’s easy to see why policymakers make energy efficiency the No. 1 resource for stopping warming, saving money, creating jobs and helping salmon.
We can build on the Northwest’s long and successful history of making electricity use more efficient as well as affordable. An even broader array of existing efficiency technologies must be deployed now to reduce our carbon impact while a more extensive set of technologies is developed. A reasonable goal is to meet all of the region’s ordinary load growth – 4,000 aMW by 2020 and 12,000 more by 2050 – through more efficient use of our existing resources.
Given recent trends, these are quite plausible targets. We need to keep doing what we’re doing now and more so.
What we’re doing now. Typical efficiency measures have included insulating homes and replacing inefficient lights, air conditioners, space- and water-heating equipment, windows, appliances, motors, etc. Since 1978, according to the Northwest Power and Conservation Council, utility efforts have resulted in region-wide energy savings totaling nearly 3,700 aMW, enough to meet about 18% of current demand or the electricity needs of 3½ Seattles.
Those savings came at an average cost of less than 2.5 cents per kilowatt-hour — less than the wholesale cost of federal hydropower and 50-80% less than what utilities now pay for other new sources of power.23 Energy efficiency cut regional demand growth in half over the last 30 years, saving Northwest families and businesses $1.6 billion per year while avoiding 14.3 million tons of CO2 emissions each year.
The Northwest has consistently outperformed experts’ predictions of regional efficiency gains. The Northwest Power and Conservation Council produces 20-year regional power and conservation plans every five years, and here are some examples from the 1st Plan, released in January 1983:
The 1983 plan called for achieving 85% of ••residential space heating savings potential by 2002. The region met that goal in 1992.
The plan foresaw a 43% improvement in the ••efficiency of new residential refrigerators by 2002. The region met that goal a full decade earlier, even though most refrigerators had become larger and more were frost-free than before.
Freezer and dishwasher efficiency improvements ••also far exceeded the plan’s assessment of achievable potential. Freezers met the 20-
year efficiency target in one year and by 2002 were using 45% less energy than the plan had considered achievable. In 2002, dishwashers were using 32% less energy than they did in 1983, far exceeding the plan’s 24% savings goal.
Forecasters have found technological improvement difficult to predict. But it turns out that improvement is the rule, not the exception. Lighting is the classic example. In 2002, about 9% of all light bulbs purchased in the Northwest were compact fluorescents, which compared quite favorably with the national average of just over 1%. By the end of 2004, thanks to aggressive marketing and awareness campaigns, the region’s average had shot up to 32%, while the national average rose to just 4%.
The lesson is clear: the more efficiency we do, the more efficiency we can do in the future. But the foregoing examples also illustrate a consistent under-estimation of conservation potential that continues through this day. The Council’s most recent power and conservation plan, issued in 2004, called for annual acquisition of 120-140 aMW of new, cost-effective conservation. In 2007, utilities in the region acquired 207 aMW and in 2008 acquired 235 aMW.
Much more efficiency can be steadily acquired by maintaining and accelerating the current pace of savings achievement, and by pushing the development of new energy-efficiency technologies.
Growing opportunities. Energy efficiency tools constantly and often strikingly evolve. Technologies advance, designs change, system operations improve. The well of energy savings never runs dry.
Today, the promise of new energy efficiency technology breakthroughs is greater than ever. Here are some noteworthy examples:
Heat pump water heaters.•• Using similar technology to the heat pumps now used for space heating, these units cut water-heating energy need in half.
Ductless heat pumps.•• Heat pumps that can operate well below freezing are just becoming commercially available.24 Because they’re ductless, they can be installed at far less cost and thus can be cost effective for apartments, condos and other formerly uneconomic applications.
Solid-state lighting.•• LEDs (light emitting diodes) are currently cost competitive in just a few niche applications, such as desk lamps and holiday lights, though costs are quickly falling. LEDs are
10 Update 1, July 2009

only about 10-20% more energy efficient (in terms of raw light output) than compact fluorescents, but feature far superior directionality, color rendition and controllability. They’re good when dimmable lights are needed and in outdoor systems linked to motion sensors. As their applications expand, LEDs will drive the next generation of mercury-free efficient lighting technology.
Information technology and entertainment.•• Huge savings are about to be realized in this rapidly growing sector. Virtual servers that share computing tasks will reduce the number of physical servers. “Dumb PCs” will access all files and programs from central servers, obviating the need for local storage and computing power. Improved desktops will cut power use 75%. Organic LEDs will cut flat screen energy use by the same percentage.
Better battery chargers and power supplies.•• Residential and commercial plug loads are the fastest-growing component of residential and commercial building electric demand. In the next few years, new standards will mandate big improvements in battery chargers and power supplies for our billions of electronic devices.
Evaporative air conditioners.•• Units using less than half the power of conventional units are rapidly dropping in price.
Super-efficient, low-emissions buildings.•• Buildings incorporating efficient energy use with geothermal- and/or rooftop solar-generated power should be realized in the next 15 to 20 years.25 The American Institute of Architects has endorsed the Architecture 2030 goal of making all new buildings low or “net-zero” carbon emitters by 2030. Several net-zero carbon buildings already exist.
Commercial and industrial load reductions.•• Power demand can be dramatically reduced at computer data centers (called server farms), silicon chip factories and water treatment plants. A host of so-called “smart” technologies can be employed to optimize machine and building energy use.26
The pace of innovation should continue, providing new opportunities for future efficiency investments. Nearly two-thirds of all the conservation identified in the Council’s 5th Power and Conservation Plan came from new measures and applications that were either too costly or not available when the 4th Plan was issued five years before.
Higher energy costs and growing awareness of the environmental cost of greenhouse-gas emissions will push innovation even further. History shows that we are in no danger of exhausting the so-called “low-hanging fruit” of cheap conservation. Rather, the more cost-saving energy efficiency we do now, the better we’ll be positioned to seize on future technological advances and to make ever-greater efficiency gains.
Potential and recommendation. In Part I we noted the Northwest’s need for more than 25,000 aMW of new clean energy by 2050. As the largest, cheapest, surest and most economy-boosting new carbon-free resource, energy efficiency is the cornerstone of our clean energy future.
The explosion in energy-savings options demonstrates that the region can significantly increase its efficiency targets and accomplishments. In fact, Northwest Power and Conservation Council senior analyst Tom Eckman believes 400 aMW per year of cost-effective savings, including those resulting from improved codes and standards, are quite achievable right now.27 That level of achievement would more than cover all projected load growth.28
The forecast for ordinary growth in demand discussed earlier (1.7% per year) works out to about 340 aMW per year. A reasonable goal for the region is to cover this growth solely with energy efficiency programs. This result is consistent with a nationwide study recently released by the American Council for an Energy-Efficient Economy (ACEEE).29
Thus we recommend establishing an enforceable region-wide savings target of at least 340 aMW a year, and reviewing and boosting that target every five years as new technologies arise and costs fall.30 Utilities, businesses and other affected sectors should have great flexibility in how they meet their shares of the target, but achieving the target must be mandatory.
Chart 3 (see next page) illustrates how saving 340 aMW per year will set the region well on the way to meeting its climate challenge. And the more we save, the less we’ll have to spend on more expensive new generation. The time has come for an aggressive strategic expansion of energy efficiency work – across business, government, consumers and utilities. We know the path; now it’s a matter of steadily following it.
11Update 1, July 2009

Combined heat and power Combined heat and power (CHP — sometimes called co-generation) is a significant and largely untapped efficiency resource. CHP involves recycling waste heat produced at an industrial site or commercial building from on-site electricity generation to supplant energy that otherwise would have been used. A typical example is installing a small gas-fired turbine that satisfies both the building’s electricity needs and its hot water or steam needs. The turbine replaces less-efficient boilers and electricity from the grid. In the past, the region’s low energy prices made this practice cost-effective only for large pulp mills, food processors and refiners. But higher fossil-fuel costs and new small-scale generating technologies have substantially increased opportunities, especially for smaller applications.
The Oak Ridge National Laboratory published a comprehensive study of Northwest CHP in 2004,31 finding an estimated 14,425 megawatts of new technical potential in the region.32 About two-thirds of that potential involves existing facilities, one-third new ones. The estimated total new potential compares to about 2,500 megawatts in service at the time of the study. Oregon currently leads the region by producing 18% of its power from CHP; Idaho gets 6% from CHP and Washington, the region’s largest energy producer, comes in at less than 4%. Large industrial facilities account for more than 90% of the region’s existing CHP, but about three-fourths of the future potential is found in small industrial and commercial/institutional settings.The Oak Ridge study uses a cost-effectiveness filter to
calculate CHP’s “Economic Market Potential.” With modest incentives covering 15% of initial capital costs and removal of grid-connection barriers, the study estimates that 5,100 megawatts of cost-effective CHP are available in the region.
While CHP has been heralded as a great efficiency opportunity for the past 20 years, the region has struggled to fully develop this resource. Proactive policy and regulatory actions will be necessary to increase deployment of CHP technologies.
The ‘smart grid’ Just in its infancy, the “smart grid” uses information technology to connect and control myriad applications. For example, smart buildings, smart appliances and electric vehicles can be connected to residents and/or utilities via two-way, Web-based communications. The smart grid:
Allows utilities to control and shape power ••demand and store energy based on real-time price information and grid reliability needs.
Allows homeowners, businesses and factories to ••control power use, to save money and to schedule equipment operation.
Helps utilities optimize their distribution networks ••and better incorporate renewable energy resources, small-scale distributed resources and load-management technologies.
Lets customers and utilities analyze power-use ••patterns and uncover cost-savings opportunities.
Within the next 10 years, most energy-intensive appliances – including furnaces, water heaters, refrigerators, freezers, etc. – will be manufactured with chips that will connect them to the meter through a wireless home or business network.
This paper looks at only two major smart-grid applications: remote control and remote storage.
Remote control. A good example of smart grid potential is its application to rooftop commercial heating-ventilation-air conditioning (HVAC) systems. These expensive, energy-guzzling units can account for much of commercial buildings’ energy use and contribute mightily to utilities’ winter and summer peak demands. Surveys show that more than one in three commercial HVAC systems does not work properly, mainly because of stuck dampers, low refrigerant or dirty filters. In response, architects usually over-design the systems with extra capacity, fans and venting — raising costs significantly.
New systems include sensors and remote control technologies that can diagnose problems and inform
Chart 3
12 Update 1, July 2009

operators of problems when they arise, even at remote locations. Proper maintenance avoids premature replacements and saves energy. And since they can count on proper operation, architects need not over-design.
Utilities could use sophisticated remote controls to shut off HVAC units during power emergencies or to raise temperature settings a few degrees when power costs are high during a few peak summer hours. The savings can be shared with the building owner/user as payment for permitting limited utility control. The utility benefits because shaving peaks lessens the need to keep expensive spare generation on hand or to buy expensive market power.
The region has used some direct load-control devices (air conditioner cycling, for example) but only on a limited basis and often using one-way communication that does not permit dynamic interaction between the utility and the device (or customer). Idaho Power demonstrated the potential by shaving 48 megawatts off its summer peak in 2007 and 54 MW in 2008 through load-control programs involving irrigation and residential air conditioning.
Remote storage. As noted in Part I, electrifying millions of vehicles can slash transportation-sector emissions and lower driving costs. Most of the charging would occur during low-demand nighttime hours when the grid is underutilized, so the effect on power system demand would be minimal. In fact, transportation sector electrification may be more of an opportunity than a problem for the power system. It offers the possibility of vast, distributed energy storage.33
Vehicles can plug into the smart grid while their owners are at home or at work. Utilities may draw on those batteries to meet demand spikes and recharge them when demand drops. Millions of electric cars and trucks plugged into the grid thus would save utilities enormous amounts of money. They could help integrate huge amounts of wind and other intermittent renewables at low cost. Finally, the need for hydropower generation adjustment (ramping up and down to follow changes in loads), on which our region depends for grid flexibility, could be reduced, making rivers friendlier to fish.
Inexpensive chips that allow appliances to communicate with the grid offer tremendous storage opportunities.Remotely adjusting water heater and freezer temperatures by a few degrees would provide thousands of megawatts of extremely low-cost storage capacity and go largely unnoticed by consumers. The Council estimates that once a smart grid backbone is created, hooking up the region’s water heaters would provide more than 15,000 MW of controllable capacity for only a few dollars per appliance.
Ice is another form of storage. During periods of low energy use, commercial air conditioners can switch to making ice, saved in thermal storage units. Later, the ice chills the cooling system as needed.
These smart grid applications provide two benefits: inexpensive integration of intermittent power, and demand reductions when the system is peaking or stressed.
New renewable generation Energy efficiency is our gold mine for new, clean, affordable energy, but meeting the region’s climate change and extinction challenges will require the power system to develop and integrate 7,000-10,000 aMW of new clean renewable energy on top of the roughly 1,800 aMW of wind and biomass energy now being produced.
Developing renewables. The pace of regional renewables development has accelerated in the past few years. The region’s first commercial project (Foote Creek wind) went into operation in 1998. By August 2008, another 700 aMW of new non-hydro renewables — mostly wind — were providing clean energy to the Northwest.34 That significant achievement pales in comparison to the new renewables now in the pipeline, as Chart 4 shows. While not all projects may be completed, the rising potential and investment interest are clear.
Chart 4
13Update 1, July 2009

Even the projects now in the pipeline represent just the tip of the iceberg in terms of Northwest cost-competitive renewables potential. Chart 5 details the region’s wind, solar, biomass and geothermal energy potential.35 It also shows that those four resources alone could more than meet all regional electric needs in 2050.
Montana holds the vast majority of that potential: more than 120,000 aMW, nearly six times the region’s current electricity consumption. Most of that is wind, and capturing that resource would require a large investment in transmission capacity. But given the very high capacity factors of Montana wind resources (typical capacity factors greater than 40% compared to 30-35% for most existing sites), realizing at least a fifth of that potential should prove economic.36
Tapping our domestic wind resources brings a host of economic benefits, especially to counties and landowners in rural areas where the strongest wind resources are often located. Wind farms are compatible with farming and ranching, and royalties from hosting turbines can help keep farmers and ranchers on the land. Wind farms are also capital-intensive facilities, infusing money into the local economy during construction phases and paying property taxes to the host county as well as royalties to local landowners for the life of the project.
For example, the 24-MW Klondike Phase I Wind Farm in Oregon, a very small project compared to many being
constructed today, contributes 10% of Sherman County’s property tax. Landowners earn $2,000 to $7,000 annually for each modern wind turbine located on their land.
In contrast, $350,000-$500,000 leaves the Northwest economy each year to pay for the (mostly Canadian) fuel that generates just 1 aMW of gas-fired electricity. A typical gas-fired turbine might drain the regional economy of more than $100 million every year.37 Wind facilities also produce more than three times as many local jobs per kilowatt-hour than do coal or natural gas plants.38 Wind energy is a homegrown energy source that strengthens the economy and increases the nation’s energy security. Also, more and more wind and solar manufacturing plants are locating in the Northwest and the United States generally, creating local jobs in development, installation and operation of the new projects.
Technological improvements are lowering the costs of large- and small-scale solar, offshore wind, wave, algae and cellulosic ethanol, and second-generation geothermal resources. Solar is probably the most promising. Several very large (100- to 600-MW) utility-scale concentrating solar projects slated for the desert Southwest have already obtained approvals and utility purchase contracts.
Distributed small-scale solar, including rooftop photovoltaic and solar hot water systems, is another huge opportunity. Photovoltaic systems are not well suited to wetter parts of the region and are still quite expensive, but
Chart 5
14 Update 1, July 2009
costs are dropping rapidly. Solar hot water systems already are cost effective for many buildings with sunny rooftop access. The power produced by small, distributed projects requires no new transmission lines and avoids transmission and distribution losses that often exceed 10% of the total generation from remote sites. Given the downward trend in photovoltaic costs, our own homes and businesses eventually could produce much of the power we need.
The energy production of non-wind renewables is less variable than that of wind, and thus easier to integrate into the system. Solar power generation complements wind and closely matches demand patterns. Newer concentrating solar projects now incorporate thermal (e.g., liquid sodium) storage to extend their ability to provide reliable power on cloudy days or for hours after sundown. Solar can be the next wind, especially if we commit to making it so.
In the near term, low-cost wind will remain utilities’ primary renewables choice.
Integrating renewables into the grid. The region must not only develop up to 10,000 aMW of new, clean renewable energy by 2050. It also must integrate that power into the system, which means matching a lot more variable generation, especially from highly variable wind, to shifting demand.
But for grid operators, this is no new problem. Today, demand can fluctuate 50% or more over the course of a few hours — for example, from a cool early morning
to hot afternoon. Since baseload nuclear and coal plants running flat-out cannot be cheaply adjusted to follow loads, grid operators rely on the ramping ability of natural gas-fired turbines and hydropower.
As more renewables enter the system, their sheer number, variety and geographical dispersion will smooth out much of the intermittency. Advanced storage technologies combined with the smart grid — such as the use of electrically powered vehicle batteries and controllable water heaters — will help, as will increased energy efficiency efforts that lower demand peaks. In the interim, the system must make room for the new renewables by progressively closing inflexible coal plants and covering renewable power production gaps by running gas turbines more and spare hydro capacity if and when available.
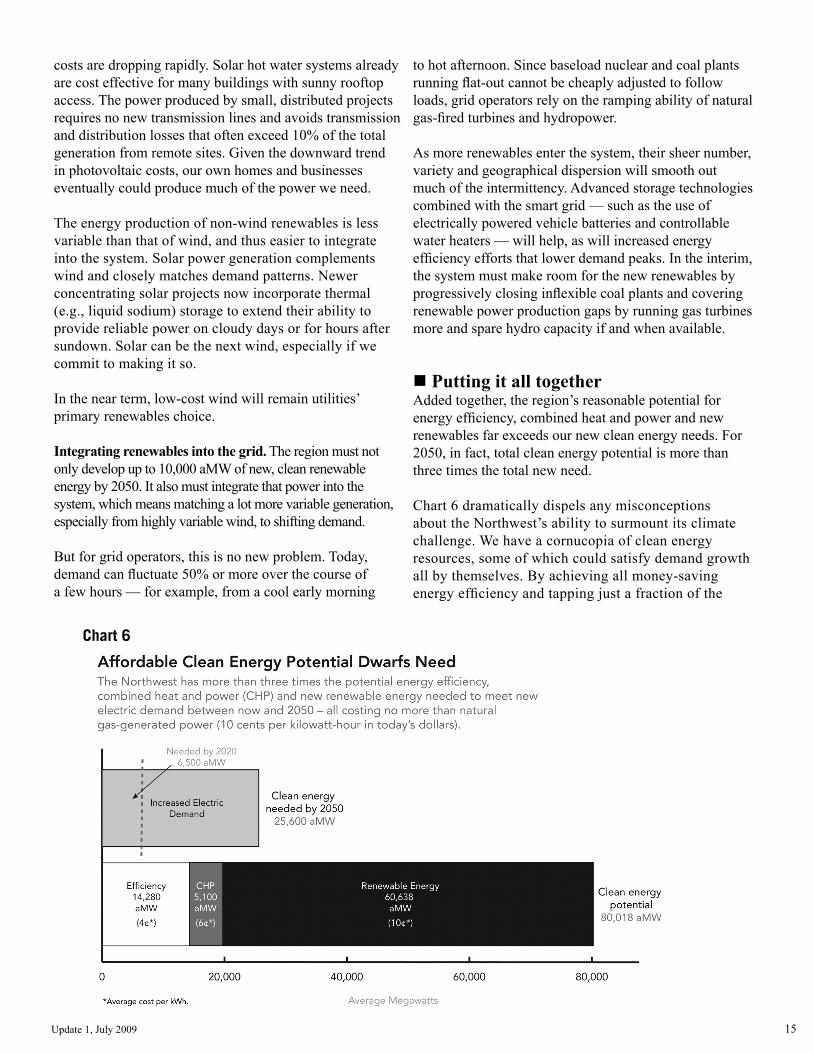
Putting it all togetherAdded together, the region’s reasonable potential for energy efficiency, combined heat and power and new renewables far exceeds our new clean energy needs. For 2050, in fact, total clean energy potential is more than three times the total new need.
Chart 6 dramatically dispels any misconceptions about the Northwest’s ability to surmount its climate challenge. We have a cornucopia of clean energy resources, some of which could satisfy demand growth all by themselves. By achieving all money-saving energy efficiency and tapping just a fraction of the
Chart 6
15Update 1, July 2009

available new renewable opportunities, we can do our part in holding back global warming, adjusting to already occurring climate changes, and serving the needs of energy consumers and fish and wildlife.
We can meet the challenge. The questions are whether we have the will to do so and how much it will cost.
We must make a choice. We can say we’ve accomplished enough and backslide toward business-as-usual, hoping against hope that our children and our world will miraculously escape the fiscal and physical tragedy of catastrophic climate change. Or the region’s electric power system can continue to move forward, planning conscientiously and fulfilling its responsibilities in the fight against global warming. That path leads to the Bright Future that this paper has shown to be both possible and practical.
This section shows the Bright Future is affordable – in fact, it’s an excellent bargain. It won’t be free, of course. Comparing simple direct costs only, as this paper does, the Bright Future appears slightly more expensive than business-as-usual. That calculation comes with all the caveats appropriate to forecasting so far into the future.
A more comprehensive cost analysis would assess a much broader range of costs, avoided costs and other benefits. We’ll touch on some of those before proceeding to the simple direct cost comparison.
Collateral costs and benefitsThe extended benefits of the Bright Future strongly outshine business-as-usual benefits. The Bright Future’s collateral benefits that are not represented in our simple cost model include:
Restored salmon runs and fisheries, along with ••the sports, commercial and tribal fishing jobs and associated economic development.
Energy, emissions and utility-bill savings from ••more efficient homes and businesses.
Reduced transportation costs.••Heightened national security.••Local economic development and green jobs ••created by investments in renewable power and energy efficiency.
That last collateral benefit is taking on ever-greater
importance. Farmers need supplemental income to stay on their land. County and local governments are desperate for the dollars needed to provide essential services. And we need jobs – well-paid, permanent and local jobs in energy efficiency services; jobs for Longshore workers unloading renewable-energy parts and systems at our ports; jobs making and selling energy-efficient and renewable-energy equipment; jobs in construction; jobs weatherizing low-income families’ houses; and jobs saved or added because businesses pay less to heat and light their shops and factories.
Business-as-usual severely limits job creation. Chart 7 contrasts the number of local and regional jobs associated with various means of generating (or avoiding production of) 1 aMW of electricity.39 Energy efficiency brings three times as many jobs as coal or natural-gas generation, wind and biomass nearly twice as many. Solar photovoltaic’s job potential is huge.
By instead choosing the Bright Future, the electric power system creates jobs and does its part to avoid the staggering costs of accelerated global warming to our economy and our environment, especially in the highly vulnerable Pacific Northwest. According to the Northwest Power and Conservation Council, the region’s
Chart 7
III. COSTS
16 Update 1, July 2009

power system is now responsible for 23% of the region’s greenhouse-gas emissions and business-as-usual will increase those emissions 18% by 2024, an additional 10.6 million tons of CO2 per year. And after 2020, when several states’ renewable-energy standards have been met, power system greenhouse-gas emissions will grow even faster.
We lack reliable region-wide estimates of how much climate change will cost. We can get an idea of the types of costs from “Impacts of Climate Change on Washington’s Economy,”40 a study produced for the state’s Department of Ecology and Department of Community, Trade and Economic Development.
Using scientists’ projections of an average 2 degrees Fahrenheit rise (from the period ending in 1999) by the 2020s and a 3-degree rise by the 2040s, the study projects:
A 50% rise, to $75 million a year, in wildfire-fighting ••costs by the 2020s, not including timber losses.
Declining water supplies for Seattle, Spokane and ••Yakima, resulting in water conservation costs of $8 million a year in the 2020s and $16 million a year by the 2040s in Seattle alone.
A dairy revenue decline of up to $6 million a ••year in two key counties by the 2040s because of warming’s effect on dairy cows.
$66 million a year in increased average crop losses ••in the Yakima area due to more frequent droughts.
Unspecified climate-change costs include those in public health, tourism and recreation due to heat-related virus intrusions, forest fire smoke and flooding. Though the study and its examples cover Washington state only, we can expect similar climate-change effects on the economies of Idaho, Montana and Oregon.
As noted, the Northwest electric power system now contributes nearly a quarter of the region’s climate change impacts and costs — rising by millions of dollars each year under business-as-usual. Viewed in that light, the Bright Future is an enormous bargain for Northwest consumers and ratepayers despite the slight increase in direct costs needed to achieve it.
CLEAN ENERGY: STIMULATING OUR ECONOMY AND INVESTING IN OUR FUTURE
By Dr. Thomas PowerChairman Emeritus, Economics Department, University of Montana
Bright Future argues that a prompt transition to a low-carbon electricity system in the Northwest that also helps restore salmon and electrify our transportation fleet is practical and achievable. It is also better for our economy. It will create more jobs and more regional economic activity than our current electricity system, and it will outperform any alternative.
The non-carbon path is best for the economies of Washington, Oregon, Montana and Idaho for at least three reasons. First, it will create more jobs than any alternative – energy efficiency jobs, renewable energy jobs, salmon jobs, transportation jobs. Second, it will keep more of the dollars we spend on electricity circulating in our states, to benefit people here rather than going out-of-region or out-of-country. Third, it will help prevent the economic destruction that unabated global warming will cause in the Northwest. I will amplify each of these reasons.
Discussions of public policies to reduce greenhouse-gas emissions usually center on what those efforts will cost us. Although any prudent economic actor keeps cost in mind when making decisions, cost by itself is not the ultimate determinant. If it were, we would never buy anything! Most of us — when we attend a concert, purchase new clothes or buy a cell phone — do not primarily curse the price we have to pay. In general, if we make the right decision, we realize that the benefits of the purchase more than justify the price. The same will be true of greenhouse-gas reductions.
Our cost/benefit comparison determines whether we think we made the right decision and improved our well-being. That common economic frame of mind must be brought to the dialogue on greenhouse-gas reductions and global warming. What matters is not just the cost of greenhouse-gas reductions but also the benefits we obtain as a result. Some benefits are direct economic gains for our households and communities; others are the avoidance of the very bad consequences associated with global warming. This distinction can be thought of
Continued on page 18
17
A tale of two pathsTo play its part in taking us to a Bright Future, the region’s electric power system must slash its CO2 emissions while spurring the economy and recovering endangered salmon. These goals can be reached. The solution lies in retiring rather than re-powering coal plants as they reach the ends of their useful lives, replacing with clean energy the power
Update 1, July 2009

Continued from page 17
as the difference between the carrots and sticks used to motivate our greenhouse gas-reduction actions.
Let’s begin with the “carrots,” the advantages of shifting to a low-carbon economy, separate and apart from the damages that global warming will do to the world as we know it. Then we will turn to “the costs of doing nothing” to limit global warming.
Stabilizing our economies. Our current high-carbon energy infrastructure provides relatively few and steadily decreasing numbers of jobs while draining large amounts of purchasing power from our communities and nation. As production of oil, coal and natural gas has risen, the jobs associated with those industries have declined. The switch to labor-displacing and machine- and energy-intensive technology has taken a steady toll on employment.
In addition, because fossil fuel production and central-station electric generation are usually concentrated in areas far away from population centers, paying for this energy drains money from our communities. The oil and some of the natural gas we buy drain money from the nation as a whole and flows to unstable and often unfriendly regimes around the world. Rather than circulating within our local economies, putting our neighbors to work and multiplying our collective wealth, our energy dollars are quickly sucked away, making our local economies poorer and less stable than they need to be.
Creating local jobs and income. Low-carbon energy strategies boost local employment and reduce the leakage of income from our communities in several ways.
First, energy efficiency measures and renewable energy sources tend to be more labor intensive than high-carbon energy industries. As a result, increasing our reliance on efficiency and renewables while reducing the use of fossil fuels creates more local jobs. One recent study found almost four times as many jobs associated with the low-carbon alternative than with continued reliance on the oil industry.
In addition, the types of jobs associated with energy efficiency and renewables match the skills of the readily available workforce in most communities. For instance, energy efficiency building retrofits require the skills of hundreds of thousands of construction trades workers
laid off due to the housing construction downturn in 2008. These green jobs can be taken by locals rather than by some distant or foreign workforce. Also, the materials used in improving the energy efficiency of our housing and building stock are much more likely to be made in the United States and obtained locally. The lower energy bills associated with efficiency improvements also reduce the leakage of purchasing power to distant energy suppliers, thus increasing the local job and income multiplier impacts of our spending. A low-carbon strategy does not burden our communities and households; it enhances them, providing more vitality and resilience to our hometowns.
Insurance against a catastrophic climate future. Of course, our focus on reducing our carbon footprint on this planet is driven by concern over the impact of high and rising greenhouse-gas emissions on the climate we share with all living creatures. These are serious impacts with which we in the Pacific Northwest have already had some experience. Higher temperatures and shifts in precipitation are projected to have all of the following impacts in the Pacific Northwest in the 21st century:
A longer wildfire season with more, larger and ••more intense fires that will clog our valleys with health-threatening smoke, shut down many summer economic activities, and burden governments with control costs.
Decreased summer stream flows that will create ••water shortages for irrigated agriculture and threaten even more the survival of endangered fisheries such as salmon.
Extended drought-like conditions for dry-land ••agriculture east of the Cascades.
Reduced snowpack in the mountains, affecting ••agriculture, hydroelectric generation, forestry, fisheries and both winter and summer recreation.
Shoreline erosion from more intense storms and ••rising sea levels.
Habitat and ecosystem changes affecting ••wildlife, forests and plant species.
Besides threatening some key regional industries, these climate changes threaten many of the very amenities that have made the Pacific Northwest an attractive place to live, work and raise a family and that have contributed significantly to the economic vitality of our communities.
18 Update 1, July 2009
We do not have to be certain that all of these things are going to happen or about the intensity of the impacts to begin to make substantial expenditures to protect ourselves from them. Almost all homeowners have fire insurance even though the probability of a home fire in any given year is incredibly tiny. Almost none of us bemoans our expenditures on fire and other catastrophic insurance. For our families’ sake, those expenditures obviously make sense.
The same is true when it comes to the uncertainties about the future impacts of climate change. For us, our children and our grandchildren, it makes sense to be “buying insurance” against the worst outcomes even if they are uncertain. One economic estimate, for instance, applied conventional insurance rules of thumb to what Americans would be willing to pay to avoid a one chance in 100 that global warming would lead to catastrophic economic outcomes in this century. The study also considered a higher probability of catastrophic economic outcomes from global warming – one chance in 15. The “economic catastrophe” was an economic collapse similar in magnitude to that of the Great Depression, an indefinite 22% decline in national GDP.
For the lower likelihood catastrophic outcome, the estimate was that Americans would be willing to pay about one-half of 1% of GDP each year for the equivalent of an insurance premium. For the higher probability catastrophic outcome, they would be willing to pay 2.5% of GDP. In terms of the 2008 GDP, these two rational global warming national insurance premiums would be $65 billion and $365 billion per year — $580 and $3,200 per household per year.
Clearly even relatively low probability but high-impact threats to the future of our children and grandchildren justify a significant level of expenditure now to protect against that future threat. That is why most of us voluntarily purchase a broad variety of different types of insurance.
Of course the cost of our efforts to control global warming matters. But so do the benefits those efforts will bring to our homes, businesses, communities, children and grandchildren. When all of those benefits are considered, we individually and collectively should face that cost with a feeling of satisfaction and the knowledge that we are making a great investment in the future.
19
from the four lower Snake River dams, and aggressively developing our energy efficiency, new renewables and combined heat and power resources.
Projected power needs under both the business-as-usual and Bright Future scenarios are based on ordinary demand growth of 1.7%, which we have modeled as 340 aMW a year through 2020 and then ramping up to 400 aMW per year through 2050. To that, the Bright Future adds replacement of the 1,000 aMW of power now produced by the four lower Snake River dams and the systemic flexibility (capacity) the dams provide. It also adds replacement of 1,000 aMW of existing coal generation with clean energy by 2020 and another 5,600 aMW (basically retiring all remaining coal) by 2050. And it foresees provision of 500 aMW by 2020 and 2,000 aMW by 2050 to power electric vehicles, compared to 100 aMW and 500 aMW, respectively, under business-as-usual.
To cover future needs, business-as-usual:
Extends the lives of the 14 coal plants now serving ••the region, all of which will reach the ends of their expected operating lives well before 2050.
Greatly increases natural gas generation.••Continues to acquire energy efficiency at the ••current rate of 230 aMW a year.
Develops only the 2,000 aMW by 2020, and 2,800 ••aMW by 2050, of new clean renewable energy currently mandated by law in the various states.41
The Bright Future path:
Adds another 110 aMW per year of more ••expensive — but still cost-effective — energy efficiency and combined heat and power, thus covering all annual demand growth.
Accelerates renewable energy development to ••2,500 aMW by 2020 and to an additional 9,320 aMW between 2020 and 2050.
Cutting to the chase To calculate and then compare costs, we multiply the amount of new resources42 specified under each scenario by known or predicted resource costs43 in today’s dollars, levelized to incorporate both capital and operating expense:
The 230 aMW of new yearly energy efficiency the ••region now achieves come at an average price of about 2½ cents per kilowatt-hour44 and should cost the same in subsequent years. We use 3 cents as a conservative estimate, however.
Update 1, July 2009

The 110 aMW of additional efficiency to meet ••rising demand in the Bright Future will cost more — averaging 6 cents per kilowatt-hour, which is still far less than new gas-fired or renewable power and about the same as electricity from re-powered coal plants (not including future carbon emissions fees).
New renewable power costs 10 cents per kilowatt-••hour, including the expense of integrating the often-intermittent generation. New natural gas-fired power under business-as-usual would cost the same, assuming no drastic increase in gas costs.
While the lost energy generation from removing the lower Snake River dams in the Bright Future scenario is reflected in the new clean-energy needs total, replacing the dams’ capacity function is not. We calculate that cost as $83 million a year45 which must be added to the Bright Future side of the ledger. On the other hand, we get to subtract 2 cents per kilowatt-hour of avoided variable costs — fuel, operation and maintenance — for backing down coal plants and 6 cents for backing down gas.46 These assumptions are summarized in Chart 8.
The cost comparisons for 2020 and 2050 total the resource costs and savings for each scenario. The actual calculations are on page 22. They show that by 2020, the new system-wide costs of meeting demand through business-as-usual will total nearly $2.2 billion (on top of current costs). Taking the Bright Future path will cost just over $3.5 billion. When that $1.3 billion cost difference is divided by total demand,47 the result is a difference of 0.67 cents per kilowatt-hour for the
average regional electric customer. To put this into perspective, typical retail residential rates adjusted for inflation are expected to be in the 7-11 cents/kWh range, depending upon individual utility resource costs.48
Costs for the entire period ending in 2050 total about $12.4 billion under business-as-usual and about $14.2 billion for a Bright Future. The rate impact of the difference is about the same as in 2020 — 0.58 cents per kWh.49
So the bottom line is that creating our Bright Future might raise the price of electricity two-thirds of a cent per kilowatt-hour more than would business-as-usual, representing roughly a 7-9% increase over current electricity rates. For comparison, the region’s publicly owned utilities increased their retail rates by as much as 100% to incorporate the costs of the failed nuclear power construction initiative of the 1970s and ’80s. The publicly and investor-owned utilities that had “bet on the market” were forced to raise rates as much as 60% as a result of the deregulation crisis of 2000-2001.
Again, this cost comparison ignores the non-energy savings customers would realize through reduced energy use, the reduced costs of transportation via electric vehicles, the economic stimuli from more local jobs and more efficient use of energy and national security benefits. Nor does it reflect the tremendous environmental and social costs of unchecked climate change. Two-thirds of a penny per kilowatt-hour is a small price to pay for the benefits and the avoided costs of the Bright Future.
Chart 8
20 Update 1, July 2009

The emissions reduction challenge presented by the scientists of the Intergovernmental Panel on Climate Change and adopted by the Western Climate Initiative requires development of enough carbon-free energy efficiency and new renewable resources to meet all new demand and essentially replace the power from 14 existing coal-fired power plants. Now is the time for effective leadership to pursue these goals aggressively and to recognize that replacing the power from the four lower Snake River dams adds only incrementally to the broader challenge.
Some immediate policy changes are needed to achieve a Bright Future:
Capping global-warming emissions.1. President Obama and the U.S. Congress should quickly set carbon emission limits consistent with scientists’ recommendations and establish mechanisms to meet them, along with incentives and penalties. But the Northwest must not wait for national action. The region can adopt Bright Future’s carbon-reduction and clean-energy targets and start working toward them now.
Regional leadership from Bonneville Power 2. Administration. The Obama administration should direct BPA to actively wield its substantial power and leadership to set a regional annual floor of 340 aMW of new energy efficiency and 270 aMW of new renewable energy.
A strong regional plan.3. The Northwest’s official power planning agency, the Northwest Power and Conservation Council, is developing its 6th Northwest Power and Conservation Plan, forecasting power needs for the next 20 years and prescribing the resources used to meet them. The Council plan should call for enough energy efficiency and renewable energy to meet all demand growth and wean the region from coal power.
Extension of state renewable energy standards.4. The renewable portfolio standards now in place in three Northwest states top out by 2025. Either the federal government or the states (including Idaho) must extend a progressive standard beyond 2025. The pace of renewables development must continue so we can close the door on coal power.
Prohibition of new coal plant construction or 5. extending the lives of existing ones. Only by rejecting coal-fueled power can we reach our greenhouse-gas reduction goals. This can be accomplished through federal action or strong emissions performance standards adopted by individual states.
These steps will set us well on the way toward a Bright Future for ourselves and our children. Working together, we can keep the lights on, the economy and good jobs growing, the rivers running and salmon swimming in the Pacific Northwest.
IV. RECOMMENDATIONS & CONCLUSION
21Update 1, July 2009

22 Update 1, July 2009

Endnotes 1. A megawatt – 1,000 kilowatts -- is a common measure of power (or capacity). A megawatt-hour (MWh) or kilowatt-hour (kWh) is a measure of actual use over time — for example, a 1,000-watt light bulb burning for one hour uses 1 kilowatt-hour of electricity. An average megawatt (aMW) equals the total number of megawatt-hours used or produced in a year if a megawatt were generated through all the hours in a year; so, 1 aMW equals 8,760 MWh. Customers of Seattle City Light currently use about 1,100 aMW of electricity each year. In utility-speak, MW represent “capacity,” or the ability to produce power, while MWh represent “energy,” the use of that power for a period of time.
2. “Carbon Dioxide Footprint of the Northwest Power System,” Northwest Power and Conservation Council, Nov. 2007: 4.
3. “Carbon Footprint”: 7.
4. The Western Climate Initiative (WCI) is a growing consortium of Western U.S. states and Canadian provinces. Its members are Arizona, British Columbia, California, Manitoba, Montana, New Mexico, Oregon, Utah, Washington, Quebec and Ontario. The WCI (www.westernclimateinitiative.org) has set a goal of reducing aggregate emissions to 15% below 2005 levels by 2020. For the longer term, the WCI partners are committed to making greenhouse gas emissions reductions “sufficient over the long term to significantly lower the risk of dangerous threats to the climate” and use as their guide the Intergovernmental Panel on Climate Change Fourth Assessment Report which states: “Current science suggests that this will require worldwide reductions between 50% and 85% in carbon dioxide emissions from current levels by 2050.” It must be noted that the WCI goals are actually fairly conservative. For example, California Assembly Bill (AB) 32, passed by the Legislature and signed by the governor in 2006, calls for enforceable emission limits to achieve a reduction in CO2 emissions to the 1990 rate by 2020. Washington Governor Gregoire’s climate-change executive order and Senate Bill 6001, passed in 2007, include the same target for CO2 reductions. Oregon House Bill 3543, passed by the legislature and signed by Governor Kulongoski in 2007, declares that it is state policy to stabilize CO2 emissions by 2010, reduce them 10% below 1990 levels by 2020, and 75% below 1990 levels by 2050.
5. McCabe, G.J. and D.M. Wolock, 1999. “General Circulation Model Simulations of Future Snowpack in the Western United States.” Journal of the American Water Resources Association 35: 1473-1484.
6. Until recently, the region did not have to plan for summer peaks. Instead it was recognized that if it had sufficient resources to deal with a severe winter “Arctic Express,” the system would have ample resources in the summer. That situation has changed, as evidenced by the Council’s recently adopted Adequacy Standards that track both summer and winter peaks. See: http://www.nwcouncil.org/library/2008/2008-07.htm
7. See, e.g., Miles, E., et al., 2007. HB 1303 Interim Report: A Comprehensive Assessment of the Impacts of Climate Change on the State of Washington (Seattle, Wash.: University of Washington JISAO CSES Climate Impacts Group).
8. These changes generally reduce the market value of the dams’ output as well. Generation in the spring, when the power is least needed, is much less valuable than summer power. These changes are already being seen. (Their value as zero-carbon resources is little affected by changes in the generation pattern, however, so long as the total output is not reduced.)
9. In April 2009, the Council reduced its forecast further to a 1.3% rate of growth, reflecting the recent economic crisis. Our analysis, however, assumes a growth rate of 340 aMW per year, about 1.7% annually, through 2020, and an overall rate of about 380 aMW per year through 2050 to be conservative.
10. E.g., PacifiCorp 2007 Integrated Resource Plan (IRP), p. 61.
11. “Carbon Dioxide Footprint of the Northwest Power System,” Northwest Power and Conservation Council, Nov. 2007. p. 5. www.nwcouncil.org
12. Bio-fuels may also play a part, especially if the use of cellulose and algae can be harnessed economically.
13. July 2008 analysis by the Northwest Power and Conservation Council, “Impact of Plug-in Hybrid Vehicles on Northwest Power System: A Preliminary Assessment,” by Massoud Jourabchi.
14. Our cost analysis moves the target date to 2020 to reflect increased concern over climate change.
15. Carbon Dioxide Footprint of the Northwest Power System,” Northwest Power and Conservation Council, Nov. 2007, p. 2. www.nwcouncil.org. All quantities are short tons (2,000 pounds) of CO2.
16. Permanent storage of coal plants’ CO2 emissions might become feasible someday, but for now we assume the costs of carbon capture and storage to be prohibitive.
17. This paper’s analysis uses the full 7,310 MW of coal capacity. Outages and maintenance reduce average actual output to about 82% of that number, or 6,000 aMW. Since we model replacement of the coal plants with energy efficiency and renewables that have almost no “downtime,” our analysis is quite conservative.
18. “Carbon Dioxide Footprint of the Northwest Power System,” Northwest Power and Conservation Council, Nov. 2007. www.nwcouncil.org. Puget Sound Energy owns several turbines that can run on either diesel fuel or natural gas; these units seldom run at all, and very rarely use oil, so the oil share of emissions is negligible.
19. The four lower Snake River dams (Ice Harbor, Lower Monumental, Little Goose and Lower Granite) have a collective nameplate generating capacity of 3,033 aMW, possible only on a few spring days of maximum water flow, or for short periods when flows are lower. Their combined average yearly output is about 1,075 aMW. This average amount is often compared to that of the load of Seattle City Light. However, that comparison is misleading, because it is based on averages. In reality, if Seattle were to rely upon these dams, it would be blacked out most of the summer and fall, while being oversupplied in the spring.
20. Recent modeling done by the WCI shows that as new renewables are deployed in response to renewable requirements and global-warming concerns, existing gas plants are used more for integration purposes than for baseload generation. The modeling shows that some new gas peakers may be needed, but the total amount of generation from gas is actually reduced. Sept. 23, 2008, “Recommendations for the WCI Regional Cap-and-Trade Program,” Appendix B.
21. The terms “energy efficiency” and “conservation” are generally interchangeable. We prefer the former, because it points toward smarter use, not just less use.
22. Losses due to the transmission of power from the power plant to an end user are 8-12% of the total power generated. And the higher end of this range occurs during hot afternoons when the system is stressed.
23. It must be noted that large-scale hydropower is “tapped out,” meaning that in the future all utilities — whether customers of BPA or not — face those higher costs.
24. Heat pumps for space heating use only about one-fourth the energy of conventional gas or electric heating and/or air conditioning. Widespread use will reduce energy consumption significantly.
25. In 2007 the California Energy Commission recommended changing the state’s building codes to require net-zero-carbon performance in residential buildings by 2020 and in commercial buildings by 2030. See: http://www.enn.com/ecosystems/article/30652.
26. May 14, 2008. http://www.nwcouncil.org/library/releases/2008/0514.htm
27. Tom Eckman, during May 8, 2008, Q&A after his presentation, “Conservation — How Much and How Fast,” Oregon Public Utility Commission.
28. Preliminary drafts of the Council’s 6th Plan say more than 6,000 aMW — 300 aMW per year — of new cost-effective efficiency are achievable during the plan’s 20-year period. Past experience suggests that the total will increase as new technologies come online.
29. http://www.aceee.org/pubs/e084.htm
30. Similar efficiency standards have been adopted by several states; Congress is discussing a national efficiency standard.
31. “Combined Heat and Power in the Pacific Northwest: Market Assessment,” August 2004, by Energy and Environmental Analysis Inc., for the Oak Ridge National Laboratory.
32. This study’s region included Oregon, Washington and Idaho, but not western Montana. We have subtracted the Alaska numbers.
33. Larger, more centralized power storage is also close at hand and will likely be developed to help smooth the intermittency of large solar and wind facilities.
23Update 1, July 2009

For example, some large central concentrated solar plants now being planned for the desert Southwest will incorporate molten sodium heat storage so they can generate into the early evening when demand is still strong. Other technologies such as flywheels and exotic batteries are also receiving large amounts of venture capital financing.
34. Figures on renewable development from the Renewable Northwest Project: http://www.rnp.org.
35. “Renewable Energy Atlas of the West,” Land and Water Fund of the Rockies, et al., p.13.
36. For purposes of this analysis, we assume that only 20% of Montana’s wind and solar potential will become available to the Northwest region.
37. Natural gas fuel cost assumes a 55% efficient combined cycle plant with a 90% capacity factor using natural gas at $4-$10/mmBtu.
38. Jobs per aMW generation figures come from “Putting Renewables to Work: How Many Jobs Can the Clean Energy Industry Generate?” by Daniel M. Kammen, Kamal Kapadia and Matthias Fripp of the Energy and Resources Group, Goldman School of Public Policy, April 13, 2004. Energy efficiency figures come from ACEEE executive director Bill Prindle, quoted in “The First Fuel,” State Legislatures, March 2008 by Glen Andersen.
39. Kammen, et al, and Prindle
40. “Impacts of Climate Change on Washington’s Economy: A Preliminary Assessment of Risks and Opportunities,” Washington Economic Steering Committee and University of Oregon, November 2006.
41. Washington 15% by 2020 = about 1,200 aMW. Oregon – 25% by 2025 = about 1,500 aMW. Montana – 15% by 2015 = about 130 aMW.
42. Unless noted, the costs of existing resources are the same under both scenarios and thus are not included in this comparison.
43. Most future price estimates come from PacifiCorp’s 2007 Integrated Resources Plan (IRP). We must note that each cost assumption is subject to change over time. We periodically update current assumptions on our Web site, but changes in load growth, gas prices and resource costs tend to be minor or countervailing, and overall results do not change much.
44. An average megawatt of efficiency is equal to 8,760,000 kilowatt-hours per year.
45. PacifiCorp’s 2007 IRP estimates $5,500 per megawatt for annual operation and maintenance of an existing single-cycle combustion turbine and up to $41,400 per megawatt annually for a new plant. To be conservative, we use the latter figure.
46. PacifiCorp’s 2007 IRP, pp. 95-96.
47. We divide by the larger business-as-usual scenario loads rather than the lower Bright Future loads, because the former is the load that would have materialized if the extra energy efficiency in the Bright Future were not acquired. This makes the comparison a realistic measure of the added costs to serve that (business-as-usual) load whether through new resources or energy efficiency.
48. Utilities that purchase power from BPA, for example, would have rates at the low end of this range, because in a carbon-constrained future that agency’s zero-carbon hydropower sales to California would become very valuable. Revenues from those sales go to further reduce public power rates.
49. An earlier version of this paper underestimated business-as-usual costs, resulting in a slightly higher difference (0.68 cents).
About Light in the River reports
Light in the River is a new collaborative project that seeks Northwest solutions to global warming that will serve as models for the nation.
Light in the River’s report series, and the conversation we hope it engenders, offers and explores solutions that will counter global warming; preserve healthy waters, fish, farms and communities; and advance initiatives to achieve these goals.
These reports are factual and forward-looking. They start from today’s realities but focus on tomorrow’s imperatives. Each report will express its authors’ informed views, rather than hew to any project sponsor’s party line. Given the tough challenge posed by global warming, each paper will tackle tough questions but do so with determination to find and implement solutions.
About Light in the River This project owes its name to Don Sampson, a leader of the Confederated Tribes of the Umatilla Reservation. Some years ago, in a talk near the Columbia River, Mr. Sampson acknowledged the light from the river: electricity from the river’s dams illuminating the room in which he spoke. He then asked equal regard for the light in the river: the salmon whose illuminations reach deep and far. Writer David James Duncan found the same image independently when, in My Story as Told by Water, he called salmon “a fire in water – an impossible watery flame.”
For these leaders, and for others, the light is in the salmon, in the waters bearing them, and in all that both nourish. The Light in the River project offers hope by seeking practical steps to counter global warming while protecting our waters and wild salmon that give us health, food, livelihoods and endless inspiration. www.LightInTheRiver.org
About the NW Energy Coalition Based in Seattle, with offices and staff in Oregon, Idaho and Montana, the NW Energy Coalition is an alliance of more than 110 environmental, civic and human service organizations; unions and faith communities; and progressive utilities and businesses throughout the region. Since 1981, the Coalition has provided policy guidance and promoted development of energy efficiency and clean renewable energy, consumer protection, low-income energy assistance, and fish and wildlife restoration in the Columbia and Snake rivers. Visit www.nwenergy.org