briefing to the portfolio committee on tourism sa tourism updated 5 year strategic plan and annual...
TRANSCRIPT

Briefing to the Portfolio Committee on Tourism
SA Tourism Updated 5 Year Strategic Plan and Annual Performance
Plan (Review 2014 /15)
04 July 2014

Slide no. 2
Contents
• Vision, Mission and Mandate and Governance
• Strategic Approach and Performance
• Africa Growth Strategy
• Domestic Tourism Strategy
• Strategic Objective Annual Targets, Performance
• Breakdown of Tourism Budget
• Concluding Remarks
• Global Audio Visual – “Reconsider South Africa”
Strategic Plan & Annual Performance Plan – 04 July 2014

Vision and Mission
Vision
For South Africa (SA) to be the preferred tourist destination in the world, in order to maximise the economic potential of tourism for our country and its people.
MissionTo develop and implement a world-class tourism marketing strategy for SA. In pursuance of this, SA Tourism will:•Implement domestic, regional and international marketing strategies informed by research•Implement a business events strategy•Implement and maintain a recognisable, credible and globally benchmarked system of quality assurance•Facilitate strategic alignment of Provinces and industry in support of global marketing of tourism.•Facilitate the removal of identified obstacles to tourism growth. •Ensure the efficient utilisation of resources to deliver the tourism strategy
Strategic Plan & Annual Performance Plan – 04 July 2014
Slide no. 3

Convince consumers that SA can be trusted to deliver memorable
experiences
Convince consumers that SA can be trusted to deliver memorable
experiences
Engage Stakeholders to deliver quality
visitor experience that re-affirm the
brand promise
Engage Stakeholders to deliver quality
visitor experience that re-affirm the
brand promise
Work the distribution channel to promote SA
Work the distribution channel to promote SA
Energise and empower the organisation to innovate and
achieve excellence
Energise and empower the organisation to innovate and
achieve excellence
Invest only in selected markets to deliver volume and
value
Invest only in selected markets to deliver volume and
value
SA Tourism recently refined its current objectives and strategies for the period until 2014/5 - in line with Government’s Performance Information Management Policy
Create a thriving tourism sector by making South Africa a tourism and business events destination of
choice
Create a thriving tourism sector by making South Africa a tourism and business events destination of
choice
Possible Tourism sector outcome which SA Tourism will need to deliver against
SA Tourism outcome
Strategies to deliver outcome
Make the SA brand a Global Player in portfolio markets, hubs and decision making centres which will grow tourism’s
trended revenue to the economy by 1.5% p.a. (excluding inflation)
Make the SA brand a Global Player in portfolio markets, hubs and decision making centres which will grow tourism’s
trended revenue to the economy by 1.5% p.a. (excluding inflation)
Strategic Plan & Annual Performance Plan – 04 July 2014Slide no. 4

Slide no. 5
SA Tourism’s Mandate set out in the Tourism Act makes it clear that it needs to make choices that will benefit all South Africans
Sustainable GDP Growth
Sustainable GDP Growth
Sustainable job creation
Sustainable job creation
Redistribution and
transformation
Redistribution and
transformation
The mandate to SA Tourism is ...
… through six key
objectives
…by acting in a focused way to
Increase in tourist volume
Increase in tourist volume
Increase in tourist spendIncrease in
tourist spendIncrease length
of stayIncrease length
of stay
Improve geographic
spread
Improve geographic
spread
Improve seasonality
patterns
Improve seasonality
patterns
Promote transformation
Promote transformation
Strategic Plan & Annual Performance Plan – 04 July 2014

Slide no. 6
SUPPORT
Business Focus
LEISURE TOURISM
“preferred tourism destination
BUSINESS EVENTS & MEETINGS
“preferred business events destination
GRADING/ QUALITY
ASSURANCE”improve quality
visitor experience”
Strategic Plan & Annual Performance Plan – 04 July 2014
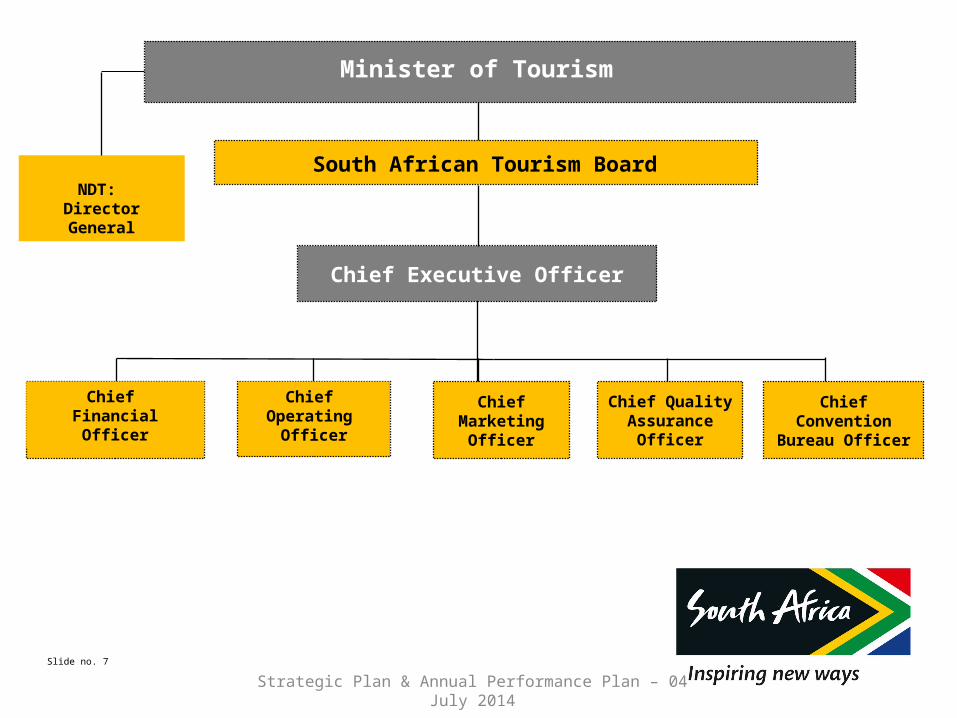
Minister of Tourism
Regional Director: Europe
Global Manager:Product
South African Tourism BoardNDT DG
Chief Executive Officer
Global Manager:Stakeholder/Global Trade
Chief FinancialOfficer
South African Tourism Board
Chief Marketing
Officer
Chief Quality Assurance
Officer
Chief Operating
Officer
QAO
Chief Convention
Bureau Officer
NDT: Director General
Slide no. 7
Strategic Plan & Annual Performance Plan – 04 July 2014

Slide no. 9
Contents
• Vision, Mission and Mandate and Governance
• Strategic Approach and Performance
• Africa Growth Strategy
• Domestic Tourism Strategy
• Strategic Objective Annual Targets, Performance
• Breakdown of Tourism Budget
• Concluding Remarks
• Global Audio Visual – “Reconsider South Africa”
Strategic Plan & Annual Performance Plan – 04 July 2014

Slide no. 10
How attractive are these markets in the short term and the
long term?
CoreTactical
Investment and Watch-List
markets
2nd filter
Salient set
Steps of the Portfolio Review
Application of cost-benefit evaluation
1st filter
4th filter
*Africa land markets are markets where more than 60% of arrivals to SA arrive by land.
3rd filter
Final portfolio
Exclude Africa and subdivide it into 5
regions
Exclude SADC (Africa Land markets) from
the elimination process (proximity to
SA).
From the remaining countries. Excludes countries with less
than 150k outbound Travel and Population of less than 3 Million
Exclude markets population less than 3 million people OR GDP PPP of less than $11
000
Top markets in terms of outbound volume
and value
The remaining countries including SADC (Africa land
markets) qualify for Africa Salient set of
countries
199
countries
133
24
117
42
40
Strategic Plan & Annual Performance Plan – 04 July 2014

Slide no. 11
Key things that have changed in the 5th Portfolio Review
APPROACH:
1. We treat the African continent differently from the rest of the world Africa gets subdivided into 5 different regions / hubs Countries with outbound less than 150K per year and a population of 3 Million are
filtered out. The average outbound per annum for African countries is 500K , while population is 7 million. The aim is to include as many countries as we can hence the very low threshold.
SADC (Africa Land Markets) automatically qualify because of its proximity.
2. For the rest of the world, we no longer use the $2 000 Gross Domestic Product (GDP) filter. Instead we use GDP Purchasing Power Parity (PPP) of $11 000 per annum as a filter for affordability. This is similar to the Big Mac Index.
3. We plan to use the Hub Strategy approach around the world to increase market penetration. The Hub approach will also be applied when markets have been filtered through all the other criteria so that we can combine markets in the portfolio based on proximity, language, trade links – for instance, the US and Canada; Japan and Korea as well as Netherlands and Belgium – among others.
Strategic Plan & Annual Performance Plan – 04 July 2014

Slide no. 12
5th Portfolio Review Outcome to be Implemented - effective 01/04/2014 – 30/03/2017 AFRICA AMERICAS ASIA & AUSTRALASIA EUROPE & THE UK
CORE MARKETS AngolaMozambique
Nigeria
TanzaniaDomestic
BrazilUSA
AustraliaChina
India
FranceGermany
NetherlandsUK
INVESTMENT MARKETS
Botswana, DRC, Ghana, Lesotho, Uganda,
Zimbabwe
Canada Japan
South Korea
Italy
Russia
TACTICAL MARKETS
NamibiaUAE
Zambia
Singapore Switzerland
WATCH-LIST MARKETS
EthiopiaMalawi
Swaziland
Argentina New Zealand Austria Belgium
Denmark FinlandNorwaySpain
Sweden Turkey
STRATEGIC IMPORTANCE
Egypt, Israel, Morocco, Saudi Arabia, Tunisia,
Malaysia
USA
Brazil – 7/’14
China
Australia
India
France
Germany
Netherlands
UK
ItalyJapan
South Korea
Nigeria
Kenya: 05/’14
Angola: 6/’14
Existing Country Offices
Planned Country Offices
Strategic Plan & Annual Performance Plan – 04 July 2014

Slide no. 13
USA (Office) - Hub
Canada
India (Office) – Stand Alone
North AmericasNorth Americas
Asia & Australasia
Asia & Australasia EuropeEurope
Germany (Office): Hub
**Russia
* Brazil (Office): Hub
*** Argentina
*** Chile
Latin AmericasLatin Americas Central EuropeCentral Europe
IndiaIndia
AustralasiaAustralasia
Australia (Office) : Hub
New Zealand
AmericasAmericas
Norway
**Sweden
Denmark
Finland
United Kingdom (Office): Hub
Ireland
Scotland
Wales
United KingdomUnited
Kingdom
Benelux & ScandinaviaBenelux &
ScandinaviaNetherlands (Office) :Hub
Belgium
China - Office ** : Hub
Hong Kong
***Macau
Japan
** South Korea
Asia PacificAsia Pacific
Asia Air Link HubAsia Air Link Hub
The Hub Strategy for Global Markets to increase market penetration, footprint
and efficient resource utilisation.
Austria
France – Stand Alone
France (Office)France (Office)
Switzerland
Spain
Turkey
Malaysia
Singapore
* Kenya (Office) : Hub
**Tanzania & Uganda
*** Ethiopia
East AfricaEast Africa
AfricaAfrica
Nigeria (Office): Hub
Ghana*** ECOWAS countries
West AfricaWest Africa
* Angola (Office) – Stand Alone
DRC: Hub
Central AfricaCentral Africa
Italy – Stand Alone
Italy (Office)Italy (Office)
Botswana
Malawi
SADCSADC
Zimbabwe
Lesotho
Mozambique Zambia
Namibia
Notes: * Planned SA Tourism Offices (2013/2014 to 2014/2015)** 1 Trade Relations Manager will be appointed – approved by Board (2014/2015) (Shanghai, South Korea, Russia, Scandinavia as well as Tanzania and Uganda)*** Future Plans (2015/16 and Beyond)
Strategic Plan & Annual Performance Plan – 04 July 2014
Slide no. 14
Contents
• Vision, Mission and Mandate and Governance
• Strategic Approach and Performance
• Africa Growth Strategy
• Domestic Tourism Strategy
• Strategic Objective Annual Targets, Performance
• Breakdown of Tourism Budget
• Concluding Remarks
• Global Audio Visual – “Reconsider South Africa”
Strategic Plan & Annual Performance Plan – 04 July 2014

Slide no. 15
MTEF Allocation to Aggressively Grow Africa
•Ring fenced budget to increase arrivals and spend from Africa to contribute to GDP and job creation.
•R50 million (2012/13) and R84 million for the MTEF period up to 2016/17
•Setting up five marketing offices in key African markets by 2020
•Implementation of regional tourism programmes
•In Africa Air markets, sizable opportunity exists to attract high value business and leisure travellers.
Strategic Plan & Annual Performance Plan – 04 July 2014

Slide no. 16
Regional Hub Strategy East Africa Hub Central Africa Hub West Africa Hub
Summary of
opportunity
Kenya is a relatively small market with only 36k arrivals in 2012.
Serving additional countries, such as Uganda and Tanzania from Kenya would increase arrivals to 95k – taking advantage of similar consumer profiles.
Good regional integration and growth is possible.
Angola, similarly to Kenya, will be a hub office – also servicing DRC and Congo-Brazzaville.
DRC will be serviced using a virtual office with only 1 Trade Relations Manager based in DRC but reporting to the hub office in Angola.
This approach is cost effective and most practical given the proximity and high connectivity.
The Nigerian market is large and fast growing.
Serving Ghana from Nigeria adds another 25k arrivals to the Nigerian market. Arrivals from Ghana are also growing fast.
Combined arrivals from both Ghana and Nigeria represent some 104k arrivals.
In 2013 a scoping exercise was performed to determine how to penetrate the market.
We will, continue to monitor Congo-Brazzaville and other surrounding Central African states to leverage opportunities as they arise.
Achieved milestone: The Nigerian office is fully operational.
Strategic Plan & Annual Performance Plan – 04 July 2014

Slide no. 17
Contents
• Vision, Mission and Mandate and Governance
• Strategic Approach and Performance
• Africa Growth Strategy
• Domestic Tourism Strategy
• Strategic Objective Annual Targets, Performance
• Breakdown of Tourism Budget
• Concluding Remarks
• Global Audio Visual – “Reconsider South Africa”
Strategic Plan & Annual Performance Plan – 04 July 2014
Slide no. 18
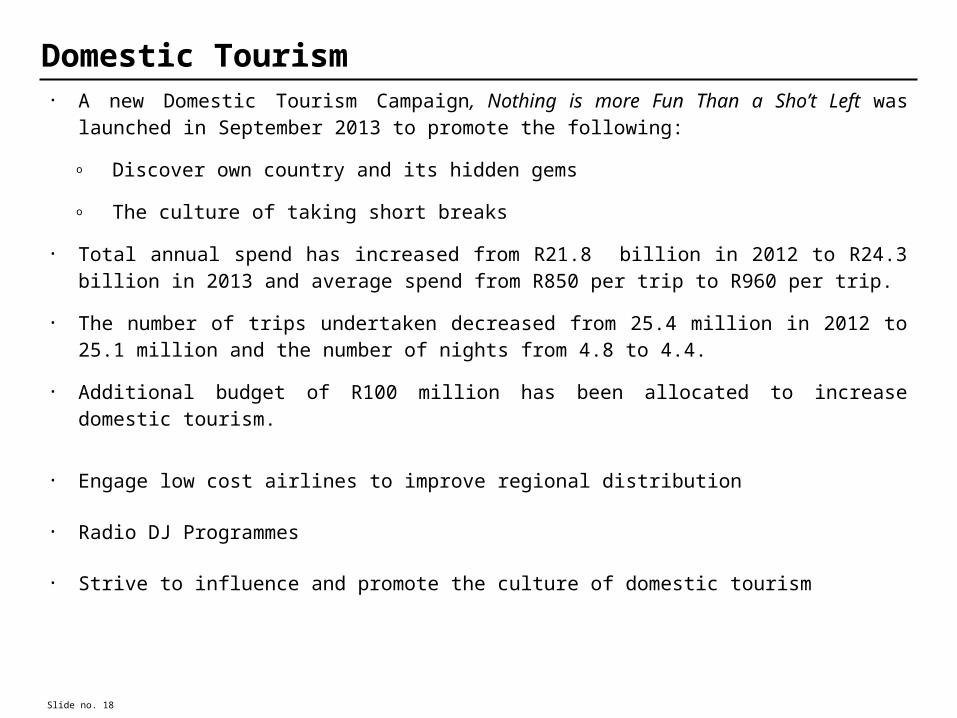
Domestic Tourism• A new Domestic Tourism Campaign, Nothing is more Fun Than a Sho’t Left was
launched in September 2013 to promote the following:
o Discover own country and its hidden gems
o The culture of taking short breaks
• Total annual spend has increased from R21.8 billion in 2012 to R24.3 billion in 2013 and average spend from R850 per trip to R960 per trip.
• The number of trips undertaken decreased from 25.4 million in 2012 to 25.1 million and the number of nights from 4.8 to 4.4.
• Additional budget of R100 million has been allocated to increase domestic tourism.
• Engage low cost airlines to improve regional distribution
• Radio DJ Programmes
• Strive to influence and promote the culture of domestic tourism

Slide no. 19
Contents
• Vision, Mission and Mandate and Governance
• Strategic Approach and Market Portfolio
• Africa Growth Strategy
• Domestic Tourism Strategy
• Strategic Objective Annual Targets, Performance
• Breakdown of Tourism Budget
• Concluding Remarks
• Global Audio Visual – “Reconsider South Africa”
Strategic Plan & Annual Performance Plan – 04 July 2014

Slide no. 20
Strategic Outcome Oriented Goals, Goal Statement and ObjectivesStrategic Objective Justification NTSS Alignment
1 Increase foreign visitor arrivals to SA
More foreign visitors will yield more tourism spend resulting to increased GDP contribution
Aligned
2 Increase domestic tourism in SA
Making SA more attractive to South Africans. This will increase tourism spend and GDP contribution
Aligned
3 Increase tourism trended revenue contribution to the economy (Total Foreign Direct Spend (TFDS) + Total Domestic Direct Spend (TDDS))
Attract tourists that will increase trended revenue contribution to GDP
Aligned
4 Increase SA brand awareness
Making SA more attractive to visitors and results in increased spend
Aligned
5 Provide quality assurance for tourism products
Marketing through word of mouth of the quality experience offered in SA
Aligned
6 Increase business events Selling SA as a “Meetings Destination” Aligned
Strategic Plan & Annual Performance Plan – 04 July 2014

Slide no. 21
Strategic Outcome Oriented Goals, Goal Statement and ObjectivesStrategi
c Objective
Key Perform -ance Indicator
Audited Outcome/ Actual Performance
Baseline – 2013/14 Performance
Medium Term Targets
2011 / 12
2012/13 2013/14 2014/15
Quarterly Targets
2015/16 2016/17
Increase foreign visitor arrivals to SA
# of foreign visitor arrivals(annually)
12 255 155
13 451 565
12 518 310
Tourist arrival estimate = 9 616 964
16 033 947
Tourist arrivals estimate: 10 000 228
Q1: 3 906 086 17 041 406
Tourist arrivals estimate: 10 446 753
18 049 947
Tourist arrivals estimate: 10 911 069
Q2: 3 687 842
Q3: 4 053 864
Q4: 4 386 156
# of buyers that SAT will host at Meetings Africa and Indaba during the financial year
N/A N/A Total: 376
Indaba: 207Meetings Africa: 169
Total: 427
(Indaba: 250 Meetings Africa: 177)
No quarterly targets
486 hosted buyers
(Indaba 309Meetings Africa: 177)
486 hosted buyers
(Indaba 309Meetings Africa: 177)
Increase domestic tourism in SA
# of domestic travellers
13.9m 12.5m 12.0m 12.9m Q1: 3.4m 13.5m 14.3m
Q2: 2.6m
Q3: 3.4m
Q4: 3.5m
Strategic Plan & Annual Performance Plan – 04 July 2014Slide no. 21

Slide no. 22
Strategic Outcome Oriented Goals, Goal Statement and Objectives
Strategic Objective
Key Performance Indicator
Audited Outcome/ Actual Performance
Baseline – 2013/14 Performance
Medium Term Targets
2011/12
2012/13
2013/14 2014/15 Quarterly Targets
2015/16 2016/17
Increase domestic tourism in SA
# of total domestic trips
26.3m 25.4m 25.1m 25.9m Q1: 6.9m 28.4m 31.2m
Q2: 5.0m
Q3: 6.9m
Q4: 7.1m
# of holiday trips
3.95m 2.9m 2.98m 3.07m Q1: 0.92 1m 3.3m 3.5.
Q2: 0.615m
Q3: 0.923m
Q4: 0.614m
Number of reports - seasonality
1 Report N/A 1 Report 1 Report
Increase tourism trended revenue contribution to the economy(TFDS+ TDDS)
Amount of Trended revenue
R8 600 R12 800 (NITS)R8 200 (TFDS)R105.4b (TFDS revenue)
R125.0b (Trended revenue)
R128.0b(Trended revenue)
Q1: R30.7b R129.7b(Trended revenue)
R133.6b (Trended revenue)
Q2: R29.4 b
Q3: R33.3b
Q4: R34.6b
Strategic Plan & Annual Performance Plan – 04 July 2014Slide no. 22

Slide no. 23
Strategic Outcome Oriented Goals, Goal Statement and Objectives
Increase SA brand awareness
Brand Awareness
77% 81% 79% 80% N/A 80% 81%
Provide quality assurance for tourism products
# of graded establishment
4 886 6 022 5 671 7 088(1 195 New 5 893 renewals)
Q1: 1 772 7 584 8 115
Q2: 1 772
Q3: 1 772
Q4: 1 772
Increase business events
# of delegates
N/A 52 587delegates
94 893 delegates
58 500 delegates
N/A 61 500 delegates at international conventions
65 000 delegates at international conventions
Strategic Objective
Key Performance Indicator
Audited Outcome/ Actual Performance
Baseline – 2013/14 Performance
Medium Term Targets
2011/12
2012/13
2013/14 2014/15 Quarterly Targets
2015/16 2016/17
Strategic Plan & Annual Performance Plan – 04 July 2014

Slide no. 24
Tourism’s GDP contribution increased from 2.8% (2011) to 3.0% (2012)
Tourism Contribution to GDP, 2008-2012*Tourism Contribution to GDP, 2008-2012*
Source: TSA, Statistics SA – Preliminary figures are used for 2011 and 2012
Tota
l D
irect
GD
P (
Billion
s)
67.1 69.376.6
83.593.3
3.0% 2.9% 2.9% 2.8% 3.0%
0.0
10.0
20.0
30.0
40.0
50.0
60.0
70.0
80.0
90.0
100.0
0.0%
0.5%
1.0%
1.5%
2.0%
2.5%
3.0%
3.5%
2008 2009 2010 2011 2012
Tourism direct GDP
Tourism share of SA GDP
To
urism
Sh
are of D
irect G
DP
CAGR (2008-2012)
Total Contribution to GDP 6.8%
Strategic Plan & Annual Performance Plan – 04 July 2014

Tourist arrivals to South Africa grew by almost 5% in 2013 in line with global growth
Note: UNWTO estimates incorporate provisional data for some regions
Source: Statssa Tourism & Migration release December 2013, SAT analysis; UNWTO World Tourism Barometer, Volume 12, April 2014 – Statistical Annex
4.7%5.4%
6.2%5.4%
-0.2%
3.2%
5.0%
-5%
0%
5%
10%
South Africa Africa Asia and thePacific
Europe Middle East Americas World
Year-on-Year Change in Tourist Arrivals to each region%
Change
2012 Tourist arrivals (Millions)
9.2 52.9 233.5 534.4 51.7 162.7 1,035
2013 Tourist arrivals (Millions)
9.6 55.8 248.1 563.4 51.6 167.9 1,087
Slide no. 25Strategic Plan & Annual Performance Plan – 04 July 2014

AFRICAAFRICAAFRICAAFRICA
11, 585,206 arrivals 12.4% up from 2012
11, 585,206 arrivals 12.4% up from 2012
Central & South AmericaCentral & South America
133, 959 arrivals 6.40% up from 2012
133, 959 arrivals 6.40% up from 2012
North AmericaNorth AmericaNorth AmericaNorth America
467, 956 arrivals 6.1% up from 2012
467, 956 arrivals 6.1% up from 2012
EuropeEuropeEuropeEurope
1,628,154 arrivals 6.7% up from 2012
1,628,154 arrivals 6.7% up from 2012
AsiaAsiaAsiaAsia
480, 064 arrivals 9.6% up from 2012
480, 064 arrivals 9.6% up from 2012
Australasia
162, 356 arrivals 2.3% up from 2012
162, 356 arrivals 2.3% up from 2012
Middle EastMiddle East
61, 994 arrivals 6.4% up from 2012
61, 994 arrivals 6.4% up from 2012
Indian Ocean IslandsIndian Ocean Islands
27, 486 arrivals 13.4% up from 2012
27, 486 arrivals 13.4% up from 2012Note : Tourist Arrivals figures shown above for Jan. - Dec 2013
Source: Statssa Tourism & Migration release December 2013, SAT analysis
14, 806, 216 arrivals 10.5% up from 2012
14, 806, 216 arrivals 10.5% up from 2012
GRAND TOTALGRAND TOTAL
Foreign arrivals to South Africa for January to December 2013 grew by 10.5% over 2012 to reach 14.8 million
Slide no. 26
Strategic Plan & Annual Performance Plan – 04 July 2014

AFRICAAFRICAAFRICAAFRICA
6,889,389 arrivals 3.8% up from 2012
6,889,389 arrivals 3.8% up from 2012
Central & South AmericaCentral & South America
129,463 arrivals 8.0% up from 2012
129,463 arrivals 8.0% up from 2012
North AmericaNorth AmericaNorth AmericaNorth America
417,582 arrivals 6.1% up from 2012
417,582 arrivals 6.1% up from 2012
EuropeEuropeEuropeEurope
1,494,978 arrivals 7.0% up from 2012
1,494,978 arrivals 7.0% up from 2012
AsiaAsiaAsiaAsia
435,076 arrivals 9.2% up from 2012
435,076 arrivals 9.2% up from 2012
Australasia
148,660 arrivals 4.0% up from 2012
148,660 arrivals 4.0% up from 2012
Middle EastMiddle East
57,382 arrivals 5.9% up from 2012
57,382 arrivals 5.9% up from 2012
Indian Ocean IslandsIndian Ocean Islands
24,394 arrivals 13.3% up from 2012
24,394 arrivals 13.3% up from 2012Note : Tourist Arrivals figures shown above for Jan. - Dec 2013
Source: Statssa Tourism & Migration release December 2013, SAT analysis
9,616,964 arrivals 4.7% up from 2012
9,616,964 arrivals 4.7% up from 2012
GRAND TOTALGRAND TOTAL
Tourist arrivals to South Africa in 2013 grew by 4.7% over 2012 to reach 9,616,964. All regions showed positive growth in tourist arrivals in this period
Slide no. 27Strategic Plan & Annual Performance Plan – 04 July 2014

Slide no. 28
AFRICAAFRICAAFRICAAFRICA
1,736,166 arrivals 7.6% up from 2012
1,736,166 arrivals 7.6% up from 2012
Central & South AmericaCentral & South America
35,535 arrivals 15.2% up from 2012
35,535 arrivals 15.2% up from 2012
North AmericaNorth AmericaNorth AmericaNorth America
92,727 arrivals 5.2% up from 2012
92,727 arrivals 5.2% up from 2012
EuropeEuropeEuropeEurope
430,910 arrivals 9.2% up from 2012
430,910 arrivals 9.2% up from 2012
Asia & AustralasiaAsia & AustralasiaAsia & AustralasiaAsia & Australasia
108,272 arrivals 27.1% up from 2012
108,272 arrivals 27.1% up from 2012
Europe remains the main source of tourist arrivals to South Africa while Asia remains buoyant with the highest growth.
Asia
“GROW”
North America
“GROW”
Africa Air
“GROW”
Europe
“RETAIN & DEFEND”
Africa Land
“GROW”
Brazil
“GROW”
AustralasiaAustralasia
Australia
“RETAIN & DEFEND
Strategic Plan & Annual Performance Plan – 04 July 2014

Tourist Arrivals to South Africa and the World, 2011 to 2013Tourist Arrivals to South Africa and the World, 2011 to 2013Tourist Arrivals to South Africa and the World, 2011 to 2013Tourist Arrivals to South Africa and the World, 2011 to 2013
Long-haul Markets
Africa Air Markets
Africa Land Markets
All Markets Global Arrivals
All markets grew faster than global growth rate between 2011 and 2013
Note: Africa Air Markets are markets where at least 60% arrives to SA use air transport; Africa Land Markets are markets where at least 60% of arrivals to SA use road transport. Long-haul markets include all countries outside of AfricaSource: Statssa Tourism & Migration release December 2013, SAT analysis; UNWTO World Tourism Barometer, Volume 12, April 2014 – Statistical Annex
Tou
rist
Arr
ivals
(M
illio
ns)
5.7%
11%
7.4%
13.1%
1000 4.5%
12% 3.4% 6.8% 4.7% 5%14.2% 8.2% 15%
10.2% 4.0%% change y-o-y
CAGR 11 to 13
Slide no. 29
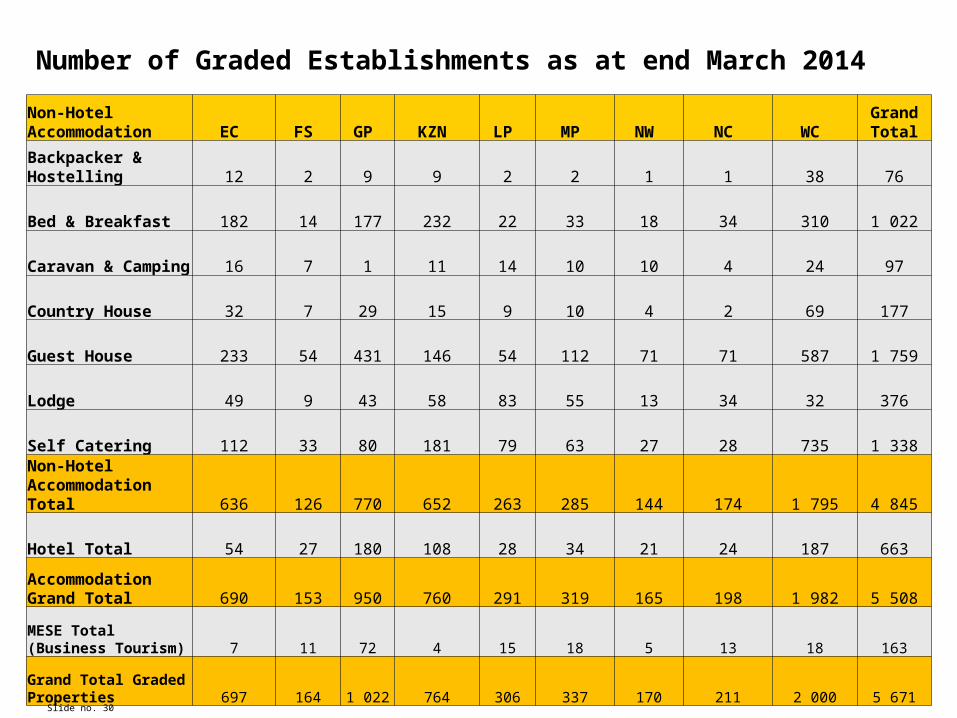
Number of Graded Establishments as at end March 2014
Non-Hotel Accommodation EC FS GP KZN LP MP NW NC WC
Grand Total
Backpacker & Hostelling 12 2 9 9 2 2 1 1 38 76
Bed & Breakfast 182 14 177 232 22 33 18 34 310 1 022
Caravan & Camping 16 7 1 11 14 10 10 4 24 97
Country House 32 7 29 15 9 10 4 2 69 177
Guest House 233 54 431 146 54 112 71 71 587 1 759
Lodge 49 9 43 58 83 55 13 34 32 376
Self Catering 112 33 80 181 79 63 27 28 735 1 338Non-Hotel Accommodation Total 636 126 770 652 263 285 144 174 1 795 4 845
Hotel Total 54 27 180 108 28 34 21 24 187 663
Accommodation Grand Total 690 153 950 760 291 319 165 198 1 982 5 508
MESE Total (Business Tourism) 7 11 72 4 15 18 5 13 18 163
Grand Total Graded Properties 697 164 1 022 764 306 337 170 211 2 000 5 671
Slide no. 30

Number of Graded Rooms as at end March 2014
Non-Hotel Accommodation EC FS GP KZN LP MP NW NC WC
Grand Total
Backpacker & Hostelling 556 132 798 723 87 49 200 32 1 278 3 855
Bed & Breakfast 1 575 105 1 117 1 516 258 270 119 340 1 624 6 924
Caravan & Camping 655 406 50 1 025 1 368 1 112 217 660 1 534 7 027
Country House 321 81 345 170 153 103 29 25 771 1 998
Guest House 2 536 619 4 395 1 540 785 1 327 667 907 4 481 17 257
Lodge 497 263 1 248 986 1 587 1 129 156 804 445 7 115
Self Catering 985 356 792 1 563 1 699 1 452 179 863 4 083 11 972
Non-Hotel Accommodation Total 7 125 1 962 8 745 7 523 5 937 5 442 1 567 3 631 14 216 56 148
Hotel Total 3 780 1 697 20 242 8 200 1 597 2 268 957 2 827 14 460 56 028Accommodation Grand Total 10 905 3 659 28 987 15 723 7 534 7 710 2 524 6 458 28 676 112 176
MESE Total (Business Tourism) 38 30 531 26 63 67 19 48 76 898
Grand Total Graded Properties 10 943 3 689 29 518 15 749 7 597 7 777 2 543 6 506 28 752 113 074
Slide no. 31
Strategic Plan & Annual Performance Plan – 04 July 2014

Slide no. 32
SA National Convention Bureau Update and Performance (2013-2014) 01 APRIL 2012: Establishment of SANCB
YEAR 1 OBJECTIVES: Fully operational business unit
SANCB FOCUS: Positioning and selling South Africa as a preferred business events destination and growing the industry’s capacity and skills.
STRATEGY: Approval of the SANCB’s 5 year strategy
COORDINATING FORUM: Guidelines for coordination of SANCB and all Provincial and City Convention Bureaus activities.
ICCA GLOBAL RANKING 2013: SA ranked 34th internationally, 1st in Africa, 11th long haul, 27th based on the number of participants
MEETINGS AFRICA: True Pan African Show celebrating 10 years in 2015 and boasting 13 African countries represented, 262 exhibitors, 170 Int, 37 association, 500 corporate buyers, 163 media
SUBVENTION: Incentive programme aimed at attracting international business events to South Africa. Subvention guidelines approved by SATB.
BIDS SUBMITTED 2013-2014 FINANCIAL YEAR
Note: R5.1 million was spent on 57 Bids = ROI: R948 million
TOTAL BIDS TOTAL NUMBER OF DAYS
ESTIMATED DELEGATE NUMBERS
ESTIMATED ECONOMIC IMPACT
57 180 76 843 R948 186 400
BIDS SECURED FOR SA: 2014 - 2018
TOTAL BIDS SECURED
TOTAL NUMBER OF DAYS
ESTIMATED DELEGATE NUMBERS
ESTIMATED ECONOMIC IMPACT
150 689 243 468 R3 222 870 000.00
Slide no. 32Strategic Plan & Annual Performance Plan – 04 July 2014

Slide no. 33
Contents
• Vision, Mission and Mandate and Governance
• Strategic Approach and Performance
• Africa Growth Strategy
• Domestic Tourism Strategy
• Strategic Objective Annual Targets, Performance
• Breakdown of Tourism Budget
• Concluding Remarks
• Global Audio Visual – “Reconsider South Africa”
Strategic Plan & Annual Performance Plan – 04 July 2014

Slide no. 34
Revenue and Expenditure Estimates Revenue
2010/11
2011/12
2012/13
2013/14 2013/14 2014/15
2015/16
2016/17
ENE Estimate
Adjustment
Approved
Rand Thousand
Audited Audited AuditedPre-Audited
Budget Budget Budget Budget Budget Estimate*
1Government grant
631 685
668 613
754 953
846 333
829 973 36 360 866 333876 309
974 0121 024 847
2TOMSA levies
104 973
98 169111 970
131 289
87 472 87 472 82 000 86 428 91 009
3Indaba & Meetings Africa
38 803 37 868 50 013 59 438 42 463 42 463 48 694 51 323 54 044
4Grading fees (note 1)
6 376 5 284 3 252 1 520 14 236 14 236 14 668 15 460 16 279
5Sundry revenue
52 567 19 045 50 318 57 610 18 168 18 168 20 567 36 531 38 466
Total834 404
828 979
970 506
1.096 m
992 312 36 360 1.028 m1.043 m
1.164 m 1.224 m
Note 1: Only the net grading revenue after the deduction of assessor fees were disclosed in the audited Annual Financial Statements for 2010/11, 2011/12 and 2012/13 respectively. Net grading fees for 2013/14 was R 1 520 250 after deducting assessor fees of R 10 393 618.
Strategic Plan & Annual Performance Plan – 04 July 2014Slide no. 34

Slide no. 35
Revenue and Expenditure Estimates per KPIName of the Objective
2010/11 2011/12 2012/13 2013/14 2014/15 2015/16 2016/17
ENE Estimate
AdjustmentApproved
in Rand Audited Audited Audited Budget Budget Budget
Major Objectives
856 089 863 295 979 646 992 312 - 992 312 1 042 238 1 163 755 1 224 645
Administration 88 292 143 054 105 465 86 663 10 000 96 663 111 160 117 163 123 372
1
Increase annual foreign visitor arrivals to South Africa
227 535 223 734 268 375 291 519 - 291 519 290 462 291 509 310 334
2
Increase the number of Domestic Travellers
39 694 23 452 45 113 35 038 26 360 61 398 43 672 143 800 144 000
3
Increase tourism trended revenue contribution to the economy
227 535 223 734 268 375 291 519 291 519 290 462 291 509 310 334
4
Marketing South Africa to become the preferred Tourism Brand*
238 465 224 258 245 850 206 828 206 828 220 292 232 187 244 493
5
To provide quality assurance by having graded accommodation establishments
34 568 25 061 3 252 37 114 37 114 40 377 39 300 41 265
6
To increase the number of international Business Events delegates in South Africa
43 216 43 631 43 631 45 813 48 287 50 846
Total 856 089 863 293 979 646 992 312 36 3601 028 672
1 042 238 1 163 755 1 224 645
Slide no. 35 Strategic Plan & Annual Performance Plan – 04 July 2014
Slide no. 36
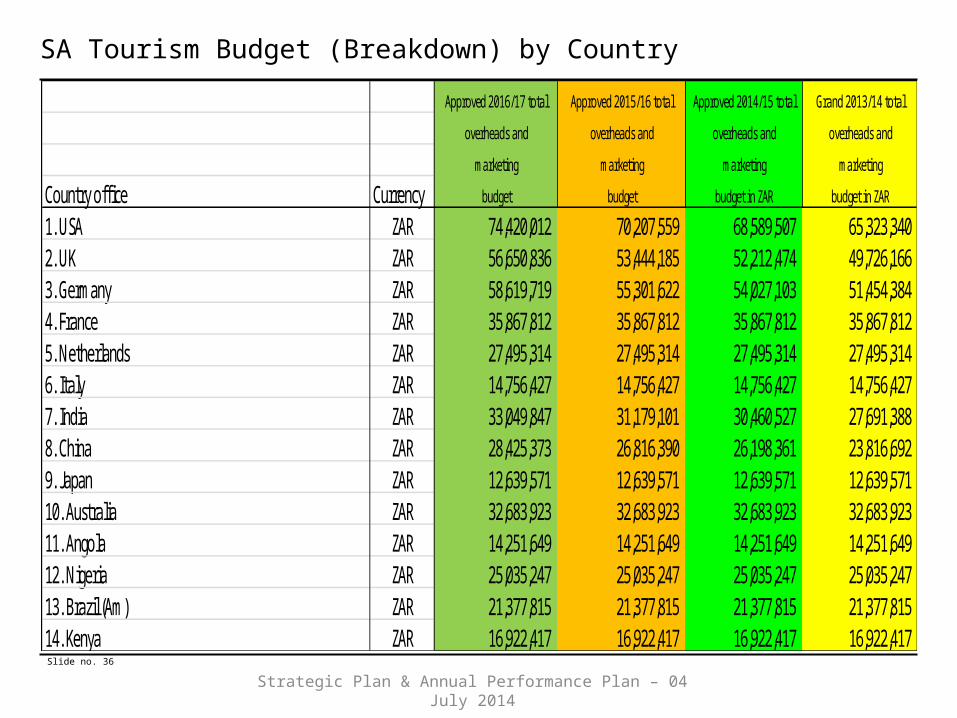
SA Tourism Budget (Breakdown) by Country
Strategic Plan & Annual Performance Plan – 04 July 2014
Approved 2016/17 total Approved 2015/16 total Approved 2014/15 total Grand 2013/14 total
overheads and overheads and overheads and overheads and
marketing marketing marketing marketing
Country office Currency budget budget budget in ZAR budget in ZAR
1. USA ZAR 74,420,012 70,207,559 68,589,507 65,323,340 2. UK ZAR 56,650,836 53,444,185 52,212,474 49,726,166 3. Germany ZAR 58,619,719 55,301,622 54,027,103 51,454,384 4. France ZAR 35,867,812 35,867,812 35,867,812 35,867,812 5. Netherlands ZAR 27,495,314 27,495,314 27,495,314 27,495,314 6. Italy ZAR 14,756,427 14,756,427 14,756,427 14,756,427 7. India ZAR 33,049,847 31,179,101 30,460,527 27,691,388 8. China ZAR 28,425,373 26,816,390 26,198,361 23,816,692 9. Japan ZAR 12,639,571 12,639,571 12,639,571 12,639,571 10. Australia ZAR 32,683,923 32,683,923 32,683,923 32,683,923 11. Angola ZAR 14,251,649 14,251,649 14,251,649 14,251,649 12. Nigeria ZAR 25,035,247 25,035,247 25,035,247 25,035,247 13. Brazil (Am) ZAR 21,377,815 21,377,815 21,377,815 21,377,815 14. Kenya ZAR 16,922,417 16,922,417 16,922,417 16,922,417

Slide no. 37
Other Resource Considerations
• Current staff complement of 206 is not expected to change in the 2014/15 financial year.
• Estimated Capital Expenditure (CAPEX) of R9.82m (2014/15) in respect of Head Quarters (HQ) office extension for Phase 1 and 2 respectively.
• Estimated R8.01m (2014/15) for software, hardware, vehicles and lease improvements.
Strategic Plan & Annual Performance Plan – 04 July 2014
Slide no. 38
Contents
• Vision, Mission and Mandate and Governance
• Strategic Approach and Performance
• Africa Growth Strategy
• Domestic Tourism Strategy
• Strategic Objective Annual Targets, Performance
• Breakdown of Tourism Budget
• Concluding Remarks
• Global Audio Visual – “Reconsider South Africa”
Strategic Plan & Annual Performance Plan – 04 July 2014

Slide no. 39
Concluding Remarks
• Fragile economic recovery and expected economic recession
• Promising outbound tourism growth but short –haul travel
• Shrinking disposable income due to austerity measures
• Exchange currency weakness
• Growing middle class in Africa
• Unemployment dampening domestic tourism
Strategic Plan & Annual Performance Plan – 04 July 2014

Slide no. 40
Contents
• Vision, Mission and Mandate and Governance
• Strategic Approach and Performance
• Africa Growth Strategy
• Domestic Tourism Strategy
• Strategic Objective Annual Targets, Performance
• Breakdown of Tourism Budget
• Concluding Remarks
• Global Audio Visual – “Reconsider South Africa”
Strategic Plan & Annual Performance Plan – 04 July 2014

Slide no. 41
Reconsider South Africa (New South African Tourism brand video)
Strategic Plan & Annual Performance Plan – 04 July 2014

Thank You
Slide no. 42
Strategic Plan & Annual Performance Plan – 04 July 2014