briefing book cover - washington state department of ... › ... › briefing-manual ›...
TRANSCRIPT

Economic Services Administration
E S A Briefing BookState Fiscal Year 2000
A reference for programs, caseloads, and expenditures.
January 2001

i
Economic Services Administration
E S A Briefing BookState Fiscal Year 2000
A reference for programs, caseloads, and expenditures.
January 2001
January 2, 2001
Dear Colleagues,
I am pleased to present the Economic Services Administration’s (ESA’s) 2000 ProgramBriefing Book. It is your reference guide to our programs, client demographics,caseloads, and expenditures. The book highlights information for State Fiscal Year(SFY) 2000, the period of July 1999 through June 2000, and provides you with historicaldata.
We have tried to make the Briefing Book more user-friendly. This year we havecombined the caseload and demographic information, and presented this information foreach major program, under separate sections.
Also, for the first time, you can now find this information online at
www.wa.gov/dshs/esa/briefingbook.htm
We are committed to providing you with accurate and useful information. If you haveany questions about ESA or this information, please contact me or members of the ESAstaff listed in Appendix 1. I would also like to hear your suggestions for making thisBriefing Book even more useful to you next year.
Sincerely,
John Atherton, Acting Assistant Secretary Economic Assistance Administration
Table of Contents
ESA Program Briefing Book 2000
iii
PageIntroduction
Introduction v
Program Descriptions
Introduction ...................................................................................................................1
Additional Requirements and Emergent Needs (AREN) ................................................2
Child Support Services..................................................................................................4
Consolidated Emergency Assistance program (CEAP) .................................................6
Diversion Cash Assistance (DCA) .................................................................................8
Food Assistance Program for Legal Immigrants (FAP) ..................................................9
Federal Food Stamp program (FSP) ...........................................................................10
Food Stamp Employment and Training (FS E&T)........................................................12
General Assistance – Children Living with legal Guardians (GA-H) .............................14
General Assistance –Unemployable (GA-U) ...............................................................16
General Assistance – Unemployable with Expedited Medicaid (GA-X) ........................18
Immigrant Assistance Services ...................................................................................20
Refugee Cash Assistance (RCA) ................................................................................21
Refugee Services ........................................................................................................23
State Family Assistance (SFA)....................................................................................25
Supplemental Security Income (SSI) State Supplemental Payments ..........................27
Temporary Assistance for Needy Families (TANF)......................................................29
United States Repatriate .............................................................................................31
Washington Telephone Assistance Program (WTAP) ......................................32
WorkFirst (WF) .................................................................................................34
Working Connections Child Care (WCCC) ..................................................................37
Table of Contents
ESA Program Briefing Book 2000
iv
Page
Caseloads and Demographics
Caseload Comparison.................................................................................................39
TANF/WorkFirst ..........................................................................................................51
Child Support ..............................................................................................................77
Working Connections Child Care ................................................................................85
Food Assistance..........................................................................................................93
General Assistance ...................................................................................................105
Other Program ..........................................................................................................115
Expenditures
Expenditures Introduction..........................................................................................143
Expenditures Overview .............................................................................................144
Cash Grant Assistance..............................................................................................149
WorkFirst...................................................................................................................155
Administrative Expenditures ......................................................................................157
Appendices
1. Contacts ............................................................................................................ A1-1
2. DSHS Regional Map ....................................................................................... A2a-1
3. Community Services Division Offices .............................................................. A2b-1
4. Division of Child Support Offices ....................................................................... A3-1
5. Abbreviations ....................................................................................................A4-1
6. Selected Internet Sites ...................................................................................... A5-1
7. Electronic Benefits and Funds Transfer ............................................................. A6-1
8. Federal Welfare Legislative History and State Welfare History .......................... A7-1
9. Change in Cash Grant Assistance Programs/Funding Due to Welfare Reforms ...... A8-1
10. Child Support Federal Legislative History .......................................................... A9-1
11. Major Changes in ESA Programs by Month .................................................... A10-1
Introduction
ESA Program Briefing Book 2000v
Introduction to ESA
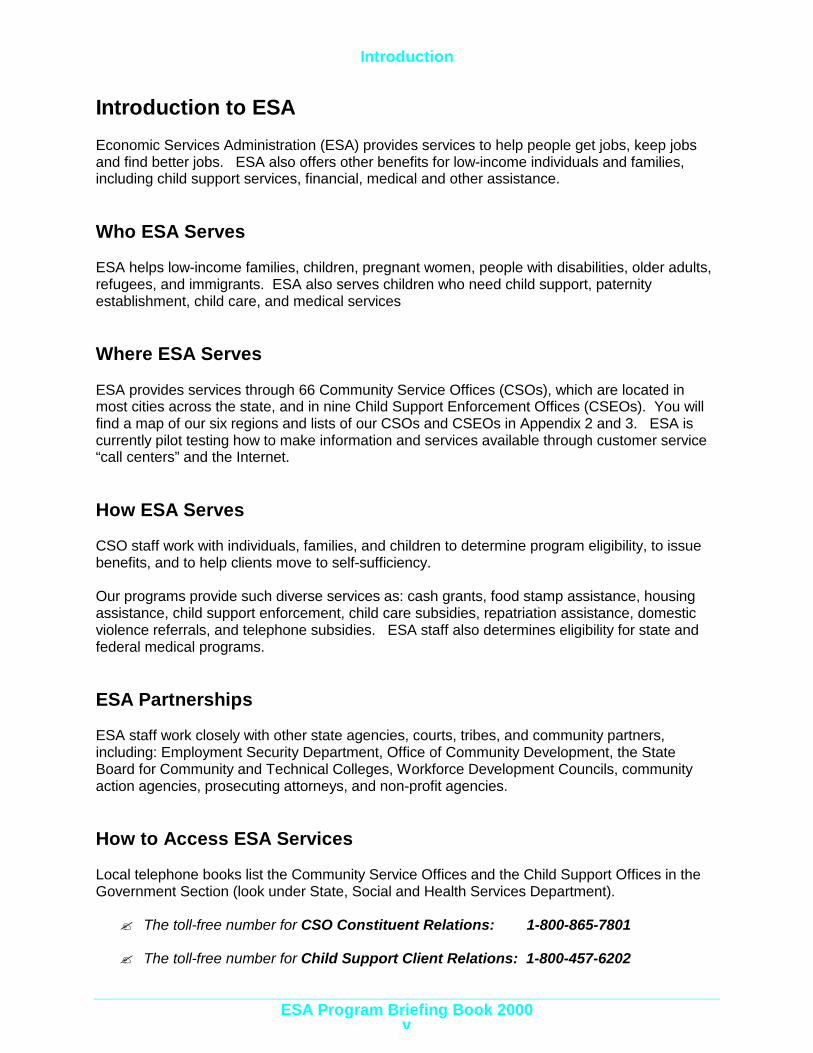
Economic Services Administration (ESA) provides services to help people get jobs, keep jobsand find better jobs. ESA also offers other benefits for low-income individuals and families,including child support services, financial, medical and other assistance.
Who ESA Serves
ESA helps low-income families, children, pregnant women, people with disabilities, older adults,refugees, and immigrants. ESA also serves children who need child support, paternityestablishment, child care, and medical services
Where ESA Serves
ESA provides services through 66 Community Service Offices (CSOs), which are located inmost cities across the state, and in nine Child Support Enforcement Offices (CSEOs). You willfind a map of our six regions and lists of our CSOs and CSEOs in Appendix 2 and 3. ESA iscurrently pilot testing how to make information and services available through customer service“call centers” and the Internet.
How ESA Serves
CSO staff work with individuals, families, and children to determine program eligibility, to issuebenefits, and to help clients move to self-sufficiency.
Our programs provide such diverse services as: cash grants, food stamp assistance, housingassistance, child support enforcement, child care subsidies, repatriation assistance, domesticviolence referrals, and telephone subsidies. ESA staff also determines eligibility for state andfederal medical programs.
ESA Partnerships
ESA staff work closely with other state agencies, courts, tribes, and community partners,including: Employment Security Department, Office of Community Development, the StateBoard for Community and Technical Colleges, Workforce Development Councils, communityaction agencies, prosecuting attorneys, and non-profit agencies.
How to Access ESA Services
Local telephone books list the Community Service Offices and the Child Support Offices in theGovernment Section (look under State, Social and Health Services Department).
? The toll-free number for CSO Constituent Relations: 1-800-865-7801
? The toll-free number for Child Support Client Relations: 1-800-457-6202
Program Descriptions
ESA Program Briefing Book 20001
ESA Programs
ESA provides a wide variety ofservices through 19 programs.They are described, inalphabetical order, on thefollowing pages.
? Additional Requirements – Emergent Needs(AREN)
? Child Support Services
? Consolidated Emergency Assistance Program(CEAP)
? Diversion Cash Assistance (DCA)
? Federal Food Stamp Program (FSP)
? Food Assistance Program for Legal Immigrants(FAP)
? Food Stamp Employment and Training (FS E&T)
? General Assistance – Children Living with LegalGuardians (GA-H)
? General Assistance – Unemployable (GA-U)
? General Assistance – Unemployable withExpedited Medicaid (GA-X)
? Immigrant Assistance Services
? Refugee Cash Assistance (RCA)
? Refugee Services
? State Family Assistance (SFA)
? Supplemental Security Income (SSI) StateSupplemental Payment
? Temporary Assistance for Needy Families(TANF)
? United States Repatriate
? Washington Telephone Assistance Program(WTAP)
? WorkFirst (WF)
? Working Connections Child Care (WCCC)
Program Descriptions
ESA Program Briefing Book 20002
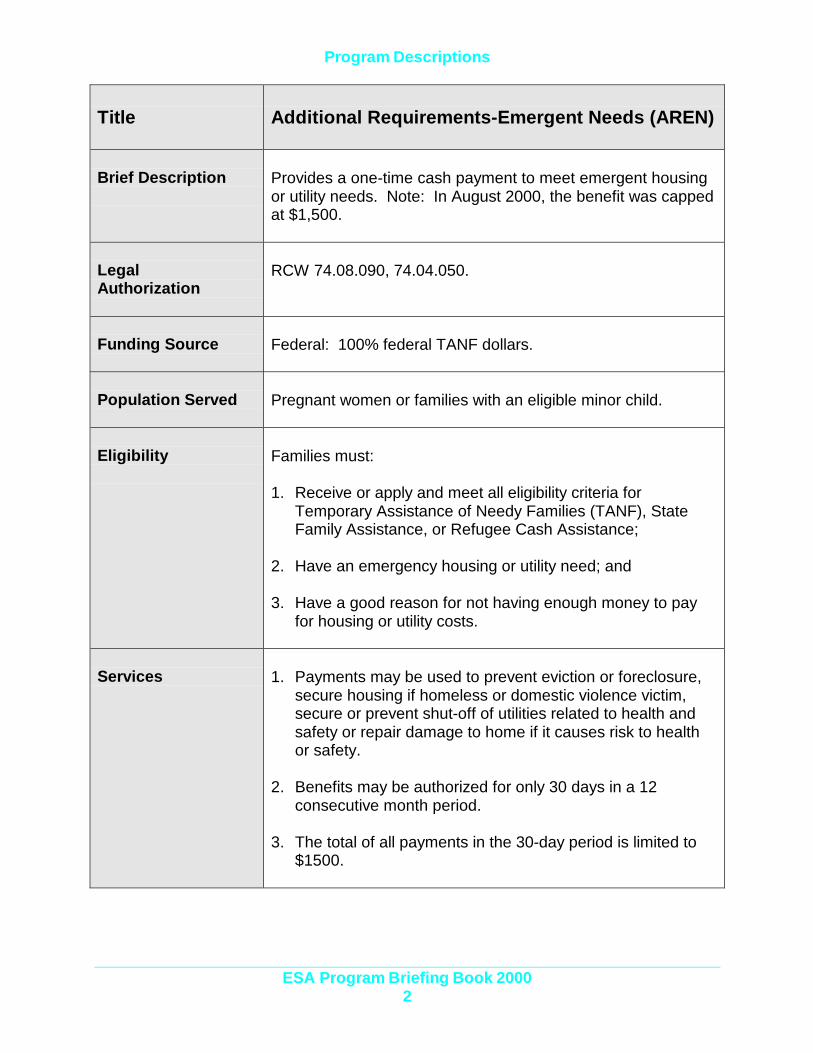
Title Additional Requirements-Emergent Needs (AREN)
Brief Description Provides a one-time cash payment to meet emergent housingor utility needs. Note: In August 2000, the benefit was cappedat $1,500.
LegalAuthorization
RCW 74.08.090, 74.04.050.
Funding Source Federal: 100% federal TANF dollars.
Population Served Pregnant women or families with an eligible minor child.
Eligibility Families must:
1. Receive or apply and meet all eligibility criteria forTemporary Assistance of Needy Families (TANF), StateFamily Assistance, or Refugee Cash Assistance;
2. Have an emergency housing or utility need; and
3. Have a good reason for not having enough money to payfor housing or utility costs.
Services 1. Payments may be used to prevent eviction or foreclosure,secure housing if homeless or domestic violence victim,secure or prevent shut-off of utilities related to health andsafety or repair damage to home if it causes risk to healthor safety.
2. Benefits may be authorized for only 30 days in a 12consecutive month period.
3. The total of all payments in the 30-day period is limited to$1500.
Program Descriptions
ESA Program Briefing Book 20003
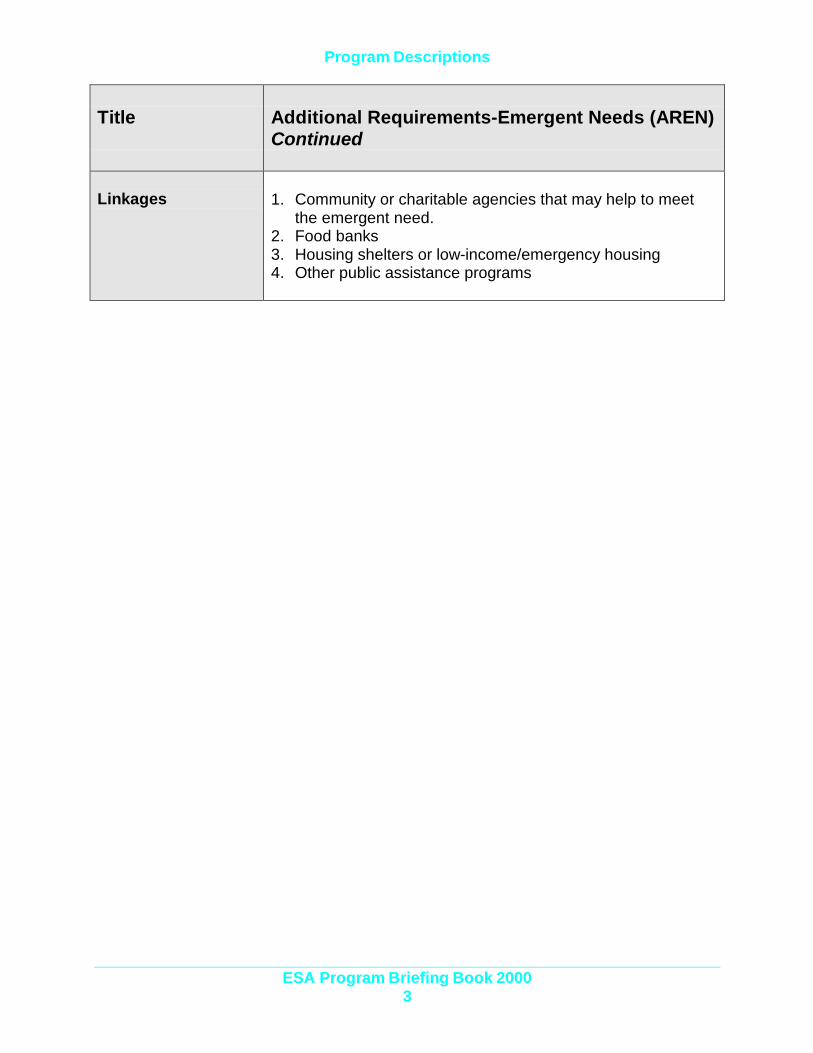
Title Additional Requirements-Emergent Needs (AREN)Continued
Linkages 1. Community or charitable agencies that may help to meetthe emergent need.
2. Food banks3. Housing shelters or low-income/emergency housing4. Other public assistance programs
Program Descriptions
ESA Program Briefing Book 20004
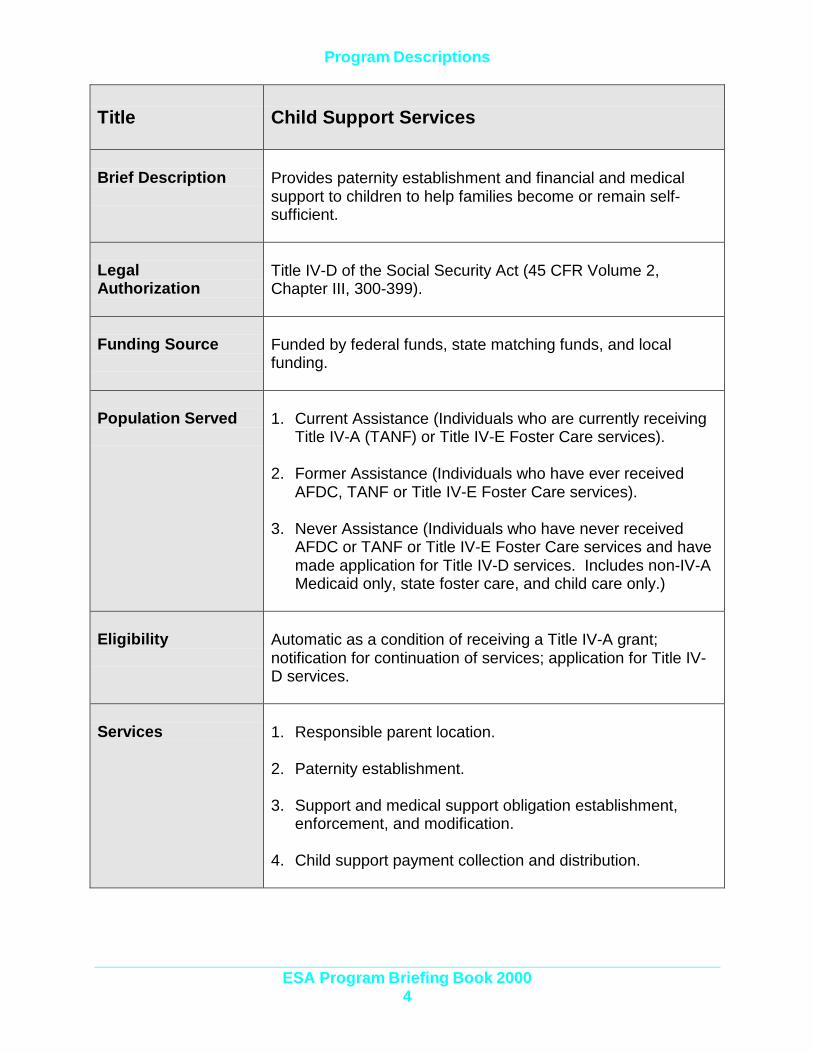
Title Child Support Services
Brief Description Provides paternity establishment and financial and medicalsupport to children to help families become or remain self-sufficient.
LegalAuthorization
Title IV-D of the Social Security Act (45 CFR Volume 2,Chapter III, 300-399).
Funding Source Funded by federal funds, state matching funds, and localfunding.
Population Served 1. Current Assistance (Individuals who are currently receivingTitle IV-A (TANF) or Title IV-E Foster Care services).
2. Former Assistance (Individuals who have ever receivedAFDC, TANF or Title IV-E Foster Care services).
3. Never Assistance (Individuals who have never receivedAFDC or TANF or Title IV-E Foster Care services and havemade application for Title IV-D services. Includes non-IV-AMedicaid only, state foster care, and child care only.)
Eligibility Automatic as a condition of receiving a Title IV-A grant;notification for continuation of services; application for Title IV-D services.
Services 1. Responsible parent location.
2. Paternity establishment.
3. Support and medical support obligation establishment,enforcement, and modification.
4. Child support payment collection and distribution.
Program Descriptions
ESA Program Briefing Book 20005
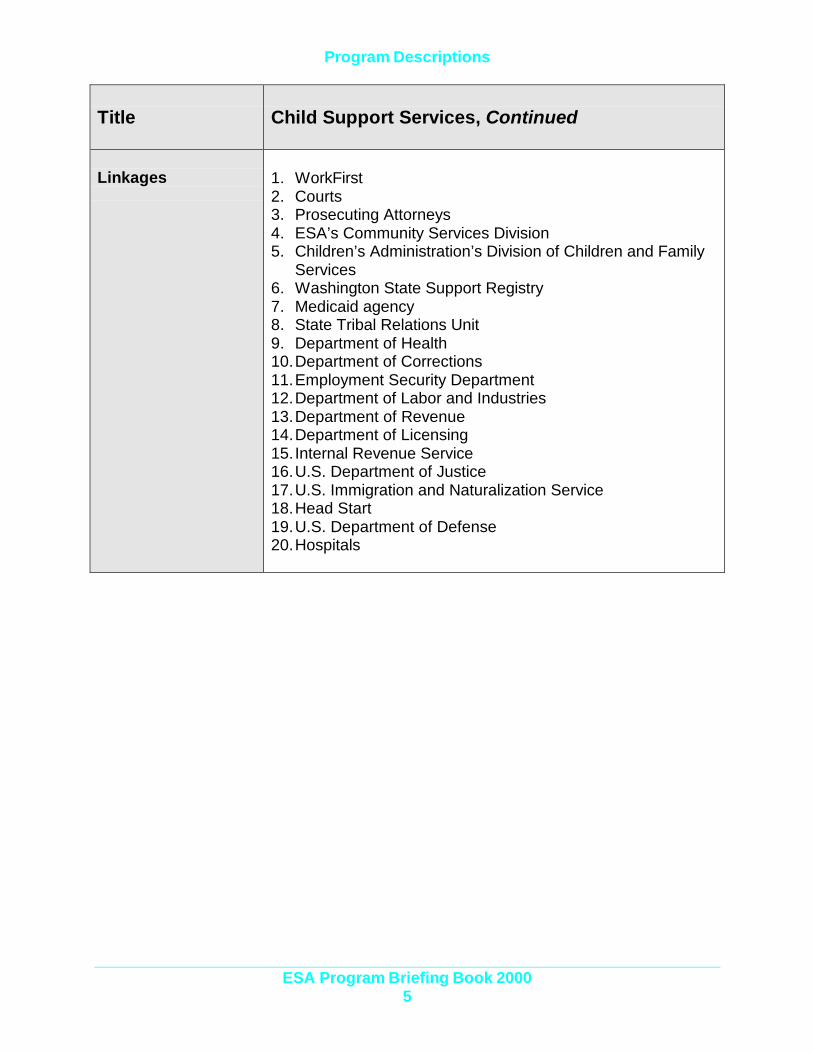
Title Child Support Services, Continued
Linkages 1. WorkFirst2. Courts3. Prosecuting Attorneys4. ESA’s Community Services Division5. Children’s Administration’s Division of Children and Family
Services6. Washington State Support Registry7. Medicaid agency8. State Tribal Relations Unit9. Department of Health10. Department of Corrections11. Employment Security Department12. Department of Labor and Industries13. Department of Revenue14. Department of Licensing15. Internal Revenue Service16. U.S. Department of Justice17. U.S. Immigration and Naturalization Service18. Head Start19. U.S. Department of Defense20. Hospitals
Program Descriptions
ESA Program Briefing Book 20006
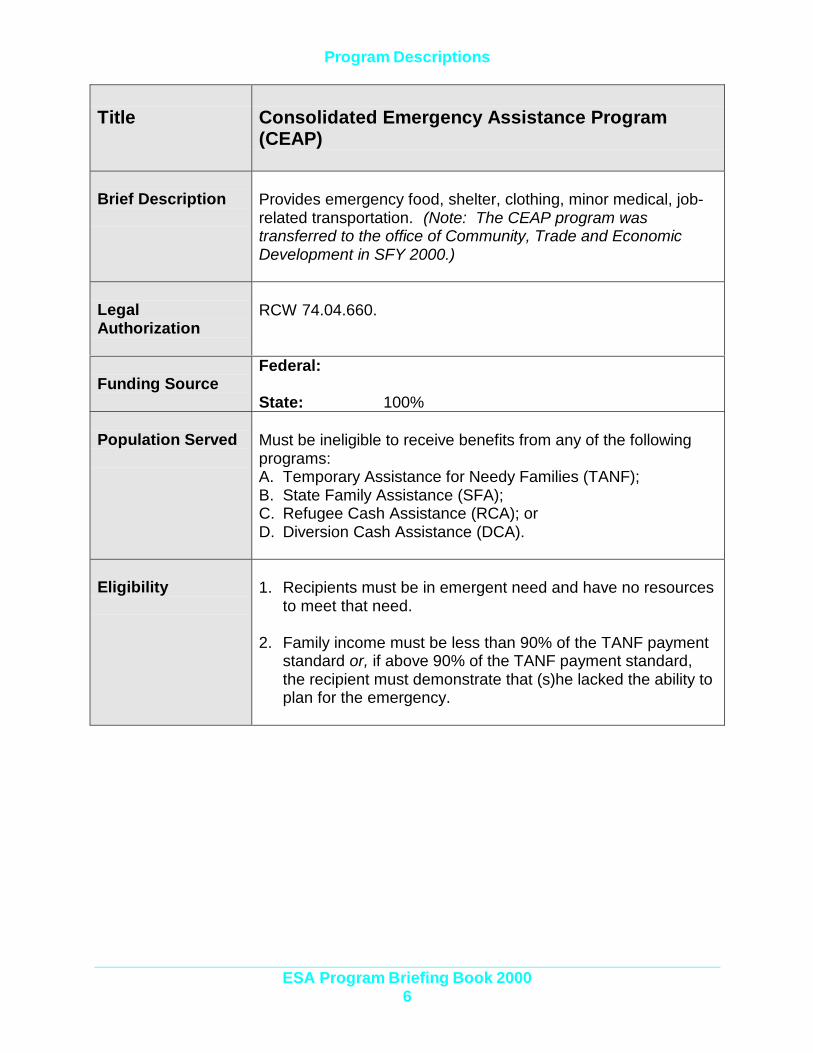
Title Consolidated Emergency Assistance Program(CEAP)
Brief Description Provides emergency food, shelter, clothing, minor medical, job-related transportation. (Note: The CEAP program wastransferred to the office of Community, Trade and EconomicDevelopment in SFY 2000.)
LegalAuthorization
RCW 74.04.660.
Funding SourceFederal:
State: 100%
Population Served Must be ineligible to receive benefits from any of the followingprograms:A. Temporary Assistance for Needy Families (TANF);B. State Family Assistance (SFA);C. Refugee Cash Assistance (RCA); orD. Diversion Cash Assistance (DCA).
Eligibility 1. Recipients must be in emergent need and have no resourcesto meet that need.
2. Family income must be less than 90% of the TANF paymentstandard or, if above 90% of the TANF payment standard,the recipient must demonstrate that (s)he lacked the ability toplan for the emergency.
Program Descriptions
ESA Program Briefing Book 20007
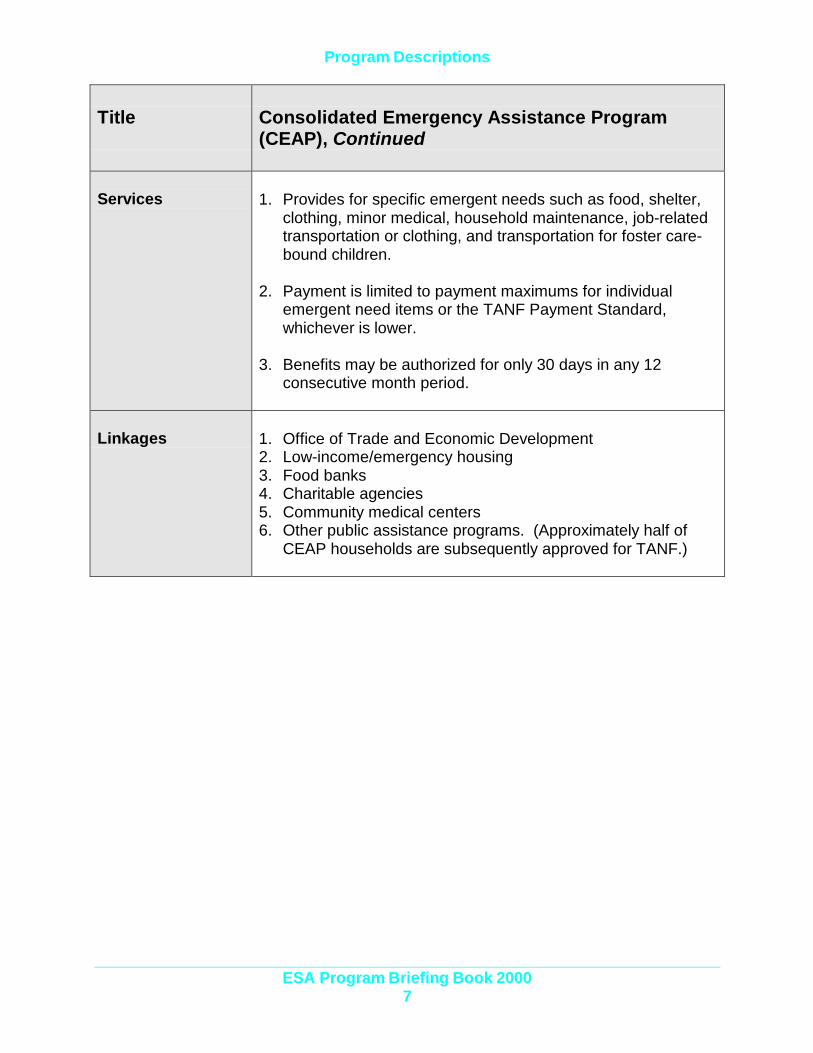
Title Consolidated Emergency Assistance Program(CEAP), Continued
Services 1. Provides for specific emergent needs such as food, shelter,clothing, minor medical, household maintenance, job-relatedtransportation or clothing, and transportation for foster care-bound children.
2. Payment is limited to payment maximums for individualemergent need items or the TANF Payment Standard,whichever is lower.
3. Benefits may be authorized for only 30 days in any 12consecutive month period.
Linkages 1. Office of Trade and Economic Development2. Low-income/emergency housing3. Food banks4. Charitable agencies5. Community medical centers6. Other public assistance programs. (Approximately half of
CEAP households are subsequently approved for TANF.)

Program Descriptions
ESA Program Briefing Book 20008
Title Diversion Cash Assistance (DCA)
Brief Description Provides a once in a 12-month payment, up to $1,500, toovercome a temporary emergency and keep the person offTANF.
LegalAuthorization
RCW 74.08A.210.
Funding SourceFederal:
State: 100%
Population Served Low-income families with temporary emergent needs who arenot likely to need continued assistance if those needs are met.
Eligibility 1. Must meet TANF eligibility criteria.
2. If the families goes on TANF within 12 months of receivingDCA, a proportionate amount of the DCA payment must berepaid to the state.
Services 1. Payments to cover emergent needs for shelter,transportation, child care, food, medical care, andemployment related expenses.
2. Usually paid directly to vendors.
Linkages 1. Employment2. Child Care3. Child Support Services4. Medical Assistance5. Food Assistance6. Other services to assist low-income families
Program Descriptions
ESA Program Briefing Book 20009
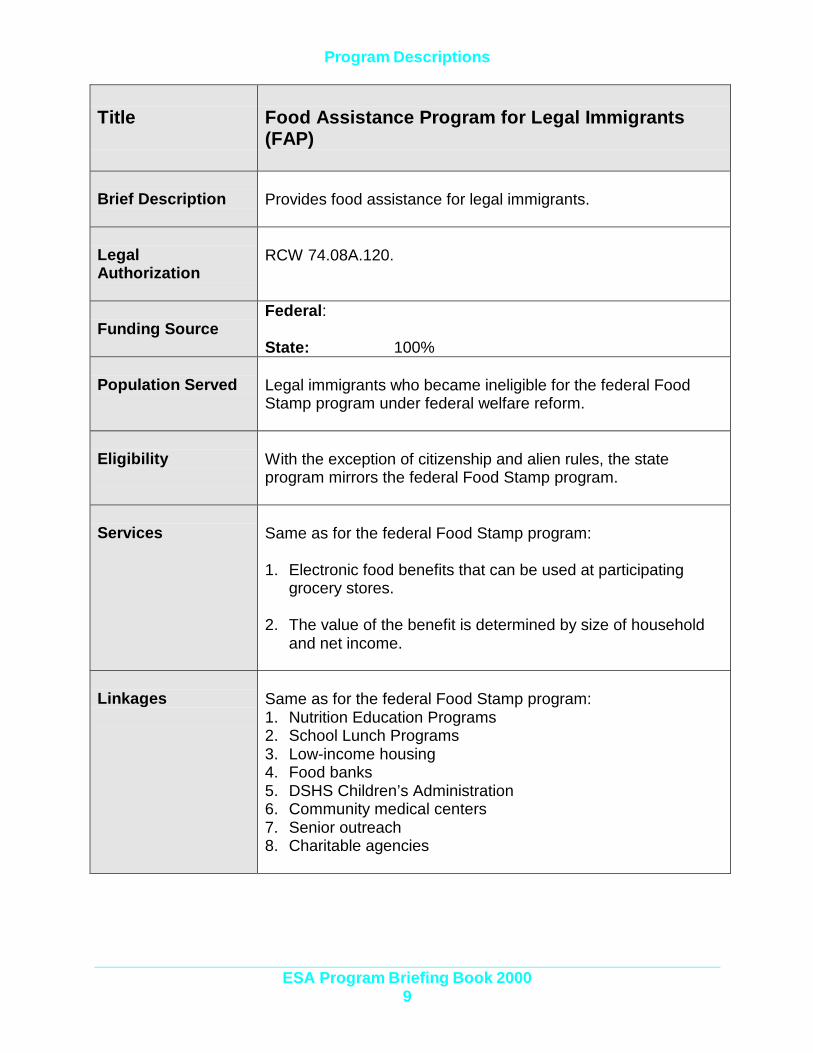
Title Food Assistance Program for Legal Immigrants(FAP)
Brief Description Provides food assistance for legal immigrants.
LegalAuthorization
RCW 74.08A.120.
Funding SourceFederal:
State: 100%
Population Served Legal immigrants who became ineligible for the federal FoodStamp program under federal welfare reform.
Eligibility With the exception of citizenship and alien rules, the stateprogram mirrors the federal Food Stamp program.
Services Same as for the federal Food Stamp program:
1. Electronic food benefits that can be used at participatinggrocery stores.
2. The value of the benefit is determined by size of householdand net income.
Linkages Same as for the federal Food Stamp program:1. Nutrition Education Programs2. School Lunch Programs3. Low-income housing4. Food banks5. DSHS Children’s Administration6. Community medical centers7. Senior outreach8. Charitable agencies
Program Descriptions
ESA Program Briefing Book 200010
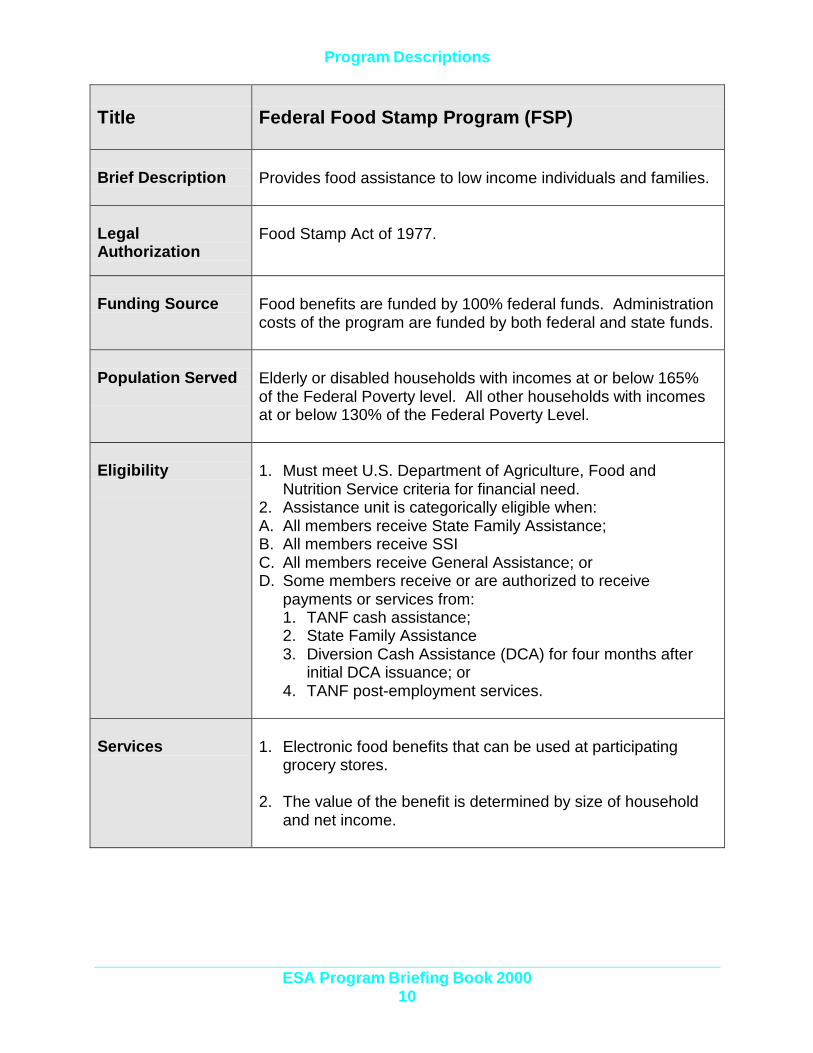
Title Federal Food Stamp Program (FSP)
Brief Description Provides food assistance to low income individuals and families.
LegalAuthorization
Food Stamp Act of 1977.
Funding Source Food benefits are funded by 100% federal funds. Administrationcosts of the program are funded by both federal and state funds.
Population Served Elderly or disabled households with incomes at or below 165%of the Federal Poverty level. All other households with incomesat or below 130% of the Federal Poverty Level.
Eligibility 1. Must meet U.S. Department of Agriculture, Food andNutrition Service criteria for financial need.
2. Assistance unit is categorically eligible when:A. All members receive State Family Assistance;B. All members receive SSIC. All members receive General Assistance; orD. Some members receive or are authorized to receive
payments or services from:1. TANF cash assistance;2. State Family Assistance3. Diversion Cash Assistance (DCA) for four months after
initial DCA issuance; or4. TANF post-employment services.
Services 1. Electronic food benefits that can be used at participatinggrocery stores.
2. The value of the benefit is determined by size of householdand net income.

Program Descriptions
ESA Program Briefing Book 200011
Title Federal Food Stamp Program (FSP), Continued
Linkages 1. Nutrition Education Programs2. School Lunch Programs3. Low-income housing4. Food banks5. Children and Family Services6. Community medical centers7. Senior outreach8. Charitable agencies
Program Descriptions
ESA Program Briefing Book 200012
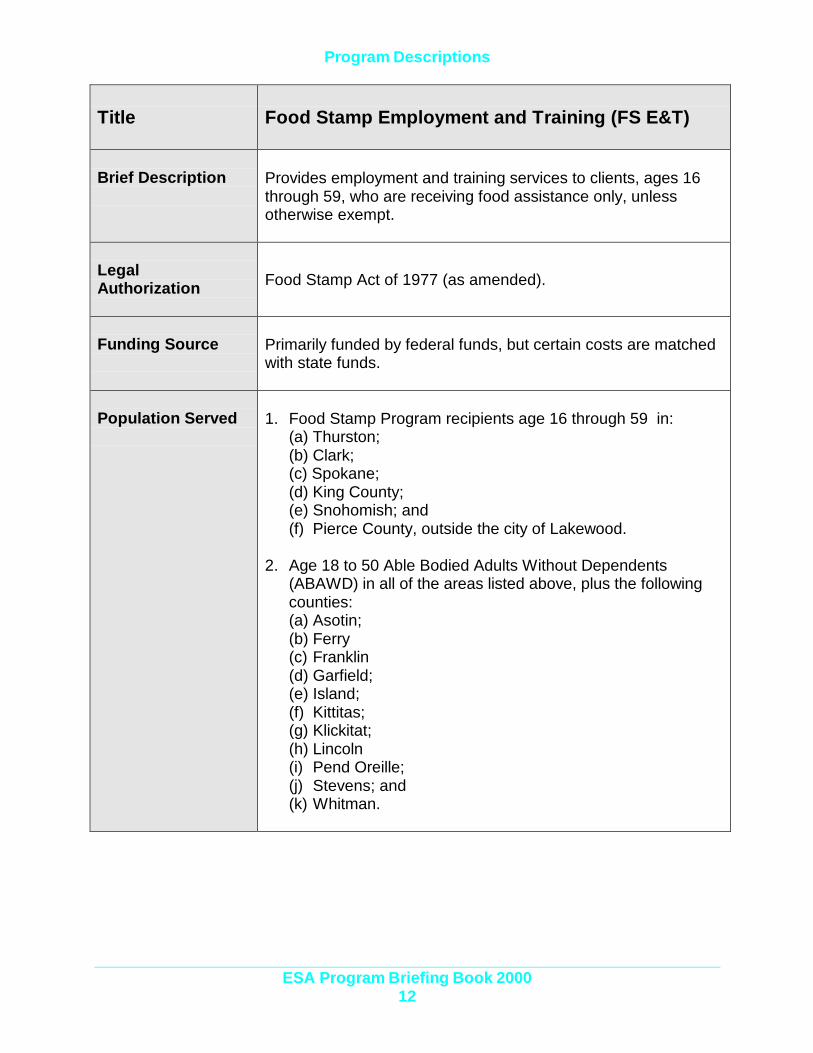
Title Food Stamp Employment and Training (FS E&T)
Brief Description Provides employment and training services to clients, ages 16through 59, who are receiving food assistance only, unlessotherwise exempt.
LegalAuthorization Food Stamp Act of 1977 (as amended).
Funding Source Primarily funded by federal funds, but certain costs are matchedwith state funds.
Population Served 1. Food Stamp Program recipients age 16 through 59 in:(a) Thurston;(b) Clark;(c) Spokane;(d) King County;(e) Snohomish; and(f) Pierce County, outside the city of Lakewood.
2. Age 18 to 50 Able Bodied Adults Without Dependents(ABAWD) in all of the areas listed above, plus the followingcounties:(a) Asotin;(b) Ferry(c) Franklin(d) Garfield;(e) Island;(f) Kittitas;(g) Klickitat;(h) Lincoln(i) Pend Oreille;(j) Stevens; and(k) Whitman.
Program Descriptions
ESA Program Briefing Book 200013
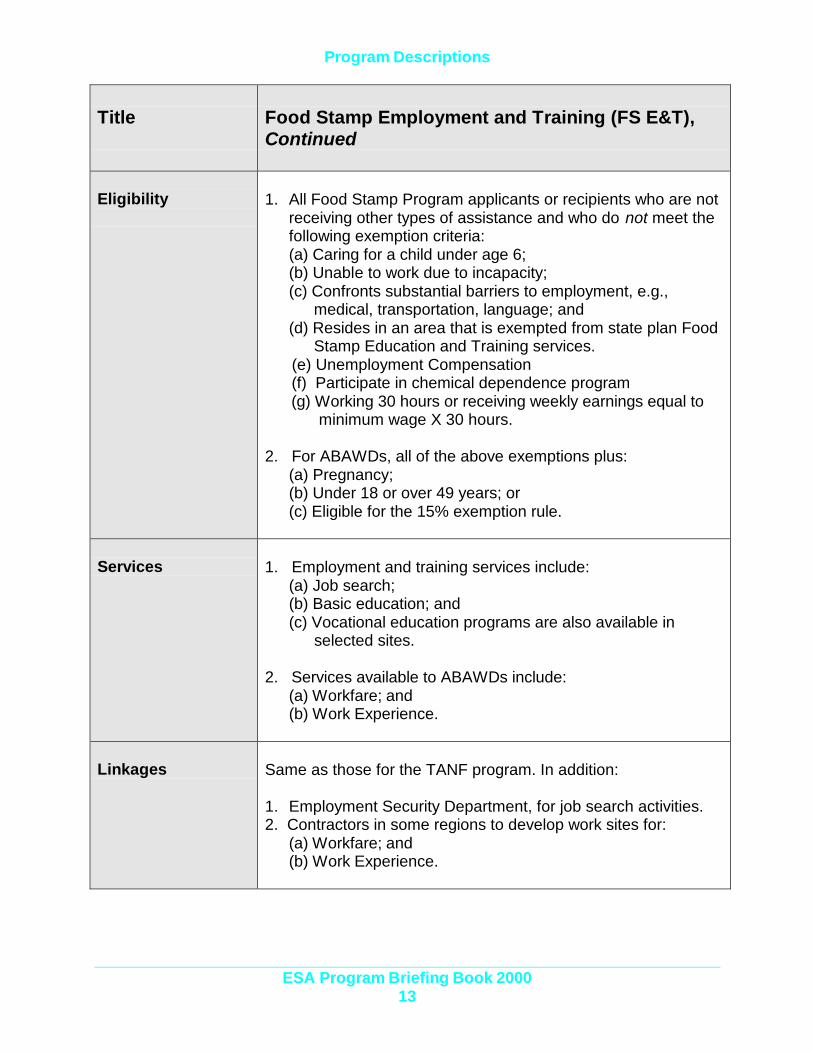
Title Food Stamp Employment and Training (FS E&T),Continued
Eligibility 1. All Food Stamp Program applicants or recipients who are notreceiving other types of assistance and who do not meet thefollowing exemption criteria:(a) Caring for a child under age 6;(b) Unable to work due to incapacity;(c) Confronts substantial barriers to employment, e.g.,
medical, transportation, language; and(d) Resides in an area that is exempted from state plan Food
Stamp Education and Training services. (e) Unemployment Compensation (f) Participate in chemical dependence program (g) Working 30 hours or receiving weekly earnings equal to minimum wage X 30 hours.
2. For ABAWDs, all of the above exemptions plus:(a) Pregnancy;(b) Under 18 or over 49 years; or(c) Eligible for the 15% exemption rule.
Services 1. Employment and training services include:(a) Job search;(b) Basic education; and(c) Vocational education programs are also available in
selected sites.
2. Services available to ABAWDs include:(a) Workfare; and(b) Work Experience.
Linkages Same as those for the TANF program. In addition:
1. Employment Security Department, for job search activities.2. Contractors in some regions to develop work sites for:
(a) Workfare; and (b) Work Experience.
Program Descriptions
ESA Program Briefing Book 200014
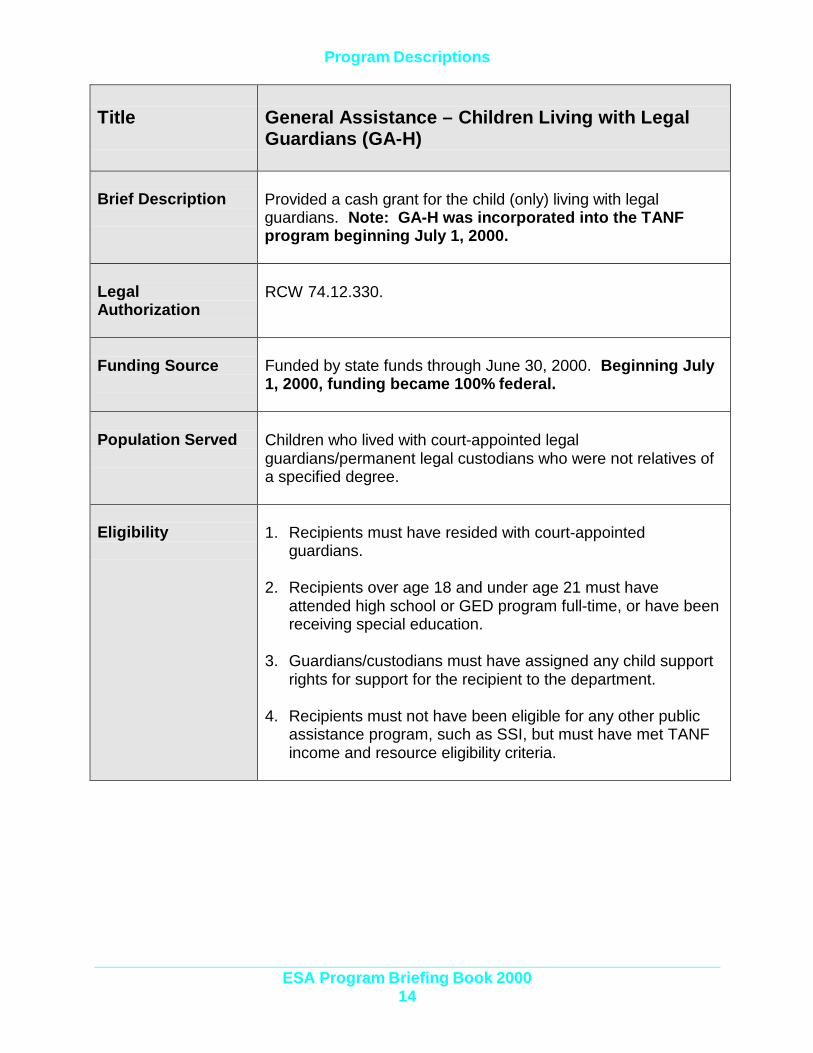
Title General Assistance – Children Living with LegalGuardians (GA-H)
Brief Description Provided a cash grant for the child (only) living with legalguardians. Note: GA-H was incorporated into the TANFprogram beginning July 1, 2000.
LegalAuthorization
RCW 74.12.330.
Funding Source Funded by state funds through June 30, 2000. Beginning July1, 2000, funding became 100% federal.
Population Served Children who lived with court-appointed legalguardians/permanent legal custodians who were not relatives ofa specified degree.
Eligibility 1. Recipients must have resided with court-appointedguardians.
2. Recipients over age 18 and under age 21 must haveattended high school or GED program full-time, or have beenreceiving special education.
3. Guardians/custodians must have assigned any child supportrights for support for the recipient to the department.
4. Recipients must not have been eligible for any other publicassistance program, such as SSI, but must have met TANFincome and resource eligibility criteria.

Program Descriptions
ESA Program Briefing Book 200015
Title General Assistance – Children Living with LegalGuardians (GA-H), Continued
Services 1. Cash grants for basic needs was based on the TANFPayment Standard.
2. Services provided covered only the needs of the children andno other household member.
3. Eligibility for services was redetermined every six months.
4. Full-scope medical coverage was provided through Medicaid.
Linkages 1. Low-income housing2. Food banks3. Charitable agencies4. Community medical centers
Program Descriptions
ESA Program Briefing Book 200016
Title General Assistance – Unemployable (GA-U)
Brief Description Provides cash assistance for low-income adults who areunemployable.
LegalAuthorization
RCW 74.04.005(6).
Funding SourceFederal:
State: 100%
Population Served 1. Incapacitated adults aged 18 to 65 years, or
2. If under 18, a member of a married couple residing togetheror residing apart because the spouse is:(a) On a visit of 90 days or less;(b) In a public or private institution;(c) In a hospital, long-term care facility, or chemical
dependency treatment facility; or
(d) On active duty in the military.
Eligibility 1. Recipients must meet income and resource tests. Resourcelimits are the same as for the TANF program.
2. Recipients must be unemployable due to mental, emotional,or physical impairment. For applicants the impairment mustprevent employment for at least 90 days from date ofapplication.
3. A person is ineligible if incapacitated only by alcoholism ordrug addiction. Persons whose alcohol or substance abuseresults in a mental or physical impairment that qualifies as aGA-U incapacity may choose between GA-U and ADATSAShelter programs. Cash assistance, to recipients whochoose GA-U, is issued to a protective payee. Recipientsmay also be required to participate in alcohol or drugtreatment.

Program Descriptions
ESA Program Briefing Book 200017
Title General Assistance – Unemployable (GA-U),Continued
EligibilityContinued
4. Recipients must accept available treatment that would enablethem to become employable or reduce their need forassistance.
Services1. Cash grant assistance.
2. Additional requirements for certain services (laundry,telephone, restaurant meals, home-delivered meals, andfood for service animals.
3. Medical overage through Medical Care Services.
4. Casework
5. Referral for alcohol or drug treatment, through ADATSA.
6. SSI-Facilitation, providing assistance with completing andmonitoring a SSA Title II or Title XVI application.
7. Supported employment services are provide by four pilotsites.
Linkages Local and emergency services agencies including:1. ADATSA alcohol/drug assessment and treatment centers2. Community mental health agencies3. Division of Vocational Rehabilitation4. Social Security Administration5. Food banks6. Housing shelters7. Congregate care facilities
Program Descriptions
ESA Program Briefing Book 200018
Title General Assistance – Unemployable with ExpeditedMedicaid (GA-X)
Brief Description Provides cash assistance for low-income adults who areapplying for, and appear to be eligible for, federal SSI benefits.
LegalAuthorization
Medicaid eligibility authorized by OBRA of 1990, programimplemented on May 1, 1991. Cash assistance authorized byRCW 74.04.005(6).
Funding Source Initial expenditures are 100% state funds that are recoupedwhen SSI eligibility is determined.
Population Served Adults 18 to 65 years old, who appear to be eligible for SSIbenefits pending a final determination by the Social SecurityAdministration (SSA).
Eligibility 1. Recipients must meet the same financial criteria as GA-U.
2. Incapacitating conditions must meet SSI disability orblindness criteria and must be expected to last at least 12months.
3. Recipients must be currently working with an SSI Facilitatorto obtain a SSI eligibility determination.
4. Eligibility extends only for the period pending thedetermination of SSI eligibility.
Services 1. Cash assistance, on-going Additional Requirementsassistance payments, case management, SSI facilitation,and referral services, the same as those provided to GA-Urecipients.
2. Medical coverage.

Program Descriptions
ESA Program Briefing Book 200019
Title General Assistance – Unemployable with ExpeditedMedicaid (GA-X), Continued
Linkages The same as those provided to GA-U recipients with the additionof :1. Social Security offices; and2. Private attorneys who accept referrals during the SSI appeals
process.
Program Descriptions
ESA Program Briefing Book 200020
Title Immigrant Assistance Services
Brief Description Provides services to prepare low-income immigrants for U.S.citizenship.
LegalAuthorization
1. In 1995, the Governor designated the Office of Refugee andImmigrant Assistance as the state’s applicant agency forcitizenship grants.
2. State naturalization facilitation law passed in 1997, RCW74.08A.130.
Funding SourceFederal:
State: 100%
Population Served Legal immigrant adults who lost their eligibility for the FederalFood Stamp program due to their non-citizen authorization.
Eligibility 1. Qualified aliens who arrived in the U.S. after August 21,1996, or
2. Those whose INS authorization as a refugee, asylee or otherexceeds the five-year time limit.
Services 1. Information and referral services;
2. Citizenship training (35 hours);
3. Fees for the INS application for citizenship; and
4. Staff support for the Washington State Task Force onImmigration and Naturalization.
Linkages 1. State Commissions for Asian, Pacific-American, Hispanic,and African-American Affairs.
2. U.S. Immigration and Naturalization Service3. Community colleges4. Community-based organizations5. Legal services agencies

Program Descriptions
ESA Program Briefing Book 200021
Title Refugee Cash Assistance (RCA)
Brief Description Provides cash assistance for refugees.
LegalAuthorization
Refugee Act of 1980, Public Law 96-212.
Funding SourceFederal: 100%
State:
Population Served 1. Refugees or asylees authorized by the U.S. StateDepartment to immigrate into the U.S. from any country.
2. Refugees granted permanent residence authorization andAmerasians.
Eligibility 1. Refugees, Cubans/Haitians, Amerasians, persons grantedasylum, or parolee authorization who meet financial needcriteria for the TANF program but are not TANF eligible(adults with no dependent children).
2. Currently, eligibility for adults expires eight months after thedate of their arrival in the United States. For asylee adults,eligibility expires eight months after the date their asyleestatus is granted.
3. Unless exempt, adults must register for employment andlanguage services.
Services 1. Cash assistance for food, clothing, and shelter.
2. Medical assistance.
3. See Refugee and Immigrant Assistance Section below.

Program Descriptions
ESA Program Briefing Book 200022
Title Refugee Cash Assistance (RCA), Continued
Linkages 1. Voluntary Resettlement Agencies2. Mutual Assistance Associations3. Community employment providers4. Low-income housing5. Food banks6. DSHS Children’s Administration7. Community medical centers8. Unaccompanied Minor Program (e.g., refugee foster care)9. Charitable agencies10. Workforce Development Councils11. Other local agencies

Program Descriptions
ESA Program Briefing Book 200023
Title Refugee Services
Brief Description Provides services for refugees, primarily by community-basedagencies, to help refugees become self-sufficient.
LegalAuthorization
1. Refugee Act of 1980, Public Law 96-212.
2. Refugees may participate in federally-funded employment,training, and other needed refugee resettlement services.(See Refugee Cash Assistance above.)
Funding Source Primarily funded by federal funds with a supplement of statefunding for certain individuals not eligible for federal funding.
Population Served 1. Refugees are those fleeing persecution due to their race,nationality, political opinion, religion or membership in aparticular group.
2. Refugees are admitted based on their special humanitarianconcern to the United States as determined by the President.
Eligibility 1. Persons who are paroled into the U.S., granted asylum, oradmitted as a refugee.
2. Amerasians, Cubans, and Haitians are eligible, although theydo not have refugee status.
3. Must meet low-income financial criteria.
4. Federal funding of employment services limited to first fiveyears after entering the United States.
Program Descriptions
ESA Program Briefing Book 200024
Title Refugee Services, Continued
Services The Office of Refugee Immigrant Assistance (ORIA) purchasesthe following services for refugees, through contracts withcommunity-based agencies, the community and technicalcolleges, and the Employment Security Department:
1. Employment training2. English language training3. Health screening4. Resettlement/social services5. Medicaid6. Foster care
Linkages 1. Community-based employment providers2. Mutual Assistance associations3. Voluntary Agencies who sponsor refugees4. Public health departments5. U.S. Immigration and Naturalization Services6. Community and technical colleges7. Community-based organizations8. Local employers9. Employment Security Department10. Workforce Training Councils11. City of Seattle and King County
Program Descriptions
ESA Program Briefing Book 200025
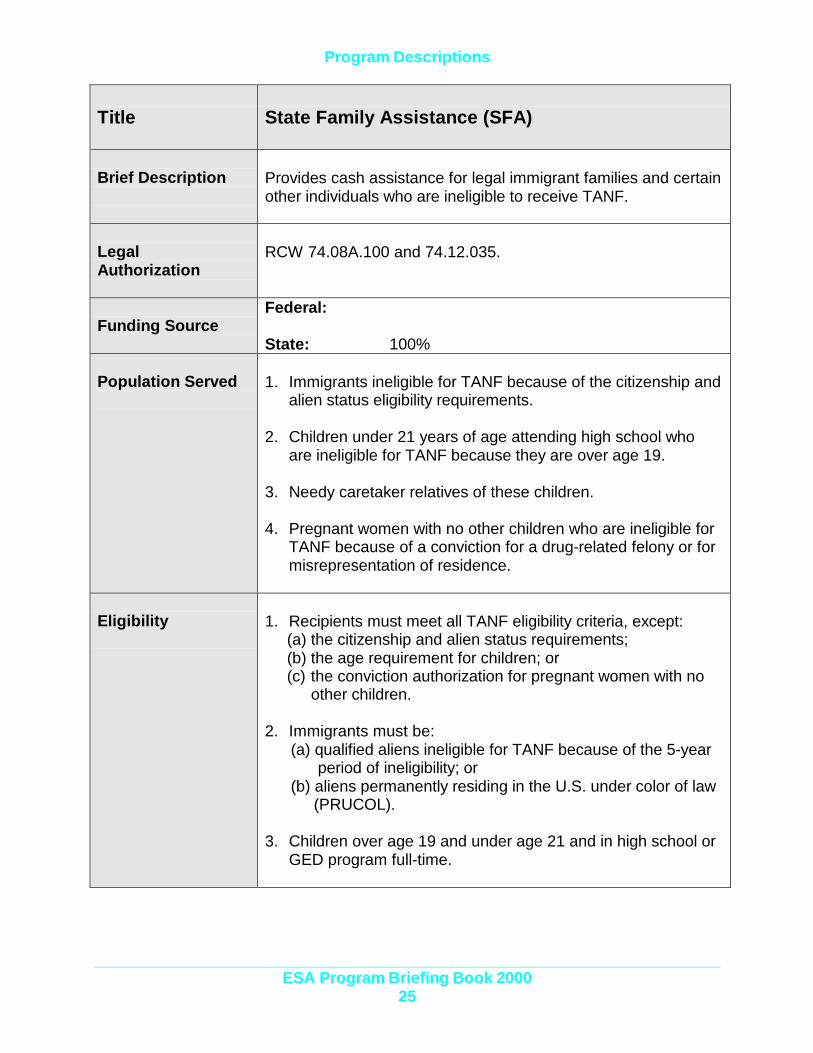
Title State Family Assistance (SFA)
Brief Description Provides cash assistance for legal immigrant families and certainother individuals who are ineligible to receive TANF.
LegalAuthorization
RCW 74.08A.100 and 74.12.035.
Funding SourceFederal:
State: 100%
Population Served 1. Immigrants ineligible for TANF because of the citizenship andalien status eligibility requirements.
2. Children under 21 years of age attending high school whoare ineligible for TANF because they are over age 19.
3. Needy caretaker relatives of these children.
4. Pregnant women with no other children who are ineligible forTANF because of a conviction for a drug-related felony or formisrepresentation of residence.
Eligibility 1. Recipients must meet all TANF eligibility criteria, except:(a) the citizenship and alien status requirements;(b) the age requirement for children; or(c) the conviction authorization for pregnant women with no
other children.
2. Immigrants must be:(a) qualified aliens ineligible for TANF because of the 5-year
period of ineligibility; or(b) aliens permanently residing in the U.S. under color of law
(PRUCOL).
3. Children over age 19 and under age 21 and in high school orGED program full-time.

Program Descriptions
ESA Program Briefing Book 200026
Title State Family Assistance (SFA), Continued
Services 1. Cash assistance in accordance with State PaymentStandards for food, clothing, and shelter. (See Table 32,Part 5, Grant Standards, for sample data.)
2. Medical assistance and WorkFirst services (See self-sufficiency below)
3. Additional Requirements Emergent Need (AREN) paymentsfor special needs, such as rent and utilities if eviction or shut-off notices have been issued.
Linkages 1. Low-income housing2. Food banks3. Children and family services4. Community medical centers5. Charitable organizations

Program Descriptions
ESA Program Briefing Book 200027
Title Supplemental Security Income (SSI) StateSupplemental Payment
Brief Description Provides supplemental cash assistance.
LegalAuthorization
Title XVI of the Social Security Act, 20 CFR 416.2095, and RCW74.04.600 – 74.04.640.
Funding Source 100% state funds for the supplement.
Population Served The combined programs serve three separate populations:1. Aged – persons 65 years of age or older;2. Blind – persons who meet Social Security sight loss criteria;
and3. Disabled – persons who meet Social Security disability
criteria.
Eligibility 1. Social Security Administration (SSA) determines SSIeligibility and administers the program. Washington has alsochosen federal administration of the state supplement.
2. Must meet resource limit of $2,000 for an individual and$3,000 for a couple (not all resources are counted).
Services 1. One–person state supplement is $27.00 (Area I: King,Pierce, Snohomish, Kitsap, and Thurston counties) or $6.55(Area II: all other counties).
2. Couple state supplements are $21 for Area 1 and $0 for AreaII.
3. The state supplement for a SSI beneficiary residing in amedical institution is $11.62.
4. Automatic eligibility for categorically needy medical coverage.
Program Descriptions
ESA Program Briefing Book 200028
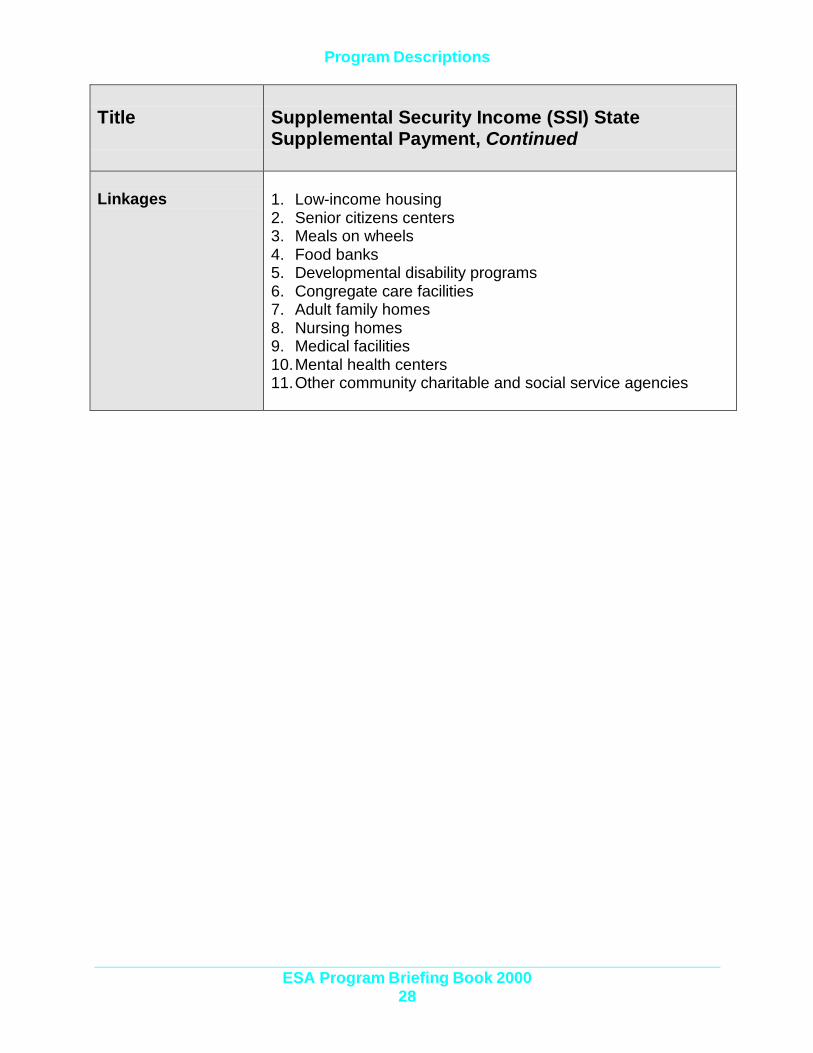
Title Supplemental Security Income (SSI) StateSupplemental Payment, Continued
Linkages 1. Low-income housing2. Senior citizens centers3. Meals on wheels4. Food banks5. Developmental disability programs6. Congregate care facilities7. Adult family homes8. Nursing homes9. Medical facilities10. Mental health centers11. Other community charitable and social service agencies
Program Descriptions
ESA Program Briefing Book 200029
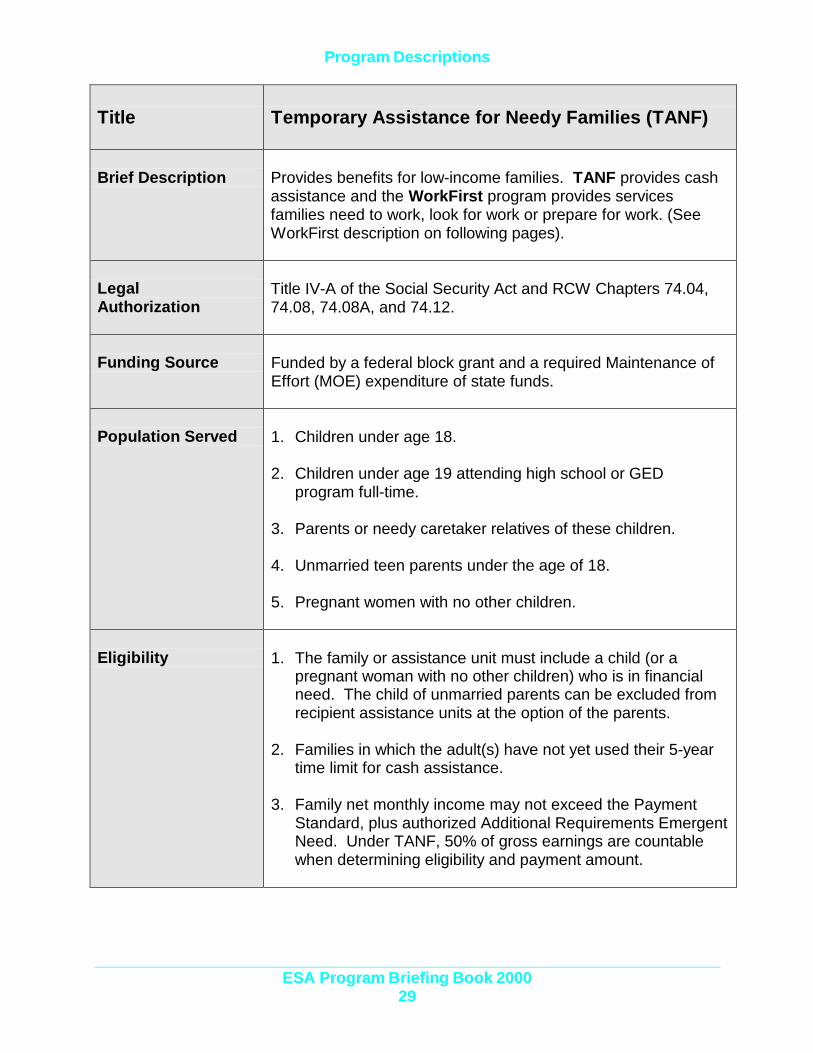
Title Temporary Assistance for Needy Families (TANF)
Brief Description Provides benefits for low-income families. TANF provides cashassistance and the WorkFirst program provides servicesfamilies need to work, look for work or prepare for work. (SeeWorkFirst description on following pages).
LegalAuthorization
Title IV-A of the Social Security Act and RCW Chapters 74.04,74.08, 74.08A, and 74.12.
Funding Source Funded by a federal block grant and a required Maintenance ofEffort (MOE) expenditure of state funds.
Population Served 1. Children under age 18.
2. Children under age 19 attending high school or GEDprogram full-time.
3. Parents or needy caretaker relatives of these children.
4. Unmarried teen parents under the age of 18.
5. Pregnant women with no other children.
Eligibility 1. The family or assistance unit must include a child (or apregnant woman with no other children) who is in financialneed. The child of unmarried parents can be excluded fromrecipient assistance units at the option of the parents.
2. Families in which the adult(s) have not yet used their 5-yeartime limit for cash assistance.
3. Family net monthly income may not exceed the PaymentStandard, plus authorized Additional Requirements EmergentNeed. Under TANF, 50% of gross earnings are countablewhen determining eligibility and payment amount.
Program Descriptions
ESA Program Briefing Book 200030
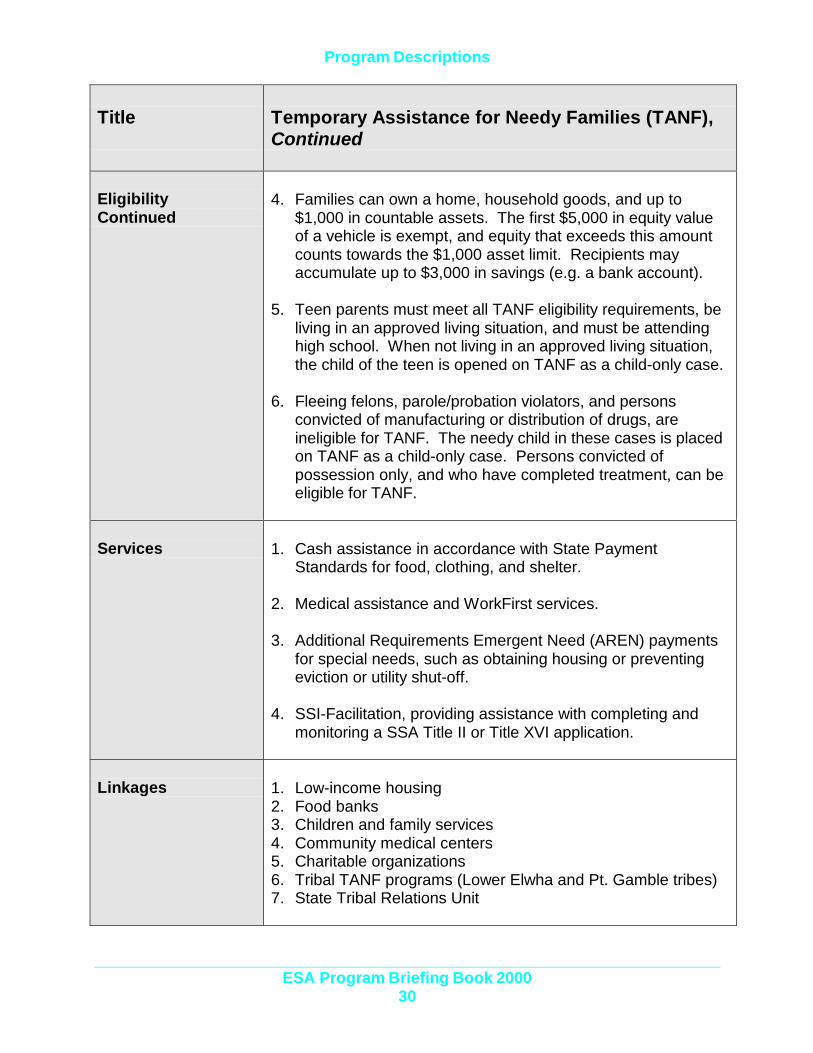
Title Temporary Assistance for Needy Families (TANF),Continued
EligibilityContinued
4. Families can own a home, household goods, and up to$1,000 in countable assets. The first $5,000 in equity valueof a vehicle is exempt, and equity that exceeds this amountcounts towards the $1,000 asset limit. Recipients mayaccumulate up to $3,000 in savings (e.g. a bank account).
5. Teen parents must meet all TANF eligibility requirements, beliving in an approved living situation, and must be attendinghigh school. When not living in an approved living situation,the child of the teen is opened on TANF as a child-only case.
6. Fleeing felons, parole/probation violators, and personsconvicted of manufacturing or distribution of drugs, areineligible for TANF. The needy child in these cases is placedon TANF as a child-only case. Persons convicted ofpossession only, and who have completed treatment, can beeligible for TANF.
Services 1. Cash assistance in accordance with State PaymentStandards for food, clothing, and shelter.
2. Medical assistance and WorkFirst services.
3. Additional Requirements Emergent Need (AREN) paymentsfor special needs, such as obtaining housing or preventingeviction or utility shut-off.
4. SSI-Facilitation, providing assistance with completing andmonitoring a SSA Title II or Title XVI application.
Linkages 1. Low-income housing2. Food banks3. Children and family services4. Community medical centers5. Charitable organizations6. Tribal TANF programs (Lower Elwha and Pt. Gamble tribes)7. State Tribal Relations Unit
Program Descriptions
ESA Program Briefing Book 200031
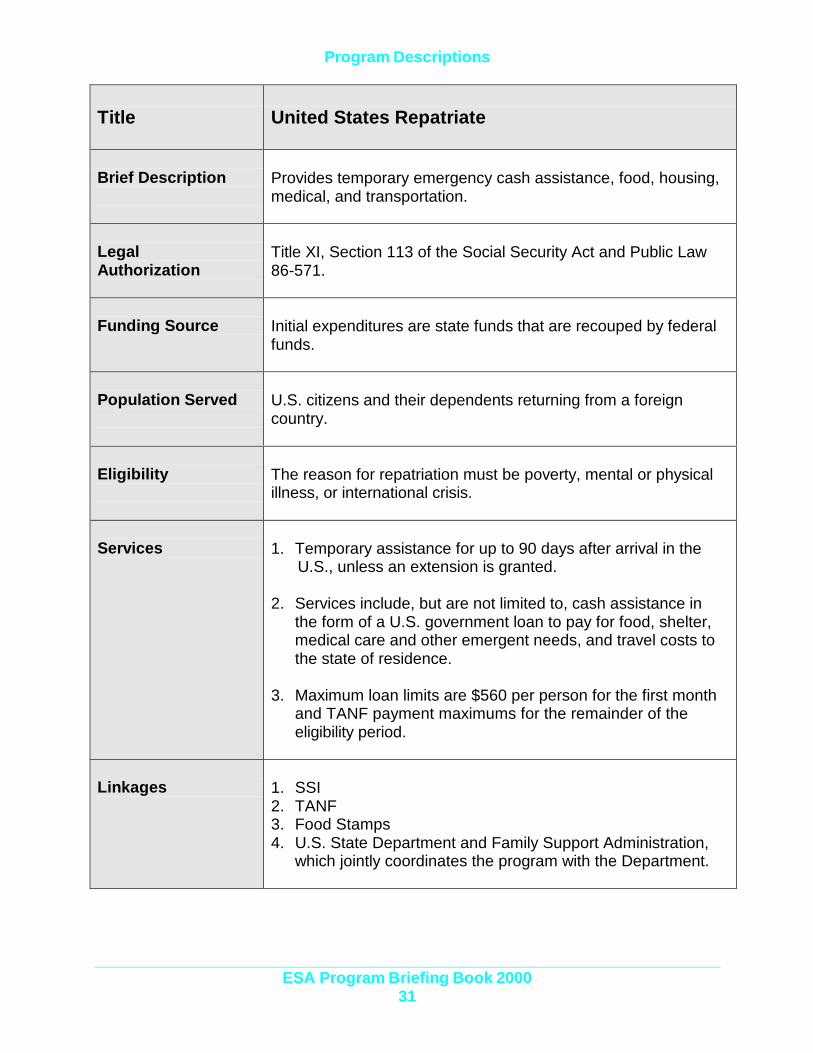
Title United States Repatriate
Brief Description Provides temporary emergency cash assistance, food, housing,medical, and transportation.
LegalAuthorization
Title XI, Section 113 of the Social Security Act and Public Law86-571.
Funding Source Initial expenditures are state funds that are recouped by federalfunds.
Population Served U.S. citizens and their dependents returning from a foreigncountry.
Eligibility The reason for repatriation must be poverty, mental or physicalillness, or international crisis.
Services 1. Temporary assistance for up to 90 days after arrival in the U.S., unless an extension is granted.
2. Services include, but are not limited to, cash assistance inthe form of a U.S. government loan to pay for food, shelter,medical care and other emergent needs, and travel costs tothe state of residence.
3. Maximum loan limits are $560 per person for the first monthand TANF payment maximums for the remainder of theeligibility period.
Linkages 1. SSI2. TANF3. Food Stamps4. U.S. State Department and Family Support Administration,
which jointly coordinates the program with the Department.
Program Descriptions
ESA Program Briefing Book 200032
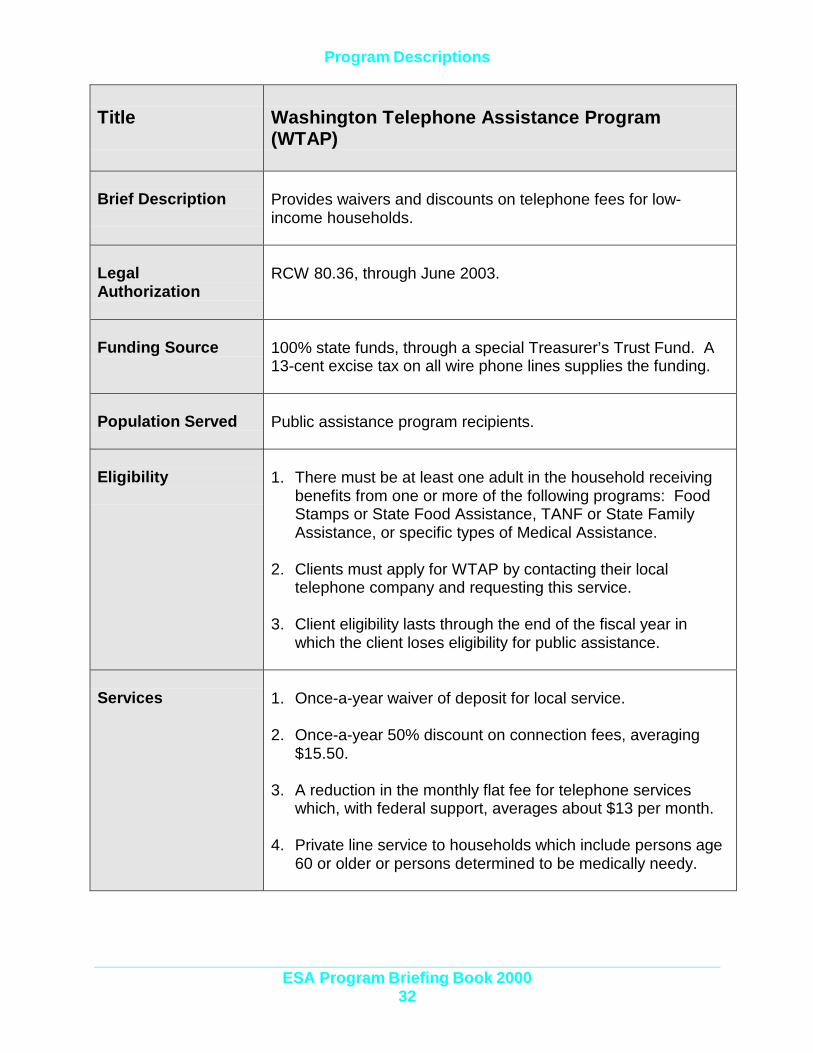
Title Washington Telephone Assistance Program(WTAP)
Brief Description Provides waivers and discounts on telephone fees for low-income households.
LegalAuthorization
RCW 80.36, through June 2003.
Funding Source 100% state funds, through a special Treasurer’s Trust Fund. A13-cent excise tax on all wire phone lines supplies the funding.
Population Served Public assistance program recipients.
Eligibility 1. There must be at least one adult in the household receivingbenefits from one or more of the following programs: FoodStamps or State Food Assistance, TANF or State FamilyAssistance, or specific types of Medical Assistance.
2. Clients must apply for WTAP by contacting their localtelephone company and requesting this service.
3. Client eligibility lasts through the end of the fiscal year inwhich the client loses eligibility for public assistance.
Services 1. Once-a-year waiver of deposit for local service.
2. Once-a-year 50% discount on connection fees, averaging$15.50.
3. A reduction in the monthly flat fee for telephone serviceswhich, with federal support, averages about $13 per month.
4. Private line service to households which include persons age60 or older or persons determined to be medically needy.
Program Descriptions
ESA Program Briefing Book 200033
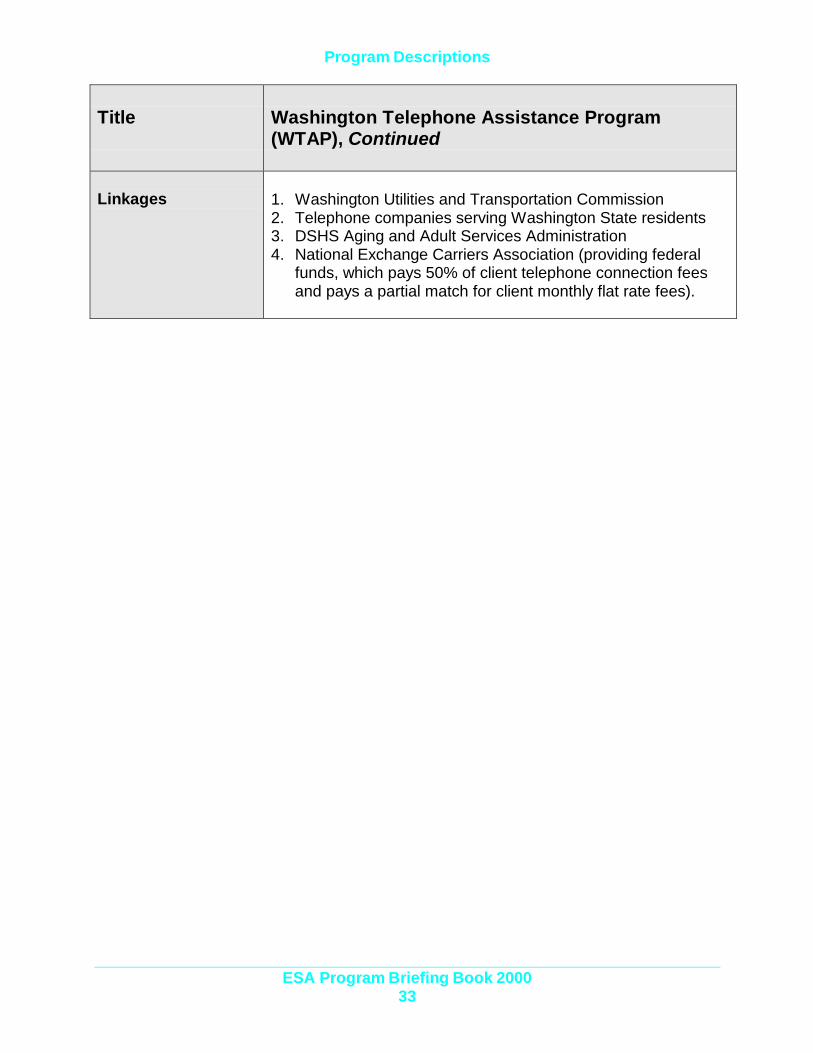
Title Washington Telephone Assistance Program(WTAP), Continued
Linkages 1. Washington Utilities and Transportation Commission2. Telephone companies serving Washington State residents3. DSHS Aging and Adult Services Administration4. National Exchange Carriers Association (providing federal
funds, which pays 50% of client telephone connection feesand pays a partial match for client monthly flat rate fees).

Program Descriptions
ESA Program Briefing Book 200034
Title WorkFirst (WF)
Brief Description Provides support services and activities to TANF clients andlow-income families so they can find jobs, keep jobs, andbecome self-sufficient.
LegalAuthorization
Personal Responsibility and Work Opportunity Reconciliation Actof 1996, Public Law 104-193, and ESHB 3901, the WashingtonTemporary Assistance for Needy Families Act. RCW
Funding Source Funded by a federal block grant and a required Maintenance ofEffort (MOE) expenditure of state funds.
PopulationServed
Low income families with dependent children and pregnantwomen.
Eligibility TANF/SFA recipients, former TANF/SFA recipients, and undersome circumstances, low-income families with incomes at orbelow 175% of the federal poverty level.
Program Descriptions
ESA Program Briefing Book 200035
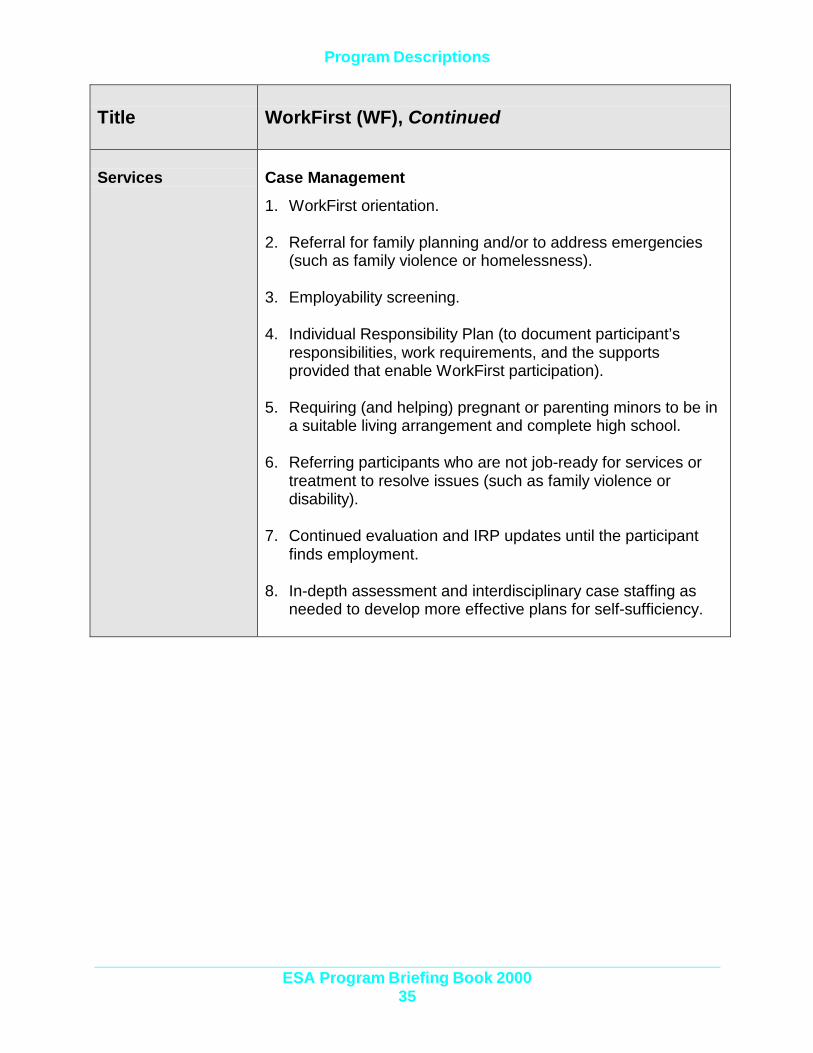
Title WorkFirst (WF), Continued
Services Case Management
1. WorkFirst orientation.
2. Referral for family planning and/or to address emergencies(such as family violence or homelessness).
3. Employability screening.
4. Individual Responsibility Plan (to document participant’sresponsibilities, work requirements, and the supportsprovided that enable WorkFirst participation).
5. Requiring (and helping) pregnant or parenting minors to be ina suitable living arrangement and complete high school.
6. Referring participants who are not job-ready for services ortreatment to resolve issues (such as family violence ordisability).
7. Continued evaluation and IRP updates until the participantfinds employment.
8. In-depth assessment and interdisciplinary case staffing asneeded to develop more effective plans for self-sufficiency.
Program Descriptions
ESA Program Briefing Book 200036
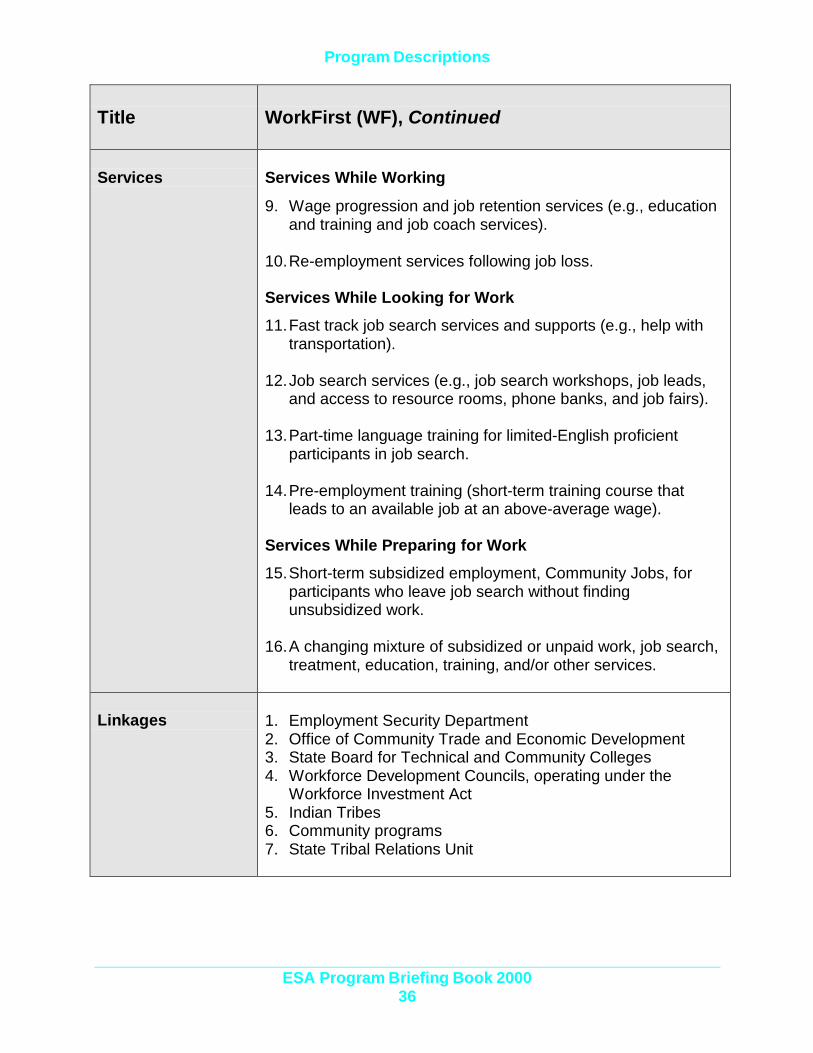
Title WorkFirst (WF), Continued
Services Services While Working
9. Wage progression and job retention services (e.g., educationand training and job coach services).
10. Re-employment services following job loss.
Services While Looking for Work
11. Fast track job search services and supports (e.g., help withtransportation).
12. Job search services (e.g., job search workshops, job leads,and access to resource rooms, phone banks, and job fairs).
13. Part-time language training for limited-English proficientparticipants in job search.
14. Pre-employment training (short-term training course thatleads to an available job at an above-average wage).
Services While Preparing for Work
15. Short-term subsidized employment, Community Jobs, forparticipants who leave job search without findingunsubsidized work.
16. A changing mixture of subsidized or unpaid work, job search,treatment, education, training, and/or other services.
Linkages 1. Employment Security Department2. Office of Community Trade and Economic Development3. State Board for Technical and Community Colleges4. Workforce Development Councils, operating under the
Workforce Investment Act5. Indian Tribes6. Community programs7. State Tribal Relations Unit

Program Descriptions
ESA Program Briefing Book 200037
Title Working Connections Child Care (WCCC)
Brief Description Provides child care subsidies for families, whose incomes are ator below 225% of the federal poverty level, in which adults areworking, looking for work, or enrolled in an approved trainingprogram while working.
LegalAuthorization
Child Care is provided by federal block grants under 45 CFRParts 98 and 99, the Child Care Development Fund (CCDF), andstate monies, RCW 74.13.0903.
Funding Source Funded by federal block grants, a required Maintenance of Effort(MOE) expenditure of state funds, and state matching funds.
Population Served 1. Eligible TANF families who require child care to participate in approved:
(a) WorkFirst activities;(b) Job search;(c) Employment; or(d) Training plans.
2. Non-TANF families who require child care to maintain employment or attend approved training while working.
Eligibility 1. The eligible families’ income must be at or below 225% of theFederal Poverty Level (FPL).
2. Parents pay for a portion of their care, based on a slidingscale.
3. A minimum co-payment is required.
Services Child care payment on behalf of eligible families.
Linkages 1. Head Start and ECEAP2. Child Care Resource and Referral3. Washington Child Care Coordinating Committee4. Office of Child Care Policy

Caseload Comparison
Exhibits Page
1a. Comparison of ESA Programs’ Characteristics- TANF, DCA, Refugee Assistance SFY 2000 .................................... 40
1b. Comparison of ESA Programs’ Characteristics- GA (U+X), Food Assistance, CEAP SFY 2000 ................................ 41
1c. Comparison of ESA Programs’ Characteristics- SSI/SSP, SFY 2000 ............................................................................ 42
2. ESA Programs’ Monthly Average ProgramCaseload Trends SFY 1997 to SFY 2000 ........................................... 43
3. Average Monthly Program Caseload Change Between State Fiscal Years SFY 1997 to SFY 2000.......................... 44
4. Average Monthly Program’s Share of CasesSFY 2000 .............................................................................................. 45
5. Average Monthly Program’s Share of PersonsSFY 2000 .............................................................................................. 45
6a. Average Monthly Assistance Program Casesby County SFY 2000 ............................................................................ 46
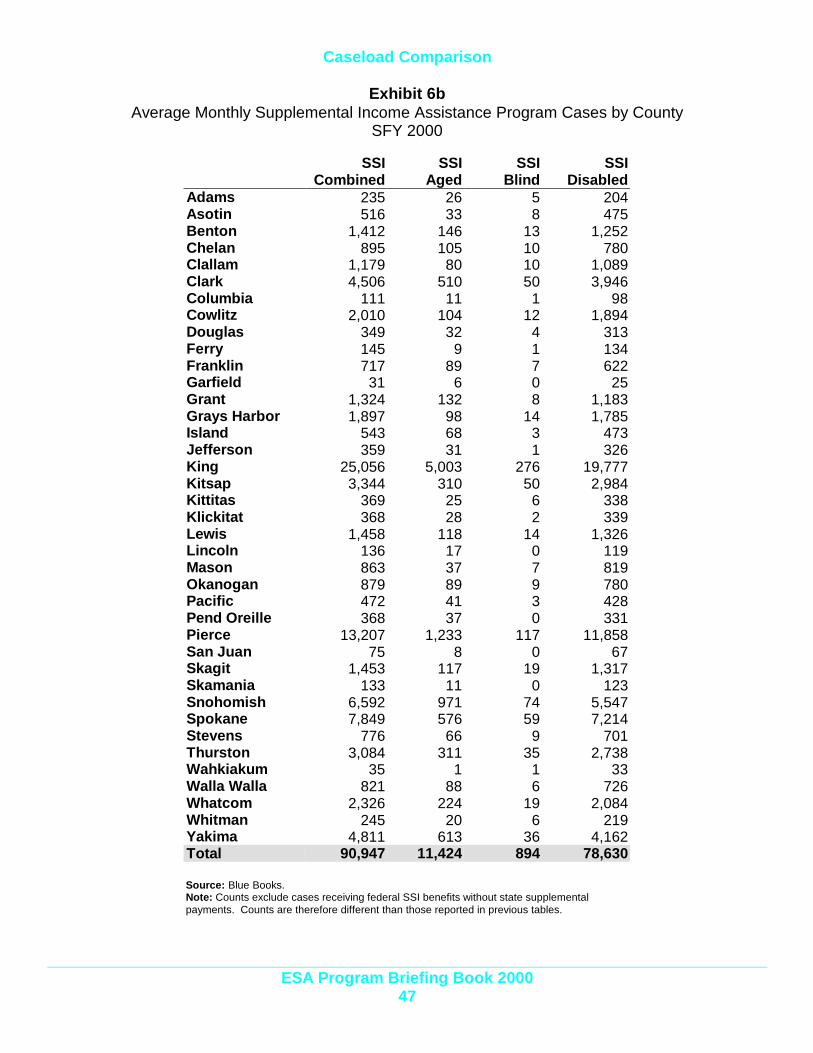
6b. Average Monthly Supplemental Income Assistance Program Cases by County SFY 2000................................................. 47
7a. Average Monthly Program Cases by Regionand CSO SFY 2000 .............................................................................. 48
7b. Average Monthly Program Cases by Regionand CSO SFY 2000 .............................................................................. 49
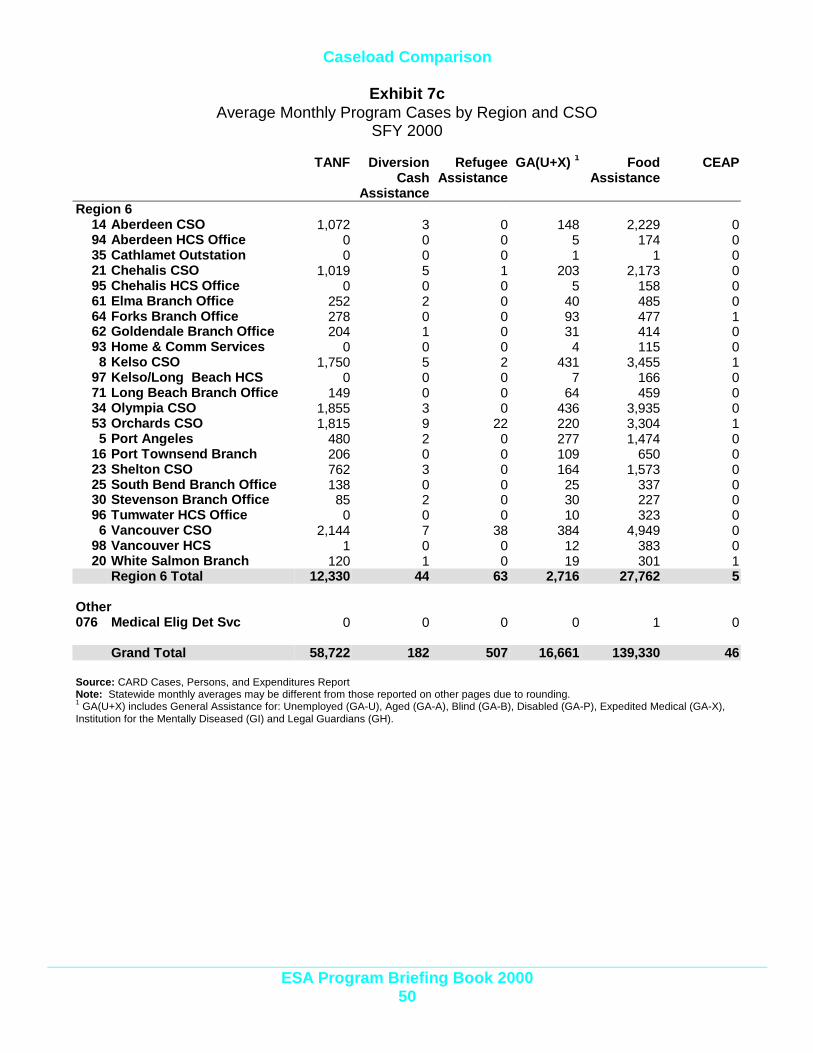
7c. Average Monthly Program Cases by Regionand CSO SFY 2000 .............................................................................. 50

Caseload Comparison
ESA Program Briefing Book 200039
CaseloadComparison
This section provides a general overview of caseload trends forESA programs. You will find a side-by-side comparison of sevenmajor programs:
? TANF? DCA? Refugee Assistance? GA-U and GA-X? Food Assistance? CEAP? SSI/SSP Combined, Aged, Blind, Disabled
Exhibit 1 compares the programs by several measures, includingaverage number of cases per month and average monthly paymentper case.
Exhibit 2 compares monthly average caseload trends for eachprogram from SFY 1997 through SFY 2000.
Exhibit 3 compares the average monthly caseload reductions ofprograms from SFY 1997 to SFY 2000.
Exhibits 4 and 5 compare the average monthly share of cases andpersons by program in SFY 2000.
Exhibits 6 and 7 compare the average monthly caseload ofprograms by county and by DSHS region.
Caseload Comparison
ESA Program Briefing Book 200040
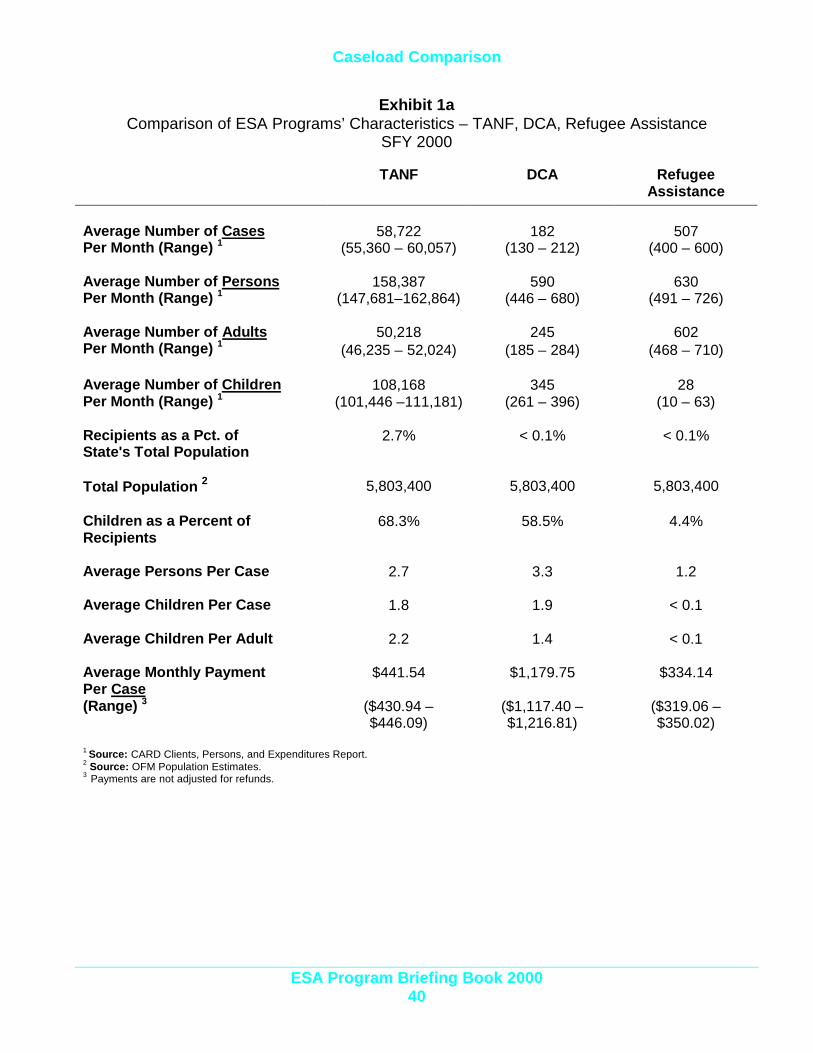
Exhibit 1aComparison of ESA Programs’ Characteristics – TANF, DCA, Refugee Assistance
SFY 2000
TANF DCA RefugeeAssistance
58,722 182 507Average Number of CasesPer Month (Range) 1 (55,360 – 60,057) (130 – 212) (400 – 600)
158,387 590 630Average Number of PersonsPer Month (Range) 1 (147,681–162,864) (446 – 680) (491 – 726)
50,218 245 602Average Number of AdultsPer Month (Range) 1 (46,235 – 52,024) (185 – 284) (468 – 710)
108,168 345 28Average Number of ChildrenPer Month (Range) 1 (101,446 –111,181) (261 – 396) (10 – 63)
Recipients as a Pct. ofState's Total Population
2.7% < 0.1% < 0.1%
Total Population 2 5,803,400 5,803,400 5,803,400
Children as a Percent ofRecipients
68.3% 58.5% 4.4%
Average Persons Per Case 2.7 3.3 1.2
Average Children Per Case 1.8 1.9 < 0.1
Average Children Per Adult 2.2 1.4 < 0.1
Average Monthly PaymentPer Case
$441.54 $1,179.75 $334.14
(Range) 3 ($430.94 –$446.09)
($1,117.40 –$1,216.81)
($319.06 –$350.02)
1 Source: CARD Clients, Persons, and Expenditures Report.2 Source: OFM Population Estimates.3 Payments are not adjusted for refunds.

Caseload Comparison
ESA Program Briefing Book 200041
Exhibit 1bComparison of ESA Programs’ Characteristics – GA(U+X), Food Assistance, CEAP
SFY 2000
General Assistance(U + X) 2
Food Assistance CEAP
16,661 139,324 46Average Number of CasesPer Month (Range) 1 (16,234 – 17,234) (136,402 – 319,987) (19 – 91)
16,843 311,259 155Average Number of PersonsPer Month (Range) 1 (16,423 – 17,409) (305,517 – 319,987) (54 – 301)
16,531 163,086 63Average Number of AdultsPer Month (Range) 1 (16,122 – 17,098) (159,460 – 168,264) (24 – 122)
N/A 148,173 92Average Number of ChildrenPer Month (Range) 1 (145,683 – 151,916) (30 – 182)
Recipients as a Pct. ofState's Total Population
0.3% 5.4% < 0.1%
Total Population 3 5,803,400 5,803,400 5,803,400
Children as a Percent ofRecipients
N/A 47.6% 59.4%
Average Persons Per Case 1.0 2.2 3.5
Average Children Per Case N/A 1.1 2.0
Average Children Per Adult N/A 0.9 1.5
Average Monthly PaymentPer Case
$305.13 $149.10 $482.49
(Range) 4 ($303.29 –$306.37)
($144.81 –$151.70)
($431.30 – $634.11)
1Source: CARD Clients, Persons, and Expenditures Report.2 GA (U+X) includes General Assistance for: Unemployed (GA-U), Aged (GA-A), Blind (GA-B), Disabled (GA-P), Expedited Medical (GA-X),Institution for the Mentally Diseased (GI) and Legal Guardians (GH).3 Source: OFM Population Estimates.4 Payments are not adjusted for refunds.

Caseload Comparison
ESA Program Briefing Book 200042
Exhibit 1cComparison of ESA Programs’ Characteristics – SSI/SSP
SFY 2000
SSI/SSPCombined
SSI/SSPAged
SSI/SSPBlind
SSI/SSPDisabled
93,684 12,037 922 80,726Average Number of CasesPer Month (Range) 1 (92,317 –
94,795)(11,873 –12,149)
(904 –938)
(79,540 –81,717)
98,766 13,906 952 83,908Average Number of PersonsPer Month (Range) 1 (97,335 –
100,018)(13,686 –14,070)
(933 –970)
(82,644 –84,989)
N/A N/A N/A N/AAverage Number of AdultsPer Month (Range) 1
N/A N/A N/A N/AAverage Number of ChildrenPer Month (Range) 1
Recipients as a Pct. ofState's Total Population
1.6% 0.2% < 0.1% 1.5%
Total Population 2 5,803,400 5,803,400 5,803,400 5,803,400
Children as a Percent ofRecipients
N/A N/A N/A N/A
Average Persons Per Case
Average Children Per Case N/A N/A N/A N/A
Average Children Per Adult N/A N/A N/A N/A
Average Monthly PaymentPer Case
$414.58 $382.49 $400.34 $419.52
(Range) 3 N/A ($370.74 -$395.65)
($387.00 -$416.66)
($404.81 -$431.01)
Note: Includes cases that received SSI benefits from either state or federal funding streams.1 Source: Blue Books.2 Source: OFM Population Estimates3 Payments are not adjusted for refunds. SSI Combined cases are the weighted average of aged, blind and disabled.
Caseload Comparison
ESA Program Briefing Book 200043
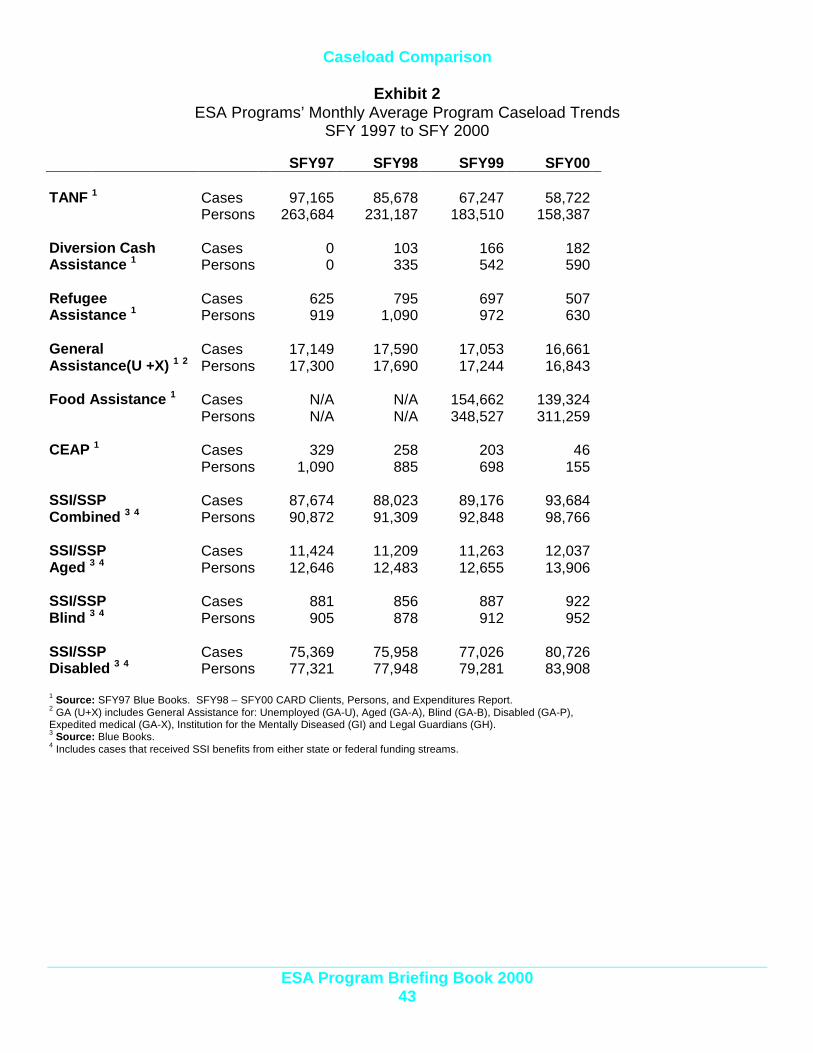
Exhibit 2ESA Programs’ Monthly Average Program Caseload Trends
SFY 1997 to SFY 2000
SFY97 SFY98 SFY99 SFY00
Cases 97,165 85,678 67,247 58,722TANF 1
Persons 263,684 231,187 183,510 158,387
Cases 0 103 166 182Diversion CashAssistance 1 Persons 0 335 542 590
Cases 625 795 697 507RefugeeAssistance 1 Persons 919 1,090 972 630
Cases 17,149 17,590 17,053 16,661GeneralAssistance(U +X) 1 2 Persons 17,300 17,690 17,244 16,843
Cases N/A N/A 154,662 139,324Food Assistance 1
Persons N/A N/A 348,527 311,259
Cases 329 258 203 46CEAP 1
Persons 1,090 885 698 155
Cases 87,674 88,023 89,176 93,684SSI/SSPCombined 3 4 Persons 90,872 91,309 92,848 98,766
Cases 11,424 11,209 11,263 12,037SSI/SSPAged 3 4 Persons 12,646 12,483 12,655 13,906
Cases 881 856 887 922SSI/SSPBlind 3 4 Persons 905 878 912 952
Cases 75,369 75,958 77,026 80,726SSI/SSPDisabled 3 4 Persons 77,321 77,948 79,281 83,908
1 Source: SFY97 Blue Books. SFY98 – SFY00 CARD Clients, Persons, and Expenditures Report.2 GA (U+X) includes General Assistance for: Unemployed (GA-U), Aged (GA-A), Blind (GA-B), Disabled (GA-P),Expedited medical (GA-X), Institution for the Mentally Diseased (GI) and Legal Guardians (GH).3 Source: Blue Books.4 Includes cases that received SSI benefits from either state or federal funding streams.

Caseload Comparison
ESA Program Briefing Book 200044
Exhibit 3Average Monthly Program Caseload Change between State Fiscal Years
SFY 1997 to SFY 2000
SFY97 toSFY98
SFY98 toSFY99
SFY99 toSFY00
Num. Change (11,487) (18,431) (8,525)TANF1
Pct. Change (11.8%) (21.5%) (12.7%)
Num. Change 103 63 16Diversion CashAssistance1 Pct. Change 0.0% 61.2% 9.6%
Num. Change 170 (98) (190)RefugeeAssistance1 Pct. Change 27.2% (12.3%) (27.3%)
Num. Change 441 (537) (392)GA-U + GA-X1 2
Pct. Change 2.6% (3.1%) (2.3%)
Num. Change N/A N/A (15,338)Food Assistance1
Pct. Change N/A N/A (9.9%)
Num. Change (71) (55) (157)CEAP1
Pct. Change (21.6%) (21.3%) (77.3%)
Num. Change 349 1,153 4,508SSI/SSPCombined 3 4 Pct. Change 0.4% 1.3% 5.1%
Num. Change (215) 54 774SSI/SSPAged 3 4 Pct. Change (1.9%) 0.5% 6.9%
Num. Change (25) 31 35SSI/SSPBlind 3 4 Pct. Change (2.8%) 3.6% 3.9%
Num. Change 589 1,068 3,700SSI/SSPDisabled 3 4 Pct. Change 0.8% 1.4% 4.8%
Note: Number in parentheses indicates a caseload reduction.1 Source: SFY1997 Blue Books. SFY1998 – SFY2000 CARD Clients, Persons, and Expenditures Report unlessotherwise noted.2 GA(U+X) includes General Assistance for: Unemployed (GA-U), Aged (GA-A), Blind (GA-B), Disabled (GA-P),Expedited Medical (GA-X), Institution for the Mentally Diseased (GI) and Legal Guardians (GH).3 Source: Blue Books.4 Includes cases that received SSI benefits from either state or federal funding streams.

Caseload Comparison
ESA Program Briefing Book 200045
Exhibit 4Average Monthly Program’s Share of Cases
SFY 2000
Exhibit 5Average Monthly Program’s Share of Persons
SFY 2000
Source: SSI/SSP counts are from the Blue Books. All other programs are from CARD Cases, Persons, and Expenditures Report.Note: Programs showing 0% share really have less or equal to 0.1% of the total share of cases.1 Includes cases and persons that received SSI benefits from either state or federal funding streams.2 GA(U+X) includes Unemployable (GA-U), Aged(GA-A), Blind (GA-B), Disabled (GA-P), Expedited Medical (GA-X), Mentally Diseased (GI), and LegalGuardians (GH).
CEAP0%DCA
0%
Refugee Assistance
0%TANF19%SSI/SSP1
30%
GA(U+X)2
5%
Food Assistance
46%
DCA0%
CEAP0% Refugee
Assistance0%SSI/SSP1
17%
GA(U+X)2
3%
TANF27%
Food Assistance
53%
Caseload Comparison
ESA Program Briefing Book 200046
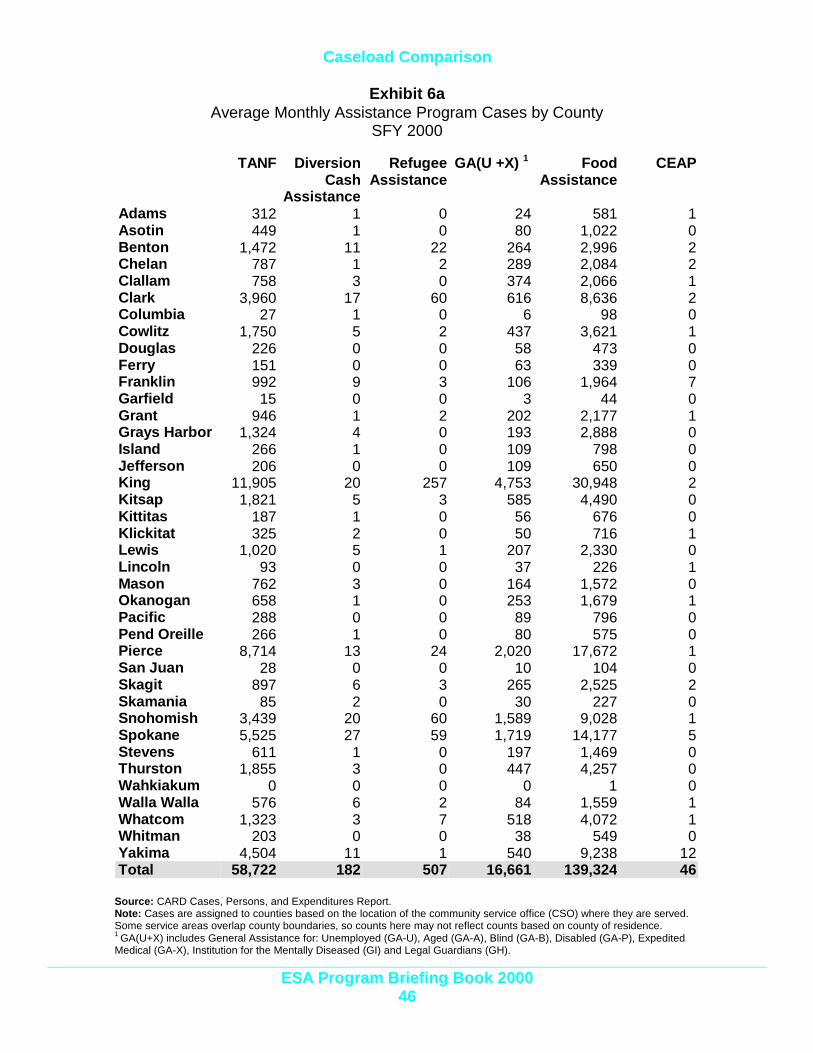
Exhibit 6aAverage Monthly Assistance Program Cases by County
SFY 2000
TANF DiversionCash
Assistance
RefugeeAssistance
GA(U +X) 1 FoodAssistance
CEAP
Adams 312 1 0 24 581 1Asotin 449 1 0 80 1,022 0Benton 1,472 11 22 264 2,996 2Chelan 787 1 2 289 2,084 2Clallam 758 3 0 374 2,066 1Clark 3,960 17 60 616 8,636 2Columbia 27 1 0 6 98 0Cowlitz 1,750 5 2 437 3,621 1Douglas 226 0 0 58 473 0Ferry 151 0 0 63 339 0Franklin 992 9 3 106 1,964 7Garfield 15 0 0 3 44 0Grant 946 1 2 202 2,177 1Grays Harbor 1,324 4 0 193 2,888 0Island 266 1 0 109 798 0Jefferson 206 0 0 109 650 0King 11,905 20 257 4,753 30,948 2Kitsap 1,821 5 3 585 4,490 0Kittitas 187 1 0 56 676 0Klickitat 325 2 0 50 716 1Lewis 1,020 5 1 207 2,330 0Lincoln 93 0 0 37 226 1Mason 762 3 0 164 1,572 0Okanogan 658 1 0 253 1,679 1Pacific 288 0 0 89 796 0Pend Oreille 266 1 0 80 575 0Pierce 8,714 13 24 2,020 17,672 1San Juan 28 0 0 10 104 0Skagit 897 6 3 265 2,525 2Skamania 85 2 0 30 227 0Snohomish 3,439 20 60 1,589 9,028 1Spokane 5,525 27 59 1,719 14,177 5Stevens 611 1 0 197 1,469 0Thurston 1,855 3 0 447 4,257 0Wahkiakum 0 0 0 0 1 0Walla Walla 576 6 2 84 1,559 1Whatcom 1,323 3 7 518 4,072 1Whitman 203 0 0 38 549 0Yakima 4,504 11 1 540 9,238 12Total 58,722 182 507 16,661 139,324 46
Source: CARD Cases, Persons, and Expenditures Report.Note: Cases are assigned to counties based on the location of the community service office (CSO) where they are served.Some service areas overlap county boundaries, so counts here may not reflect counts based on county of residence.1 GA(U+X) includes General Assistance for: Unemployed (GA-U), Aged (GA-A), Blind (GA-B), Disabled (GA-P), ExpeditedMedical (GA-X), Institution for the Mentally Diseased (GI) and Legal Guardians (GH).
Caseload Comparison
ESA Program Briefing Book 200047
Exhibit 6bAverage Monthly Supplemental Income Assistance Program Cases by County
SFY 2000
SSICombined
SSIAged
SSIBlind
SSIDisabled
Adams 235 26 5 204Asotin 516 33 8 475Benton 1,412 146 13 1,252Chelan 895 105 10 780Clallam 1,179 80 10 1,089Clark 4,506 510 50 3,946Columbia 111 11 1 98Cowlitz 2,010 104 12 1,894Douglas 349 32 4 313Ferry 145 9 1 134Franklin 717 89 7 622Garfield 31 6 0 25Grant 1,324 132 8 1,183Grays Harbor 1,897 98 14 1,785Island 543 68 3 473Jefferson 359 31 1 326King 25,056 5,003 276 19,777Kitsap 3,344 310 50 2,984Kittitas 369 25 6 338Klickitat 368 28 2 339Lewis 1,458 118 14 1,326Lincoln 136 17 0 119Mason 863 37 7 819Okanogan 879 89 9 780Pacific 472 41 3 428Pend Oreille 368 37 0 331Pierce 13,207 1,233 117 11,858San Juan 75 8 0 67Skagit 1,453 117 19 1,317Skamania 133 11 0 123Snohomish 6,592 971 74 5,547Spokane 7,849 576 59 7,214Stevens 776 66 9 701Thurston 3,084 311 35 2,738Wahkiakum 35 1 1 33Walla Walla 821 88 6 726Whatcom 2,326 224 19 2,084Whitman 245 20 6 219Yakima 4,811 613 36 4,162Total 90,947 11,424 894 78,630
Source: Blue Books.Note: Counts exclude cases receiving federal SSI benefits without state supplementalpayments. Counts are therefore different than those reported in previous tables.

Caseload Comparison
ESA Program Briefing Book 200048
Exhibit 7aAverage Monthly Program Cases by Region and CSO
SFY 2000
TANF DiversionCash
Assistance
RefugeeAssistance
GA(U+X) 1 FoodAssistance
CEAP
Region 12 Clarkston 449 1 0 79 980 0
38 Colfax Branch Office 203 0 0 38 549 078 Colville HCS Office 0 0 0 8 164 022 Davenport Branch Office 93 0 0 37 226 113 Moses Lake 946 1 2 194 2,038 181 Moses Lake HCS Office 0 0 0 8 140 026 Newport Branch Office 266 1 0 80 575 024 Okanogan County 658 1 0 250 1,612 177 Okanogan HCS Office 0 0 0 4 66 01 Othello 312 1 0 24 581 1
12 Pomeroy Outstation 15 0 0 3 44 010 Republic 151 0 0 63 339 032 Spokane Central Supply 1 0 0 175 367 058 Spokane East 1,932 10 23 480 4,277 357 Spokane HCS Office 0 0 0 24 952 059 Spokane North 2,494 9 24 465 5,070 160 Spokane Southwest 1,097 8 13 575 3,512 133 Tri County-Colville 611 1 0 189 1,305 04 Wenatchee – Chelan 787 1 2 284 1,983 29 Wenatchee – Douglas 226 0 0 58 473 0
79 Wenatchee HCS Office 0 0 0 5 101 0Region 1 Total 10,242 35 63 3,042 25,354 12
Region 286 Clarkston HCS 0 0 0 1 43 019 Ellensburg Branch Office 187 1 0 56 676 070 Grandview 330 1 0 21 710 13 Kennewick 1,472 11 22 264 2,996 2
11 Pasco 991 9 3 102 1,811 784 Pasco HCS 0 0 0 4 153 054 Sunnyside 703 0 0 36 1,214 383 Sunnyside HCS 0 0 0 3 96 050 Toppenish 737 3 0 59 1,304 436 Walla Walla 576 6 2 79 1,463 185 Walla Walla HCS 0 0 0 5 97 07 Walla Walla-Columbia 27 1 0 6 98 0
75 Wapato 451 0 0 55 787 239 Yakima 1,301 4 0 205 2,830 182 Yakima/Ellensburg HCS 0 0 0 10 193 069 Yakima-Kittitas 981 3 0 150 2,105 2
Region 2 Total 7,757 37 27 1,056 16,575 22
Source: CARD Cases, Persons, and Expenditures Report1 GA(U+X) includes General Assistance for: Unemployed (GA-U), Aged (GA-A), Blind (GA-B), Disabled (GA-P), Expedited Medical (GA-X),Institution for the Mentally Diseased (GI) and Legal Guardians (GH).

Caseload Comparison
ESA Program Briefing Book 200049
Exhibit 7bAverage Monthly Program Cases by Region and CSO
SFY 2000
TANF DiversionCash
Assistance
RefugeeAssistance
GA(U+X) 1 FoodAssistance
CEAP
Region 352 Alderwood CSO 680 1 25 406 1,973 089 Alderwood HCS Office 0 0 0 9 121 037 Bellingham CSO 1,323 3 7 506 3,909 187 Bellingham HCS Office 0 0 0 12 163 031 Everett 1,701 13 32 678 4,206 192 Everett HCS Office 0 0 0 13 219 028 Friday Harbor Outstation 28 0 0 10 104 029 Mt Vernon 897 6 3 260 2,375 263 Mt Vernon HCS Office 0 0 0 5 151 015 Oak Harbor CSO 266 1 0 109 798 090 Skykomish HCS Office 0 0 0 2 49 068 Skykomish Valley CSO 298 2 2 175 817 065 Smokey Point CSO 761 4 0 302 1,566 091 Smokey Point HCS 0 0 0 6 78 0
Region 3 Total 5,954 29 70 2,491 16,528 4
Region 447 Belltown 256 0 3 801 3,243 044 Burien 1,870 4 52 381 2,960 046 Capitol Hill 573 0 5 498 2,508 045 Federal Way CSO 909 3 31 196 1,712 056 Holgate HCS Office 0 0 0 190 1,791 040 King Eastside CSO 808 3 16 353 2,022 042 King North/Ballard 609 2 8 489 2,600 043 King South CSO 2,529 1 63 536 4,566 074 Lake City CSO 450 0 9 281 1,604 041 Rainier 1,883 1 51 519 3,852 080 Renton CSO 1,012 1 13 284 1,957 055 West Seattle CSO 1,006 5 7 226 2,134 1
Region 4 Total 11,905 20 257 4,753 30,949 2
Region 518 Bremerton CSO 1,821 5 3 573 4,251 088 Bremerton HCS Office 0 0 0 12 239 049 Pierce North CSO 1,895 4 10 548 4,126 148 Pierce South CSO 2,651 3 5 430 4,777 067 Pierce West CSO 2,611 4 9 628 5,178 017 Puyallup HCS Office 0 0 0 17 203 051 Puyallup Valley CSO 1,558 3 1 356 2,738 166 Tacoma HCS Office 0 0 0 41 652 0
Region 5 Total 10,535 18 27 2,605 22,162 2
Source: CARD Cases, Persons, and Expenditures Report1 GA(U+X) includes General Assistance for: Unemployed (GA-U), Aged (GA-A), Blind (GA-B), Disabled (GA-P), Expedited Medical (GA-X),Institution for the Mentally Diseased (GI) and Legal Guardians (GH).
Caseload Comparison
ESA Program Briefing Book 200050
Exhibit 7cAverage Monthly Program Cases by Region and CSO
SFY 2000
TANF DiversionCash
Assistance
RefugeeAssistance
GA(U+X) 1 FoodAssistance
CEAP
Region 614 Aberdeen CSO 1,072 3 0 148 2,229 094 Aberdeen HCS Office 0 0 0 5 174 035 Cathlamet Outstation 0 0 0 1 1 021 Chehalis CSO 1,019 5 1 203 2,173 095 Chehalis HCS Office 0 0 0 5 158 061 Elma Branch Office 252 2 0 40 485 064 Forks Branch Office 278 0 0 93 477 162 Goldendale Branch Office 204 1 0 31 414 093 Home & Comm Services 0 0 0 4 115 08 Kelso CSO 1,750 5 2 431 3,455 1
97 Kelso/Long Beach HCS 0 0 0 7 166 071 Long Beach Branch Office 149 0 0 64 459 034 Olympia CSO 1,855 3 0 436 3,935 053 Orchards CSO 1,815 9 22 220 3,304 15 Port Angeles 480 2 0 277 1,474 0
16 Port Townsend Branch 206 0 0 109 650 023 Shelton CSO 762 3 0 164 1,573 025 South Bend Branch Office 138 0 0 25 337 030 Stevenson Branch Office 85 2 0 30 227 096 Tumwater HCS Office 0 0 0 10 323 06 Vancouver CSO 2,144 7 38 384 4,949 0
98 Vancouver HCS 1 0 0 12 383 020 White Salmon Branch 120 1 0 19 301 1
Region 6 Total 12,330 44 63 2,716 27,762 5
Other076 Medical Elig Det Svc 0 0 0 0 1 0
Grand Total 58,722 182 507 16,661 139,330 46
Source: CARD Cases, Persons, and Expenditures ReportNote: Statewide monthly averages may be different from those reported on other pages due to rounding.1 GA(U+X) includes General Assistance for: Unemployed (GA-U), Aged (GA-A), Blind (GA-B), Disabled (GA-P), Expedited Medical (GA-X),Institution for the Mentally Diseased (GI) and Legal Guardians (GH).
TANF/WorkFirst Program
Exhibits Page
1. Selected TANF Program CharacteristicsSFY 1999 and SFY 2000 ...................................................................... 52
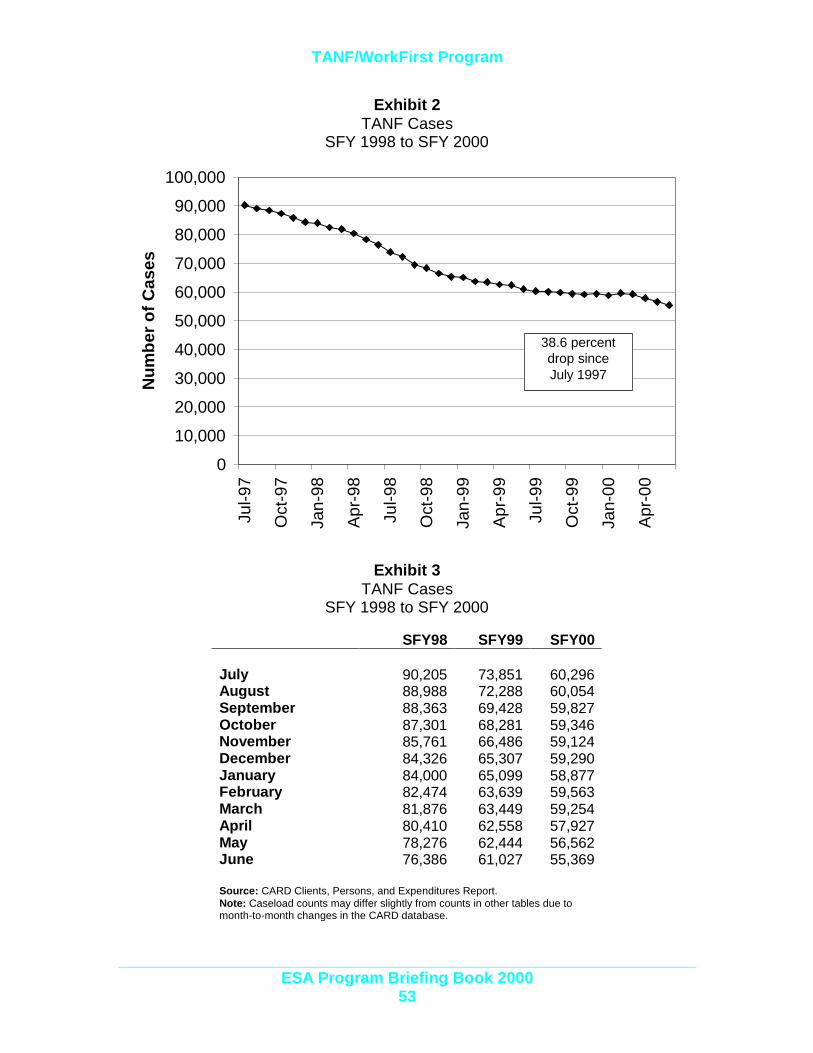
2. TANF Cases (Chart)SFY 1998 to SFY 2000 ......................................................................... 53
3. TANF Cases (Table)SFY 1998 to SFY 2000 ......................................................................... 53
4. TANF Applications (Chart)SFY 1999 to SFY 2000 ......................................................................... 54
5. TANF Applications (Table)SFY 1999 to SFY 2000 ......................................................................... 54
6. Cases Entering, Exiting, and Re-Entering TANFAs a Percent of the Total Caseload (Chart)SFY 1999 to SFY 2000 ......................................................................... 55
7. Cases Entering, Exiting, and Re-Entering TANFAs a Percent of the Total Caseload (Table)SFY 1999 to SFY 2000 ......................................................................... 55
8. Adults Returning to TANF Six Months After Exit (Chart)SFY 1999 to SFY 2000 ......................................................................... 56
9. Adults Returning to TANF Six Months After Exit (Table)SFY 1999 to SFY 2000 ......................................................................... 56
10. Clients Receiving the Early Exit BonusApril 2000 through September 2000 (Chart)...................................... 57
11. Clients Receiving the Early Exit BonusApril 2000 through September 2000 (Table)...................................... 57
12. Clients Receiving the Early Exit Bonus by Case TypeApril 2000 Through September 2000 (Chart)..................................... 58
13. Clients Receiving the Early Exit Bonus by Case TypeApril 2000 Through September 2000 (Table)..................................... 58
14. Percent of TANF Cases by Number of Adults (Chart)SFY 1999 to SFY 2000 ......................................................................... 59

TANF/WorkFirst Program
15. TANF Cases by Number of Adults SFY 2000 .................................... 59
16. Percent of TANF Cases by Number of ChildrenSFY 1999 to SFY 2000 ......................................................................... 60
17. TANF Cases by Number of Children SFY 2000................................. 60
18. Percent of TANF Cases with Teen Heads of HouseholdSFY 1998 to SFY 2000 ......................................................................... 61
19. TANF Cases with Teen Heads of Household SFY 2000 ................... 61
20. Percent of TANF Cases with Pregnant Womenand Children 12 Months or YoungerSFY 1999 to SFY 2000 ......................................................................... 62
21. TANF Cases with Pregnant Women andChildren 12 Months or Younger SFY 2000 ........................................ 62
22. Percent of TANF Adults SFY 1999 to SFY 2000 ................................ 63
23. Employed TANF Adults SFY 1999 to SFY 2000................................. 63
24. Percent of TANF Cases with Adults in WorkFirst SanctionSFY 1999 to SFY 2000 ......................................................................... 64
25. TANF Cases with Adults in WorkFirst SanctionBy Consecutive Months in Sanction Status SFY 2000..................... 64
26. Average Monthly WorkFirst Adultsand Their Participation Status SFY 2000........................................... 65
27. Average Monthly WorkFirst Adultsand Their Participation Status SFY 2000........................................... 65
28. Average Monthly WorkFirst Adults Not ReadyTo Participate in WorkFirst Activities SFY 2000 ............................... 66
29. Average Monthly WorkFirst AdultsNot Ready to Participate SFY 2000 .................................................... 66
30. WorkFirst Participation Rates and TargetsOf Those Adults Ready to Participate SFY 2000............................... 67
TANF/WorkFirst Program
31. WorkFirst Participation Rates and TargetsOf Those Adults Ready to Participate SFY 2000............................... 67
32. TANF Employment Entries (Chart)SFY 1999 to SFY 2000 ......................................................................... 68
33. TANF Employment Entries (Table)SFY 1999 to SFY 2000 ......................................................................... 68
34a. TANF Client (Adults and Children) DemographicsJuly 2000 .............................................................................................. 69
34b. TANF Client (Adults and Children) DemographicsJuly 2000 .............................................................................................. 70
35. Estimates of TANF Families Reaching 60 MonthsOn Assistance in August 2002 and August 20003............................ 71
36. Families With Long Term TANF ClientsServed by Other DSHS Divisions During SFY 1999.......................... 72
37. Percent of Adults on TANFBy Months on Assistance, as of July 2000 ....................................... 73
38. Number of Months Adults Have Been ContinuouslyOn TANF Since July 1997 as of July 2000......................................... 73
39. Percent of Exemptions for Adults Who Have BeenContinuously on TANF for 36 Months as of July 2000..................... 74
40. All TANF Adults Compared to Adults Who Have BeenContinuously on TANF for 36 Months; ExemptionsAs of July 2000 .................................................................................... 74
41a. All TANF Adults Compared to Adults Who Have BeenContinuously on TANF for 36 Months;Demographics as of July 2000 ........................................................... 75
41b. All TANF Adults Compared to Adults Who Have BeenContinuously on TANF for 36 Months;Demographics as of July 2000 ........................................................... 76

TANF/WorkFirst Program
ESA Program Briefing Book 200051
TANF andWorkFirst
The exhibits in this section summarize the TANF and WorkFirstcaseload trends for SFY 2000.
In the following exhibits, we include both federally-funded TANFand state-funded SFA cases, unless otherwise noted.
Highlights:
? Washington’s TANF/WorkFirst average monthlycaseload declined to 58,722 in SFY 2000, from a monthlyaverage of 62,247 in SFY 1999. In June 2000, thecaseload was lower still, at 55,369 cases.
? The average payment per case in SFY 2000 was$441.54.
? Child-only cases increased to 28.1% of the total TANFcaseload in June 2000, compared to 19.1% in July 1998.
? Single-parent cases declined to 60.2% in June 2000,compared to 69% of the total TANF caseload in July 1998.
? Two-parent cases stayed about the same, at 11.8% ofthe TANF caseload in June 2000, and 11.9% in July 1998.
? In June 2000, 5% of TANF cases with adults were insanction status.
? ESA estimates that in August 2002, approximately 8%of TANF cases may have an adult who reaches 60months of TANF, the time limit under welfare reform.
? In April 2000, 17.7% of TANF Adults returned sixmonths after an exit, compared to 18% in April 1999. Thepercentage has ranged from a high of 21.3% to a low of16.7% in SFY 2000.
? In July 2000, the majority of TANF adult clients wasfemale (80.6%), white (65.9%), and never married(43.6%). The median age for an adult was 30.2 years.

TANF/WorkFirst Program
ESA Program Briefing Book 200052
Exhibit 1Selected TANF Program Characteristics
SFY 1999 and SFY 2000
SFY99(July 98 - June 99)
SFY00(July 99 - June 00)
67,247 58,722Average Number of CasesPer Month (Range) 1 (61,011 - 75,305) (55,360 – 60,057)
183,510 158,387Average Number of PersonsPer Month (Range) 1 (165,384 - 206,109) (147,681–162,864)
59,149 50,218Average Number of AdultsPer Month (Range) 1 (51,948 – 68,182) (46,235 – 52,024)
123,131 108,168Average Number of ChildrenPer Month (Range) 1 (112,455 - 136,525) (101,446 –111,181)
Recipients as a Percent ofState's Total Population
3.2% 2.7%
Total Population 2 5,757,400 5,803,400
Children as a Percent ofRecipients
67.1% 68.3%
Average Persons Per Case 2.7 2.7
Average Children Per Case 1.8 1.8
Average Children Per Adult 2.0 2.2
Average Monthly PaymentPer Case
$433.87 $441.54
(Range) 1 3 ($426.75 - $441.99) ($430.94 - $446.09)
Note: The TANF cases for May 1999 and later have been adjusted to include cases formerly in the GeneralAssistance for Pregnant Women Program (GA-S). These cases have been paid TANF funds since May 1999.1 Source: CARD Clients, Persons, and Expenditures Report.2 Source: OFM 2000 Population Trends.3 Payments are not adjusted for refunds.
TANF/WorkFirst Program
ESA Program Briefing Book 200053
Exhibit 2TANF Cases
SFY 1998 to SFY 2000
Exhibit 3TANF Cases
SFY 1998 to SFY 2000
SFY98 SFY99 SFY00
July 90,205 73,851 60,296August 88,988 72,288 60,054September 88,363 69,428 59,827October 87,301 68,281 59,346November 85,761 66,486 59,124December 84,326 65,307 59,290January 84,000 65,099 58,877February 82,474 63,639 59,563March 81,876 63,449 59,254April 80,410 62,558 57,927May 78,276 62,444 56,562June 76,386 61,027 55,369
Source: CARD Clients, Persons, and Expenditures Report.Note: Caseload counts may differ slightly from counts in other tables due tomonth-to-month changes in the CARD database.
0
10,000
20,000
30,000
40,000
50,000
60,000
70,000
80,000
90,000
100,000
Jul-9
7
Oct
-97
Jan-
98
Apr
-98
Jul-9
8
Oct
-98
Jan-
99
Apr
-99
Jul-9
9
Oct
-99
Jan-
00
Apr
-00
Num
ber
of C
ases
38.6 percentdrop sinceJuly 1997

TANF/WorkFirst Program
ESA Program Briefing Book 200054
Exhibit 4TANF Applications
SFY 1999 to SFY 2000
Exhibit 5TANF Applications
SFY 1998 to SFY 2000
SFY98 SFY99 SFY00
July 8,955 8,728 9,328August 8,659 8,952 10,637September 9,330 9,348 10,269October 8,944 9,029 9,742November 7,949 8,930 10,662December 9,191 9,524 10,350January 9,344 9,423 11,656February 7,702 7,675 9,503March 8,566 9,168 10,953April 8,027 8,633 9,458May 7,561 7,985 10,744June 8,578 9,604 11,319
Source: MRDA caseload tracking using the CARD database.Note: Applications were identified using application dates in the ACESsystem. All applications entered into ACES are counted, including newcases, closed cases reapplying for benefits and clients added to opencases.
0
2,000
4,000
6,000
8,000
10,000
12,000
14,000
Jul-9
7
Oct
-97
Jan-
98
Apr
-98
Jul-9
8
Oct
-98
Jan-
99
Apr
-99
Jul-9
9
Oct
-99
Jan-
00
Apr
-00
Num
ber
of C
ases

TANF/WorkFirst Program
ESA Program Briefing Book 200055
Exhibit 6Cases Entering, Exiting, and Re-Entering TANF
as a Percent of the Total Caseload, SFY 1999 to SFY 2000
Exhibit 7Cases Entering, Re-Entering, and Exiting TANF as a Percent of the Total Caseload. SFY 2000
Month Caseload1 Entries Re-Entries ExitsNumber Percent Number Percent Number Percent
Jul-98 73,845 4,383 5.9% 3,134 71.5% 6,282 8.5%
Jul-99 59,464 4,890 8.2% 3,541 72.4% 5,181 8.7%Aug-99 60,047 5,758 9.6% 3,759 65.3% 5,583 9.3%Sep-99 59,821 5,353 8.9% 3,725 69.6% 5,727 9.6%Oct-99 59,342 5,245 8.8% 3,736 71.2% 5,615 9.5%Nov-99 59,119 5,388 9.1% 3,950 73.3% 5,551 9.4%Dec-99 58,952 5,410 9.2% 3,371 62.3% 6,155 10.4%Jan-00 58,865 5,806 9.9% 4,314 74.3% 4,252 7.2%Feb-00 59,555 4,938 8.3% 3,513 71.1% 5,352 9.0%Mar-00 59,244 5,039 8.5% 3,598 71.4% 5,986 10.1%Apr-00 57,913 4,654 8.0% 3,355 72.1% 6,222 10.7%May-00 56,544 4,851 8.6% 3,532 72.8% 6,352 11.2%Jun-00 55,358 5,162 9.3% 3,663 71.0% 6,271 11.3%
Source: MRDA caseload tracking using the CARD database.Note: Entries are defined as cases that were not on TANF the month prior to what is reported. Exits are definedas cases that received a benefit in the month reported, but not in the subsequent month. Re-entries are definedas cases that have been off TANF at least one month before entering TANF. For example, it is possible that a re-entry case could be on in June, off in July, and back on in August, a break of one month.1 Caseload counts may differ slightly from counts in other tables due to month-to-month changes in the CARDdatabase.
0.0%
2.0%
4.0%
6.0%
8.0%
10.0%
12.0%
Jul-9
8
Sep
-98
Nov
-98
Jan-
99
Mar
-99
May
-99
Jul-9
9
Sep
-99
Nov
-99
Jan-
00
Mar
-00
May
-00
Per
cent
of T
otal
Cas
eloa
d
Entries Re-Entries Exits
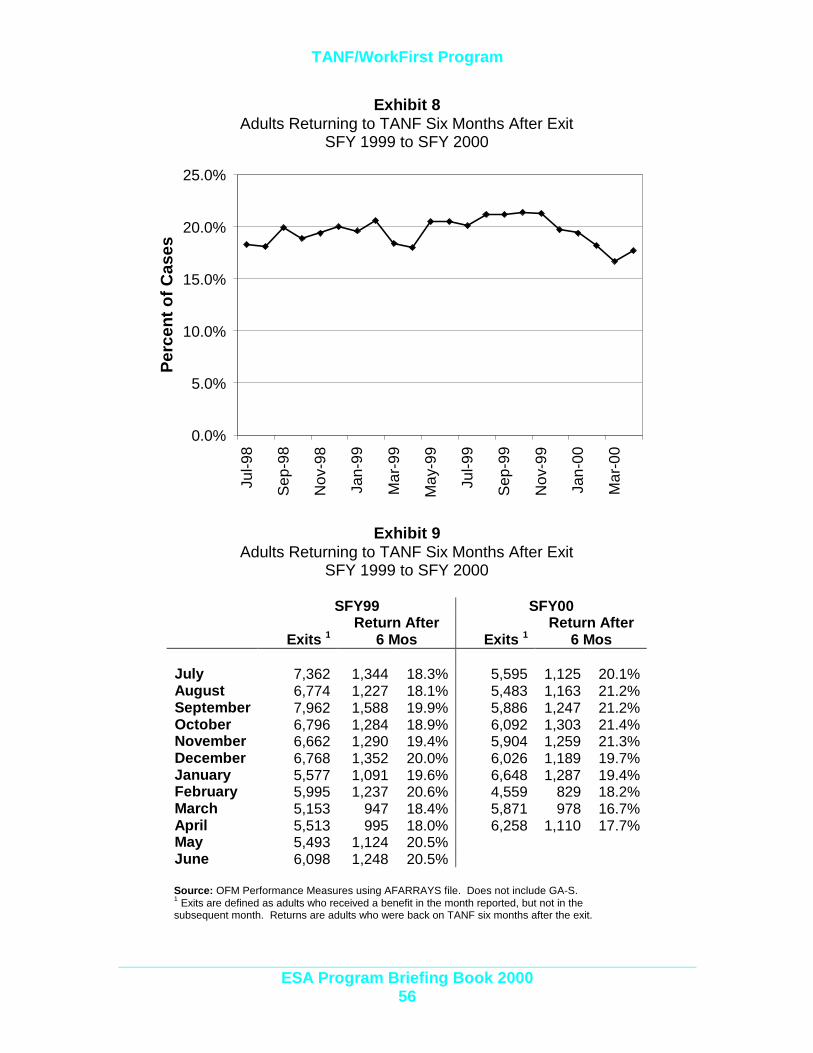
TANF/WorkFirst Program
ESA Program Briefing Book 200056
Exhibit 8Adults Returning to TANF Six Months After Exit
SFY 1999 to SFY 2000
Exhibit 9Adults Returning to TANF Six Months After Exit
SFY 1999 to SFY 2000
SFY99 SFY00
Exits 1Return After
6 Mos Exits 1Return After
6 Mos
July 7,362 1,344 18.3% 5,595 1,125 20.1%August 6,774 1,227 18.1% 5,483 1,163 21.2%September 7,962 1,588 19.9% 5,886 1,247 21.2%October 6,796 1,284 18.9% 6,092 1,303 21.4%November 6,662 1,290 19.4% 5,904 1,259 21.3%December 6,768 1,352 20.0% 6,026 1,189 19.7%January 5,577 1,091 19.6% 6,648 1,287 19.4%February 5,995 1,237 20.6% 4,559 829 18.2%March 5,153 947 18.4% 5,871 978 16.7%April 5,513 995 18.0% 6,258 1,110 17.7%May 5,493 1,124 20.5%June 6,098 1,248 20.5%
Source: OFM Performance Measures using AFARRAYS file. Does not include GA-S.1 Exits are defined as adults who received a benefit in the month reported, but not in thesubsequent month. Returns are adults who were back on TANF six months after the exit.
0.0%
5.0%
10.0%
15.0%
20.0%
25.0%
Jul-9
8
Sep
-98
Nov
-98
Jan-
99
Mar
-99
May
-99
Jul-9
9
Sep
-99
Nov
-99
Jan-
00
Mar
-00
Per
cent
of C
ases

TANF/WorkFirst Program
ESA Program Briefing Book 200057
Exhibit 10Clients Receiving the Early Exit Bonus
April 2000 through September 2000
Exhibit 11Clients Receiving the Early Exit Bonus
April 2000 through September 2000
Returned to TANFAs of Sep. 2000 1
ContinuedFood Stamps 2
EEBCount Number Percent
AverageMonths
OffNumber Percent
Apr 00 256 58 22.7% 3.07 223 87.1%May 00 582 97 16.7% 2.30 514 88.3%Jun 00 762 130 17.1% 1.94 644 84.5%Jul 00 617 75 12.2% 1.48 522 84.6%Aug 00 540 33 6.1% 1.00 472 87.4%Sep 00 627 0 0.0% 0.00 538 85.8%
Source: MRDA caseload tracking using the CARD database.Note: The Early Exit Bonus (EEB) began in April 2000 and is a once in a lifetime $1,000 payment to clients withearnings who leave TANF. The EEB is a incentive for clients to remain self-sufficient.1 Returned to TANF includes clients who received TANF in any month after receiving the Early Exit Bonus.2 Continued Food Stamps includes clients who received Food Stamps in the same month as the Early ExitBonus regardless of whether they received Food Stamps in subsequent months.
0
100
200
300
400
500
600
700
800
900
Apr
-00
May
-00
Jun-
00
Jul-0
0
Aug
-00
Sep
-00
Num
ber
of C
ases
EEB Cases Returned to TANF Cont'd Food Stamps
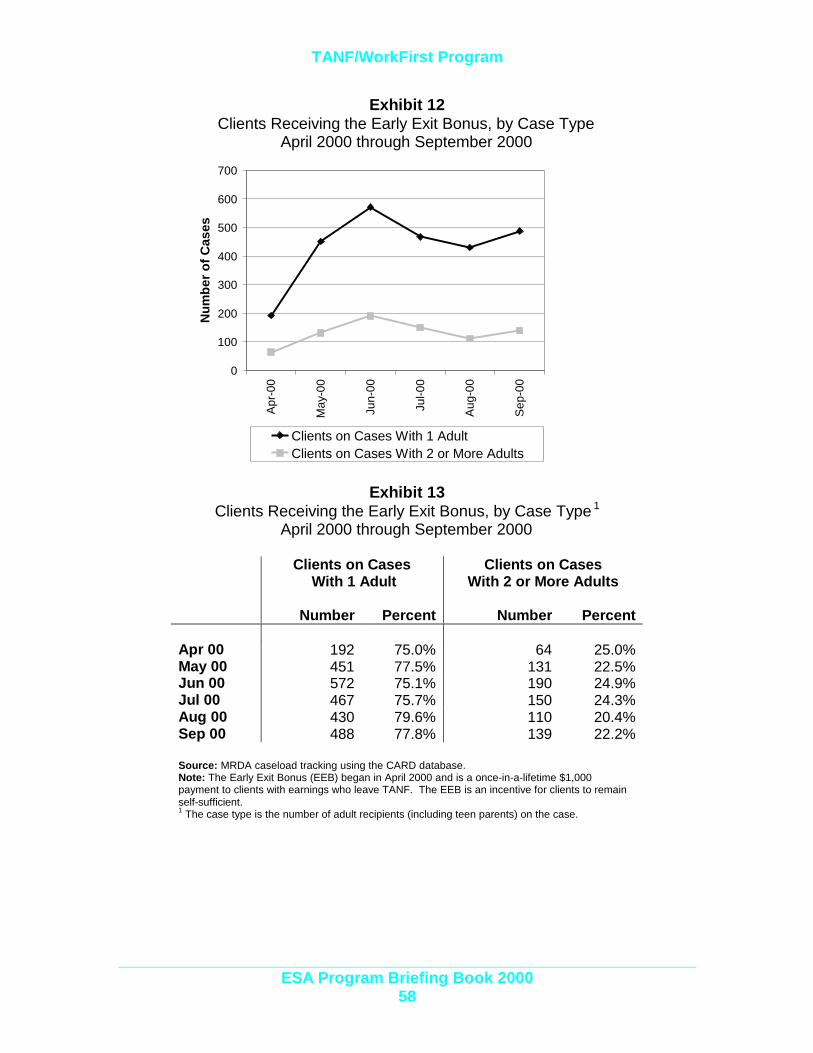
TANF/WorkFirst Program
ESA Program Briefing Book 200058
Exhibit 12Clients Receiving the Early Exit Bonus, by Case Type
April 2000 through September 2000
Exhibit 13Clients Receiving the Early Exit Bonus, by Case Type 1
April 2000 through September 2000
Clients on Cases With 1 Adult
Clients on CasesWith 2 or More Adults
Number Percent Number Percent
Apr 00 192 75.0% 64 25.0%May 00 451 77.5% 131 22.5%Jun 00 572 75.1% 190 24.9%Jul 00 467 75.7% 150 24.3%Aug 00 430 79.6% 110 20.4%Sep 00 488 77.8% 139 22.2%
Source: MRDA caseload tracking using the CARD database.Note: The Early Exit Bonus (EEB) began in April 2000 and is a once-in-a-lifetime $1,000payment to clients with earnings who leave TANF. The EEB is an incentive for clients to remainself-sufficient.1 The case type is the number of adult recipients (including teen parents) on the case.
0
100
200
300
400
500
600
700
Apr
-00
May
-00
Jun-
00
Jul-0
0
Aug
-00
Sep
-00
Num
ber
of C
ases
Clients on Cases With 1 AdultClients on Cases With 2 or More Adults

TANF/WorkFirst Program
ESA Program Briefing Book 200059
Exhibit 14Percent of TANF Cases by Number of Adults
SFY 1999 to SFY 2000
Exhibit 15TANF Cases by Number of Adults
SFY 2000Child Only 1 Adult 2 or More Adults
Caseload1 Number Percent Number Percent Number Percent
Jul-98 73,845 14,388 19.1% 51,944 69.0% 8,967 11.9%
Jul-99 60,286 14,889 24.7% 38,286 63.5% 7,111 11.8%Aug-99 60,049 14,981 24.9% 37,942 63.2% 7,126 11.9%Sep-99 59,821 15,072 25.2% 37,600 62.9% 7,149 12.0%Oct-99 59,342 15,108 25.5% 37,074 62.5% 7,160 12.1%Nov-99 59,119 15,329 25.9% 36,601 61.9% 7,189 12.2%Dec-99 59,283 15,626 26.4% 36,426 61.4% 7,231 12.2%Jan-00 58,868 15,854 26.9% 35,717 60.7% 7,297 12.4%Feb-00 59,552 16,011 26.9% 36,082 60.6% 7,459 12.5%Mar-00 59,243 16,052 27.1% 35,791 60.4% 7,400 12.5%Apr-00 57,921 15,892 27.4% 34,899 60.3% 7,130 12.3%May-00 56,543 15,755 27.9% 33,998 60.1% 6,790 12.0%Jun-00 55,351 15,539 28.1% 33,303 60.2% 6,509 11.8%
Source: MRDA caseload tracking using the CARD database.Note: Cases are grouped according to the number of adult recipients on a case. Adults include teen parents. Noadjustments are made for disabled adults.1 Caseload counts may differ slightly from counts in other tables due to month-to-month changes in the CARDdatabase.
0.0%
10.0%
20.0%
30.0%
40.0%
50.0%
60.0%
70.0%
80.0%
90.0%
100.0%
Jul-9
8
Sep
-98
Nov
-98
Jan-
99
Mar
-99
May
-99
Jul-9
9
Sep
-99
Nov
-99
Jan-
00
Mar
-00
May
-00
Per
cent
of C
ases
Child Only 1 Adult 2 or More Adults
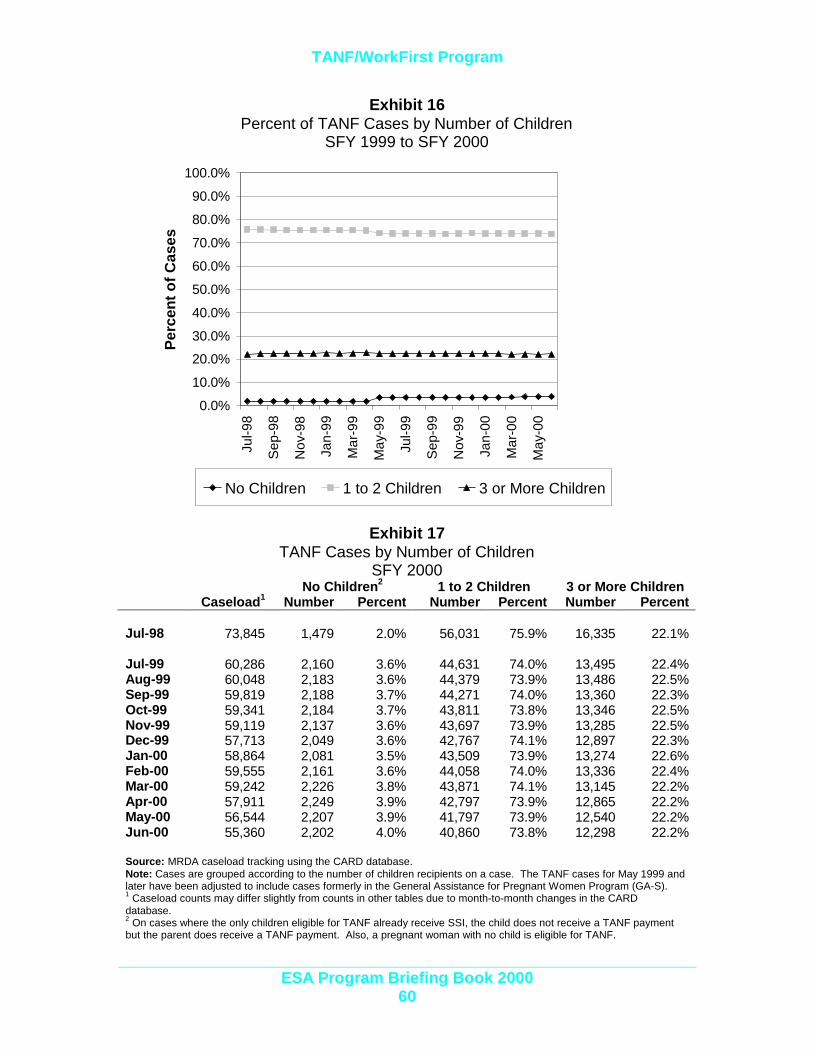
TANF/WorkFirst Program
ESA Program Briefing Book 200060
Exhibit 16Percent of TANF Cases by Number of Children
SFY 1999 to SFY 2000
Exhibit 17TANF Cases by Number of Children
SFY 2000No Children2 1 to 2 Children 3 or More Children
Caseload1 Number Percent Number Percent Number Percent
Jul-98 73,845 1,479 2.0% 56,031 75.9% 16,335 22.1%
Jul-99 60,286 2,160 3.6% 44,631 74.0% 13,495 22.4%Aug-99 60,048 2,183 3.6% 44,379 73.9% 13,486 22.5%Sep-99 59,819 2,188 3.7% 44,271 74.0% 13,360 22.3%Oct-99 59,341 2,184 3.7% 43,811 73.8% 13,346 22.5%Nov-99 59,119 2,137 3.6% 43,697 73.9% 13,285 22.5%Dec-99 57,713 2,049 3.6% 42,767 74.1% 12,897 22.3%Jan-00 58,864 2,081 3.5% 43,509 73.9% 13,274 22.6%Feb-00 59,555 2,161 3.6% 44,058 74.0% 13,336 22.4%Mar-00 59,242 2,226 3.8% 43,871 74.1% 13,145 22.2%Apr-00 57,911 2,249 3.9% 42,797 73.9% 12,865 22.2%May-00 56,544 2,207 3.9% 41,797 73.9% 12,540 22.2%Jun-00 55,360 2,202 4.0% 40,860 73.8% 12,298 22.2%
Source: MRDA caseload tracking using the CARD database.Note: Cases are grouped according to the number of children recipients on a case. The TANF cases for May 1999 andlater have been adjusted to include cases formerly in the General Assistance for Pregnant Women Program (GA-S).1 Caseload counts may differ slightly from counts in other tables due to month-to-month changes in the CARDdatabase.2 On cases where the only children eligible for TANF already receive SSI, the child does not receive a TANF paymentbut the parent does receive a TANF payment. Also, a pregnant woman with no child is eligible for TANF.
0.0%
10.0%
20.0%
30.0%
40.0%
50.0%
60.0%
70.0%
80.0%
90.0%
100.0%
Jul-9
8
Sep
-98
Nov
-98
Jan-
99
Mar
-99
May
-99
Jul-9
9
Sep
-99
Nov
-99
Jan-
00
Mar
-00
May
-00
Per
cent
of C
ases
No Children 1 to 2 Children 3 or More Children

TANF/WorkFirst Program
ESA Program Briefing Book 200061
Exhibit 18Percent of TANF Cases with Teen Heads of Household
SFY 1998 to SFY 2000
Exhibit 19TANF Cases with Teen Heads of Household
SFY 2000
Caseswith
Adults
Head of Householdis 16 Years Old
or Less
Head of Householdis 17 Years Old
Head of Householdis 18 Years Old
Jul-98 59,458 76 0.1% 219 0.4% 1,405 2.4%
Jul-99 45,397 52 0.1% 155 0.3% 1,350 3.0%Aug-99 45,067 51 0.1% 160 0.4% 1,373 3.0%Sep-99 44,749 49 0.1% 172 0.4% 1,343 3.0%Oct-99 44,234 49 0.1% 164 0.4% 1,306 3.0%Nov-99 43,790 53 0.1% 162 0.4% 1,273 2.9%Dec-99 43,657 51 0.1% 166 0.4% 1,294 3.0%Jan-00 43,013 53 0.1% 183 0.4% 1,282 3.0%Feb-00 43,541 60 0.1% 183 0.4% 1,282 2.9%Mar-00 43,191 53 0.1% 187 0.4% 1,318 3.1%Apr-00 42,029 59 0.1% 188 0.4% 1,270 3.0%May-00 40,788 61 0.1% 187 0.5% 1,209 3.0%Jun-00 39,812 54 0.1% 188 0.5% 1,214 3.0%
Source: Source: MRDA caseload tracking using the CARD database. Adults include teen parents.Note: TANF living arrangements and school attendance requirements apply to those under age 18.
0.0%
0.5%
1.0%
1.5%
2.0%
2.5%
3.0%
3.5%
Jul-9
8
Sep
-98
Nov
-98
Jan-
99
Mar
-99
May
-99
Jul-9
9
Sep
-99
Nov
-99
Jan-
00
Mar
-00
May
-00
Per
cent
of C
ases
16 Years Old and Younger 17 Years Old 18 Years Old
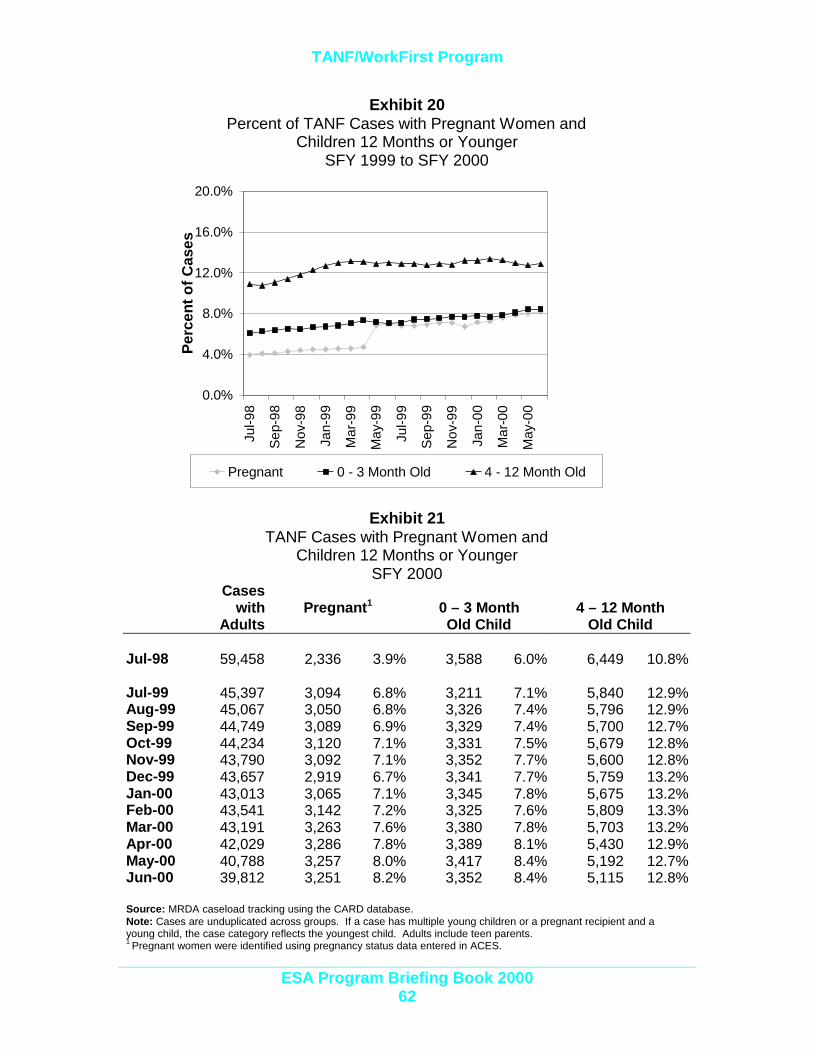
TANF/WorkFirst Program
ESA Program Briefing Book 200062
Exhibit 20Percent of TANF Cases with Pregnant Women and
Children 12 Months or YoungerSFY 1999 to SFY 2000
Exhibit 21TANF Cases with Pregnant Women and
Children 12 Months or YoungerSFY 2000
Caseswith
AdultsPregnant1 0 – 3 Month
Old Child4 – 12 Month
Old Child
Jul-98 59,458 2,336 3.9% 3,588 6.0% 6,449 10.8%
Jul-99 45,397 3,094 6.8% 3,211 7.1% 5,840 12.9%Aug-99 45,067 3,050 6.8% 3,326 7.4% 5,796 12.9%Sep-99 44,749 3,089 6.9% 3,329 7.4% 5,700 12.7%Oct-99 44,234 3,120 7.1% 3,331 7.5% 5,679 12.8%Nov-99 43,790 3,092 7.1% 3,352 7.7% 5,600 12.8%Dec-99 43,657 2,919 6.7% 3,341 7.7% 5,759 13.2%Jan-00 43,013 3,065 7.1% 3,345 7.8% 5,675 13.2%Feb-00 43,541 3,142 7.2% 3,325 7.6% 5,809 13.3%Mar-00 43,191 3,263 7.6% 3,380 7.8% 5,703 13.2%Apr-00 42,029 3,286 7.8% 3,389 8.1% 5,430 12.9%May-00 40,788 3,257 8.0% 3,417 8.4% 5,192 12.7%Jun-00 39,812 3,251 8.2% 3,352 8.4% 5,115 12.8%
Source: MRDA caseload tracking using the CARD database.Note: Cases are unduplicated across groups. If a case has multiple young children or a pregnant recipient and ayoung child, the case category reflects the youngest child. Adults include teen parents.1 Pregnant women were identified using pregnancy status data entered in ACES.
0.0%
4.0%
8.0%
12.0%
16.0%
20.0%
Jul-9
8
Sep
-98
Nov
-98
Jan-
99
Mar
-99
May
-99
Jul-9
9
Sep
-99
Nov
-99
Jan-
00
Mar
-00
May
-00
Per
cent
of C
ases
Pregnant 0 - 3 Month Old 4 - 12 Month Old

TANF/WorkFirst Program
ESA Program Briefing Book 200063
Exhibit 22Percent of Employed TANF Adults
SFY 1999 to SFY 2000
Exhibit 23Employed TANF AdultsSFY 1999 to SFY 2000
SFY99 SFY00Adults Employed Adults Employed
July 68,422 19,580 28.6% 52,473 16,614 31.7%August 66,711 19,058 28.6% 52,180 16,040 30.7%September 63,567 18,584 29.2% 51,886 16,165 31.2%October 62,222 19,682 31.6% 51,380 Unknown1 0.0%November 60,242 19,047 31.6% 50,982 Unknown1 0.0%December 58,537 17,990 30.7% 50,880 Unknown1 0.0%January 58,242 16,783 28.8% 50,302 13,239 26.3%February 56,504 15,919 28.2% 50,986 12,841 25.2%March 56,274 16,426 29.2% 50,578 12,817 25.3%April 55,309 17,422 31.5% 49,148 12,452 25.3%May 54,916 17,072 31.1% 47,582 12,366 26.0%June 53,066 16,404 30.9% 46,319 12,120 26.2%
Source: MRDA caseload tracking using the CARD database Adults include teen parents.Note: Employment is identified using data in the ACES system.1 In January 2000, ESA switched from retrospect budgeting to prospective budgeting. Because of that change, October1999 – December 1999 income was not used to budget benefit amounts. Therefore, employment data for those monthsis considered unreliable.
0.0%
10.0%
20.0%
30.0%
40.0%
Jul-9
8
Sep
-98
Nov
-98
Jan-
99
Mar
-99
May
-99
Jul-9
9
Sep
-99
Nov
-99
Jan-
00
Mar
-00
May
-00
Per
cent
of C
ases

TANF/WorkFirst Program
ESA Program Briefing Book 200064
Exhibit 24Percent of TANF Cases With Adults in WorkFirst Sanction
SFY 1999 to SFY 2000
Exhibit 25TANF Cases with Adults in WorkFirst Sanction
by Consecutive Months in Sanction StatusSFY 2000
Caseswith
Adults
CasesSanctioned
First Month Second Month Third MonthOr Later
Jul-98 59,458 3,602 1,279 2.2% 918 1.5% 1,405 2.4%
Jul-99 45,397 2,695 689 1.5% 490 1.1% 1,516 3.3%Aug-99 45,067 2,415 595 1.3% 416 0.9% 1,404 3.1%Sep-99 44,749 2,277 608 1.4% 384 0.9% 1,285 2.9%Oct-99 44,234 2,158 640 1.4% 371 0.8% 1,147 2.6%Nov-99 43,790 2,113 647 1.5% 394 0.9% 1,072 2.4%Dec-99 43,657 2,124 641 1.5% 424 1.0% 1,059 2.4%Jan-00 43,013 2,207 741 1.7% 403 0.9% 1,063 2.5%Feb-00 43,541 2,347 757 1.7% 496 1.1% 1,094 2.5%Mar-00 43,191 2,237 748 1.7% 421 1.0% 1,068 2.5%Apr-00 42,029 2,154 765 1.8% 420 1.0% 969 2.3%May-00 40,788 2,075 704 1.7% 459 1.1% 912 2.2%Jun-00 39,812 2,011 736 1.8% 404 1.0% 871 2.2%
Source: MRDA caseload tracking using the CARD database. Adults include teen parents.
0.0%
0.5%
1.0%
1.5%
2.0%
2.5%
3.0%
3.5%
4.0%
4.5%
Jul-9
8
Sep
-98
Nov
-98
Jan-
99
Mar
-99
May
-99
Jul-9
9
Sep
-99
Nov
-99
Jan-
00
Mar
-00
May
-00
Per
cent
of C
ases
First Month Second Month Third Month
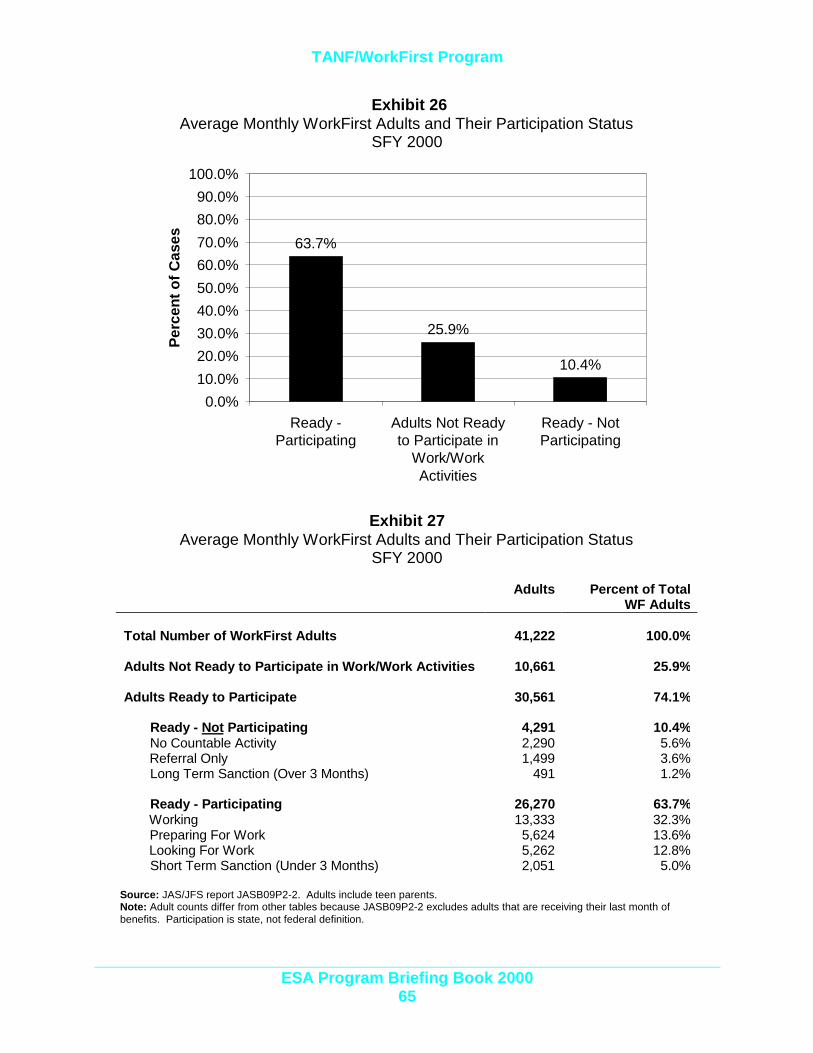
TANF/WorkFirst Program
ESA Program Briefing Book 200065
Exhibit 26Average Monthly WorkFirst Adults and Their Participation Status
SFY 2000
Exhibit 27Average Monthly WorkFirst Adults and Their Participation Status
SFY 2000
Adults Percent of TotalWF Adults
Total Number of WorkFirst Adults 41,222 100.0%
Adults Not Ready to Participate in Work/Work Activities 10,661 25.9%
Adults Ready to Participate 30,561 74.1%
Ready - Not Participating 4,291 10.4% No Countable Activity 2,290 5.6% Referral Only 1,499 3.6% Long Term Sanction (Over 3 Months) 491 1.2%
Ready - Participating 26,270 63.7% Working 13,333 32.3% Preparing For Work 5,624 13.6% Looking For Work 5,262 12.8% Short Term Sanction (Under 3 Months) 2,051 5.0%
Source: JAS/JFS report JASB09P2-2. Adults include teen parents.Note: Adult counts differ from other tables because JASB09P2-2 excludes adults that are receiving their last month ofbenefits. Participation is state, not federal definition.
63.7%
25.9%
10.4%
0.0%10.0%20.0%30.0%40.0%50.0%60.0%70.0%80.0%90.0%
100.0%
Ready -Participating
Adults Not Readyto Participate in
Work/WorkActivities
Ready - NotParticipating
Per
cent
of C
ases
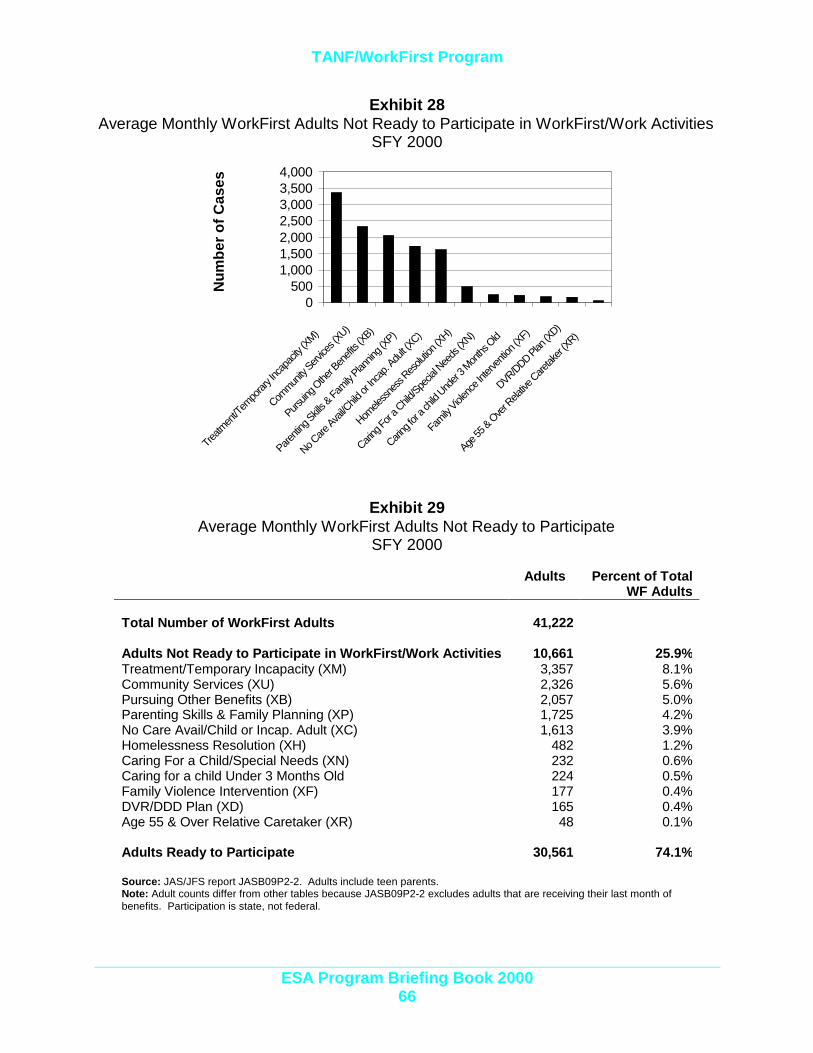
TANF/WorkFirst Program
ESA Program Briefing Book 200066
Exhibit 28Average Monthly WorkFirst Adults Not Ready to Participate in WorkFirst/Work Activities
SFY 2000
Exhibit 29Average Monthly WorkFirst Adults Not Ready to Participate
SFY 2000
Adults Percent of TotalWF Adults
Total Number of WorkFirst Adults 41,222
Adults Not Ready to Participate in WorkFirst/Work Activities 10,661 25.9%Treatment/Temporary Incapacity (XM) 3,357 8.1%Community Services (XU) 2,326 5.6%Pursuing Other Benefits (XB) 2,057 5.0%Parenting Skills & Family Planning (XP) 1,725 4.2%No Care Avail/Child or Incap. Adult (XC) 1,613 3.9%Homelessness Resolution (XH) 482 1.2%Caring For a Child/Special Needs (XN) 232 0.6%Caring for a child Under 3 Months Old 224 0.5%Family Violence Intervention (XF) 177 0.4%DVR/DDD Plan (XD) 165 0.4%Age 55 & Over Relative Caretaker (XR) 48 0.1%
Adults Ready to Participate 30,561 74.1%
Source: JAS/JFS report JASB09P2-2. Adults include teen parents.Note: Adult counts differ from other tables because JASB09P2-2 excludes adults that are receiving their last month ofbenefits. Participation is state, not federal.
0500
1,0001,5002,0002,5003,0003,5004,000
Treatm
ent/T
empo
rary In
capa
city (X
M)
Commun
ity Serv
ices (
XU)
Pursuin
g Othe
r Ben
efits (
XB)
Parenti
ng Skill
s & Fa
mily Plan
ning (
XP)
No Care
Avail/C
hild or
Inca
p. Adu
lt (XC)
Homele
ssnes
s Res
olution
(XH)
Caring
For a
Child/Spe
cial N
eeds
(XN)
Caring
for a
child
Under
3 Mon
ths O
ld
Family
Violenc
e Inte
rventi
on (X
F)
DVR/DDD Plan (X
D)
Age 55
& Ove
r Rela
tive Care
taker
(XR)
Num
ber
of C
ases
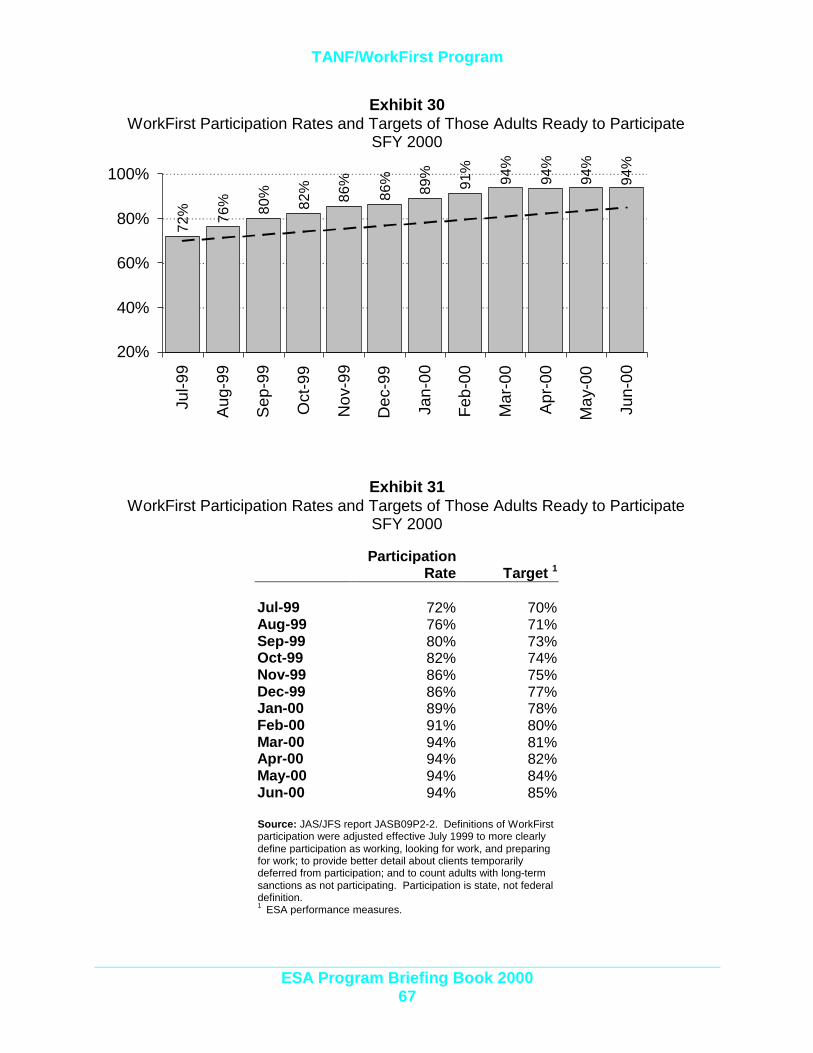
TANF/WorkFirst Program
ESA Program Briefing Book 200067
Exhibit 30WorkFirst Participation Rates and Targets of Those Adults Ready to Participate
SFY 2000
Exhibit 31WorkFirst Participation Rates and Targets of Those Adults Ready to Participate
SFY 2000
ParticipationRate Target 1
Jul-99 72% 70%Aug-99 76% 71%Sep-99 80% 73%Oct-99 82% 74%Nov-99 86% 75%Dec-99 86% 77%Jan-00 89% 78%Feb-00 91% 80%Mar-00 94% 81%Apr-00 94% 82%May-00 94% 84%Jun-00 94% 85%
Source: JAS/JFS report JASB09P2-2. Definitions of WorkFirstparticipation were adjusted effective July 1999 to more clearlydefine participation as working, looking for work, and preparingfor work; to provide better detail about clients temporarilydeferred from participation; and to count adults with long-termsanctions as not participating. Participation is state, not federaldefinition.1 ESA performance measures.
72% 76
% 80%
82% 86%
86%
89% 94
%
94%
94%
91%
94%
20%
40%
60%
80%
100%Ju
l-99
Aug
-99
Sep
-99
Oct
-99
Nov
-99
Dec
-99
Jan-
00
Feb-
00
Mar
-00
Apr
-00
May
-00
Jun-
00
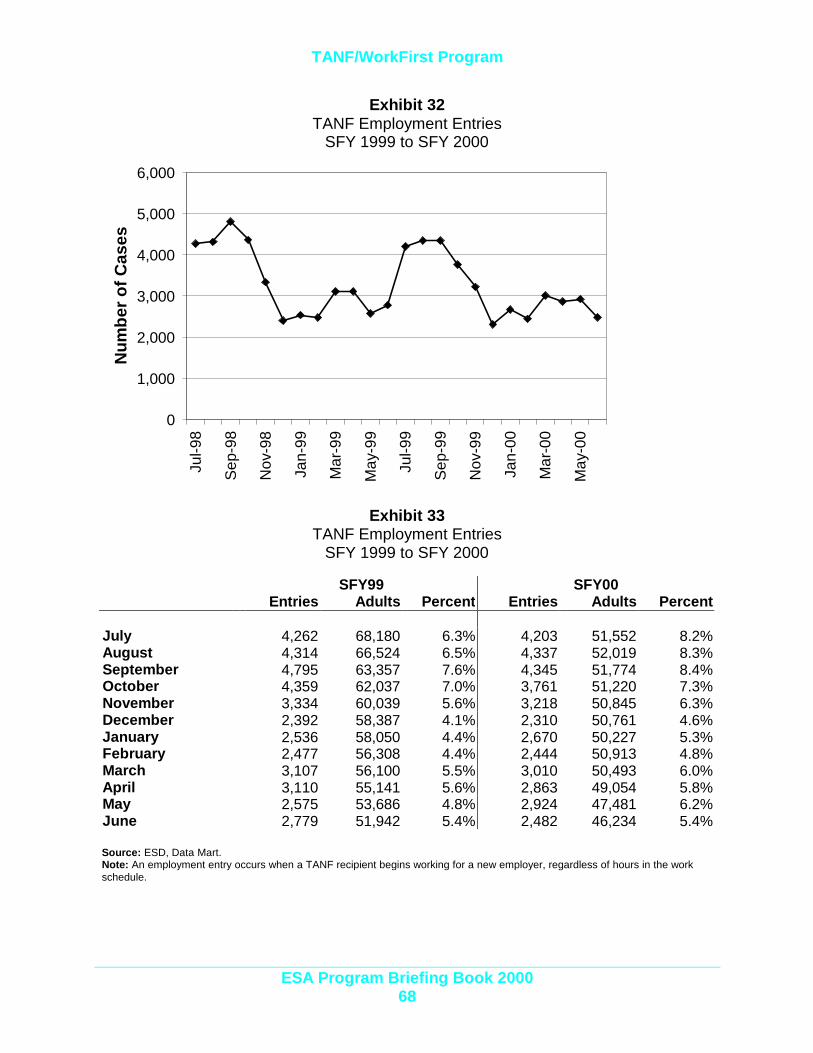
TANF/WorkFirst Program
ESA Program Briefing Book 200068
Exhibit 32TANF Employment Entries
SFY 1999 to SFY 2000
Exhibit 33TANF Employment Entries
SFY 1999 to SFY 2000
SFY99 SFY00Entries Adults Percent Entries Adults Percent
July 4,262 68,180 6.3% 4,203 51,552 8.2%August 4,314 66,524 6.5% 4,337 52,019 8.3%September 4,795 63,357 7.6% 4,345 51,774 8.4%October 4,359 62,037 7.0% 3,761 51,220 7.3%November 3,334 60,039 5.6% 3,218 50,845 6.3%December 2,392 58,387 4.1% 2,310 50,761 4.6%January 2,536 58,050 4.4% 2,670 50,227 5.3%February 2,477 56,308 4.4% 2,444 50,913 4.8%March 3,107 56,100 5.5% 3,010 50,493 6.0%April 3,110 55,141 5.6% 2,863 49,054 5.8%May 2,575 53,686 4.8% 2,924 47,481 6.2%June 2,779 51,942 5.4% 2,482 46,234 5.4%
Source: ESD, Data Mart. Note: An employment entry occurs when a TANF recipient begins working for a new employer, regardless of hours in the workschedule.
0
1,000
2,000
3,000
4,000
5,000
6,000Ju
l-98
Sep
-98
Nov
-98
Jan-
99
Mar
-99
May
-99
Jul-9
9
Sep
-99
Nov
-99
Jan-
00
Mar
-00
May
-00
Num
ber
of C
ases

TANF/WorkFirst Program
ESA Program Briefing Book 200069
Exhibit 34aTANF Client (Adults and Children) Demographics
July 2000
All TANF Clients(Adults and Children)
Characteristic (N=145,073) Percent
Gender Female 86,183 59.4% Male 58,888 40.6% Unknown 2 0.0%
Race White 86,219 59.4% Hispanic 18,724 12.9% Black 18,772 12.9% Asian/Pacific Islander 6,636 4.6% Native American 7,103 4.9% Unknown 7,619 5.3%
Marital Status (Adults Only) Separated 7,106 15.6% Married 11,598 25.5% Never Married 19,915 43.8% Divorced 6,562 14.4% Widow 329 0.7% Unknown 3 0.0%
Citizenship U.S. Citizen 130,998 90.3% Resident Alien 13,530 9.3% U.S. National 152 0.1% U.S. Born Child of Refugee 375 0.3% Undocumented Alien 16 0.0% Unknown 2 0.0%
Age < 17 Years Old 96,080 66.2% 17 - 18 Years Old 4,969 3.4% 19 - 20 Years Old 4,085 2.8% 21 – 30 Years Old 18,438 12.7% 31 – 40 Years Old 14,267 9.8% 41 – 50 Years Old 6,031 4.2% 51 – 55 Years Old 779 0.5% 56 + Years Old 424 0.3% Unknown 0 0.0%
Mean Age of Children 7.8 Years OldMedian Age of Children 7.5 Years Old
Mean Age of Adults 31.5 Years OldMedian Age of Adults 30.2 Years Old
Source: MRDA caseload tracking the CARD database.

TANF/WorkFirst Program
ESA Program Briefing Book 200070
Exhibit 34bTANF Client (Adults and Children) Demographics
July 2000All TANF Clients
(Adults and Children)Characteristic (N=145,073) Percent
Client Type Adult 45,554 31.4% Child 99,519 68.6%
Limited in Life Activity 1 3,721 2.6%
Limited in Work 1 3,630 2.5%
Limited in English 2 22,013 15.2%
DSHS Region Region 1 25,472 17.6% Region 2 18,632 12.8% Region 3 14,808 10.2% Region 4 30,507 21.0% Region 5 25,526 17.6% Region 6 30,127 20.8% Other 1 0.0%
CSO Type Urban 104,050 71.7% Rural 41,023 28.3%
Source: MRDA caseload tracking the CARD database.1 Caseworkers ask whether a client is limited in a life activity (e.g., dressing or bathing) or limitedin their ability to work. The questions are used to identify disabled clients.2 A client is included in Limited English if the Head of Household for the Assistance Unit hasindicated he/she wants to receive materials in a language other than English.

TANF/WorkFirst Program
ESA Program Briefing Book 200071
Exhibit 35Estimates of TANF Families Reaching 60 Monthson Assistance in August 2002 and August 2003
Estimate Number of familiesestimated to reach60-month time limit inAugust 2002(percent of projectedcaseload)
Cumulative Number offamiliesestimated to reach60-month time limit inAugust 2003(percent of projectedcaseload)
Low estimate 2,900(5% of projected caseload)
6,460(11% of projectedcaseload)
High estimate 4,760(8% of projected caseload)
10,240(18% of projectedcaseload)
Source: low estimate from Washington State Institute for Public Policy; high estimate and maximum numbersfrom ACES data and OFM projections compiled by MRDA.Note: The high and low estimates in the table above are projections of how many of these families are likely toremain on the caseload and reach their time limit by certain dates. In addition to these estimates, we know theabsolute maximum number of families who could potentially reach the time limit. Families who have receivedassistance continuously from August 1997 to July 2000, and stay on assistance, could reach their time limit inAugust 2002. This is a maximum of 6,280 families or 12% of the projected caseload. Families who havereceived between 24 and 35 months of assistance, as of July 2000, and who stay on assistance, could reachtheir time limit by August 2003. This is a cumulative total of 15, 170 families or 27% of the projected caseload.This is a “worst case scenario.”

TANF/WorkFirst Program
ESA Program Briefing Book 200072
Exhibit 36Families with Long Term TANF Clients
Served by Other DSHS Divisions During SFY 1999
DSHS Divisions servingTANF families
Number of long-termTANF families served
by other Divisions
Percentage oflong-term families
served by otherDivisions
Economic Services 6,069 100%
Mental Health Division(MHD)
1,284 21.2%
Division of Alcohol andSubstance Abuse (DASA)
631 10.4%
Children’s Administration(CA)
1,732 28.5%
Division of VocationalRehabilitation (DVR)
278 4.6%
MHD and DASA 224 3.7%
MHD and CA 580 9.6%
CA and DASA 328 5.4%
CA and DASA and MHD 142 2.3%
Source: Research and Data Analysis, ad hoc report 10/31/00, cross match of TANF reportingfile with Client Service Database.Note: SFY99 is the latest data available.
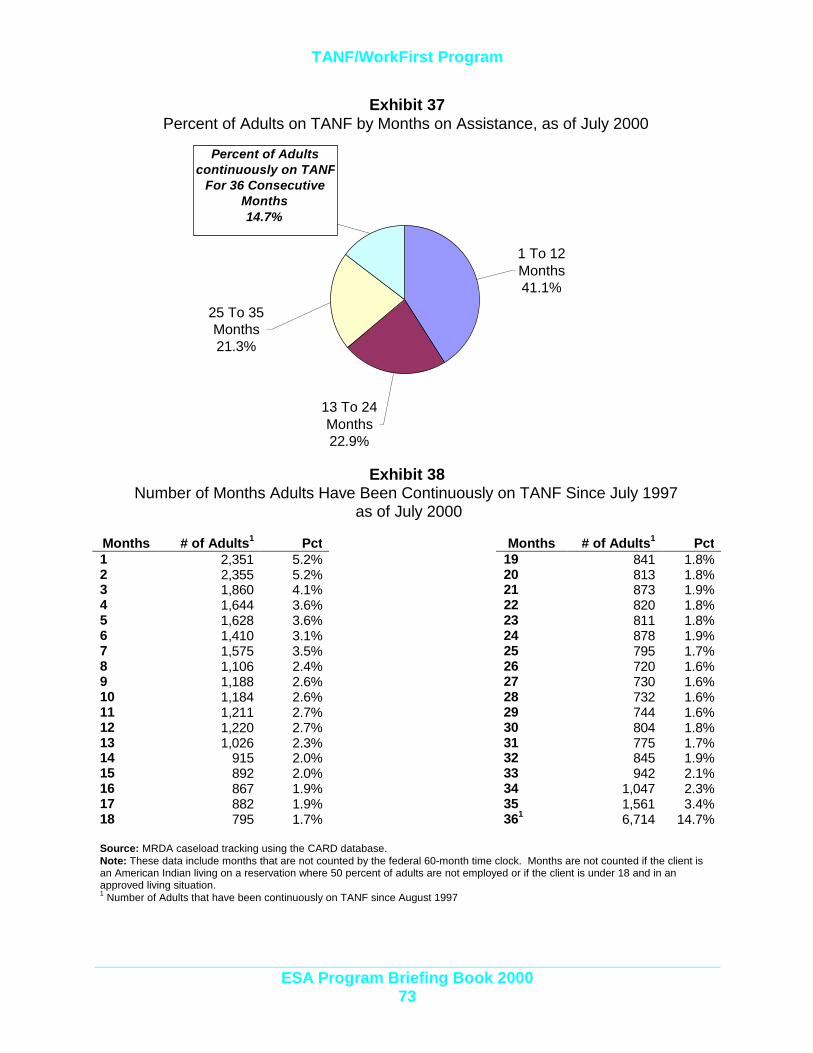
TANF/WorkFirst Program
ESA Program Briefing Book 200073
Exhibit 37Percent of Adults on TANF by Months on Assistance, as of July 2000
Exhibit 38Number of Months Adults Have Been Continuously on TANF Since July 1997
as of July 2000
Months # of Adults1 Pct Months # of Adults1 Pct1 2,351 5.2% 19 841 1.8%2 2,355 5.2% 20 813 1.8%3 1,860 4.1% 21 873 1.9%4 1,644 3.6% 22 820 1.8%5 1,628 3.6% 23 811 1.8%6 1,410 3.1% 24 878 1.9%7 1,575 3.5% 25 795 1.7%8 1,106 2.4% 26 720 1.6%9 1,188 2.6% 27 730 1.6%10 1,184 2.6% 28 732 1.6%11 1,211 2.7% 29 744 1.6%12 1,220 2.7% 30 804 1.8%13 1,026 2.3% 31 775 1.7%14 915 2.0% 32 845 1.9%15 892 2.0% 33 942 2.1%16 867 1.9% 34 1,047 2.3%17 882 1.9% 35 1,561 3.4%18 795 1.7% 361 6,714 14.7%
Source: MRDA caseload tracking using the CARD database.Note: These data include months that are not counted by the federal 60-month time clock. Months are not counted if the client isan American Indian living on a reservation where 50 percent of adults are not employed or if the client is under 18 and in anapproved living situation.1 Number of Adults that have been continuously on TANF since August 1997
13 To 24 Months22.9%
25 To 35 Months21.3%
36 Months14.7%
1 To 12 Months41.1%
Percent of Adults continuously on TANF
For 36 Consecutive Months14.7%
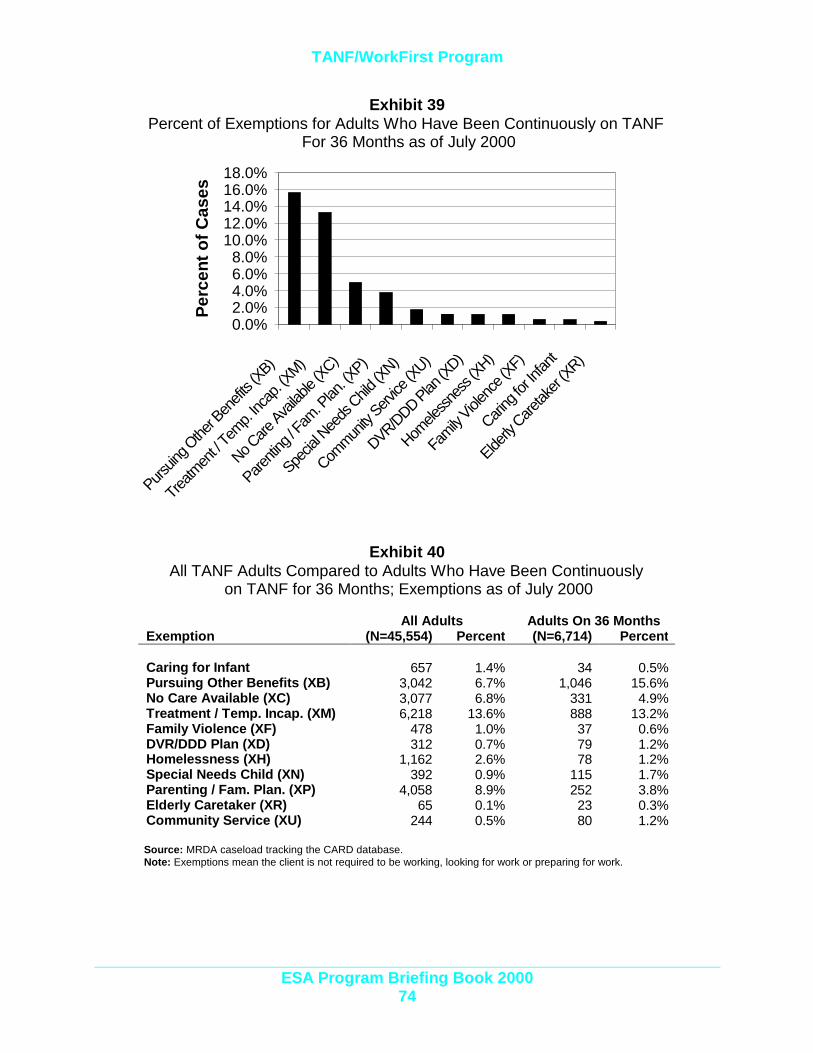
TANF/WorkFirst Program
ESA Program Briefing Book 200074
Exhibit 39Percent of Exemptions for Adults Who Have Been Continuously on TANF
For 36 Months as of July 2000
Exhibit 40All TANF Adults Compared to Adults Who Have Been Continuously
on TANF for 36 Months; Exemptions as of July 2000
All Adults Adults On 36 MonthsExemption (N=45,554) Percent (N=6,714) Percent
Caring for Infant 657 1.4% 34 0.5%Pursuing Other Benefits (XB) 3,042 6.7% 1,046 15.6%No Care Available (XC) 3,077 6.8% 331 4.9%Treatment / Temp. Incap. (XM) 6,218 13.6% 888 13.2%Family Violence (XF) 478 1.0% 37 0.6%DVR/DDD Plan (XD) 312 0.7% 79 1.2%Homelessness (XH) 1,162 2.6% 78 1.2%Special Needs Child (XN) 392 0.9% 115 1.7%Parenting / Fam. Plan. (XP) 4,058 8.9% 252 3.8%Elderly Caretaker (XR) 65 0.1% 23 0.3%Community Service (XU) 244 0.5% 80 1.2%
Source: MRDA caseload tracking the CARD database.Note: Exemptions mean the client is not required to be working, looking for work or preparing for work.
0.0%2.0%4.0%6.0%8.0%
10.0%12.0%14.0%16.0%18.0%
Pursuin
g Othe
r Ben
efits
(XB)
Treatm
ent /
Temp.
Incap
. (XM)
No Care
Availab
le (XC)
Parenti
ng / F
am. P
lan. (X
P)
Specia
l Nee
ds C
hild (X
N)
Commun
ity Serv
ice (X
U)
DVR/DDD Plan (X
D)
Homele
ssnes
s (XH)
Family
Violenc
e (XF)
Caring
for In
fant
Elderly
Caretak
er (XR)
Per
cent
of C
ases
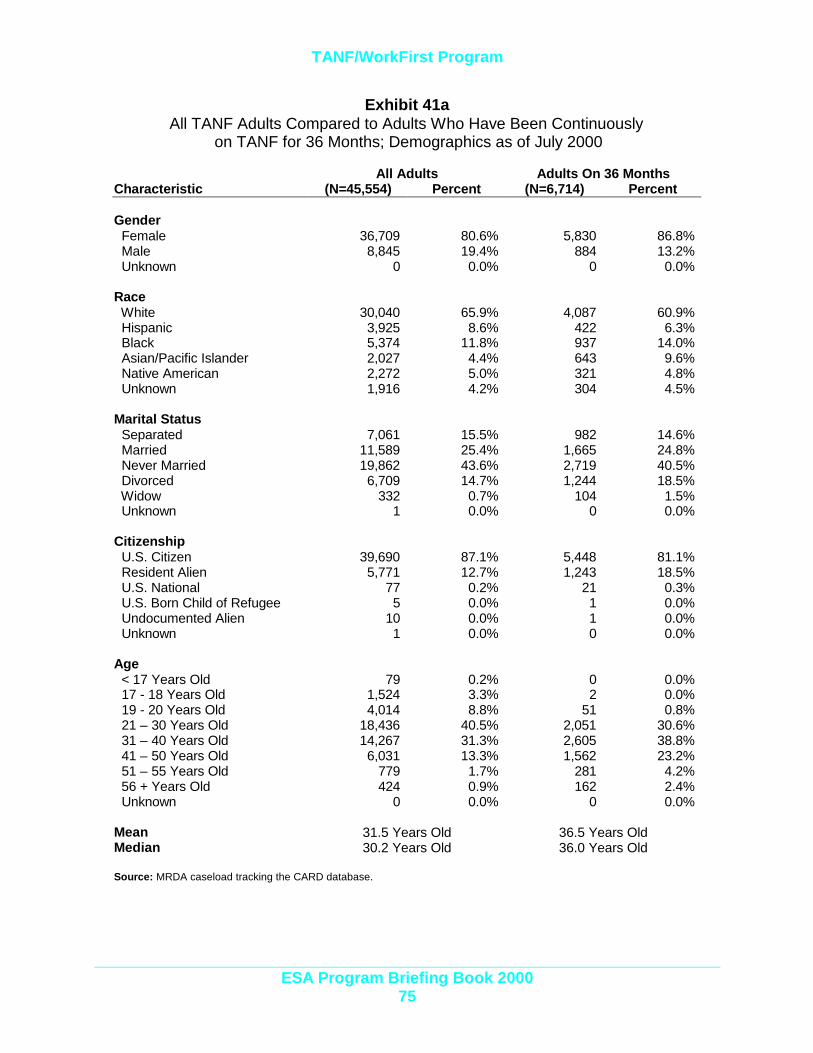
TANF/WorkFirst Program
ESA Program Briefing Book 200075
Exhibit 41aAll TANF Adults Compared to Adults Who Have Been Continuously
on TANF for 36 Months; Demographics as of July 2000
All Adults Adults On 36 MonthsCharacteristic (N=45,554) Percent (N=6,714) Percent
Gender Female 36,709 80.6% 5,830 86.8% Male 8,845 19.4% 884 13.2% Unknown 0 0.0% 0 0.0%
Race White 30,040 65.9% 4,087 60.9% Hispanic 3,925 8.6% 422 6.3% Black 5,374 11.8% 937 14.0% Asian/Pacific Islander 2,027 4.4% 643 9.6% Native American 2,272 5.0% 321 4.8% Unknown 1,916 4.2% 304 4.5%
Marital Status Separated 7,061 15.5% 982 14.6% Married 11,589 25.4% 1,665 24.8% Never Married 19,862 43.6% 2,719 40.5% Divorced 6,709 14.7% 1,244 18.5% Widow 332 0.7% 104 1.5% Unknown 1 0.0% 0 0.0%
Citizenship U.S. Citizen 39,690 87.1% 5,448 81.1% Resident Alien 5,771 12.7% 1,243 18.5% U.S. National 77 0.2% 21 0.3% U.S. Born Child of Refugee 5 0.0% 1 0.0% Undocumented Alien 10 0.0% 1 0.0% Unknown 1 0.0% 0 0.0%
Age < 17 Years Old 79 0.2% 0 0.0% 17 - 18 Years Old 1,524 3.3% 2 0.0% 19 - 20 Years Old 4,014 8.8% 51 0.8% 21 – 30 Years Old 18,436 40.5% 2,051 30.6% 31 – 40 Years Old 14,267 31.3% 2,605 38.8% 41 – 50 Years Old 6,031 13.3% 1,562 23.2% 51 – 55 Years Old 779 1.7% 281 4.2% 56 + Years Old 424 0.9% 162 2.4% Unknown 0 0.0% 0 0.0%
Mean 31.5 Years Old 36.5 Years OldMedian 30.2 Years Old 36.0 Years Old
Source: MRDA caseload tracking the CARD database.
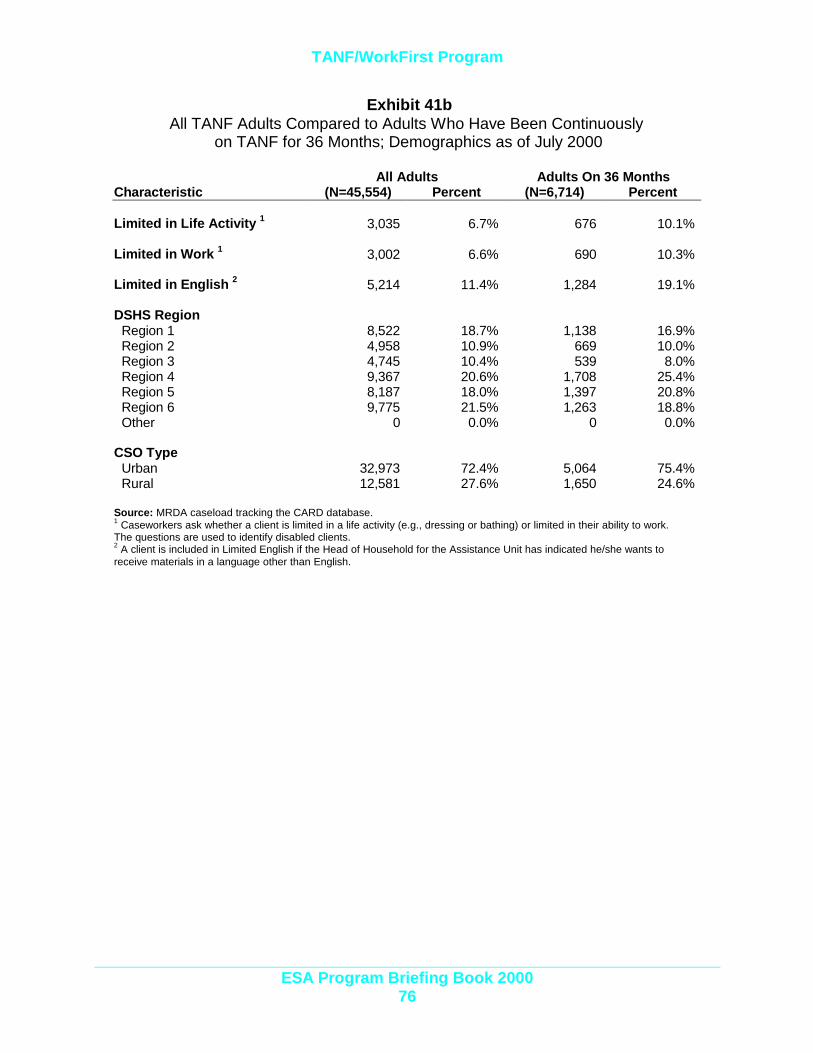
TANF/WorkFirst Program
ESA Program Briefing Book 200076
Exhibit 41bAll TANF Adults Compared to Adults Who Have Been Continuously
on TANF for 36 Months; Demographics as of July 2000
All Adults Adults On 36 MonthsCharacteristic (N=45,554) Percent (N=6,714) Percent
Limited in Life Activity 1 3,035 6.7% 676 10.1%
Limited in Work 1 3,002 6.6% 690 10.3%
Limited in English 2 5,214 11.4% 1,284 19.1%
DSHS Region Region 1 8,522 18.7% 1,138 16.9% Region 2 4,958 10.9% 669 10.0% Region 3 4,745 10.4% 539 8.0% Region 4 9,367 20.6% 1,708 25.4% Region 5 8,187 18.0% 1,397 20.8% Region 6 9,775 21.5% 1,263 18.8% Other 0 0.0% 0 0.0%
CSO Type Urban 32,973 72.4% 5,064 75.4% Rural 12,581 27.6% 1,650 24.6%
Source: MRDA caseload tracking the CARD database.1 Caseworkers ask whether a client is limited in a life activity (e.g., dressing or bathing) or limited in their ability to work.The questions are used to identify disabled clients.2 A client is included in Limited English if the Head of Household for the Assistance Unit has indicated he/she wants toreceive materials in a language other than English.
Child Support
Exhibits Page
1. Child Support Incentive ScorecardSFY 1999 and 2000 .............................................................................. 79
2. Child Support Caseload and CollectionsJuly 1998 to June 2000........................................................................ 80
3. Child Support Caseload by TypeOctober 1998 to June 2000 ................................................................. 81
4. Child Support CollectionsActual and Projected SFY 1999 – SFY 2000 ...................................... 82
5. Child Support Collections by Case TypeMarch 1998 to June 2000 .................................................................... 82
6. Non-Custodial Parents by GenderAugust 2000 ......................................................................................... 83
7. Non-Custodial Parents by AgeAugust 2000 ......................................................................................... 83
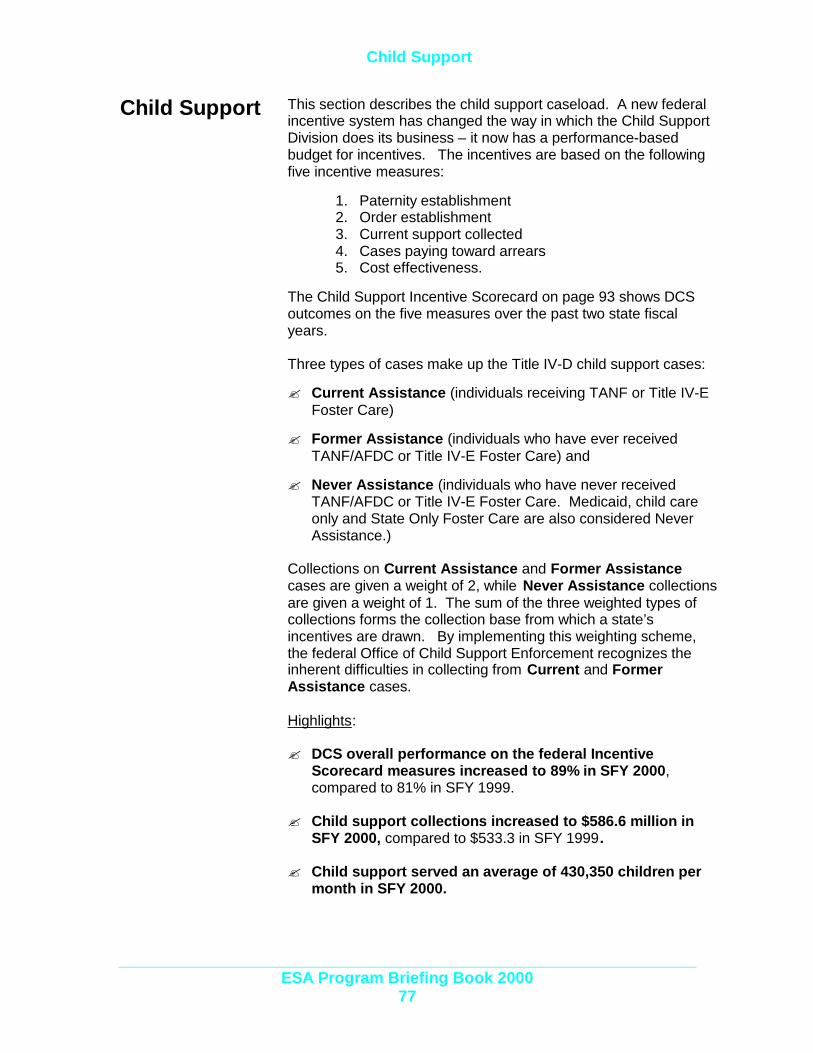
Child Support
ESA Program Briefing Book 200077
Child Support This section describes the child support caseload. A new federalincentive system has changed the way in which the Child SupportDivision does its business – it now has a performance-basedbudget for incentives. The incentives are based on the followingfive incentive measures:
1. Paternity establishment2. Order establishment3. Current support collected4. Cases paying toward arrears5. Cost effectiveness.
The Child Support Incentive Scorecard on page 93 shows DCSoutcomes on the five measures over the past two state fiscalyears.
Three types of cases make up the Title IV-D child support cases:
? Current Assistance (individuals receiving TANF or Title IV-EFoster Care)
? Former Assistance (individuals who have ever receivedTANF/AFDC or Title IV-E Foster Care) and
? Never Assistance (individuals who have never receivedTANF/AFDC or Title IV-E Foster Care. Medicaid, child careonly and State Only Foster Care are also considered NeverAssistance.)
Collections on Current Assistance and Former Assistancecases are given a weight of 2, while Never Assistance collectionsare given a weight of 1. The sum of the three weighted types ofcollections forms the collection base from which a state’sincentives are drawn. By implementing this weighting scheme,the federal Office of Child Support Enforcement recognizes theinherent difficulties in collecting from Current and FormerAssistance cases.
Highlights:
? DCS overall performance on the federal IncentiveScorecard measures increased to 89% in SFY 2000,compared to 81% in SFY 1999.
? Child support collections increased to $586.6 million inSFY 2000, compared to $533.3 in SFY 1999.
? Child support served an average of 430,350 children permonth in SFY 2000.

Child Support
ESA Program Briefing Book 200078
Child SupportContinued
? The average monthly Child Support IV-D caseloaddecreased slightly in SFY 2000 (322,988 cases), comparedto SFY 1999 (323,214 cases). The drop in current assistancecases is responsible for most of this decline. Other factorsthat could contribute to a shrinking caseload include: caseclosure for those no longer receiving assistance, an agingpopulation, decreasing non-marital births and divorce.
? Current Assistance declined by 11,326 cases from SFY1999 to SFY 2000, more than 16 percent in one year.
? The majority (87.5%) of non-custodial parents is male and24-39 years old (54.9%).
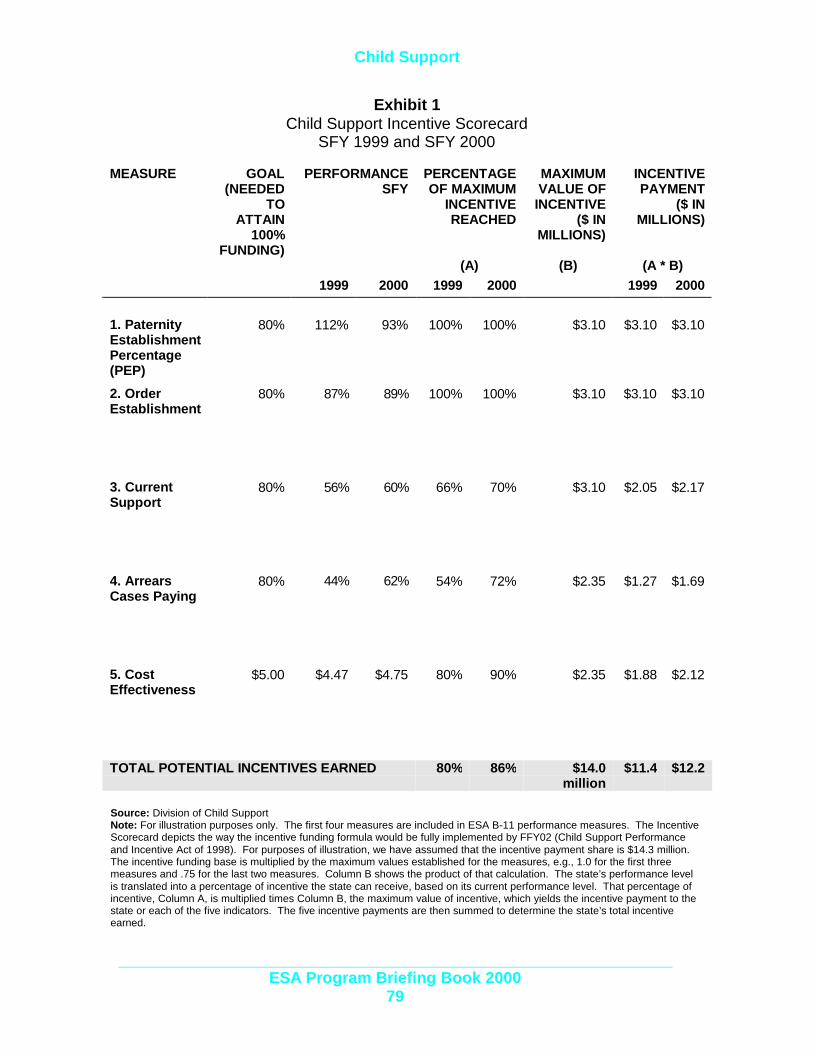
Child Support
ESA Program Briefing Book 200079
Exhibit 1Child Support Incentive Scorecard
SFY 1999 and SFY 2000
MEASURE GOAL(NEEDED
TOATTAIN
100%FUNDING)
PERFORMANCE SFY
PERCENTAGEOF MAXIMUM
INCENTIVEREACHED
MAXIMUMVALUE OF
INCENTIVE($ IN
MILLIONS)
INCENTIVEPAYMENT
($ INMILLIONS)
(A) (B) (A * B)1999 2000 1999 2000 1999 2000
1. PaternityEstablishmentPercentage(PEP)
80% 112% 93% 100% 100% $3.10 $3.10 $3.10
2. OrderEstablishment
80% 87% 89% 100% 100% $3.10 $3.10 $3.10
3. CurrentSupport
80% 56% 60% 66% 70% $3.10 $2.05 $2.17
4. ArrearsCases Paying
80% 44% 62% 54% 72% $2.35 $1.27 $1.69
5. CostEffectiveness
$5.00 $4.47 $4.75 80% 90% $2.35 $1.88 $2.12
TOTAL POTENTIAL INCENTIVES EARNED 80% 86% $14.0million
$11.4 $12.2
Source: Division of Child SupportNote: For illustration purposes only. The first four measures are included in ESA B-11 performance measures. The IncentiveScorecard depicts the way the incentive funding formula would be fully implemented by FFY02 (Child Support Performanceand Incentive Act of 1998). For purposes of illustration, we have assumed that the incentive payment share is $14.3 million.The incentive funding base is multiplied by the maximum values established for the measures, e.g., 1.0 for the first threemeasures and .75 for the last two measures. Column B shows the product of that calculation. The state’s performance levelis translated into a percentage of incentive the state can receive, based on its current performance level. That percentage ofincentive, Column A, is multiplied times Column B, the maximum value of incentive, which yields the incentive payment to thestate or each of the five indicators. The five incentive payments are then summed to determine the state’s total incentiveearned.
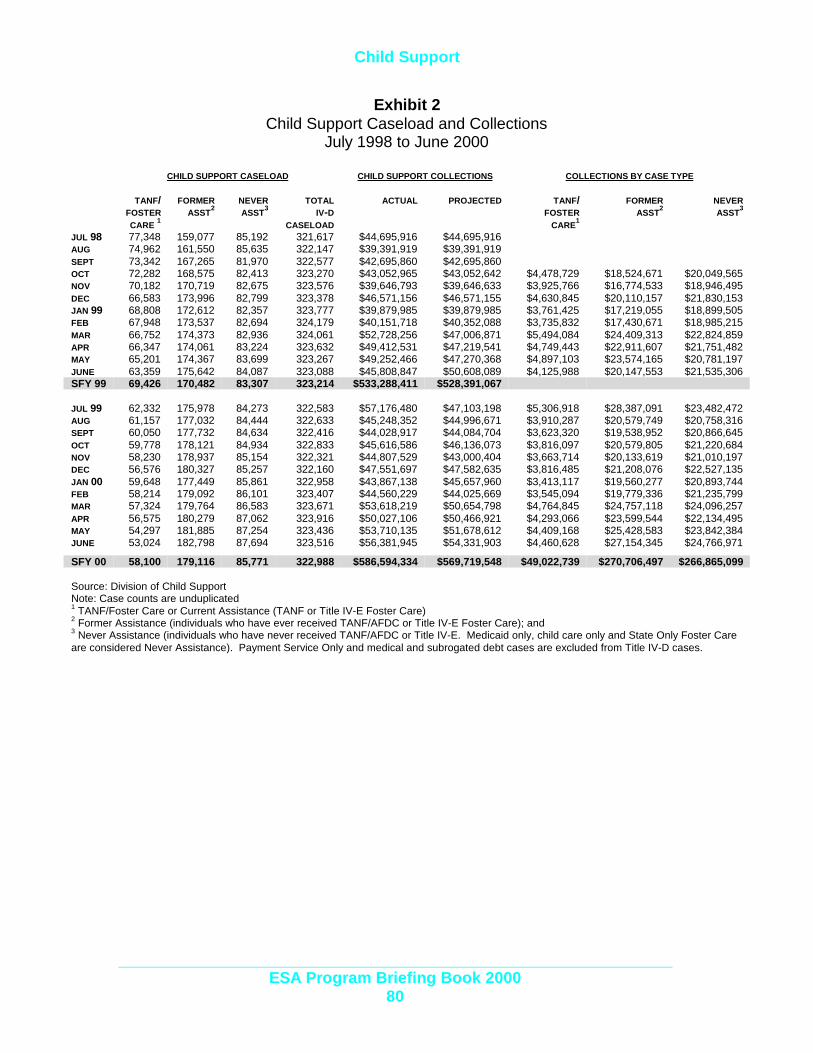
Child Support
ESA Program Briefing Book 200080
Exhibit 2Child Support Caseload and Collections
July 1998 to June 2000
CHILD SUPPORT CASELOAD CHILD SUPPORT COLLECTIONS COLLECTIONS BY CASE TYPE
TANF/FOSTERCARE 1
FORMERASST2
NEVERASST3
TOTALIV-D
CASELOAD
ACTUAL PROJECTED TANF/FOSTER CARE1
FORMER ASST2
NEVER ASST3
JUL 98 77,348 159,077 85,192 321,617 $44,695,916 $44,695,916AUG 74,962 161,550 85,635 322,147 $39,391,919 $39,391,919SEPT 73,342 167,265 81,970 322,577 $42,695,860 $42,695,860OCT 72,282 168,575 82,413 323,270 $43,052,965 $43,052,642 $4,478,729 $18,524,671 $20,049,565NOV 70,182 170,719 82,675 323,576 $39,646,793 $39,646,633 $3,925,766 $16,774,533 $18,946,495DEC 66,583 173,996 82,799 323,378 $46,571,156 $46,571,155 $4,630,845 $20,110,157 $21,830,153JAN 99 68,808 172,612 82,357 323,777 $39,879,985 $39,879,985 $3,761,425 $17,219,055 $18,899,505FEB 67,948 173,537 82,694 324,179 $40,151,718 $40,352,088 $3,735,832 $17,430,671 $18,985,215MAR 66,752 174,373 82,936 324,061 $52,728,256 $47,006,871 $5,494,084 $24,409,313 $22,824,859APR 66,347 174,061 83,224 323,632 $49,412,531 $47,219,541 $4,749,443 $22,911,607 $21,751,482MAY 65,201 174,367 83,699 323,267 $49,252,466 $47,270,368 $4,897,103 $23,574,165 $20,781,197JUNE 63,359 175,642 84,087 323,088 $45,808,847 $50,608,089 $4,125,988 $20,147,553 $21,535,306SFY 99 69,426 170,482 83,307 323,214 $533,288,411 $528,391,067
JUL 99 62,332 175,978 84,273 322,583 $57,176,480 $47,103,198 $5,306,918 $28,387,091 $23,482,472AUG 61,157 177,032 84,444 322,633 $45,248,352 $44,996,671 $3,910,287 $20,579,749 $20,758,316SEPT 60,050 177,732 84,634 322,416 $44,028,917 $44,084,704 $3,623,320 $19,538,952 $20,866,645OCT 59,778 178,121 84,934 322,833 $45,616,586 $46,136,073 $3,816,097 $20,579,805 $21,220,684NOV 58,230 178,937 85,154 322,321 $44,807,529 $43,000,404 $3,663,714 $20,133,619 $21,010,197DEC 56,576 180,327 85,257 322,160 $47,551,697 $47,582,635 $3,816,485 $21,208,076 $22,527,135JAN 00 59,648 177,449 85,861 322,958 $43,867,138 $45,657,960 $3,413,117 $19,560,277 $20,893,744FEB 58,214 179,092 86,101 323,407 $44,560,229 $44,025,669 $3,545,094 $19,779,336 $21,235,799MAR 57,324 179,764 86,583 323,671 $53,618,219 $50,654,798 $4,764,845 $24,757,118 $24,096,257APR 56,575 180,279 87,062 323,916 $50,027,106 $50,466,921 $4,293,066 $23,599,544 $22,134,495MAY 54,297 181,885 87,254 323,436 $53,710,135 $51,678,612 $4,409,168 $25,428,583 $23,842,384JUNE 53,024 182,798 87,694 323,516 $56,381,945 $54,331,903 $4,460,628 $27,154,345 $24,766,971
SFY 00 58,100 179,116 85,771 322,988 $586,594,334 $569,719,548 $49,022,739 $270,706,497 $266,865,099
Source: Division of Child SupportNote: Case counts are unduplicated1 TANF/Foster Care or Current Assistance (TANF or Title IV-E Foster Care)2 Former Assistance (individuals who have ever received TANF/AFDC or Title IV-E Foster Care); and3 Never Assistance (individuals who have never received TANF/AFDC or Title IV-E. Medicaid only, child care only and State Only Foster Careare considered Never Assistance). Payment Service Only and medical and subrogated debt cases are excluded from Title IV-D cases.
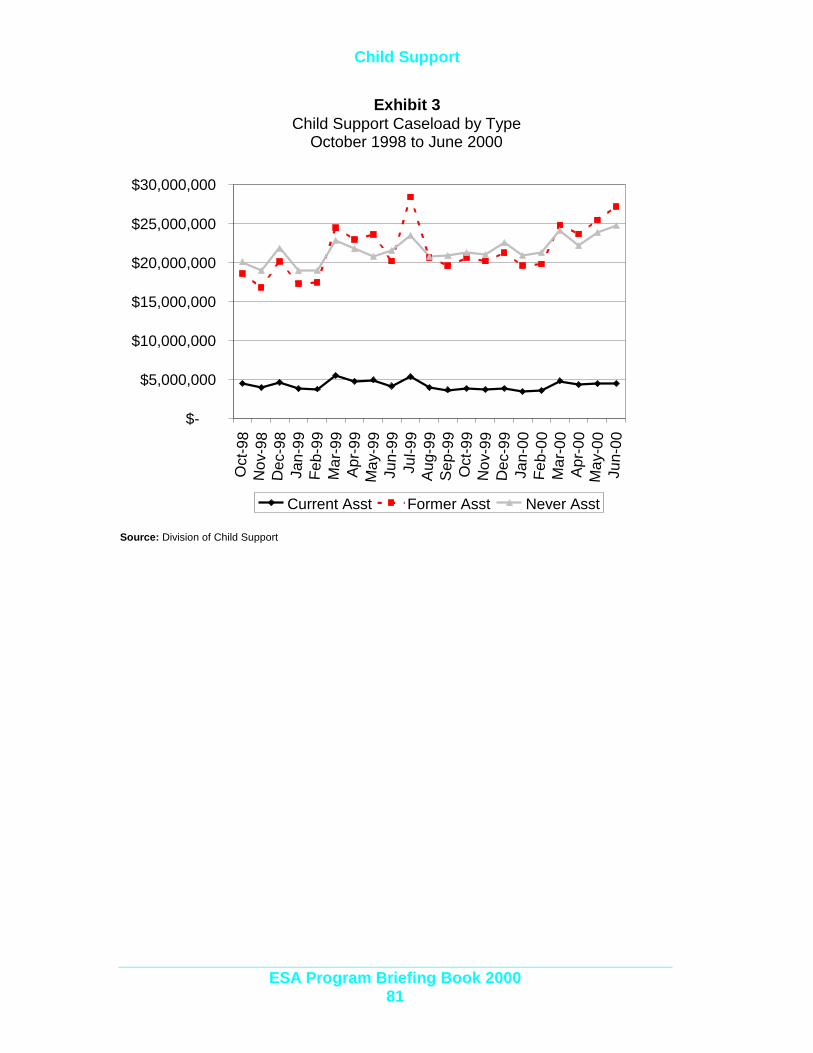
Child Support
ESA Program Briefing Book 200081
Exhibit 3Child Support Caseload by Type
October 1998 to June 2000
Source: Division of Child Support
$-
$5,000,000
$10,000,000
$15,000,000
$20,000,000
$25,000,000
$30,000,000
Oct
-98
Nov
-98
Dec
-98
Jan-
99Fe
b-99
Mar
-99
Apr
-99
May
-99
Jun-
99Ju
l-99
Aug
-99
Sep
-99
Oct
-99
Nov
-99
Dec
-99
Jan-
00Fe
b-00
Mar
-00
Apr
-00
May
-00
Jun-
00
Current Asst Former Asst Never Asst
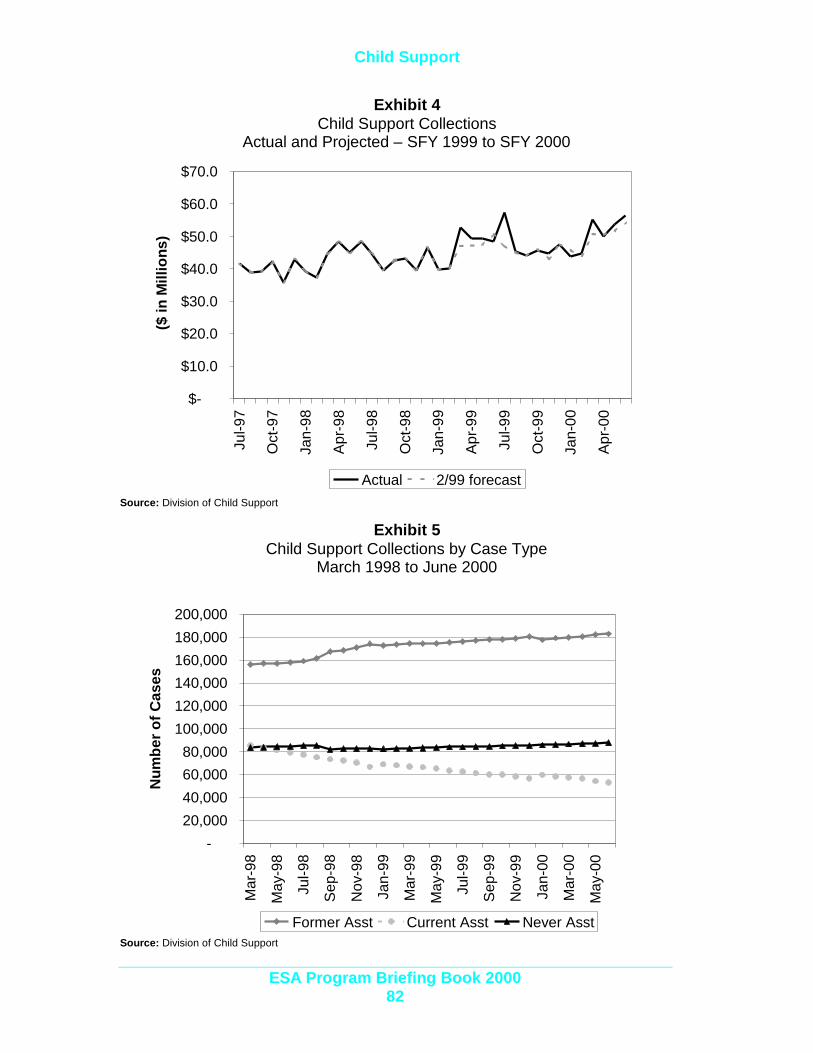
Child Support
ESA Program Briefing Book 200082
Exhibit 4Child Support Collections
Actual and Projected – SFY 1999 to SFY 2000
Source: Division of Child Support
Exhibit 5Child Support Collections by Case Type
March 1998 to June 2000
Source: Division of Child Support
$-
$10.0
$20.0
$30.0
$40.0
$50.0
$60.0
$70.0
Jul-9
7
Oct
-97
Jan-
98
Apr
-98
Jul-9
8
Oct
-98
Jan-
99
Apr
-99
Jul-9
9
Oct
-99
Jan-
00
Apr
-00
($ in
Mill
ions
)
Actual 2/99 forecast
-20,00040,00060,00080,000
100,000120,000140,000160,000180,000200,000
Mar
-98
May
-98
Jul-9
8
Sep
-98
Nov
-98
Jan-
99
Mar
-99
May
-99
Jul-9
9
Sep
-99
Nov
-99
Jan-
00
Mar
-00
May
-00
Num
ber
of C
ases
Former Asst Current Asst Never Asst
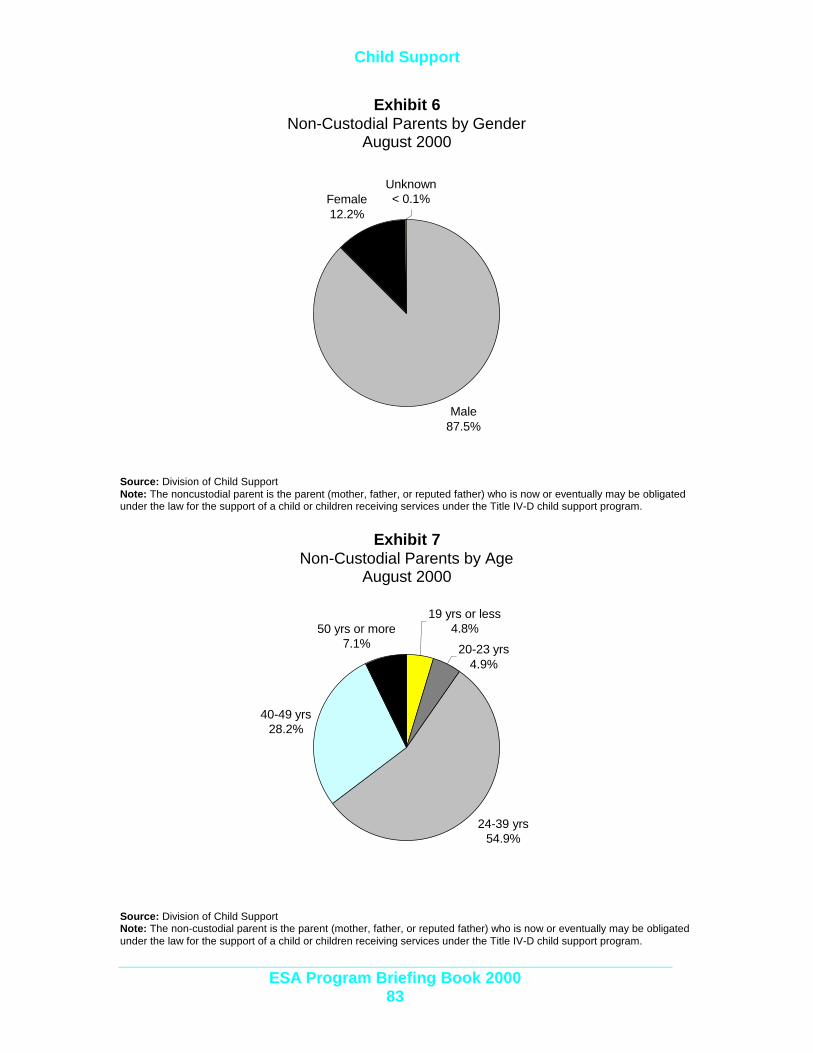
Child Support
ESA Program Briefing Book 200083
Exhibit 6Non-Custodial Parents by Gender
August 2000
Source: Division of Child SupportNote: The noncustodial parent is the parent (mother, father, or reputed father) who is now or eventually may be obligatedunder the law for the support of a child or children receiving services under the Title IV-D child support program.
Exhibit 7Non-Custodial Parents by Age
August 2000
Source: Division of Child SupportNote: The non-custodial parent is the parent (mother, father, or reputed father) who is now or eventually may be obligatedunder the law for the support of a child or children receiving services under the Title IV-D child support program.
19 yrs or less4.8%
20-23 yrs4.9%
24-39 yrs54.9%
40-49 yrs28.2%
50 yrs or more7.1%
Male87.5%
Female12.2%
Unknown< 0.1%

Working Connections Child Care
Exhibits Page
1. Working Connections Child Care (WCCC) Cases (Chart)SFY 1998 to SFY 2000 ......................................................................... 86
2. Working Connections Child Care (WCCC) Cases (Table)SFY 1998 to SFY 2000 ......................................................................... 86
3. Working Connections Child Care, by type (Chart)SFY 1998 to SFY 2000 ......................................................................... 87
4. Working Connections Child Care, by type (Table)SFY 1998 to SFY 2000 ........................................................................ 87
5. Percent of TANF Cases Receiving Working ConnectionsChild Care (WCCC) SFY 2000 ............................................................. 88
6. TANF Cases Receiving Working ConnectionsChild Care (WCCC) SFY 2000 ............................................................. 88
7. Children Served by Working Connections Child Care (Chart)SFY 1998 to SFY 2000 ......................................................................... 89
8. Children Served by Working Connections Child Care (Table)SFY 1998 to SFY 2000 ......................................................................... 89
9. Children Served by Working Connections Child Care (Chart)by type SFY 1998 to SFY 2000............................................................ 90
10. Children Served by Working Connections Child Care (Table)by type SFY 1998 to SFY 2000............................................................ 90
11. Average Monthly Percent of Children Using WorkingConnections Child Care by Facility Type SFY 2000 ......................... 91
12. Number of Children Using Working ConnectionsChild Care by Facility Type SFY 2000................................................ 91
13. Average Monthly Percent of Children Under 12 Monthsof Age Using Working Connections Child Care................................ 92by Facility Type SFY 2000
14. Number of Children Under 12 Months of Age UsingWorking Connections Child Care by Facility TypeSFY 2000 .............................................................................................. 92
Working Connections Child Care
ESA Program Briefing Book 200085
WorkingConnectionsChild Care
The exhibits in this section summarize Working ConnectionsChild Care (WCCC). The program provides child caresubsidies for families, whose incomes are at or below 225% ofthe federal poverty level, in which adults are working, lookingfor work, or enrolled in an approved training program whileworking.
Highlights:
? The average monthly caseload of children served byWCCC for SFY 2000 was 33,978, compared to 30,166 forSFY 1999.
? The number of non-TANF cases using child careincreased by 33.7% from fiscal year 1999 to fiscal year2000; while the number of TANF cases served by WCCCdeclined by 15.5%.
? During fiscal year 2000, more families used center-based care than any other type of care. This was thepattern of all WCCC utilization by type:? 39% of the cases used center-based care;? 24% used licensed family homes;? 13% placed their children in a relative’s home;? 13% had a relative care for their children in the? child’s home; and? 11% used in-home care by a non-relative
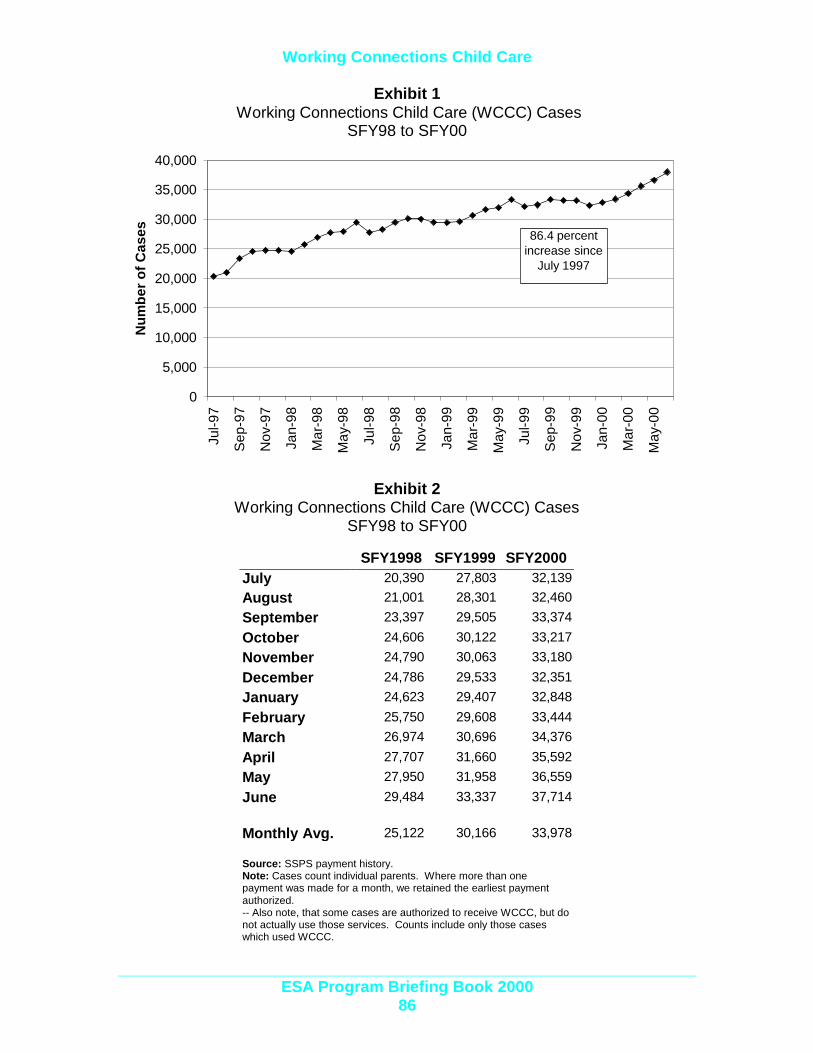
Working Connections Child Care
ESA Program Briefing Book 200086
Exhibit 1 Working Connections Child Care (WCCC) Cases
SFY98 to SFY00
Exhibit 2Working Connections Child Care (WCCC) Cases
SFY98 to SFY00
SFY1998 SFY1999 SFY2000July 20,390 27,803 32,139August 21,001 28,301 32,460September 23,397 29,505 33,374October 24,606 30,122 33,217November 24,790 30,063 33,180December 24,786 29,533 32,351January 24,623 29,407 32,848February 25,750 29,608 33,444March 26,974 30,696 34,376April 27,707 31,660 35,592May 27,950 31,958 36,559June 29,484 33,337 37,714
Monthly Avg. 25,122 30,166 33,978
Source: SSPS payment history.Note: Cases count individual parents. Where more than onepayment was made for a month, we retained the earliest paymentauthorized.-- Also note, that some cases are authorized to receive WCCC, but donot actually use those services. Counts include only those caseswhich used WCCC.
0
5,000
10,000
15,000
20,000
25,000
30,000
35,000
40,000
Jul-9
7
Sep
-97
Nov
-97
Jan-
98
Mar
-98
May
-98
Jul-9
8
Sep
-98
Nov
-98
Jan-
99
Mar
-99
May
-99
Jul-9
9
Sep
-99
Nov
-99
Jan-
00
Mar
-00
May
-00
Num
ber
of C
ases 86.4 percent
increase sinceJuly 1997
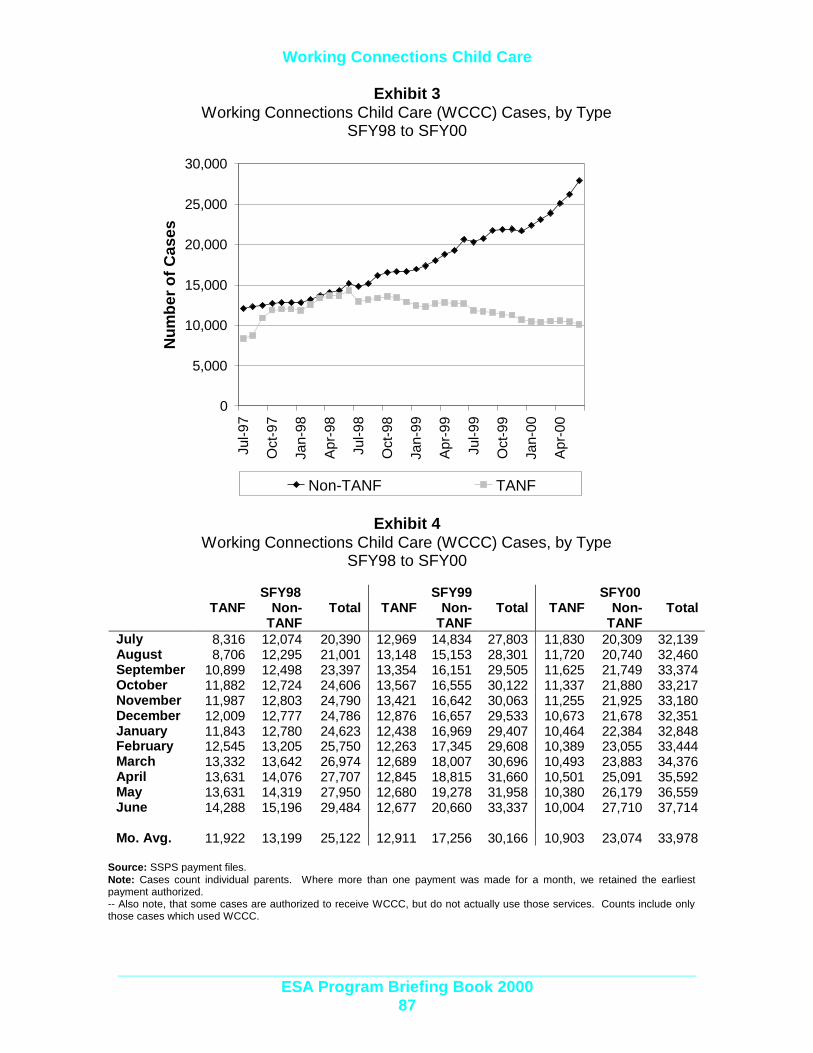
Working Connections Child Care
ESA Program Briefing Book 200087
Exhibit 3Working Connections Child Care (WCCC) Cases, by Type
SFY98 to SFY00
Exhibit 4Working Connections Child Care (WCCC) Cases, by Type
SFY98 to SFY00
SFY98 SFY99 SFY00TANF Non-
TANFTotal TANF Non-
TANFTotal TANF Non-
TANFTotal
July 8,316 12,074 20,390 12,969 14,834 27,803 11,830 20,309 32,139August 8,706 12,295 21,001 13,148 15,153 28,301 11,720 20,740 32,460September 10,899 12,498 23,397 13,354 16,151 29,505 11,625 21,749 33,374October 11,882 12,724 24,606 13,567 16,555 30,122 11,337 21,880 33,217November 11,987 12,803 24,790 13,421 16,642 30,063 11,255 21,925 33,180December 12,009 12,777 24,786 12,876 16,657 29,533 10,673 21,678 32,351January 11,843 12,780 24,623 12,438 16,969 29,407 10,464 22,384 32,848February 12,545 13,205 25,750 12,263 17,345 29,608 10,389 23,055 33,444March 13,332 13,642 26,974 12,689 18,007 30,696 10,493 23,883 34,376April 13,631 14,076 27,707 12,845 18,815 31,660 10,501 25,091 35,592May 13,631 14,319 27,950 12,680 19,278 31,958 10,380 26,179 36,559June 14,288 15,196 29,484 12,677 20,660 33,337 10,004 27,710 37,714
Mo. Avg. 11,922 13,199 25,122 12,911 17,256 30,166 10,903 23,074 33,978
Source: SSPS payment files.Note: Cases count individual parents. Where more than one payment was made for a month, we retained the earliestpayment authorized.-- Also note, that some cases are authorized to receive WCCC, but do not actually use those services. Counts include onlythose cases which used WCCC.
0
5,000
10,000
15,000
20,000
25,000
30,000
Jul-9
7
Oct
-97
Jan-
98
Apr
-98
Jul-9
8
Oct
-98
Jan-
99
Apr
-99
Jul-9
9
Oct
-99
Jan-
00
Apr
-00
Num
ber
of C
ases
Non-TANF TANF

Working Connections Child Care
ESA Program Briefing Book 200088
Exhibit 5Percent of TANF Cases Receiving
Working Connections Child Care (WCCC)SFY00
Exhibit 6TANF Cases Receiving Working Connections Child Care (WCCC)
SFY00
TANFCases1
WCCC CasesReceiving
TANF2
Percent ofTANF Cases
ReceivingChild Care
Jul-99 59,472 11,830 19.9%Aug-99 60,054 11,720 19.5%Sep-99 59,827 11,625 19.4%Oct-99 59,346 11,337 19.1%Nov-99 59,124 11,255 19.0%Dec-99 59,290 10,673 18.0%Jan-00 58,877 10,464 17.8%Feb-00 59,563 10,389 17.4%Mar-00 59,254 10,493 17.7%Apr-00 57,927 10,501 18.1%May-00 56,562 10,380 18.4%Jun-00 55,369 10,004 18.1%
1 Source: CARD Cases and Persons Expenditures Report. Includes child-only and GA-Scases.2 Source: SSPS payment files.
Note: Cases count individual parents. Where more than one payment was made for amonth, we retained the earliest payment authorized.
-- Also note, that some cases are authorized to receive WCCC, but do not actually usethose services. Counts include only those cases which used WCCC.
16.0%
16.5%
17.0%
17.5%
18.0%
18.5%
19.0%
19.5%
20.0%
20.5%
Jul-9
9
Aug
-99
Sep
-99
Oct
-99
Nov
-99
Dec
-99
Jan-
00
Feb-
00
Mar
-00
Apr
-00
May
-00
Jun-
00
Per
cent
of C
ases
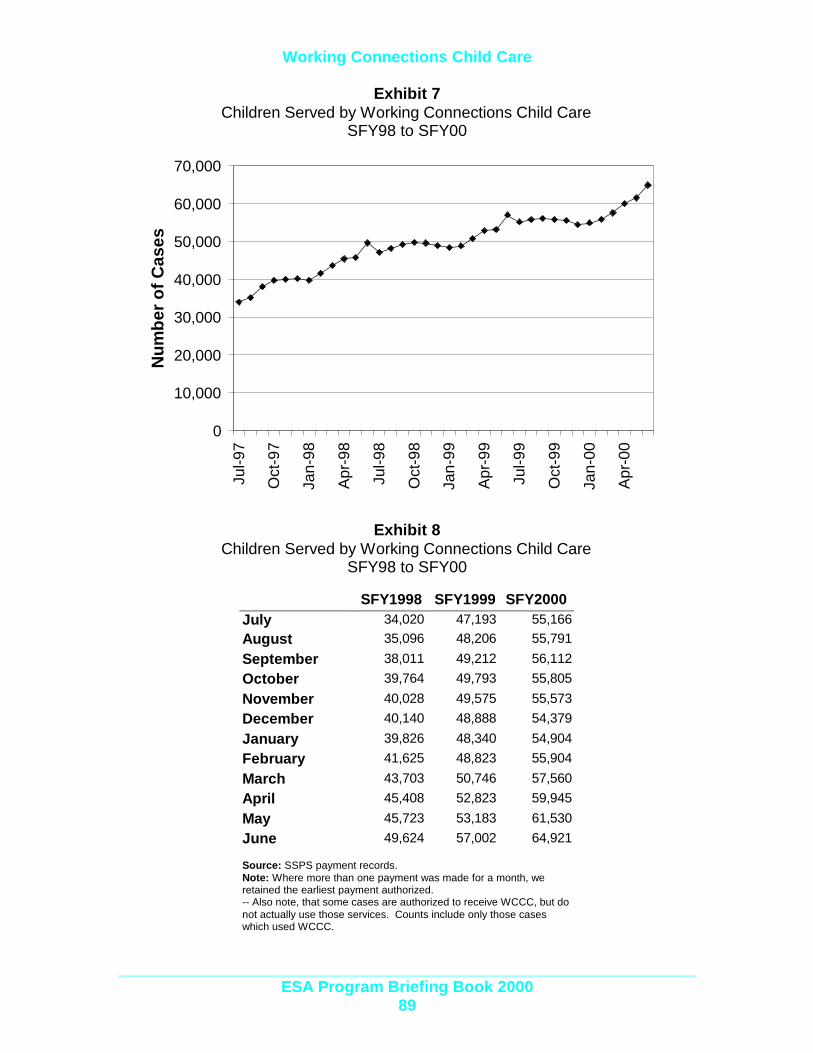
Working Connections Child Care
ESA Program Briefing Book 200089
Exhibit 7Children Served by Working Connections Child Care
SFY98 to SFY00
Exhibit 8Children Served by Working Connections Child Care
SFY98 to SFY00
SFY1998 SFY1999 SFY2000July 34,020 47,193 55,166August 35,096 48,206 55,791September 38,011 49,212 56,112October 39,764 49,793 55,805November 40,028 49,575 55,573December 40,140 48,888 54,379January 39,826 48,340 54,904February 41,625 48,823 55,904March 43,703 50,746 57,560April 45,408 52,823 59,945May 45,723 53,183 61,530June 49,624 57,002 64,921
Source: SSPS payment records.Note: Where more than one payment was made for a month, weretained the earliest payment authorized.-- Also note, that some cases are authorized to receive WCCC, but donot actually use those services. Counts include only those caseswhich used WCCC.
0
10,000
20,000
30,000
40,000
50,000
60,000
70,000
Jul-9
7
Oct
-97
Jan-
98
Apr
-98
Jul-9
8
Oct
-98
Jan-
99
Apr
-99
Jul-9
9
Oct
-99
Jan-
00
Apr
-00
Num
ber
of C
ases
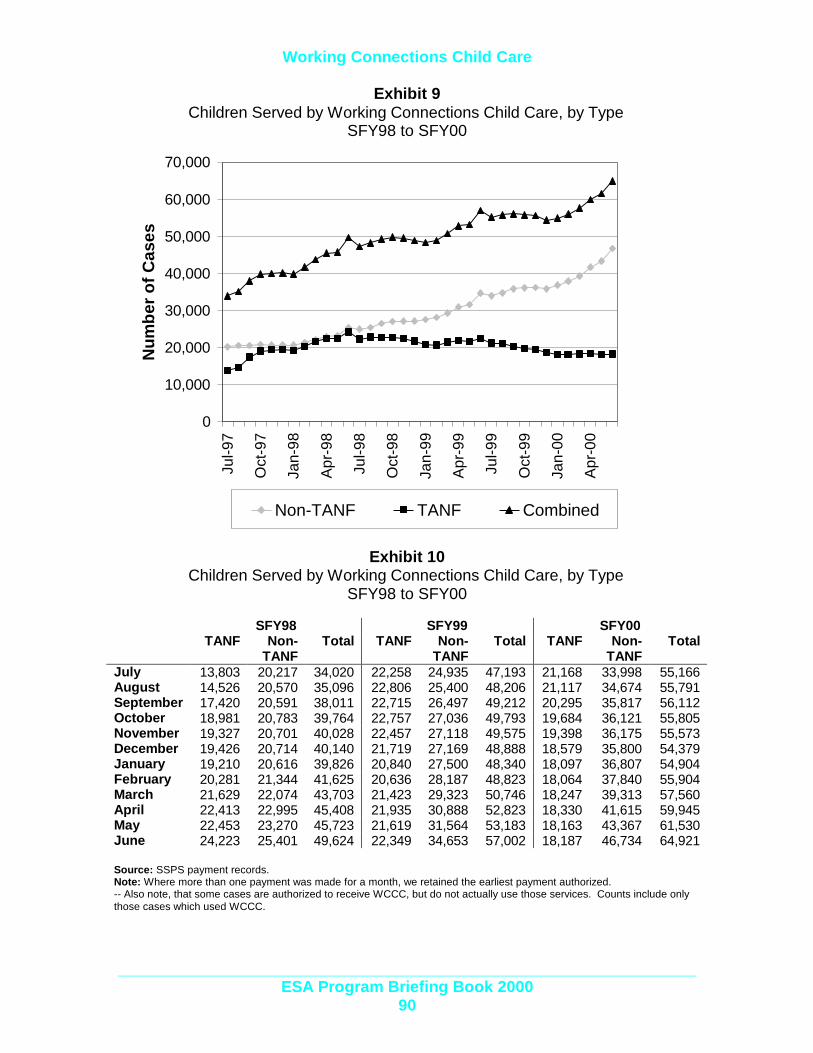
Working Connections Child Care
ESA Program Briefing Book 200090
Exhibit 9Children Served by Working Connections Child Care, by Type
SFY98 to SFY00
Exhibit 10Children Served by Working Connections Child Care, by Type
SFY98 to SFY00
SFY98 SFY99 SFY00TANF Non-
TANFTotal TANF Non-
TANFTotal TANF Non-
TANFTotal
July 13,803 20,217 34,020 22,258 24,935 47,193 21,168 33,998 55,166August 14,526 20,570 35,096 22,806 25,400 48,206 21,117 34,674 55,791September 17,420 20,591 38,011 22,715 26,497 49,212 20,295 35,817 56,112October 18,981 20,783 39,764 22,757 27,036 49,793 19,684 36,121 55,805November 19,327 20,701 40,028 22,457 27,118 49,575 19,398 36,175 55,573December 19,426 20,714 40,140 21,719 27,169 48,888 18,579 35,800 54,379January 19,210 20,616 39,826 20,840 27,500 48,340 18,097 36,807 54,904February 20,281 21,344 41,625 20,636 28,187 48,823 18,064 37,840 55,904March 21,629 22,074 43,703 21,423 29,323 50,746 18,247 39,313 57,560April 22,413 22,995 45,408 21,935 30,888 52,823 18,330 41,615 59,945May 22,453 23,270 45,723 21,619 31,564 53,183 18,163 43,367 61,530June 24,223 25,401 49,624 22,349 34,653 57,002 18,187 46,734 64,921
Source: SSPS payment records.Note: Where more than one payment was made for a month, we retained the earliest payment authorized.-- Also note, that some cases are authorized to receive WCCC, but do not actually use those services. Counts include onlythose cases which used WCCC.
0
10,000
20,000
30,000
40,000
50,000
60,000
70,000
Jul-9
7
Oct
-97
Jan-
98
Apr
-98
Jul-9
8
Oct
-98
Jan-
99
Apr
-99
Jul-9
9
Oct
-99
Jan-
00
Apr
-00
Num
ber
of C
ases
Non-TANF TANF Combined

Working Connections Child Care
ESA Program Briefing Book 200091
Exhibit 11Average Monthly Percent of Children
Using Working Connections Child Care by Facility Type SFY00
Exhibit 12Number of Children Using Working Connections Child Care by Facility Type
SFY00
Center
LicensedFamilyHome
RelativeHome
Child’sHome
Non-Relative
Child’sHome
RelativeJul-99 20,801 12,860 7,841 6,622 7,434Aug-99 20,984 12,997 7,889 6,886 7,708Sep-99 21,804 13,426 7,636 6,609 7,476Oct-99 21,766 13,227 7,383 6,435 7,534Nov-99 21,875 13,047 7,136 6,428 7,599Dec-99 21,599 12,694 6,849 6,179 7,474Jan-00 22,097 12,946 6,757 6,097 7,352Feb-00 22,801 13,298 6,728 6,056 7,332Mar-00 23,544 13,933 6,807 6,118 7,431Apr-00 24,301 14,681 7,172 6,291 7,715May-00 24,834 15,244 7,282 6,504 7,882Jun-00 26,256 16,096 7,887 6,795 8,152
Mo. Avg. 22,722 13,704 7,281 6,418 7,591Mo. Pct. 39% 24% 13% 11% 13%
Source: SSPS payment records.Note: Where more than one payment was made for a month, we retained the earliest paymentauthorized.
Relative Home13%
Child's Home Non-Relative
11%
Child's Home Relative
13%
Centers39%
Family Homes24%
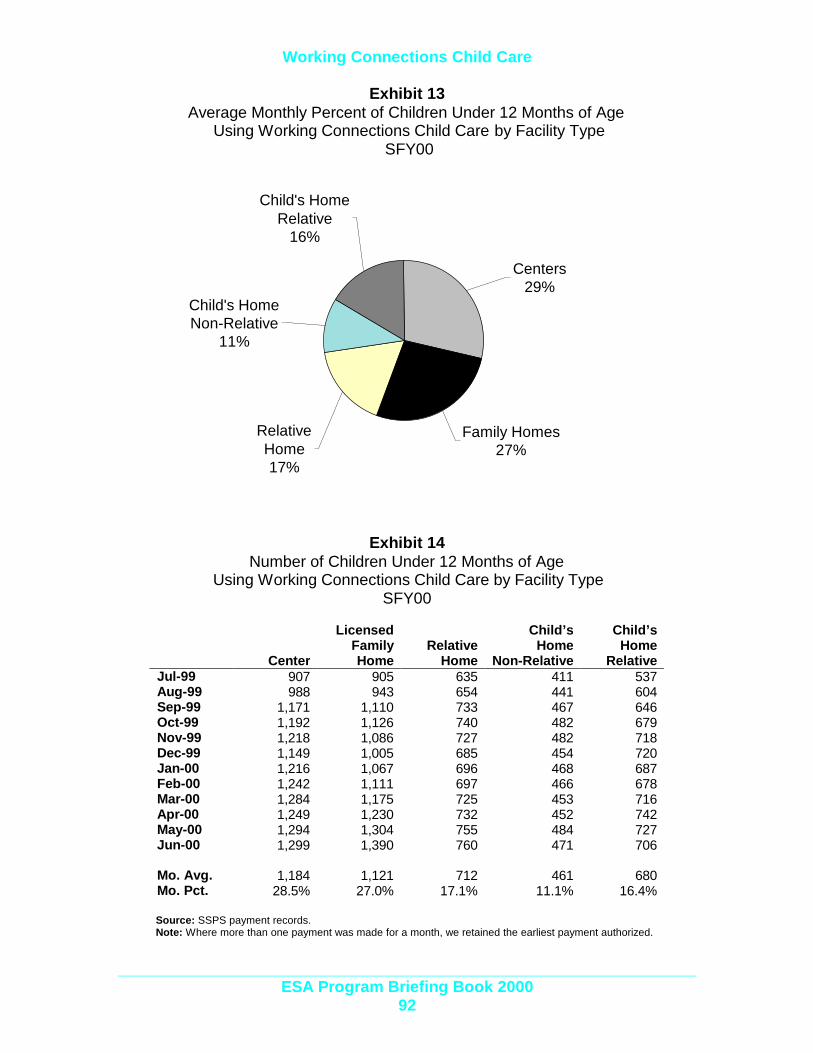
Working Connections Child Care
ESA Program Briefing Book 200092
Exhibit 13Average Monthly Percent of Children Under 12 Months of Age
Using Working Connections Child Care by Facility Type SFY00
Exhibit 14Number of Children Under 12 Months of Age
Using Working Connections Child Care by Facility TypeSFY00
Center
LicensedFamilyHome
RelativeHome
Child’sHome
Non-Relative
Child’sHome
RelativeJul-99 907 905 635 411 537Aug-99 988 943 654 441 604Sep-99 1,171 1,110 733 467 646Oct-99 1,192 1,126 740 482 679Nov-99 1,218 1,086 727 482 718Dec-99 1,149 1,005 685 454 720Jan-00 1,216 1,067 696 468 687Feb-00 1,242 1,111 697 466 678Mar-00 1,284 1,175 725 453 716Apr-00 1,249 1,230 732 452 742May-00 1,294 1,304 755 484 727Jun-00 1,299 1,390 760 471 706
Mo. Avg. 1,184 1,121 712 461 680Mo. Pct. 28.5% 27.0% 17.1% 11.1% 16.4%
Source: SSPS payment records.Note: Where more than one payment was made for a month, we retained the earliest payment authorized.
Child's Home Relative
16%
Child's Home Non-Relative
11%
Relative Home17%
Centers29%
Family Homes27%

Food Assistance
Exhibits Page
1. Selected Food Assistance Program CharacteristicsSFY 1999 and SFY 2000 ...................................................................... 94
2. Food Assistance Cases (Chart)SFY 1998 to SFY 2000 ......................................................................... 95
3. Food Assistance Cases (Table)SFY 1998 to SFY 2000 ......................................................................... 95
4. Food Assistance Applications (Chart)SFY 1999 to SFY 2000 ......................................................................... 96
5. Food Assistance Applications (Table)SFY 1998 to SFY 2000 ......................................................................... 96
6. Average Monthly Participating Food Assistance CasesSFY 1998 to SFY 2000 ......................................................................... 97
7. Food Assistance Program Participating CaseloadSFY 1988 to SFY 2000 ......................................................................... 97
8. Percent Change in Participating Food Assistance CasesSFY 1988 to SFY 2000 ......................................................................... 98
9. Participating Food Assistance Persons as a Percent ofState’s Population SFY 1988 to SFY 2000 ......................................... 99
10. Food Assistance Program Cases by Case Type, June 2000 ......... 100
11. Food Assistance Program Cases by Case Type SFY 2000............ 100
12. Food Assistance Program Error RateFFY 1982 to FFY 2000........................................................................ 101
13. Regional and Statewide Food Stamp Accuracy Rates, FFY 2000(Sample Frame: October 1999 to June 2000) .................................. 102
14a. Food Assistance Client Demographics, June 2000........................ 103
14b. Food Assistance Client Demographics, June 2000........................ 104
Food Assistance Program
ESA Program Briefing Book 200093
FoodAssistance
This section summarizes data on households and personsparticipating in food assistance programs:
1. The federally-funded food assistance caseloads are brokenout into three program types:
A. SSI – all recipients that also received SupplementalSecurity Income (SSI) or Social Security (SSA) benefits;
B. Public Assistance Food Stamps (PAFS) – all recipientsthat received a cash assistance grant or SSI;
C. Non-Assistance Food Stamp (NAFS) - at least onerecipient who did not receive a cash assistance grant orSSI.
2. The state-funded Food Assistance Program (FAP) is forindividuals who meet federal income requirements, but notcertain categorical requirements (e.g., their immigrant status).
Food assistance caseload information in this section includes thefederal Food Stamp Program, the state-funded FAP program, andmixed caseloads, unless otherwise noted.
Highlights:
? The average monthly food assistance caseload decreasedto 139,324 cases in SFY 2000, from 154,662 cases in SFY1999.
? The average payment per case in SFY 2000 was $149.10
? The proportion of the population who received foodassistance declined. 5.5% of Washington residentsparticipated in food stamp programs in SFY 2000, comparedto 6.1% for SFY 1999.
? Preliminary findings indicate Washington’s federal FoodStamp Program error rate will be low enough to avoidfederal sanctions. The error rate is about 6.7% for FederalFiscal Year 1999 (October 1998-September 1999), which is3.2% below the threshold.
? The majority of food assistance recipients in SFY 2000was female (57.6%), white (64.0%), and never married(65.7%). The median age of the head of the household was35.6 years.
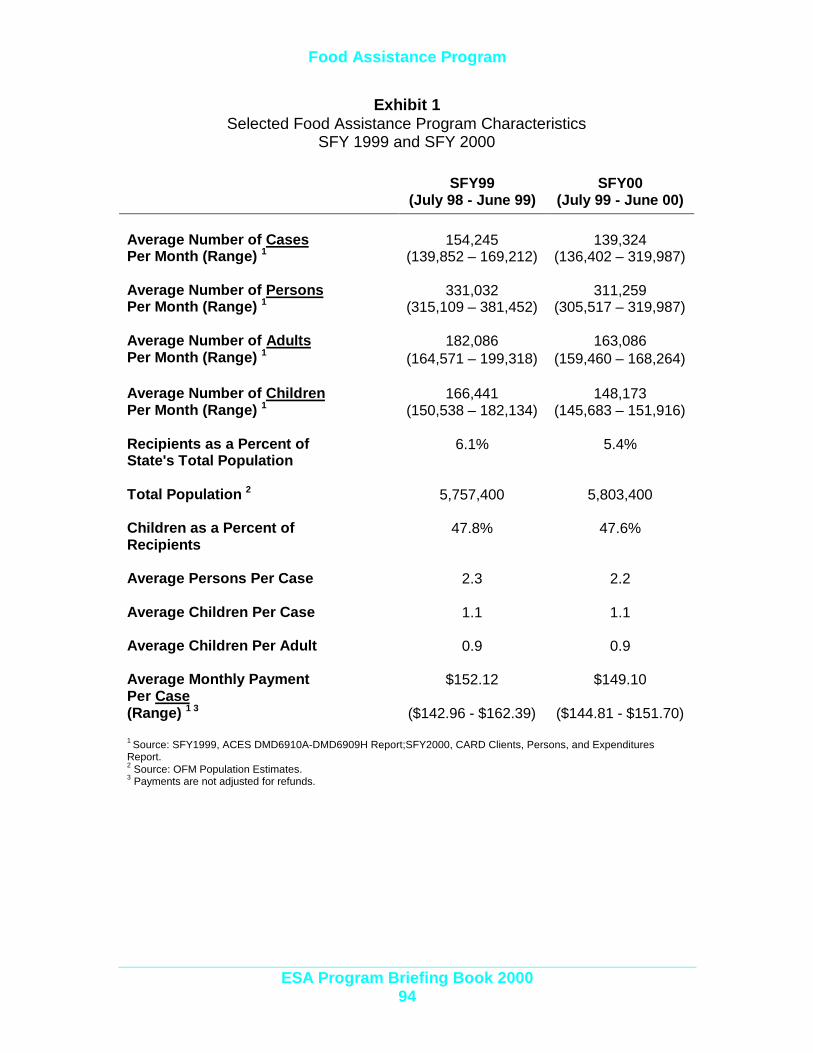
Food Assistance Program
ESA Program Briefing Book 200094
Exhibit 1Selected Food Assistance Program Characteristics
SFY 1999 and SFY 2000
SFY99(July 98 - June 99)
SFY00(July 99 - June 00)
154,245 139,324Average Number of CasesPer Month (Range) 1 (139,852 – 169,212) (136,402 – 319,987)
331,032 311,259Average Number of PersonsPer Month (Range) 1 (315,109 – 381,452) (305,517 – 319,987)
182,086 163,086Average Number of AdultsPer Month (Range) 1 (164,571 – 199,318) (159,460 – 168,264)
166,441 148,173Average Number of ChildrenPer Month (Range) 1 (150,538 – 182,134) (145,683 – 151,916)
Recipients as a Percent ofState's Total Population
6.1% 5.4%
Total Population 2 5,757,400 5,803,400
Children as a Percent ofRecipients
47.8% 47.6%
Average Persons Per Case 2.3 2.2
Average Children Per Case 1.1 1.1
Average Children Per Adult 0.9 0.9
Average Monthly PaymentPer Case
$152.12 $149.10
(Range) 1 3 ($142.96 - $162.39) ($144.81 - $151.70)
1 Source: SFY1999, ACES DMD6910A-DMD6909H Report;SFY2000, CARD Clients, Persons, and ExpendituresReport.2 Source: OFM Population Estimates.3 Payments are not adjusted for refunds.
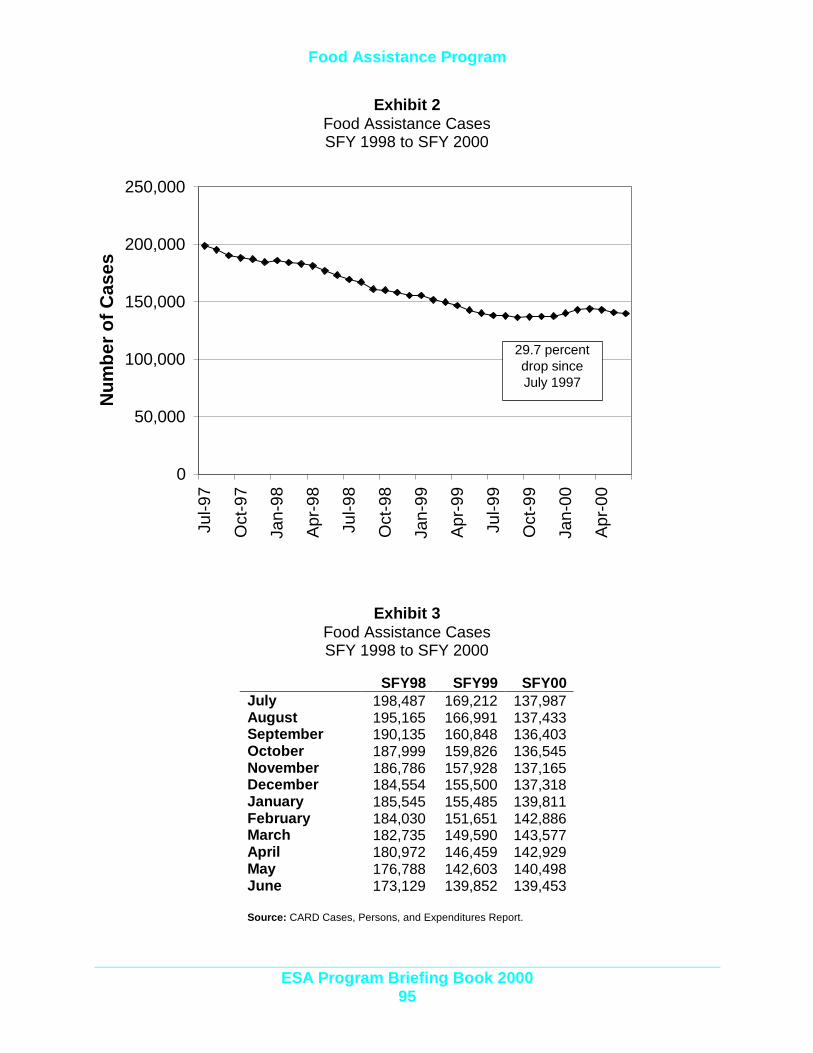
Food Assistance Program
ESA Program Briefing Book 200095
Exhibit 2Food Assistance CasesSFY 1998 to SFY 2000
Exhibit 3Food Assistance CasesSFY 1998 to SFY 2000
SFY98 SFY99 SFY00July 198,487 169,212 137,987August 195,165 166,991 137,433September 190,135 160,848 136,403October 187,999 159,826 136,545November 186,786 157,928 137,165December 184,554 155,500 137,318January 185,545 155,485 139,811February 184,030 151,651 142,886March 182,735 149,590 143,577April 180,972 146,459 142,929May 176,788 142,603 140,498June 173,129 139,852 139,453
Source: CARD Cases, Persons, and Expenditures Report.
0
50,000
100,000
150,000
200,000
250,000Ju
l-97
Oct
-97
Jan-
98
Apr
-98
Jul-9
8
Oct
-98
Jan-
99
Apr
-99
Jul-9
9
Oct
-99
Jan-
00
Apr
-00
Num
ber
of C
ases
29.7 percent drop sinceJuly 1997
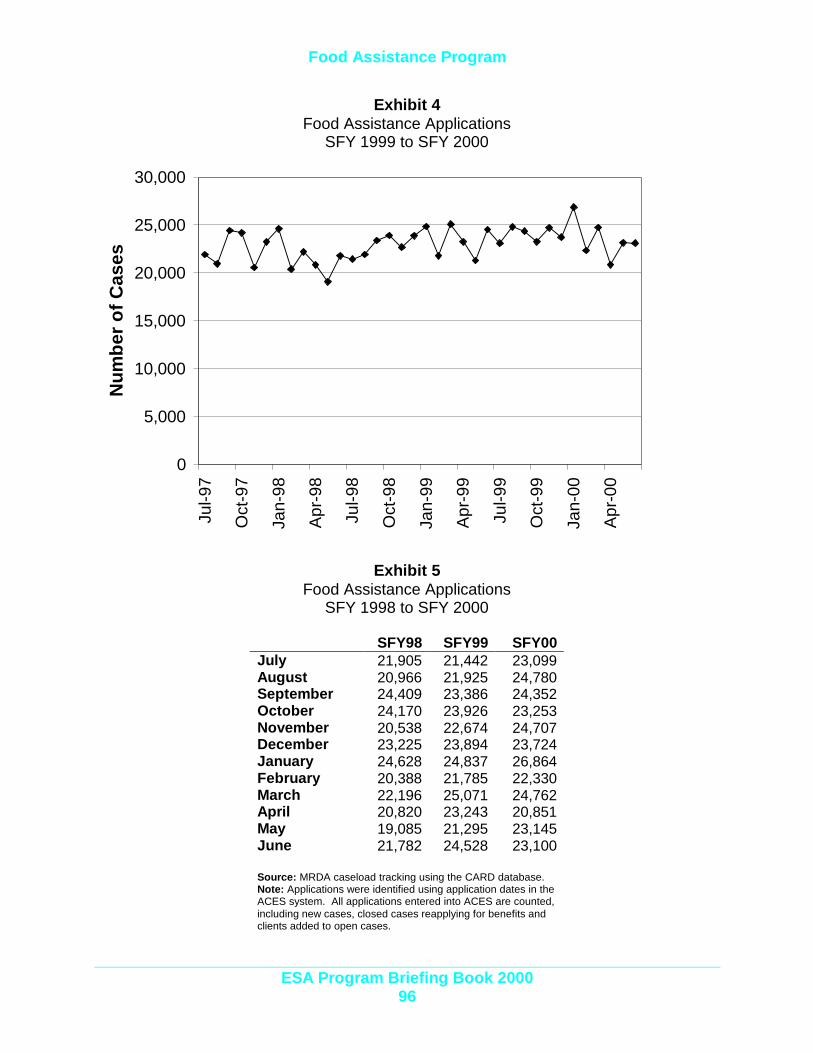
Food Assistance Program
ESA Program Briefing Book 200096
Exhibit 4Food Assistance Applications
SFY 1999 to SFY 2000
Exhibit 5Food Assistance Applications
SFY 1998 to SFY 2000
SFY98 SFY99 SFY00July 21,905 21,442 23,099August 20,966 21,925 24,780September 24,409 23,386 24,352October 24,170 23,926 23,253November 20,538 22,674 24,707December 23,225 23,894 23,724January 24,628 24,837 26,864February 20,388 21,785 22,330March 22,196 25,071 24,762April 20,820 23,243 20,851May 19,085 21,295 23,145June 21,782 24,528 23,100
Source: MRDA caseload tracking using the CARD database.Note: Applications were identified using application dates in theACES system. All applications entered into ACES are counted,including new cases, closed cases reapplying for benefits andclients added to open cases.
0
5,000
10,000
15,000
20,000
25,000
30,000
Jul-9
7
Oct
-97
Jan-
98
Apr
-98
Jul-9
8
Oct
-98
Jan-
99
Apr
-99
Jul-9
9
Oct
-99
Jan-
00
Apr
-00
Num
ber
of C
ases
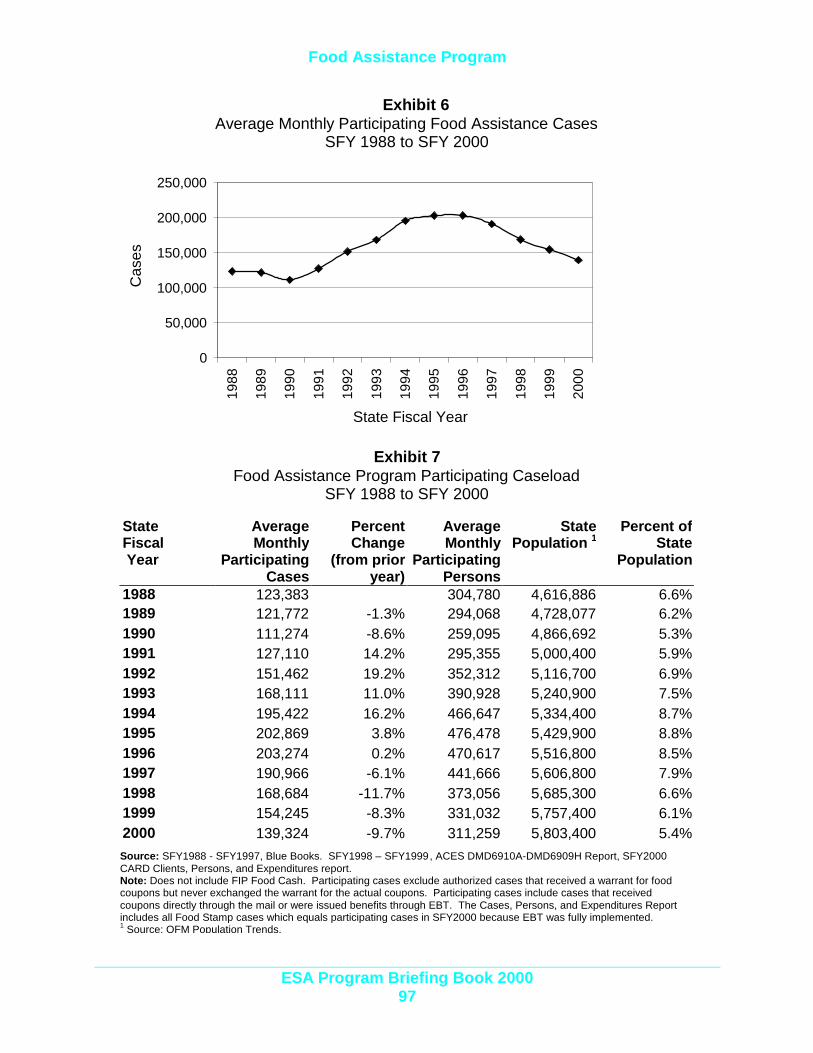
Food Assistance Program
ESA Program Briefing Book 200097
Exhibit 6Average Monthly Participating Food Assistance Cases
SFY 1988 to SFY 2000
Exhibit 7Food Assistance Program Participating Caseload
SFY 1988 to SFY 2000
StateFiscal Year
AverageMonthly
ParticipatingCases
PercentChange
(from prioryear)
AverageMonthly
ParticipatingPersons
StatePopulation 1
Percent ofState
Population
1988 123,383 304,780 4,616,886 6.6%1989 121,772 -1.3% 294,068 4,728,077 6.2%1990 111,274 -8.6% 259,095 4,866,692 5.3%1991 127,110 14.2% 295,355 5,000,400 5.9%1992 151,462 19.2% 352,312 5,116,700 6.9%1993 168,111 11.0% 390,928 5,240,900 7.5%1994 195,422 16.2% 466,647 5,334,400 8.7%1995 202,869 3.8% 476,478 5,429,900 8.8%1996 203,274 0.2% 470,617 5,516,800 8.5%1997 190,966 -6.1% 441,666 5,606,800 7.9%1998 168,684 -11.7% 373,056 5,685,300 6.6%1999 154,245 -8.3% 331,032 5,757,400 6.1%2000 139,324 -9.7% 311,259 5,803,400 5.4%Source: SFY1988 - SFY1997, Blue Books. SFY1998 – SFY1999, ACES DMD6910A-DMD6909H Report, SFY2000CARD Clients, Persons, and Expenditures report.Note: Does not include FIP Food Cash. Participating cases exclude authorized cases that received a warrant for foodcoupons but never exchanged the warrant for the actual coupons. Participating cases include cases that receivedcoupons directly through the mail or were issued benefits through EBT. The Cases, Persons, and Expenditures Reportincludes all Food Stamp cases which equals participating cases in SFY2000 because EBT was fully implemented.1 Source: OFM Population Trends.
0
50,000
100,000
150,000
200,000
250,000
1988
1989
1990
1991
1992
1993
1994
1995
1996
1997
1998
1999
2000
State Fiscal Year
Cas
es
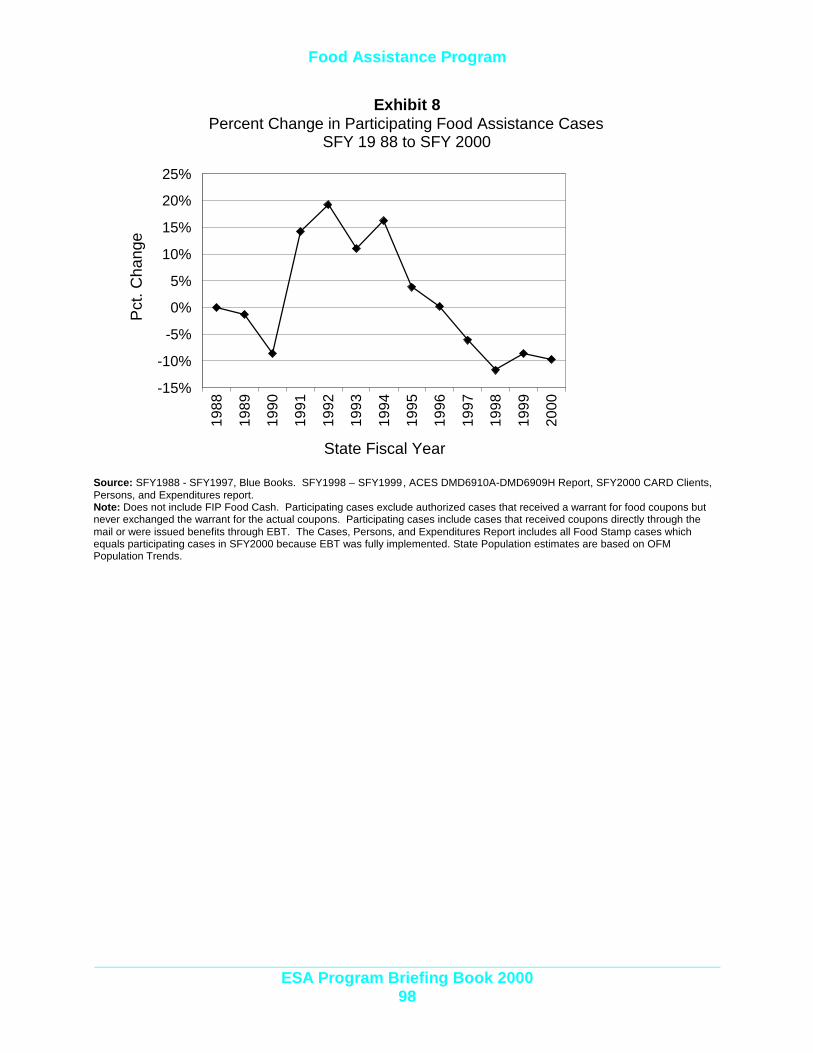
Food Assistance Program
ESA Program Briefing Book 200098
Exhibit 8Percent Change in Participating Food Assistance Cases
SFY 19 88 to SFY 2000
Source: SFY1988 - SFY1997, Blue Books. SFY1998 – SFY1999, ACES DMD6910A-DMD6909H Report, SFY2000 CARD Clients,Persons, and Expenditures report.Note: Does not include FIP Food Cash. Participating cases exclude authorized cases that received a warrant for food coupons butnever exchanged the warrant for the actual coupons. Participating cases include cases that received coupons directly through themail or were issued benefits through EBT. The Cases, Persons, and Expenditures Report includes all Food Stamp cases whichequals participating cases in SFY2000 because EBT was fully implemented. State Population estimates are based on OFMPopulation Trends.
-15%
-10%
-5%
0%
5%
10%
15%
20%
25%
1988
1989
1990
1991
1992
1993
1994
1995
1996
1997
1998
1999
2000
State Fiscal Year
Pct
. Cha
nge
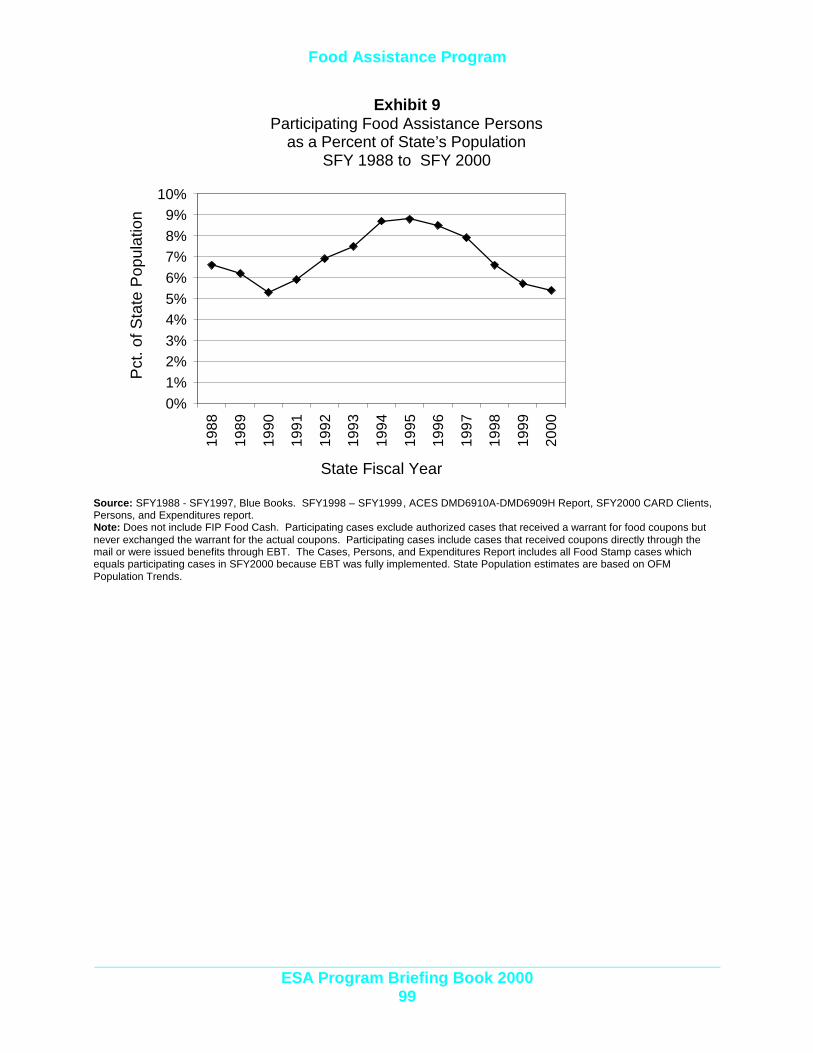
Food Assistance Program
ESA Program Briefing Book 200099
Exhibit 9Participating Food Assistance Persons
as a Percent of State’s PopulationSFY 1988 to SFY 2000
Source: SFY1988 - SFY1997, Blue Books. SFY1998 – SFY1999, ACES DMD6910A-DMD6909H Report, SFY2000 CARD Clients,Persons, and Expenditures report.Note: Does not include FIP Food Cash. Participating cases exclude authorized cases that received a warrant for food coupons butnever exchanged the warrant for the actual coupons. Participating cases include cases that received coupons directly through themail or were issued benefits through EBT. The Cases, Persons, and Expenditures Report includes all Food Stamp cases whichequals participating cases in SFY2000 because EBT was fully implemented. State Population estimates are based on OFMPopulation Trends.
0%1%2%3%4%5%6%7%8%9%
10%19
88
1989
1990
1991
1992
1993
1994
1995
1996
1997
1998
1999
2000
State Fiscal Year
Pct
. of S
tate
Pop
ulat
ion

Food Assistance Program
ESA Program Briefing Book 2000100
Exhibit 10Food Assistance Program Cases by Case Type
June 2000
Exhibit 11Food Assistance Program Cases by Case Type
SFY 2000
FEDERAL STATE MIXEDTOTAL PAFS NAFS SSI PAFS NAFS SSI PAFS NAFS SSI
Jul-99 137,988 51,328 52,554 29,202 355 371 59 1,841 2,262 16Aug-99 137,430 50,972 52,429 29,134 347 391 58 1,839 2,245 15Sep-99 136,401 50,876 51,777 29,169 348 364 59 1,797 1,996 15Oct-99 136,540 50,804 52,068 29,158 356 358 55 1,809 1,914 18Nov-99 137,162 50,591 52,659 29,238 360 372 60 1,822 2,039 21Dec-99 137,317 51,095 52,152 29,247 362 410 61 1,871 2,097 22Jan-00 139,809 50,611 54,871 29,140 380 465 66 1,885 2,368 23Feb-00 142,878 51,316 56,860 29,323 384 494 67 1,968 2,443 23Mar-00 143,566 51,821 56,949 29,509 398 493 68 1,907 2,396 25Apr-00 142,914 51,046 56,929 29,699 407 507 75 1,859 2,369 23May-00 140,476 49,778 55,978 29,694 424 478 66 1,776 2,261 21Jun-00 139,402 49,179 55,541 29,756 454 442 67 1,711 2,228 24
Source: CARD Clients, Persons and Expenditures Report. All recipients in SSI cases also received Supplemental SecurityIncome (SSI). All recipients on Public Assistance Food Stamps (PAFS) cases also received a cash assistance grant or SSI.Non-Assistance Food Stamp (NAFS) cases had at least one recipient who did not also receive a cash assistance grant or SSI.
SSI21%
PAFS37%
NAFS42%
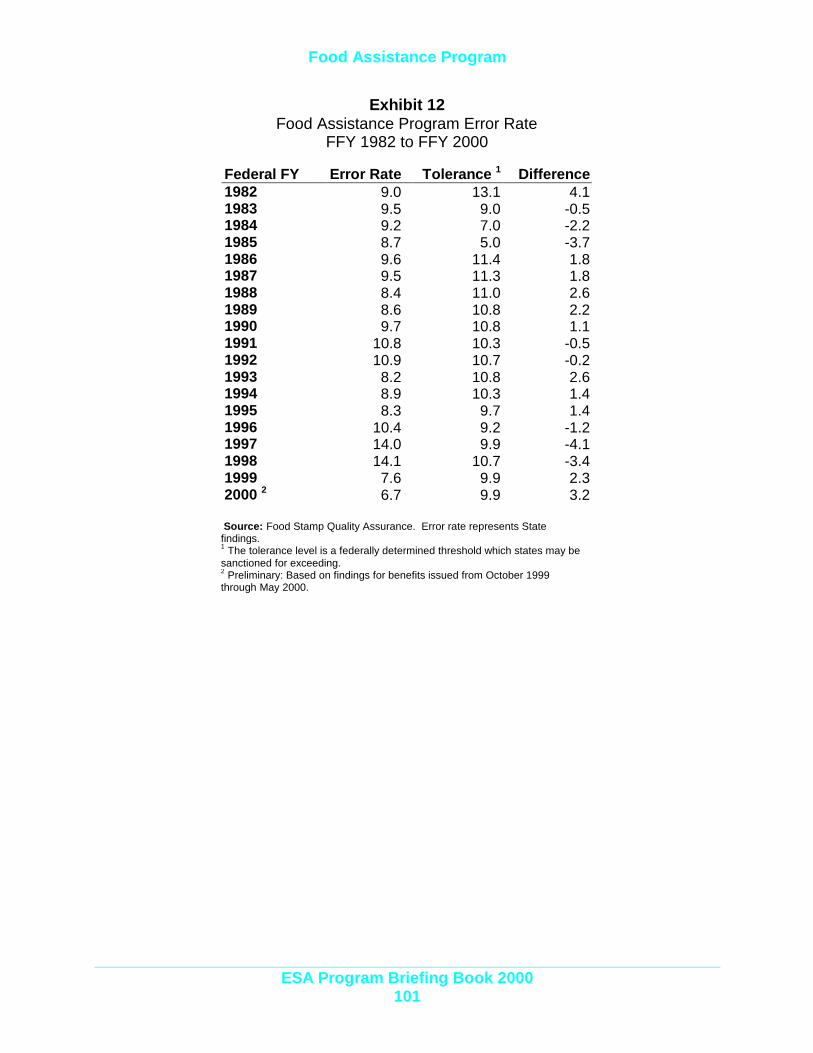
Food Assistance Program
ESA Program Briefing Book 2000101
Exhibit 12Food Assistance Program Error Rate
FFY 1982 to FFY 2000
Federal FY Error Rate Tolerance 1 Difference1982 9.0 13.1 4.11983 9.5 9.0 -0.51984 9.2 7.0 -2.21985 8.7 5.0 -3.71986 9.6 11.4 1.81987 9.5 11.3 1.81988 8.4 11.0 2.61989 8.6 10.8 2.21990 9.7 10.8 1.11991 10.8 10.3 -0.51992 10.9 10.7 -0.21993 8.2 10.8 2.61994 8.9 10.3 1.41995 8.3 9.7 1.41996 10.4 9.2 -1.21997 14.0 9.9 -4.11998 14.1 10.7 -3.41999 7.6 9.9 2.32000 2 6.7 9.9 3.2
Source: Food Stamp Quality Assurance. Error rate represents Statefindings.1 The tolerance level is a federally determined threshold which states may besanctioned for exceeding.2 Preliminary: Based on findings for benefits issued from October 1999through May 2000.
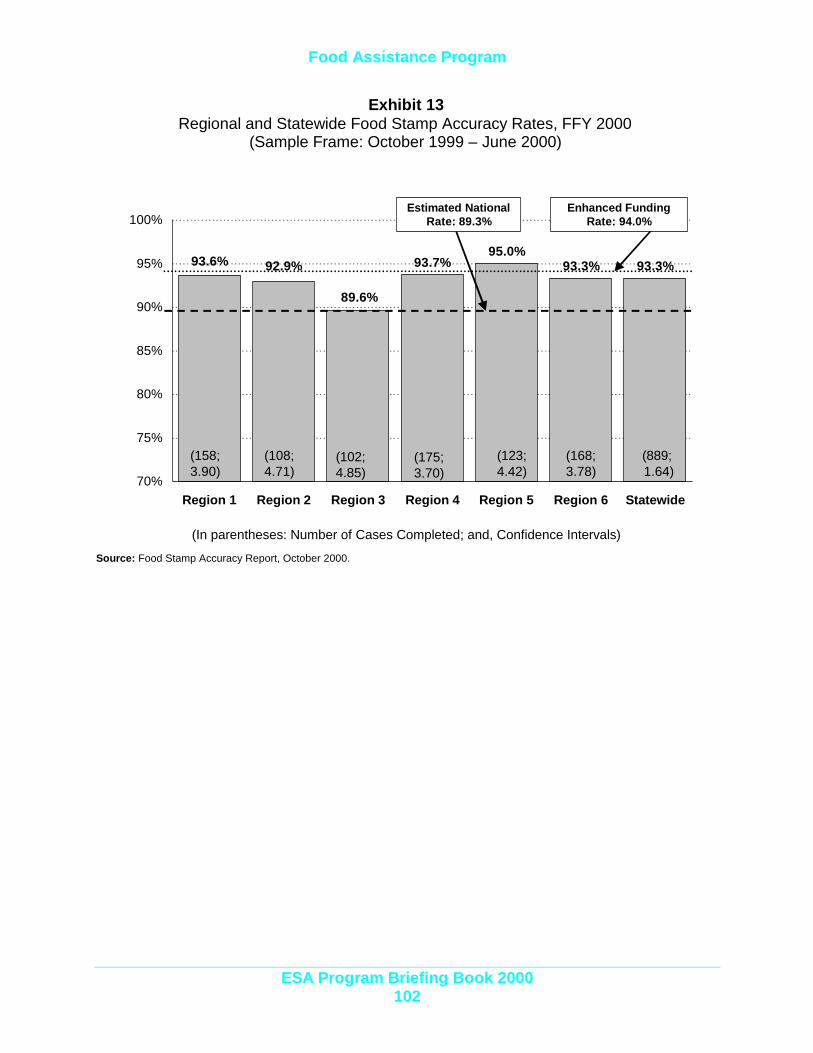
Food Assistance Program
ESA Program Briefing Book 2000102
Exhibit 13Regional and Statewide Food Stamp Accuracy Rates, FFY 2000
(Sample Frame: October 1999 – June 2000)
93.7%95.0%
93.3% 93.3%93.6% 92.9%
89.6%
70%
75%
80%
85%
90%
95%
100%
Region 1 Region 2 Region 3 Region 4 Region 5 Region 6 Statewide
(158;3.90)
(108;4.71)
(102;4.85)
(175;3.70)
(123;4.42)
(168;3.78)
(889; 1.64)
(In parentheses: Number of Cases Completed; and, Confidence Intervals)
Estimated NationalRate: 89.3%
Enhanced FundingRate: 94.0%
Source: Food Stamp Accuracy Report, October 2000.
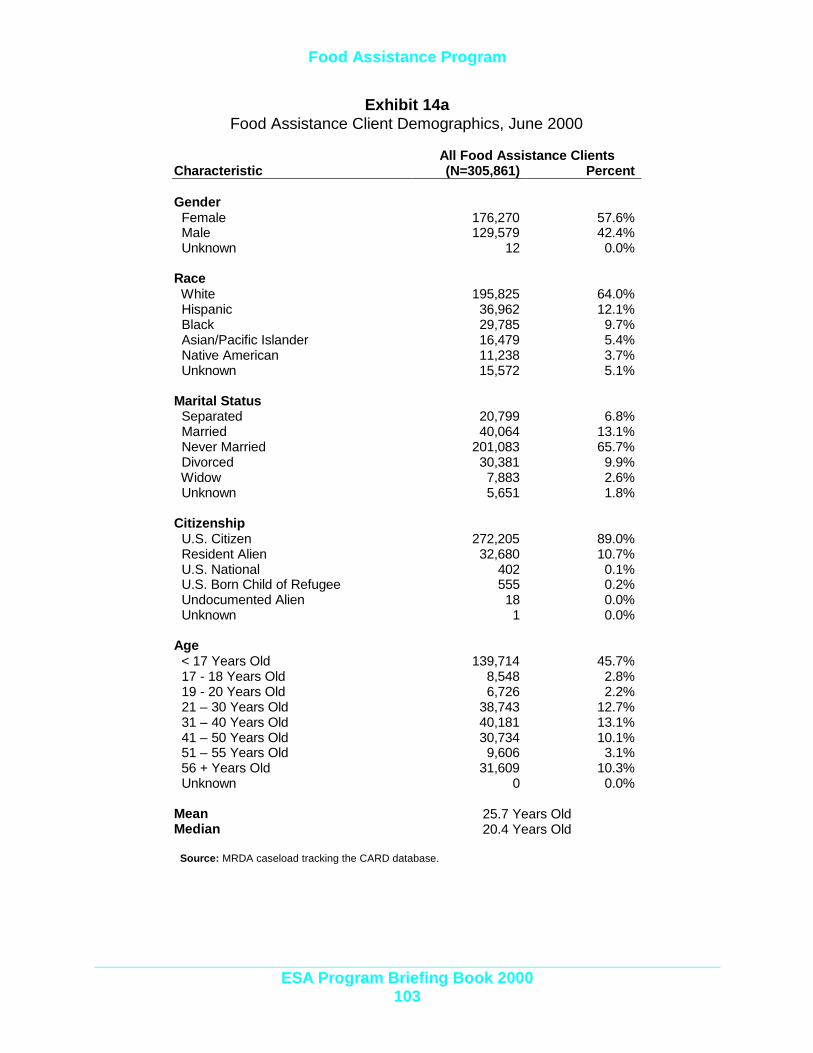
Food Assistance Program
ESA Program Briefing Book 2000103
Exhibit 14aFood Assistance Client Demographics, June 2000
All Food Assistance ClientsCharacteristic (N=305,861) Percent
Gender Female 176,270 57.6% Male 129,579 42.4% Unknown 12 0.0%
Race White 195,825 64.0% Hispanic 36,962 12.1% Black 29,785 9.7% Asian/Pacific Islander 16,479 5.4% Native American 11,238 3.7% Unknown 15,572 5.1%
Marital Status Separated 20,799 6.8% Married 40,064 13.1% Never Married 201,083 65.7% Divorced 30,381 9.9% Widow 7,883 2.6% Unknown 5,651 1.8%
Citizenship U.S. Citizen 272,205 89.0% Resident Alien 32,680 10.7% U.S. National 402 0.1% U.S. Born Child of Refugee 555 0.2% Undocumented Alien 18 0.0% Unknown 1 0.0%
Age < 17 Years Old 139,714 45.7% 17 - 18 Years Old 8,548 2.8% 19 - 20 Years Old 6,726 2.2% 21 – 30 Years Old 38,743 12.7% 31 – 40 Years Old 40,181 13.1% 41 – 50 Years Old 30,734 10.1% 51 – 55 Years Old 9,606 3.1% 56 + Years Old 31,609 10.3% Unknown 0 0.0%
Mean 25.7 Years OldMedian 20.4 Years Old
Source: MRDA caseload tracking the CARD database.
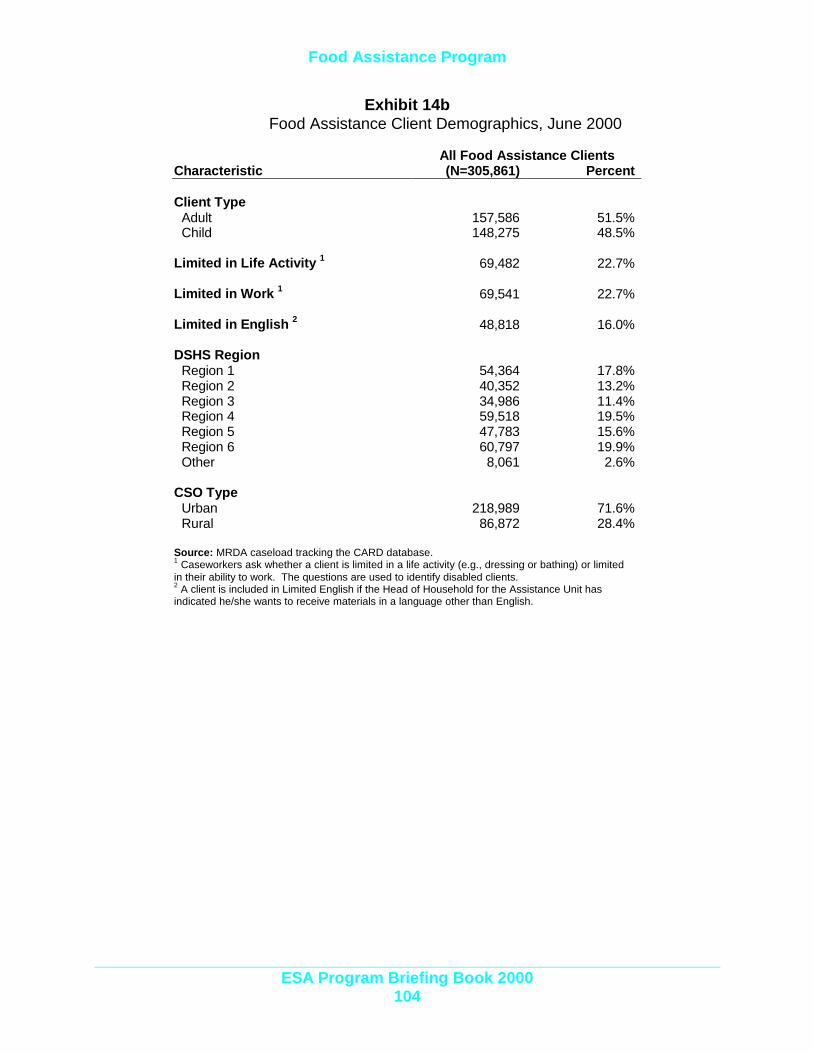
Food Assistance Program
ESA Program Briefing Book 2000104
Exhibit 14bFood Assistance Client Demographics, June 2000
All Food Assistance ClientsCharacteristic (N=305,861) Percent
Client Type Adult 157,586 51.5% Child 148,275 48.5%
Limited in Life Activity 1 69,482 22.7%
Limited in Work 1 69,541 22.7%
Limited in English 2 48,818 16.0%
DSHS Region Region 1 54,364 17.8% Region 2 40,352 13.2% Region 3 34,986 11.4% Region 4 59,518 19.5% Region 5 47,783 15.6% Region 6 60,797 19.9% Other 8,061 2.6%
CSO Type Urban 218,989 71.6% Rural 86,872 28.4%
Source: MRDA caseload tracking the CARD database.1 Caseworkers ask whether a client is limited in a life activity (e.g., dressing or bathing) or limitedin their ability to work. The questions are used to identify disabled clients.2 A client is included in Limited English if the Head of Household for the Assistance Unit hasindicated he/she wants to receive materials in a language other than English.

General Assistance (GA-U and GA-X) Programs
Exhibits Page
1. Selected GA-U ad GA-X Program CharacteristicsSFY 1999 and SFY 2000 .................................................................... 106
2. GA-U and GA-X Program Cases (Chart)SFY 1999 to SFY 2000 ....................................................................... 107
3. GA-U and GA-X Program Cases (Table)SFY 1999 to SFY 2000 ....................................................................... 107
4. GA-U and GA-X Program New Applications (Chart)SFY 1998 to SFY 2000 ....................................................................... 108
5. GA-U and GA-X Program New Applications (Table)SFY 1998 to SFY 2000 ....................................................................... 108
6. Percent of GA-U Clients Exiting to GA-X (Chart)SFY 2000 ............................................................................................ 109
7. Percent of GA-U Clients Exiting to GA-X (Table)SFY 2000 ............................................................................................ 109
8. GA-U and GA-X Persons by Consecutive Months on Assistance(Chart) September 2000 .................................................................... 110
9. GA-U and GA-X Persons by Consecutive Months on Assistance(Table) September 2000 .................................................................... 110
10a. General Assistance (GA-U) Client Demographics, June 2000....... 111
10b. General Assistance (GA-U) Client Demographics, June 2000....... 112
11a. General Assistance (GA-X) Client Demographics, June 2000....... 113
11b. General Assistance (GA-X) Client Demographics, June 2000....... 114

General Assistance (GA-U and GA-X) Program
ESA Program Briefing Book, 2000105
GeneralAssistance(GA-U and GA-X)Programs
This section describes two General Assistanceprograms:
1. General Assistance-Unemployable (GA-U). GA-U includes General Assistance for: Unemployable(GA-U), Aged (GA-A), Blind (GA-B), Disabled (GA-P), Institution for the Mentally Diseased (GI), andLegal Guardians (GH).
2. General Assistance-Expedited MedicalDisability (GA-X). The GA-X program is designedfor cases pending SSI, the federal SupplementalSecurity Income.
Highlights:
? The average monthly GA-U and GA-X caseloaddecreased in SFY 2000 (16,399 cases), from SFY1999 (16,908 cases).
? The average payment per case in SFY 2000 was$304.61.
? The number of new applicants per monthincreased in SFY 2000, from 3,637 in July 1999 to4,272 in June 2000.
? In SFY 2000, about 6% of the caseload movedfrom GA-U to GA-X each month. GA-U clientsare often moved into the GA-X program as a firststep in securing federal SSI benefits for the client.
? Most (54%) of General Assistance recipients aremale, and over 70% are white. Most are divorced(28%) or never married (40%).
? The median age for GA-U clients is 43.2 yearsand 44.2 years for GA-X clients.
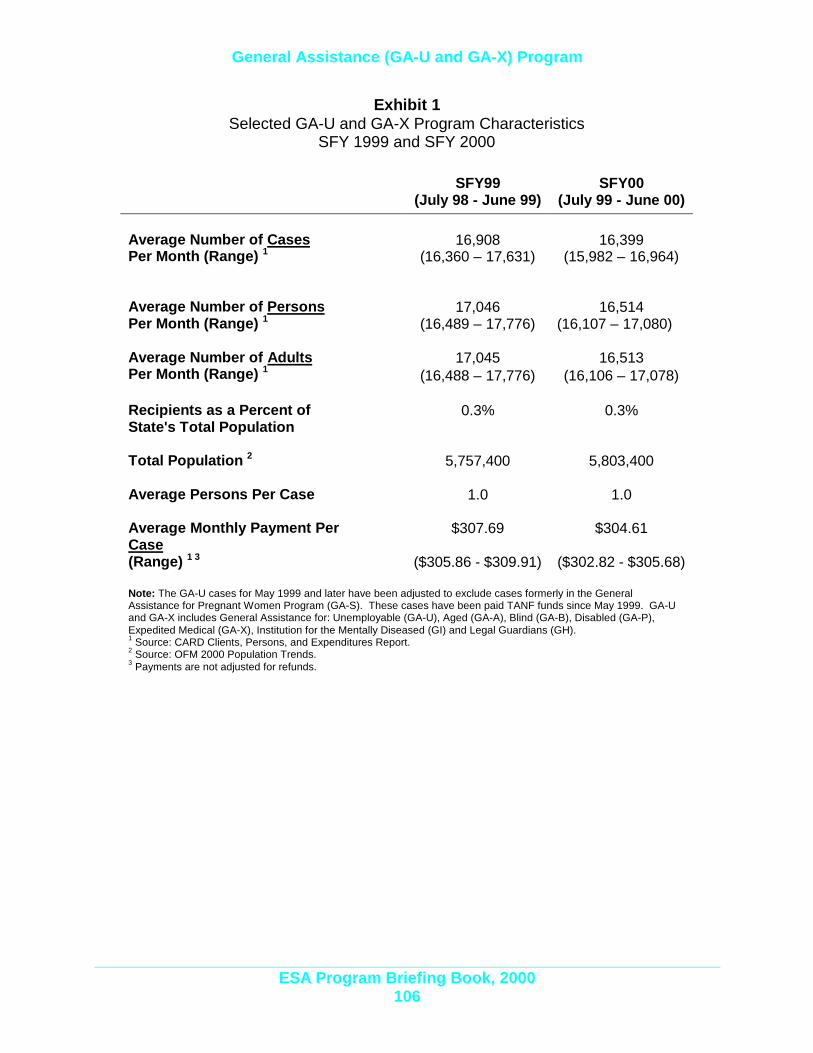
General Assistance (GA-U and GA-X) Program
ESA Program Briefing Book, 2000106
Exhibit 1Selected GA-U and GA-X Program Characteristics
SFY 1999 and SFY 2000
SFY99(July 98 - June 99)
SFY00(July 99 - June 00)
16,908 16,399Average Number of CasesPer Month (Range) 1 (16,360 – 17,631) (15,982 – 16,964)
17,046 16,514Average Number of PersonsPer Month (Range) 1 (16,489 – 17,776) (16,107 – 17,080)
17,045 16,513Average Number of AdultsPer Month (Range) 1 (16,488 – 17,776) (16,106 – 17,078)
Recipients as a Percent ofState's Total Population
0.3% 0.3%
Total Population 2 5,757,400 5,803,400
Average Persons Per Case 1.0 1.0
Average Monthly Payment PerCase
$307.69 $304.61
(Range) 1 3 ($305.86 - $309.91) ($302.82 - $305.68)
Note: The GA-U cases for May 1999 and later have been adjusted to exclude cases formerly in the GeneralAssistance for Pregnant Women Program (GA-S). These cases have been paid TANF funds since May 1999. GA-Uand GA-X includes General Assistance for: Unemployable (GA-U), Aged (GA-A), Blind (GA-B), Disabled (GA-P),Expedited Medical (GA-X), Institution for the Mentally Diseased (GI) and Legal Guardians (GH).1 Source: CARD Clients, Persons, and Expenditures Report.2 Source: OFM 2000 Population Trends.3 Payments are not adjusted for refunds.

General Assistance (GA-U and GA-X) Program
ESA Program Briefing Book, 2000107
Exhibit 2GA-U and GA-X Program Cases
SFY 1999 to SFY 2000
Exhibit 3GA-U and GA-X Program Cases
SFY 1998 to SFY 2000
SFY98 SFY99 SFY00July 17,701 17,842 16,314August 17,526 17,622 16,234September 17,331 17,449 16,390October 17,458 17,218 16,381November 17,198 17,095 16,370December 17,375 17,150 16,586January 17,473 16,939 16,487February 17,736 16,906 16,672March 18,066 17,060 17,234April 18,130 16,961 17,081May 17,970 16,702 17,129June 17,924 16,599 17,056Source: CARD Cases Persons and Expenditures Report.Note: The GA-U cases for May 1999 and later have been adjusted toexclude cases formerly in the General Assistance for Pregnant WomenProgram (GA-S). These cases have been paid TANF funds since May1999. GA-U and GA-X includes General Assistance for: Unemployable(GA-U), Aged (GA-A), Blind (GA-B), Disabled (GA-P), Expedited Medical(GA-X), Institution for the Mentally Diseased (GI) and Legal Guardians(GH).
15,000
15,500
16,000
16,500
17,000
17,500
18,000
18,500Ju
l-97
Oct
-97
Jan-
98
Apr
-98
Jul-9
8
Oct
-98
Jan-
99
Apr
-99
Jul-9
9
Oct
-99
Jan-
00
Apr
-00
Num
ber
of C
ases
3.6 percent drop sinceJuly 1997
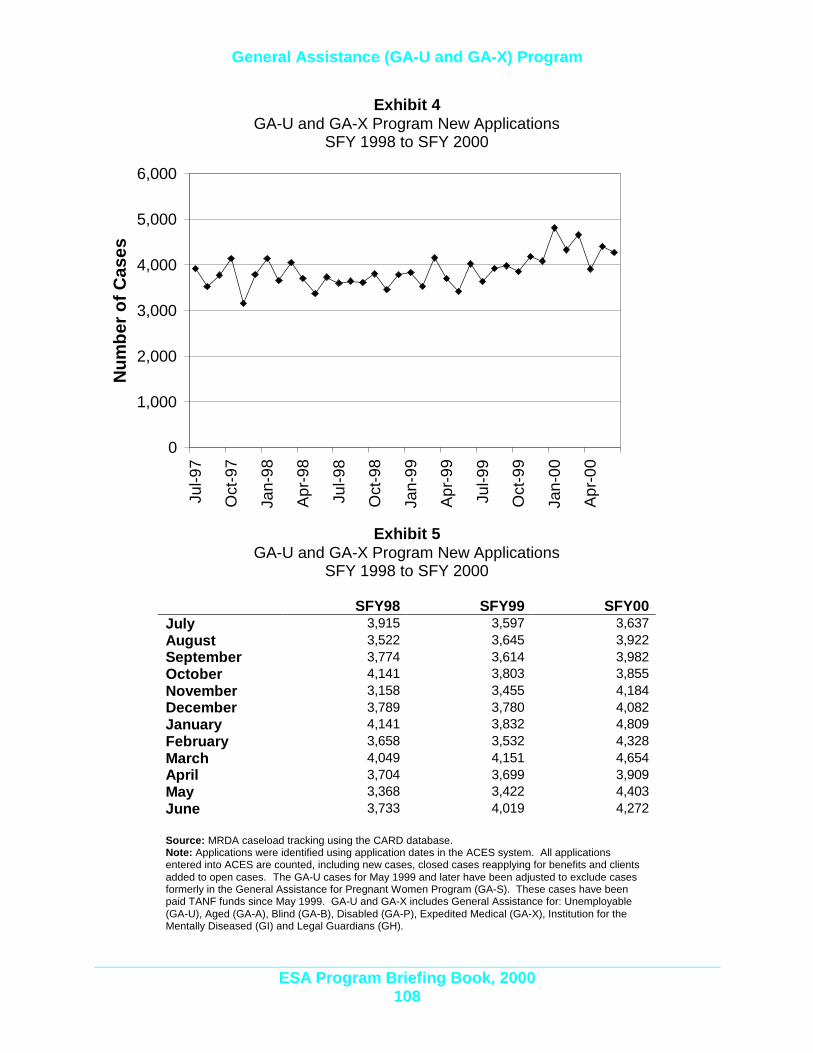
General Assistance (GA-U and GA-X) Program
ESA Program Briefing Book, 2000108
Exhibit 4GA-U and GA-X Program New Applications
SFY 1998 to SFY 2000
Exhibit 5GA-U and GA-X Program New Applications
SFY 1998 to SFY 2000
SFY98 SFY99 SFY00July 3,915 3,597 3,637August 3,522 3,645 3,922September 3,774 3,614 3,982October 4,141 3,803 3,855November 3,158 3,455 4,184December 3,789 3,780 4,082January 4,141 3,832 4,809February 3,658 3,532 4,328March 4,049 4,151 4,654April 3,704 3,699 3,909May 3,368 3,422 4,403June 3,733 4,019 4,272
Source: MRDA caseload tracking using the CARD database.Note: Applications were identified using application dates in the ACES system. All applicationsentered into ACES are counted, including new cases, closed cases reapplying for benefits and clientsadded to open cases. The GA-U cases for May 1999 and later have been adjusted to exclude casesformerly in the General Assistance for Pregnant Women Program (GA-S). These cases have beenpaid TANF funds since May 1999. GA-U and GA-X includes General Assistance for: Unemployable(GA-U), Aged (GA-A), Blind (GA-B), Disabled (GA-P), Expedited Medical (GA-X), Institution for theMentally Diseased (GI) and Legal Guardians (GH).
0
1,000
2,000
3,000
4,000
5,000
6,000Ju
l-97
Oct
-97
Jan-
98
Apr
-98
Jul-9
8
Oct
-98
Jan-
99
Apr
-99
Jul-9
9
Oct
-99
Jan-
00
Apr
-00
Num
ber
of C
ases

General Assistance (GA-U and GA-X) Program
ESA Program Briefing Book, 2000109
Exhibit 6Percent of GA-U Clients Exiting to GA-X
SFY 2000
Exhibit 7GA-U Clients Exiting to GA-X
SFY 2000
Total GA-U GA-U to GA-X PercentJul-99 9,445 594 6.3%Aug-99 9,330 457 4.9%Sep-99 9,419 513 5.4%Oct-99 9,281 643 6.9%Nov-99 9,219 574 6.2%Dec-99 9,365 523 5.6%Jan-00 9,337 534 5.7%Feb-00 9,487 498 5.2%Mar-00 9,870 558 5.7%Apr-00 9,773 599 6.1%May-00 9,797 572 5.8%Jun-00 9,618 639 6.6%
Source: MRDA caseload tracking using the CARD database.Note: GA-U to GA-X counts the number of clients receiving GA-X in their first month, followingthe month they received GA-U. GA-U is General Assistance for Unemployable only. GA-X isexpedited medical only.
0.0%
2.0%
4.0%
6.0%
8.0%
Jul-9
9
Aug
-99
Sep
-99
Oct
-99
Nov
-99
Dec
-99
Jan-
00
Feb-
00
Mar
-00
Apr
-00
May
-00
Jun-
00
Per
cent
of C
ases
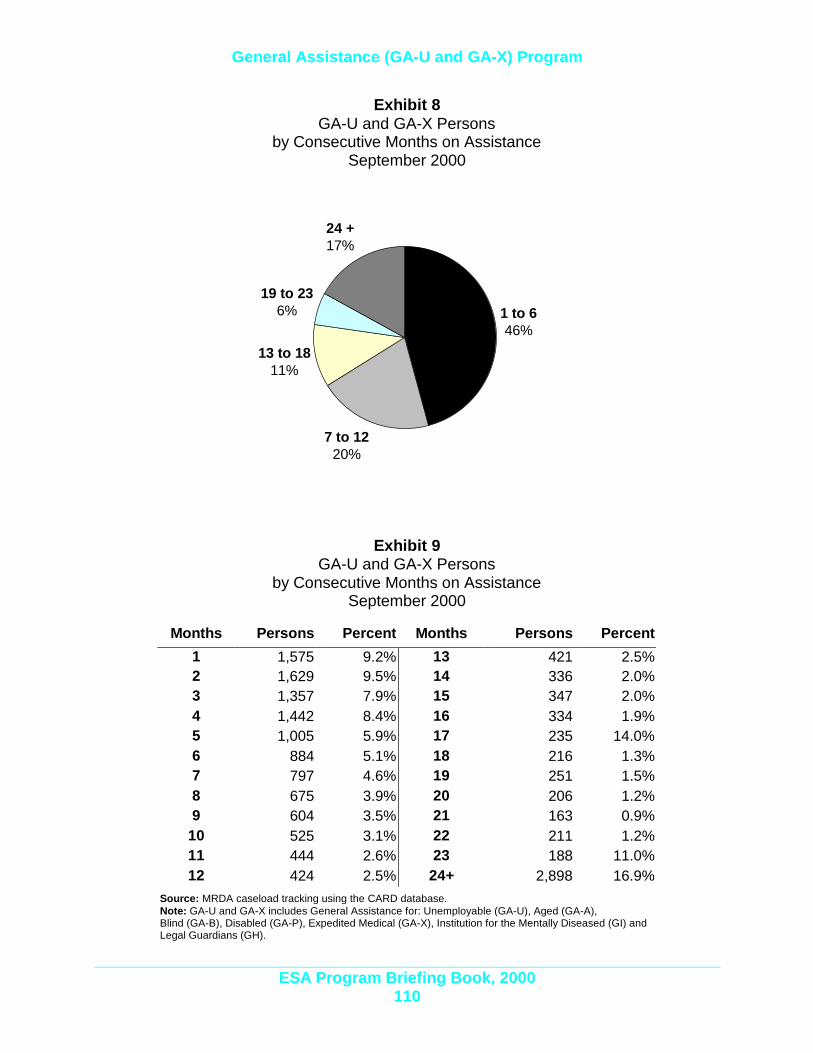
General Assistance (GA-U and GA-X) Program
ESA Program Briefing Book, 2000110
Exhibit 8GA-U and GA-X Persons
by Consecutive Months on AssistanceSeptember 2000
Exhibit 9GA-U and GA-X Persons
by Consecutive Months on AssistanceSeptember 2000
Months Persons Percent Months Persons Percent
1 1,575 9.2% 13 421 2.5%2 1,629 9.5% 14 336 2.0%3 1,357 7.9% 15 347 2.0%4 1,442 8.4% 16 334 1.9%5 1,005 5.9% 17 235 14.0%6 884 5.1% 18 216 1.3%7 797 4.6% 19 251 1.5%8 675 3.9% 20 206 1.2%9 604 3.5% 21 163 0.9%
10 525 3.1% 22 211 1.2%11 444 2.6% 23 188 11.0%12 424 2.5% 24+ 2,898 16.9%
Source: MRDA caseload tracking using the CARD database.Note: GA-U and GA-X includes General Assistance for: Unemployable (GA-U), Aged (GA-A),Blind (GA-B), Disabled (GA-P), Expedited Medical (GA-X), Institution for the Mentally Diseased (GI) andLegal Guardians (GH).
7 to 1220%
13 to 1811%
1 to 646%
24 +17%
19 to 236%

General Assistance (GA-U and GA-X) Program
ESA Program Briefing Book, 2000111
Exhibit 10aGeneral Assistance (GA-U) Client Demographics, June 2000
All GA-U ClientsCharacteristic (N=10,755) Percent
Gender Female 4,867 45.3% Male 5,885 54.7% Unknown 3 0.0%
Race White 7,624 70.9% Hispanic 537 5.0% Black 958 8.9% Asian/Pacific Islander 670 6.2% Native American 463 4.3% Unknown 503 4.7%
Marital Status Separated 1,504 14.0% Married 1,066 9.9% Never Married 4,325 40.2% Divorced 2,981 27.7% Widow 562 5.2% Unknown 317 2.9%
Citizenship U.S. Citizen 9,437 87.7% Resident Alien 1,302 12.1% U.S. National 13 0.1% Unknown 3 0.0%
Age < 17 Years Old 303 2.8% 17 - 18 Years Old 98 0.9% 19 - 20 Years Old 324 3.0% 21 – 30 Years Old 1,473 13.7% 31 – 40 Years Old 2,438 22.6% 41 – 50 Years Old 3,379 31.4% 51 – 55 Years Old 1,073 10.0% 56 + Years Old 1,667 15.5% Unknown 0 0.0%
Mean 42.8 Years OldMedian 43.2 Years Old
Source: MRDA caseload tracking the CARD database.Note: GA-U includes General Assistance for: Unemployable (GA-U), Aged (GA-A), Blind (GA-B),Disabled (GA-P), Institution for the Mentally Diseased (GI) and Legal Guardians (GH). Thisexcludes Expedited Medical (GA-X).
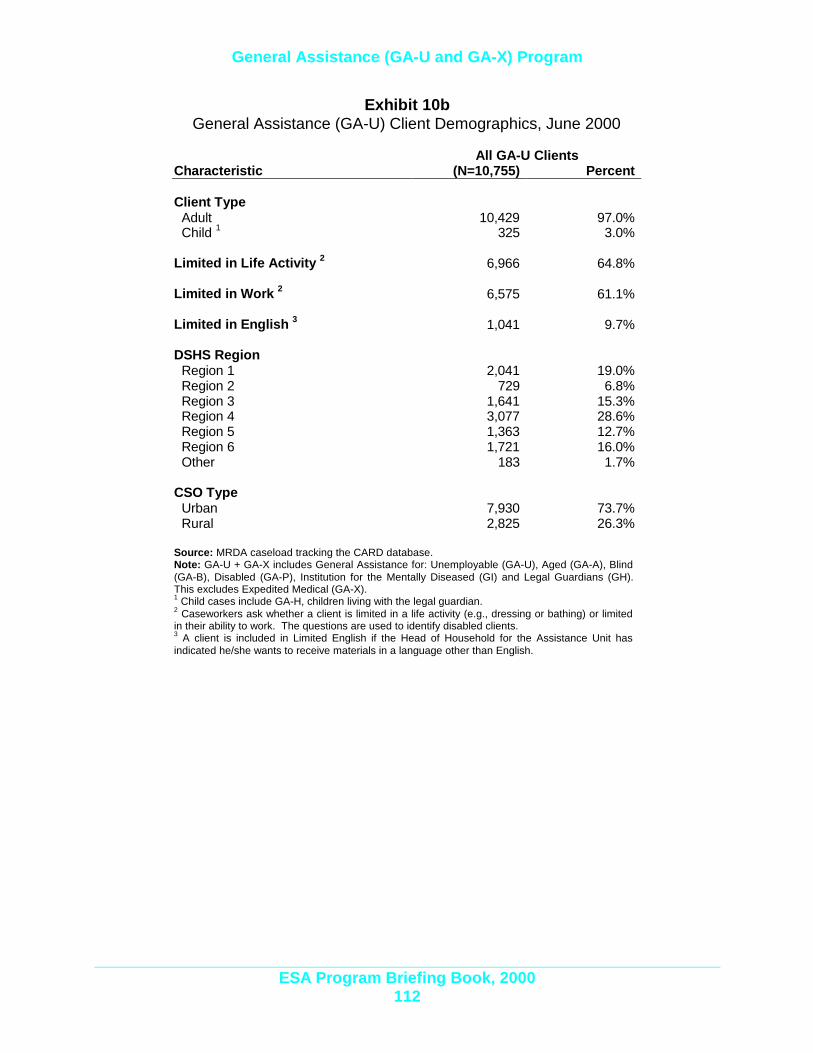
General Assistance (GA-U and GA-X) Program
ESA Program Briefing Book, 2000112
Exhibit 10bGeneral Assistance (GA-U) Client Demographics, June 2000
All GA-U ClientsCharacteristic (N=10,755) Percent
Client Type Adult 10,429 97.0% Child 1 325 3.0%
Limited in Life Activity 2 6,966 64.8%
Limited in Work 2 6,575 61.1%
Limited in English 3 1,041 9.7%
DSHS Region Region 1 2,041 19.0% Region 2 729 6.8% Region 3 1,641 15.3% Region 4 3,077 28.6% Region 5 1,363 12.7% Region 6 1,721 16.0% Other 183 1.7%
CSO Type Urban 7,930 73.7% Rural 2,825 26.3%
Source: MRDA caseload tracking the CARD database.Note: GA-U + GA-X includes General Assistance for: Unemployable (GA-U), Aged (GA-A), Blind(GA-B), Disabled (GA-P), Institution for the Mentally Diseased (GI) and Legal Guardians (GH).This excludes Expedited Medical (GA-X).1 Child cases include GA-H, children living with the legal guardian.2 Caseworkers ask whether a client is limited in a life activity (e.g., dressing or bathing) or limitedin their ability to work. The questions are used to identify disabled clients.3 A client is included in Limited English if the Head of Household for the Assistance Unit hasindicated he/she wants to receive materials in a language other than English.
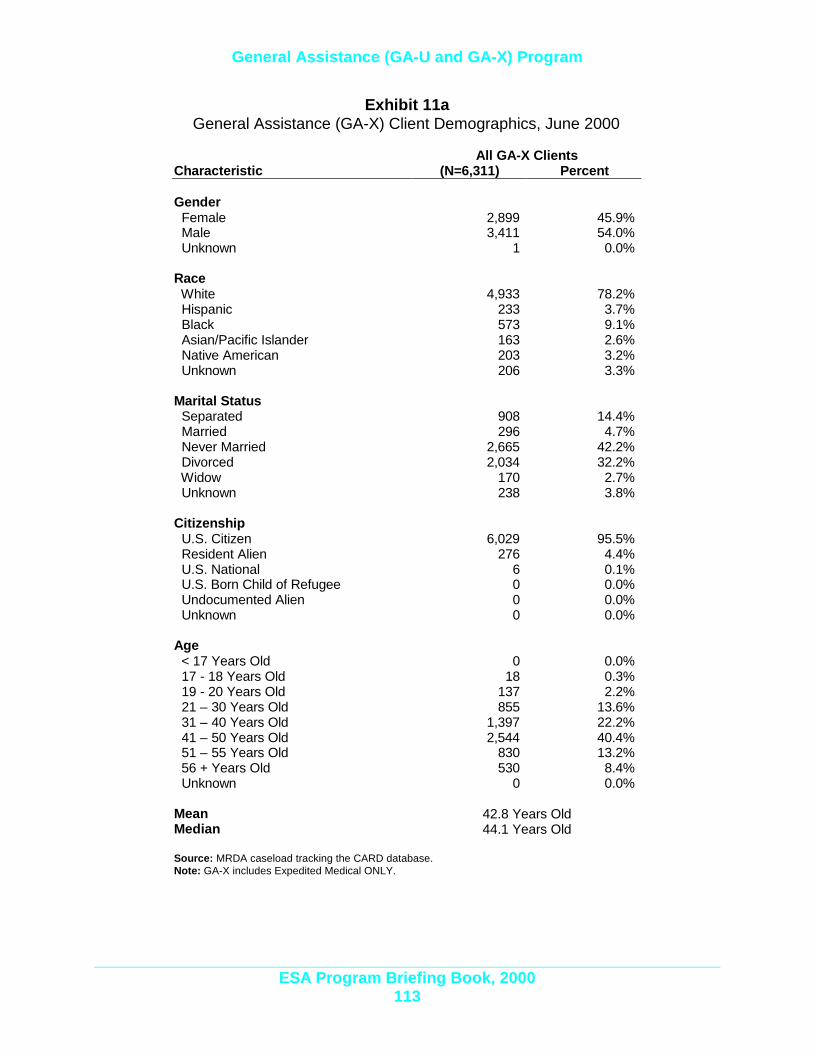
General Assistance (GA-U and GA-X) Program
ESA Program Briefing Book, 2000113
Exhibit 11aGeneral Assistance (GA-X) Client Demographics, June 2000
All GA-X ClientsCharacteristic (N=6,311) Percent
Gender Female 2,899 45.9% Male 3,411 54.0% Unknown 1 0.0%
Race White 4,933 78.2% Hispanic 233 3.7% Black 573 9.1% Asian/Pacific Islander 163 2.6% Native American 203 3.2% Unknown 206 3.3%
Marital Status Separated 908 14.4% Married 296 4.7% Never Married 2,665 42.2% Divorced 2,034 32.2% Widow 170 2.7% Unknown 238 3.8%
Citizenship U.S. Citizen 6,029 95.5% Resident Alien 276 4.4% U.S. National 6 0.1% U.S. Born Child of Refugee 0 0.0% Undocumented Alien 0 0.0% Unknown 0 0.0%
Age < 17 Years Old 0 0.0% 17 - 18 Years Old 18 0.3% 19 - 20 Years Old 137 2.2% 21 – 30 Years Old 855 13.6% 31 – 40 Years Old 1,397 22.2% 41 – 50 Years Old 2,544 40.4% 51 – 55 Years Old 830 13.2% 56 + Years Old 530 8.4% Unknown 0 0.0%
Mean 42.8 Years OldMedian 44.1 Years Old
Source: MRDA caseload tracking the CARD database.Note: GA-X includes Expedited Medical ONLY.
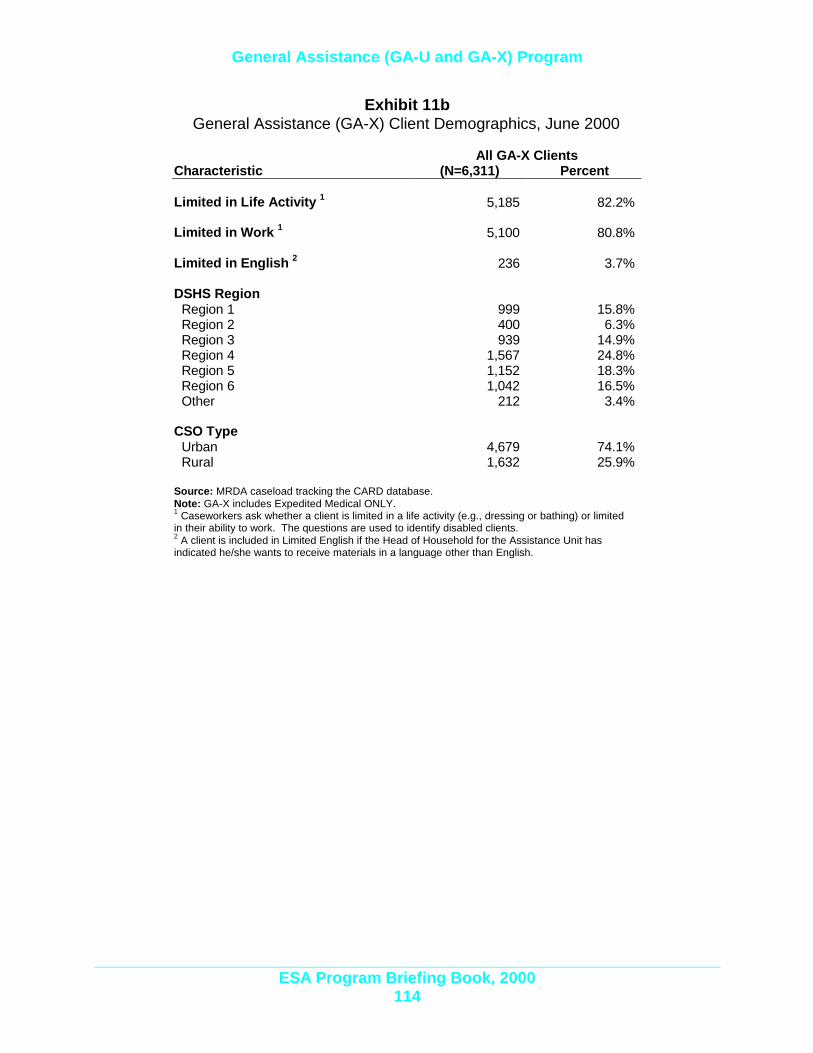
General Assistance (GA-U and GA-X) Program
ESA Program Briefing Book, 2000114
Exhibit 11bGeneral Assistance (GA-X) Client Demographics, June 2000
All GA-X ClientsCharacteristic (N=6,311) Percent
Limited in Life Activity 1 5,185 82.2%
Limited in Work 1 5,100 80.8%
Limited in English 2 236 3.7%
DSHS Region Region 1 999 15.8% Region 2 400 6.3% Region 3 939 14.9% Region 4 1,567 24.8% Region 5 1,152 18.3% Region 6 1,042 16.5% Other 212 3.4%
CSO Type Urban 4,679 74.1% Rural 1,632 25.9%
Source: MRDA caseload tracking the CARD database.Note: GA-X includes Expedited Medical ONLY.1 Caseworkers ask whether a client is limited in a life activity (e.g., dressing or bathing) or limitedin their ability to work. The questions are used to identify disabled clients.2 A client is included in Limited English if the Head of Household for the Assistance Unit hasindicated he/she wants to receive materials in a language other than English.

Other Programs
Exhibits Page
1. Additional Requirements for Emergent Needs AREN Cases (Chart) SFY 1998 to SFY 2000 .................................................................117
2. Additional Requirements for Emergent Needs AREN Cases (Table) SFY 1998 to SFY 2000 .................................................................117
3. AREN Cases as a Percent of the TANF Caseload, SFY 2000................118
4. AREN Cases as a Percent of the TANF Caseload and Total Expenditures SFY 2000 ..................................................................118
5. Percent of TANF Cases with Payments for Additional Requirements-Emergent Needs (AREN) by Type (Chart) SFY 2000 ...................................................................................................119
6. Percent of TANF Cases with Payments for Additional Requirements-Emergent Needs (AREN) by Type (Table) SFY 2000 ...................................................................................................120
7a.b. AREN Client Demographics, June 2000.................................................121
8. Selected CEAP Program Characteristics SFY 1999 and SFY 2000.. ....123
9. CEAP Program Cases SFY 1998 to SFY 2000 (Chart) ...........................124
10. CEAP Program Cases SFY 1998 to SFY 2000 (Table) ..........................124
11. CEAP Applications SFY 1998 to SFY 2000 (Chart) ................................125
12. CEAP Applications SFY 1998 to SFY 2000 (Table) ................................125
13a.b. CEAP Client Demographics, June 2000 .................................................126
14. Selected Diversion Cash Assistance Program Characteristics SFY 1999 and SFY 2000...........................................................................128
15. Diversion Cash Assistance program Cases (Chart) SFY 1999 and SFY 2000 ...........................................................................129
16. Diversion Cash Assistance program Cases (Table)..............................129
17. Diversion Cash Assistance Applications (Chart) SFY 1999 and SFY 2000 ...........................................................................130
18. Diversion Cash Assistance Applications (Table) SFY 1999 and SFY 2000 ...........................................................................130
19a.b. DCA Client Demographics, June 2000 ...................................................131
Other Programs
20. Selected Refugee Assistance Program Characteristics SFY 1999 and SFY 2000...........................................................................133
21. Refugee Assistance Program Cases (Chart) SFY 1998 to SFY 2000 ..............................................................................134
22. Refugee Assistance Program Cases (Table) SFY 1998 to SFY 2000 ..............................................................................134
23. Refugee Assistance Applications (Chart) SFY 1998 to SFY 2000 ..............................................................................135
24. Refugee Assistance Applications (Table) SFY 1998 to SFY 2000 ..............................................................................135
25a.b. Refugee Assistance Client Demographics, June 2000 .........................136
26. Selected SSI program Characteristics SFY 1999 and SFY 2000..........138
27. SSI Combined Program Cases (Chart) SFY 1998 to SFY 2000 .............139
28. SSI Combined Program Cases (Table) SFY 1998 to SFY 2000 .............139
29. SSI Program Cases, by Type (Chart) SFY 1998 to SFY 2000 ................140
30. SSI Program Cases, by Type (Table) SFY 1998 to SFY 2000 ................140
31. Washington Telephone Assistance Program Cases (Chart) SFY 1990 to SFY 2000..............................................................................141
32. Washington Telephone Assistance Program Cases (Table) SFY 1990 to SFY 2000..............................................................................141
Other Programs
ESA Program Briefing Book 2000115
Other Programs
AREN
CEAP
Diversion CashAssistance (DCA)
Refugee CashAssistance (RCA)
SSI
WTAP
This section describes other programs not alreadydiscussed in previous sections. It includes: AdditionalRequirements – Emergent Needs (AREN),Consolidated Emergency Assistance Program (CEAP),Diversion Cash Assistance (DCA), Refugee CashAssistance (RCA), Supplemental Security Income(SSI), and Washington Telephone Assistance Program(WTAP).
Highlights:
? The average monthly AREN caseload was 2,775in SFY 2000, compared to 1,173 in SFY 1999.
? In June 2000, 5.8% TANF cases had ARENpayments, compared to 2.5% in July 1999.
? The majority of AREN recipients was female(59.7%), never married (78.4%), and White(64.7%). The median age for an adult was 29.5years.
? The average monthly CEAP caseload in SFY2000 decreased to 46 cases, down from themonthly average of 203 cases in SFY 1999.1
? The majority of CEAP recipients was female(62.9%), never married (71.4%), and Hispanic(45.2%). The median age was 28.2 years.
? The average monthly caseload for DCAincreased in SFY 2000 (182 cases), compared toSFY 1999 (165 cases).
? The average monthly DCA payment increasedto $1,179.75 in SFY 2000 from $1,133.43 in SFY1999.
? The majority of DCA recipients was female(57.5%), white (69.1%), and never married(71.4%). The median age was 32. 1 years.
1 The CEAP program underwent major changes in SFY 2000, as part ofsettling the “Homeless Lawsuit.” A good portion of the CEAP budget wastransferred to another agency, the Office of Community Trade andEconomic Development. Under a new rule, families that contains amember who is eligible for TANF, SFA, or RCA, are no longer eligible forCEAP. Families are also required to establish eligibility for other assistanceprograms such as SSI, housing assistance and unemploymentcompensation, as an alternative to CEAP. These factors caused thecaseload to decline.
Other Programs
ESA Program Briefing Book 2000116
Other ProgramsContinued
? The average monthly Refugee Cash Assistancecaseload decreased in SFY 2000 (507 cases),compared to SFY 1999 (697 cases).
? The majority of Refugee Cash Assistanceclients was male (53.0%), white (56.1%), andmarried. (31.3%). Most (88.7%) were limited inEnglish.
? The average monthly SSI caseload in SFY 2000was 93,684 cases, compared to 89,176 cases inSFY 1999.
? The annual total of WTAP cases in SFY 2000was 93,078 cases, compared to a total of 89,384cases in SFY 1999.

Other Programs
ESA Program Briefing Book 2000117
Exhibit 1Additional Requirements For Emergent Needs (AREN) Cases
SFY 1998 to SFY 2000
Exhibit 2Additional Requirements For Emergent Needs (AREN) Cases
SFY 1998 to SFY 2000
SFY98 SFY99 SFY00July 1,140 1,220 1,502August 1,141 1,212 2,302September 1,123 1,211 2,574October 1,263 1,209 2,539November 1,027 1,032 2,718December 1,263 1,177 2,995January 1,246 1,020 3,082February 1,195 1,161 2,922March 1,206 1,153 3,182April 1,181 1,106 2,993May 1,179 1,162 3,294June 1,191 1,415 3,201
Monthly Avg. 1,180 1,173 2,775
Source: MRDA caseload tracking using the CARD database.
0
500
1,000
1,500
2,000
2,500
3,000
3,500
Jul-9
7
Oct
-97
Jan-
98
Apr
-98
Jul-9
8
Oct
-98
Jan-
99
Apr
-99
Jul-9
9
Oct
-99
Jan-
00
Apr
-00
Num
ber
of C
ases

Other Programs
ESA Program Briefing Book 2000118
Exhibit 3AREN Cases as a Percent of the TANF Caseload
SFY 2000
Exhibit 4AREN Cases as a Percent of the TANF Caseload
and Total ExpendituresSFY 2000
TANF AREN Percent of Total ARENCases Cases AREN Cases Expenditures
Jul-99 59,476 1,502 2.5% $562,414.43Aug-99 60,057 2,302 3.8% $1,170,707.57Sep-99 59,830 2,574 4.3% $1,321,145.22Oct-99 59,350 2,539 4.3% $1,345,234.20Nov-99 59,125 2,718 4.6% $1,478,790.00Dec-99 59,290 2,995 5.1% $1,698,468.59Jan-00 58,878 3,082 5.2% $1,720,030.39Feb-00 59,560 2,922 4.9% $1,652,366.68Mar-00 59,250 3,182 5.4% $1,819,111.88Apr-00 57,934 2,993 5.2% $1,688,137.64May-00 56,557 3,294 5.8% $1,869,562.35Jun-00 55,360 3,201 5.8% $1,811,200.47
Source: Source: MRDA caseload tracking using the CARD database.Note: In July 1999, ESA implemented a policy to provide AREN payments to preventeviction for cases otherwise ineligible for TANF.
0.0%
1.0%
2.0%
3.0%
4.0%
5.0%
6.0%
7.0%
Jul-9
9
Aug
-99
Sep
-99
Oct
-99
Nov
-99
Dec
-99
Jan-
00
Feb-
00
Mar
-00
Apr
-00
May
-00
Jun-
00
Per
cent
of C
ases

Other Programs
ESA Program Briefing Book 2000119
Exhibit 5Percent of TANF Cases with Payments for
Additional Requirements - Emergent Needs (AREN), by TypeSFY 2000
Source: MRDA caseload tracking using the CARD database.Note: Because many cases have more than one reason to use AREN payments, percentages are calculated by takingthe average monthly caseload by type as the numerator divided by the average monthly unduplicated count of ARENcases (2,775 cases) as the denominator. Therefore, percentages sum to more than 100 percent..
0.0%5.0%
10.0%15.0%20.0%25.0%30.0%35.0%40.0%45.0%
Preven
t Evic
tion
Excepti
on To
Policy
Utility S
hut O
ff
Unkno
wn
Secure
Housin
g Onc
e Evic
ted
Homele
ss
No Fue
l for H
eating
and C
ookin
g
Obtain
New Hou
sing-
Abusiv
e
Obtain
New H
ousin
g - Veri
fiable
No Foo
d
Correc
t a Sud
den M
alfun
ction/U
tility
Clothin
g Due
to Natu
ral Disa
ster
Housin
g Due
to Natu
ral Disa
ster
Pct
. of A
vg. M
ontlh
y C
asel
oad
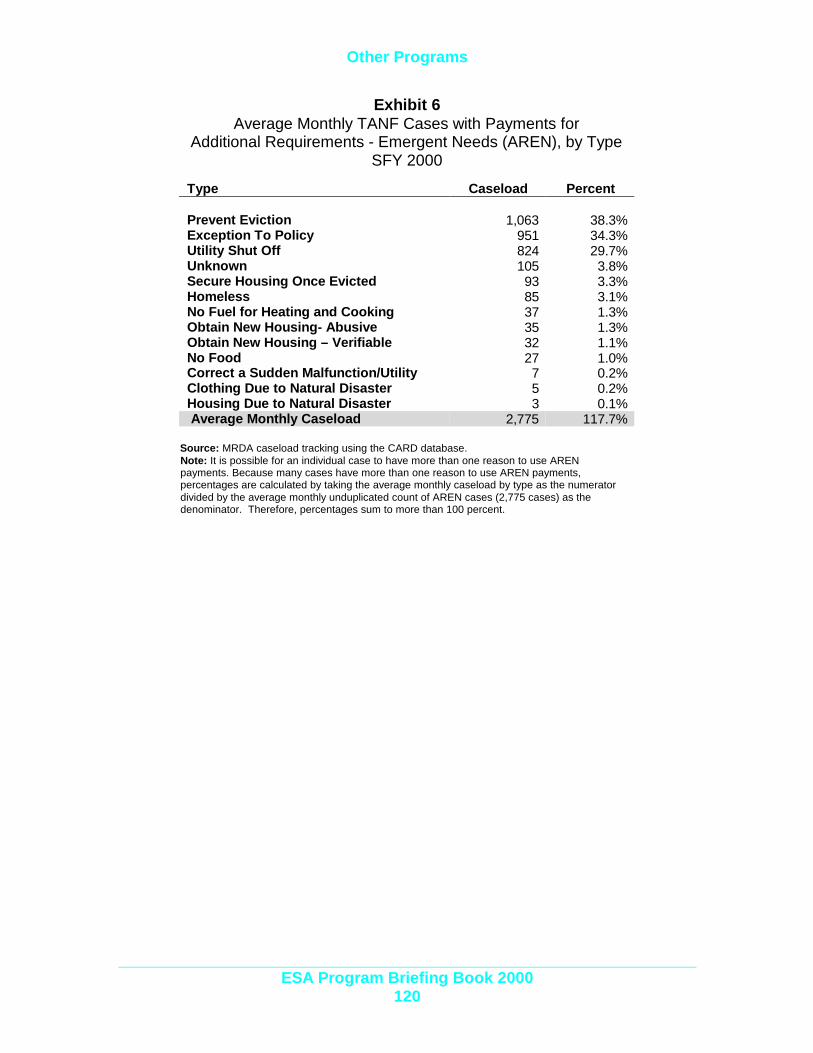
Other Programs
ESA Program Briefing Book 2000120
Exhibit 6Average Monthly TANF Cases with Payments for
Additional Requirements - Emergent Needs (AREN), by TypeSFY 2000
Type Caseload Percent
Prevent Eviction 1,063 38.3%Exception To Policy 951 34.3%Utility Shut Off 824 29.7%Unknown 105 3.8%Secure Housing Once Evicted 93 3.3%Homeless 85 3.1%No Fuel for Heating and Cooking 37 1.3%Obtain New Housing- Abusive 35 1.3%Obtain New Housing – Verifiable 32 1.1%No Food 27 1.0%Correct a Sudden Malfunction/Utility 7 0.2%Clothing Due to Natural Disaster 5 0.2%Housing Due to Natural Disaster 3 0.1% Average Monthly Caseload 2,775 117.7%
Source: MRDA caseload tracking using the CARD database.Note: It is possible for an individual case to have more than one reason to use ARENpayments. Because many cases have more than one reason to use AREN payments,percentages are calculated by taking the average monthly caseload by type as the numeratordivided by the average monthly unduplicated count of AREN cases (2,775 cases) as thedenominator. Therefore, percentages sum to more than 100 percent.
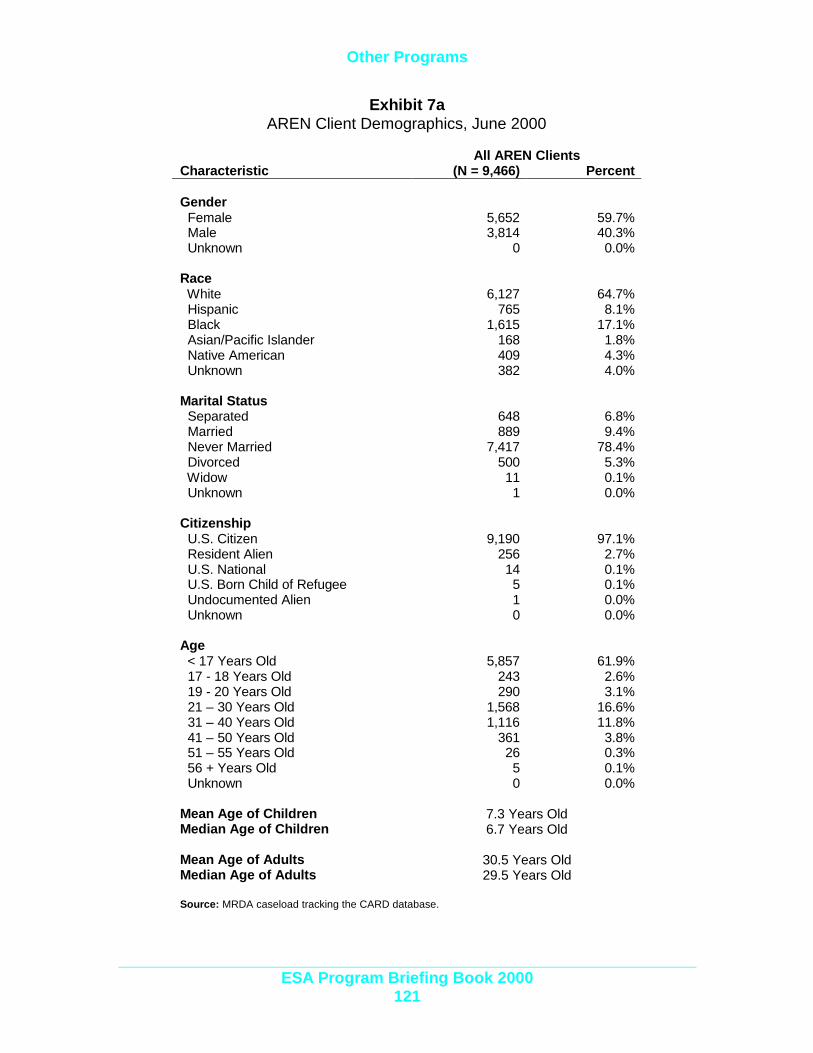
Other Programs
ESA Program Briefing Book 2000121
Exhibit 7aAREN Client Demographics, June 2000
All AREN ClientsCharacteristic (N = 9,466) Percent
Gender Female 5,652 59.7% Male 3,814 40.3% Unknown 0 0.0%
Race White 6,127 64.7% Hispanic 765 8.1% Black 1,615 17.1% Asian/Pacific Islander 168 1.8% Native American 409 4.3% Unknown 382 4.0%
Marital Status Separated 648 6.8% Married 889 9.4% Never Married 7,417 78.4% Divorced 500 5.3% Widow 11 0.1% Unknown 1 0.0%
Citizenship U.S. Citizen 9,190 97.1% Resident Alien 256 2.7% U.S. National 14 0.1% U.S. Born Child of Refugee 5 0.1% Undocumented Alien 1 0.0% Unknown 0 0.0%
Age < 17 Years Old 5,857 61.9% 17 - 18 Years Old 243 2.6% 19 - 20 Years Old 290 3.1% 21 – 30 Years Old 1,568 16.6% 31 – 40 Years Old 1,116 11.8% 41 – 50 Years Old 361 3.8% 51 – 55 Years Old 26 0.3% 56 + Years Old 5 0.1% Unknown 0 0.0%
Mean Age of Children 7.3 Years OldMedian Age of Children 6.7 Years Old
Mean Age of Adults 30.5 Years OldMedian Age of Adults 29.5 Years Old
Source: MRDA caseload tracking the CARD database.
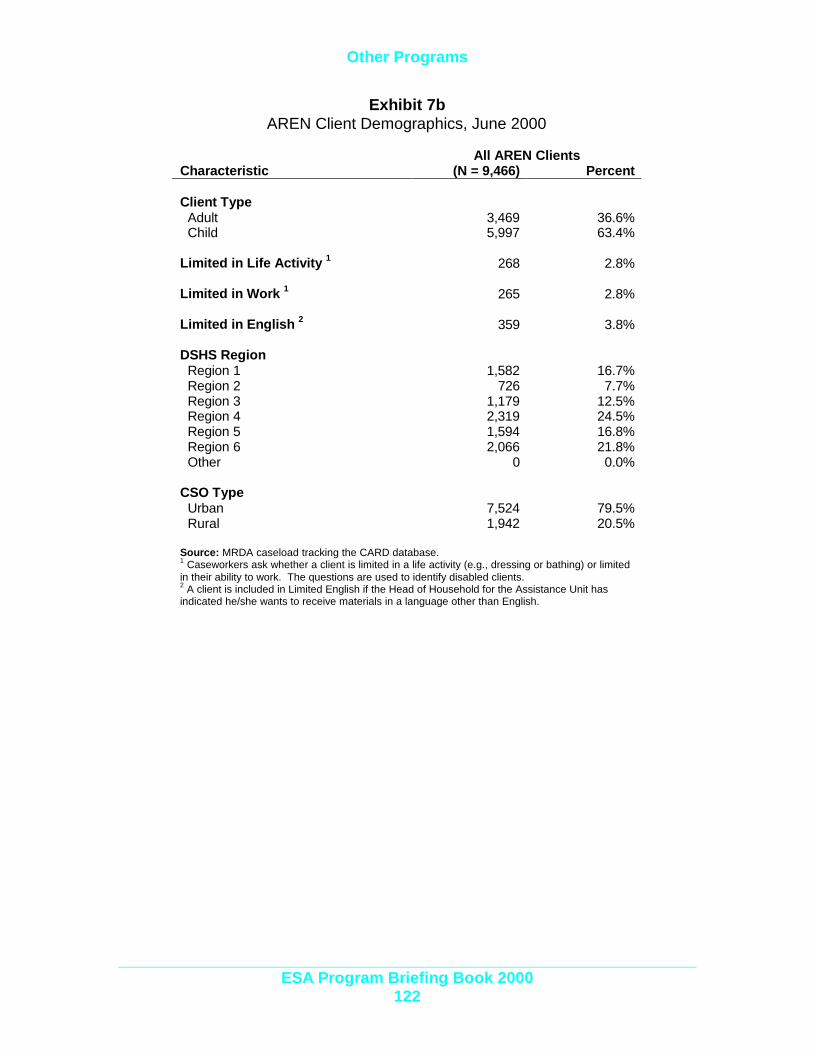
Other Programs
ESA Program Briefing Book 2000122
Exhibit 7bAREN Client Demographics, June 2000
All AREN ClientsCharacteristic (N = 9,466) Percent
Client Type Adult 3,469 36.6% Child 5,997 63.4%
Limited in Life Activity 1 268 2.8%
Limited in Work 1 265 2.8%
Limited in English 2 359 3.8%
DSHS Region Region 1 1,582 16.7% Region 2 726 7.7% Region 3 1,179 12.5% Region 4 2,319 24.5% Region 5 1,594 16.8% Region 6 2,066 21.8% Other 0 0.0%
CSO Type Urban 7,524 79.5% Rural 1,942 20.5%
Source: MRDA caseload tracking the CARD database.1 Caseworkers ask whether a client is limited in a life activity (e.g., dressing or bathing) or limitedin their ability to work. The questions are used to identify disabled clients.2 A client is included in Limited English if the Head of Household for the Assistance Unit hasindicated he/she wants to receive materials in a language other than English.
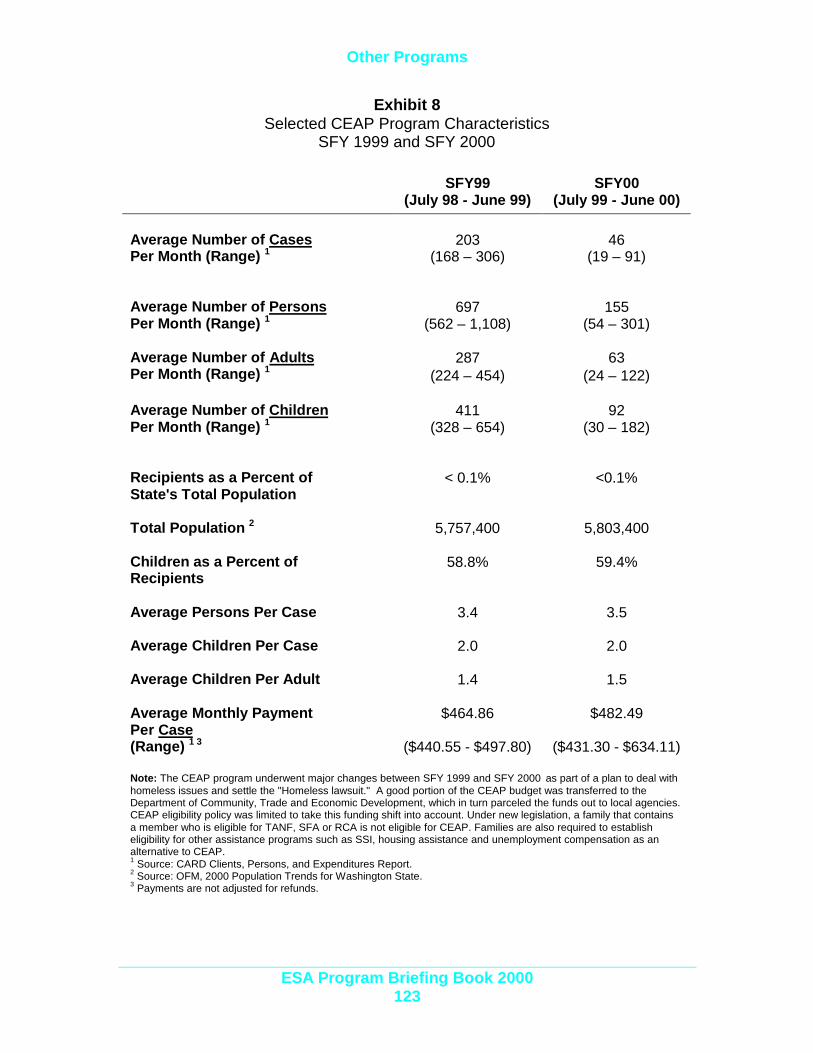
Other Programs
ESA Program Briefing Book 2000123
Exhibit 8Selected CEAP Program Characteristics
SFY 1999 and SFY 2000
SFY99(July 98 - June 99)
SFY00(July 99 - June 00)
203 46Average Number of CasesPer Month (Range) 1 (168 – 306) (19 – 91)
697 155Average Number of PersonsPer Month (Range) 1 (562 – 1,108) (54 – 301)
287 63Average Number of AdultsPer Month (Range) 1 (224 – 454) (24 – 122)
411 92Average Number of ChildrenPer Month (Range) 1 (328 – 654) (30 – 182)
Recipients as a Percent ofState's Total Population
< 0.1% <0.1%
Total Population 2 5,757,400 5,803,400
Children as a Percent ofRecipients
58.8% 59.4%
Average Persons Per Case 3.4 3.5
Average Children Per Case 2.0 2.0
Average Children Per Adult 1.4 1.5
Average Monthly PaymentPer Case
$464.86 $482.49
(Range) 1 3 ($440.55 - $497.80) ($431.30 - $634.11)
Note: The CEAP program underwent major changes between SFY 1999 and SFY 2000 as part of a plan to deal withhomeless issues and settle the "Homeless lawsuit." A good portion of the CEAP budget was transferred to theDepartment of Community, Trade and Economic Development, which in turn parceled the funds out to local agencies.CEAP eligibility policy was limited to take this funding shift into account. Under new legislation, a family that containsa member who is eligible for TANF, SFA or RCA is not eligible for CEAP. Families are also required to establisheligibility for other assistance programs such as SSI, housing assistance and unemployment compensation as analternative to CEAP.1 Source: CARD Clients, Persons, and Expenditures Report.2 Source: OFM, 2000 Population Trends for Washington State.3 Payments are not adjusted for refunds.
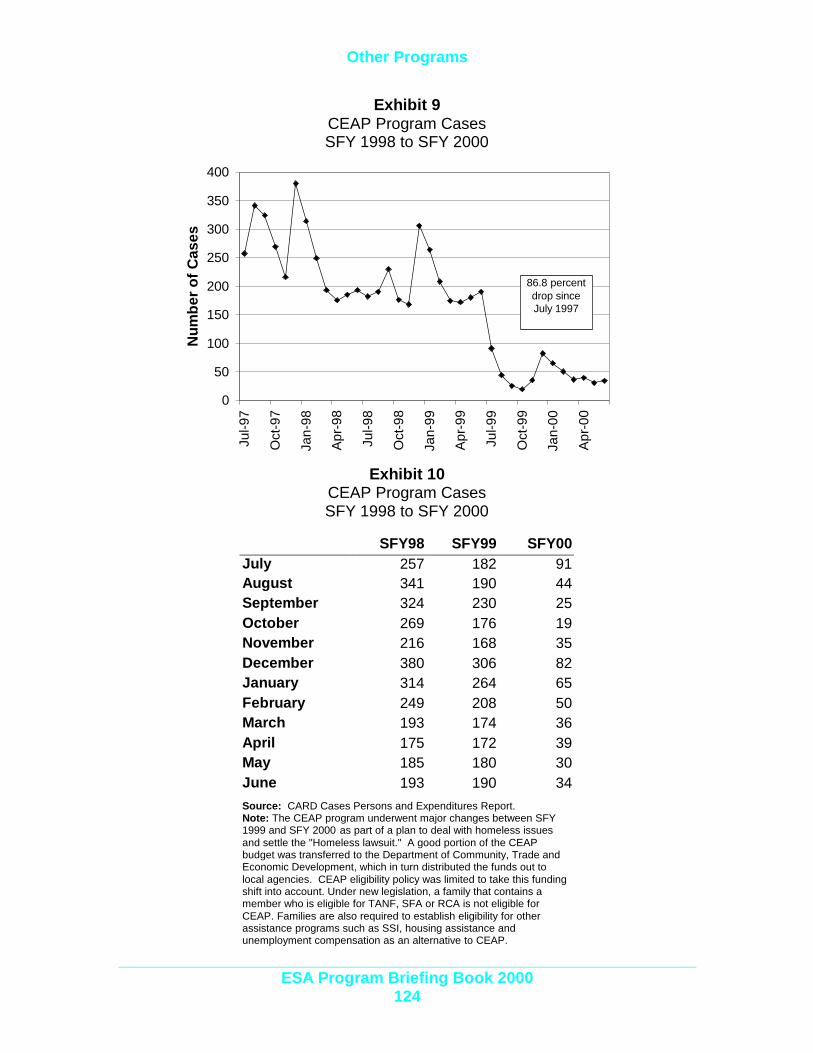
Other Programs
ESA Program Briefing Book 2000124
Exhibit 9CEAP Program CasesSFY 1998 to SFY 2000
Exhibit 10CEAP Program CasesSFY 1998 to SFY 2000
SFY98 SFY99 SFY00July 257 182 91August 341 190 44September 324 230 25October 269 176 19November 216 168 35December 380 306 82January 314 264 65February 249 208 50March 193 174 36April 175 172 39May 185 180 30June 193 190 34Source: CARD Cases Persons and Expenditures Report.Note: The CEAP program underwent major changes between SFY1999 and SFY 2000 as part of a plan to deal with homeless issuesand settle the "Homeless lawsuit." A good portion of the CEAPbudget was transferred to the Department of Community, Trade andEconomic Development, which in turn distributed the funds out tolocal agencies. CEAP eligibility policy was limited to take this fundingshift into account. Under new legislation, a family that contains amember who is eligible for TANF, SFA or RCA is not eligible forCEAP. Families are also required to establish eligibility for otherassistance programs such as SSI, housing assistance andunemployment compensation as an alternative to CEAP.
0
50
100
150
200
250
300
350
400
Jul-9
7
Oct
-97
Jan-
98
Apr
-98
Jul-9
8
Oct
-98
Jan-
99
Apr
-99
Jul-9
9
Oct
-99
Jan-
00
Apr
-00
Num
ber
of C
ases
86.8 percentdrop sinceJuly 1997

Other Programs
ESA Program Briefing Book 2000125
Exhibit 11CEAP Applications
SFY 1998 to SFY 2000
Exhibit 12CEAP Applications
SFY 1998 to SFY 2000
SFY98 SFY99 SFY00July 372 252 139August 470 248 77September 452 282 64October 377 220 39November 319 254 72December 535 416 147January 455 343 109February 330 272 75March 282 258 71April 252 228 74May 243 236 58June 241 249 52
Source: MRDA caseload tracking using the CARD database.Note: Applications were identified using application dates inthe ACES system. All applications entered into ACES arecounted, including new cases, closed cases reapplying forbenefits and clients added to open cases.
0
100
200
300
400
500
600
Jul-9
7
Oct
-97
Jan-
98
Apr
-98
Jul-9
8
Oct
-98
Jan-
99
Apr
-99
Jul-9
9
Oct
-99
Jan-
00
Apr
-00
Num
ber
of C
ases
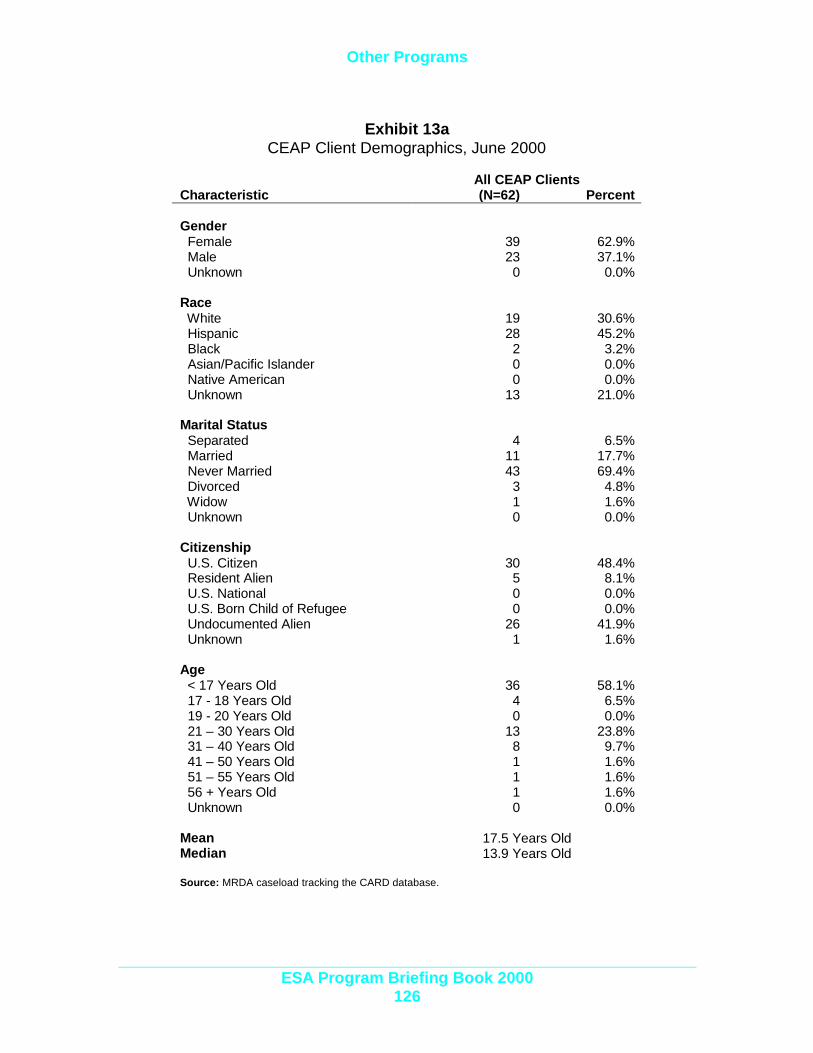
Other Programs
ESA Program Briefing Book 2000126
Exhibit 13aCEAP Client Demographics, June 2000
All CEAP ClientsCharacteristic (N=62) Percent
Gender Female 39 62.9% Male 23 37.1% Unknown 0 0.0%
Race White 19 30.6% Hispanic 28 45.2% Black 2 3.2% Asian/Pacific Islander 0 0.0% Native American 0 0.0% Unknown 13 21.0%
Marital Status Separated 4 6.5% Married 11 17.7% Never Married 43 69.4% Divorced 3 4.8% Widow 1 1.6% Unknown 0 0.0%
Citizenship U.S. Citizen 30 48.4% Resident Alien 5 8.1% U.S. National 0 0.0% U.S. Born Child of Refugee 0 0.0% Undocumented Alien 26 41.9% Unknown 1 1.6%
Age < 17 Years Old 36 58.1% 17 - 18 Years Old 4 6.5% 19 - 20 Years Old 0 0.0% 21 – 30 Years Old 13 23.8% 31 – 40 Years Old 8 9.7% 41 – 50 Years Old 1 1.6% 51 – 55 Years Old 1 1.6% 56 + Years Old 1 1.6% Unknown 0 0.0%
Mean 17.5 Years OldMedian 13.9 Years Old
Source: MRDA caseload tracking the CARD database.

Other Programs
ESA Program Briefing Book 2000127
Exhibit 13bCEAP Client Demographics, June 2000
All CEAP ClientsCharacteristic (N=62) Percent
Client Type Adult 26 41.9% Child 36 58.1%
Limited in Life Activity 1 0 0.0%
Limited in Work 1 0 0.0%
Limited in English 2 30 48.4%
DSHS Region Region 1 10 16.1% Region 2 20 32.3% Region 3 16 25.8% Region 4 0 0.0% Region 5 5 8.1% Region 6 11 17.7% Other 0 0.0%
CSO Type Urban 39 62.9% Rural 23 37.1%
Source: MRDA caseload tracking the CARD database.1 Caseworkers ask whether a client is limited in a life activity (e.g., dressing or bathing) or limitedin their ability to work. The questions are used to identify disabled clients.2 A client is included in Limited English if the Head of Household for the Assistance Unit hasindicated he/she wants to receive materials in a language other than English.

Other Programs
ESA Program Briefing Book 2000128
Exhibit 14Selected Diversion Cash Assistance Program Characteristics
SFY 1999 and SFY 2000
SFY99(July 98 - June 99)
SFY00(July 99 - June 00)
165 182Average Number of CasesPer Month (Range) 1 (130 – 223) (130 – 212)
542 590Average Number of PersonsPer Month (Range) 1 (413 – 742) (446 – 680)
227 245Average Number of AdultsPer Month (Range) 1 (174 – 302) (185 – 284)
315 345Average Number of ChildrenPer Month (Range) 1 (239 – 440) (261 – 396)
Recipients as a Percent ofState's Total Population
< 0.1% < 0.1%
Total Population2 5,757,400 5,803,400
Children as a Percent ofRecipients
58.0% 58.5%
Average Persons Per Case 3.3 3.3
Average Children Per Case 1.9 1.9
Average Children Per Adult 1.4 1.4
Average Monthly PaymentPer Case
$1,133.43 $1,179.75
(Range) 1 3 ($1,057.65 -$1,203.04)
($1,117.40 -$1,216.81)
1 Source: CARD Clients, Persons, and Expenditures Report.2 Source: OFM, 1999 Population Trends for Washington State.3 Payments are not adjusted for refunds.
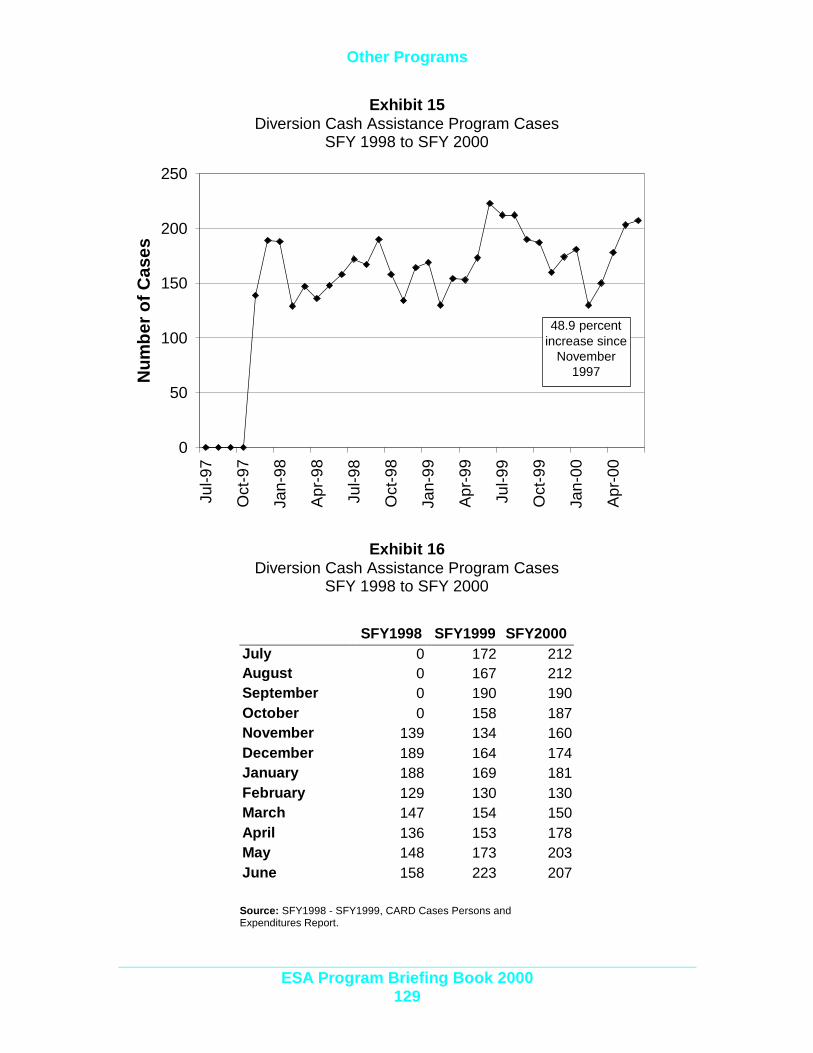
Other Programs
ESA Program Briefing Book 2000129
Exhibit 15Diversion Cash Assistance Program Cases
SFY 1998 to SFY 2000
Exhibit 16Diversion Cash Assistance Program Cases
SFY 1998 to SFY 2000
SFY1998 SFY1999 SFY2000July 0 172 212August 0 167 212September 0 190 190October 0 158 187November 139 134 160December 189 164 174January 188 169 181February 129 130 130March 147 154 150April 136 153 178May 148 173 203June 158 223 207
Source: SFY1998 - SFY1999, CARD Cases Persons andExpenditures Report.
0
50
100
150
200
250
Jul-9
7
Oct
-97
Jan-
98
Apr
-98
Jul-9
8
Oct
-98
Jan-
99
Apr
-99
Jul-9
9
Oct
-99
Jan-
00
Apr
-00
Num
ber
of C
ases
48.9 percentincrease since
November 1997
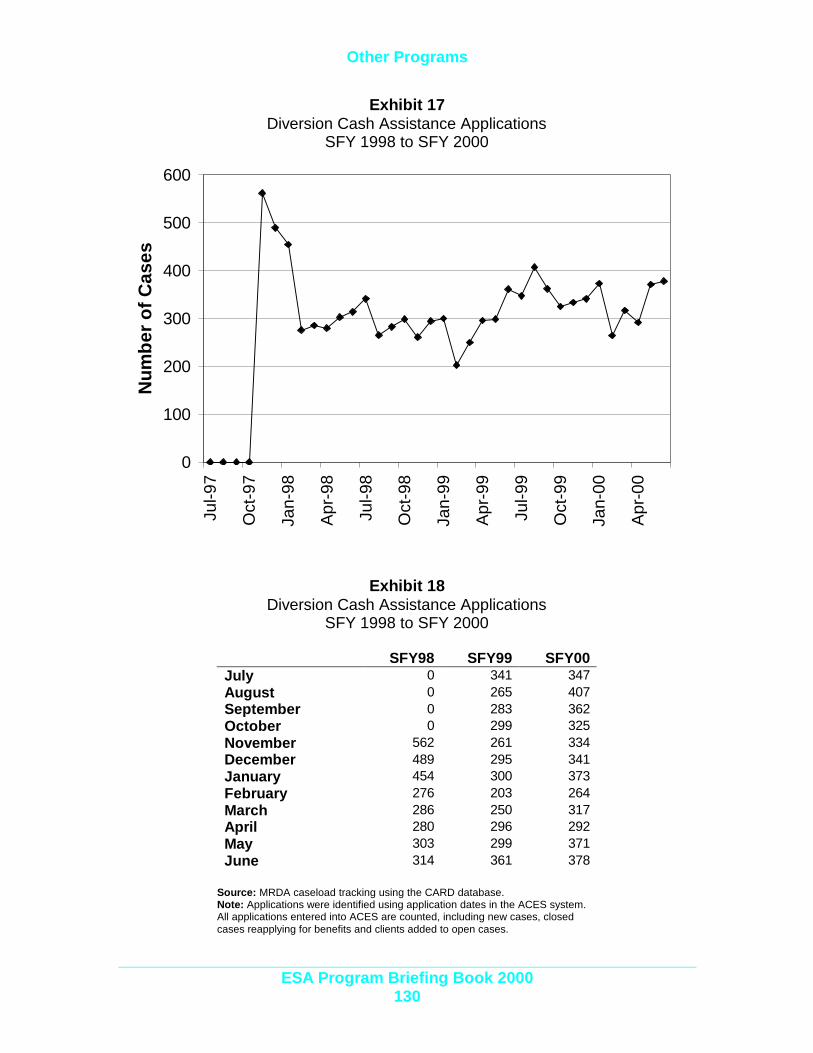
Other Programs
ESA Program Briefing Book 2000130
Exhibit 17Diversion Cash Assistance Applications
SFY 1998 to SFY 2000
Exhibit 18Diversion Cash Assistance Applications
SFY 1998 to SFY 2000
SFY98 SFY99 SFY00July 0 341 347August 0 265 407September 0 283 362October 0 299 325November 562 261 334December 489 295 341January 454 300 373February 276 203 264March 286 250 317April 280 296 292May 303 299 371June 314 361 378
Source: MRDA caseload tracking using the CARD database.Note: Applications were identified using application dates in the ACES system.All applications entered into ACES are counted, including new cases, closedcases reapplying for benefits and clients added to open cases.
0
100
200
300
400
500
600
Jul-9
7
Oct
-97
Jan-
98
Apr
-98
Jul-9
8
Oct
-98
Jan-
99
Apr
-99
Jul-9
9
Oct
-99
Jan-
00
Apr
-00
Num
ber
of C
ases

Other Programs
ESA Program Briefing Book 2000131
Exhibit 19aDCA Client Demographics, June 2000
All ClientsCharacteristic (N=664) Percent
Gender Female 382 57.5% Male 282 42.5% Unknown 0 0.0%
Race White 459 69.1% Hispanic 101 15.2% Black 49 7.4% Asian/Pacific Islander 9 1.4% Native American 14 2.1% Unknown 32 4.8%
Marital Status Separated 38 5.7% Married 116 17.5% Never Married 474 71.4% Divorced 36 5.4% Widow 0 0.0% Unknown 0 0.0%
Citizenship U.S. Citizen 645 97.1% Resident Alien 19 2.9% U.S. National 0 0.0% U.S. Born Child of Refugee 0 0.0% Undocumented Alien 0 0.0% Unknown 0 0.0%
Age < 17 Years Old 394 59.3% 17 - 18 Years Old 13 2.0% 19 - 20 Years Old 11 1.7% 21 – 30 Years Old 116 17.4% 31 – 40 Years Old 96 14.5% 41 – 50 Years Old 33 5.0% 51 – 55 Years Old 1 0.2% 56 + Years Old 0 0.0% Unknown 0 0.0%
Mean 17.1 Years OldMedian 13.4 Years Old
Source: MRDA caseload tracking the CARD database.

Other Programs
ESA Program Briefing Book 2000132
Exhibit 19bDCA Client Demographics, June 2000
All ClientsCharacteristic (N=664) Percent
Client Type Adult 259 39.0% Child 399 60.1%
Limited in Life Activity 1 11 1.7%
Limited in Work 1 11 1.7%
Limited in English 2 28 4.2%
DSHS Region Region 1 134 20.2% Region 2 166 25.0% Region 3 86 13.0% Region 4 39 5.9% Region 5 65 9.8% Region 6 174 26.2% Other 0 0.0%
CSO Type Urban 427 64.3% Rural 237 35.7%
Source: MRDA caseload tracking the CARD database.1 Caseworkers ask whether a client is limited in a life activity (e.g., dressing or bathing) or limitedin their ability to work. The questions are used to identify disabled clients.2 A client is included in Limited English if the Head of Household for the Assistance Unit hasindicated he/she wants to receive materials in a language other than English.

Other Programs
ESA Program Briefing Book 2000133
Exhibit 20Selected Refugee Assistance Program Characteristics
SFY 1999 and SFY 2000
SFY99(July 98 – June 99)
SFY00(July 99 - June 00)
697 507Average Number of CasesPer Month (Range) 1 4 (528 – 791) (400 – 600)
971 630Average Number of PersonsPer Month (Range) 1 (703 – 1,120) (491 – 726)
864 602Average Number of AdultsPer Month (Range) 1 (645 – 974) (468 – 710)
107 28Average Number of ChildrenPer Month (Range) 1 (58 – 156) (10 – 63)
Recipients as a Percent ofState's Total Population
< 0.1% < 0.1%
Total Population 2 5,757,400 5,803,400
Children as a Percent ofRecipients
10.8% 4.4%
Average Persons Per Case 1.4 1.2
Average Children Per Case 0.2 < 0.1
Average Children Per Adult 0.1 < 0.1
Average Monthly PaymentPer Case
$351.48 $334.14
(Range) 1 3 ($335.90 - $363.91) ($319.06 - $350.02)
1 Source: CARD Clients, Persons, and Expenditures Report.2 Source: OFM, 2000 Population Trends for Washington State.3 Payments are not adjusted for refunds.
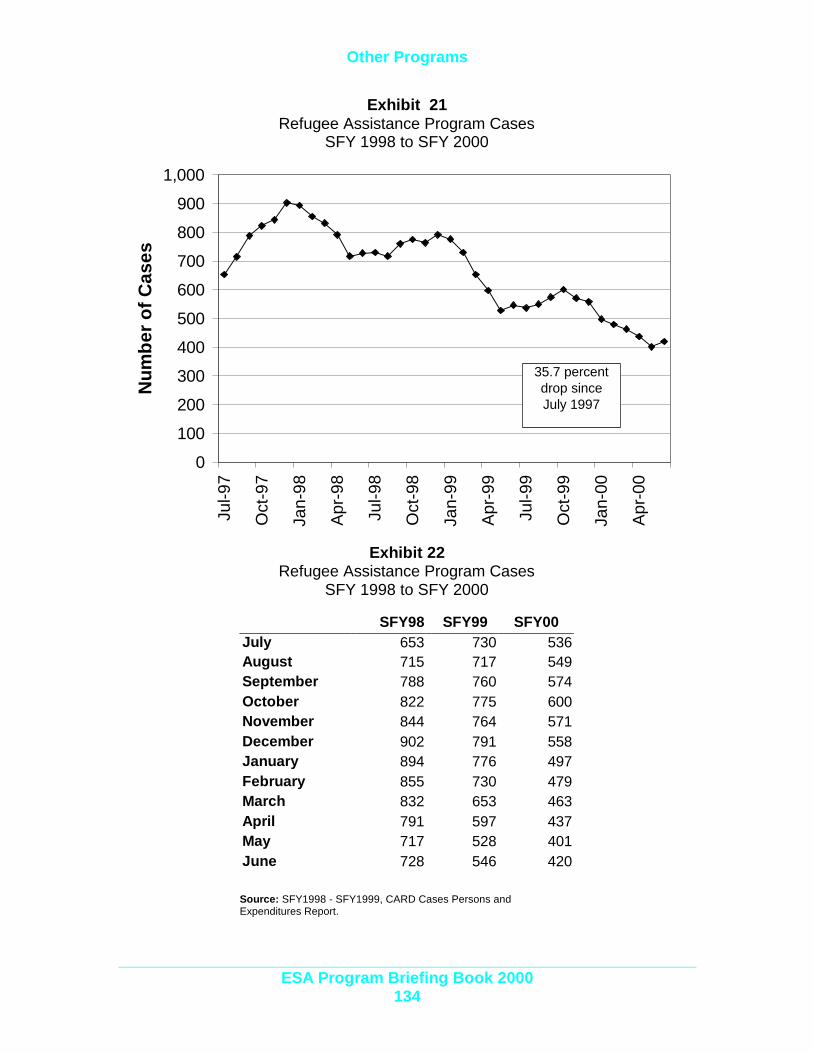
Other Programs
ESA Program Briefing Book 2000134
Exhibit 21Refugee Assistance Program Cases
SFY 1998 to SFY 2000
Exhibit 22Refugee Assistance Program Cases
SFY 1998 to SFY 2000
SFY98 SFY99 SFY00July 653 730 536August 715 717 549September 788 760 574October 822 775 600November 844 764 571December 902 791 558January 894 776 497February 855 730 479March 832 653 463April 791 597 437May 717 528 401June 728 546 420
Source: SFY1998 - SFY1999, CARD Cases Persons andExpenditures Report.
0
100
200
300
400
500
600
700
800
900
1,000
Jul-9
7
Oct
-97
Jan-
98
Apr
-98
Jul-9
8
Oct
-98
Jan-
99
Apr
-99
Jul-9
9
Oct
-99
Jan-
00
Apr
-00
Num
ber
of C
ases
35.7 percent drop sinceJuly 1997

Other Programs
ESA Program Briefing Book 2000135
Exhibit 23Refugee Assistance Applications
SFY 1998 to SFY 2000
Exhibit 24Refugee Assistance Applications
SFY 1998 to SFY 2000
SFY98 SFY99 SFY00July 182 146 133August 180 160 145September 211 213 148October 162 147 117November 158 154 99December 177 159 113January 158 102 101February 112 111 100March 172 124 116April 144 123 105May 130 116 134June 174 145 105
Source: MRDA caseload tracking using the CARD database.Note: Applications were identified using application dates in theACES system. All applications entered into ACES are counted,including new cases, closed cases reapplying for benefits and clientsadded to open cases.
0
50
100
150
200
250
Jul-9
7
Oct
-97
Jan-
98
Apr
-98
Jul-9
8
Oct
-98
Jan-
99
Apr
-99
Jul-9
9
Oct
-99
Jan-
00
Apr
-00
Num
ber
of C
ases
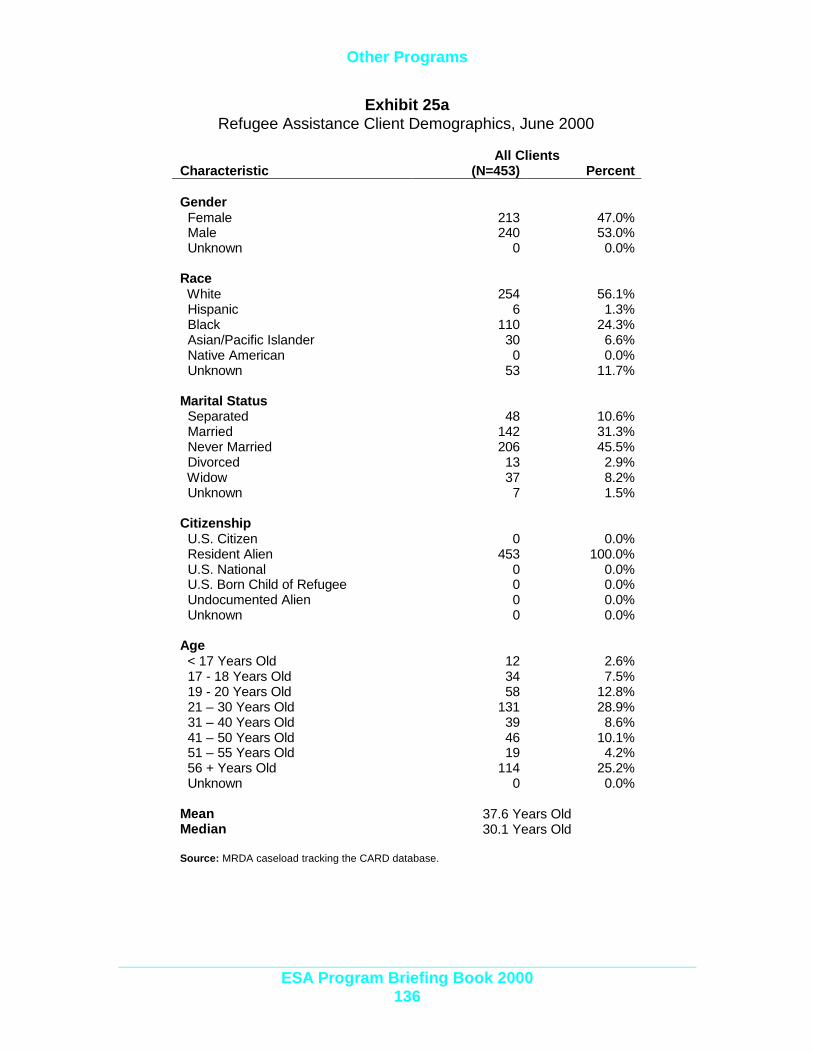
Other Programs
ESA Program Briefing Book 2000136
Exhibit 25aRefugee Assistance Client Demographics, June 2000
All ClientsCharacteristic (N=453) Percent
Gender Female 213 47.0% Male 240 53.0% Unknown 0 0.0%
Race White 254 56.1% Hispanic 6 1.3% Black 110 24.3% Asian/Pacific Islander 30 6.6% Native American 0 0.0% Unknown 53 11.7%
Marital Status Separated 48 10.6% Married 142 31.3% Never Married 206 45.5% Divorced 13 2.9% Widow 37 8.2% Unknown 7 1.5%
Citizenship U.S. Citizen 0 0.0% Resident Alien 453 100.0% U.S. National 0 0.0% U.S. Born Child of Refugee 0 0.0% Undocumented Alien 0 0.0% Unknown 0 0.0%
Age < 17 Years Old 12 2.6% 17 - 18 Years Old 34 7.5% 19 - 20 Years Old 58 12.8% 21 – 30 Years Old 131 28.9% 31 – 40 Years Old 39 8.6% 41 – 50 Years Old 46 10.1% 51 – 55 Years Old 19 4.2% 56 + Years Old 114 25.2% Unknown 0 0.0%
Mean 37.6 Years OldMedian 30.1 Years Old
Source: MRDA caseload tracking the CARD database.
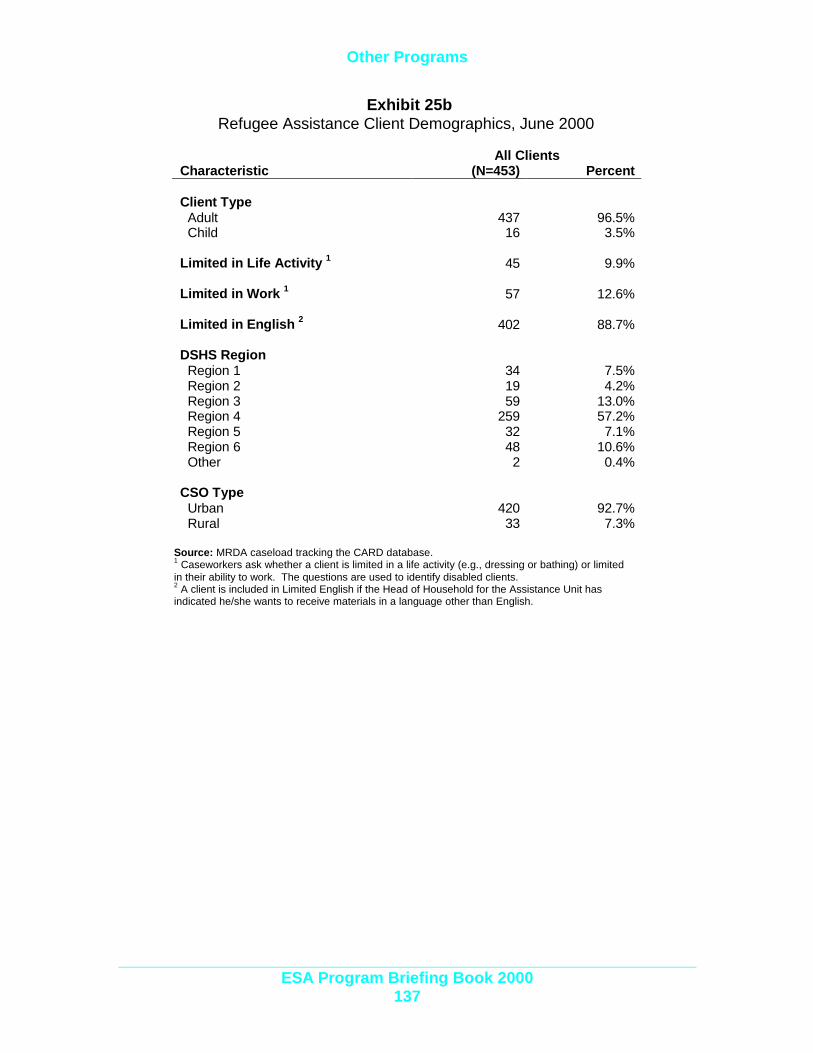
Other Programs
ESA Program Briefing Book 2000137
Exhibit 25bRefugee Assistance Client Demographics, June 2000
All ClientsCharacteristic (N=453) Percent
Client Type Adult 437 96.5% Child 16 3.5%
Limited in Life Activity 1 45 9.9%
Limited in Work 1 57 12.6%
Limited in English 2 402 88.7%
DSHS Region Region 1 34 7.5% Region 2 19 4.2% Region 3 59 13.0% Region 4 259 57.2% Region 5 32 7.1% Region 6 48 10.6% Other 2 0.4%
CSO Type Urban 420 92.7% Rural 33 7.3%
Source: MRDA caseload tracking the CARD database.1 Caseworkers ask whether a client is limited in a life activity (e.g., dressing or bathing) or limitedin their ability to work. The questions are used to identify disabled clients.2 A client is included in Limited English if the Head of Household for the Assistance Unit hasindicated he/she wants to receive materials in a language other than English.

Other Programs
ESA Program Briefing Book 2000138
Exhibit 26Selected SSI Program Characteristics
SFY 1999 and SFY 2000
SFY99(July 98 - June 99)
SFY00(July 99 – June 00)
89,176 93,684Average Number of CasesPer Month (Range) 1 (88,192 – 90,169) (92,317 – 94,795)
92,838 94,828Average Number of PersonsPer Month (Range) 1 (91,719 – 93,955) (93,906 – 95,866)
N/A N/AAverage Number of AdultsPer Month (Range) 1
N/A N/AAverage Number of ChildrenPer Month (Range) 1
Recipients as a Percent ofState's Total Population
1.6% 1.6%
Total Population 2 5,757,400 5,803,400
Children as a Percent ofRecipients
N/A N/A
Average Persons Per Case 1.0 1.0
Average Children Per Case N/A N/A
Average Children Per Adult N/A N/A
Average Monthly PaymentPer Case
N/A $414.58
(Range) 1 3 N/A N/A
Note: Includes cases that received SSI benefits from either state or federal funding streams.1 Source: Blue Books.2 Source: OFM, 2000 Population Trends for Washington State.3 Payments are not adjusted for refunds.

Other Programs
ESA Program Briefing Book 2000139
Exhibit 27SSI Combined Program Cases
SFY 1998 to SFY 2000
Exhibit 28SSI Combined Program Cases
SFY 1998 to SFY 2000
SFY98 SFY99 SFY00July 87,845 88,428 90,495August 87,959 88,192 90,065September 88,059 88,497 91,048October 88,157 88,646 90,720November 87,843 88,790 90,517December 88,171 89,063 90,618January 87,927 89,009 90,564February 87,803 89,615 90,771March 88,073 89,603 91,602April 87,952 90,197 91,422May 88,134 89,897 91,655June 88,144 90,169 91,885
Source: Blue Books.Note: Includes cases that received SSI benefits from either state orfederal funding streams.
75,000
80,000
85,000
90,000
95,000
100,000
Jul-9
7
Oct
-97
Jan-
98
Apr
-98
Jul-9
8
Oct
-98
Jan-
99
Apr
-99
Jul-9
9
Oct
-99
Jan-
00
Apr
-00
Num
ber
of C
ases
4.6 percentincrease since
July 1997
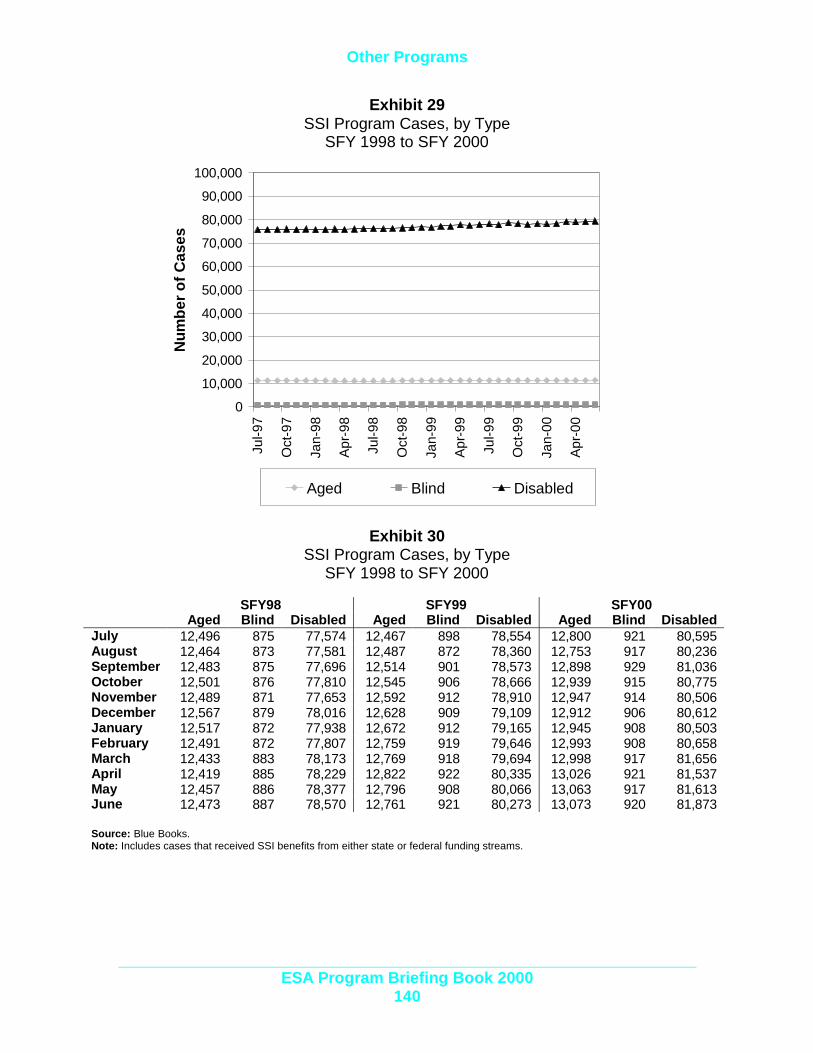
Other Programs
ESA Program Briefing Book 2000140
Exhibit 29SSI Program Cases, by Type
SFY 1998 to SFY 2000
Exhibit 30SSI Program Cases, by Type
SFY 1998 to SFY 2000
SFY98 SFY99 SFY00Aged Blind Disabled Aged Blind Disabled Aged Blind Disabled
July 12,496 875 77,574 12,467 898 78,554 12,800 921 80,595August 12,464 873 77,581 12,487 872 78,360 12,753 917 80,236September 12,483 875 77,696 12,514 901 78,573 12,898 929 81,036October 12,501 876 77,810 12,545 906 78,666 12,939 915 80,775November 12,489 871 77,653 12,592 912 78,910 12,947 914 80,506December 12,567 879 78,016 12,628 909 79,109 12,912 906 80,612January 12,517 872 77,938 12,672 912 79,165 12,945 908 80,503February 12,491 872 77,807 12,759 919 79,646 12,993 908 80,658March 12,433 883 78,173 12,769 918 79,694 12,998 917 81,656April 12,419 885 78,229 12,822 922 80,335 13,026 921 81,537May 12,457 886 78,377 12,796 908 80,066 13,063 917 81,613June 12,473 887 78,570 12,761 921 80,273 13,073 920 81,873
Source: Blue Books.Note: Includes cases that received SSI benefits from either state or federal funding streams.
0
10,000
20,000
30,000
40,000
50,000
60,000
70,000
80,000
90,000
100,000
Jul-9
7
Oct
-97
Jan-
98
Apr
-98
Jul-9
8
Oct
-98
Jan-
99
Apr
-99
Jul-9
9
Oct
-99
Jan-
00
Apr
-00
Num
ber
of C
ases
Aged Blind Disabled

Other Programs
ESA Program Briefing Book 2000141
Exhibit 31Washington Telephone Assistance Program Cases
SFY 1990 to SFY 2000
Exhibit 32Washington Telephone Assistance Program Cases
SFY 1990 to SFY 2000
State FiscalYear Cases1990 46,2421991 69,1331992 83,5091993 94,5771994 102,7651995 108,1931996 106,1451997 113,4501998 97,8881999 89,3842000 93,078
Source: Information System ServicesDivision (ISSD).
0
20,000
40,000
60,000
80,000
100,000
120,000
1990
1991
1992
1993
1994
1995
1996
1997
1998
1999
2000
State Fiscal Year
Num
ber
of C
ases

Expenditures
Exhibits Page
1. State Budget Overview – All Funds1999-01 Biennium (including Supplemental) .................................. 145
2. DSHS Budget Overview – All Funds1999-01 Biennium (including Supplemental) .................................. 145
3. State Budget Overview – General Fund State1999-01 Biennium (including Supplemental) .................................. 146
4. DSHS Budget Overview – General Fund State1999-01 Biennium (including Supplemental) .................................. 146
5a. Economic Services Administration Actual and Projected Program and Administrative Expenditures 147
5b. Economic Services Administration Actual and Projected Program and Administrative Expenditures 148
6a. Actual and Projected Grant Expenditures....................................... 150
6b. Actual and Projected Grant Expenditures....................................... 151
7. State Grant Assistance Expenditures Over Selected Biennia ....... 152
8. Summary of Income Assistance Program Participation, BudgetFunding Stream and Match Rates, Total Annual Budget............... 153
9. Summary of Income Assistance Program Participation, BudgetFunding Stream ................................................................................. 153
10. TANF Program as a Percent of the State General Fund................. 154
11. WorkFirst Program Expenditures .................................................... 156
12a. Actual and Projected Administrative Expenditures and Staffing Levels for Selected Biennia .............................................................. 158
12b. Actual and Projected Administrative Expenditures and Staffing Levels for Selected Biennia .............................................................. 159
Expenditures
ESA Program Briefing Book 2000143
ExpendituresIntroduction
This section presents expenditures of ESA’s programs. Theinformation is divided into sub-sections:
? Expenditures Overview? Cash Grant Assistance? WorkFirst Program? Administrative Expenditures
Each sub-section begins with a brief narrative.
State expenditures for programs such as TemporaryAssistance for Needy Families (TANF), and most child careassistance, are affected by block grants. Block grants place a“lid” on the amount of federal funding available.
Federal law requires states to maintain “historic levels ofspending” for the programs consolidated in the TANF blockgrant. This state spending is known as Maintenance of Effort(MOE). Failure to spend state dollars at that level can result ina reduced block grant payment and require increases in statespending. States must spend at least 75% of what they hadhistorically spent on these programs, based on their 1994spending levels.
Expenditures
ESA Program Briefing Book 2000144
ExpendituresOverview
This sub-section summarizes ESA expenditure data for the 99-01biennium.
To put ESA expenditures in context, DSHS funds are 50% federal,42% General Fund-State, and 8% other.
General Fund-State expenditures for DSHS are projected to be 25%of the total statewide General Fund-State expenditures.
ESA (including child support services) is expected to be 16.6% ofthe total DSHS General Fund-State spending during the 1999-01biennium.
Highlights:
? Total spending on all cash grant assistance programs isexpected to decrease 30.4%, with the state share ofexpenditures projected to drop by 36.4%.
? Working Connections Child Care costs are expected to climbto $496.7 million in the 1999-01 biennium. This is 67.5%higher than expenditures in the 1997-99 biennium.
? Funding for the WorkFirst program is expected to be $122.1million in the 1999-01 biennium. This is 60% higher thanexpenditures in the 1997-99 biennium.
? Funding for Refugee contracted services will increase by16.6% over the 1997-99 biennium.
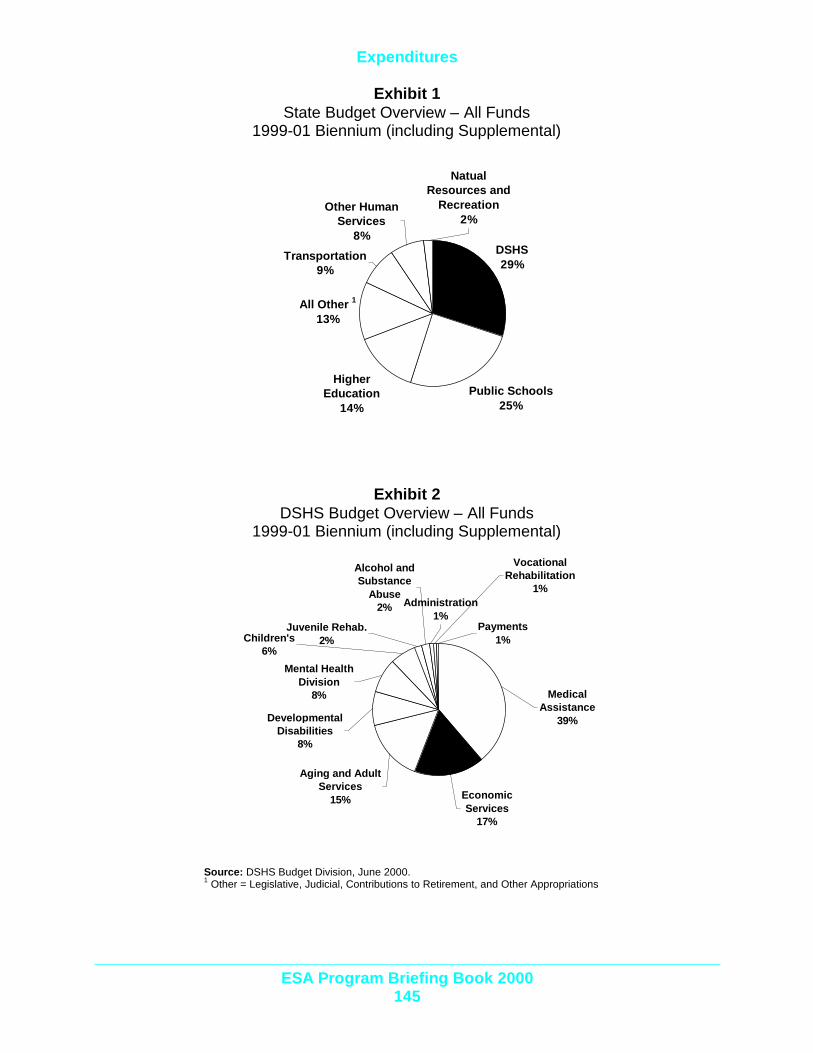
Expenditures
ESA Program Briefing Book 2000145
Exhibit 1State Budget Overview – All Funds
1999-01 Biennium (including Supplemental)
Exhibit 2DSHS Budget Overview – All Funds
1999-01 Biennium (including Supplemental)
Source: DSHS Budget Division, June 2000.1 Other = Legislative, Judicial, Contributions to Retirement, and Other Appropriations
DSHS29%
Public Schools25%
Higher Education
14%
Transportation9%
Other Human Services
8%
All Other 1
13%
Natual Resources and
Recreation2%
Aging and Adult Services
15% Economic Services
17%
Medical Assistance
39%Developmental Disabilities
8%
Mental Health Division
8%
Children's6%
Juvenile Rehab.2%
Administration1%
Payments1%
Alcohol and Substance
Abuse2%
Vocational Rehabilitation
1%

Expenditures
ESA Program Briefing Book 2000146
Exhibit 3State Budget Overview – General Fund State1999-01 Biennium (including Supplemental)
Exhibit 4DSHS Budget Overview – General Fund State
1999-01 Biennium (including Supplemental)
Source: DSHS Budget Division, June 2000.1 All Other = Legislative, Judicial, Contributions to Retirement, and Other Appropriations
Public Schools46%
DSHS25%
Higher Education12%
All Other1
11%
Other Human Services
5%
Natural Resources and Recreation
1%
Medical Assistance
31%
Aging and Adult Services
19%
Economic Services
17%
Developmental Disabilities
11%
Mental Health Division
11%
Juvenile Rehab.4%
Payments1%
Children's Administration
4%
Administration1% Vocational
Rehabilitation0%
Alcohol and Substance
Abuse1%

Expenditures
ESA Program Briefing Book 2000147
Exhibit 5aEconomic Services Administration
Actual and Projected Program and Administrative Expenditures(in millions of dollars)
Actual Projected 1 FY97 – 99 to FY99 - 01FY 97 – 99 FY 99 - 01 Numeric
ChangePercentChange
Grant Assistance ProgramState 618.9 393.8 (225.1) -36.4%Total 837.3 582.8 (254.5) -30.4%
Child CareState 98.8 90.9 (7.9) -8.0%Total 296.6 496.7 200.1 67.5%
WorkFirstState 0.8 0.3 (0.5) -62.5%Total 76.3 122.1 45.8 60.0%
Refugee Contracted ServicesState 1.2 1.9 0.7 58.3%Total 14.5 16.9 2.4 16.6%
ACESState 17.8 21.2 3.4 19.1%Total 34.9 46.6 11.7 33.5%
ESA HeadquartersState 35.9 - (35.9) -100.0%Total 61.3 - (61.3) -100.0%
ESA Field ServicesState 196.1 - (196.1) -100.0%Total 398.1 - (398.1) -100.0%
DCS HeadquartersState 34.2 35.0 0.8 2.3%Total 103.9 107.1 3.2 3.1%
DCS Field ServicesState 12.8 17.3 4.5 35.2%Total 127.1 133.4 6.3 5.0%
Table 90a Sub-totalState 1016.5 560.4 (456.1) - 44.9%Total 1950.0 1505.6 (444.4) -22.8%
Source: ESA Budget DivisionNote: Numbers in parentheses represent declines.1 Projections are based on actual expenditures for FY00 and allotments for FY01 from FRS reports dated 10/18/00.
.
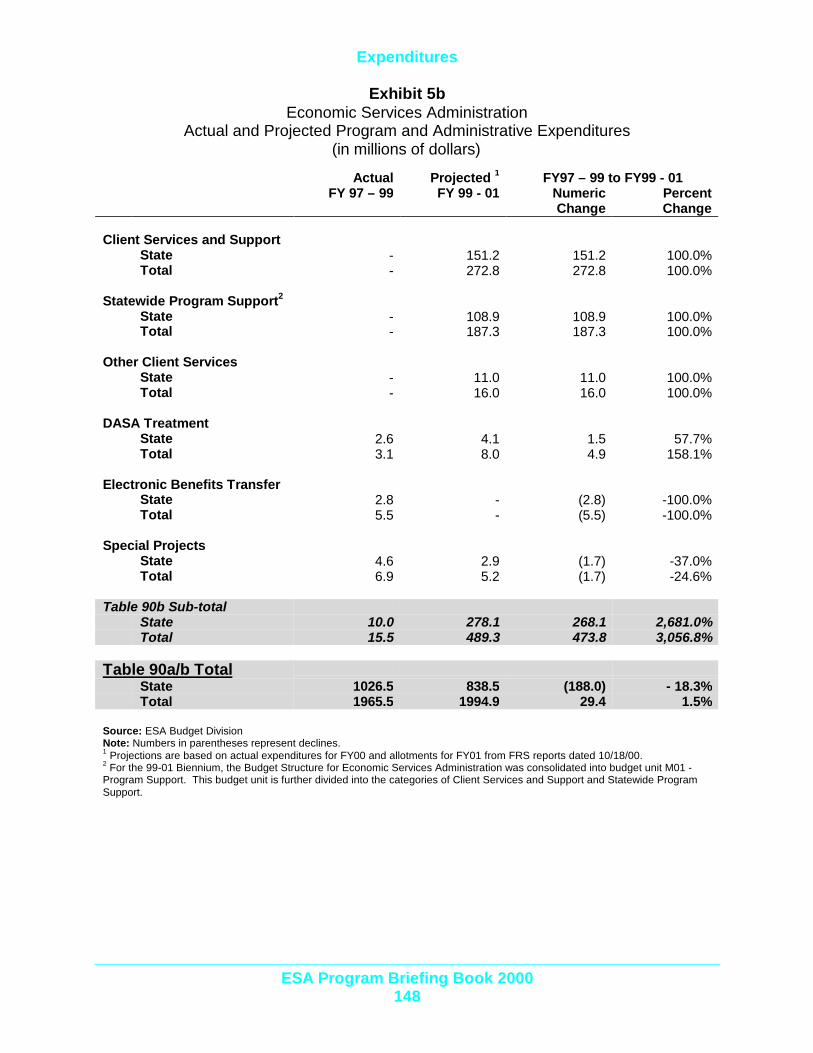
Expenditures
ESA Program Briefing Book 2000148
Exhibit 5bEconomic Services Administration
Actual and Projected Program and Administrative Expenditures(in millions of dollars)
Actual Projected 1 FY97 – 99 to FY99 - 01FY 97 – 99 FY 99 - 01 Numeric
ChangePercentChange
Client Services and SupportState - 151.2 151.2 100.0%Total - 272.8 272.8 100.0%
Statewide Program Support2
State - 108.9 108.9 100.0%Total - 187.3 187.3 100.0%
Other Client ServicesState - 11.0 11.0 100.0%Total - 16.0 16.0 100.0%
DASA TreatmentState 2.6 4.1 1.5 57.7%Total 3.1 8.0 4.9 158.1%
Electronic Benefits TransferState 2.8 - (2.8) -100.0%Total 5.5 - (5.5) -100.0%
Special ProjectsState 4.6 2.9 (1.7) -37.0%Total 6.9 5.2 (1.7) -24.6%
Table 90b Sub-totalState 10.0 278.1 268.1 2,681.0%Total 15.5 489.3 473.8 3,056.8%
Table 90a/b TotalState 1026.5 838.5 (188.0) - 18.3%Total 1965.5 1994.9 29.4 1.5%
Source: ESA Budget DivisionNote: Numbers in parentheses represent declines.1 Projections are based on actual expenditures for FY00 and allotments for FY01 from FRS reports dated 10/18/00.2 For the 99-01 Biennium, the Budget Structure for Economic Services Administration was consolidated into budget unit M01 -Program Support. This budget unit is further divided into the categories of Client Services and Support and Statewide ProgramSupport.

Expenditures
ESA Program Briefing Book 2000149
Cash GrantAssistance
This sub-section shows actual and projected expenditures for cashgrant assistance programs:
? TANF Assistance (One and Two Parent Families and GeneralAssistance for Pregnant Women),
? Diversion Cash Assistance,? Child Support Recoveries,? General Assistance (GA-U and GA-X combined),? CEAP, SSI/SSP, SSI Special Needs, Refugee Assistance,? Food Assistance Program for Legal Immigrants (FAP)
Highlights:
? State expenditures for cash grant assistance programsdecreased by 28.2% in SFY 2000 from SFY 1999, and totalspending for grant assistance programs dropped by 17.7%.
? State expenditures in the TANF Assistance programdecreased to $168.5 million in fiscal year 2000 from $229.5million in fiscal year 1999 (see Exhibit 6a, TANF Assistance).
? State expenditures in the TANF Assistance program areexpected to further decline from $168.5 million in SFY 2000 to$152.7 in SFY 2001 (see Exhibit 6a, TANF Assistance).
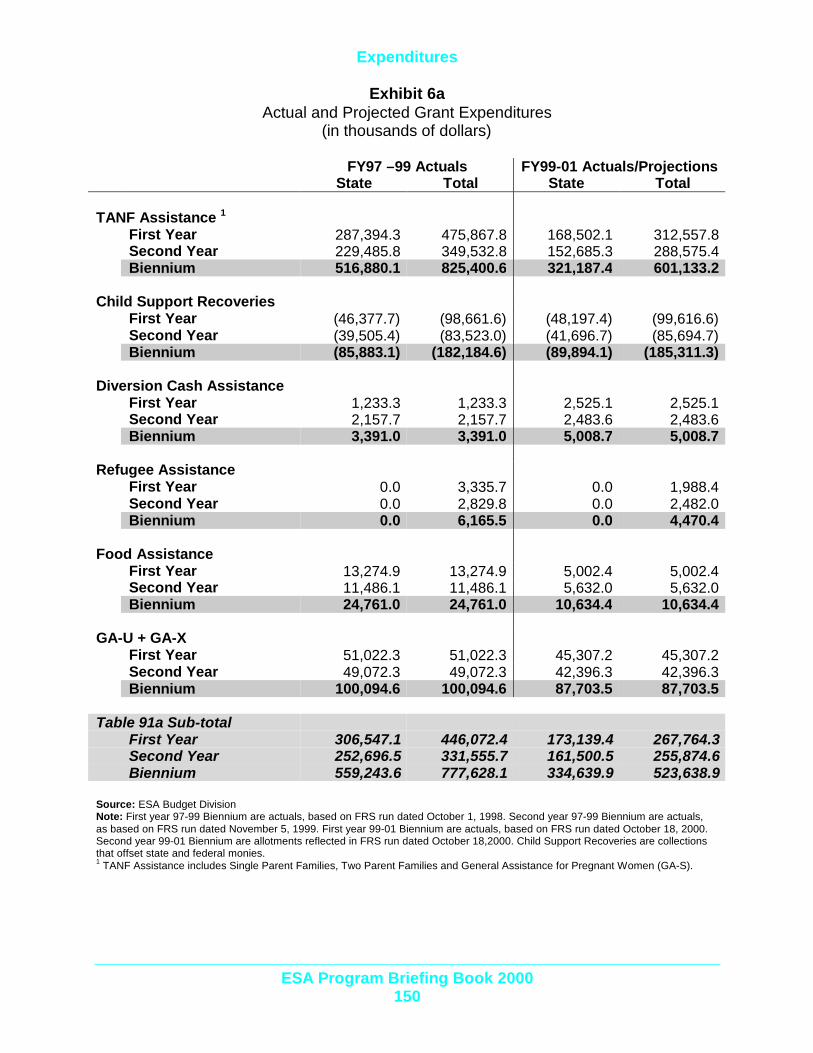
Expenditures
ESA Program Briefing Book 2000150
Exhibit 6aActual and Projected Grant Expenditures
(in thousands of dollars)
FY97 –99 Actuals FY99-01 Actuals/ProjectionsState Total State Total
TANF Assistance 1
First Year 287,394.3 475,867.8 168,502.1 312,557.8Second Year 229,485.8 349,532.8 152,685.3 288,575.4Biennium 516,880.1 825,400.6 321,187.4 601,133.2
Child Support RecoveriesFirst Year (46,377.7) (98,661.6) (48,197.4) (99,616.6)Second Year (39,505.4) (83,523.0) (41,696.7) (85,694.7)Biennium (85,883.1) (182,184.6) (89,894.1) (185,311.3)
Diversion Cash AssistanceFirst Year 1,233.3 1,233.3 2,525.1 2,525.1Second Year 2,157.7 2,157.7 2,483.6 2,483.6Biennium 3,391.0 3,391.0 5,008.7 5,008.7
Refugee AssistanceFirst Year 0.0 3,335.7 0.0 1,988.4Second Year 0.0 2,829.8 0.0 2,482.0Biennium 0.0 6,165.5 0.0 4,470.4
Food AssistanceFirst Year 13,274.9 13,274.9 5,002.4 5,002.4Second Year 11,486.1 11,486.1 5,632.0 5,632.0Biennium 24,761.0 24,761.0 10,634.4 10,634.4
GA-U + GA-XFirst Year 51,022.3 51,022.3 45,307.2 45,307.2Second Year 49,072.3 49,072.3 42,396.3 42,396.3Biennium 100,094.6 100,094.6 87,703.5 87,703.5
Table 91a Sub-totalFirst Year 306,547.1 446,072.4 173,139.4 267,764.3Second Year 252,696.5 331,555.7 161,500.5 255,874.6Biennium 559,243.6 777,628.1 334,639.9 523,638.9
Source: ESA Budget DivisionNote: First year 97-99 Biennium are actuals, based on FRS run dated October 1, 1998. Second year 97-99 Biennium are actuals,as based on FRS run dated November 5, 1999. First year 99-01 Biennium are actuals, based on FRS run dated October 18, 2000.Second year 99-01 Biennium are allotments reflected in FRS run dated October 18,2000. Child Support Recoveries are collectionsthat offset state and federal monies.1 TANF Assistance includes Single Parent Families, Two Parent Families and General Assistance for Pregnant Women (GA-S).

Expenditures
ESA Program Briefing Book 2000151
Exhibit 6bActual and Projected Grant Expenditures
(in thousands of dollars)
FY 97-99 Actuals FY 99-01 Actuals/ProjectionsState Total State Total
CEAPFirst Year 1,397.3 1,396.3 269.3 269.3Second Year 1,128.5 1,129.1 271.0 271.0Biennium 2,525.8 2,525.4 540.3 540.3
SSI/SSPFirst Year 27,699.7 27,699.7 29,520.2 29,520.2Second Year 28,906.0 28,906.0 28,556.4 28,556.4Biennium 56,605.7 56,605.7 58,076.6 58,076.6
SSI / Special NeedsFirst Year 272.2 272.2 277.6 277.6Second Year 278.2 278.2 296.0 296.0Biennium 550.4 550.4 573.6 573.6
Table 91b Sub-totalFirst Year 29,369.2 29,368.2 30,067.1 30,067.1Second Year 30,312.7 30,313.3 29,123.4 29,123.4Biennium 59,681.9 59,681.5 59,190.5 59,190.5
Table 91a/b TotalFirst Year 335,916.3 475,440.6 203,206.5 297,831.4Second Year 283,009.2 361,869.0 190,623.9 284,998.0Biennium 618,925.5 837,309.6 393,830.4 582,829.4
Source: ESA Budget DivisionNote: First year 97-99 Biennium are actuals, based on FRS run dated October 1, 1998. Second year 97-99 Biennium areactuals, based on FRS run dated November 5, 1999. First year 99-01 Biennium are actuals, based on FRS run datedOctober 18, 2000. Second year 99-01 Biennium are allotments, reflected in FRS run dated October 18, 2000. ChildSupport Recoveries are collections that offset state and federal monies.
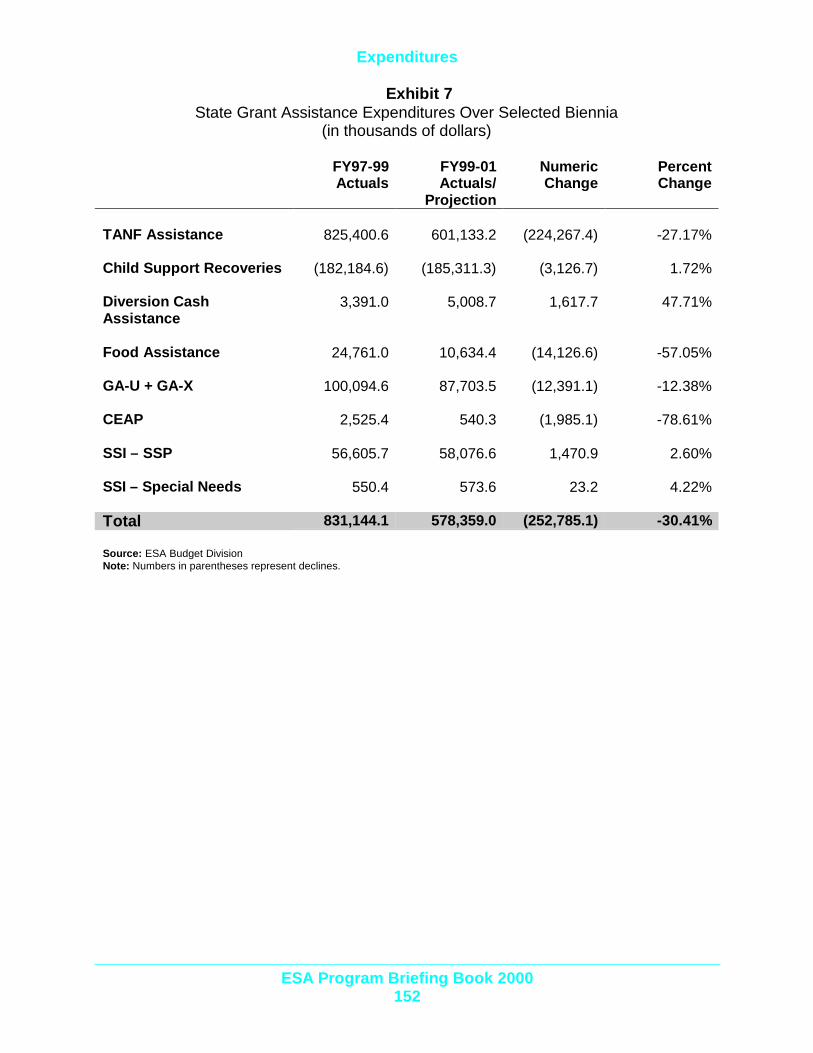
Expenditures
ESA Program Briefing Book 2000152
Exhibit 7State Grant Assistance Expenditures Over Selected Biennia
(in thousands of dollars)
FY97-99Actuals
FY99-01Actuals/
Projection
NumericChange
PercentChange
TANF Assistance 825,400.6 601,133.2 (224,267.4) -27.17%
Child Support Recoveries (182,184.6) (185,311.3) (3,126.7) 1.72%
Diversion CashAssistance
3,391.0 5,008.7 1,617.7 47.71%
Food Assistance 24,761.0 10,634.4 (14,126.6) -57.05%
GA-U + GA-X 100,094.6 87,703.5 (12,391.1) -12.38%
CEAP 2,525.4 540.3 (1,985.1) -78.61%
SSI – SSP 56,605.7 58,076.6 1,470.9 2.60%
SSI – Special Needs 550.4 573.6 23.2 4.22%
Total 831,144.1 578,359.0 (252,785.1) -30.41%
Source: ESA Budget DivisionNote: Numbers in parentheses represent declines.

Expenditures
ESA Program Briefing Book 2000153
Exhibit 8Summary of Income Assistance Program Participation,
Budget Funding Stream and Match Rates, Total Annual Budget(in millions of dollars)
Program Avg.MonthlyPersons
Cases Funding 97 – 99Actuals
99 – 01Actuals/
Projections
TANF Assistance 158,387 58,722 Total 825.4 601.1State 516.9 321.2
Refugee CashAssistance
630 507 Federal 6.2 4.5
Food Assistance 311,259 139,324 Federal 599.1State 24.8 10.6
GA-U + GA-X 16,514 16,399 State 100.1 87.7
CEAP 155 46 State 2.5 0.5
SSI 93,684 93,684 State 56.6 58.1
Source: ESA Budget Division
Exhibit 9Summary of Income Assistance Program Participation,
Budget Funding Stream(in millions of dollars)
Program Funding Funding Stream
TANF Assistance Federal TANF Block GrantState Maintenance of Effort (MOE)
Refugee Cash Assistance Federal Office of Refugee Resettlement
Food Assistance Federal Food Stamp Act of 1977State General Fund State
GA-U + GA-X State General Fund State
CEAP State General Fund State
SSI SSI General Fund State
Source: ESA Budget Division

Expenditures
ESA Program Briefing Book 2000154
Exhibit 10TANF Program as a Percent of the State General Fund
(in millions of dollars)
Biennium TANF GF-S Percent
1985 - 87 $332.9 $9,181.2 3.6%
1987 – 89 $334.4 $10,396.6 3.2%
1989 – 91 $359.7 $12,844.1 2.8%
1991 – 93 $403.5 $14,982.5 2.7%
1993 – 95 $488.0 $16,311.6 3.0%
1995 – 97 $460.4 $17,732.4 2.6%
1997 – 99 $434.4 $19,081.5 2.3%
1999 – 01 $236.3 $20,880.2 1.1%
Source: ESA Budget Division
Expenditures
ESA Program Briefing Book 2000155
WorkFirst This sub-section shows actual and projected expenditures for theWorkFirst Program. The table presents:
1. Child care expenditures2. Client support service costs (i.e., costs for services provided directly
to clients such as transportation, tuition and books), and3. Direct services reflecting state service delivery, staff in the
Employment Security Department and the Department of Social andHealth Services third-party service delivery.
Highlights:
? Program expenditures continue to increase with the fullimplementation of the WorkFirst program. Total funding was up28.7% in SFY 2000, compared to SFY 1999.
? Working Connections Child Care expenditures increased 29.2%in SFY 2000, compared to SFY 1999.
? DASA Treatment increased to $4,007,300 in SFY 2000, from$2,804,400 in SFY year 1999.

Expenditures
ESA Program Briefing Book 2000156
Exhibit 11WorkFirst Program Expenditures
(in thousands of dollars)
1997 – 1999Biennium Actuals
1999 – 2001Biennium Actuals/
AllotmentFederal State Total Federal State Total
First Year:Working ConnectionsChild Care
73,486.3 53,891.9 127,378.2 173,505.6 45,112.3 218,617.9
DASA Treatment 158.3 123.8 282.1 2,975.3 1,032.0 4,007.3Supportive Services 1,837.9 -0.4 1,837.5 0.0 0.0 0.0ESD Contract 24,445.9 0.0 24,445.9 33,697.4 0.0 33,697.4JOBS Service Delivery 818.6 233.7 1,052.3 0.0 0.0 0.0WorkFirst Service Delivery 2,056.9 2,056.9 25,331.5 170.6 25,502.1
Total: 102,803.9 54,249.0 157,052.9 235,509.8 46,314.9 281,824.7
Second Year:Working ConnectionsChild Care
124,279.9 44,949.6 169,229.5 232,308.0 45,780.0 278,088.0
DASA Treatment 377.0 2,427.4 2,804.4 931.8 3,075.5 4,007.3Supportive Services 3,712.9 34.2 3,747.1 0.0 0.0 0.0ESD Contract 33,762.3 0.0 33,762.3 37,361.3 0.0 37,361.3ESD JOBS Developer 0.0 0.0 0.0 0.0 0.0 0.0JOBS Service Delivery 0.7 525.7 526.4 0.0 0.0 0.0WorkFirst Service Delivery 8,862.5 8.5 8,871.0 25,431.9 112.4 25,544.3
Total: 170,995.3 47,945.4 218,940.7 296,033.0 48,967.9 345,000.9
Biennium Total:WCCC 197,766.2 98,841.5 296,607.7 405,813.6 90,892.3 496,705.9DASA Treatment 535.3 2,551.2 3,086.5 3,907.1 4,107.5 8,014.6Supportive Services 5,550.8 33.8 5,584.6 0.0 0.0 0.0ESD Contract 58,208.2 0.0 58,208.2 71,058.7 0.0 71,058.7JOBS Service Delivery 819.3 759.4 1,578.7 0.0 0.0 0.0WorkFirst Service Delivery 10,919.4 8.5 10,927.9 50,763.4 283.0 51,046.4
Total: 273,799.2 102,194.4 375,993.6 531,542.8 95,282.8 626,825.6
Source: ESA Budget Division
Expenditures
ESA Program Briefing Book 2000157
AdministrativeExpenditures
This sub-section shows ESA staff expenditures.
Highlights:
? As a result of the budget program structure change in ESA, staffare now being shown in following two categories:
? Client Services and Support? Statewide Program Support
? Total ESA staff decreased by 4% in SFY 2000 compared to SFY1999. This increase is mostly due to the end of the Food StampAccuracy Initiative approved by the governor to reduce WashingtonState’s Food Stamp Error Rate.
? State funds for ESA staff increased 5.5% for SFY 2000 ($144.2million), compared to SFY 1999 ($136.7 million). Total fundingdecreased by 3.6%.
? State funds for ESA staffing decreased 2.9% in SFY 2000($144.2 million) to SFY 2001 ($140 million).

Expenditures
ESA Program Briefing Book 2000158
Exhibit 12aActual and Projected Administrative Expenditures and Staffing Levels
For Selected Biennia (in millions of dollars)
1997 – 99 Biennium 1999 – 01 BienniumState Total FTE’S State Total FTE’S
ESA HQ 1
First Year 17.2 29.5 207.8 0.0 0.0 0.0Second Year 18.7 31.8 211.5 0.0 0.0 0.0Biennium 35.9 61.3 209.7 0.0 0.0 0.0
ESA FieldServices 2
First Year 94.9 193.6 3,187.5 0.0 0.0 0.0Second Year 101.2 204.5 3,495.7 0.0 0.0 0.0Biennium 196.1 398.1 3,341.6 0.0 0.0 0.0
DCS HQ 3
First Year 16.8 52.3 237.7 17.7 54.0 233.5Second Year 17.4 51.6 239.3 17.3 53.1 231.9Biennium 34.2 103.9 238.5 35.0 107.1 232.7
DCS Field ServicesFirst Year 5.2 62.7 1,105.0 8.5 65.2 1,095.9Second Year 7.6 64.4 1,106.0 8.8 68.2 1,127.0Biennium 12.8 127.1 1,105.5 17.3 133.4 1,111.5
Client Services and Support 4
First Year 0.0 0.0 0.0 76.0 139.0 3,144.6Second Year 0.0 0.0 0.0 75.2 133.8 3,049.5Biennium 0.0 0.0 0.0 151.2 272.8 3,097.1
Statewide ProgramSupport 4
First Year 0.0 0.0 0.0 54.7 92.9 406.1Second Year 0.0 0.0 0.0 54.2 94.4 363.8Biennium 0.0 0.0 0.0 108.9 187.3 385.0
Table 97a Sub-totalFirst Year 134.1 338.1 4,738.0 156.9 351.1 4,880.1Second Year 144.9 352.3 5,052.5 155.5 349.5 4,772.2Biennium 279.0 690.4 4,895.3 312.4 700.6 4,826.1
Source: ESA Budget DivisionNote: For the 97-99 Biennium, 1st year actuals, per FRS report dated 10/98; and 2nd year actuals, per FRS report, dated11/99. For the 99-01 Biennium, 1st year actuals, per FRS report dated 10/18/00; and 2nd year, based on allotments per FRSreport dated 10/18/99.1 ESA Headquarters includes all headquarters level divisions within ESA, except for the Division of Child Support2 ESA Field Services includes all regional and local offices, except for the Division of Child Support.3 DCS HQ includes some direct client and support service functions as well as administrative functions.4 For the 99-01 Biennium, the Budget Structure for Economic Services Administration was consolidated into budget unit M01 -Program Support. This budget unit is further divided into the categories of Client Services and Support and Statewide ProgramSupport.

Expenditures
ESA Program Briefing Book 2000159
Exhibit 12bActual and Projected Administrative Expenditures and Staffing Levels
For Selected Biennia (in millions of dollars)
1997 – 99 Biennium 1999 – 01 BienniumState Total FTE’S State Total FTE’S
ACES 1
First Year 7.6 14.5 30.2 11.7 22.4 42.6Second Year 10.2 20.4 34.7 9.5 24.2 44.0Biennium 17.8 34.9 32.5 21.2 46.6 43.3
Electronic BenefitsTransfer
First Year 0.4 0.8 4.4 0.0 0.0 0.0Second Year 2.4 4.7 6.6 0.0 0.0 0.0Biennium 2.8 5.5 5.5 0.0 0.0 0.0
Special Projects 2
First Year 0.4 1.2 4.3 1.8 3.2 36.5Second Year 4.2 5.7 34.2 1.1 2.0 18.0Biennium 4.6 6.9 19.3 2.9 5.2 27.3
Table 97b Sub-totalFirst Year 8.4 16.5 38.9 13.5 25.6 79.1Second Year 16.8 30.8 75.5 10.6 26.2 62.0Biennium 25.2 47.3 57.3 24.1 51.8 70.6
Table 97a/b TotalFirst Year 142.5 354.6 4,776.9 170.4 376.7 4,959.2Second Year 161.7 383.1 5,128.0 166.1 375.7 4,834.2Biennium 304.2 737.7 4,952.6 336.5 752.4 4,896.7
Source: ESA Budget DivisionNote: 97-99 Biennium, 1st year actuals, per FRS report dated 10/98 and 2nd year actuals, per FRS report dated 11/99. 99-01Biennium, 1st year actuals, per FRS report dated 10/18/00 and 2nd year based on allotments per FRS report dated 10/18/99.1 ACES includes contracted payments to the ACES vendor.2 Special Projects are funding for those items being accomplished by another program; such as JAS/JFS Year 2000, SPSSYear 2000, WorkFirst Evaluation, Reporting Requirements, and National Case / New Hire Registry as well as some of the FoodStamp Accuracy projects.

Appendix 1Contacts
ESA Program Briefing Book 2000A1-1
DSHS Secretary Dennis Braddock(360) [email protected]
DSHS Deputy Secretary Liz Dunbar(360) [email protected]
ESA Assistant Secretary John Atherton, Acting(360) [email protected]
ESA Deputy Assistant Secretary Tom Hilyard(360) [email protected]
Community Services Division Michael Masten, Director(360) [email protected]
Division of Assistance Programs Phyllis Lowe, Acting Director(360) [email protected]
Division of Child Support Meg Sollenberger, Director(360) [email protected]
Division of Management and Kathleen Brockman, Director Operations Support (360) 413-3300
WorkFirst Division Robert K. St.John, Director(360) [email protected]
Management Reports and Patricia Richards, Supervisor Data Analysis (360) 413-3017
State Tribal Relations Unit Sarah Sotomish, Administrator(360) [email protected]
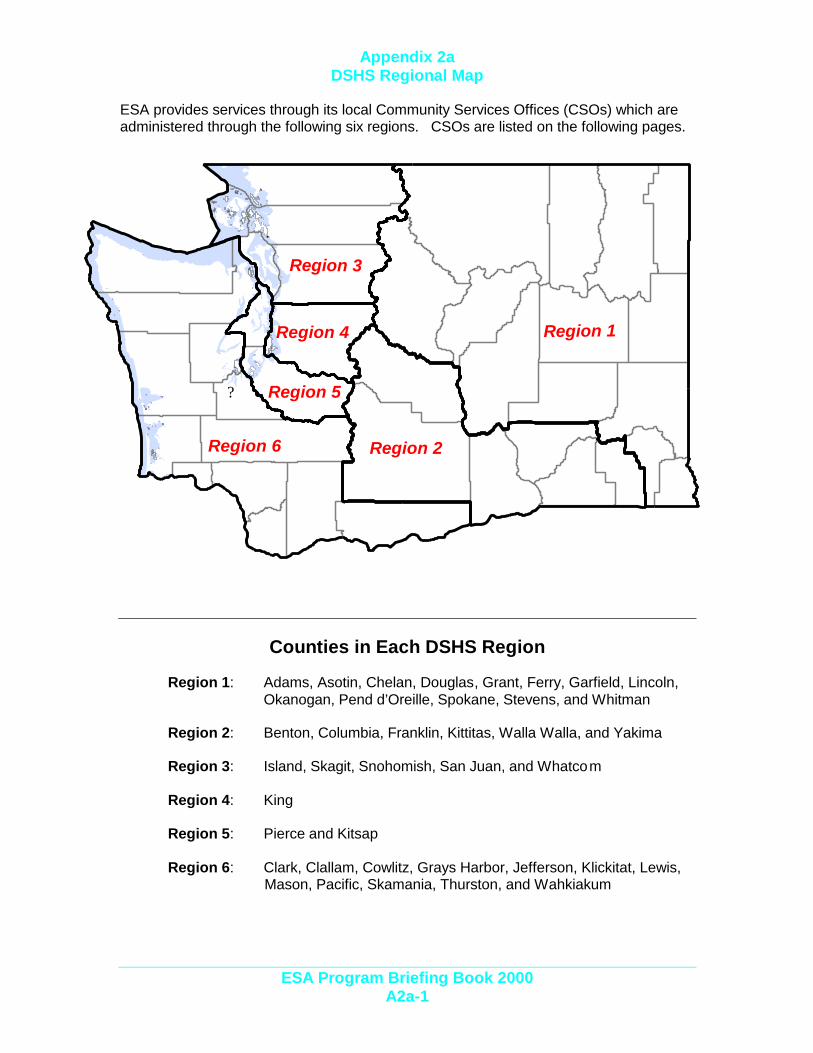
Appendix 2aDSHS Regional Map
ESA Program Briefing Book 2000A2a-1
ESA provides services through its local Community Services Offices (CSOs) which areadministered through the following six regions. CSOs are listed on the following pages.
Counties in Each DSHS Region
Region 1: Adams, Asotin, Chelan, Douglas, Grant, Ferry, Garfield, Lincoln, Okanogan, Pend d’Oreille, Spokane, Stevens, and Whitman
Region 2: Benton, Columbia, Franklin, Kittitas, Walla Walla, and Yakima
Region 3: Island, Skagit, Snohomish, San Juan, and Whatcom
Region 4: King
Region 5: Pierce and Kitsap
Region 6: Clark, Clallam, Cowlitz, Grays Harbor, Jefferson, Klickitat, Lewis, Mason, Pacific, Skamania, Thurston, and Wahkiakum
Region 6
Region 4
Region 2
? Region 5
Region 3
Region 1
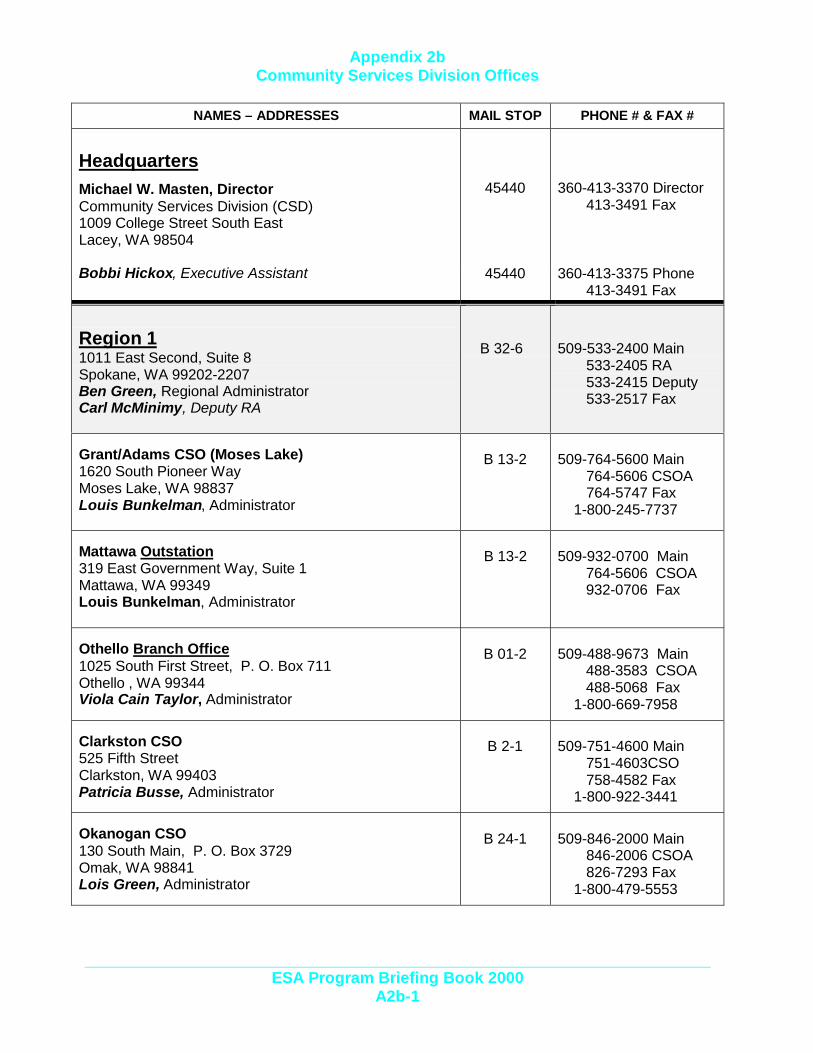
Appendix 2bCommunity Services Division Offices
ESA Program Briefing Book 2000A2b-1
NAMES – ADDRESSES MAIL STOP PHONE # & FAX #
HeadquartersMichael W. Masten, DirectorCommunity Services Division (CSD)1009 College Street South EastLacey, WA 98504
45440 360-413-3370 Director 413-3491 Fax
Bobbi Hickox, Executive Assistant 45440 360-413-3375 Phone 413-3491 Fax
Region 11011 East Second, Suite 8Spokane, WA 99202-2207Ben Green, Regional AdministratorCarl McMinimy, Deputy RA
B 32-6 509-533-2400 Main 533-2405 RA 533-2415 Deputy 533-2517 Fax
Grant/Adams CSO (Moses Lake)1620 South Pioneer WayMoses Lake, WA 98837Louis Bunkelman, Administrator
B 13-2 509-764-5600 Main 764-5606 CSOA 764-5747 Fax 1-800-245-7737
Mattawa Outstation319 East Government Way, Suite 1Mattawa, WA 99349Louis Bunkelman, Administrator
B 13-2 509-932-0700 Main 764-5606 CSOA 932-0706 Fax
Othello Branch Office1025 South First Street, P. O. Box 711Othello , WA 99344Viola Cain Taylor, Administrator
B 01-2 509-488-9673 Main 488-3583 CSOA 488-5068 Fax 1-800-669-7958
Clarkston CSO525 Fifth StreetClarkston, WA 99403Patricia Busse, Administrator
B 2-1 509-751-4600 Main 751-4603CSO 758-4582 Fax 1-800-922-3441
Okanogan CSO130 South Main, P. O. Box 3729Omak, WA 98841Lois Green, Administrator
B 24-1 509-846-2000 Main 846-2006 CSOA 826-7293 Fax 1-800-479-5553
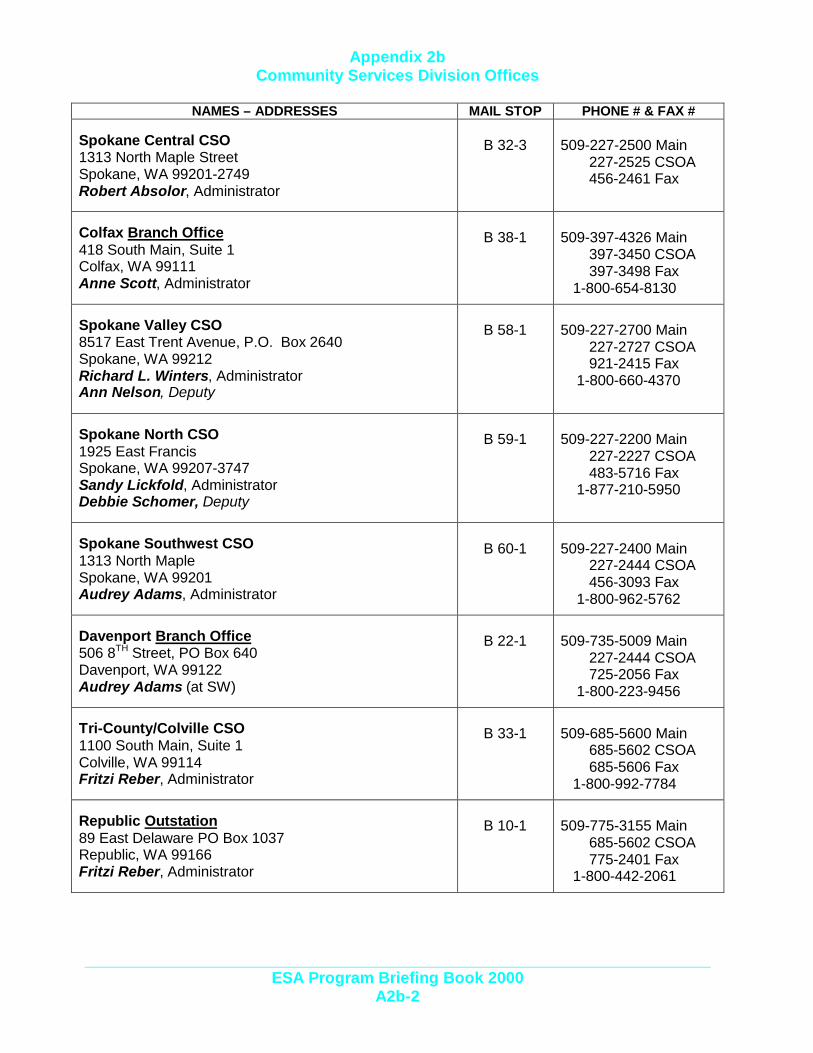
Appendix 2bCommunity Services Division Offices
ESA Program Briefing Book 2000A2b-2
NAMES – ADDRESSES MAIL STOP PHONE # & FAX #
Spokane Central CSO1313 North Maple StreetSpokane, WA 99201-2749Robert Absolor, Administrator
B 32-3 509-227-2500 Main 227-2525 CSOA 456-2461 Fax
Colfax Branch Office418 South Main, Suite 1Colfax, WA 99111Anne Scott, Administrator
B 38-1 509-397-4326 Main 397-3450 CSOA 397-3498 Fax 1-800-654-8130
Spokane Valley CSO8517 East Trent Avenue, P.O. Box 2640Spokane, WA 99212Richard L. Winters, AdministratorAnn Nelson, Deputy
B 58-1 509-227-2700 Main 227-2727 CSOA 921-2415 Fax 1-800-660-4370
Spokane North CSO1925 East FrancisSpokane, WA 99207-3747Sandy Lickfold, AdministratorDebbie Schomer, Deputy
B 59-1 509-227-2200 Main 227-2227 CSOA 483-5716 Fax 1-877-210-5950
Spokane Southwest CSO1313 North MapleSpokane, WA 99201Audrey Adams, Administrator
B 60-1 509-227-2400 Main 227-2444 CSOA 456-3093 Fax 1-800-962-5762
Davenport Branch Office506 8TH Street, PO Box 640Davenport, WA 99122Audrey Adams (at SW)
B 22-1 509-735-5009 Main 227-2444 CSOA 725-2056 Fax 1-800-223-9456
Tri-County/Colville CSO1100 South Main, Suite 1Colville, WA 99114Fritzi Reber, Administrator
B 33-1 509-685-5600 Main 685-5602 CSOA 685-5606 Fax 1-800-992-7784
Republic Outstation89 East Delaware PO Box 1037Republic, WA 99166Fritzi Reber, Administrator
B 10-1 509-775-3155 Main 685-5602 CSOA 775-2401 Fax 1-800-442-2061

Appendix 2bCommunity Services Division Offices
ESA Program Briefing Book 2000A2b-3
NAMES – ADDRESSES MAIL STOP PHONE # & FAX #
Newport Branch Office1600 West 1st Street, PO Box 570Newport, WA 99156-0570 David Rendon, Administrator
B 26-1 509-447-3192 Main 447-1063 CSOA 447-4732 Fax 1-800-624-7222
Wenatchee CSO805 South Mission, PO Box 3088Wenatchee, WA 98807John Lein, Administrator
B 4-1 509-662-0511 Main 662-0541 CSOA 664-6340 Fax 1-800-272-8881
Region 21002 North 16th AvenuePO Box 9428Yakima, WA 98909Stella Vasquez, Regional AdministratorRobert Gutierrez, Deputy RA
B 39-6 509-225-7900 Main 225-7918 RA 225-7914 Deputy 575-2903 Fax 1-800-545-1395
Grandview CSO1313 West Wine Country Road, PO Box 70Grandview, WA 98930-0070Maria Vigil, Administrator
B 70-1 509-882-9300 Main 882-9302 CSOA 882-4589 Fax
Kennewick CSO1120 North Edison Street, PO Box 6330Kennewick, WA 99336John Olivas, Administrator
B 03-4 509-735-7119 Main 736-2800 CSOA 736-2857 Fax
Pasco CSO800 West Court, PO Box 931Pasco, WA 99301Tom Balzer, Act. Administrator
B 11-1 509-545-1400 Main 545-2684 CSOA 546-2414 Fax 1-800-922-3442
Sunnyside CSO810 East Custer Avenue, PO. Box 818Sunnyside, WA 98944Maria Vigil, Administrator
B 54-1 509-839-7200 Main 839-7211 CSOA 839-7224 Fax
Toppenish CSO306 Bolin Drive, PO Box 470Toppenish, WA 98948Karen Whitekiller, Administrator
B 50-1 509-865-2805 Main 865-1110 CSOA 865-1133 Fax 1-800-228-5032
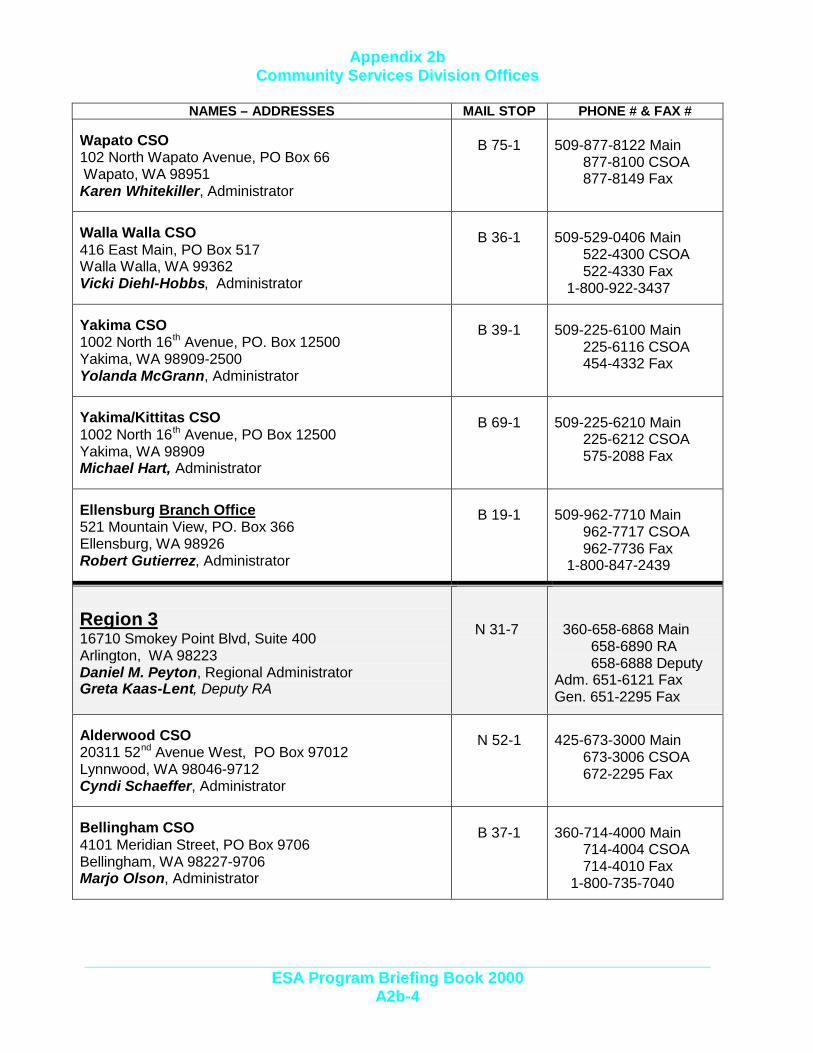
Appendix 2bCommunity Services Division Offices
ESA Program Briefing Book 2000A2b-4
NAMES – ADDRESSES MAIL STOP PHONE # & FAX #
Wapato CSO102 North Wapato Avenue, PO Box 66 Wapato, WA 98951Karen Whitekiller, Administrator
B 75-1 509-877-8122 Main 877-8100 CSOA 877-8149 Fax
Walla Walla CSO416 East Main, PO Box 517Walla Walla, WA 99362Vicki Diehl-Hobbs, Administrator
B 36-1 509-529-0406 Main 522-4300 CSOA 522-4330 Fax 1-800-922-3437
Yakima CSO1002 North 16th Avenue, PO. Box 12500Yakima, WA 98909-2500Yolanda McGrann, Administrator
B 39-1 509-225-6100 Main 225-6116 CSOA 454-4332 Fax
Yakima/Kittitas CSO1002 North 16th Avenue, PO Box 12500Yakima, WA 98909Michael Hart, Administrator
B 69-1 509-225-6210 Main 225-6212 CSOA 575-2088 Fax
Ellensburg Branch Office521 Mountain View, PO. Box 366Ellensburg, WA 98926Robert Gutierrez, Administrator
B 19-1 509-962-7710 Main 962-7717 CSOA 962-7736 Fax 1-800-847-2439
Region 316710 Smokey Point Blvd, Suite 400Arlington, WA 98223Daniel M. Peyton, Regional AdministratorGreta Kaas-Lent, Deputy RA
N 31-7 360-658-6868 Main 658-6890 RA 658-6888 DeputyAdm. 651-6121 FaxGen. 651-2295 Fax
Alderwood CSO20311 52nd Avenue West, PO Box 97012Lynnwood, WA 98046-9712Cyndi Schaeffer, Administrator
N 52-1 425-673-3000 Main 673-3006 CSOA 672-2295 Fax
Bellingham CSO4101 Meridian Street, PO Box 9706Bellingham, WA 98227-9706Marjo Olson, Administrator
B 37-1 360-714-4000 Main 714-4004 CSOA 714-4010 Fax 1-800-735-7040

Appendix 2bCommunity Services Division Offices
ESA Program Briefing Book 2000A2b-5
NAMES – ADDRESSES MAIL STOP PHONE # & FAX #
Everett CSO840 North Broadway, Suite 200Everett, WA 98201-1297Nancy Wolke, Administrator
N 31-1 425-339-4000 Main 339-4716 CSOA 339-4012 Deputy 339-4890 Fax
Mount Vernon CSO900 East College Way, Suite 100Mount Vernon, WA 98273-5682Patti Omdal, Administrator
B 29-1 360-416-7444 Main 416-7301 CSOAGen. 416-7279 FaxAdm. 416-7277 Fax
Friday Harbor Outstation55 Second Street, Suite 101PO. Box 1215Friday Harbor, WA 98250
B 29-10 360-378-4196 CSOA 378-4098 Fax 1-800-735-7036

Appendix 2bCommunity Services Division Offices
ESA Program Briefing Book 2000A2b-6
NAMES – ADDRESSES MAIL STOP PHONE # & FAX #
Oak Harbor CSO656 Southeast Bayshore Drive #1Oak Harbor, WA 98277Klaire Harry, Acting Administrator
B 15-1 360-240-4700 Main 679-3524 Fax 1-800-735-7037
Skykomish Valley CSO19705 SR 2, PO Box 7000Monroe, WA 98272Gwen Delp, Administrator
B 68-1 360-794-1350 Main 794-1361 CSOA 794-1360 Fax 1-800-735-7039
Smokey Point CSO3704 172nd Street NE, Suite P, PO Box 3099Arlington, WA 98223-3099Dorothy Zaretzke, Administrator
B 65-1 360-658-2200 Main 658-2210 CSOA 658-2294 Fax 1-800-827-1808
Region 4400 Mercer Street, Suite 600Seattle, WA 98109-4641Tom Haines, Acting Regional AdministratorChet Linowski, Deputy Region Administrator
N 17-18 206-272-2140 Main 272-2145 RA 272-2144 Deputy 298-4601 Fax
Auburn CSO2707 I Street NEAuburn, WA 98002Val Meads, AdministratorConnie Peterson, Deputy
N 72-01 253-804-1159 Main 804-1180 Deputy 804-5342 Fax 1-800-586-5502
Ballard CSO907 NorthWest BallardSeattle, WA 98107-4683Julia Moore, Administrator
N 42-1 206-789-5200 Main 545-7690 CSOA 706-4252 Fax
Bell Town CSO2106 2nd AvenueSeattle, WA 98121-2298Ann Ballard, Administrator
N 47-1 206-956-3353 Main 956-3375 CSOA 956-3360 Fax
Burien CSO15811 Ambaum Boulevard SouthwestSeattle, WA 98166-3090Kathy Shober, AdministratorLinda Williams, Deputy
N 44-1 206-439-5300 Main 439-5319 CSOA 439-5327 Deputy 439-5324 Fax
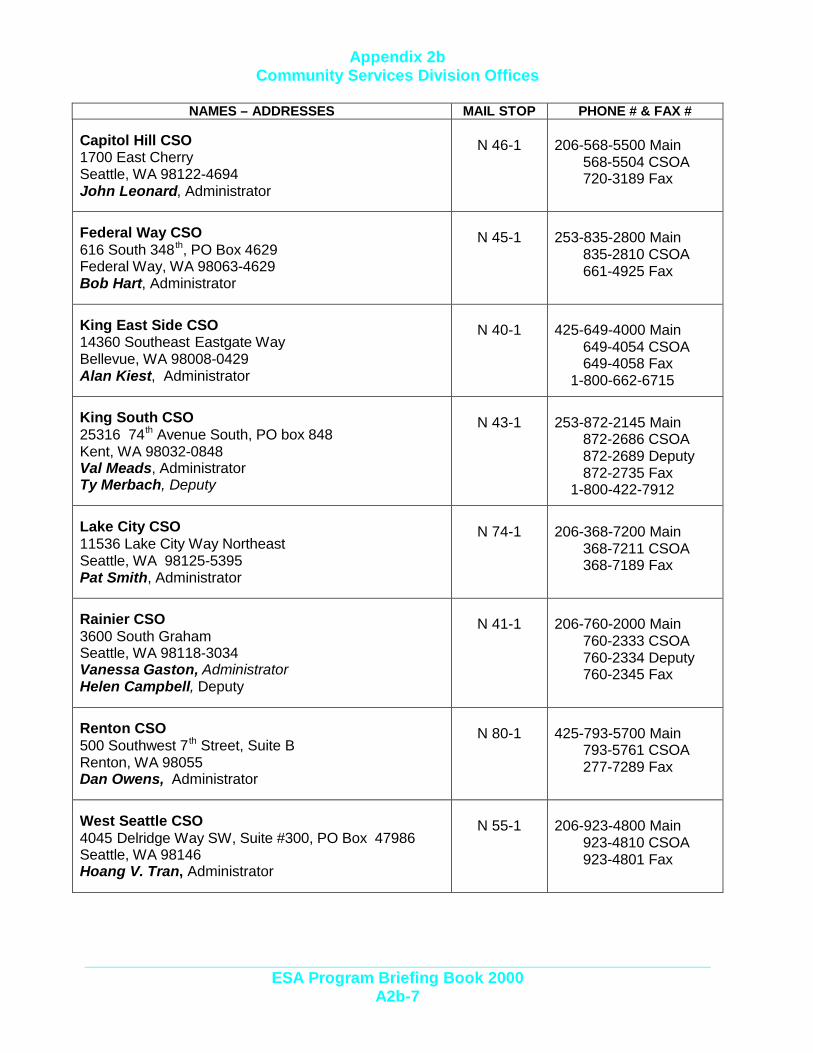
Appendix 2bCommunity Services Division Offices
ESA Program Briefing Book 2000A2b-7
NAMES – ADDRESSES MAIL STOP PHONE # & FAX #
Capitol Hill CSO1700 East CherrySeattle, WA 98122-4694John Leonard, Administrator
N 46-1 206-568-5500 Main 568-5504 CSOA 720-3189 Fax
Federal Way CSO616 South 348th, PO Box 4629Federal Way, WA 98063-4629Bob Hart, Administrator
N 45-1 253-835-2800 Main 835-2810 CSOA 661-4925 Fax
King East Side CSO14360 Southeast Eastgate WayBellevue, WA 98008-0429Alan Kiest, Administrator
N 40-1 425-649-4000 Main 649-4054 CSOA 649-4058 Fax 1-800-662-6715
King South CSO25316 74th Avenue South, PO box 848Kent, WA 98032-0848Val Meads, AdministratorTy Merbach, Deputy
N 43-1 253-872-2145 Main 872-2686 CSOA 872-2689 Deputy 872-2735 Fax 1-800-422-7912
Lake City CSO11536 Lake City Way NortheastSeattle, WA 98125-5395Pat Smith, Administrator
N 74-1 206-368-7200 Main 368-7211 CSOA 368-7189 Fax
Rainier CSO3600 South GrahamSeattle, WA 98118-3034Vanessa Gaston, AdministratorHelen Campbell, Deputy
N 41-1 206-760-2000 Main 760-2333 CSOA 760-2334 Deputy 760-2345 Fax
Renton CSO500 Southwest 7th Street, Suite BRenton, WA 98055Dan Owens, Administrator
N 80-1 425-793-5700 Main 793-5761 CSOA 277-7289 Fax
West Seattle CSO4045 Delridge Way SW, Suite #300, PO Box 47986Seattle, WA 98146Hoang V. Tran, Administrator
N 55-1 206-923-4800 Main 923-4810 CSOA 923-4801 Fax
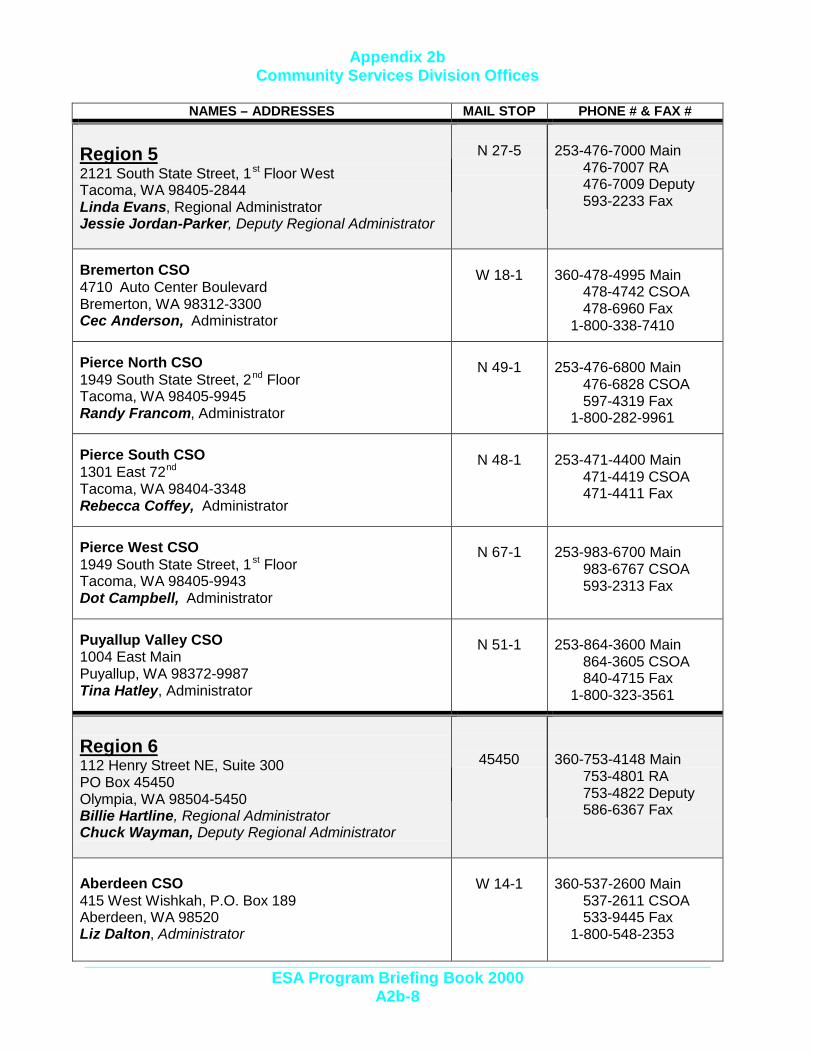
Appendix 2bCommunity Services Division Offices
ESA Program Briefing Book 2000A2b-8
NAMES – ADDRESSES MAIL STOP PHONE # & FAX #
Region 52121 South State Street, 1st Floor WestTacoma, WA 98405-2844Linda Evans, Regional AdministratorJessie Jordan-Parker, Deputy Regional Administrator
N 27-5 253-476-7000 Main 476-7007 RA 476-7009 Deputy 593-2233 Fax
Bremerton CSO4710 Auto Center BoulevardBremerton, WA 98312-3300Cec Anderson, Administrator
W 18-1 360-478-4995 Main 478-4742 CSOA 478-6960 Fax 1-800-338-7410
Pierce North CSO1949 South State Street, 2nd FloorTacoma, WA 98405-9945Randy Francom, Administrator
N 49-1 253-476-6800 Main 476-6828 CSOA 597-4319 Fax 1-800-282-9961
Pierce South CSO1301 East 72nd
Tacoma, WA 98404-3348Rebecca Coffey, Administrator
N 48-1 253-471-4400 Main 471-4419 CSOA 471-4411 Fax
Pierce West CSO1949 South State Street, 1st FloorTacoma, WA 98405-9943Dot Campbell, Administrator
N 67-1 253-983-6700 Main 983-6767 CSOA 593-2313 Fax
Puyallup Valley CSO1004 East MainPuyallup, WA 98372-9987Tina Hatley, Administrator
N 51-1 253-864-3600 Main 864-3605 CSOA 840-4715 Fax 1-800-323-3561
Region 6112 Henry Street NE, Suite 300PO Box 45450Olympia, WA 98504-5450Billie Hartline, Regional AdministratorChuck Wayman, Deputy Regional Administrator
45450 360-753-4148 Main 753-4801 RA 753-4822 Deputy 586-6367 Fax
Aberdeen CSO415 West Wishkah, P.O. Box 189Aberdeen, WA 98520Liz Dalton, Administrator
W 14-1 360-537-2600 Main 537-2611 CSOA 533-9445 Fax 1-800-548-2353

Appendix 2bCommunity Services Division Offices
ESA Program Briefing Book 2000A2b-9
NAMES – ADDRESSES MAIL STOP PHONE # & FAX #
South Bend Branch Office307 East Robert Bush Drive, PO Box 87South Bend, WA 98586Karen Klinger, Branch Office Administrator
W 25-1 360-875-6501 Main 875-4211 CSOA 875-0590 Fax 1-800-458-3747
Long Beach Branch Office2601 Pacific Ave N, PO Box 429Long Beach, WA 98631Shelba Marracci, Branch Office Administrator
B 71-1 360-642-3791 Main 642-6206 CSOA 642-6229 Fax 1-800-269-6126
Chehalis CSO2025 Northeast Kresky Road, PO Box 359Chehalis, WA 98532Carol MacCracken, Administrator
S 21-1 360-740-3800 Main 740-3801 CSOA 748-2286 Fax 1-800-442-5118
Kelso CSO711 Vine, PO Box 330Kelso, WA 98626-0026Eunice Moss, Administrator
S 8-1 360-501-2400 Main 501-2406 CSOA 577-2296 Fax 1-800-244-3170
Olympia CSO5000 Capitol BoulevardPO Box 1908Olympia, WA 98507-1908Steve Brink, Administrator,Bill Moore, Deputy
45455 360-753-5983 Main 753-5975 CSOA 753-5971 Deputy 586-6787 Fax
Orchards CSO11900 NE 95th Street, Bldg 4, PO Box 4485Vancouver, WA 98662Carol Lee, Administrator
S 53-1 360-260-6400 Main 260-6425 CSOA 260-6423 Fax 1-800-287-1745
Goldendale Branch Office808 South Columbus, PO Box 185Goldendale, WA 98620David Holcomb, Branch Office Administrator
B 62-1 509-773-5835 Main 773-5961 CSOA 773-4282 Fax 1-800-505-4686
Stevenson Branch Office266 SW Second Street, PO Box 817Stevenson, WA 98648Lisa Bleak, Branch Office Administrator
B 30-1 509-427-5611 Main 427-2337 CSOA 427-4604 Fax 1-800-505-4203
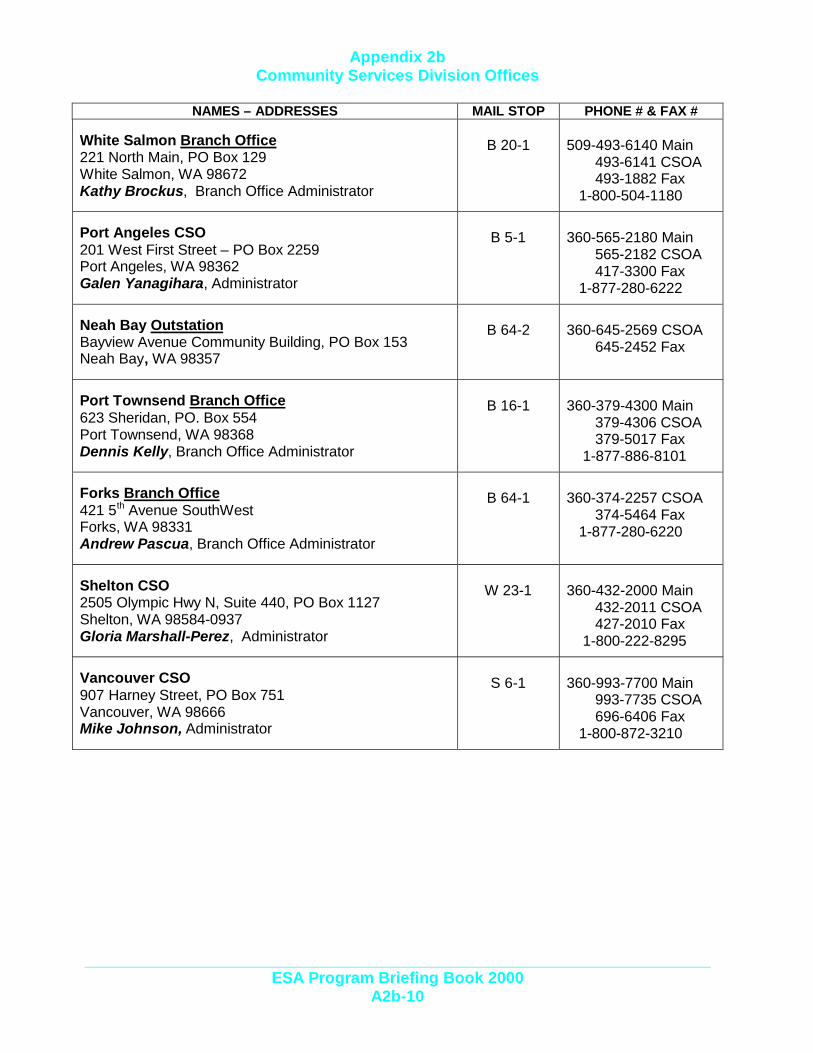
Appendix 2bCommunity Services Division Offices
ESA Program Briefing Book 2000A2b-10
NAMES – ADDRESSES MAIL STOP PHONE # & FAX #
White Salmon Branch Office221 North Main, PO Box 129White Salmon, WA 98672Kathy Brockus, Branch Office Administrator
B 20-1 509-493-6140 Main 493-6141 CSOA 493-1882 Fax 1-800-504-1180
Port Angeles CSO201 West First Street – PO Box 2259Port Angeles, WA 98362Galen Yanagihara, Administrator
B 5-1 360-565-2180 Main 565-2182 CSOA 417-3300 Fax 1-877-280-6222
Neah Bay OutstationBayview Avenue Community Building, PO Box 153Neah Bay, WA 98357
B 64-2 360-645-2569 CSOA 645-2452 Fax
Port Townsend Branch Office623 Sheridan, PO. Box 554Port Townsend, WA 98368Dennis Kelly, Branch Office Administrator
B 16-1 360-379-4300 Main 379-4306 CSOA 379-5017 Fax 1-877-886-8101
Forks Branch Office421 5th Avenue SouthWestForks, WA 98331Andrew Pascua, Branch Office Administrator
B 64-1 360-374-2257 CSOA 374-5464 Fax 1-877-280-6220
Shelton CSO2505 Olympic Hwy N, Suite 440, PO Box 1127Shelton, WA 98584-0937Gloria Marshall-Perez, Administrator
W 23-1 360-432-2000 Main 432-2011 CSOA 427-2010 Fax 1-800-222-8295
Vancouver CSO907 Harney Street, PO Box 751Vancouver, WA 98666Mike Johnson, Administrator
S 6-1 360-993-7700 Main 993-7735 CSOA 696-6406 Fax 1-800-872-3210
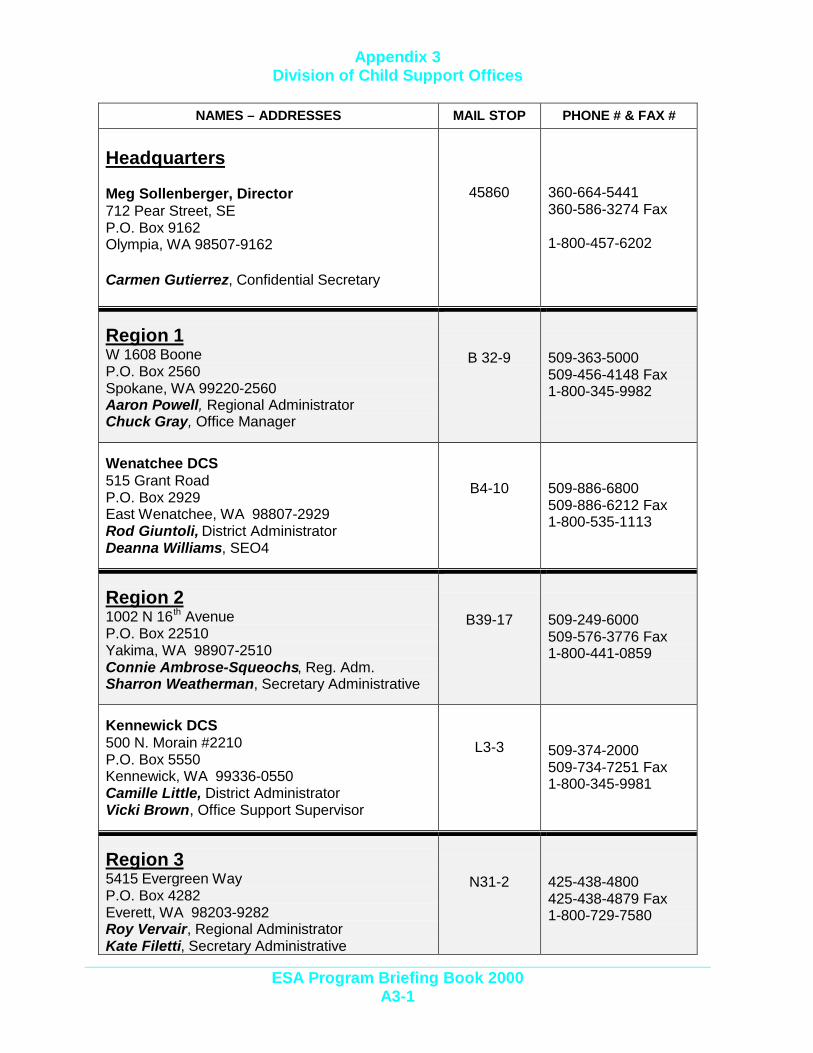
Appendix 3Division of Child Support Offices
ESA Program Briefing Book 2000A3-1
NAMES – ADDRESSES MAIL STOP PHONE # & FAX #
Headquarters
Meg Sollenberger, Director712 Pear Street, SEP.O. Box 9162Olympia, WA 98507-9162
45860 360-664-5441360-586-3274 Fax
1-800-457-6202
Carmen Gutierrez, Confidential Secretary
Region 1W 1608 BooneP.O. Box 2560Spokane, WA 99220-2560Aaron Powell, Regional AdministratorChuck Gray, Office Manager
B 32-9 509-363-5000509-456-4148 Fax1-800-345-9982
Wenatchee DCS515 Grant RoadP.O. Box 2929East Wenatchee, WA 98807-2929Rod Giuntoli, District AdministratorDeanna Williams, SEO4
B4-10 509-886-6800509-886-6212 Fax1-800-535-1113
Region 21002 N 16th AvenueP.O. Box 22510Yakima, WA 98907-2510Connie Ambrose-Squeochs, Reg. Adm.Sharron Weatherman, Secretary Administrative
B39-17 509-249-6000509-576-3776 Fax1-800-441-0859
Kennewick DCS500 N. Morain #2210P.O. Box 5550Kennewick, WA 99336-0550Camille Little, District AdministratorVicki Brown, Office Support Supervisor
L3-3 509-374-2000509-734-7251 Fax1-800-345-9981
Region 35415 Evergreen WayP.O. Box 4282Everett, WA 98203-9282Roy Vervair, Regional AdministratorKate Filetti, Secretary Administrative
N31-2 425-438-4800425-438-4879 Fax1-800-729-7580
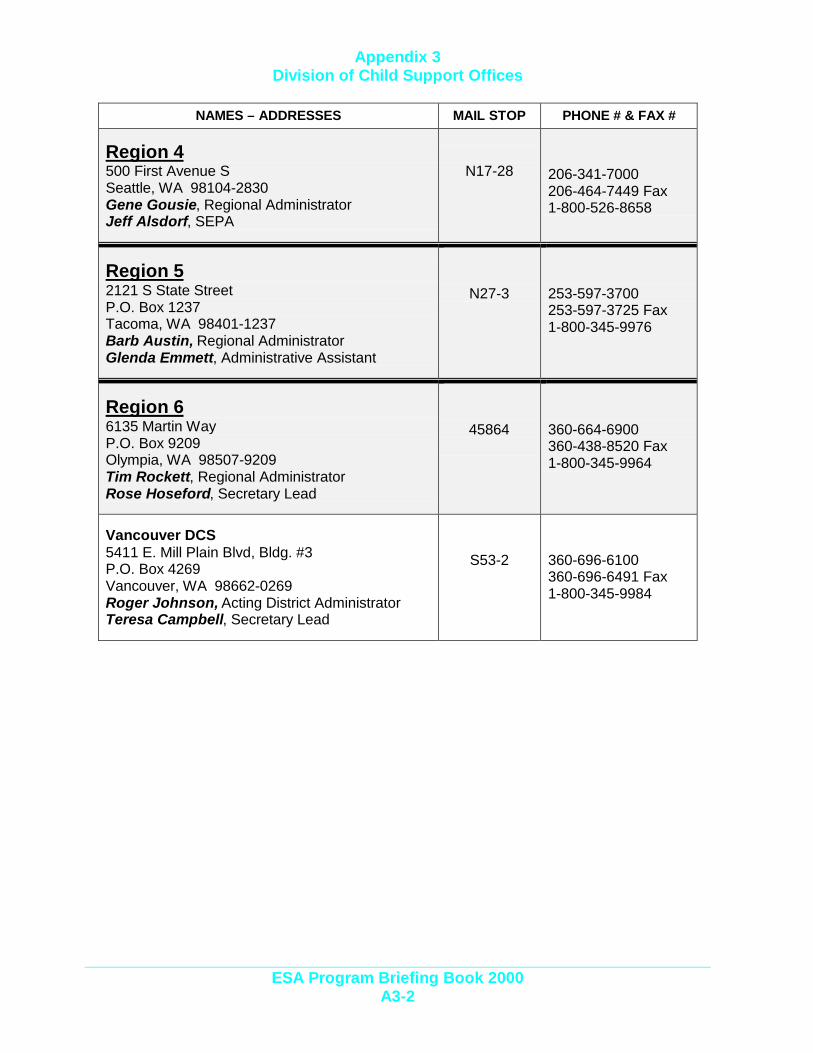
Appendix 3Division of Child Support Offices
ESA Program Briefing Book 2000A3-2
NAMES – ADDRESSES MAIL STOP PHONE # & FAX #
Region 4500 First Avenue SSeattle, WA 98104-2830Gene Gousie, Regional AdministratorJeff Alsdorf, SEPA
N17-28 206-341-7000206-464-7449 Fax1-800-526-8658
Region 52121 S State StreetP.O. Box 1237Tacoma, WA 98401-1237Barb Austin, Regional AdministratorGlenda Emmett, Administrative Assistant
N27-3 253-597-3700253-597-3725 Fax1-800-345-9976
Region 66135 Martin WayP.O. Box 9209Olympia, WA 98507-9209Tim Rockett, Regional AdministratorRose Hoseford, Secretary Lead
45864 360-664-6900360-438-8520 Fax1-800-345-9964
Vancouver DCS5411 E. Mill Plain Blvd, Bldg. #3P.O. Box 4269Vancouver, WA 98662-0269Roger Johnson, Acting District AdministratorTeresa Campbell, Secretary Lead
S53-2 360-696-6100360-696-6491 Fax1-800-345-9984
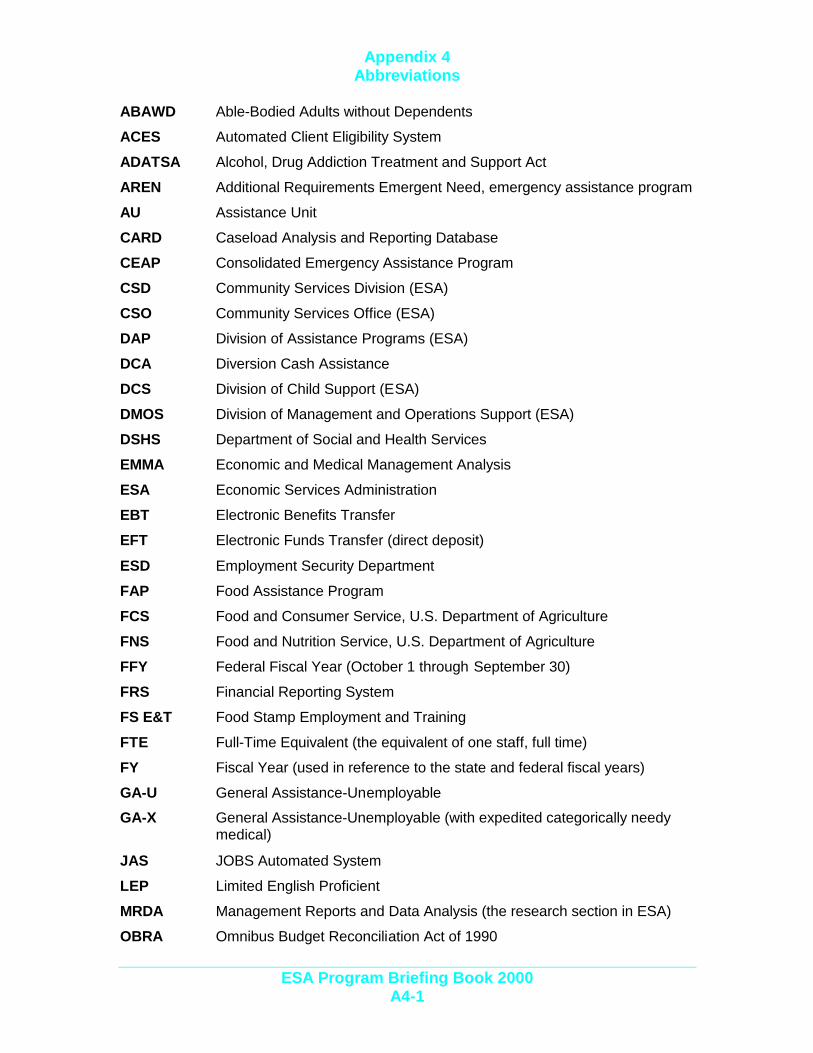
Appendix 4Abbreviations
ESA Program Briefing Book 2000A4-1
ABAWD Able-Bodied Adults without Dependents
ACES Automated Client Eligibility System
ADATSA Alcohol, Drug Addiction Treatment and Support Act
AREN Additional Requirements Emergent Need, emergency assistance program
AU Assistance Unit
CARD Caseload Analysis and Reporting Database
CEAP Consolidated Emergency Assistance Program
CSD Community Services Division (ESA)
CSO Community Services Office (ESA)
DAP Division of Assistance Programs (ESA)
DCA Diversion Cash Assistance
DCS Division of Child Support (ESA)
DMOS Division of Management and Operations Support (ESA)
DSHS Department of Social and Health Services
EMMA Economic and Medical Management Analysis
ESA Economic Services Administration
EBT Electronic Benefits Transfer
EFT Electronic Funds Transfer (direct deposit)
ESD Employment Security Department
FAP Food Assistance Program
FCS Food and Consumer Service, U.S. Department of Agriculture
FNS Food and Nutrition Service, U.S. Department of Agriculture
FFY Federal Fiscal Year (October 1 through September 30)
FRS Financial Reporting System
FS E&T Food Stamp Employment and Training
FTE Full-Time Equivalent (the equivalent of one staff, full time)
FY Fiscal Year (used in reference to the state and federal fiscal years)
GA-U General Assistance-Unemployable
GA-X General Assistance-Unemployable (with expedited categorically needymedical)
JAS JOBS Automated System
LEP Limited English Proficient
MRDA Management Reports and Data Analysis (the research section in ESA)
OBRA Omnibus Budget Reconciliation Act of 1990

Appendix 4Abbreviations
ESA Program Briefing Book 2000A4-2
ORIA Office of Refugee and Immigrant Assistance (ESA)
OTED Office of Trade and Economic Development
RCW Revised Code of Washington
SBCTC State Board for Community and Technical Colleges
SFA State Family Assistance
SFY State Fiscal Year (July 1 through June 30)
SPF Single-Parent Families (TANF-R cases)
SSA Social Security Administration
STRU State Tribal Relations Unit
SSI/SSP Supplemental Security Income/State Supplement Program
TANF Temporary Assistance for Needy Families (the block grant, created in1996 by federal welfare reform, P. L. 104-193, that consolidated formerAFDC, JOBS, and CEAP funding)
Title IV-A Title of the Social Security Act, which contains regulations for theTemporary Assistance for Needy Families (TANF) program.
Title IV-D Title of the Social Security Act, which contains regulations regarding childsupport collection and enforcement.
Title IV-E Title of the Social Security Act, which contains regulations regardingchildren’s services, including some foster care programs
USDA U. S. Department of Agriculture
WAC Washington Administrative Code
WCCC Working Connections Child Care
WFCM WorkFirst Case Manager
WFD WorkFirst Division
WDC Workforce Development Councils (formerly Private Investment Councilsor PICs)
WIA Workforce Investment Act
WPLEX WorkFirst Post-Employment Labor Exchange
WtW Welfare to Work
WTAP Washington Telephone Assistance Program

Appendix 5Selected Internet Sites
ESA Program Briefing Book 2000A5-1
DSHS and ESA Siteshttp://www.dshs.wa.gov (see ESA under “financial help”)
Division of Child Supporthttp://www.wa.gov/dshs/dcs
WorkFirsthttp://www.wa.gov/WORKFIRST/
EBThttp://www.dshs.wa.gov/trial/ebt
State and Legislative AgenciesEmployment Security Departmenthttp://www.wa.gov/esd/employment.html
Office of Community Developmenthttp://www.ocd.wa.gov
Office of Financial Managementhttp://www.ofm.wa.gov
State Board for Community and Technical Collegeshttp://www.sbctc.ctc.edu
Governor’s Office of Indian Affairshttp://www.goia.wa.gov
Office of the Code Reviserhttp://slc.leg.wa.gov
Washington State Legislaturehttp://www.leg.wa.gov
U.S. AgenciesU.S. Department of Agriculturehttp://www.usda.gov/
U.S. Census Bureauhttp://www.census.gov
U.S. Department of Health and Human Serviceshttp://www.acf.dhhs.gov/
U.S. Department of Health and Human Services, Region 10http://www.hhs.gov/region10/

Appendix 5Selected Internet Sites
ESA Program Briefing Book 2000A5-2
U.S. Social Security Administrationhttp://www.ssa.gov/
Policy and Research SitesAmerican Public Human Services Associationhttp://www.aphsa.org/
Bureau of Labor Statisticshttp://www.bls.gov/
Center on Budget and Policy Prioritieshttp://www.cbpp.org
Child Trendshttp://childtrends.org
ChildStats (Federal Interagency Forum on Child and Family Statistics)http://childStats.gov
Center for Law and Social Policyhttp://www.clasp.org/
KidsCounthttp://www.aecf.org/kidscount/kc2000
The Electronic Policy Networkhttp://epn.org/
Manpower Demonstration Research Corporationhttp://www.MDRC.org/
Mathematica Policy Research Corporationhttp://www.mathematica-mpr.com
National Conference of State Legislatorshttp://www.ncsl.org/
National Governors Associationhttp://www.nga.org
The Urban Institutehttp://www.urban.org/
Welfare Information Networkhttp://www.welfareinfo.org/

Appendix 6Electronic Benefits and Funds Transfer
ESA Program Briefing Book 2000A6-1
Electronic Benefits Transfer (EBT)
Electronic Funds Transfer - Direct Deposit (EFT)
What EBT does:? Delivers cash and food assistance benefits through a magnetic stripe debit card.? Uses Point of Sale (POS) devices and Automated Teller Machines (ATM).
Who EBT serves:? Clients who receive both federal and state food assistance benefits and/or cash benefits from
TANF, General Assistance, Refugee Assistance, and the Consolidated Emergency AssistanceProgram.
How it was done:? In 1996, Washington joined a coalition of five other western states (Alaska, Arizona, Colorado,
Hawaii, and Idaho) in a competitive procurement (Request for Proposal). Nevada later joinedthe alliance.
? In 1996, Citibank EBT Services was selected as the successful vendor.? In 1997, stakeholders were organized into several EBT workgroups to assure they had input on
issues affecting them. Stakeholders included food retailers, client advocates, tribal members,disability community, banks, union, federal, field and headquarters staff.
? In 1998, business and technical requirements for EBT were developed in association withCiticorp, ACES and stakeholders.
Time frames:? In April 1998, the EBT contract was signed.? In March 1999, the EBT Pilot started in Cowlitz, Grays Harbor, Clark, Klickitat, Pacific,
Skamania, and Wahkiakum counties.? In June 1999, the first of six regional rollouts began in Region 1.? In November 1999, statewide implementation of EBT was completed.? Federal Food Stamp rules requires EBT in all states by October 1, 2002.
What EFT does:? At client request, cash benefits are deposited directly into personal checking/savings accounts.
Who EFT serves:? Clients who receive cash benefits, who have EBT, and have or are willing to open a savings or
checking accounts. It is an optional service clients may choose.
How it was done:? EBT Steering Committee agreed to pursue EFT outside of the EBT contract.? Beginning in June 1999, a workgroup including staff from ACES, State Treasurer office and EBT
met to determine business and technical requirements.
Time frames:? In January 2000, EFT Pilot started in two Pierce County offices (Pierce West and Pierce North).? In May 2000, all EBT cash assistance clients statewide were given the option to use EFT.

Appendix 7Welfare History Overview
ESA Program Briefing Book 2000A7-1
Federal Welfare Legislative History
1996 Personal Responsibility and Work Opportunity Reconciliation Act (PRWORA) gives states choices in how to structure their welfare programs. Federal funding is provided in the form of the Temporary Assistance to Needy Families (TANF) block grant, and is fixed at
the same level for five years. PRWORA provides new federal child care funds,reauthorizes the Child Care and Development Block Grant, and requires thesecombined funds to be administered as a unified program under the Child Careand Development Fund (CCDF). In this first major overhaul of welfare in 60years, welfare receipt is limited to 5 years.
1988 Family Support Act (FSA) targets services for those most likely to become long-term welfare recipients. The act created the Job Opportunities and Basic Skills(JOBS) program, which focuses on education and training, and provides child careand medical assistance to recipients for 12 months after they leave AFDC withemployment.
1981 Omnibus Budget Reconciliation Act (OBRA) begins welfare-to-workdemonstration projects in many states. States may require welfare recipients to gointo training, job search, or unpaid work experience in exchange for their AFDCgrants.
1970 Federal regulations require states to guard against payments to ineligible welfareapplicants. States must monitor their active AFDC caseloads, compute errorsmade in determining eligibility, and pay penalties for high error rates.
1967 Amendments to the Social Security Act establishes the Work IncentiveProgram (WIN), which adds employment services to AFDC, and directs states toemphasize work rather than welfare.
1965 Medicaid and Food Stamp programs are created, and AFDC recipients are eligible.
1962 Amendments to the Social Security Act lead to a new emphasis on socialservices, and allows families with two parents to receive AFDC. Welfarecaseloads begin to grow, for both one and two parent families.
1935 The Aid to Dependent Children, later known as Aid to Families withDependent Children (AFDC) is created as part of Social Security Act.
AFDC supports poor children whose parents are dead, absent, or incapacitated.
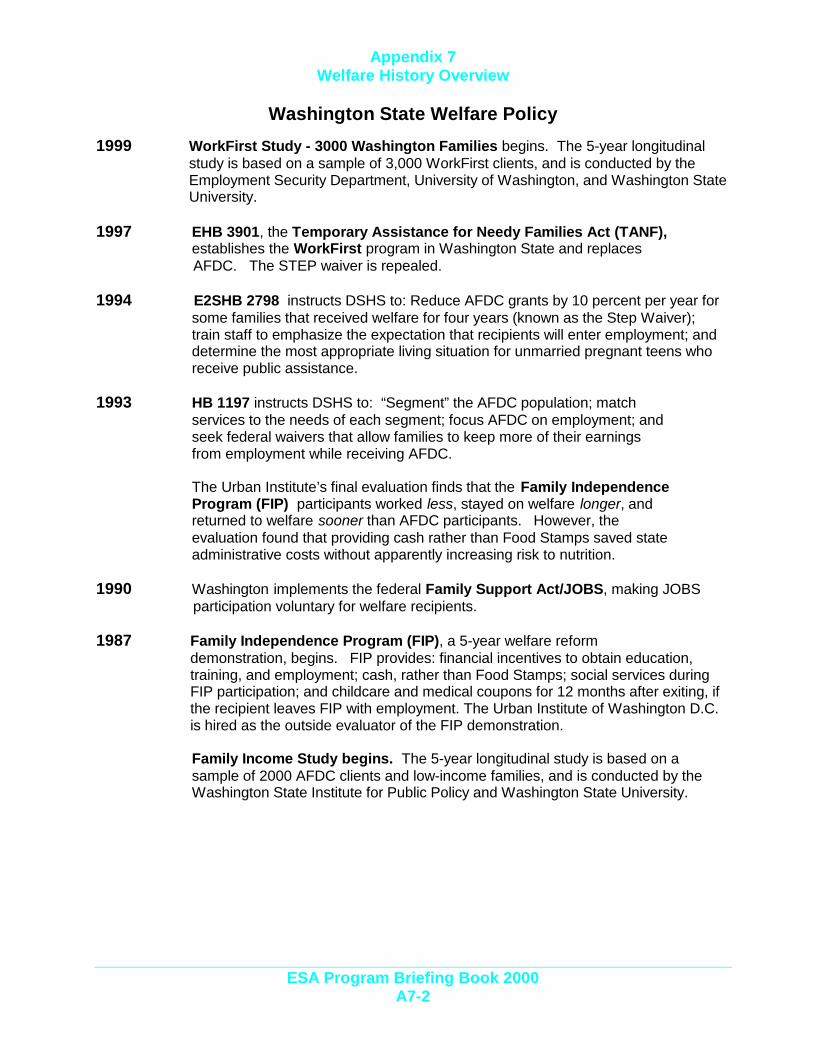
Appendix 7Welfare History Overview
ESA Program Briefing Book 2000A7-2
Washington State Welfare Policy
1999 WorkFirst Study - 3000 Washington Families begins. The 5-year longitudinalstudy is based on a sample of 3,000 WorkFirst clients, and is conducted by theEmployment Security Department, University of Washington, and Washington StateUniversity.
1997 EHB 3901, the Temporary Assistance for Needy Families Act (TANF), establishes the WorkFirst program in Washington State and replaces AFDC. The STEP waiver is repealed.
1994 E2SHB 2798 instructs DSHS to: Reduce AFDC grants by 10 percent per year forsome families that received welfare for four years (known as the Step Waiver);train staff to emphasize the expectation that recipients will enter employment; anddetermine the most appropriate living situation for unmarried pregnant teens whoreceive public assistance.
1993 HB 1197 instructs DSHS to: “Segment” the AFDC population; match services to the needs of each segment; focus AFDC on employment; and seek federal waivers that allow families to keep more of their earnings from employment while receiving AFDC.
The Urban Institute’s final evaluation finds that the Family IndependenceProgram (FIP) participants worked less, stayed on welfare longer, andreturned to welfare sooner than AFDC participants. However, theevaluation found that providing cash rather than Food Stamps saved stateadministrative costs without apparently increasing risk to nutrition.
1990 Washington implements the federal Family Support Act/JOBS, making JOBS participation voluntary for welfare recipients.
1987 Family Independence Program (FIP), a 5-year welfare reformdemonstration, begins. FIP provides: financial incentives to obtain education,training, and employment; cash, rather than Food Stamps; social services duringFIP participation; and childcare and medical coupons for 12 months after exiting, ifthe recipient leaves FIP with employment. The Urban Institute of Washington D.C.is hired as the outside evaluator of the FIP demonstration.
Family Income Study begins. The 5-year longitudinal study is based on asample of 2000 AFDC clients and low-income families, and is conducted by theWashington State Institute for Public Policy and Washington State University.
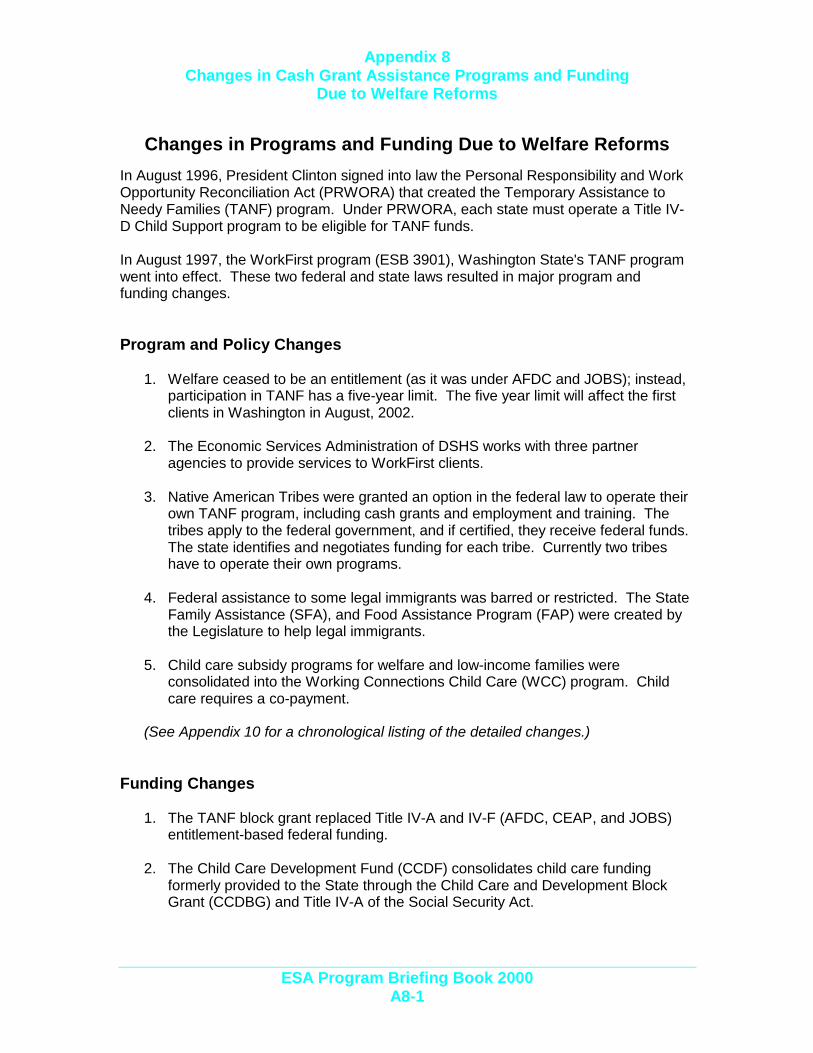
Appendix 8Changes in Cash Grant Assistance Programs and Funding
Due to Welfare Reforms
ESA Program Briefing Book 2000A8-1
Changes in Programs and Funding Due to Welfare Reforms
In August 1996, President Clinton signed into law the Personal Responsibility and WorkOpportunity Reconciliation Act (PRWORA) that created the Temporary Assistance toNeedy Families (TANF) program. Under PRWORA, each state must operate a Title IV-D Child Support program to be eligible for TANF funds.
In August 1997, the WorkFirst program (ESB 3901), Washington State's TANF programwent into effect. These two federal and state laws resulted in major program andfunding changes.
Program and Policy Changes
1. Welfare ceased to be an entitlement (as it was under AFDC and JOBS); instead,participation in TANF has a five-year limit. The five year limit will affect the firstclients in Washington in August, 2002.
2. The Economic Services Administration of DSHS works with three partneragencies to provide services to WorkFirst clients.
3. Native American Tribes were granted an option in the federal law to operate theirown TANF program, including cash grants and employment and training. Thetribes apply to the federal government, and if certified, they receive federal funds.The state identifies and negotiates funding for each tribe. Currently two tribeshave to operate their own programs.
4. Federal assistance to some legal immigrants was barred or restricted. The StateFamily Assistance (SFA), and Food Assistance Program (FAP) were created bythe Legislature to help legal immigrants.
5. Child care subsidy programs for welfare and low-income families wereconsolidated into the Working Connections Child Care (WCC) program. Childcare requires a co-payment.
(See Appendix 10 for a chronological listing of the detailed changes.)
Funding Changes
1. The TANF block grant replaced Title IV-A and IV-F (AFDC, CEAP, and JOBS)entitlement-based federal funding.
2. The Child Care Development Fund (CCDF) consolidates child care fundingformerly provided to the State through the Child Care and Development BlockGrant (CCDBG) and Title IV-A of the Social Security Act.

Appendix 8Changes in Cash Grant Assistance Programs and Funding
Due to Welfare Reforms
ESA Program Briefing Book 2000A8-2
3. A requirement to spend an amount of state dollars, known as the Maintenance ofEffort (MOE), replaced previous federal requirements to match a percentage of
program costs with state funds. There is an MOE requirement for TANF and theCCDF block grant. Federal matching funds still exist in Food Stamps, Medicaidand one CCDF child care funding stream.
5. Total funds available to the General Assistance program were lidded withinstructions in the law to limit eligibility factors to control costs.
Funding Details
TANF Block Grant
Washington’s TANF block grant is $404,331,754 per year. The amount of the blockgrant is based on the amount of the Title IV-A and Title IV-F funds, AFDC Assistance,Emergency Assistance (EA), JOBS, and AFDC administration claimed by WashingtonState in FFY1994, plus a portion of the increase of FFY 1995 EA over FFY 1994 EA.
The block grant amount will remain the same through FY 2002, unless it is lowered bypenalties for awards to Tribes electing to operate a Tribal TANF program. For FFY2000, Washington’s TANF grant amount was reduced by $1,017,923 in Tribal TANFawards, to $403,313,831.
Additionally, in FFY 2000, the U.S. Department of Health and Human Services (HHS)awarded Washington $10,616,733 in TANF High Performance Bonus award funds.
Maintenance of Effort (MOE)
HHS set the MOE requirement for the TANF block grant based on the State’s 1994expenditures for the AFDC, EA, AFDC-related child care, transitional child care, At-RiskChild Care, and JOBS programs. In general, states must spend state funds in anamount equal to at least 80% of the amount spent on these programs in FFY 1994;however, if a state meets the required work participation rates, then it only needs toexpend 75% of the amount spent in FY 1994.
For FFY 2000, Washington reduced its MOE spending to 75% of the FFY 1994 spendinglevel, or $272,060,824. This amount was reduced by an additional $684,925 for TribalTANF programs operating ins the state, to $271,375,899.
HHS also set the MOE requirement for the CCDF block grant, based on stateexpenditures in FFY 1994. The CCDF MOE amount is $38,707,605. This amount isanticipated to be the same for FFY 2001 and FFY 2002.
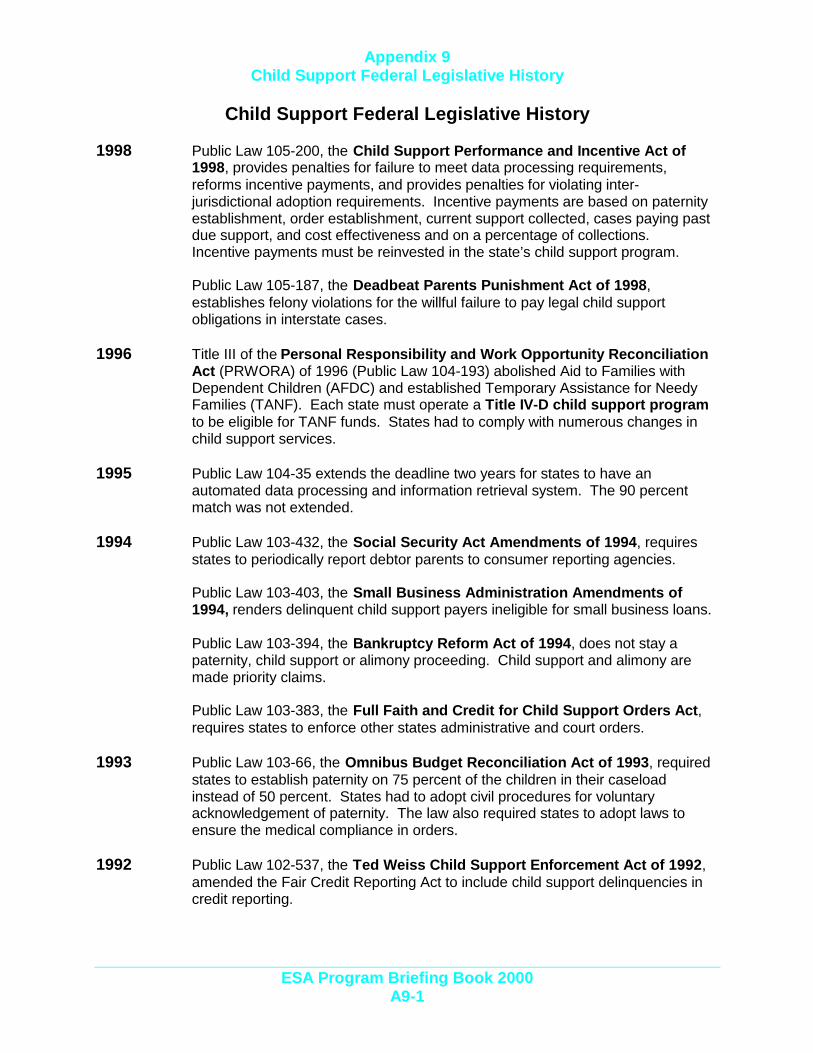
Appendix 9Child Support Federal Legislative History
ESA Program Briefing Book 2000A9-1
Child Support Federal Legislative History
1998 Public Law 105-200, the Child Support Performance and Incentive Act of1998, provides penalties for failure to meet data processing requirements,reforms incentive payments, and provides penalties for violating inter-jurisdictional adoption requirements. Incentive payments are based on paternityestablishment, order establishment, current support collected, cases paying pastdue support, and cost effectiveness and on a percentage of collections.Incentive payments must be reinvested in the state’s child support program.
Public Law 105-187, the Deadbeat Parents Punishment Act of 1998,establishes felony violations for the willful failure to pay legal child supportobligations in interstate cases.
1996 Title III of the Personal Responsibility and Work Opportunity ReconciliationAct (PRWORA) of 1996 (Public Law 104-193) abolished Aid to Families withDependent Children (AFDC) and established Temporary Assistance for NeedyFamilies (TANF). Each state must operate a Title IV-D child support programto be eligible for TANF funds. States had to comply with numerous changes inchild support services.
1995 Public Law 104-35 extends the deadline two years for states to have anautomated data processing and information retrieval system. The 90 percentmatch was not extended.
1994 Public Law 103-432, the Social Security Act Amendments of 1994, requiresstates to periodically report debtor parents to consumer reporting agencies.
Public Law 103-403, the Small Business Administration Amendments of1994, renders delinquent child support payers ineligible for small business loans.
Public Law 103-394, the Bankruptcy Reform Act of 1994, does not stay apaternity, child support or alimony proceeding. Child support and alimony aremade priority claims.
Public Law 103-383, the Full Faith and Credit for Child Support Orders Act,requires states to enforce other states administrative and court orders.
1993 Public Law 103-66, the Omnibus Budget Reconciliation Act of 1993, requiredstates to establish paternity on 75 percent of the children in their caseloadinstead of 50 percent. States had to adopt civil procedures for voluntaryacknowledgement of paternity. The law also required states to adopt laws toensure the medical compliance in orders.
1992 Public Law 102-537, the Ted Weiss Child Support Enforcement Act of 1992,amended the Fair Credit Reporting Act to include child support delinquencies incredit reporting.
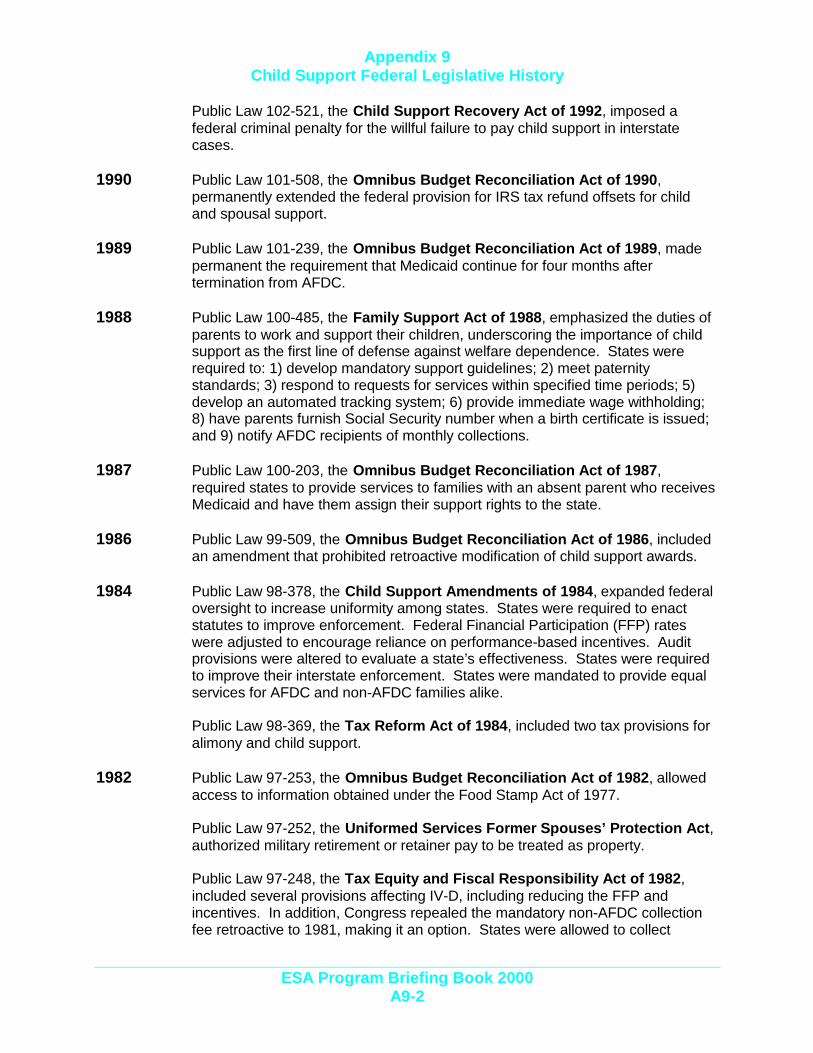
Appendix 9Child Support Federal Legislative History
ESA Program Briefing Book 2000A9-2
Public Law 102-521, the Child Support Recovery Act of 1992, imposed afederal criminal penalty for the willful failure to pay child support in interstatecases.
1990 Public Law 101-508, the Omnibus Budget Reconciliation Act of 1990,permanently extended the federal provision for IRS tax refund offsets for childand spousal support.
1989 Public Law 101-239, the Omnibus Budget Reconciliation Act of 1989, madepermanent the requirement that Medicaid continue for four months aftertermination from AFDC.
1988 Public Law 100-485, the Family Support Act of 1988, emphasized the duties ofparents to work and support their children, underscoring the importance of childsupport as the first line of defense against welfare dependence. States wererequired to: 1) develop mandatory support guidelines; 2) meet paternitystandards; 3) respond to requests for services within specified time periods; 5)develop an automated tracking system; 6) provide immediate wage withholding;8) have parents furnish Social Security number when a birth certificate is issued;and 9) notify AFDC recipients of monthly collections.
1987 Public Law 100-203, the Omnibus Budget Reconciliation Act of 1987,required states to provide services to families with an absent parent who receivesMedicaid and have them assign their support rights to the state.
1986 Public Law 99-509, the Omnibus Budget Reconciliation Act of 1986, includedan amendment that prohibited retroactive modification of child support awards.
1984 Public Law 98-378, the Child Support Amendments of 1984, expanded federaloversight to increase uniformity among states. States were required to enactstatutes to improve enforcement. Federal Financial Participation (FFP) rateswere adjusted to encourage reliance on performance-based incentives. Auditprovisions were altered to evaluate a state’s effectiveness. States were requiredto improve their interstate enforcement. States were mandated to provide equalservices for AFDC and non-AFDC families alike.
Public Law 98-369, the Tax Reform Act of 1984, included two tax provisions foralimony and child support.
1982 Public Law 97-253, the Omnibus Budget Reconciliation Act of 1982, allowedaccess to information obtained under the Food Stamp Act of 1977.
Public Law 97-252, the Uniformed Services Former Spouses’ Protection Act,authorized military retirement or retainer pay to be treated as property.
Public Law 97-248, the Tax Equity and Fiscal Responsibility Act of 1982,included several provisions affecting IV-D, including reducing the FFP andincentives. In addition, Congress repealed the mandatory non-AFDC collectionfee retroactive to 1981, making it an option. States were allowed to collect
Appendix 9Child Support Federal Legislative History
ESA Program Briefing Book 2000A9-3
spousal support for non-AFDC cases. Military personnel were required to makeallotments from their pay if delinquent.
1981 Public Law 97-35, the Omnibus Reconciliation Act of 1981, amended IV-D infive ways: 1) IRS was authorized to withhold tax refunds for delinquent childsupport; 2) IV-D agencies were required to collect spousal support for AFDCfamilies; 3) IV-D agencies were required to collect fees from parents delinquentin child support; 4) obligations assigned to the state were no longerdischargeable in bankruptcy proceedings; and 5) states were required to withholda portion of unemployment for delinquent support.
1980 Public Law 96-272, the Adoption Assistance and Child Welfare Act of 1980,amended the Social Security Act as follows: 1) FFP for non-AFDC was madepermanent; 2) states could receive incentives on interstate AFDC collections;and 3) states had to claim expenditures within two years.
Public Law 96-265, the Social Security Disability Amendments of 1980,increased federal matching funds to 90 percent for automated systems.Matching funds were made available for court staff. IRS was authorized tocollect arrearages for non-AFDC families. IV-D agencies were allowed access towage data.
1978 Public Law 95-598, the Bankruptcy Reform Act of 1978, repealed section456(b) of the Social Security Act (42 USC §656(b)), which had barred thedischarge in bankruptcy of assigned child support arrears. (Public Law 97-35 in1981 restored this section.)
1977 Public Law 95-142, the Medicare-Medicaid Antifraud and AbuseAmendments of 1977, enabled states to require Medicaid applicants to assignthe state their rights to medical support. Incentives were made for statessecuring collections on behalf of other states.
Public Law 95-30 amended section 454 of the Social Security Act, includinggarnishment of federal employees, bonding employees who handle cash andchanging incentive rates.
1976 Public Law 94-566 required state employment agencies to provide addresses ofobligated parents to state child support agencies.
1974 Public Law 93-647, the Social Security Amendments of 1974, created Title IV-D of the Social Security Act, the child support program. The program wasdesigned for cost recovery of state and federal outlays on public assistance andfor cost avoidance to help families leave welfare and to help families avoidturning to public assistance.
1967 Public Law 90-248, the Social Security Amendments of 1967, allowed statesaccess to IRS for addresses of obligated parents. Each state was required toestablish a single child support unit for AFDC children. States were required towork cooperatively.
Appendix 9Child Support Federal Legislative History
ESA Program Briefing Book 2000A9-4
1965 Public Law 89-97, the Social Security Amendments of 1965, allowed welfareagencies to obtain addresses and employers of obligated parents from the U.S.Department of Health, Education and Welfare.
1950 Public Law 81-734, the Social Security Act Amendments of 1950, addedsection 402(a)(11) to the Social Security Act (42 USC 602(a)(11)). The lawrequired state welfare agencies to notify law enforcement officials when providingAFDC to a child. The Uniform Reciprocal Enforcement of Support Act (URESA)was approved.

Appendix 10Major Changes in ESA Programs by Month
ESA Program Briefing Book 2000A10-1
Major Changes in ESA Programs by Month, July 1995 – August 2000
August 2000
1. Expanded categorical eligibility for Food Stamps to include households that loseeligibility for TANF due to excess earnings (for 24 months after grant termination) andhouseholds that receive Diversion Cash Assistance (month of receipt and following 3months). For these cases, categorical eligibility means that the household is exemptform the Food Stamp gross income test (130% of Federal Poverty Level) and FoodStamp resource standards.
2. Restricted eligibility for Additional Requirements – Emergent Needs (TANF, SFA andRCA) to (1) require that family must be eligible for ongoing grant; (2) cap benefits at$1,5000; and (3) limit eligibility to once every 12 months. Policy change implemented tocontrol program expenditures.
July 2000
1. Began using TANF funds for children living with legal guardians (GA-H program) tocomply with proviso in 1999 budget bill.
2. Effective July 14, 2000, aliens who are Permanently Residing (in the USA) Under Colorof Law (PRUCOL) are eligible for the state-funded food assistance program (FAP).
June 2000
1. Increased employment and training requirements for Food Stamp recipients who areable-bodied without dependents (ABAWD). Enhanced tracking mechanisms to bettermonitor each of these clients’ job search progress.
2. Implemented changes in federal law that ensure asylees receive refugee cash aid andmedical assistance for up to eight months from the date their application for asylum isgranted. (Formerly, the eight months of aid were reduced by months of pending asyleestatus.)
April 2000
1. VIEW is created and implemented. (VIEW is a TANF screening and evaluation systemfor WorkFirst case managers to use to identify and document WorkFirst clients’barriers to employment and to make appropriate referrals for services.)

Appendix 10Major Changes in ESA Programs by Month
ESA Program Briefing Book 2000A10-2
March 2000
1. TANF Early Exit Bonuses implemented (Bonuses are a once-in-a-lifetime $1,000support service payment to employed TANF clients, with low cash grants, whovoluntarily exit TANF). The bonus is paid to cover work expenses and allow clients to“bank” months of TANF use for times of greater need.
January 2000
1. TANF intensive services implemented statewide.
2. Implemented “prospective” income budgeting policy for cash and food assistance.Eligibility is now determined based on anticipated income, rather than income receivedin past months (“retrospective” budgeting).
November 1999
1. Authorize an overall child care eligibility increase to families with gross incomes at orbelow 225% of the Federal Poverty Level.
2. Begin phasing in the intensive services model, which provides DSHS social workerassessments, collaboratively developed Individual Responsibility Plans (IRP) andbundled services for the harder-to-employ. The model requires more frequent use ofemployability evaluations to determine which participants might benefit from intensiveservices.
3. Electronic Benefit Transfer (EBT) implemented statewide.
October 1999
1. Implement Limited English Proficiency (LEP) pathway statewide (i.e., Phase 2).
2. Change the participation report in the JAS management information system to collectmore information about those who are receiving alternative services and redefine whatcounts as participating in the WorkFirst program.
3. Implemented the Children with Special Needs Initiative statewide (i.e., Phase 2).
Appendix 10Major Changes in ESA Programs by Month
ESA Program Briefing Book 2000A10-3
September 1999
1. General Assistance Supported Employment Project adds pilot site at the King EastsideCSO.
2. Division of Child Support (DCS) awarded federal grant to develop Internet-based lienregistry. State and local government agencies and private businesses will be able tocheck if a claimant owes a child support debt and can voluntarily notify DCS.
August 1999
1. Deprivation due to absence, incapacity, death, or unemployment of a parent iseliminated by ESB 5798, effective July 25, 1999. Associated qualifying parentrequirements are eliminated.
2. The 185% of Need test is eliminated.
3. The Striker provision (a person on strike on the last day of the month is retroactivelyineligible to the first of the month and an overpayment established) is eliminated.
4. Simplified the guidelines for support services and increased the upper limit for howmuch support services a client can receive.
5. Implemented Phase I of the WorkFirst Children with Special Needs Initiative (phasing inservices for WorkFirst clients raising children with special needs).
6. Expanded age limits for children receiving TANF/SFA/GAH based on schoolparticipation.
7. Expanded SFA eligibility to pregnant women who are ineligible for TANF due to aconviction for a drug-related felony or misrepresentation of residence.
8. Effective August 1, ESA field staff began an audit of all TANF cash terminations todetermine if medical benefits should continue. In addition to audits, there were severalenhancements to the Automated Client Eligibility system (ACES to ensure clientseligible for continued medical benefits receive them.
9. Expanded categorical eligibility for Food Stamps to include households that loseeligibility for TANF due to excess earnings (for 24 months after grant termination), andhouseholds that received Diversion Cash Assistance (month of receipt and following 3months). For these cases, categorical eligibility means that the household is exemptfrom the Food Stamp gross income test (130% of the Federal Poverty Level) and FoodStamp resource standards.
Appendix 10Major Changes in ESA Programs by Month
ESA Program Briefing Book 2000A10-4
10. Restricted eligibility for Additional Requirements – Emergent Needs (TANF, SFA andRCA) to control program expenditures, by:
a. requiring that a family must be eligible for an ongoing grant;b. capping benefits at $1,5000, andc. limiting eligibly to once every 12 months.
July 1999
1. Washington Telephone Assistance Program (WTAP) client threshold is reduced from$7.50 to $4.00.
3. State law changes WorkFirst participation exemption criteria from parents with a childunder 12 months of age to those with a child under three months. Establishes thePregnancy-to-Employment pathway to meet the parenting and employment needs ofparents with infants, who are no longer exempt from WorkFirst participation, and formerGA-S participants, who have been moved into the TANF program.
3. CEAP funds transferred to the Department of Community, Trade, and EconomicDevelopment (DCTED). Limited CEAP eligibility to clients who are not eligible for anyother cash assistance program. Removed cap for Additional Requirements-EmergentNeed (AREN) payments.
4. TANF eligibility review cycle decreased from twelve to six months in order to transitioncases to Prospective Budgeting.
5. Expanded Family Assistance Program (FAP) eligibility to non-citizens who are legallyadmitted into the country in order to escape domestic violence.
6. Region 5 SSI Facilitation Project completed.
June 1999
1. Phase I implementation of Children with Special Needs Initiative.
2. Working Connections Automated Program (WCAP) pilot begins.
3. EBT begins in Region 1.
4. Implement SSA on-line Access (SOLQ) statewide through ACES.
5. Implement the Community Jobs Program statewide and change the earnings disregardfrom 20% to 50%.
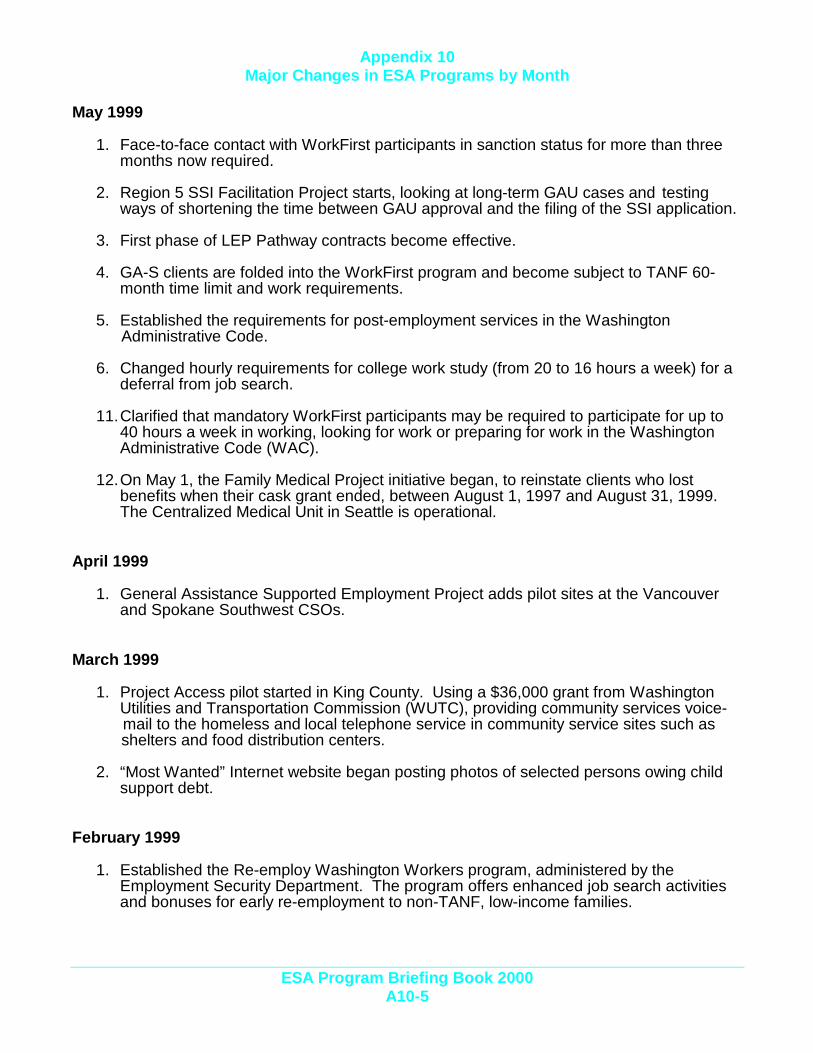
Appendix 10Major Changes in ESA Programs by Month
ESA Program Briefing Book 2000A10-5
May 1999
1. Face-to-face contact with WorkFirst participants in sanction status for more than threemonths now required.
2. Region 5 SSI Facilitation Project starts, looking at long-term GAU cases and testingways of shortening the time between GAU approval and the filing of the SSI application.
3. First phase of LEP Pathway contracts become effective.
4. GA-S clients are folded into the WorkFirst program and become subject to TANF 60-month time limit and work requirements.
5. Established the requirements for post-employment services in the Washington Administrative Code.
6. Changed hourly requirements for college work study (from 20 to 16 hours a week) for adeferral from job search.
11. Clarified that mandatory WorkFirst participants may be required to participate for up to40 hours a week in working, looking for work or preparing for work in the WashingtonAdministrative Code (WAC).
12. On May 1, the Family Medical Project initiative began, to reinstate clients who lostbenefits when their cask grant ended, between August 1, 1997 and August 31, 1999.The Centralized Medical Unit in Seattle is operational.
April 1999
1. General Assistance Supported Employment Project adds pilot sites at the Vancouverand Spokane Southwest CSOs.
March 1999
1. Project Access pilot started in King County. Using a $36,000 grant from WashingtonUtilities and Transportation Commission (WUTC), providing community services voice-
mail to the homeless and local telephone service in community service sites such as shelters and food distribution centers.
2. “Most Wanted” Internet website began posting photos of selected persons owing childsupport debt.
February 1999
1. Established the Re-employ Washington Workers program, administered by theEmployment Security Department. The program offers enhanced job search activitiesand bonuses for early re-employment to non-TANF, low-income families.
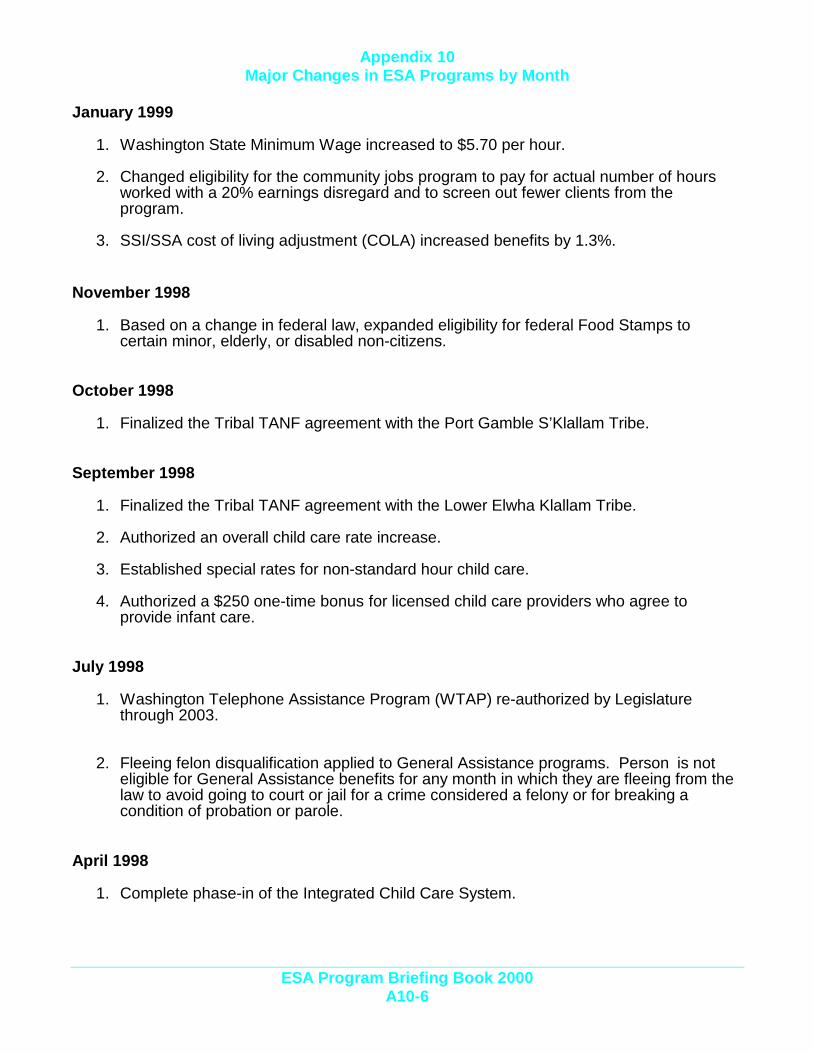
Appendix 10Major Changes in ESA Programs by Month
ESA Program Briefing Book 2000A10-6
January 1999
1. Washington State Minimum Wage increased to $5.70 per hour.
2. Changed eligibility for the community jobs program to pay for actual number of hoursworked with a 20% earnings disregard and to screen out fewer clients from theprogram.
3. SSI/SSA cost of living adjustment (COLA) increased benefits by 1.3%.
November 1998
1. Based on a change in federal law, expanded eligibility for federal Food Stamps tocertain minor, elderly, or disabled non-citizens.
October 1998
1. Finalized the Tribal TANF agreement with the Port Gamble S’Klallam Tribe.
September 1998
1. Finalized the Tribal TANF agreement with the Lower Elwha Klallam Tribe.
2. Authorized an overall child care rate increase.
3. Established special rates for non-standard hour child care.
4. Authorized a $250 one-time bonus for licensed child care providers who agree toprovide infant care.
July 1998
1. Washington Telephone Assistance Program (WTAP) re-authorized by Legislaturethrough 2003.
2. Fleeing felon disqualification applied to General Assistance programs. Person is noteligible for General Assistance benefits for any month in which they are fleeing from thelaw to avoid going to court or jail for a crime considered a felony or for breaking acondition of probation or parole.
April 1998
1. Complete phase-in of the Integrated Child Care System.
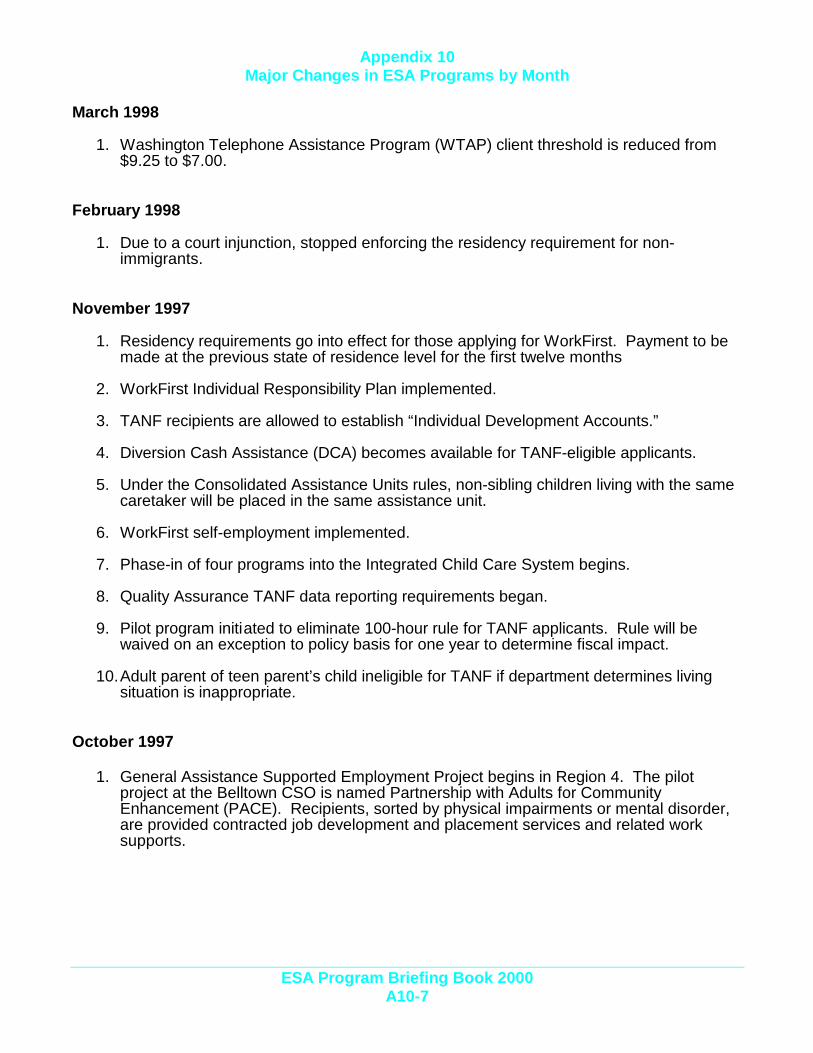
Appendix 10Major Changes in ESA Programs by Month
ESA Program Briefing Book 2000A10-7
March 1998
1. Washington Telephone Assistance Program (WTAP) client threshold is reduced from$9.25 to $7.00.
February 1998
1. Due to a court injunction, stopped enforcing the residency requirement for non-immigrants.
November 1997
1. Residency requirements go into effect for those applying for WorkFirst. Payment to bemade at the previous state of residence level for the first twelve months
2. WorkFirst Individual Responsibility Plan implemented.
3. TANF recipients are allowed to establish “Individual Development Accounts.”
4. Diversion Cash Assistance (DCA) becomes available for TANF-eligible applicants.
5. Under the Consolidated Assistance Units rules, non-sibling children living with the samecaretaker will be placed in the same assistance unit.
6. WorkFirst self-employment implemented.
7. Phase-in of four programs into the Integrated Child Care System begins.
8. Quality Assurance TANF data reporting requirements began.
9. Pilot program initiated to eliminate 100-hour rule for TANF applicants. Rule will bewaived on an exception to policy basis for one year to determine fiscal impact.
10.Adult parent of teen parent’s child ineligible for TANF if department determines livingsituation is inappropriate.
October 1997
1. General Assistance Supported Employment Project begins in Region 4. The pilotproject at the Belltown CSO is named Partnership with Adults for CommunityEnhancement (PACE). Recipients, sorted by physical impairments or mental disorder,are provided contracted job development and placement services and related worksupports.

Appendix 10Major Changes in ESA Programs by Month
ESA Program Briefing Book 2000A10-8
September 1997
1. As of September 1, 1997, certain legal immigrants are no longer eligible for federal foodstamps. The state implemented the Food Assistance Program for eligible legalimmigrants to receive state-funded food stamps. Eligibility and employment & trainingrequirements are the same as for the federal food stamp program.
2. General Assistance-Unemployable Pilot (GAP) project in Region 3 ended.
August 1997
1. Changes to the Temporary Assistance for Needy Families (TANF) program were madeto complete implementation of P. L. 104-193 requirements and to begin implementingstate welfare reform legislation (EHB 3901) signed into law in April. Changes include:a. A five-year time limit for cash assistance;b. Exemption of 50% of gross earned income from consideration when determining
benefit level;c. Elimination of establishment of overpayments due to retrospective budgeting;d. Elimination of the 100% needs test;e. Increased allowable equity of $5,000 for a client’s automobile;f. Exemption of client savings accounts of up to $3,000;g. Pregnant Teen and Teen Parent requirements for education (teen must be pursuing
high school completion or GED) go into effect;h. Diversion Services provided directly or through referral to other agencies as an
alternative to WorkFirst Cash Assistance;I. A vehicle used to transport disabled individual is exempt without regard to value ;j. DCS non-cooperation sanction is replaced by 25% grant reduction penalty and
determination of DCS non-cooperation to be made by the IV-D agency (underPWORA, each state must operate a Title IV-D child support program to be eligiblefor TANF funds);
k. Eligibility review cycle extended from six to twelve months;l. Disqualification for drug-related felony conviction modified to add an exception for
clients who participate in or have completed treatment;m. Temporary disqualification of caretaker relative for failure to make timely report of a
child’s absence from home;k. Teen parent requirements for appropriate living situation are amended by state law
to further restrict eligibility beyond TANF requirements, a living situation is notappropriate if a minor parent is under 16 and resides with the adult parent of his/herchild ("child rape" situations); and
l. Certain categories of aliens are denied TANF benefits.
2. State-Funded Cash Aid program for legal immigrants implemented.
3. AREN component of TANF is broadened so that clients no longer need an eviction orutility shut-off notice in order to qualify for a payment. Also, the AREN payment was nolonger limited to the grant payment standard for the family size. Effect was to allowsome clients with income (earned or unearned) that exceeded the grant standard toretain eligibility because of the increase in the need (e.g., the payment standard plus theamount requested for AREN).
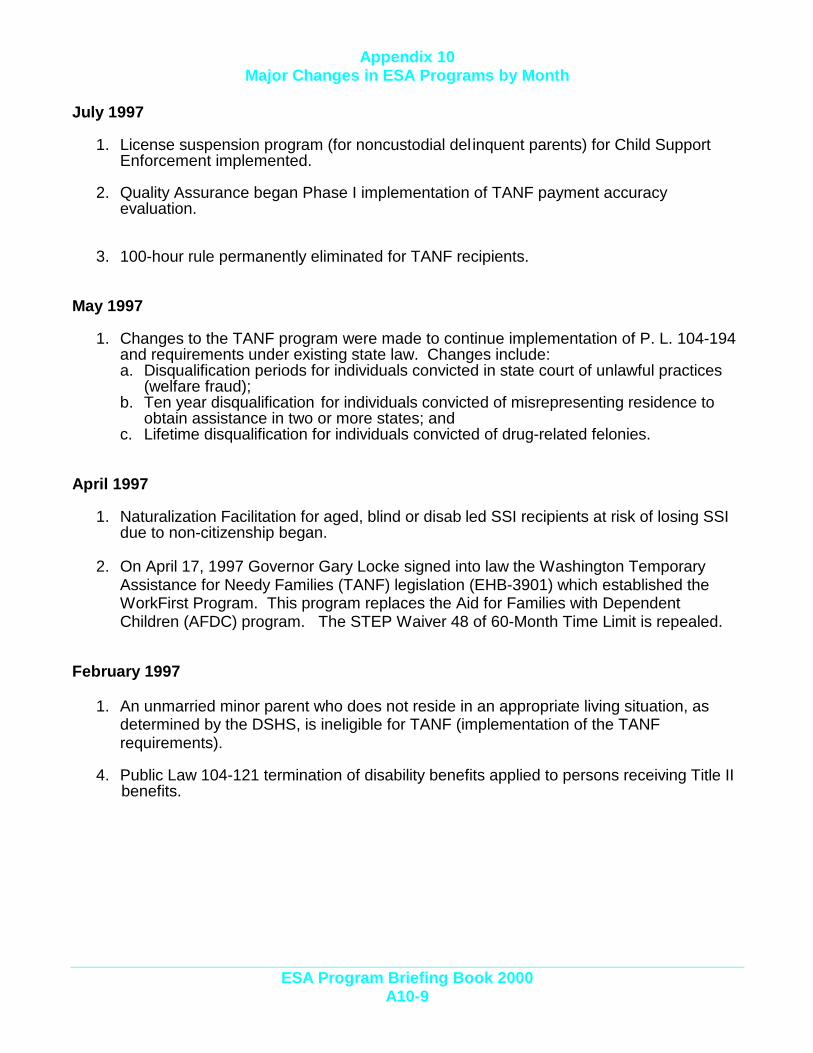
Appendix 10Major Changes in ESA Programs by Month
ESA Program Briefing Book 2000A10-9
July 1997
1. License suspension program (for noncustodial del inquent parents) for Child SupportEnforcement implemented.
2. Quality Assurance began Phase I implementation of TANF payment accuracyevaluation.
3. 100-hour rule permanently eliminated for TANF recipients.
May 1997
1. Changes to the TANF program were made to continue implementation of P. L. 104-194and requirements under existing state law. Changes include:a. Disqualification periods for individuals convicted in state court of unlawful practices
(welfare fraud);b. Ten year disqualification for individuals convicted of misrepresenting residence to
obtain assistance in two or more states; andc. Lifetime disqualification for individuals convicted of drug-related felonies.
April 1997
1. Naturalization Facilitation for aged, blind or disab led SSI recipients at risk of losing SSIdue to non-citizenship began.
2. On April 17, 1997 Governor Gary Locke signed into law the Washington TemporaryAssistance for Needy Families (TANF) legislation (EHB-3901) which established theWorkFirst Program. This program replaces the Aid for Families with DependentChildren (AFDC) program. The STEP Waiver 48 of 60-Month Time Limit is repealed.
February 1997
1. An unmarried minor parent who does not reside in an appropriate living situation, asdetermined by the DSHS, is ineligible for TANF (implementation of the TANFrequirements).
4. Public Law 104-121 termination of disability benefits applied to persons receiving Title II benefits.
Appendix 10Major Changes in ESA Programs by Month
ESA Program Briefing Book 2000A10-10
January 1997
1. Temporary Assistance for Needy Families (TANF) replaced the Aid to Families withDependent Children (AFDC) program on January 10 when the TANF State Plan wassubmitted to the Department of Health and Human Services. The following TANFprogram changes were implemented in January as a result of the PersonalResponsibility & Work Opportunity Reconciliation Act of 1996 (P. L. 104-193) andexisting state law that was no longer superseded by federal law:
a. Upon the request of a law enforcement officer, the DSHS will furnish the address ofany TANF recipient who is a fugitive felon or probation or parole violator or hasinformation that is necessary for the conduct of the officer’s official duties.
b. Personal property of great sentimental value is exempt without regard to ceilingvalue.
c. Non-recurring lump sum income in the form of compensatory awards or relatedsettlements that are not used to repair or replace damaged, destroyed or stolenproperty or to pay medical bills are treated as resources on the first of the monthfollowing receipt. Recipients may reduce the value of the award prior to the first ofthe month as long as the resource is not transferred for less than adequateconsideration.
For lump sums that are not compensatory awards or related settlements, that portionof the award equal to the difference between the $1,000 non-exempt resourceceiling and the client’s existing non-exempt resources will be considered exempt. Ifthe remaining balance of the lump sum is:(1) Less than the payment standard, the amount will be deducted from the
recipient’s grant.(2) In excess of one month’s grant payment less than two month’s payment, the
recipient’s grant will be suspended.(3) In excess of two month’s payment, the recipient is ineligible for two months and
must reapply for assistance at the end of the period of ineligibility.d. Fleeing felons are ineligible for TANF. A person is no longer eligible if fleeing from
the law to avoid prosecution or imprisonment or violating a condition of probation orparole.
2. The shelter deduction is increased from $247 to $250.
3. The following Food Stamp Program changes are the result of the PersonalResponsibility & Work Opportunity Reconciliation Act of 1996 (P. L. 104-193):a. Children 21 years of age or younger living with a par ent must be included in the food
stamp household with the parent.b. Fleeing felons are ineligible for the food stamp program. A person is no longer
eligible for the food stamp program when fleeing from the law to avoid going to courtor jail for a crime considered a felony and breaking a condition of parole orprobation.
c. The 20% work expense deduction from earned income is eliminated when ahousehold fails without good cause to report earnings in a timely manner resulting inan over issuance.

Appendix 10Major Changes in ESA Programs by Month
ESA Program Briefing Book 2000A10-11
c. Immigrant eligibility changed so that many non-citizens who previously qualified donot qualify for food stamps. The following non-citizens are eligible:
(1) Immigrants residing in the United States who:(A) Are veterans honorably discharged for reasons other than alienage,(B) Are active duty personnel of the armed forces,
(C) Are spouses or unmarried dependents of these veterans or active duty personnel, or
(D) Have worked and earned money in 40 qualifying quarters.
(2) For five years after obtaining the designated alien status:(A) Refugees admitted under section 207 of the Immigration and Nationality Act
(INA),(B) Asylees admitted under section 208 of the INA, or(C)Aliens whose deportation has been withheld under section 243(h) of the INA.
4. The energy disregard for cash grants was eliminated. In the past a part of the cashgrant was disregarded as energy assistance. This amount is now being counted asincome. The grant remains the same, but each cash assistance household will losebetween $25 and $30 in food stamp benefits.
5. Food stamp households that are late reapplying for food stamp benefits (after thecertification period has expired), will have the food stamp benefits prorated from thedate of application.
6. Earnings of high school students age 18 and over will have their earnings counted asincome when calculating food stamp benefits.
7. Food stamp benefits will not increase when income is decreased because of failure totake an action required by a public assistance program.
8. New penalties are required for the Food Stamp Employment and Training Program andfor voluntary quit. They are:a. One month for the first time and correct the violation,b. Three months for the second time and correct the violation, andc. Six months for the third time and correct the violation.
9. Fraud penalties are stiffer. People who knowingly break a food stamp rule will bebarred from the food stamp program for 12 months for the first offense and 24 monthsfor the second offense.
10.People who are found guilty of buying, selling or trading food stamps for illegal drugswill be barred for two years. People convicted of buying, selling or trading food stampsof $500 or more are barred for life.
11.People who are found guilty of giving false information about their identity or where theylive to get duplicate benefits will be barred for 10 years.
12.Able bodied adults with no dependents are eligible for food stamp benefits for no morethan three months out of a 36 month period unless working or participating in a workprogram at least twenty hours a week, or participating in a Workfare program.
Appendix 10Major Changes in ESA Programs by Month
ESA Program Briefing Book 2000A10-12
13.The definition of a homeless person is revised to limit homelessness to 90 days whiletemporarily residing in the home of another.
14.The homeless shelter standard is eliminated.
15. The SSI state supplement payment standards were increased when the state returnedto the “payment level method” for determining the amount of the state supplement. Thiswas done in anticipation of a drop in SSI case load due to 1996 Welfare Reformlegislation. However, under the Balanced Budget Act of 1997, most recipients will
remain on SSI. Therefore, the state changed to the “Total Expenditure Method” fordetermining the state supplement amount.
16.Public Law 104-121 terminated SSI benefits for persons whose disability was based ondrug addiction or alcoholism. Disability benefits denied to any person filing for benefitsbased on drug addiction or alcoholism or whose case was adjudicated on or after March29, 1996.
November 1996
1. Governor Mike Lowry presented Washington’s proposed Temporary Assistance toNeedy Families (TANF) State Plan for public review and comment.
2. The ACES On-line Manuals System was implemented statewide. Policy andProcedural manuals as well as the ACES User Manual are now available electronicallyto all ACES users.
October 1996
1. The one-year General Assistance-Unemployable (GA-U) pilot (GAP) project begins.DIA and the Alderwood, Smokey Point, Sky Valley and Everett CSOs establish workingagreements with community employment services agencies to test an inter-agencyassessment tool and determine the services, time and costs needed to help long-term(recipient for six months or more and not suitable to apply for SSI) GA-U recipientsbecome employable.
2. The vehicle resource limit for the food stamp program is raised from $4,600 to $4,650.
3. The standard deduction is frozen at $134.
August 1996
1. On August 22, 1996 President Clinton signed the Personal Responsibility & WorkOpportunity Reconciliation Act (PRWORA) into law. Title IV of the Social Security Act isre-written to repeal the Aid to Families with Dependent Children (AFDC) program andreplace it with the Temporary Assistance for Needy Families (TANF) program. Theentitlement to public assistance is ended, states receive block grants and are givenflexibility to design their own assistance programs. A five-year lifetime limit on receipt ofpublic assistance is established along with stringent work participation requirements.
Appendix 10Major Changes in ESA Programs by Month
ESA Program Briefing Book 2000A10-13
July 1996
1. Administration of most cases for persons receiving long term care services istransferred to Home and Community Services, Aging and Adult Services. GeneralAssistance-Unemployable WAC is amended to waive the requirement for medicaldocumentation to establish incapacity for these cases.
May 1996
1. The definition of student is expanded to include an adult student who has parentalcontrol of a child eleven years of age or under when neither the child’s natural, adoptiveor stepparent nor the adult’s spouse resided in the household.
2. DSHS received waiver approval from Food and Consumer Services to eliminate thetelephone interview for food stamp benefits at the time of the desk review for Aid forFamilies with Dependent Children (AFDC). A face-to-face interview is required every 12months for the Food Stamp Program.
3. Added a new description to inaccessible resources. Resources are inaccessible if whensold, the resources would net the household less than one-half of the applicableresource limit.
December 1995
1. Washington Administrative Code (WAC) is changed effective December 1, 1995 toallow AFDC recipient households the option of including or excluding the child ofunmarried parents when the child is living with both parents. This change was made inresponse to the state court of appeals decision in Sams v. DSHS.
2. Unmarried, two-parent AFDC applicants are offered the opportunity to sign paternityaffidavits at the time of financial interview. Those applicants choosing not to completean affidavit are then referred to the Division of Child Support for paternity establishment.
3. The Food Stamp Standard Deduction is reduced from $138 to $134.
4. Implemented the Garcia decision from the U. S. Ninth Circuit Court of Appeals. Anintentional program violation disqualification shall be implemented the first of the monthfollowing the date the person receives written notification of the AdministrativeDisqualification Hearing for both recipients and non-recipients.

Appendix 10Major Changes in ESA Programs by Month
ESA Program Briefing Book 2000A10-14
October 1995
1. The Food Stamp Program changed as follows:a. Thrifty Food Plan amounts and Basis of Issuance tables were increased.b. Gross, net and 165% of Income Standards increased.c. Standard deduction increased to $138.d. Homeless shelter deduction increased to $143.e. The maximum shelter deduction increased to $247.f. Standard Utility Allowance increased to $220.g. The Telephone Standard increased to $29.h. The vehicle fair market value limit increased to $4,600.
2. Cooperation with Quality Control (QC) is made an eligibility factor for AFDC. AFDCgrants must be terminated for families that refuse to cooperate in the Quality Controlreview process.
2. Refugees are eligible for extended Refugee Medical Assistance through the eighthmonth after entry into the United States, regardless of their Refugee Cash Assistance
status.
September 1995
1. Need standards for grant recipients are raised to reflect annual cost of living adjustment.AFDC grant Payment Standards remain unchanged and are now equal to 43.6% of theNeed Standards.
August 1995
1. The Department suspends retrospectively budgeted Food Stamp households for onemonth when the household receives an extra periodic income. Retrospective budgetingmeans budgeting income from a past month to determine benefits for a future month,e.g., earned income received in January is reported to the Department in February andis then budgeted against March food stamp benefits.
July 1995
1. The Department adds a non-heating/non-cooling limited utility allowance.
2. Mandatory verification for household composition, shelter, and utility costs is added.
3. The Washington Administrative Code (WAC) is amended, as required by theLegislature, to require the DSHS to notify the parent with whom a child last residedwhen the child is approved for AFDC while living with a nonparental relative. Theparent is also informed of the availability of Family Reconciliation Services and that theyhave the right to request their child’s address. The Department is obligated to disclosethe child’s address to the parent provided there are no allegations of child abuse ofneglect..

Appendix 10Major Changes in ESA Programs by Month
ESA Program Briefing Book 2000A10-15
4. Public Law 103-286 exempts payments made to victims of Nazi persecution.
5. As a result of the Confederated Tribes of the Colville Reservation Grand Coulee DamSettlement Act, funds paid from a trust fund established through the act aredisregarded.
6. Bank accounts jointly owned by AFDC recipients and SSI recipients may be excludedas a resource for AFDC if the account was considered by Social Security AdministrationDisability Office (SSADO) in determining SSI eligibility.