briefing: apprenticeships in citiesmycouncil.oxford.gov.uk/documents/s29895/app. 1 - centre for...
TRANSCRIPT

Centre for Cities1
Briefing: apprenticeships in citiesWhat does the data show?January 2016
Executive Summary
Apprenticeships are increasingly regarded by both policymakers and employers as providing an important pathway from education into employment, as well as an effective means of plugging the skills gaps that exist in the national economy.
As a result of this focus the number of people starting apprenticeships has grown considerably over the last decade. This briefing shows how the take-up, nature and quality of apprenticeships varies across 56 English cities. It finds that:
• Number of apprenticeships - In 2013/14, the top three cities for apprenticeship starts per thousand of working-age population were Sunderland, Barnsley and Middlesbrough. Oxford, Cambridge and London were the bottom three cities.
• Age of apprentices - Across all cities, 38 per cent of apprenticeships were undertaken by those aged 25 and over, 35 per cent were undertaken by those aged 19 to 24 years old and 27 per cent were undertaken by young people aged 19 and under. In some cities apprentices tended to be younger. Those aged 19 and under accounted for 33 per cent of all apprenticeship starts in Barnsley, Derby and Sheffield.
• Level of apprenticeships – The majority of apprenticeship starts in cities were Intermediate apprenticeships (see Box 1). One in three starts in cities were Advanced apprenticeships and only 2 per cent were Higher apprenticeships. With 4 per cent of all apprenticeship starts, Blackpool was the city with the highest share of Higher apprenticeships, while less than 1 per cent of all starts in Swindon were at that level.
• Occupation of apprenticeships - In 40 out of 56 English cities most apprenticeship starts were in business, administration and law (on average 31 per cent of all starts). In Blackburn 43 per cent of all apprentices trained in these subjects. Fewer than one in five apprentices in cities started in engineering, construction, maths and science. These subject areas were the most common choice of apprentices in Reading (42 per cent), Portsmouth and Chatham (30 per cent), and Plymouth (27 per cent).
169

Briefing: Apprenticeships in cities • January 2016
Centre for Cities2
• Success rates of apprenticeships - In 2013/14 across all Engish cities, 68 per cent of apprentices successfully completed their training. The success rate was highest in Barnsley (77 per cent) and lowest in Milton Keynes (59 per cent). Success rates were also high in Blackburn (76 per cent) and Portsmouth (76 per cent).
Efforts to create new pathways into employment are much needed and apprenticeships will continue to be important in upgrading the skills of young people and filling local skills gaps. But if apprenticeships are to provide a viable alternative pathway into employment for those young people who choose a vocational rather than an academic route, further efforts are needed to improve the quality of apprenticeships across different cities.
Box 1: Types of apprenticeship
There are three levels of apprenticeship:
• Intermediate level is equivalent to five GCSE passes.
• Advanced level is equivalent to two A level passes.
• Higher level can lead to NVQ Level 4 and above, or a foundation degree.
Introduction
Apprenticeships, which offer practical on- and off-the-job training, are increasingly seen by both policymakers and employers as providing important pathways from education into employment for those young people not taking the traditional academic route, as well as an effective way of plugging the skills gaps that exist in the national economy. There is evidence that apprenticeships can have a positive effect on employment and wages and improve the skills of the workforce.1
Although the tradition of apprenticeships dates back hundreds of years, the number of those undertaking apprenticeships in England has been growing in recent years. At the peak in 2011/12, the number of people starting an apprenticeship in England (515,000) was nearly three times higher than in 2005/06 (172,600).2 In 2013/14, over 430,000 people in England started an apprenticeship.
This reflects their increasing popularity with policymakers. A key policy for the Conservative government is to create 3 million new apprenticeships by 2020. And the establishment of ‘Apprenticeship Hubs’ has also been a key feature in City Deals, while several cities gained more control over the Apprenticeship Grant for Employers3 with the aim to fill gaps in the local economy and equip people with skills that make them more employable.
Alongside the increasing popularity of apprenticeships, there have also been a number of concerns raised about the nature and quality of apprenticeships more generally. These include:
• The relatively low number of 16 to 24 year olds starting apprenticeships possibly signifying that existing jobs were being rebranded;4
• The relatively low number of Higher apprenticeships raises questions about how effective apprenticeships are in preparing apprentices for working in higher-skilled jobs;
1 What Works Centre For Local Economic Growth (2015) Evidence Review 8: Apprenticeships – September 20152 Unless otherwise stated all data in this briefing is from BIS (2015). There is a break in the data from 2011/12 onwards owing to the introduction of Single Individualised
Learner Record (ILR) data collection, which replaced the multiple ILR data collection in earlier years. The new collection system led to a removal of duplicate learners and means that the pre-2011 figures overstate the actual number of apprentices.
3 Clayton, N. and McGough, L. (2015) City deals and skills: How have City and Local Growth Deals supported the development of employment and skills policies that reflect local demand? London: Centre for Cities
4 http://www.theguardian.com/education/2011/oct/27/jobs-rebranded-apprenticeships-government-report
170

Briefing: Apprenticeships in cities • January 2016
Centre for Cities3
• Most apprentices choose business, administration and law apprenticeships, despite the shortage of technical skills in the labour market;5
• The need to improve the success rates of apprenticeships when more than three in 10 apprentices fail to complete their training.6
This short briefing explores these issues from a city perspective, focusing first on how the take-up of apprenticeships varies between cities. The paper then examines the age profile of individuals starting apprenticeships, explores the link between the types of apprenticeship being undertaken and skills demand in cities, and looks at the variation in success rates. The aim of the briefing is to provide an analytical basis for further research on the role that policymakers can play in driving up demand for and the quality of apprenticeships in cities.
Where are people most likely to undertake an apprenticeship?
While the last few years have seen an unprecedented number of people starting apprenticeships, across England this has varied between cities.
Figure 1: Apprenticeship starts by city
Source: BIS, 2015
5 http://www.theguardian.com/business/2015/feb/10/uk-plumbers-builders-engineers-skill-crisis-economy6 http://www.theguardian.com/careers/careers-blog/higher-apprenticeships-for-engineering-science-technology
Apprenticeship starts in cities in 2013/14(per 1,000 working-age population)
18 - 20
16 - 17
13 - 15
10 - 12
5 - 9
Huddersfield
Sunderland
Hull
Barnsley
Stoke
Newcastle
Middlesbrough
GrimsbyDoncaster
Mansfield
Birmingham
Telford
York
Cambridge
CrawleyAldershot
Reading
Oxford
Bristol
Wakefield
Peterborough
Ipswich
Southend
Sheffield
Norwich
Nottingham
Leicester
Luton
London
Chatham
Gloucester
Bournemouth
Birkenhead
Liverpool
Bolton
Warrington
Blackpool
Derby
Northampton
Coventry
Milton Keynes
Swindon
Plymouth
Southampton Worthing
Portsmouth
Brighton
Preston
Wigan
Blackburn
Bradford
Manchester
Rochdale
BurnleyLeeds
Hastings
171

Briefing: Apprenticeships in cities • January 2016
Centre for Cities4
In 2013/14, the city with the highest apprenticeship take-up was Sunderland, where for every 1,000 of resident working-age population, 20 started an apprenticeship (Table 1). Immediately behind were Barnsley and Middlesbrough with 19 starts for every 1,000 of working-age population.
Table 1: Top 10 cities for apprenticeship starts per 1,000 of working-age population, 2013/14
Rank City Apprenticeship starts per 1,000 working age population, 2013/14
1 Sunderland 20
2 Barnsley 19
3 Middlesbrough 19
4 Blackburn 19
5 Birkenhead 18
6 Stoke 18
7 Wigan 18
8 Doncaster 18
9 Mansfield 17
10 Portsmouth 17
Source: BIS, 2015
At the other end of the spectrum, people were almost four times less likely to start an apprenticeship in Oxford and Cambridge than in Sunderland – only five and six out of 1,000 working-age residents, respectively.
Table 2: Bottom 10 cities for apprenticeship starts per 1,000 of working-age population, 2013/14
Rank City Apprenticeship starts per 1,000 working age population, 2013/14
47 Swindon 11
48 Leicester 11
49 Milton Keynes 11
50 Norwich 11
51 York 10
52 Crawley 8
53 Brighton 8
54 London 7
55 Cambridge 6
56 Oxford 5
Source: BIS, 2015
The data on the number of employers offering apprenticeships at the Local Enterprise Partnership (LEP) level and on young people in higher education suggests that the low take-up of apprenticeships in cities such
172
Briefing: Apprenticeships in cities • January 2016
Centre for Cities5
as Oxford, Cambridge, London and Brighton is a result of both low take-up from individuals who have other routes into employment, and low levels of demand from employers who are therefore offering fewer apprenticeships.7
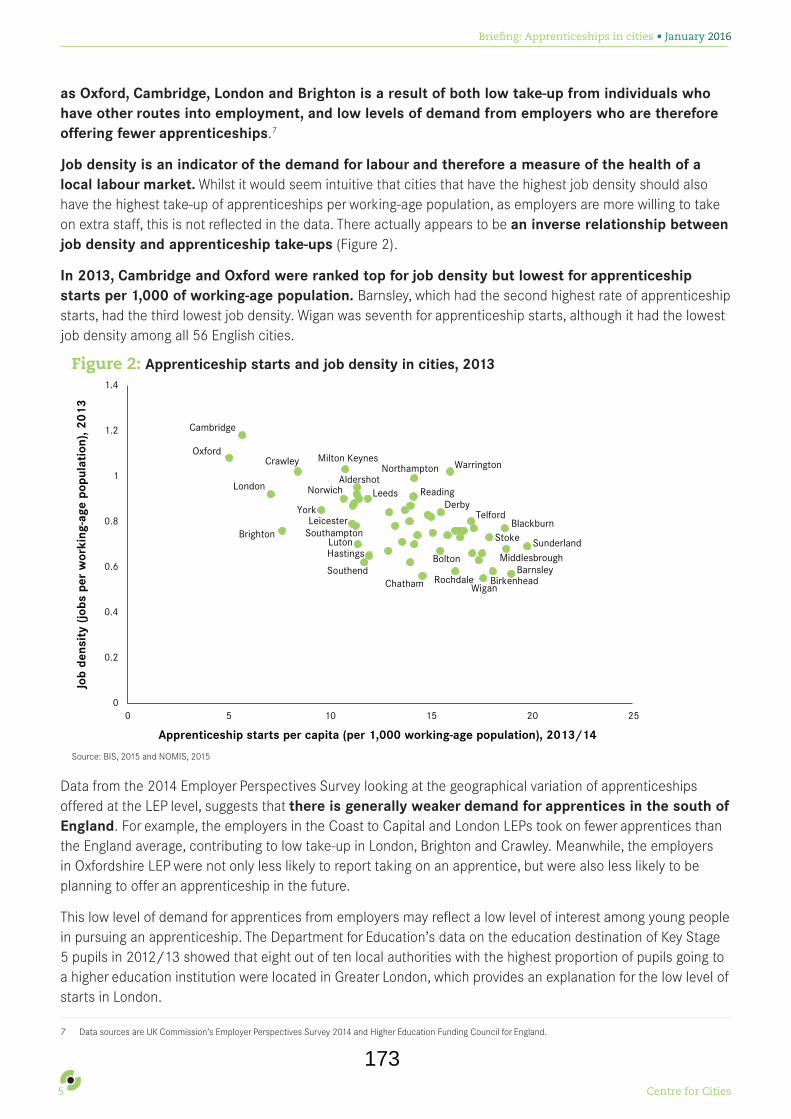
Job density is an indicator of the demand for labour and therefore a measure of the health of a local labour market. Whilst it would seem intuitive that cities that have the highest job density should also have the highest take-up of apprenticeships per working-age population, as employers are more willing to take on extra staff, this is not reflected in the data. There actually appears to be an inverse relationship between job density and apprenticeship take-ups (Figure 2).
In 2013, Cambridge and Oxford were ranked top for job density but lowest for apprenticeship starts per 1,000 of working-age population. Barnsley, which had the second highest rate of apprenticeship starts, had the third lowest job density. Wigan was seventh for apprenticeship starts, although it had the lowest job density among all 56 English cities.
Figure 2: Apprenticeship starts and job density in cities, 2013
Source: BIS, 2015 and NOMIS, 2015
Data from the 2014 Employer Perspectives Survey looking at the geographical variation of apprenticeships offered at the LEP level, suggests that there is generally weaker demand for apprentices in the south of England. For example, the employers in the Coast to Capital and London LEPs took on fewer apprentices than the England average, contributing to low take-up in London, Brighton and Crawley. Meanwhile, the employers in Oxfordshire LEP were not only less likely to report taking on an apprentice, but were also less likely to be planning to offer an apprenticeship in the future.
This low level of demand for apprentices from employers may reflect a low level of interest among young people in pursuing an apprenticeship. The Department for Education’s data on the education destination of Key Stage 5 pupils in 2012/13 showed that eight out of ten local authorities with the highest proportion of pupils going to a higher education institution were located in Greater London, which provides an explanation for the low level of starts in London.
7 Data sources are UK Commission’s Employer Perspectives Survey 2014 and Higher Education Funding Council for England.
Aldershot
BarnsleyBirkenhead
Blackburn
Bolton
Brighton
Cambridge
Chatham
Crawley
Derby
Hastings
Leeds
Leicester
London
Luton
Middlesbrough
Milton KeynesNorthampton
Norwich
Oxford
Reading
Rochdale
Southampton
Southend
Stoke Sunderland
Telford
Warrington
Wigan
York
0
0.2
0.4
0.6
0.8
1
1.2
1.4
0 5 10 15 20 25
Job
dens
ity
(jobs
per
wor
king
-age
pop
ulat
ion)
, 201
3
Apprenticeship starts per capita (per 1,000 working-age population), 2013/14
173
Briefing: Apprenticeships in cities • January 2016
Centre for Cities6
Who undertakes apprenticeships in cities?
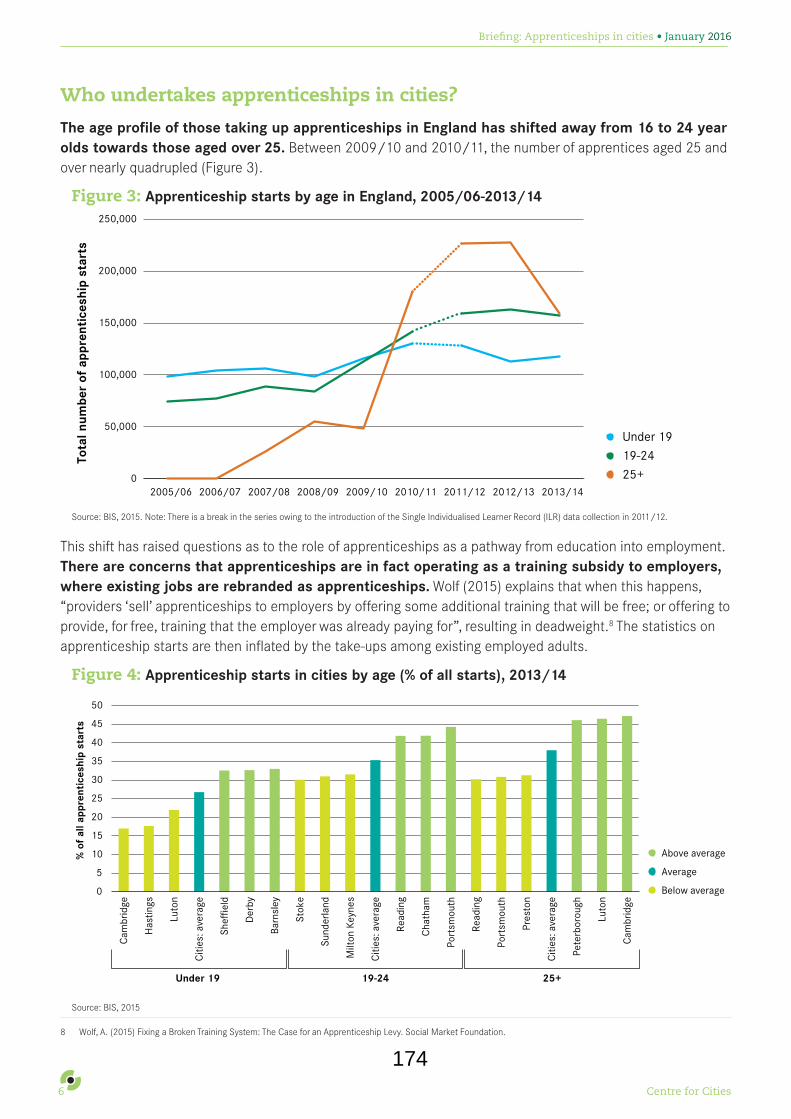
The age profile of those taking up apprenticeships in England has shifted away from 16 to 24 year olds towards those aged over 25. Between 2009/10 and 2010/11, the number of apprentices aged 25 and over nearly quadrupled (Figure 3).
Figure 3: Apprenticeship starts by age in England, 2005/06-2013/14
Source: BIS, 2015. Note: There is a break in the series owing to the introduction of the Single Individualised Learner Record (ILR) data collection in 2011/12.
This shift has raised questions as to the role of apprenticeships as a pathway from education into employment. There are concerns that apprenticeships are in fact operating as a training subsidy to employers, where existing jobs are rebranded as apprenticeships. Wolf (2015) explains that when this happens, “providers ‘sell’ apprenticeships to employers by offering some additional training that will be free; or offering to provide, for free, training that the employer was already paying for”, resulting in deadweight.8 The statistics on apprenticeship starts are then inflated by the take-ups among existing employed adults.
Figure 4: Apprenticeship starts in cities by age (% of all starts), 2013/14
Source: BIS, 2015
8 Wolf, A. (2015) Fixing a Broken Training System: The Case for an Apprenticeship Levy. Social Market Foundation.
0
50,000
100,000
150,000
200,000
250,000
2005/06 2006/07 2007/08 2008/09 2009/10 2010/11 2011/12 2012/13 2013/14
Tota
l num
ber
of a
ppre
ntic
eshi
p st
arts
Under 19
19-24
25+
0
5
10
15
20
25
30
35
40
45
50
Below average
Average
Above average
Cam
brid
ge
Has
tings
Luto
n
Citi
es: a
vera
ge
Shef
field
Der
by
Barn
sley
Stok
e
Sund
erla
nd
Milt
on K
eyne
s
Citi
es: a
vera
ge
Read
ing
Cha
tham
Port
smou
th
Read
ing
Port
smou
th
Pres
ton
Citi
es: a
vera
ge
Pete
rbor
ough
Luto
n
Cam
brid
ge
Under 19 19-24 25+
% o
f al
l app
rent
ices
hip
star
ts
174

Briefing: Apprenticeships in cities • January 2016
Centre for Cities7
In line with national trends, most apprenticeships in cities were undertaken by people aged 25 and over (38 per cent) or by 19 to 24 year olds (35 per cent), and far fewer apprenticeships were taken up by those aged 19 and under (27 per cent) (Figure 4). Several cities stand out as having a relatively young apprenticeship profile, however. There was a higher than average representation of young people (under 19) starting apprenticeships in Barnsley (33 per cent), Derby (33 per cent) and Sheffield (33 per cent) (Figure 4),9 while people aged 19-24 were most widely represented among apprentices in Portsmouth (44 per cent), Chatham (42 per cent) and Reading (42 per cent).
In other cities, the age profile of someone undertaking an apprenticeship was older. A larger share of apprenticeships was taken-up by those aged 25 and over in Cambridge (47 per cent), Luton (46 per cent) and Peterborough (46 per cent) compared to the city average (38 per cent).
What is the level of apprenticeships undertaken in cities?
The low number of Higher apprenticeships being undertaken has also attracted criticism. Critics have suggested that the incentives surrounding apprenticeships has led to training providers offering short, low-level and low-quality apprenticeships rather than longer, more rigorous and high-quality training.10 And this means that few apprenticeships are preparing people to work in a high-knowledge economy.
Figure 5: Apprenticeship starts in cities by level, 2012/13 and 2013/14
Source: BIS, 2015
Apprenticeship can be one of three levels: Intermediate, Advanced and Higher.11 Nearly two thirds of all apprenticeship starts in cities in 2013/14 were Intermediate, and only 2 per cent were Higher (Figure 5). While the proportion of Higher apprenticeship starts in cities has increased marginally between 2012/13 and 2013/14 (from 1.9 to 2.1 per cent), the proportion of Advanced apprenticeships fell from 41 per cent in 2012/13 to 33 per cent in 2013/14. Intermediate apprenticeships increased from 57 per cent to 65 per cent between those two years.
Cities that in 2013/14 had proportionally more Intermediate apprenticeships included Chatham, Leicester, Northampton, Norwich and Oxford, where they made up more than 70 per cent of all starts compared to the city average of 65 per cent. These cities also had proportionally fewer Advanced apprenticeship starts relative to the city average of 33 per cent.
9 Those aged 19 and under were not the dominant group among apprentices in any city as the shares never exceeded 33 per cent.10 Wolf, A. (2015) Fixing a Broken Training System: The Case for an Apprenticeship Levy. Social Market Foundation.11 Intermediate apprenticeship is equivalent to 5 GCSE passes, Advanced apprenticeship is equivalent to 2 A level passes and Higher apprenticeship can lead to NVQ Level 4
and above, or a foundation degree.
Intermediate Level Apprenticeship
Advanced Level Apprenticeship
Higher Apprenticeship
2013/142012/13
57%41%
2%
65%33%
2%
175

Briefing: Apprenticeships in cities • January 2016
Centre for Cities8
Reading stands out – unlike other cities, the majority of apprenticeship starts there in 2013/14 were Advanced apprenticeships (56 per cent of all starts).
Across all cities, the share of Higher apprenticeships is low. At 4 per cent, the share of Higher apprenticeships in all starts in 2013/14 was highest in Blackpool. In Swindon, on the other hand, an apprentice in 2013/14 was least likely to start a Higher apprenticeship (0.6 per cent).
How is the industrial profile of cities reflected in apprenticeships?
Fewer than one in five apprentices train in engineering, construction, maths and science, and fewer still (2 per cent) complete Higher apprenticeships. This has sparked claims that the provision of apprenticeships is largely unable to address the shortage in technical and highly skilled occupations.
Figure 6: Apprenticeship starts in cities by subject area, 2013/14
Source: BIS, 2015
In general, the shift in the makeup of the UK economy away from manufacturing and towards services is reflected in the distribution of the apprenticeship starts by subject area (Figure 6). In 2013/14, business administration and law made up the largest proportion of apprenticeship starts in English cities (31 per cent). The second most popular were apprenticeships in health, public services and care (24 per cent), which reflects growing demand for health and care staff due to an ageing population and existing shortages in the health and care workforce. The third most popular subject areas were retail and commercial enterprise, together with leisure, travel and tourism (21 per cent).
The overall tendency for apprentices to choose business, administration and law is also evident at the city level: in 40 out of 56 cities, most apprenticeship starts in 2013/14 were in these sector areas (Figure 7). In Blackburn 43 per cent of all apprentices started training in these sector areas.
In Blackpool, Bournemouth, Bristol, Gloucester Hastings, Southampton and Worthing, the most popular subjects were healthcare, public services and care. In Cambridge, Oxford and York, apprentices tended to choose retail, leisure, travel and tourism. Engineering, construction, science and maths were the most common choice of apprentices in four out of 56 cities: Reading (42 per cent), Portsmouth and Chatham (30 per cent), and Plymouth (27 per cent).
Business, Administration and Law
Engineering, Construction, Science and Maths
Health, Public Services and Care
Retail, Leisure, Travel and Tourism
Humanities
Agriculture, Horticulture and Animal Care
Information and Communication Technology
31%
18%24%
2%
21%
1% 3%
176

Briefing: Apprenticeships in cities • January 2016
Centre for Cities9
Figure 7: Most popular apprenticeship subject areas by city, 2013/14
Source: BIS, 2015
Success rates of apprenticeships: how do they vary across cities?
The increase in apprenticeship starts may indicate a general positive trend, but does not say anything about completion rates. Apprenticeship success rates measure the proportion of apprentices that enrolled and successfully completed all elements of the apprenticeship programme and provide some indication of the quality of apprenticeships.12
In 2013/14, 68 per cent of apprentices who started an apprenticeship across all English cities successfully completed their training.13 But the chances of successfully completing an apprenticeship varied considerably between different cities. The success rate was highest in Barnsley (77 per cent), which was 18 percentage points higher than in Milton Keynes (59 per cent), where it was lowest (Figure 8). Success rates were also high in Blackburn (76 per cent) and Portsmouth (76 per cent) but they were low in Aldershot (60 per cent) and Leicester (62 per cent).
12 Overall success rates are reported as either Learner Local Authority Success Rates, which are based on the apprentices’ home postcodes, or Delivery Local Authority Success Rates, which are based on the postcode of the institution’s delivery locations. To provide a comparative overview of how the quality of apprenticeships differs between cities, this briefing discusses the variation in Delivery Success Rates, which link the learning outcomes to where the learning is delivered.
13 This success rate is a mean value of delivery success rates across all institution types (general further education and tertiary colleges, other public funded institutions, private sector public funded institutions, schools, sixth form colleges and specialist colleges), all apprenticeship types (Intermediate, Advanced and Higher) and all age categories (under 19, 19-24 and 25+) of the participants. Delivery success rates measure the completion rates of apprenticeships based on the delivery location postcode, rather than the learner’s home postcode (learner success rates).
Business, Administration and Law
% of apprentices that chosethe subject area
Most popular apprenticeshipsubject in cities in 2013/14
24 - 28
29 - 32
33 - 36
37 - 40
41 - 43
Engineering, Construction, Science and Maths
Health, Public Services and Care
More than one
Retail, Leisure, Travel and Tourism
Huddersfield
Sunderland
Hull
Barnsley
Stoke
Newcastle
Middlesbrough
GrimsbyDoncaster
Mansfield
Birmingham
Telford
Coventry
York
Cambridge
CrawleyAldershot
Reading
Oxford
Bristol
Wakefield
Peterborough
Ipswich
Southend
Sheffield
Norwich
Nottingham
Leicester
Luton
London
Chatham
Gloucester
Bournemouth
Birkenhead
Liverpool
Bolton
Warrington
Blackpool
Derby
Northampton
Milton Keynes
Swindon
Plymouth
SouthamptonWorthing
Portsmouth
Brighton
Preston
Wigan
BlackburnBradford
Manchester
Rochdale
BurnleyLeeds
Hastings
177

Briefing: Apprenticeships in cities • January 2016
Centre for Cities10
Figure 8: Apprenticeship starts and success rates in cities, 2013/14
Source: BIS, 2015
Across all cities, there appears to be a positive relationship between success rates and apprenticeship starts (Figure 8). Sunderland, which had the highest number of apprenticeship starts per thousand of working-age population, had a high success rate (74 per cent). The success rate of apprenticeships in Oxford, which had the lowest number of apprenticeship starts, was lower than in Sunderland (69 per cent).
On average, cities with the largest share of apprenticeship starts in engineering, construction, science and maths also had high success rates. In this group of cities, Portsmouth had the third highest success rate among the 56 English cities (76 per cent). Blackburn, which had the highest concentration of starts in business, administration and law, had the second highest success rate (76 per cent).
This variation in success rates suggests that some cities could do more to support young people to complete their apprenticeships. Although some variation between places is to be expected, it is essential that young people right across the country are given appropriate support to develop their skills and to make the transition from education into employment.
Aldershot
Barnsley
Birkenhead
Blackburn
Brighton
Burnley
Cambridge
Chatham
Coventry
CrawleyDoncaster
Gloucester
Grimsby
Hastings
Huddersfield
Hull
Ipswich
Leeds
Leicester
Liverpool
LondonLuton
Manchester
Mansfield
Middlesbrough
Milton Keynes
Newcastle
Norwich
Oxford
Plymouth
Portsmouth
Preston
Reading
Rochdale
SheffieldSouthampton
Stoke
Sunderland
Swindon
Telford
Warrington
Wigan
Worthing
York
58
60
62
64
66
68
70
72
74
76
78
0 2 4 6 8 10 12 14 16 18 20
Succ
ess
rate
s (%
)
Apprenticeship starts per 1,000 working-age population
178

Briefing: Apprenticeships in cities • January 2016
Centre for Cities11
Figure 9: Success rates of apprenticeships in cities, 2013/14
Source: BIS, 2015
Conclusions
Efforts to create new pathways into employment are much needed and apprenticeships will continue to be important in upgrading the skills of young people and filling local skills gaps. But if apprenticeships are to provide a viable alternative pathway into employment for those young people who choose a vocational rather than an academic route, further efforts are needed to improve the quality of apprenticeships across different cities.
While apprenticeships are intended to provide an additional route into employment for young people not taking the traditional academic routes, take-up has shifted away from those aged 16-24 years old towards those aged 25 and over. The shift in the age profile of apprentices has led to concerns that existing jobs are being rebranded as apprenticeships. In 2013/14 those aged 25 and over accounted for 38 per cent of all apprenticeship starts in cities, while those aged 19-24 and under 19 years old made up 35 per cent and 27 per cent of all starts respectively. The age profile of apprentices in Barnsley, Derby and Sheffield, however, tended to be younger.
Success rates of apprenticeshipsin cities in 2013/14 (%)
74 - 77
71 - 73
68 - 70
64 - 67
59 - 63
Huddersfield
Sunderland
Hull
Barnsley
Stoke
Telford
Newcastle
Middlesbrough
GrimsbyDoncaster
Mansfield
Birmingham
York
Cambridge
CrawleyAldershot
Reading
Oxford
Bristol
Wakefield
Peterborough
Ipswich
Southend
Sheffield
Norwich
Nottingham
Leicester
Luton
London
Chatham
Gloucester
Bournemouth
Birkenhead
Liverpool
Bolton
Warrington
Blackpool
Derby
Northampton
Coventry
Milton Keynes
Swindon
Plymouth
Southampton Worthing
Portsmouth
Brighton
Preston
Wigan
BlackburnBradford
Manchester
Rochdale
BurnleyLeeds
Hastings
179

Briefing: Apprenticeships in cities • January 2016
12
There are also concerns about the level of apprenticeships undertaken, and the extent to which they are preparing people for work in the knowledge economy. The majority of all apprenticeship starts in cities in 2013/14 were Intermediate apprenticeships. One in three starts were Advanced apprenticeships and only 2 per cent were Higher apprenticeships. But with 56 per cent of all starts being Advanced apprenticeships, the nature of take-ups was significantly different in Reading.
The most popular subject areas chosen by apprentices in cities were business, administration and law, with fewer apprenticeships undertaken in science, technology, engineering and maths (STEM) subjects, despite the reported skills shortages in these areas – Reading, Portsmouth, Chatham and Plymouth were the exception. Business, administration and law were chosen by 43 per cent of apprentices undertaking their training in Blackburn, for example.
The completion rates of apprenticeships is also an area of concern as more than three in ten apprentices in cities failed to complete their training. But the success rates of apprenticeships also differ significantly between different cities, suggesting an issue of variable apprenticeship provision in some cities. The success rates were some 18 percentage points higher in Barnsley (77 per cent) than in Milton Keynes (59 per cent). And although some variation is expected, the worst performing cities could do better to support the apprentices towards the completion of their training.
The government target to create 3 million new apprenticeships by 2020 is welcome but for apprenticeships to provide a viable route into employment for young people, it is essential to focus on the quality of provision, by ensuring Higher apprenticeships are created, and in a broad range of subjects, such as STEM, that will equip people with skills the labour market needs.
Endnote
This briefing analyses data on Apprenticeships starts for the period 2005/06 – 2013/14. During the course of drafting this briefing paper, data on Apprenticeship starts by local education authority 2014/15, have been made available. More detailed data series, including Apprenticeship starts by sector subject area by local education authority 2014-15, and Apprenticeship starts by age and level by local education authority 2014-15, will not be made publicly available until May 2016. We plan to update this briefing paper when the full set of data on Apprenticeship starts 2014/15 is released.
Contact
Ilona Serwicka
Researcher at Centre for Cities
[email protected] / 0207 803 4304
© Centre for Cities 2016
Centre for CitiesSecond Floor
9 Holyrood StreetLondon SE1 9EL
www.centreforcities.org
Centre for Cities is a registered charity (No 1119841) and a company limited by guarantee registered in England (No 6215397)
180