bridging macro to micro: gs top-down stock...
TRANSCRIPT

June 11, 2012
Bridging macro to micro: GS
top-down stock selection
Portfolio Strategy Research
A tool to translate macro views into stock ideas
We introduce a top-down stock picking framework which builds upon
macro factor mapping, micro-specific comparisons, and business-cycle-
based investing, aiming to connect macro views to micro implementation.
Macro and micro are both important to returns
Macro factors such as global growth, local growth and financial conditions
are important return drivers for around 60% of market cap in Asia.
Additionally, micro specifics such as valuations, consensus EPS changes,
and technical indicators have strong links with ensuing 3-month returns.
Macro + Micro = Alpha
Using the four phases of the business cycle as defined by our Global
Leading Indicator (GLI), we select stocks based on their macro and micro
characteristics. Backtests suggest that such an approach would help
produce returns that exceed those of traditional buy/hold strategies.
Stock picks in a contraction phase: Lower beta and growth
exposure; and buy easing beneficiaries
Our GLI suggests that we are currently in a contraction phase (since April).
Against this backdrop, we highlight stocks with appropriate macro
exposure and micro support: NAB, Orica, Hengan, PetroChina, Tencent,
CK, HSB, HDFC, ITC, BRI, LS Corp, Shinhan, CIMB, SM Inv., JCC, Delta,
TSMC and BK Bank. We intend to refresh our stock ideas on a regular
basis.
Top-down analysis works for select economic groups but not all
Source: FactSet, MSCI, CEIC, Goldman Sachs Global ECS Research.
Kinger Lau, CFA
+852-2978-1224 [email protected] Goldman Sachs (Asia) L.L.C.
Timothy Moe, CFA
+852-2978-1328 [email protected] Goldman Sachs (Asia) L.L.C.
Caesar Maasry
+852-2978-7213 [email protected] Goldman Sachs (Asia) L.L.C.
Richard Tang
+852-2978-0722 [email protected] Goldman Sachs (Asia) L.L.C.
Sunil Koul
+852-2978-0924 [email protected] Goldman Sachs (Asia) L.L.C.
Goldman Sachs does and seeks to do business with companies covered in its research reports. As a result, investorsshould be aware that the firm may have a conflict of interest that could affect the objectivity of this report. Investors should consider this report as only a single factor in making their investment decision. For Reg AC certification and otherimportant disclosures, see the Disclosure Appendix, or go to www.gs.com/research/hedge.html. Analysts employed bynon-US affiliates are not registered/qualified as research analysts with FINRA in the U.S. This report is intended fordistribution to GS institutional clients only.
The Goldman Sachs Group, Inc. Goldman Sachs Global Economics, Commodities and Strategy Research

June 11, 2012 Asia Pacific
Goldman Sachs Global Economics, Commodities and Strategy Research 2
Introducing GS top-down stock picking framework
In this report, we introduce a framework to help connect the macro environment to
single stock selection.
Specifically, we believe this framework would be helpful to:
Formalize our existing top-down stock picking logic and approach in a disciplined
and statistically-tested manner that is also intuitively appealing
Better comprehend how macro factors influence individual stock returns and help
connect macro trends to actionable stock ideas
Expand our implementation focus to include more single stock ideas as well as
theme baskets and derivative overlays
Complement our sector analysts’ views and our bottom-up stock selection
processes such as Asia-Pacific Conviction Lists and GS Sustain, which focus
principally on operating returns and industry position
Provide a tool which can add further perspective to investors’ own stock selection
processes
The exhibit below summarizes the key building blocks and logic flow in this report.
The key building blocks and approach of our stock-selection framework
Source: FactSet, I/B/E/S, Goldman Sachs Global ECS Research estimates.

June 11, 2012 Asia Pacific
Goldman Sachs Global Economics, Commodities and Strategy Research 3
Executive summary
Top-down and bottom-up are the two prevalent approaches to securities analysis.
However, neither is perfect— macro-focused investors may overlook micro factors and
industry dynamics while stock pickers may sometimes miss the big picture.
With an objective of combining the two approaches and translating macro views into
actionable stock ideas (and, hopefully, good returns), we introduce a top-down stock
selection framework which builds upon macro factor profiling, micro specific
comparisons, and business-cycle-based investing.
Key conclusions and investment implications in this report are:
1. Macro analysis is important, even to stock pickers. Our regression model
shows select macroeconomic factors are statistically significant return drivers
(R²>40%) for around 250 stocks in Asia, representing 58% of MXAPJ market cap.
This underscores the importance of macro analysis even to bottom-up-oriented
investors. Macro analysis is particularly effective in Hong Kong, China, Singapore,
and sectors including energy, financials, and materials.
2. Some macro variables are more important than others. Investors can be
overwhelmed by macro data, but many macroeconomic variables are highly
correlated. Stock pickers can simplify the process of macro monitoring by
focusing on six factors, namely, market risk, local growth, policy/liquidity, CPI,
oil prices, and global growth.
3. Micro specifics have linked well with ensuing returns. Empirically, micro
considerations such as valuation, consensus EPS and target price changes, and
technical entry levels have shown very strong relationships with ensuing 3-
month returns. These micro considerations complement the macro perspective
and address the extent to which fundamentals are discounted in share prices.
4. Our two-tier stock selection strategy may help performance. We have
established a trading algorithm based on our global leading indicator and its
derived business cycle— expansion, slowdown, contraction, and recovery— to
implement our macro and micro analysis. Backtests of our two-tier strategy
suggest performance can be enhanced to a meaningful extent by considering
these macro and micro factors.
5. Useful tool. This framework is flexible and can complement the investment
process for different types of investors.
Caveats: A tool, not a cure-all
We believe this approach adds value, but we also recognize its limitations. Regression
models are static and assume mean-reversion, and need to be updated and refined to
adapt to changing fundamentals.

June 11, 2012 Asia Pacific
Goldman Sachs Global Economics, Commodities and Strategy Research 4
Stock ideas: Investing in a contraction phase The latest GLI reading suggests the global economy has entered a contraction phase.
Against this backdrop, we would:
a. Reduce market risk “beta”;
b. Buy stocks with low sensitivity to local growth;
c. Accumulate policy easing beneficiaries;
d. Own stocks that may outperform in a disinflationary environment;
e. Buy stocks that may benefit from lower oil prices;
f. Overweight stocks that are less sensitive to global growth momentum.
Stocks which have these macro characteristics and have shown favorable micro readings
are shown in Exhibit 1.
Exhibit 1: We like these stocks because of their favorable macro exposure and compelling micro profile relative to their
regional peers Stock recommendations for June 2012 (Priced as of June 5)
Note (1): These stocks are rated Buy or Neutral by Goldman Sachs Research except SM Investments which is NC. We use consensus estimates for SM Investments. Note (2): * denotes the stock is on our regional Conviction List. “Tick” indicates stock that ranks top-30 percentile within each factor relative to its market peers and they perform well in our specified macro environment. Revisions and sentiment are based on forward 12-month consensus EPS.
Source: Factset, I/B/E/S, Goldman Sachs Global ECS Research estimates.
Key exhibits for chart lovers
We highlight the important exhibits (takeaways) as follows:
Exhibit 7: Where top-down analysis may be more applicable in terms of markets
and sectors.
Exhibit 8: Stocks that are the most and least sensitive to different macro factors
across markets.
Exhibit 17: The empirical relationships between micro parameters and ensuing
returns.
Exhibits 28 to 38: Market summary pages which detail the factor loading for each
stock under our study universe.
Ticker Name MarketMkt. cap
(US$mn)
6m
ADVT
GS
Rating
Global
growth
13E
P/E
13E
P/B
13E
D/Y
13E
EPSg
EPS
rev.
EPS
sent.
14d
RSI%b
NAB AT National Australia Bank Australia 49,179 156.9 B √ √ √ 8.4 1.2 8.6% 5% -1% 17% 35 14%
ORI AT Orica Australia 8,473 34.8 B* √ √ 10.8 2.1 4.7% 16% 3% 13% 28 9%
1044 HK Hengan Int'L Group Co China 6,748 20.1 N √ √ √ 19.9 5.7 3.2% 21% 4% 43% 32 -4%
857 HK Petrochina Co H China 26,240 89.1 N √ √ √ 8.6 1.2 5.2% 8% 3% 0% 28 5%
700 HK Tencent Holdings Lim(Cn) China 27,186 98.2 B √ 19.2 5.5 0.6% 27% 4% 22% 37 13%
1 HK Cheung Kong Holdings Hong Kong 15,492 51.2 B √ √ √ 7.7 0.6 3.9% 16% 2% 6% 28 8%
11 HK Hang Seng Bank Hong Kong 9,866 19.6 N √ √ √ 10.6 2.1 5.2% 9% 2% 15% 38 26%
HDFC IS Housing Dev Finance Corp India 12,601 57.4 N √ √ √ 14.8 3.2 2.2% 15% 15% -15% 44 44%
ITC IS ITC India 8,867 33.4 B √ √ √ 21.5 8.0 2.8% 17% 4% 23% 41 0%
BBRI IJ Bank Rakyat Indonesia Indonesia 6,253 24.4 N √ √ √ 7.2 1.7 2.8% 13% 3% -5% 23 8%
006260 KP LS Corp Korea 1,162 9.2 B √ √ 6.4 0.9 1.6% 23% 5% 50% 47 23%
055550 KP Shinhan Financial Group Korea 13,742 40.0 N √ √ √ 6.3 0.7 2.9% 4% 1% 19% 39 31%
CIMB MK CIMB Group Holdings Bhd Malaysia 11,204 23.8 N √ √ 11.6 1.8 4.1% 12% 2% -8% 52 60%
SM PM SM Investments Philippines 3,334 9.2 NC √ √ √ 15.5 2.1 1.7% 12% 2% 0% 48 36%
JCNC SP Jardine Cycle & Carriage Singapore 3,467 7.8 N √ 8.3 - 5.1% 24% 9% 0% 33 17%
2308 TT Delta Electronics Taiwan 4,749 21.5 B √ √ 12.7 2.0 5.8% 10% 8% 67% 36 11%
2330 TT Taiwan Semiconductor Mfg Taiwan 64,204 101.0 N √ √ √ 11.5 2.5 3.8% 10% 10% 56% 41 11%
BBL/F TB Bangkok Bank Fgn Thailand 4,617 7.7 B* √ √ √ 8.6 1.1 4.4% 17% 4% 38% 31 -13%
Median 9,366 28.9 10.7 2.0 3.9% 14% 3% 16% 37 12%
MXAPJ 9.3 1.3 4.0% 11% 0% -6% 30 16%
Factor loading Valuations Fundamentals Technical
Market
risks
Local
growth
Policy/
liquidityInflation Oil

June 11, 2012 Asia Pacific
Goldman Sachs Global Economics, Commodities and Strategy Research 5
Part 1: Mapping stock returns to macro exposure
Defining our study universe
To ensure the practicability of the regression results, we choose to focus on MXAPJ
constituents with at least US$1bn of index market cap, over US$5mn of average daily value
traded (ADVT) in the past 6 months, and at least 5 years of listing history. There are 412
stocks in MXAPJ which fit these requirements (as of April 30, 2012) and they represent
86% of MXAPJ index market cap. These stocks are mostly located in Australia, China,
Korea and India, with a sector concentration in financials, IT and telecoms (Exhibits 2 and
3).
Exhibit 2: Liquid, large-cap stocks are mostly found in
Australia, China, Korea and India Free-float market cap distribution by markets
Exhibit 3: ...and they are concentrated in sectors including
financials, IT, and telecoms Free-float market cap distribution by sectors
Source: FactSet, MSCI, Goldman Sachs Global ECS Research.
Source: FactSet, MSCI, Goldman Sachs Global ECS Research.
Defining the dependent variables (returns)
We choose 3-month price returns as the dependent variable in our regression model as
we attempt to strike a balance between high frequency trading and the “buy-and-hold”
approach. Returns are quoted in local currency, on our assumption that foreign
investors should treat the currency decisions separately from the stock selection decisions
and the impact of FX changes could be partly reflected/captured in the underlying macro
trends (e.g. exports in CAI and FCI).
Choosing and testing independent variables (macro factors)
While there are a large number of macro variables that equity investors could focus on, we
elect to limit our independent variables to 14 macro factors which theoretically should
drive stock prices. In other words, this is not an exhaustive list of macro variables which
might influence stock returns but what we have found to be generally influential at a
market level. See Asia Pacific: Portfolio Strategy: What macro indicators matter for Asian
markets?, May 7, for details.
We also test the statistical significance of 2nd derivatives and lead/lags for each of the
factors in our multi-factor regression model to ensure statistically important relationships
will be accounted for.
Given many of these variables are inter-correlated and are essentially linked to similar sets
of fundamental drivers, we run a correlation matrix to eliminate those with strong
Australia20%
China23%
Hong Kong8%
India11%
Indonesia2%
Korea16%
Malaysia2%
Philippines0%
Singapore5%
Taiwan9%
Thailand4%
Banks23%
Information Technology
14%
Telecom11%
Materials10%
Energy9%
Industrials7%
Cons Disc7%
Cons Stap6%
Property6%
Insurance and other financial
services4%
Utilities2%
Health Care1%

June 11, 2012 Asia Pacific
Goldman Sachs Global Economics, Commodities and Strategy Research 6
directional relationships to improve the ensuing regression results (Appendix 1). In cases
where macro factors are strongly correlated among each other within a category (e.g.
growth), we prefer our proprietary indexes such as Current Activity Index (CAI), Financial
Conditions Index (FCI), and Global Leading Indicator (GLI) given their broader
representation and statistically-tested robustness (see Exhibit 4).
Following the above steps, we conclude that a significant part of an individual stock’s
return variations can be reasonably explained by 6 broad macro measurements: Market
risk (MXAPJ), domestic growth (CAI), domestic liquidity/policy (FCI), domestic
inflation (CPI), oil prices (WTI), and global growth (GLI).
The final step is to establish linkages between returns and these macro factors by using
regression techniques, namely simple linear and multiple factor regression models.
Recognizing the advantages and deficiencies of these modeling techniques, we choose to
base our stock selection analysis on the former and the market analysis on the latter.
Simple linear regression by a single factor (e.g. six separate regression models)
allows us to estimate the factor loadings for the independent variables without
running into multicollinearity issues. This approach may work better in capturing
the maximum total exposure to a single factor. That said, it doesn't account for the
impact of other significant variables and therefore is not robust to changes in the
relationship between macro factors over time. Even if we run a number of single
factor regressions, the resulting individual R²s from this are not additive and we
cannot statistically prove the explanatory power of each factor for returns.
Multiple factor regression with stepwise elimination helps form a quantifiable
relationship (equation) as to what factors are important and to what extent they,
when all treated as independent variables, have historically affected stock returns
(when one factor changes and others are held constant). The drawback is that the
(high) correlation among macro variables lowers the precision of the regression
estimates, which is likely to lead to estimates being very inaccurate for some
stocks when the regressions are carried out across a large universe of single
stocks. If we subsequently use the analysis to pick stocks with the highest/lowest
sensitivities there is a risk that we will also end up maximizing exposure to
estimation errors.
Exhibit 4: The independent variables in our regression model are representative of the principal macro categories that
tend to influence stock returns Macro variables and the inputs to our regression model
Note: We use the next 3 month yoy growth for CAI (local/US/EU) as they show significantly higher correlations with returns, which provides better indicative power on returns and fits our purpose of mapping returns to macro exposure better. See Appendix 1 for details.
Source: FactSet, I/B/E/S, Goldman Sachs Global ECS Research estimates.
Input specifications
Chosen
variablesRegional index returns Log P(t)‐Log P(t‐3)
Country index returns Log P(t)‐Log P(t‐3)Regional sector index returns Log P(t)‐Log P(t‐3)
Local IP Log (Avg. of last 3 monthly yoy growth)
Local export growth Log (Avg. of last 3 monthly yoy growth)
Local retail sales Log (Avg. of last 3 monthly yoy growth)
Local CAI Log (Avg. of next 3 monthly yoy growth)
Local PMI Log (Avg. of latest 3 mom growth)
Local CPI Log (Avg. of last 3 monthly yoy growth) Local CPI
Local FCI Log (Avg. of last 3 monthly yoy growth) Local FCI
WTI Price Log WTI(t)‐Log WTI(t‐3)US CAI Log (Avg. of next 3 monthly yoy growth)
EU CAI Log (Avg. of next 3 monthly yoy growth)
EM GDP Log (Avg. of last 3 monthly yoy growth)
GLI momentum Log (latest 3 mom changes)
MXAPJ returns
Local CAI
WTI
GLI
Indep
enden
t variab
les
Stock beta
Domestic growth
Domestic
liquidity/policy
Global growth
• Correlationmatrix
• Multi‐collinearity
check
June 11, 2012 Asia Pacific
Goldman Sachs Global Economics, Commodities and Strategy Research 7
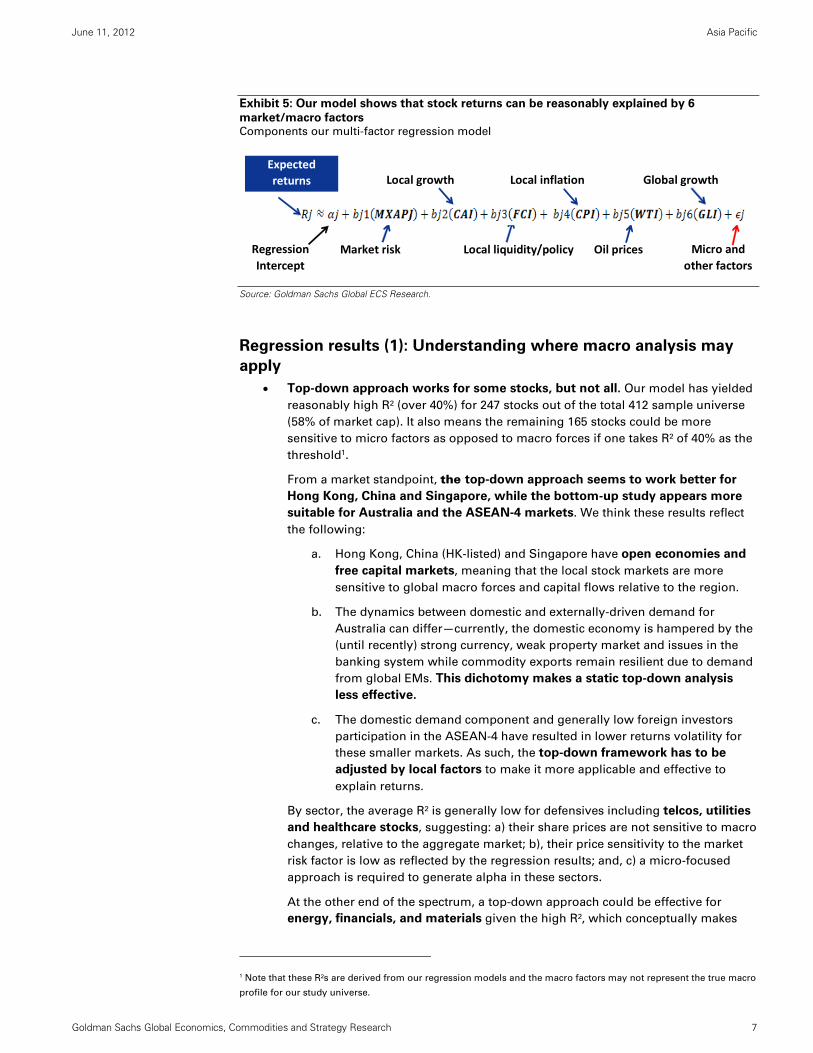
Exhibit 5: Our model shows that stock returns can be reasonably explained by 6
market/macro factors Components our multi-factor regression model
Source: Goldman Sachs Global ECS Research.
Regression results (1): Understanding where macro analysis may
apply
Top-down approach works for some stocks, but not all. Our model has yielded
reasonably high R² (over 40%) for 247 stocks out of the total 412 sample universe
(58% of market cap). It also means the remaining 165 stocks could be more
sensitive to micro factors as opposed to macro forces if one takes R² of 40% as the
threshold1.
From a market standpoint, the top-down approach seems to work better for
Hong Kong, China and Singapore, while the bottom-up study appears more
suitable for Australia and the ASEAN-4 markets. We think these results reflect
the following:
a. Hong Kong, China (HK-listed) and Singapore have open economies and
free capital markets, meaning that the local stock markets are more
sensitive to global macro forces and capital flows relative to the region.
b. The dynamics between domestic and externally-driven demand for
Australia can differ—currently, the domestic economy is hampered by the
(until recently) strong currency, weak property market and issues in the
banking system while commodity exports remain resilient due to demand
from global EMs. This dichotomy makes a static top-down analysis
less effective.
c. The domestic demand component and generally low foreign investors
participation in the ASEAN-4 have resulted in lower returns volatility for
these smaller markets. As such, the top-down framework has to be
adjusted by local factors to make it more applicable and effective to
explain returns.
By sector, the average R² is generally low for defensives including telcos, utilities
and healthcare stocks, suggesting: a) their share prices are not sensitive to macro
changes, relative to the aggregate market; b), their price sensitivity to the market
risk factor is low as reflected by the regression results; and, c) a micro-focused
approach is required to generate alpha in these sectors.
At the other end of the spectrum, a top-down approach could be effective for
energy, financials, and materials given the high R², which conceptually makes
1 Note that these R²s are derived from our regression models and the macro factors may not represent the true macro
profile for our study universe.
Market risk Local liquidity/policy Oil prices
Local inflation Global growthExpected
returns
Regression
Intercept
Local growth
Micro and
other factors

June 11, 2012 Asia Pacific
Goldman Sachs Global Economics, Commodities and Strategy Research 8
sense as these sectors are closely linked with global dynamics via real demand
and financial channels.
Exhibit 6: Macro factors appear important return drivers (R² more than 40%) for 60% of the
stocks and 58% of market cap in MXAPJ
Accumulated distribution of R² based on our study universe
Source: Goldman Sachs Global ECS Research estimates.
Exhibit 7: Top-down analysis works for select economic groups but not all Average R² based on our multi-factor regression
Source: FactSet, I/B/E/S, Goldman Sachs Global ECS Research estimates.
0%
10%
20%
30%
40%
50%
60%
70%
80%
90%
100%
0% 10% 20% 30% 40% 50% 60% 70% 80% 90% 100%
Top‐down approach may work better
Macro factors explain >40% of return variations
% of market cap
R2
Bottom‐up approach may work better
Macro factors explain<40% of return variations
Utilities
Health
care Telecom Con. Stp. Con. Disc. Industrials IT Materials Financials Energy Average
Hong Kong 0.16 ‐ ‐ ‐ 0.45 0.60 0.64 ‐ 0.63 ‐ 0.55
China 0.31 0.51 0.50 0.42 0.48 0.61 0.53 0.59 0.66 0.57 0.55
Singapore ‐ ‐ 0.27 0.47 0.41 0.56 ‐ ‐ 0.58 ‐ 0.52
India 0.48 0.25 0.55 0.29 0.50 0.52 0.56 0.53 0.47 0.41 0.46
Indonesia 0.42 ‐ 0.47 0.43 0.39 0.46 ‐ 0.28 0.39 0.51 0.40
Thailand ‐ ‐ 0.05 0.21 ‐ ‐ ‐ 0.75 0.46 0.52 0.44
Taiwan ‐ ‐ 0.25 0.26 0.34 0.30 0.49 0.44 0.41 0.48 0.43
Philippines ‐ ‐ 0.25 ‐ ‐ 0.36 ‐ ‐ 0.45 ‐ 0.35
Korea 0.31 0.26 0.15 0.27 0.42 0.42 0.33 0.46 0.48 0.28 0.40
Malaysia 0.16 ‐ 0.16 0.38 0.41 0.25 ‐ ‐ 0.41 ‐ 0.33
Australia 0.03 0.11 0.15 0.29 0.37 0.28 0.15 0.41 0.36 0.38 0.32
Average 0.34 0.31 0.35 0.38 0.46 0.47 0.49 0.49 0.50 0.51
Bottom 25 percentile
Top 25 percentile
Bottom‐up may work better
Bottom‐up may work better
Top downmay work better

June 11, 2012 Asia Pacific
Goldman Sachs Global Economics, Commodities and Strategy Research 9
Regression results (2): Making sense of it
We ran macro-factor regressions for more than 400 stocks in Asia and the results are
organized by their factor loadings in each market in Exhibit 8 (we show the top-3 stocks
under each market factor only; regression results for the full universe are shown in the
country summary pages).
Exhibit 8: We group stocks under different macro buckets based on their factor loadings Stocks with highest/lowest factor loadings by market
Note (*): Highest (positive) coefficients for FCI means stocks have historically performed better relative to their benchmark when financial conditions tighten. Note (1): We rank stocks by their factor loadings based on the output from our simple linear regression model. Multiple factor regression models using specific independent variables are required to estimate the relative significance of variables and their explanatory power on returns. Note (2): We only show stocks which rank in the top-80 percentile in terms of R² ranking for that particular factor.
Note (3): We exclude Philippines because only 4 stocks satisfy our liquidity requirements.
Source: Goldman Sachs Global ECS Research estimates.
Highest Lowest Highest Lowest Highest Lowest Highest Lowest Highest Lowest Highest Lowest
Lynas Corporation
Westfield Group Goodman Group Telstra Corp Origin Energy OZ Minerals Metcash WorleyparsonsFortescue
Metals GroupTatts Group
Lynas Corporation
Westfield Group
Fortescue Metals Group
Westpac Banking
Fortescue Metals Group
CFX retail SantosLynas
CorporationOrigin Energy Goodman Group OZ Minerals Coca-Cola Amatil Goodman Group
Westpac Banking
OZ MineralsNational
Australia BankLynas
CorporationNational
Australia BankIluka Resources Goodman Group
Ramsay Health Care
Lynas Corporation Goodman Group Westfield GroupFortescue
Metals GroupNational
Australia BankNine Dragons
PaperBeijing
Enterprises HldgNine Dragons
PaperTingyi Holding
Corp(Cn)China Resources
PowerNine Dragons
PaperChina Unicom
Nine Dragons Paper
China COSCO H China MobileNine Dragons
PaperHengan Int'L
Group Co
China COSCO HHengan Int'L
Group CoChina Cosco Holdings H
Beijing Enterprises Hldg
China MobileIntime
Department CNOOC
Shimao Property Hldgs
China Coal Energy H
China Telecom Corp H
Intime Department
Tsingtao Brewery H
Agile Property Hldgs
China Resources Power
China Coal Energy H
Tsingtao Brewery H
China Telecom Corp H
China Coal Energy H
China Overseas Land &Inv
Agile Property Hldgs
Nine Dragons Paper
China Resources Land
China Coal Energy H
China Mobile
Galaxy Entertainment
Link REITFoxconn
InternationalCLP Holdings
Foxconn International
Cheung Kong Infrastruct.
HongKong China Gas
Foxconn International
Galaxy Entertainment
CLP HoldingsGalaxy
Entertainment Link REIT
New World Development
HongKong China Gas
Galaxy Entertainment
Link REITHong Kong
Exch.&ClearingPower Assets
HoldingsHang Seng Bank
Orient Overseas Intl
Foxconn International
Link REITFoxconn
InternationalHongKong China
GasFoxconn
InternationalHang Seng Bank
Hong Kong Exch.&Clearing
HongKong China Gas
New World Development
Hang Seng Bank Link REIT BOCHKASM Pacific Technology
HongKong China Gas
ASM Pacific Technology
MTR Corp
Jaiprakash Associates
NTPCJaiprakash Associates
ITCInfrastructure
Dev FinBharti Airtel
Dr Reddy'S Laboratories
Jaiprakash Associates
JSW Steel ITC JSW Steel ITC
Adani Enterprises
Asian PaintsInfrastructure
Dev FinHindustan Unilever
Wipro Lupin Asian Paints Bharti Airtel Tata Steel Gail IndiaSterlite
IndustriesBharti Airtel
Sterlite Industries
Sun Pharmaceutical
Tata Consultancy Hdfc BankHindalco
IndustriesHindustan Unilever
Axis Bank United SpiritsAdani
EnterprisesAsian Paints Tata Steel
Sun Pharmaceutical
Bumi ResourcesTelekomunikasi
IndonesiaIndofood Sukses
MakmurBank Negara
IndonesiaPerusahaan Gas
NegaraBumi Resources
Perusahaan Gas Negara
Bumi Resources Bumi Resources Gudang Garam Bumi ResourcesTelekomunikasi
Indonesia
United Tractors Gudang Garam IndocementBank Rakyat
IndonesiaBank Negara
IndonesiaBank Mandiri
Telekomunikasi Indonesia
United Tractors United TractorsPerusahaan Gas
NegaraUnited Tractors Semen Gresik
Bank Negara Indonesia
Bank Rakyat Indonesia
Bank Mandiri Gudang GaramIndofood Sukses
MakmurUnited Tractors
Indofood Sukses Makmur
Bank Rakyat Indonesia
Indofood Sukses Makmur
Bank Rakyat Indonesia
SK HynixKepco Korea Elect. Power
SK HynixAmorepacific Corp (New)
Doosan Heavy Industries
NCsoft Corp CelltrionDoosan Infracore
CoSK Hynix
LG Household & Health
SK HynixKepco Korea Elect. Power
Hanwha Chemical Corp
Samsung Fire & Marine
Industrial Bank Of Korea
LG Household & Health
Doosan Corp Celltrion NCsoft CorpWoori Finance
HoldingsWoori Finance
HoldingsOrion Corp
Korea Exchange Bank
Cheil Industrial
Dongbu Insurance Co
Kangwon LandHana Financial
HoldingsLG Electronics
Hyundai Heavy Industries
Samsung Electro-Mech. Co
S-Oil Corp SK HynixDaewoo
ShipbuildingLS Corp
Woori Finance Holdings
LG Display
AMMB Holdings Sime Darby AMMB Holdings Genting AirAsiaBumiputra-Commerce
Tenaga Nasional IOI Corp IOI Corp UMW Holdings AMMB Holdings Tenaga Nasional
Genting Public Bank Fgn IOI CorpBumiputra-Commerce
DiGi.com Public Bank Fgn Umw Holdings AMMB Holdings AMMB Holdings Public Bank Fgn IOI Corp UMW Holdings
Bumiputra-Commerce
Malayan Banking Kuala Lumpur
Kepong Malayan Banking AMMB Holdings Genting Resorts World
Kuala Lumpur Kepong
Genting Tenaga Nasional Genting Public Bank Fgn
Keppel LandSingapore Telecom
Keppel LandSingapore Press
HldgSingapore Telecom
Noble GroupSingapore Telecom
Keppel Land Keppel LandSingapore Press
HldgKeppel Land
Singapore Telecom
Golden Agri Resources
Singapore Press Hldg
Golden Agri Resources
Singapore Telecom
OCBC BankOlam
InternationalSingapore Press
HldgOlam International
SembCorp Marine
Singapore Telecom
Golden Agri Resources
Singapore Press Hldg
Wilmar International
Fraser And Neave
Olam International
Ascendas Real Estate Inv
Fraser And Neave
Keppel Corp OCBC Bank Noble Group Noble GroupSingapore
AirlinesKeppel Corp
Singapore Airlines
Chimei Innolux Corp
Far Eastone Telecom. Co
Chimei Innolux Corp
Taiwan Mobile HTCChimei Innolux
CorpHTC
Chimei Innolux Corp
Chimei Innolux Corp
Chunghwa Telecom Co
WPG HoldingsChunghwa Telecom Co
WPG Holdings Taiwan Mobile WPG HoldingsFar Eastone Telecom. Co
Taiwan Mobile WPG HoldingsPresident Chain
StoreEPISTAR WPG Holdings
President Chain Store
Chimei Innolux Corp
Far Eastone Telecom. Co
Novatek Microelectrs
Formosa Petrochemical
Novatek Microelectrs
Chunghwa Telecom Co
Formosa Petrochemical
EPISTAR Taiwan Mobile Wpg Holdings Co Wistron CorpQuanta
ComputerEPISTAR Taiwan Mobile
PTT Global Chemical
PTT Exploration&Pro
PTT Global Chemical
Bangkok Bank Fgn
Bank Of Ayudhya
Charoen Pokphand Foods
Advanced Info Service
PTT Global Chemical
PTT Global Chemical
Charoen Pokphand Foods
PTT Global Chemical
Charoen Pokphand Foods
Thai OilSiam
Commercial Thai Oil
Siam Commercial
Thai Oil PTTPTT
Exploration&ProThai Oil Thai Oil
Kasikornbank Fgn
IRPC PCLSiam
Commercial
IRPC PCLBangkok Bank
FgnBanpu Bangkok Bank
PTT Global Chemical
Bangkok BankSiam
Commercial Banpu Banpu
Bangkok Bank Fgn
BanpuBangkok Bank
Fgn
Korea
Malaysia
Singapore
Taiwan
Thailand
Global growth
Australia
China
Hong Kong
India
Inflation Oil
Indonesia
Linear regression cofficient
Market risks Local growth Policy/ liquidity *

June 11, 2012 Asia Pacific
Goldman Sachs Global Economics, Commodities and Strategy Research 10
To better interpret and make sense of the regression output, we think it is useful to look at
a few examples below.
Example 1: Samsung Electronics (005930 KR)
The regression R² is low for Samsung Electronics (33%), suggesting the stock’s
returns could be more sensitive to specific micro factors than the high-level macro
variables that we test.
While Samsung is perceived by investors as a DM growth proxy, its share does not
appear to be well linked with global growth momentum (GLI is eliminated in the
stepwise regression). This coincides with the stock’s substantial outperformance in
the past few years due to its improved competiveness and strong product cycle
(e.g. Galaxy smartphones).
It is positively correlated with domestic growth and liquidity conditions, which
seems normal, although their statistical significance is lower than the market risk
factor.
Exhibit 9: The low R² for Samsung suggests that micro factors could be more important in driving the stock price
Stepwise regression results (Samsung Electronics)
Source: FactSet, CEIC, MSCI, Goldman Sachs Global ECS Research estimates.
Example 2: ICBC (1398 HK)
Our model shows 74% of ICBC’s share price variations can be explained by the
four factors in the stepwise regression model.
ICBC’s sensitivity to the market risk factor is high (high beta), partly reflecting the
relatively high growth and policy volatility (or market concerns) in China.
It is positively correlated with inflation and policy easing as the bank may benefit
from loan pricing and higher loan quota when these macro conditions move in its
favor.
The share prices tend to outperform (underperform) the aggregate market when
global growth decelerates (accelerates), as the stock is not as sensitive as the
MXAPJ aggregate to global growth momentum.
# of obs. 142
R² 33%
Significant variables Eliminated variables
Variable
Estimated
coefficient P value Variable Partial R² P value
Intercept ‐0.02 0.45 GLI Momentum 0.0004 0.76
MXAPJ 0.87 <.0001 CPI 0.0008 0.69
CAI 1.04 0.03
FCI ‐2.25 0.02
WTI ‐0.17 0.05
Low R² ≈ more micro driven
Low "beta" vs. MXAPJ; statistically significant
Positively correlated with local growth and easing; unfavorably
exposed to high oil prices
Eliminated by stepwise process
Low incrementalexplanatory power to the regression
GLI is not a significant return driver although the stock is regarded as
DM proxy

June 11, 2012 Asia Pacific
Goldman Sachs Global Economics, Commodities and Strategy Research 11
Exhibit 10: Policy easing should bode well for ICBC but its GDP growth exposure may not be as high as many have
perceived Stepwise regression results (ICBC)
Source: FactSet, CEIC, MSCI, Goldman Sachs Global ECS Research estimates.
Example 3: WesFarmers (WES AU)
The regression R² is high compared with other Australian stocks in our study
sample, meaning that top-down approach may make more sense for WES relative
to other Australian stocks.
The stock has showed low sensitivity to MXAPJ returns in local currency terms.
Higher CPI tends to bode well for stock returns, as high inflation may allow the
company to raise prices more easily.
While the local exposure of its business operations may suggest high sensitivity to
domestic growth activities, domestic CAI is omitted from the regression. This may
reflect the hybrid structure of the Australian economy as discussed on page 7.
Exhibit 11: The market risk sensitivity is generally low for AU stocks due possibly to the omission of FX beta; domestic
activities link well with export growth cycles, adding complications when interpreting regression results Stepwise regression results (WesFarmers)
Source: FactSet, CEIC, MSCI, Goldman Sachs Global ECS Research estimates.
# of obs. 60
R² 74%
Significant variables Eliminated variables
Variable
Estimated
coefficient P value Variable Partial R² P value
Intercept ‐0.03 0.19 WTI 0.0049 0.32
MXAPJ 1.64 <.0001 CAI 0.0053 0.30
CPI 1.66 0.02
FCI ‐1.85 0.04
GLI ‐7.91 0.01
High R² ≈ more macro driven
High "beta" vs. MXAPJ; statistically significant
High CPI may improve loan pricing and easing could mean better loan
growth and lower NPL risksChinese banks may not offer high GDP growth exposure as many would have thought
# of obs. 142
R² 50%
Significant variables Eliminated variables
Variable
Estimated
coefficient P value Variable Partial R² P value
Intercept ‐0.18 <.0001 GLI 0.0001 0.84
MXAPJ 0.61 <.0001 CAI 0.0069 0.17
CPI 6.39 <.0001
FCI ‐2.74 <.0001
WTI 0.24 <.0001
High R² compared with other AU stocks
Low "beta" vs. MXAPJ; may reflect the omission
of FX beta
Higher inflation may lead to higher ASP and liquidity easing is positive
to the local economyAlthough the company is focusing on the domestic market, CAI is heavily influenced by commodity exports
cycles

June 11, 2012 Asia Pacific
Goldman Sachs Global Economics, Commodities and Strategy Research 12
Example 4: TATA Consultancy Services (TCS IN)
It has one of the highest R² (74%) among the Indian stocks in the MXAPJ universe
(average 46%).
The stock can be classified as a low-beta stock given its low return coefficient with
MXAPJ (c.0.67).
The stock has tended to move very closely with GLI momentum (1% of GLI
momentum change has historically led to 15% of share price movement),
consistent with TCS’s business concentration in global developed markets.
Exhibit 12: TATA consultancy’s share prices seem very sensitive to global growth given the company’s geographic
exposure
Stepwise regression results (TATA Consultancy Services)
Source: FactSet, CEIC, MSCI, Goldman Sachs Global ECS Research estimates.
# of obs. 86
R² 74%
Significant variables Eliminated variables
Variable
Estimated
coefficient P value Variable Partial R² P value
Intercept ‐0.09 0.00 WTI 0.0031 0.33
MXAPJ 0.67 <.0001 CAI 0.0076 0.12
CPI 1.48 0.0002
FCI ‐1.01 0.0017
GLI 15.68 <.0001
Reasonably high R²
Low "beta" vs. MXAPJ; statistically significant
Strong (weak) relationship with global growth momenutm (localgrowth), reflecting its business
concentration in DM

June 11, 2012 Asia Pacific
Goldman Sachs Global Economics, Commodities and Strategy Research 13
Part 2: Adding micro overlays—valuation, micro fundamentals and
technical indicators—to enhance returns
Part 1 aims to match individual equities’ returns to select macro factors. However, the
return attribution exercise is insufficient to build a sensible trading strategy on its own,
because:
a. No market or stock in our sample universe has close to a 100% fit (R²) in our
regression model, suggesting some unobserved or uncaptured variables, which
we believe are mostly micro-related, are also significant performance drivers;
b. Stock returns are essentially a joint function of earnings growth and valuation
changes. Our analysis helps partly explain returns variations using macro factors
but does not take into account the returns that macro drivers have on risk premia
and therefore the willingness of investors to pay for equities for a given level of
earnings.
c. In some cases, share prices may have already reflected stock-specific
themes/exposure; and pricing signals (especially shorter-term ones) are difficult to
capture in macro-factor regression models.
As such, we incorporate valuation parameters, micro fundamental variables, and
various technical indicators into our broader framework. We believe these additional
considerations could help us form an objective view on stocks’ micro profile and help
answer the questions of “how much is priced in” and “entry level”, which have shown
strong relationships with price returns (more on this later).
Valuation parameters
We focus on the stock’s current valuations to gauge how the stock’s fundamentals are
being priced by the market and to avoid buying/selling at full/depressed valuation levels.
Specifically, taking the conclusions from our recent work: Asia Pacific: Portfolio Strategy:
Global Strategy Paper: No. 3: AsiaPac Valuation: What works, and when, March 12, 2012,
we have chosen forward P/E, trailing D/Y, and trailing P/B, which are proven to be
significant returns indicators (higher significance to medium-term returns) according to our
analysis, as the key metrics.
While we have also proved that P/CF has strong predictive power on forward returns at a
market level, we deliberately exclude this in our analysis given its short and unstable time
series at an individual stock level.
Micro fundamentals
While we have established relationships between macro factors and stock returns in Part 1,
stocks react to macro forces because they tend to impact earnings or earnings expectations,
which can be quantified and captured by the changes of consensus EPS and expected
returns (target price). In this vein, we look at following indicators to assess stock’s micro
dynamics using consensus data:
Earnings revision (magnitude)—percentage of month-on-month forward 12-
month EPS changes;
Earnings sentiment (breadth)—percentage of net earnings
upgrades/downgrades versus the total number of consensus estimates (mom);
Consensus target price—percentage changes (mom).

June 11, 2012 Asia Pacific
Goldman Sachs Global Economics, Commodities and Strategy Research 14
Technical indicators
Broadly speaking, technical indicators can be grouped into four categories—momentum,
volatility, trend and volume. Given the numerous forms of technical indicators, we focus
on those that are most commonly used and are comparable from a time series standpoint.
The key objective here is to form a view on short-term entry levels.
1. RSI (momentum): We use 14-day RSI to gauge the near-term price momentum of
particular stocks. We prefer 14-day over longer-dated RSIs given its higher
volatility relative to longer-dated RSIs, which better fits our objective of evaluating
entry point for shorter-term investing.
2. Bollinger bands (volatility): For computational purpose, we look at %b, as
opposed to the actual moving averages and the two bands (upper and lower) to
quantify where the current price is relative to its recent range in standard deviation
terms. Low %b indicates current prices are closer to the lower Bollinger band and
vice versa.
3. Moving Average Convergence/Divergence (MACD) (trend): We take the
differentials between MACD line (12 day-26 day exponential moving average
(EMA)) and MACD signal line (9-day EMA), which is the histogram on a typical
MACD chart, to gauge the short-term trend and price momentum of the stock. High
positive values reflect strong price momentum in recent trading periods and vice
versa.
4. Volume: Most volume-based indicators require a time-series perspective to form
trading signals; hence, an absolute number often does not tell us much. Volume
signals can vary so decision-making is not stable. As such, we exclude volume-
related indicators in our micro score calculation.
Exhibit 13: We use these micro parameters to form a view on the stocks’ fundamentals, aiming to enhance the
risk/reward of our top-down stock recommendations A summary of micro parameters
Source: FactSet, I/B/E/S, Goldman Sachs Global ECS Research estimates.
Input specifications
Forward P/E P(t)/fEPS(t)
Trailing P/B P(t)/tBPS(t)
Trailing D/Y P(t)/tDPS(t)
EPS revisions fEPS(t)/fEPS(t‐1)‐1
EPS sentiment{#up rev(t)‐#down
rev(t)}/#estimate(t)
Consensus target price TP(t)/TP(t‐1)‐1
Momentum 14‐day RSI
Volatility Bollinger Bands (%b)
Trend MACD line ‐ MACD signal line
Composite micro score
Micro param
eters
Valuations
Micro
fundamentals
Technical
indicators
Valuation
MicroTechnical
Z‐score standardization

June 11, 2012 Asia Pacific
Goldman Sachs Global Economics, Commodities and Strategy Research 15
The effectiveness of micro overlays—an empirical study
While these micro parameters are commonly regarded as important elements to potential
returns, their actual implications and contribution to returns are unclear to us up to this
point.
As such, we test the conditions and formats under which these micro factors matter most
to potential returns, and design our trading strategies accordingly.
First, we aggregate and organize ex-ante, subsequent 3-month stock returns based on the
nominal values of these parameters. The sample size is statistically significant as there are
more than 50,000 datapoints for each parameter, given our study universe contains over
400 stocks with more than 12 years of monthly history (i.e. 400*144). The results support
the conventional wisdom of buying stocks at low valuations and technically sound
entry levels, and when consensus expectations rise, ensuing returns tend to be
strong and vice versa. Details are shown in Appendix 2.
We then standardize all the parameters based on their z-scores to ensure comparability and
compatibility of the dataset, and to allow us to form an objective view of the stock’s micro
attractiveness with existing (ex-ante) data-points. Key points to note:
Forms of standardization: Time series and cross-sectional analysis are commonly
used data standardization methods. While they have their own analytical
advantages and drawbacks, we choose the forms under which the parameters
have historically generated more differentiated (higher or lower) returns. In this
vein, we take time series z-scores for valuations and micro revision data, and
cross-sectional z-scores for technical indicators.
Valuations—Extreme valuations usually lead to significant subsequent
returns: In our recent research, Global Strategy Paper: No. 3 - AsiaPac Valuation:
What works, and when, we found that the levels of valuation, on a standalone
basis, have low correlation with ensuing returns over a relatively short time
horizon (3-6 months) at the regional/market level. However, the picture looks
slightly different at the stock level. We note that when prevailing stock valuations
are close to 1.5 to 2 standard deviations (s.d.) to the attractive side (3-year rolling z-
scores), subsequent 3-month performance tends to be strong (Exhibit 14). The
opposite is not very obvious, unless when valuations are extremely demanding (2
s.d. to the unattractive side).
Micro fundamentals—Consensus view changes are a reasonably good
indicator of short-term returns: Unsurprisingly, upgrades of consensus earnings
(both magnitude and breadth) and/or target prices usually lead to favorable price
returns. However, it is noteworthy that we are comparing ex-ante earnings and
target price changes with subsequent 3-month returns, meaning that: a)
observable consensus view changes do drive actual stock returns; and, b) it may
take some time for the market to discount the incremental new consensus
expectations (Exhibit 15).
Technical indicators—The trend is your friend: Exhibit 16 shows, fairly
consistently, stocks with high technical scores (low RSI, MACD, %b compared with
peers) tend to outperform those that embrace demanding technical entry levels.
However, the extent to which stocks have historically outperformed/
underperformed is lower on our technical scores (vs. valuation and micro scores),
reflecting that valuations and fundamentals have comparatively higher
contributions to return variations than technical indicators.
Composite micro score—an objective view on stock’s micro attractiveness:
While the each of the three categories of micro parameters appear to be significant
determinant of short-term returns on its own, we believe a combined

June 11, 2012 Asia Pacific
Goldman Sachs Global Economics, Commodities and Strategy Research 16
measurement (simple average of the three z-scores) could be even more helpful
for investors to gauge risk/reward because: a) it gives a comprehensive and
objective assessment of stocks’ micro profile using observable market data,
without involving stocks’ specific operating and industry-wide expectations; b) it
gives higher alpha (positive and negative) than the individual scores may reflect,
meaning that it is probably a better variable to consider in our stock-picking
framework (Exhibit 17).
Exhibit 14: Levels of valuations seem to have strong
impact on returns, especially when valuations are at
extremes 3-month price returns (loc) vs. valuation z-scores
Exhibit 15: Positive earnings revisions (in terms of both
magnitude and breadth) and target price upgrades do bode
well for performance 3-month price returns (loc) vs. micro fundamentals z-scores
Note: High z-scores mean lower fP/E, tP/B and high tD/Y. Note: High z-scores mean positive EPS revisions, EPS sentiment, and consensus target price upgrades.
Source: FactSet, Goldman Sachs Global ECS Research.
Source: FactSet, Goldman Sachs Global ECS Research.
Exhibit 16: Technical factors are helpful to explain returns
variations, although not as much as valuations and
fundamentals 3-month price returns (loc) vs. technical z-scores
Exhibit 17: Our composite z-scores provide an objective
assessment on stocks’ micro profile and reasonably
strong indications to forward returns 3-month price returns (loc) vs. composite micro z -cores
Note: High z -scores mean low RSI, MACD and %b.
Source: Bloomberg, Goldman Sachs Global ECS Research.
Source: FactSet, Bloomberg, Goldman Sachs Global ECS Research.
2.7%
6.6% 6.6%
4.8%4.6%4.2%
5.6%
8.1%
10.1%
0%
2%
4%
6%
8%
10%
12%
14%
16%
-2 -1.5 -1 -0.5 0 0.5 1 1.5 2
Valuation score at different entry levels (z score)
Average returns in our study universe
Avg. subsequent 3m returns
2.7%
5.9%
3.2%3.7%
4.2%
6.7%7.1%
7.5%
9.9%
0%
2%
4%
6%
8%
10%
12%
14%
16%
-2 -1.5 -1 -0.5 0 0.5 1 1.5 2
Micro fundamentals score at different entry levels (z score)
Avg. subsequent 3m returns
Average returns in our study universe
1.6%
2.8%
3.6%4.2%
4.9%
6.4% 6.4%6.8% 7.1%
0%
2%
4%
6%
8%
10%
12%
14%
16%
-2 -1.5 -1 -0.5 0 0.5 1 1.5 2
Technical score at different entry levels (z score)
Average returns in our study universe
Avg. subsequent 3m returns
2.0%
3.9% 2.9%
4.5% 4.8%5.7%
8.2%
9.5%
15.2%
0%
2%
4%
6%
8%
10%
12%
14%
16%
-2 -1.5 -1 -0.5 0 0.5 1 1.5 2
Composite micro score at different entry levels (z score)
Avg. subsequent 3m returns
Average returns in our study universe

June 11, 2012 Asia Pacific
Goldman Sachs Global Economics, Commodities and Strategy Research 17
Part 3: Back-testing our strategies—Cycle-based trading algorithms
may help performance
Building trading algorithms around the GLI
Parts 1 and 2 form the core analytical foundations for our stock selection process. The next
step revolves around designing a trading algorithm and testing (and refining) its
effectiveness.
Leveraging the work by our global team in its recent paper: Global Economics Paper No:
214, Acceleration Matters: Asset Returns and the Business Cycle, May 16, 2012, we define
the macro business cycle using our proprietary Global Leading Indicator (GLI), which
also serves as a signal for our trading strategies.
Simply put, our global team uses the interaction of GLI growth (mom) with GLI acceleration
(changes of mom growth) to define four phases of the business cycle (Exhibit 18):
1. Expansion: Positive growth and positive acceleration.
2. Slowdown: Positive growth and negative acceleration.
3. Contraction: Negative growth and negative acceleration.
4. Recovery: Negative growth and positive acceleration.
In each of the four phases, we examine past market returns (MXAPJ) and historical trends
of macro variables in our regression model to understand how investors should position in
the different periods of the economic cycle. Key insights (and our decision rules) are:
In an expansion phase, investors should turn aggressive by going long stock
beta and growth proxies (including oil-related exposure). Policy tends to stay
neutral during this phase given the lagged effect of growth on inflation.
During an economic slowdown, equity returns may stay positive although they are
less obvious than in the expansion phase. Investors should focus on late-cycle
plays including inflation beneficiaries and commodity stocks as
growth/inflation tradeoff deteriorates. Policy tends to become tighter, so stocks
that are sensitive (insensitive) to liquidity may underperform (outperform).
Defensive is the core theme during economic contraction periods as high beta
equities and growth proxies are likely to be under pressure. Policymakers tend to
loosen monetary policy as growth is challenged, and stocks with favorable
exposure to liquidity should trade well relative to the benchmark.
Easing starts to take effect and growth begins to accelerate into the recovery stage.
Equities returns are mixed as valuation compression tends to overpower the
impact of nascent growth and earnings upgrades. In other words, investors should
own growth proxies but not necessarily overweight beta. Financial conditions tend
to stay very easy and asset/rate-sensitive slices may outperform.

June 11, 2012 Asia Pacific
Goldman Sachs Global Economics, Commodities and Strategy Research 18
Exhibit 18: GLI mom growth and acceleration define the four phases of the business cycle
and our stock selection decision process GS GLI momentum and our trading algorithms
Note: “1” means owning the top-40 percentile (by factor sensitivity) of stocks under each market factor and owning the bottom-40 for “-1”. “0” means owning 30 to 70 percentile of the distribution.
Source: Goldman Sachs Global ECS Research estimates.
Back-testing our trading strategy
We test this strategy based on the following procedures:
a. Create a benchmark portfolio which includes top-80 percentile of stocks by their R²
ranking in each of the six macro factors in order to include stocks to which the top-
down approach may apply. We also believe this is a better performance proxy
than MXAPJ because of survivorship bias in our study universe.
b. Take the latest GLI reading as input and allocate macro exposure (1, 0 or -1) based
on the trading algorithm we defined in Exhibit 18. Specifically, “1” means owning

June 11, 2012 Asia Pacific
Goldman Sachs Global Economics, Commodities and Strategy Research 19
the top-40 percentile of stock (based on their factor loadings) under that particular
factor for each market, “-1” means buying the bottom-40 percentile, and “0”
refers to the 30th to 70th percentile of the distribution.
c. We then rank stocks by their macro attractiveness, as defined by the simple
average of their ranking in all 6 macro factors (depending on the business cycle),
to filter stocks with reasonably compelling macro exposure (i.e. these stocks may
not score well in all six macro filters but they have relatively high ranking in all
categories on average.) This forms our “macro-only” portfolio.
d. From (c), we select stocks in each market with the highest aggregate micro z-
scores (top-15 percentile) and form our “macro + micro” portfolio. The portfolio is
rebalanced on a quarterly basis and the price returns are measured in local
currency.
Exhibit 19: The logic flow/mechanism of our top-down selection framework
Source: Goldman Sachs Global ECS Research estimates.

June 11, 2012 Asia Pacific
Goldman Sachs Global Economics, Commodities and Strategy Research 20
Evaluating the back-test results: It is an alpha, not beta strategy
Performance: Over the past ten years, our “macro + micro” portfolio has gained
326%, versus benchmark of 165% on a market-cap-weighted basis, translating into
11.4pp average annualized outperformance according to our backtest (as of May
31). The portfolio has generated accumulated price return of 1914% since 2002 on
an equal-weighted basis, outperforming the benchmark (672%) by 1232pp. This
translates into 88pp average outperformance per annum versus the benchmark
(Exhibit 20). “Macro” and “macro + micro” portfolios outperformed the
benchmark 29 and 24 out of 42 quarters since 2002 respectively.
Representation: Our portfolio has consisted of at least 23 stocks across the full
study period, representing around 5% of the universe by number of stocks and 5%
by free-float market cap. Portfolio constituents are proportionately distributed
across markets according to their representation in the universe as designed by
our constraints. 295 stocks have been included in our portfolio at least once.
Volatility: Realized volatility (annualized) of our portfolio has been tracking in line
with the benchmark except during 1H09 and 1H12 when the overall market
volatility was high. Given the size (number of stocks in the portfolio) of the
portfolio, we consider its realized volatility as reasonable.
Alpha or beta?: As shown in Exhibit 23, both portfolios have outperformed the
benchmark (on average) in all the economic phases since 2002 on an equal-
weighted basis, suggesting that: a) our strategies are not entirely driven by beta
exposure; b) Some elements of alpha are embedded in our portfolios as they have
outperformed in both expansion and contraction phases2.
Macro vs. micro: Interestingly, the returns differentials between our “macro only”
and “macro + micro” portfolios reflect that one strategy might outperform the
other under different market conditions. For example, “macro” fared better than
“macro + micro” during the bull market from 2005 to 2007 but underperformed in
2009, and we believe this can be explained by the micro filters that we have put in
place to screen out high-valuation and momentum stocks during that period3. In
the case of 2009, given many stocks were trading at undemanding valuations and
technical levels post the Global Financial Crisis, our micro filters were generally
not binding constraints (Exhibit 24). This shows that investors may be better off if
they can relax their valuation/micro standards at the onset of a market
uptrend; however, micro disciplines still add alpha over time.
Caveats: Risks and limitations
1. Our backtest is conducted on an in-sample basis (i.e. regression for factor loading
and backtest start at the same time), a less preferred approach to out-of-sample
test from a statistical standpoint. However, we are constrained by data availability
which is prevalent for Asian stocks where listing history is generally short.
2. Historical GLI readings are subject to revision risk. As such, the indication of
economic turning points by the GLI is more accurate on an ex-post basis.
3. We have not assumed any trading and transaction costs in our backtest returns
calculations. Realized returns could be meaningfully different from the results.
4. Our trading algorithms could be subject to data-mining risk (e.g. we favor certain
macro exposures in different business-cycle phases based on historical pattern).
2 We use monthly rebalancing returns to calculate our portfolios’ performance in different business-cycle phases to
better capture the changes in GLI-derived trading signals.
3 We take the simple average of the valuation, micro fundamentals, and technical scores. Investors may adjust the
weighting of each category depending on market conditions.

June 11, 2012 Asia Pacific
Goldman Sachs Global Economics, Commodities and Strategy Research 21
Exhibit 20: Our two-tier strategy has outperformed the benchmark in both equal-weighted and market-cap-weighted
terms Indexed price performance (loc for equal weighted and USD for market-cap weighted), as of May 31
Source: Bloomberg, MSCI, FactSet, Goldman Sachs Global ECS Research.
Exhibit 21: Our portfolio accounts for around 5% of the
benchmark by number of stocks and 5.3% (avg.) by cap Percentage of stock and market cap
Exhibit 22: Our strategy has higher realized volatility than
the benchmark in 1H09 and 1H12 Annualized monthly return volatility
Source: Bloomberg, MSCI, FactSet, Goldman Sachs Global ECS Research.
Source: FactSet, MSCI, Goldman Sachs Global ECS Research.
Exhibit 23: Our strategy has outperformed benchmark in
different phases in the business cycle Average monthly price returns in different business-cycle
phases since 2002 (Equal weighted)
Exhibit 24: Micro considerations appeared less effective
during 2005 to 2007 when the markets were on a strong
run Annual price returns (Equal weighted)
Source: Bloomberg, MSCI, Goldman Sachs Global ECS Research.
Source: FactSet, MSCI, Goldman Sachs Global ECS Research.
0
400
800
1200
1600
2000
2400
Ja
n-0
2
Ja
n-0
3
Ja
n-0
4
Ja
n-0
5
Ja
n-0
6
Ja
n-0
7
Ja
n-0
8
Ja
n-0
9
Ja
n-1
0
Ja
n-1
1
Ja
n-1
2
EW benchmark
EW macro only
EW macro and micro
Macro and Micro: 2014
Macro: 1667
Benchmark: 783
0
100
200
300
400
500
600
Ja
n-0
2
Ja
n-0
3
Ja
n-0
4
Ja
n-0
5
Ja
n-0
6
Ja
n-0
7
Ja
n-0
8
Ja
n-0
9
Ja
n-1
0
Ja
n-1
1
Ja
n-1
2
CW benchmark
CW macro only
CW macro and micro
Macro and Micro: 426
Macro: 417
Benchmark: 265
0%
2%
4%
6%
8%
10%
12%
0
5
10
15
20
25
30
35
Ja
n/0
2
Ma
y/0
2
Se
p/0
2
Ja
n/0
3
Ma
y/0
3
Se
p/0
3
Ja
n/0
4
Ma
y/0
4
Se
p/0
4
Ja
n/0
5
Ma
y/0
5
Se
p/0
5
Ja
n/0
6
Ma
y/0
6
Se
p/0
6
Ja
n/0
7
Ma
y/0
7
Se
p/0
7
Ja
n/0
8
Ma
y/0
8
Se
p/0
8
Ja
n/0
9
Ma
y/0
9
Se
p/0
9
Ja
n/1
0
Ma
y/1
0
Se
p/1
0
Ja
n/1
1
Ma
y/1
1
Se
p/1
1
Ja
n/1
2
% of market cap (RHS)
Number of stocks
0.0%
0.5%
1.0%
1.5%
2.0%
2.5%
3.0%
3.5%
4.0%
4.5%
Ja
n-0
2
Ja
n-0
3
Ja
n-0
4
Ja
n-0
5
Ja
n-0
6
Ja
n-0
7
Ja
n-0
8
Ja
n-0
9
Ja
n-1
0
Ja
n-1
1
Ja
n-1
2
EW benchmark
EW macro only
EW macro and micro
4.7%
1.2%
-5.7%
1.1%
5.8%
1.3%
-4.1%
1.3%
5.9%
1.2%
-3.6%
3.0%
-8.0%
-6.0%
-4.0%
-2.0%
0.0%
2.0%
4.0%
6.0%
8.0%
Expansion Slowdown Contraction Recovery
benchmark
macro only
macro and micro
-100%
-50%
0%
50%
100%
150%
200%
2002 2003 2004 2005 2006 2007 2008 2009 2010 2011 2012
benchmark
macro only
macro and micro

June 11, 2012 Asia Pacific
Goldman Sachs Global Economics, Commodities and Strategy Research 22
Part 4: Stock ideas- Investing in a contraction phase; reduce market
beta and go long easing beneficiaries
The latest GLI reading (final) for May 2012, which was released on June 1, suggests that
the global economy has ventured into a contraction phase starting from April (Exhibit
25). See Global Leading Indicator (GLI): May Final GLI - Momentum In Negative Territory,
June 1, 2012.
Exhibit 25: GS GLI suggests the global economy has entered the contraction phase GLI momentum and momentum changes
Source: Goldman Sachs Global ECS Research estimates.
Adhering to our stock selection process, we would focus on the following macro
characteristics when investing in a contraction phase:
Low “beta”;
Low sensitivity to local growth;
Favorable exposure to policy easing;
Disinflationary outperformers;
Stocks that may benefit from lower oil prices;
Low sensitivity to global growth momentum.
Stocks which have these macro characteristics and rank well with respect to their
composite micro scores include (organized by macro factors) are shown in Exhibit 26.

June 11, 2012 Asia Pacific
Goldman Sachs Global Economics, Commodities and Strategy Research 23
Exhibit 26: We like these stocks because of their favorable macro exposure and compelling micro profile relative to their
regional peers Stock recommendations for June 2012 (Priced as of June 5)
Note (1): These stocks are rated Buy or Neutral by Goldman Sachs Research except SM Investments which is NC. We use consensus estimates for SM Investments. Note (2): * denotes the stock is on our regional Conviction List. “Tick” indicates stock that ranks top-30 percentile within each factor relative to its market peers and they perform well in our specified macro environment. Revisions and sentiment are based on forward 12-month consensus EPS.
Source: FactSet, I/B/E/S, Goldman Sachs Global ECS Research estimates.
Ticker Name MarketMkt. cap
(US$mn)
6m
ADVT
GS
Rating
Global
growth
13E
P/E
13E
P/B
13E
D/Y
13E
EPSg
EPS
rev.
EPS
sent.
14d
RSI%b
NAB AT National Australia Bank Australia 49,179 156.9 B √ √ √ 8.4 1.2 8.6% 5% -1% 17% 35 14%
ORI AT Orica Australia 8,473 34.8 B* √ √ 10.8 2.1 4.7% 16% 3% 13% 28 9%
1044 HK Hengan Int'L Group Co China 6,748 20.1 N √ √ √ 19.9 5.7 3.2% 21% 4% 43% 32 -4%
857 HK Petrochina Co H China 26,240 89.1 N √ √ √ 8.6 1.2 5.2% 8% 3% 0% 28 5%
700 HK Tencent Holdings Lim(Cn) China 27,186 98.2 B √ 19.2 5.5 0.6% 27% 4% 22% 37 13%
1 HK Cheung Kong Holdings Hong Kong 15,492 51.2 B √ √ √ 7.7 0.6 3.9% 16% 2% 6% 28 8%
11 HK Hang Seng Bank Hong Kong 9,866 19.6 N √ √ √ 10.6 2.1 5.2% 9% 2% 15% 38 26%
HDFC IS Housing Dev Finance Corp India 12,601 57.4 N √ √ √ 14.8 3.2 2.2% 15% 15% -15% 44 44%
ITC IS ITC India 8,867 33.4 B √ √ √ 21.5 8.0 2.8% 17% 4% 23% 41 0%
BBRI IJ Bank Rakyat Indonesia Indonesia 6,253 24.4 N √ √ √ 7.2 1.7 2.8% 13% 3% -5% 23 8%
006260 KP LS Corp Korea 1,162 9.2 B √ √ 6.4 0.9 1.6% 23% 5% 50% 47 23%
055550 KP Shinhan Financial Group Korea 13,742 40.0 N √ √ √ 6.3 0.7 2.9% 4% 1% 19% 39 31%
CIMB MK CIMB Group Holdings Bhd Malaysia 11,204 23.8 N √ √ 11.6 1.8 4.1% 12% 2% -8% 52 60%
SM PM SM Investments Philippines 3,334 9.2 NC √ √ √ 15.5 2.1 1.7% 12% 2% 0% 48 36%
JCNC SP Jardine Cycle & Carriage Singapore 3,467 7.8 N √ 8.3 - 5.1% 24% 9% 0% 33 17%
2308 TT Delta Electronics Taiwan 4,749 21.5 B √ √ 12.7 2.0 5.8% 10% 8% 67% 36 11%
2330 TT Taiwan Semiconductor Mfg Taiwan 64,204 101.0 N √ √ √ 11.5 2.5 3.8% 10% 10% 56% 41 11%
BBL/F TB Bangkok Bank Fgn Thailand 4,617 7.7 B* √ √ √ 8.6 1.1 4.4% 17% 4% 38% 31 -13%
Median 9,366 28.9 10.7 2.0 3.9% 14% 3% 16% 37 12%
MXAPJ 9.3 1.3 4.0% 11% 0% -6% 30 16%
Factor loading Valuations Fundamentals Technical
Market
risks
Local
growth
Policy/
liquidityInflation Oil

June 11, 2012 Asia Pacific
Goldman Sachs Global Economics, Commodities and Strategy Research 24
Part 5: Potential usage—Broad-based
We recognize that many investors use some form of macro input to their stock selection
process, ranging from general awareness of the macro environment to pure model-driven
strategies. While our approach may not suit everyone, we do think it is a useful
complement to different types of investors, notably:
Macro investors: This framework can help pick stocks, implement themes, and devise
various forms of strategies based on their macro expectations expressed in observable and
quantifiable variables.
Relative-return-focused fund managers: Fund managers running regional or country
funds can use this tool to attribute returns to macro factors and better understand what
their portfolio’s effective exposure is relative to the benchmark, thereby helping tactical
allocation and portfolio risk management.
Bottom-up stock pickers: This group of investors may not pay much attention to macro
trends but our analysis can help them identify stocks where top-down (or bottom-up)
approaches may (or may not) work, and therefore improve their internal resource
allocation.
Hedgers: Investors may be assisted in formulating targeted, factor-hedging strategies
based on our outlined risk parameters at the regional, market or stock level.
General market participants: As stated earlier, our model by no means has captured all
significant return drivers, especially at the sector and stock levels where specific micro
factors play a more important role in driving returns. Nevertheless, investors can add
and/or substitute independent variables to/from our default regression setup to explore
investment implications according to their mandate and interest areas.
For example, an ASEAN-focused fund manager can replace MXAPJ by MSCI ASEAN index
and add local factors such as palm oil prices to the model, and a tech specialist can put
Taiwan exports order and monthly revenue growth as independent variables. In a nutshell,
the framework is flexible and expandable.
Exhibit 27: Our framework may be helpful to a diverse group of investors Potential users and usage of our stock picking framework
Source: Goldman Sachs Global ECS Research.

June 11, 2012 Asia Pacific
Goldman Sachs Global Economics, Commodities and Strategy Research 25
Market summary: Australia
Exhibit 28: Factor loadings for MXAU constituents which pass our liquidity and market filters
Note (1): We show stepwise regression coefficient and p-value for each macro variable at the market index level but we show simple linear regression coefficient at the stock level given the multicollinearity issue we discussed earlier in this report. Note (2): Dark-blue (light-blue) shading means top-15 (bottom-15) percentile of stocks that have historically performed well when macro indicators move positively (including our FCI which means tightening of financial conditions),
Note (3): (1) and (2) apply to all market summary pages from page 25 to 32.
Source: FactSet, I/B/E/S, Goldman Sachs Global ECS Research estimates.
Market risks Local growth Policy/liquidity Inflation Oil Global growthMXAU Multiple regression R²= 0 7396 0 53 (<0 01) 1 94 (<0 01) -0 03 (0 93) 1 6 (<0 01) 0 02 (0 55) 1 11 (0 4)BHP AU BHP Billiton Ltd. 0.8 6.6 -1.5 -3.2 0.3 9.4CBA AU Commonwealth Bank of Australia 0.6 5.6 -2.9 -2.8 0.2 10.3WBC AT Westpac Banking Corp. 0.5 4.5 -1.9 -2.2 0.1 7.7ANZ AU Australia & New Zealand Banking Group Ltd. 0.4 4.9 -2.9 -2.3 0.1 8.2NAB AT National Australia Bank Ltd. 0.5 4.3 -2.1 -1.0 0.1 7.8WOW AT Woolworths Ltd. 0.1 1.8 -0.1 1.5 0.0 0.1WES AT Wesfarmers Ltd. 0.6 5.8 -2.6 -0.3 0.3 10.8RIO AT Rio Tinto Ltd. 1.1 10.6 -3.1 -3.9 0.6 20.2WPL AT Woodside Petroleum Ltd. 0.7 6.7 -0.8 -3.0 0.5 11.4WDC AT Westfield Group Australia 0.5 7.1 -1.7 -4.1 0.1 7.4NCM AT Newcrest Mining Ltd. 0.6 6.1 -1.8 -2.5 0.1 5.8CSL AU CSL Ltd. 0.4 2.4 1.1 -0.4 0.1 2.4TLS AT Telstra Corp. Ltd. 0.2 3.0 0.3 -1.0 0.0 2.6QBE AT QBE Insurance Group Ltd. 0.5 5.0 0.8 0.9 0.1 4.2ORG AT Origin Energy Ltd. 0.0 -0.3 1.7 4.1 0.1 -0.6STO AT Santos Ltd. 0.3 1.6 1.6 -0.2 0.3 3.7AMP AU AMP Ltd. 0.5 3.8 -2.1 -1.0 0.1 7.4BXB AU Brambles Ltd. 0.5 5.8 -1.3 -2.6 0.1 8.8SUN AT Suncorp Group Ltd. 0.6 7.6 -2.2 -0.8 0.2 10.7MQG AT Macquarie Group Ltd. 1.1 9.6 -3.8 -4.1 0.4 16.2ORI AT Orica Ltd. 1.0 10.9 -4.6 -7.0 0.3 16.9AMC AU Amcor Ltd. 0.2 2.7 -1.6 0.0 -0.1 3.5TCL AT Transurban Group 0.0 1.9 0.1 -0.2 -0.1 0.9SGP AT Stockland Australia 0.4 7.3 -2.1 -1.9 0.2 9.8IAG AT Insurance Australia Group Ltd. 0.3 3.1 -0.5 -0.2 0.0 2.9CCL AU Coca‐Cola Amatil Ltd. 0.0 0.7 -1.0 0.2 -0.1 -0.5FMG AU Fortescue Metals Group Ltd. 2.4 25.9 -2.0 -9.6 0.9 37.0AGK AU AGL Energy Ltd. 0.0 -0.2 0.7 -0.2 0.0 -0.4ILU AT Iluka Resources Ltd. 0.2 -1.1 1.4 0.5 0.0 0.8GPT AT GPT Group 0.6 11.5 -2.9 -3.3 0.2 15.7ASX AU ASX Ltd. 0.7 6.0 -1.4 -3.0 0.2 7.9IPL AT Incitec Pivot Ltd. 1.2 15.9 -1.0 -6.8 0.7 23.4WOR AT WorleyParsons Ltd. 1.7 15.7 -3.8 -16.2 0.8 23.0GMG AT Goodman Group 1.8 27.1 -6.2 -15.5 0.8 37.8SHL AT Sonic Healthcare Ltd. 0.2 2.4 0.9 -1.4 0.1 2.0CPB AU Campbell Brothers Ltd. 1.0 9.7 -2.7 -4.2 0.4 18.5MGR AT Mirvac Group 1.0 12.1 -4.6 -4.3 0.4 20.1DXS AT Dexus Property Group 0.9 9.7 -2.1 -6.5 0.4 13.5LLC AT Lend Lease Group 0.8 8.8 -3.5 -6.3 0.2 13.9TOL AT Toll Holdings Ltd. 0.3 5.1 -3.0 0.2 0.0 5.7CPU AU Computershare Ltd. 0.6 5.3 -0.2 -4.2 0.2 8.6COH AU Cochlear Ltd. 0.2 0.4 -0.3 -0.4 0.0 -1.3CFX AT CFS Retail Property Trust 0.1 3.1 -0.5 -0.9 0.0 3.1TTS AT Tatts Group Ltd. 0.0 2.1 -0.6 -1.7 -0.2 -1.4JHX AU James Hardie Industries SE 0.5 4.5 -3.7 -1.9 0.1 7.8MTS AT Metcash Ltd. 0.1 2.0 -1.4 4.7 -0.1 -2.8LEI AT Leighton Holdings Ltd. 1.0 11.7 -3.0 -3.5 0.4 18.2BLD AU Boral Ltd. 0.6 7.0 -2.5 -1.6 0.3 11.6OZL AT OZ Minerals Ltd. 1.9 21.4 -7.4 -7.5 0.8 32.8BEN AU Bendigo & Adelaide Bank Ltd. 0.3 5.3 -0.5 0.3 0.0 6.1AWC AU Alumina Ltd. 1.3 13.6 -3.9 -4.2 0.5 25.1RHC AT Ramsay Health Care Ltd. 0.1 -0.5 0.1 3.9 -0.1 -1.0APA AT APA Group 0.2 1.3 -0.6 -0.4 0.0 1.3SGM AT Sims Metal Management Ltd. 1.0 9.0 -1.9 -3.3 0.6 15.5TAH AT TABCorp Holdings Ltd. 0.5 8.9 -2.9 -3.5 0.2 10.2CTX AU Caltex Australia Ltd. 1.0 10.5 -2.2 -7.3 0.4 14.9LYC AT Lynas Corp. Ltd. 2.5 23.7 -6.5 -10.3 0.7 44.5QAN AT Qantas Airways Ltd. 0.8 9.8 -3.9 -3.9 0.1 12.6FXJ AU Fairfax Media Ltd. 1.0 12.3 -4.1 -4.7 0.4 18.4SYD AT Sydney Airport 0.7 9.8 -3.1 -8.9 0.2 10.9HVN AT Harvey Norman Holdings Ltd. 0.9 9.1 -3.3 -4.1 0.2 12.9

June 11, 2012 Asia Pacific
Goldman Sachs Global Economics, Commodities and Strategy Research 26
Market summary: China
Exhibit 29: Factor loadings for MXCN constituents which pass our liquidity and market filters
Source: FactSet, I/B/E/S, Goldman Sachs Global ECS Research estimates.
Market risks Local growth Policy/liquidity Inflation Oil Global growth
941 HK China Mobile Ltd. 1.1 4.3 -1.1 0.1 0.2 12.4939 HK China Construction Bank Corp. 1.7 7.9 -3.1 -2.4 0.7 23.61398 HK Industrial & Commercial Bank of China Ltd. 1.7 7.6 -3.7 -2.3 0.8 24.8883 HK CNOOC Ltd. 1.2 4.8 -2.0 -1.1 0.6 17.7700 HK Tencent Holdings Ltd. 1.6 7.6 -5.4 -3.1 0.7 22.8857 HK PetroChina Co. Ltd. 1.2 4.0 -2.4 -1.4 0.5 16.63988 HK Bank of China Ltd. 1.8 8.2 -3.9 -3.6 0.8 25.72628 HK China Life Insurance Co. Ltd. (China) 1.4 6.6 -3.5 -3.3 0.4 16.4386 HK China Petroleum & Chemical Corp. 1.1 4.3 -2.0 -1.4 0.4 16.21088 HK China Shenhua Energy Co. Ltd. 2.1 11.4 -5.3 -3.9 0.8 30.82318 HK Ping An Insurance (Group) Co. of China Ltd. 2.0 9.0 -3.1 -3.5 0.7 23.6762 HK China Unicom (Hong Kong) Ltd. 1.1 4.4 -0.5 0.8 0.3 16.4688 HK China Overseas Land & Investment Ltd. 1.5 5.3 -2.2 -1.2 0.3 12.23968 HK China Merchants Bank Co. Ltd 'H' 2.6 12.7 -5.8 -4.0 1.2 39.51044 HK Hengan International Group Co. Ltd. 0.8 3.9 -2.7 -1.8 0.0 9.0728 HK China Telecom Corp. Ltd. 1.0 4.4 -1.2 -1.3 0.3 13.6992 HK Lenovo Group Ltd. 1.8 6.9 -4.3 -1.4 0.7 27.83328 HK Bank of Communications Co. Ltd. 2.0 9.8 -4.4 -3.5 0.8 27.3322 HK Tingyi (Cayman Islands) Holding Corp. 0.5 2.8 -2.0 -2.4 0.1 9.0489 HK Dongfeng Motor Group Co. Ltd. 2.3 12.4 -7.2 -7.1 0.7 26.31898 HK China Coal Energy Co. Ltd. 3.5 17.9 -8.4 -4.9 1.5 51.7291 HK China Resources Enterprise Ltd. 1.3 5.0 -3.5 -1.6 0.4 19.11800 HK China Communications Construction Co. Ltd. 2.0 9.5 0.3 -1.4 0.7 21.01171 HK Yanzhou Coal Mining Co. Ltd. 1.8 6.9 -4.5 -1.6 0.8 26.41109 HK China Resources Land Ltd. 1.2 5.6 -1.3 -1.4 0.3 9.8914 HK Anhui Conch Cement Co. Ltd. 1.3 4.3 -1.5 -2.0 0.3 11.4135 HK Kunlun Energy Co. Ltd. 1.4 5.5 -4.9 -2.1 0.5 18.82319 HK China Mengniu Dairy Co. Ltd. 2.0 11.4 -6.4 -4.4 0.7 29.53323 HK China National Building Material Co. Ltd. 3.5 16.8 -0.7 -5.0 1.0 31.7144 HK China Merchants Holdings (International) Co. Ltd. 1.4 5.5 -2.7 -1.9 0.5 20.52328 HK PICC Property and Casualty Company Ltd 1.8 8.7 -2.9 -3.4 0.4 18.7900948 CG Inner Mongolia Yitai Coal Co. Ltd. 1.2 6.7 -1.9 -1.5 0.5 14.4358 HK Jiangxi Copper Co. Ltd. 2.2 8.8 -4.9 -2.7 0.8 29.4836 HK China Resources Power Holdings Co. Ltd. 1.0 4.1 -0.8 -1.6 0.3 9.4392 HK Beijing Enterprises Holdings Ltd. 0.8 3.0 -1.5 -0.3 0.0 5.22688 HK ENN Energy Holdings Ltd. 1.2 4.8 -3.2 -1.6 0.4 18.72883 HK China Oilfield Services Ltd. 1.8 8.7 -2.4 -1.7 0.8 25.51199 HK Cosco Pacific Ltd. 1.3 5.1 -2.3 -2.4 0.5 19.51114 HK Brilliance China Automotive Holdings Ltd. 1.4 7.3 -5.7 -3.9 0.5 25.52333 HK Great Wall Motor Co. Ltd. 2.2 12.4 -4.5 -6.6 0.7 35.4813 HK Shimao Property Holdings Ltd. 3.3 17.8 -6.7 -8.6 0.9 40.02238 HK Guangzhou Automobile Group Co. Ltd. 0.9 3.1 -3.4 -3.2 0.2 9.5267 HK CITIC Pacific Ltd. 2.1 9.4 -3.7 -2.9 1.0 32.62899 HK Zijin Mining Group Co. Ltd. 2.0 11.2 -4.5 -4.5 0.6 22.02338 HK Weichai Power Co. Ltd. 2.0 9.3 -4.2 -4.8 0.7 28.42600 HK Aluminum Corp. of China Ltd. 2.4 10.3 -6.2 -4.3 0.7 31.93308 HK Golden Eagle Retail Group Ltd. 1.9 10.7 -7.4 -5.0 0.7 33.0902 HK Huaneng Power International Inc. 0.4 0.3 -0.3 -2.1 0.0 2.53383 HK Agile Property Holdings Ltd. 3.6 17.2 -6.1 -7.4 1.2 44.11066 HK Shandong Weigao Group Medical Polymer Co. Ltd. 1.3 6.7 -4.7 -5.7 0.1 14.51068 HK China Yurun Food Group Ltd. 1.7 7.9 -8.2 -4.4 0.6 24.4168 HK Tsingtao Brewery Co. Ltd. 0.8 3.4 -3.6 -2.3 0.2 11.1493 HK GOME Electrical Appliances Holding Ltd. 1.8 7.8 -3.3 -2.7 0.8 33.93368 HK Parkson Retail Group Ltd. 1.7 10.2 -5.4 -4.2 0.5 25.1384 HK China Gas Holdings Ltd. 1.7 7.1 -2.9 -2.9 0.6 20.51919 HK China COSCO Holdings Co. Ltd. 3.6 18.4 -6.1 -4.0 1.6 51.3753 HK Air China Ltd. 2.2 11.8 -7.1 -5.5 0.6 32.62727 HK Shanghai Electric Group Co. Ltd. 1.7 8.4 -2.8 -3.0 0.5 20.8763 HK ZTE CORP H 1.5 8.9 -5.1 -2.9 0.7 23.3175 HK Geely Automobile Holdings Ltd. 1.7 7.9 -6.8 -3.6 0.5 21.11833 HK Intime Department Store (Group) Co. Ltd. 2.6 14.9 -9.7 -7.3 1.0 53.01211 HK BYD Co. Ltd. 1.0 5.5 -6.4 -5.3 0.1 13.32777 HK Guangzhou R&F Properties Co. Ltd. 3.3 17.8 -5.2 -7.1 0.9 36.92689 HK Nine Dragons Paper Holdings Ltd. 4.1 24.7 -13.9 -13.5 1.3 62.53898 HK Zhuzhou CSR Times Electric Co. Ltd. 1.9 8.3 -3.3 -7.3 0.5 18.7210 HK Daphne International Holdings Ltd. 2.3 9.3 -6.1 -2.4 0.7 30.92866 HK China Shipping Container Lines Co. Ltd. 2.9 12.7 -3.4 -4.4 1.1 34.61818 HK Zhaojin Mining Industry Co. Ltd. 2.6 17.2 -4.3 -5.7 0.8 28.6639 HK Shougang Fushan Resources Group Ltd. 1.8 8.4 -4.8 -3.6 0.8 28.4119 HK Poly (Hong Kong) Investments Ltd. 2.3 10.0 -6.8 -4.0 0.6 33.3

June 11, 2012 Asia Pacific
Goldman Sachs Global Economics, Commodities and Strategy Research 27
Market summary: Hong Kong
Exhibit 30: Factor loadings for MXHK constituents which pass our liquidity and market filters
Source: FactSet, I/B/E/S, Goldman Sachs Global ECS Research estimates.
Market risks Local growth Policy/liquidity Inflation Oil Global growthMXHK Multiple regression R = 0 8801 1 09 (<0 01) 0 62 (0 01) -0 02 (0 97) 0 04 (0 8) 0 03 (0 33) -2 82 (0 09)13 HK Hutchison Whampoa Ltd. 1.2 2.7 4.6 -0.2 0.4 15.71 HK Cheung Kong (Holdings) Ltd. 1.2 2.3 4.7 -0.4 0.3 13.116 HK Sun Hung Kai Properties Ltd. 1.3 2.7 5.5 -1.2 0.4 16.32 HK CLP Holdings Ltd. 0.1 0.6 -0.5 -0.1 0.1 3.0388 HK Hong Kong Exchanges & Clearing Ltd. 1.8 3.9 13.9 -1.4 0.4 22.0494 HK Li & Fung Ltd. 1.3 3.8 6.0 -0.8 0.4 19.73 HK Hong Kong & China Gas Co. Ltd. 0.5 1.4 1.8 -0.7 0.2 10.02388 HK BOC Hong Kong (Holdings) Ltd. 1.5 3.8 4.2 -2.4 0.6 23.211 HK Hang Seng Bank Ltd. 0.7 1.6 1.6 -0.7 0.3 11.46 HK Power Assets Holdings Ltd. 0.0 0.0 -0.9 0.2 0.0 -0.3823 HK Link Real Estate Investment Trust 0.4 1.3 4.2 -0.9 0.2 6.74 HK Wharf (Holdings) Ltd. 1.3 2.2 5.0 -1.5 0.4 17.1101 HK Hang Lung Properties Ltd. 1.0 1.9 6.8 -1.3 0.3 12.719 HK Swire Pacific Ltd. 1.1 2.5 5.7 -1.2 0.3 15.623 HK Bank of East Asia Ltd. 1.3 2.8 6.6 -1.3 0.5 20.912 HK Henderson Land Development Co. Ltd. 1.4 2.7 5.7 -1.3 0.4 17.366 HK MTR Corp. Ltd. 0.8 1.9 6.0 -0.4 0.3 10.983 HK Sino Land Co. Ltd. 1.8 3.5 10.5 -1.7 0.5 22.417 HK New World Development Co. Ltd. 2.1 3.8 12.5 -1.9 0.5 24.027 HK Galaxy Entertainment Group Ltd. 2.3 4.0 10.3 -1.4 0.8 31.7683 HK Kerry Properties Ltd. 1.8 3.2 10.0 -1.8 0.5 23.414 HK Hysan Development Co. Ltd. 1.3 2.9 5.9 -1.0 0.4 18.11038 HK Cheung Kong Infrastructure Holdings Ltd. 0.1 0.3 -0.9 0.2 0.1 2.2522 HK ASM Pacific Technology Ltd. 1.7 3.9 2.1 -1.3 0.6 25.9142 HK First Pacific Co. Ltd. 1.3 2.5 3.8 -0.1 0.4 18.9293 HK Cathay Pacific Airways Ltd. 1.1 2.8 2.0 -1.3 0.3 17.7316 HK Orient Overseas (International) Ltd. 1.7 3.4 5.8 -4.1 0.4 25.62038 HK Foxconn International Holdings Ltd. 2.0 5.4 23.4 -7.7 0.7 29.3

June 11, 2012 Asia Pacific
Goldman Sachs Global Economics, Commodities and Strategy Research 28
Market summary: India
Exhibit 31: Factor loadings for MXIN constituents which pass our liquidity and market filters
Source: FactSet, I/B/E/S, Goldman Sachs Global ECS Research estimates.
Market risks Local growth Policy/liquidity Inflation Oil Global growthIndia Multiple regression R = 0 7787 1 17 (<0 01) 0 67 (0 1) 0 11 (0 5) -0 48 (0 06) -0 01 (0 76) 0 18 (0 93)INFO IS Infosys Ltd. 1.1 1.9 0.6 0.6 0.4 15.4RIL IS Reliance Industries Ltd. 1.2 3.1 0.1 -1.0 0.4 15.6HDFCB IS HDFC Bank Ltd. 0.9 2.1 0.4 -0.1 0.3 11.5HDFC IS Housing Development Finance Corp. Ltd. 1.0 2.4 0.4 -0.9 0.3 14.2TCS IS Tata Consultancy Services Ltd. 1.2 7.5 1.1 0.6 0.4 19.7ITC IS ITC Ltd. 0.5 1.8 -0.1 0.0 0.1 6.5TTMT IS Tata Motors Ltd. 2.0 5.1 1.0 0.2 0.5 33.8HUVR IS Hindustan Unilever Ltd. 0.4 1.8 -0.5 0.4 0.0 0.5ICICIBC IS ICICI Bank Ltd. 1.7 2.6 0.8 -0.8 0.5 24.3SBIN IS State Bank of India 1.2 2.9 -0.2 -0.5 0.2 12.8LT IS Larsen & Toubro Ltd. 1.8 5.2 -0.2 -0.8 0.4 21.0AXSB IN Axis Bank Ltd. 1.4 3.3 0.4 -0.8 0.5 22.8MM IS Mahindra & Mahindra Ltd. 1.8 5.7 0.2 0.4 0.4 26.3ONGC IS Oil & Natural Gas Corp. Ltd. 0.9 1.3 0.0 -0.9 0.4 12.5WPRO IS Wipro Ltd. 1.6 2.7 1.3 0.5 0.6 23.6SUNP IS Sun Pharmaceutical Industries Ltd. 0.8 2.3 0.3 -0.3 0.3 9.9JSP IS Jindal Steel & Power Ltd. 2.0 5.0 0.4 -1.2 0.6 27.1BHARTI IN Bharti Airtel Ltd. 1.0 3.9 -1.0 -2.5 0.1 9.7DRRD IN Dr. Reddy's Laboratories Ltd. 0.8 3.0 0.3 0.9 0.3 12.7KMB IS Kotak Mahindra Bank Ltd. 1.8 3.1 0.6 -1.0 0.6 28.2STLT IS Sterlite Industries (India) Ltd. 2.2 5.0 0.5 -2.3 0.8 35.7TATA IS Tata Steel Ltd. 2.2 4.2 1.1 -1.4 0.9 34.8BHEL IN Bharat Heavy Electricals Ltd. 1.1 2.9 -0.1 -1.6 0.2 12.5HNDL IS Hindalco Industries Ltd. 1.8 4.5 1.1 -0.3 0.7 29.7GAIL IN GAIL (India) Ltd. 1.0 2.9 -0.1 -0.3 0.2 11.9IDFC IS Infrastructure Development Finance Co. Ltd. 1.8 11.2 1.8 -0.8 0.5 21.9CIPLA IN Cipla Ltd. 0.5 2.3 0.3 -0.4 0.1 6.5APNT IN Asian Paints (India) Ltd. 0.6 2.4 0.8 0.4 0.2 12.8TPWR IS Tata Power Co. Ltd. 1.3 2.7 -0.2 -1.5 0.4 15.1NATP IS NTPC Ltd. 0.6 2.2 -0.2 -1.1 0.0 2.4ACEM IN Ambuja Cements Ltd. 1.2 3.3 0.0 0.1 0.1 11.0MSIL IS Maruti Suzuki India Ltd. 1.2 4.4 -0.4 -1.4 0.1 14.1HMCL IS Hero MotoCorp Ltd. 0.6 1.4 -0.2 0.2 0.0 5.3LPC IS Lupin Ltd. 0.6 2.1 -0.7 0.2 -0.1 10.5LICHF IS LIC Housing Finance Ltd. 1.4 3.0 0.2 0.4 0.4 17.3JPA IS Jaiprakash Associates Ltd. 2.5 16.0 1.0 -3.8 0.8 26.5SHTF IS Shriram Transport Finance Co. Ltd. 0.9 2.7 1.0 -1.2 0.3 15.4SESA IS Sesa Goa Ltd. 1.9 5.6 0.4 -1.4 0.5 30.0UNSP IS United Spirits Ltd. 1.5 5.6 0.7 -2.3 0.3 18.3ACC IN ACC Ltd. 1.0 3.0 -0.3 -0.3 0.1 9.8RBXY IS Ranbaxy Laboratories Ltd. 1.0 1.9 1.1 0.1 0.5 20.4JSTL IS JSW Steel Ltd. 2.2 4.5 0.7 0.1 0.9 37.3ADE IN Adani Enterprises Ltd. 2.2 6.5 0.9 0.7 0.8 32.8BPCL IN Bharat Petroleum Corp. Ltd. 0.6 0.6 -0.4 -0.2 -0.2 2.3RELI IS Reliance Infrastructure Ltd. 1.6 3.3 0.1 -1.5 0.5 20.8

June 11, 2012 Asia Pacific
Goldman Sachs Global Economics, Commodities and Strategy Research 29
Market summary: Indonesia
Exhibit 32: Factor loadings for MXID constituents which pass our liquidity and market filters
Source: FactSet, I/B/E/S, Goldman Sachs Global ECS Research estimates.
Market risks Local growth Policy/liquidity Inflation Oil Global growthIndonesia Multiple regression R²= 0 6503 1 05 (<0 01) 0 5 (0 56) 1 43 (0 04) -0 32 (0 46) 0 07 (0 27) 2 4 (0 31)ASII IJ Astra International 1.4 5.3 0.9 -0.5 0.5 20.9BBCA IJ Bank Central Asia 0.5 -0.5 0.5 0.3 0.1 6.7TLKM IJ Telekomunikasi Indonesia 0.8 0.2 1.1 0.6 0.1 9.0BBRI IJ Bank Rakyat Indonesia 1.2 5.8 -0.3 -0.3 0.3 12.8BMRI IJ Bank Mandiri (Persero) 1.4 7.3 -1.1 -0.7 0.4 17.3UNTR IJ United Tractors 1.8 5.7 -1.0 -1.5 0.7 28.0PGAS IJ Perusahaan Gas Negara 1.3 4.6 2.9 1.5 0.3 13.6SMGR IJ Semen Gresik (Persero) 0.8 3.3 1.4 0.3 0.1 10.4GGRM IJ Gudang Garam 1.0 5.4 0.0 -1.3 0.2 15.2BUMI IJ Bumi Resources 2.8 7.3 -4.1 -3.2 1.5 55.6BBNI IJ Bank Negara Indonesia 1.4 7.0 2.5 0.4 0.4 17.0INTP IJ Indocement Tunggal Prakarsa 1.3 7.4 -0.6 -0.9 0.4 19.8INDF IJ IndoFood Sukses Makmur 1.3 9.1 1.6 -0.2 0.5 25.2

June 11, 2012 Asia Pacific
Goldman Sachs Global Economics, Commodities and Strategy Research 30
Market summary: Korea
Exhibit 33: Factor loadings for MXKR constituents which pass our liquidity and market filters
Source: FactSet, I/B/E/S, Goldman Sachs Global ECS Research estimates.
Market risks Local growth Policy/liquidity Inflation Oil Global growthMXKR Multiple regression R = 0 7724 1 19 (<0 01) 0 86 (<0 01) -0 52 (0 29) 1 48 (0 12) -0 08 (0 05) -3 19 (0 12)005930 KP Samsung Electronics Co. Ltd. 1.0 2.1 -2.0 -3.7 0.1 11.4005380 KP Hyundai Motor Co. Ltd. 1.1 2.2 -2.1 0.2 0.4 15.2005490 KP POSCO 1.2 1.6 -0.8 -3.9 0.3 11.5012330 KP Hyundai Mobis Co. Ltd. 1.0 2.0 -3.6 2.1 0.2 10.0000270 KP Kia Motors Corp. 0.9 2.0 -0.2 0.8 0.4 15.3055550 KP Shinhan Financial Group Co. Ltd. 1.1 1.8 0.5 -4.9 0.3 16.2005935 KP Samsung Electronics Co Prf 1.2 2.5 -1.7 -3.7 0.2 15.9105560 KP KB Financial Group Inc. 1.2 2.5 -1.2 -4.9 0.3 15.7000660 KP SK hynix Inc 2.4 4.2 0.4 -10.0 0.6 30.4051910 KP LG Chem Ltd. 1.3 3.0 -2.7 -6.8 0.3 13.3009540 KP Hyundai Heavy Industries Co. Ltd. 1.5 2.0 3.3 -5.2 0.3 13.6035420 KP NHN Corp. 0.8 1.1 3.2 -9.4 0.2 8.8000830 KP Samsung C&T Corp. 1.4 1.8 -0.1 -2.8 0.2 14.6086790 KS Hana Financial Group Inc. 1.2 3.6 0.3 -9.5 0.6 21.4033780 KP KT&G Corp. 0.2 0.1 1.0 1.7 0.1 1.6000810 KP Samsung Fire & Marine Insurance Co. Ltd. 0.8 0.9 -0.5 -2.4 0.1 7.0066570 KP LG Electronics Inc. 1.0 1.4 -1.4 -3.5 0.4 12.8010140 KP Samsung Heavy Industries Co. Ltd. 1.3 1.6 2.6 -4.7 0.4 10.9009150 KP Samsung Electro‐Mechanics Co. Ltd. 1.3 2.4 -3.7 -7.6 0.1 14.0028050 KP Samsung Engineering Co. Ltd. 1.6 2.5 0.1 -3.8 0.5 16.9015760 KP Korea Electric Power Corp. 0.6 0.9 0.2 -1.3 0.1 7.1051900 KP LG Household & Health Care Ltd. 0.7 1.4 1.6 -8.0 0.2 7.8003550 KP LG Corp. 1.7 1.9 0.1 -9.9 0.4 20.2006400 KP Samsung SDI Co. Ltd. 0.8 1.9 -3.2 -1.6 0.3 13.2004020 KP Hyundai Steel Co. 1.8 2.9 -0.7 -7.2 0.4 21.2034220 KP LG Display Co. Ltd. 1.0 2.4 -0.3 -7.0 0.4 11.0000720 KP Hyundai Engineering & Construction Co. Ltd. 1.4 1.1 2.1 -4.5 0.1 9.0001300 KS Cheil Industries Inc. 1.0 2.0 0.9 -3.7 0.2 10.9010950 KP S‐Oil Corp. 0.4 0.0 -0.2 3.4 0.1 4.9053000 KP Woori Finance Holdings Co. Ltd. 1.6 3.2 1.1 -10.2 0.6 22.7000240 KS Hankook Tire Co Ltd 0.8 0.5 -1.0 1.8 0.1 8.8036570 KP NCsoft Corp. 1.0 1.3 -7.3 3.5 0.0 1.4011170 KP Honam Petrochemical Corp. 1.5 2.5 -1.5 -0.9 0.2 14.3010060 KP OCI Co. Ltd. 1.3 1.5 0.8 -3.2 0.3 12.0090430 KS Amorepacific Corp. (New) 0.5 0.9 0.6 -5.6 0.0 4.5023530 KP Lotte Shopping Co. Ltd. 1.3 2.8 -0.2 -7.7 0.4 14.5003600 KP SK Holdings Co. Ltd. 1.3 1.8 -1.3 -1.4 0.2 13.9001800 KP Orion Corp. 0.9 2.2 0.2 -0.2 0.2 10.5078930 KS GS Holdings Corp. 1.1 2.3 1.5 -8.4 0.4 12.0010130 KP Korea Zinc Co. Ltd. 1.6 2.1 -1.0 -2.6 0.3 15.8006360 KS GS Engineering & Construction Corp. 1.2 2.0 0.2 -3.2 0.3 13.7042660 KS Daewoo Shipbuilding & Marine Engineering Co. Ltd. 1.5 3.5 2.8 -5.4 0.6 15.5016360 KP Samsung Securities Co. Ltd. 1.1 0.7 -0.5 -1.9 0.1 4.0000210 KS Daelim Industrial Co. Ltd. 1.6 3.1 -0.9 -2.2 0.3 18.5086280 KS Hyundai Glovis Co. Ltd. 0.8 2.3 -2.0 -2.1 0.4 9.4017670 KP SK Telecom Co. Ltd. 0.4 0.8 -0.6 -2.5 0.0 2.2012450 KP Samsung Techwin Co. Ltd. 1.7 2.4 -1.0 -9.8 0.3 19.4035250 KP Kangwon Land Inc. 0.9 2.4 1.3 -4.9 0.3 11.3069960 KP Hyundai Department Store Co. Ltd. 1.3 2.5 0.9 -5.9 0.3 12.5068270 KS Celltrion Inc. 0.6 1.3 -4.1 10.1 0.4 -2.9034020 KS Doosan Heavy Industries & Construction Co. Ltd. 1.2 2.3 3.8 -9.1 0.3 11.2004940 KP Korea Exchange Bank 1.7 3.5 -1.6 -4.2 0.5 24.0005280 KS BS Financial Group Inc. 1.2 2.9 -1.6 -3.6 0.4 20.0042670 KS Doosan Infracore Co. Ltd. 1.6 3.4 2.4 -10.8 0.4 21.0006800 KS Daewoo Securities Co. Ltd. 1.5 1.3 -0.4 -3.3 0.1 7.1024110 KP Industrial Bank of Korea 1.4 3.7 0.1 -8.6 0.4 20.4005830 KS Dongbu Insurance Co. Ltd. 1.9 3.3 -1.3 -2.2 0.5 20.3001450 KP Hyundai Marine & Fire Insurance Co. Ltd. 1.5 2.5 -2.3 2.0 0.2 13.1009830 KP Hanwha Chemical Corp. 2.1 3.5 -2.3 -1.5 0.3 19.2004170 KP Shinsegae Co. Ltd. 0.9 1.6 -1.7 -5.3 0.2 10.7003490 KP Korean Air Lines Co. Ltd. 1.3 2.5 0.6 -7.2 0.1 15.2005940 KP Woori Investment & Securities Co. Ltd. 1.5 2.4 -1.3 -3.6 0.2 8.2011780 KP Kumho Petro Chemical Co Ltd 1.6 2.1 2.8 -2.3 0.5 19.0000150 KS Doosan Corp. 1.6 2.5 3.7 -6.8 0.2 13.0006260 KP LS Corp. 1.2 1.1 -0.9 -2.6 0.2 7.7004800 KP Hyosung Corp. 1.5 2.4 -1.9 -2.2 0.4 9.4000880 KP Hanwha Corp. 1.8 2.9 -0.7 -3.3 0.3 19.2010620 KP Hyundai Mipo Dockyard Co. Ltd. 1.5 0.9 2.8 -1.2 0.2 10.6012630 KP Hyundai Development Co. 1.4 2.1 -0.7 -2.1 0.1 11.9032640 KP LG Uplus Corp. 0.4 -0.2 0.7 -1.5 0.0 -0.3010520 KP Hyundai HYSCO 1.3 1.8 -1.2 1.6 0.4 13.3002380 KP KCC Corp. 1.0 1.8 -0.5 -2.4 0.3 7.3001040 KS CJ Corp. 1.1 1.9 -0.8 -1.8 0.1 14.1047050 KS Daewoo International Corp. 1.6 3.5 0.6 -6.8 0.4 19.3

June 11, 2012 Asia Pacific
Goldman Sachs Global Economics, Commodities and Strategy Research 31
Market summary: Malaysia
Exhibit 34: Factor loadings for MXMY constituents which pass our liquidity and market filters
Source: FactSet, I/B/E/S, Goldman Sachs Global ECS Research estimates.
Market summary: Philippines
Exhibit 35: Factor loadings for MXPH constituents which pass our liquidity and market filters
Source: FactSet, I/B/E/S, Goldman Sachs Global ECS Research estimates.
Market risks Local growth Policy/liquidity Inflation Oil Global growthMXMY Multiple regression R = 0 5606 0 54 (<0 01) 0 64 (0 02) 0 18 (0 79) 0 07 (0 89) 0 (0 93) 6 98 (<0 01)CIMB MK CIMB Group Holdings Bhd 0.9 1.3 -2.5 -3.0 0.3 14.2MAY MK Malayan Banking Bhd 0.7 1.4 -1.9 -3.2 0.2 12.8SIME MK Sime Darby Bhd 0.6 1.4 -1.9 -3.2 0.2 11.0GENT MK Genting Bhd 1.1 1.3 -2.3 -2.7 0.3 15.6TNB MK Tenaga Nasional Bhd 0.5 0.7 -0.2 -0.9 0.2 6.8IOI MK IOI Corp. Bhd 0.9 1.6 0.9 -4.7 0.4 15.9PBKF MK Public Bank Fgn 0.6 0.8 -2.4 -2.6 0.2 9.4DIGI MK DiGi.com Bhd 0.7 1.1 2.8 0.0 0.2 7.6GENM MK Genting Malaysia Bhd 0.8 0.7 -2.0 -1.3 0.2 10.2KLK MK Kuala Lumpur Kepong Bhd 0.7 1.5 0.0 -3.3 0.3 13.0AMM MK AMMB Holdings Bhd 1.2 1.7 -1.6 -3.9 0.3 17.4T MK Telekom Malaysia Bhd 0.2 0.4 -2.3 -1.5 -0.1 4.3AIRA MK AirAsia Bhd 0.6 0.8 4.1 -1.5 0.1 6.4UMWH MKUMW Holdings Bhd 0.5 0.3 0.4 -1.1 0.1 7.1
Market risks Local growth Policy/liquidity Inflation Oil Global growthMXPH Multiple regression R = 0 5447 0 91 (<0 01) -0 21 (0 68) 1 44 (0 15) 0 44 (0 38) -0 08 (0 12) 2 22 (0 47)SM PM SM Investments Corp. 0.9 2.0 -3.9 -2.1 0.2 10.1TEL PM Philippine Long Distance Telephone Co. 0.8 1.8 2.3 -1.2 0.2 9.8BDO PM BDO Unibank Inc 1.1 2.6 0.0 -1.8 0.3 14.2AGI PM Alliance Global Group Inc. 1.2 4.2 -3.0 -3.7 0.5 21.6

June 11, 2012 Asia Pacific
Goldman Sachs Global Economics, Commodities and Strategy Research 32
Market summary: Singapore
Exhibit 36: Factor loadings for MXSG constituents which pass our liquidity and market filters
Source: FactSet, I/B/E/S, Goldman Sachs Global ECS Research estimates.
Market risks Local growth Policy/liquidity Inflation Oil Global growth
DBS SP DBS Group Holdings Ltd. 1.2 1.2 -6.0 -2.2 0.4 18.2ST SP Singapore Telecommunications Ltd. 0.6 0.6 -3.1 -0.9 0.2 9.0UOB SP United Overseas Bank Ltd. 0.9 0.8 -5.2 -2.3 0.2 13.5OCBC SP Oversea‐Chinese Banking Corp. Ltd. 1.0 0.8 -4.2 -1.9 0.3 13.6KEP SP Keppel Corp. Ltd. 1.4 1.4 -9.4 -3.4 0.6 22.0GENS SP Genting Singapore PLC 1.3 0.5 2.9 -2.4 -0.1 11.7WIL SP Wilmar International Ltd. 1.7 1.0 -0.8 -2.2 0.4 20.3CAPL SP CapitaLand Ltd. 1.4 1.3 -6.5 -3.3 0.4 19.1FNN SP Fraser & Neave Ltd. 0.8 0.8 -4.8 -2.0 0.2 12.1SPH SP Singapore Press Holdings Ltd. 0.6 0.5 -5.2 -1.2 0.2 9.7SGX SP Singapore Exchange Ltd. 1.3 1.0 -5.2 -3.5 0.2 13.4SIA SP Singapore Airlines Ltd. 0.9 0.8 -5.0 -2.2 0.2 11.9CIT SP City Developments Ltd. 1.4 1.3 -7.5 -3.1 0.4 19.7JCNC SP Jardine Cycle & Carriage Ltd. 1.1 1.0 -8.8 -2.1 0.3 17.2SCI SP SembCorp Industries Ltd. 1.2 1.0 0.1 -2.5 0.4 15.1GGR SP Golden Agri‐Resources Ltd. 1.7 1.6 -6.4 -4.0 0.7 28.5NOBL SP Noble Group Ltd 1.2 1.1 -24.1 -4.0 0.7 21.3SMM SP SembCorp Marine Ltd. 1.3 1.4 -5.9 -3.0 0.7 20.5CT SP CapitaMall Trust 0.8 0.8 -5.8 -3.5 0.3 14.3AREIT SP Ascendas Real Estate Investment Trust 0.8 0.8 -7.4 -2.8 0.3 12.7OLAM SP Olam International Ltd. 1.6 1.5 -13.0 -5.4 0.6 19.7KPLD SP Keppel Land Ltd. 1.9 2.2 -8.3 -5.4 0.7 30.2

June 11, 2012 Asia Pacific
Goldman Sachs Global Economics, Commodities and Strategy Research 33
Market summary: Taiwan
Exhibit 37: Factor loadings for MXTW constituents which pass our liquidity and market filters
Source: FactSet, I/B/E/S, Goldman Sachs Global ECS Research estimates.
Market risks Local growth Policy/liquidity Inflation Oil Global growthTaiwan Multiple regression R²= 0 7955 1 29 (<0 01) 0 29 (0 16) -0 14 (0 92) 0 85 (0 2) -0 01 (0 76) -0 41 (0 84)2330 TT Taiwan Semiconductor Manufacturing Co. Ltd. 1.0 0.9 -3.5 -2.8 0.1 10.02317 TT Hon Hai Precision Industry Co. Ltd. 1.5 2.4 -5.4 -5.6 0.4 20.42412 TT Chunghwa Telecom Co. Ltd. 0.3 0.7 0.6 0.6 0.2 5.61301 TT Formosa Plastics Corp. 0.9 1.5 -6.5 -4.1 0.3 13.52498 TT HTC Corp. 1.1 1.4 12.5 2.2 0.6 11.62002 TT China Steel Corp. 1.0 1.7 -7.5 -4.2 0.4 16.21303 TT Nan Ya Plastics Corp. 1.2 1.8 -8.8 -4.9 0.4 18.12454 TT MediaTek Inc. 1.4 1.4 -9.0 -7.1 0.2 13.01326 TT Formosa Chemicals & Fibre Corp. 1.1 1.4 -10.0 -5.3 0.3 16.42882 TT Cathay Financial Holding Co. Ltd. 1.1 1.8 -9.5 -4.4 0.4 18.32357 TT ASUSTeK Computer Inc. 1.4 1.5 -4.9 -3.8 0.4 16.32382 TT Quanta Computer Inc. 1.1 0.8 -6.6 -4.1 0.2 9.52303 TT United Microelectronics Corp. 1.4 2.0 -7.6 -6.1 0.3 17.92891 TT Chinatrust Financial Holding Co. Ltd. 1.2 1.6 -9.5 -5.4 0.4 17.62886 TT Mega Financial Holding Co. Ltd. 1.2 2.0 -7.3 -4.2 0.4 17.71216 TT Uni‐President Enterprises Corp. 0.8 1.2 -4.2 -1.8 0.2 12.32308 TT Delta Electronics Inc. 1.2 1.5 -1.5 -2.0 0.3 14.83045 TT Taiwan Mobile Co. Ltd. 0.5 0.7 -1.7 -1.2 0.2 7.12881 TT Fubon Financial Holding Co. Ltd. 0.8 0.8 -8.1 -3.9 0.2 10.12324 TT Compal Electronics Inc. 1.3 1.6 -10.7 -5.5 0.3 14.42311 TT Advanced Semiconductor Engineering Inc. 1.8 2.5 -12.0 -6.7 0.4 23.81101 TT Taiwan Cement Corp. 1.3 1.9 -10.0 -4.3 0.4 15.82105 TT Cheng Shin Rubber Industry Co. Ltd. 0.8 1.2 -13.8 -6.5 0.3 13.32885 TT Yuanta Financial Holding Co. Ltd. 1.0 1.5 -7.7 -3.5 0.3 12.62474 TT Catcher Technology Co. Ltd. 1.8 1.3 -1.8 -5.5 0.3 17.86505 TT Formosa Petrochemical Corp. 0.6 0.9 -2.8 -3.1 0.3 9.82409 TT AU Optronics Corp. 1.8 2.1 -8.8 -6.9 0.4 19.84904 TT Far EasTone Telecommunications Co. Ltd. 0.4 0.7 0.7 -0.7 0.2 7.12325 TT Siliconware Precision Industries Co. Ltd. 1.5 1.5 -9.6 -4.6 0.2 15.72892 TT First Financial Holding Co. Ltd. 1.0 1.3 -6.5 -2.7 0.4 14.11402 TT Far Eastern New Century Corp. 1.5 2.2 -11.2 -4.4 0.5 19.32912 TT President Chain Store Corp. 0.5 0.8 1.3 -1.0 0.2 7.42347 TT Synnex Technology International Corp. 1.4 2.2 -9.9 -5.5 0.4 16.92353 TT Acer Inc. 1.6 2.0 -10.2 -4.3 0.3 16.03231 TT Wistron Corp. 1.6 3.2 -8.3 -7.0 0.6 21.42880 TT Hua Nan Financial Holdings Co. Ltd. 0.8 1.0 -6.3 -1.9 0.3 9.82301 TT Lite‐On Technology Corp. 1.4 1.6 -5.2 -5.8 0.3 15.92354 TT Foxconn Technology Co. Ltd. 1.9 2.0 -4.4 -6.6 0.3 20.12883 TT China Development Financial Holding Corp. 1.0 1.4 -5.6 -3.6 0.3 14.71102 TT Asia Cement Corp. 1.1 1.6 -9.2 -3.5 0.3 14.22801 TT Chang Hwa Commercial Bank Ltd. 1.1 1.2 -6.2 -3.1 0.4 14.53481 TT Chimei Innolux Corp. 2.6 5.1 -22.8 -13.8 0.9 34.62884 TT E.Sun Financial Holding Co. Ltd. 0.9 1.2 -7.9 -5.5 0.3 12.62887 TT Taishin Financial Holdings Co. Ltd. 1.4 2.3 -11.6 -7.8 0.6 21.82448 TT EPISTAR Corp. 1.8 3.4 -17.9 -13.2 0.6 29.43702 TT WPG Holdings Ltd. 2.4 4.9 -21.0 -12.9 0.9 35.26176 TT Radiant Opto‐Electronics Corp. 1.2 1.8 1.0 -5.8 0.4 13.31314 TT China Petrochemical Development Corp. 1.7 2.6 -10.0 -5.6 0.6 24.52888 TT Shin Kong Financial Holding Co. Ltd. 1.6 2.0 -7.8 -5.8 0.5 21.31722 TT Taiwan Fertilizer Co. Ltd. 1.3 2.1 -13.6 -4.8 0.5 19.36121 TT Simplo Technology Co. Ltd. 1.3 2.0 -8.1 -6.4 0.4 19.43008 TT LARGAN Precision Co. Ltd. 1.1 2.1 -0.6 -3.2 0.4 20.12207 TT Hotai Motor Co. Ltd. 0.8 1.7 -4.1 -3.1 0.4 15.43034 TT Novatek Microelectronics Corp. 2.1 3.5 -7.1 -9.6 0.5 27.02823 TT China Life Insurance Co. Ltd. 1.5 1.8 -13.9 -5.8 0.4 20.73037 TT UniMicron Technology Corp. 1.9 3.3 -3.9 -5.3 0.5 27.62201 TT Yulon Motor Co. Ltd. 1.0 2.3 -12.7 -7.9 0.4 18.56008 TT KGI Securities Co. Ltd. 1.4 1.9 -11.0 -5.8 0.5 19.06239 TT Powertech Technology Inc. 1.6 2.9 -11.8 -9.0 0.6 25.83044 TT Tripod Technology Corp. 1.6 2.8 -3.8 -7.3 0.5 23.22103 TT TSRC Corp. 1.4 1.7 -12.4 -4.8 0.5 18.32337 TT Macronix International Co. Ltd. 1.4 2.1 -2.6 -4.9 0.3 15.22610 TT China Airlines Ltd. 0.7 1.4 -3.7 -3.7 0.2 11.22903 TT Far Eastern Department Stores Ltd. 1.5 2.3 -9.5 -5.8 0.5 22.22618 TT EVA Airways Corp. 0.9 1.6 -4.8 -3.7 0.3 14.5

June 11, 2012 Asia Pacific
Goldman Sachs Global Economics, Commodities and Strategy Research 34
Market summary: Thailand
Exhibit 38: Factor loadings for MXTH constituents which pass our liquidity and market filters
Source: FactSet, I/B/E/S, Goldman Sachs Global ECS Research estimates.
Market risks Local growth Policy/liquidity Inflation Oil Global growthThailand Multiple regression R²= 0 6750 0 98 (<0 01) 0 23 (0 34) 0 (0 99) 0 8 (0 07) 0 04 (0 47) -0 75 (0 79)PTT TB PTT PCL 1.3 1.8 1.7 -3.7 0.5 18.0SCB TB Siam Commercial Bank PCL 1.0 1.2 4.6 -1.9 0.3 13.1PTTEP TB PTT Exploration & Production PCL 0.9 1.5 2.3 -1.4 0.5 13.9KBANK/F TBKasikornbank Public Co Ltd Shs Fgn Reg 1.1 1.3 4.6 -2.6 0.2 16.4CPALL TB CP ALL PCL 0.5 0.2 -0.8 -2.5 0.1 4.8BBL/F TB Bangkok Bank (F) 1.0 1.1 2.6 -2.2 0.3 13.6ADVANC TBAdvanced Info Service PCL 0.3 0.1 -0.9 -0.8 0.0 2.9CPF TB Charoen Pokphand Foods PCL 0.8 0.7 -1.5 -2.3 0.2 12.0PTTCH TB PTT Global Chemical Public Company Ltd 1.8 2.6 5.0 -5.1 0.8 28.1KBANK TB Kasikornbank PCL 1.1 1.4 4.3 -2.7 0.3 16.9BBL TB Bangkok Bank PCL 1.0 1.2 2.1 -2.4 0.3 13.9BANPU TB Banpu PCL 1.4 2.3 2.6 -4.1 0.6 23.1TOP TB Thai Oil PCL 1.7 2.3 5.7 -4.9 0.8 22.2BAY TB Bank of Ayudhya PCL 1.5 2.1 5.8 -2.9 0.5 22.7KTB TB Krung Thai Bank PCL 1.4 1.5 2.6 -3.1 0.4 20.1IRPC TB IRPC PCL 1.6 2.2 4.7 -2.2 0.4 24.0

June 11, 2012 Asia Pacific
Goldman Sachs Global Economics, Commodities and Strategy Research 35
Appendix 1: Correlations among macro variables
Exhibit 39: Stock returns correlations with growth indicators, such as CAI and GLI, are generally high Correlations between 3-month local returns and macro indicators (shading)
Note: 3-m lead means equity returns are leading economic variables by 3 months
Source: FactSet, I/B/E/S, CEIC, MSCI, Goldman Sachs Global ECS Research estimates.
Simple correlation table (3‐month rolling returns, loc)
IP Exports
Retail
sales
Domestic
CAI PMI CPI
Domestic
FCI WTI US CAI GLI EU CAI EM GDP
Coincident ‐0.09 ‐0.29 0.18 0.34 0.13 ‐0.33 ‐0.33 0.46 0.43 0.13 0.17 0.03
Momentum 0.12 ‐0.37 0.12 0.49 0.49 0.04 ‐0.05 0.26 0.55 0.65 0.54 0.27
3‐m lead 0.08 ‐0.30 0.06 0.59 0.42 ‐0.17 ‐0.24 0.23 0.58 0.42 0.52 0.32
Coincident 0.23 ‐0.05 ‐0.08 0.40 0.27 ‐0.12 ‐0.26 0.41 0.25 0.07 ‐0.02 0.00
Momentum 0.32 ‐0.01 ‐0.02 0.35 0.57 0.22 ‐0.22 0.41 0.43 0.58 0.36 0.19
3‐m lead 0.52 0.11 ‐0.02 0.63 0.63 0.03 ‐0.31 0.31 0.40 0.33 0.30 0.27
Coincident 0.14 ‐0.05 ‐0.05 0.14 0.22 ‐0.15 0.23 0.48 0.27 0.10 ‐0.01 ‐0.03
Momentum 0.41 0.05 0.20 0.44 0.44 ‐0.01 ‐0.09 0.39 0.50 0.64 0.43 0.16
3‐m lead 0.30 0.20 0.18 0.61 0.60 ‐0.07 0.07 0.36 0.47 0.39 0.39 0.28
Coincident ‐0.01 ‐0.28 N/A 0.27 0.01 ‐0.04 0.11 0.44 0.24 0.06 ‐0.05 ‐0.08
Momentum 0.21 0.09 N/A 0.30 0.60 ‐0.20 0.15 0.35 0.49 0.62 0.44 0.15
3‐m lead 0.25 0.06 N/A 0.46 0.47 ‐0.02 0.41 0.23 0.43 0.35 0.32 0.22
Coincident ‐0.24 ‐0.24 0.09 0.12 N/A ‐0.03 0.10 0.44 0.28 0.03 ‐0.09 ‐0.09
Momentum 0.04 0.13 0.25 0.26 N/A ‐0.27 ‐0.24 0.36 0.48 0.61 0.40 0.14
3‐m lead ‐0.06 0.05 0.27 0.31 N/A ‐0.18 0.01 0.30 0.45 0.32 0.26 0.19
Coincident ‐0.16 ‐0.30 ‐0.16 0.12 0.21 ‐0.24 ‐0.08 0.29 0.19 ‐0.08 ‐0.10 ‐0.21
Momentum 0.32 0.07 0.33 0.33 0.50 ‐0.35 0.12 0.34 0.54 0.51 0.31 0.05
3‐m lead 0.20 0.03 0.35 0.58 0.68 ‐0.24 0.16 0.34 0.42 0.21 0.22 0.06
Coincident ‐0.12 ‐0.26 N/A ‐0.04 N/A ‐0.36 ‐0.13 0.38 0.22 0.06 ‐0.05 ‐0.14
Momentum 0.10 0.00 N/A 0.28 N/A ‐0.31 0.26 0.37 0.55 0.59 0.40 0.18
3‐m lead 0.19 ‐0.04 N/A 0.37 N/A ‐0.40 ‐0.08 0.24 0.40 0.35 0.28 0.15
Coincident ‐0.20 ‐0.02 N/A 0.15 N/A ‐0.15 0.15 0.23 0.24 0.01 ‐0.06 ‐0.04
Momentum ‐0.12 0.23 N/A 0.21 N/A ‐0.25 0.20 0.25 0.46 0.45 0.39 0.00
3‐m lead ‐0.04 0.15 N/A 0.33 N/A ‐0.22 0.15 0.13 0.43 0.23 0.20 0.15
Coincident 0.19 ‐0.08 ‐0.07 0.25 0.16 ‐0.38 ‐0.16 0.48 0.28 0.08 ‐0.01 ‐0.04
Momentum 0.12 0.18 0.03 0.32 0.46 ‐0.22 ‐0.15 0.40 0.57 0.69 0.53 0.24
3‐m lead 0.42 0.19 0.16 0.58 0.48 ‐0.32 ‐0.01 0.30 0.51 0.39 0.39 0.27
Coincident ‐0.06 ‐0.17 0.06 0.22 0.37 ‐0.38 ‐0.25 0.38 0.15 0.00 ‐0.11 ‐0.18
Momentum 0.27 0.21 0.32 0.38 0.62 ‐0.04 0.13 0.43 0.56 0.58 0.37 0.10
3‐m lead 0.31 0.19 0.29 0.51 0.68 ‐0.13 ‐0.16 0.41 0.41 0.30 0.28 0.15
Coincident ‐0.04 ‐0.22 0.00 0.04 N/A ‐0.34 0.18 0.43 0.27 0.01 ‐0.12 ‐0.19
Momentum 0.20 0.10 0.26 0.29 N/A ‐0.04 0.07 0.38 0.56 0.61 0.42 0.23
3‐m lead 0.35 0.13 0.24 0.54 N/A ‐0.10 0.27 0.33 0.48 0.32 0.24 0.13
3mo lead: corr(mxau apr‐jun return, ip grwoth in jul‐sep)
momentum corr(mxau apr‐jun return, ip grwoth in apr‐jun MINUS ip growth in jan‐mar)
Thailand
Korea
Australia
China
Hong Kong
India
Indonesia
Macro indicators vs. MSCI
country index returns (3m,
l )
Malaysia
Philippines
Singapore
Taiwan

June 11, 2012 A
sia Pacific
Goldm
an Sachs Global Econom
ics, Com
modities and Strategy R
esearch
36
Exhibit 40: Many growth-related indicators are highly correlated among themselves
Correlations among macro variables
Note: Shaded areas mean correlation coefficient is higher than 0.5 or lower than -0.5.
Source: MSCI, FactSet, CEIC, Goldman Sachs Global ECS Research
CAI CPI FCI WTI GLI DM EM IP Exp.
Ret.
Sales PMI CAI CPI FCI WTI GLI DM EM IP Exp.
Ret.
Sales PMI CAI CPI FCI WTI GLI DM EM IP Exp.
Ret.
Sales PMI
CAI 1.00 CAI 1.00 CAI 1.00
CPI ‐0.52 1.00 CPI ‐0.28 1.00 CPI ‐0.49 1.00
FCI ‐0.41 0.58 1.00 FCI 0.04 0.76 1.00 FCI ‐0.15 0.46 1.00
WTI 0.39 ‐0.28 ‐0.18 1.00 WTI 0.30 ‐0.21 ‐0.15 1.00 WTI 0.55 ‐0.20 ‐0.16 1.00
GLI 0.77 ‐0.56 ‐0.55 0.63 1.00 GLI 0.32 ‐0.24 ‐0.09 0.63 1.00 GLI 0.76 ‐0.58 ‐0.30 0.63 1.00
DM 0.58 ‐0.54 ‐0.57 0.56 0.86 1.00 DM 0.47 ‐0.31 ‐0.11 0.58 0.86 1.00 DM 0.71 ‐0.55 ‐0.25 0.58 0.86 1.00
EM 0.55 ‐0.12 0.22 0.43 0.48 0.26 1.00 EM 0.09 ‐0.08 ‐0.07 0.44 0.52 0.30 1.00 EM 0.43 ‐0.35 0.12 0.44 0.52 0.30 1.00
IP 0.13 0.30 0.32 ‐0.02 ‐0.09 ‐0.12 0.44 1.00 IP ‐0.06 ‐0.71 ‐0.61 0.01 ‐0.09 ‐0.04 0.15 1.00 IP 0.30 ‐0.28 0.13 0.17 0.44 0.39 0.66 1.00
Exports ‐0.59 0.52 0.58 ‐0.34 ‐0.68 ‐0.59 ‐0.18 0.08 1.00 Exports ‐0.13 ‐0.07 0.13 ‐0.06 ‐0.13 ‐0.14 0.60 0.41 1.00 Exports 0.02 0.02 0.35 0.06 0.01 ‐0.04 0.74 0.67 1.00
Ret. Sales 0.49 ‐0.27 ‐0.28 0.21 0.30 0.19 ‐0.02 ‐0.11 ‐0.46 1.00 Ret. Sales 0.09 ‐0.69 ‐0.45 0.18 0.23 0.27 0.35 0.64 0.38 1.00 Ret. Sales ‐0.09 ‐0.05 0.05 0.05 ‐0.12 ‐0.25 0.52 0.14 0.56 1.00
PMI 0.61 0.02 0.15 0.21 0.30 0.18 0.62 0.54 ‐0.31 0.33 1.00 PMI N/A N/A N/A N/A N/A N/A N/A N/A N/A N/A N/A PMI 0.47 ‐0.46 ‐0.11 0.40 0.54 0.51 0.78 0.53 0.53 0.44 1.00
CAI CPI FCI WTI GLI DM EM IP Exp.
Ret.
Sales PMI CAI CPI FCI WTI GLI DM EM IP Exp.
Ret.
Sales PMI CAI CPI FCI WTI GLI DM EM IP Exp.
Ret.
Sales PMI
CAI 1.00 CAI 1.00 CAI 1.00
CPI ‐0.26 1.00 CPI ‐0.51 1.00 CPI ‐0.42 1.00
FCI ‐0.46 0.55 1.00 FCI 0.14 ‐0.46 1.00 FCI ‐0.22 0.61 1.00
WTI 0.42 0.02 ‐0.20 1.00 WTI 0.47 ‐0.26 0.22 1.00 WTI 0.55 ‐0.05 ‐0.08 1.00
GLI 0.72 ‐0.30 ‐0.53 0.63 1.00 GLI 0.74 ‐0.61 0.29 0.63 1.00 GLI 0.80 ‐0.48 ‐0.33 0.63 1.00
DM 0.57 ‐0.45 ‐0.53 0.63 0.86 1.00 DM 0.61 ‐0.51 0.16 0.62 0.86 1.00 DM 0.64 ‐0.50 ‐0.34 0.58 0.86 1.00
EM 0.27 0.28 ‐0.02 0.44 0.53 0.31 1.00 EM 0.43 ‐0.50 0.89 0.44 0.53 0.30 1.00 EM 0.24 0.11 0.25 0.44 0.52 0.30 1.00
IP 0.08 0.31 ‐0.12 0.34 0.39 0.25 0.92 1.00 IP 0.21 ‐0.26 0.82 0.24 0.35 0.33 0.83 1.00 IP 0.05 0.16 0.30 0.24 0.34 0.29 0.79 1.00
Exports ‐0.36 0.60 0.59 ‐0.10 ‐0.19 ‐0.28 0.67 0.66 1.00 Exports ‐0.14 0.10 0.80 0.00 ‐0.08 ‐0.07 0.70 0.84 1.00 Exports ‐0.19 0.37 0.52 0.10 0.10 0.06 0.79 0.92 1.00
Ret. Sales ‐0.76 0.65 0.40 ‐0.30 ‐0.61 ‐0.41 ‐0.24 ‐0.11 0.19 1.00 Ret. Sales 0.06 0.12 0.63 0.18 0.13 0.15 0.62 0.86 0.81 1.00 Ret. Sales 0.26 ‐0.01 0.39 0.39 0.45 0.34 0.75 0.77 0.71 1.00PMI 0.32 0.13 ‐0.31 0.57 0.67 0.60 0.83 0.85 0.35 ‐0.11 1.00 PMI 0.42 ‐0.44 0.66 0.47 0.60 0.53 0.78 0.76 0.51 0.56 1.00 PMI 0.42 ‐0.10 0.00 0.53 0.71 0.68 0.77 0.66 0.52 0.59 1.00
CAI CPI FCI WTI GLI DM EM IP Exp.
Ret.
Sales PMI CAI CPI FCI WTI GLI DM EM IP Exp.
Ret.
Sales PMI CAI CPI FCI WTI GLI DM EM IP Exp.
Ret.
Sales PMI
CAI 1.00 CAI 1.00 CAI 1.00
CPI ‐0.12 1.00 CPI ‐0.59 1.00 CPI ‐0.32 1.00
FCI 0.24 ‐0.01 1.00 FCI ‐0.11 0.10 1.00 FCI 0.24 0.26 1.00
WTI 0.55 ‐0.06 0.08 1.00 WTI 0.67 ‐0.36 ‐0.05 1.00 WTI 0.64 ‐0.12 0.17 1.00
GLI 0.85 ‐0.31 0.15 0.64 1.00 GLI 0.83 ‐0.70 ‐0.13 0.63 1.00 GLI 0.84 ‐0.36 0.35 0.63 1.00
DM 0.74 ‐0.51 0.11 0.62 0.86 1.00 DM 0.71 ‐0.60 ‐0.15 0.56 0.86 1.00 DM 0.72 ‐0.39 0.13 0.56 0.86 1.00
EM 0.71 0.05 ‐0.02 0.44 0.53 0.30 1.00 EM 0.54 ‐0.23 0.19 0.42 0.50 0.27 1.00 EM 0.54 0.38 0.65 0.42 0.50 0.27 1.00
IP 0.43 0.21 0.36 0.23 0.26 0.07 0.73 1.00 IP 0.26 ‐0.12 0.03 0.18 0.21 0.10 0.77 1.00 IP 0.30 0.28 0.23 0.10 0.19 0.14 0.63 1.00
Exports 0.21 0.32 ‐0.05 0.02 0.00 ‐0.05 0.70 0.80 1.00 Exports 0.01 0.25 0.11 0.05 ‐0.10 ‐0.15 0.65 0.78 1.00 Exports 0.07 0.68 0.42 0.06 ‐0.06 ‐0.14 0.75 0.69 1.00
Ret. Sales 0.07 0.70 ‐0.35 0.07 ‐0.09 ‐0.19 0.55 0.63 0.73 1.00 Ret. Sales N/A N/A N/A N/A N/A N/A N/A N/A N/A N/A Ret. Sales 0.21 0.14 ‐0.07 0.04 0.04 0.02 0.26 0.62 0.38 1.00PMI 0.71 ‐0.05 ‐0.04 0.39 0.54 0.42 0.94 0.69 0.69 0.48 1.00 PMI N/A N/A N/A N/A N/A N/A N/A N/A N/A N/A N/A PMI N/A N/A N/A N/A N/A N/A N/A N/A N/A N/A N/A
CAI CPI FCI WTI GLI DM EM IP Exp.
Ret.
Sales PMI CAI CPI FCI WTI GLI DM EM IP Exp.
Ret.
Sales PMI
CAI 1.00 CAI 1.00
CPI 0.18 1.00 CPI ‐0.44 1.00
FCI 0.11 0.20 1.00 FCI ‐0.11 0.39 1.00
WTI 0.33 ‐0.16 0.31 1.00 WTI 0.60 ‐0.38 ‐0.05 1.00
GLI 0.41 ‐0.08 0.47 0.64 1.00 GLI 0.78 ‐0.67 ‐0.14 0.63 1.00
DM 0.65 0.21 0.59 0.62 0.86 1.00 DM 0.71 ‐0.51 ‐0.25 0.57 0.86 1.00
EM 0.60 ‐0.17 0.56 0.44 0.53 0.30 1.00 EM 0.33 ‐0.23 0.34 0.39 0.49 0.27 1.00
IP 0.29 ‐0.28 0.25 0.10 0.12 0.01 0.77 1.00 IP ‐0.11 0.23 0.11 ‐0.13 ‐0.13 ‐0.08 0.46 1.00
Exports ‐0.07 ‐0.09 0.15 ‐0.02 ‐0.21 ‐0.25 0.63 0.62 1.00 Exports 0.01 ‐0.07 0.30 0.08 0.14 0.08 0.71 0.77 1.00
Ret. Sales N/A N/A N/A N/A N/A N/A N/A N/A N/A N/A Ret. Sales N/A N/A N/A N/A N/A N/A N/A N/A N/A N/APMI 0.37 ‐0.26 0.34 0.23 0.25 0.24 0.77 0.71 0.67 N/A 1.00 PMI N/A N/A N/A N/A N/A N/A N/A N/A N/A N/A N/A
India Philippines
KoreaChina
Australia Indonesia Singapore
Taiwan
ThailandMalaysiaHK

June 11, 2012 Asia Pacific
Goldman Sachs Global Economics, Commodities and Strategy Research 37
Appendix 2: Empirical linkages between micro parameters and
returns
Exhibit 41: Valuation metrics and subsequent 3-month stock returns
Source: FactSet, I/B/E/S, Goldman Sachs Global ECS Research estimates.
Exhibit 42: Micro indicators and subsequent 3-month stock returns
Source: FactSet, I/B/E/S, Goldman Sachs Global ECS Research estimates.
Exhibit 43: Technical indicators and subsequent 3-month stock returns
Source: FactSet, I/B/E/S, Goldman Sachs Global ECS Research estimates.
0%
2%
4%
6%
8%
10%
12%
14%
16%
18%
20%
51015202530
Entry Point fPE(x)
Average subsequent
3mth return
0%
2%
4%
6%
8%
10%
12%
14%
16%
18%
20%
11.522.533.5Entry Point tPB(x)
Average subsequent
3mth return
0%
2%
4%
6%
8%
10%
12%
14%
16%
1%2%3%4%5%6%
Entry Point tDY
Average subsequent
3mth return
-1%
0%
1%
2%
3%
4%
5%
6%
7%
8%
-2-1012>2Entry Point Target Price Chg z score
Average subsequent
3mth return
-1%
0%
1%
2%
3%
4%
5%
6%
7%
-2-1012>2
Entry Point Earnings Sentiment z score
Average subsequent
3mth return
3.0%
3.5%
4.0%
4.5%
5.0%
5.5%
6.0%
-2-1012>2Entry Point Earnings Revision z score
Average subsequent
3mth return
0%
5%
10%
15%
20%
25%
3040506070>70Entry Point RSI
Average subsequent
3mth return
0%
2%
4%
6%
8%
10%
12%
14%
0.20.40.60.811.2>1.2Entry Point Boll
Average subsequent 3mth return
0%
5%
10%
15%
20%
25%
30%
35%
40%
45%
-0.2-0.15-0.1-0.0500.050.10.150.2>0.2
Entry Point MACD
Averageg subsequent
3mth return

June 11, 2012 Asia Pacific
Goldman Sachs Global Economics, Commodities and Strategy Research 38
Appendix 3: Macro variables in different phases of business cycle
Exhibit 44: Equity returns and growth performance during different phases of the business cycle (from 2000)
Source: FactSet, I/B/E/S, Goldman Sachs Global ECS Research estimates.

June 11, 2012 Asia Pacific
Goldman Sachs Global Economics, Commodities and Strategy Research 39
References
Asia Pacific: Portfolio Strategy: Global Strategy Paper: No. 3: AsiaPac Valuation: What
works, and when, March 12, 2012
Asia Pacific: Portfolio Strategy: “Corporate Asia” Earning: from Macro to Micro, March 6
Asia Pacific: Portfolio Strategy: What macro indicators matter for Asian markets?, March 6
Global Economics Paper No: 214: Acceleration Matters: Asset Returns and the Business
Cycle, May 16, 2012
Fama, Eugene F.; French, Kenneth R. (1992). "The Cross-Section of Expected Stock Returns".
Journal of Finance 47
Fama, Eugene F.; French, Kenneth R. (1993). "Common Risk Factors in the Returns on
Stocks and Bonds". Journal of Financial Economics 33
Ross, Stephen (1976). "The arbitrage theory of capital asset pricing". Journal of Economic
Theory 13
Chen, Nai-Fu; Roll, Richard; Ross, Stephen (1986). "Economic Forces and the Stock Market".
Journal of Business 59

June 11, 2012 Asia Pacific
Goldman Sachs Global Economics, Commodities and Strategy Research 40
MSCI disclosure
All MSCI data used in this report is the exclusive property of MSCI, Inc. (MSCI). Without
prior written permission of MSCI, this information and any other MSCI intellectual property
may not be reproduced or redisseminated in any form and may not be used to create any
financial instruments or products or any indices. This information is provided on an “as is”
basis, and the user of this information assumes the entire risk of any use made of this
information. Neither MSCI, any of its affiliates nor any third party involved in, or related to,
computing or compiling the data makes any express or implied warranties or
representations with respect to this information (or the results to be obtained by the use
thereof), and MSCI, its affiliates and any such third party hereby expressly disclaim all
warranties of originality, accuracy, completeness, merchantability or fitness for a particular
purpose with respect to any of this information. Without limiting any of the foregoing, in
no event shall MSCI, any of its affiliates or any third party involved in, or related to,
computing or compiling the data have any liability for any direct, indirect, special, punitive,
consequential or any other damages (including lost profits) even if notified of the
possibility of such damages. MSCI and the MSCI indexes are service marks of MSCI and its
affiliates. The Global Industry Classification Standard (GICS) were developed by and is the
exclusive property of MSCI and Standard & Poor’s. GICS is a service mark of MSCI and
S&P and has been licensed for use by The Goldman Sachs Group, Inc.

June 11, 2012 Asia Pacific
Goldman Sachs Global Economics, Commodities and Strategy Research 41
Disclosure Appendix
Reg AC
I, Kinger Lau, CFA, hereby certify that all of the views expressed in this report accurately reflect my personal views about the subject company or
companies and its or their securities. I also certify that no part of my compensation was, is or will be, directly or indirectly, related to the specific
recommendations or views expressed in this report.
Disclosures
Option Specific Disclosures
Price target methodology: Please refer to the analyst’s previously published research for methodology and risks associated with equity price
targets.
Pricing Disclosure: Option prices and volatility levels in this note are indicative only, and are based on our estimates of recent mid-market levels.
All prices and levels exclude transaction costs unless otherwise stated.
Buying Options - Investors who buy call (put) options risk loss of the entire premium paid if the underlying security finishes below (above) the
strike price at expiration. Investors who buy call or put spreads also risk a maximum loss of the premium paid. The maximum gain on a long call or
put spread is the difference between the strike prices, less the premium paid.
Selling Options - Investors who sell calls on securities they do not own risk unlimited loss of the security price less the strike price. Investors who
sell covered calls (sell calls while owning the underlying security) risk having to deliver the underlying security or pay the difference between the
security price and the strike price, depending on whether the option is settled by physical delivery or cash-settled. Investors who sell puts risk loss of
the strike price less the premium received for selling the put. Investors who sell put or call spreads risk a maximum loss of the difference between
the strikes less the premium received, while their maximum gain is the premium received.
For options settled by physical delivery, the above risks assume the options buyer or seller, buys or sells the resulting securities at the
settlement price on expiry.
Distribution of ratings/investment banking relationships
Goldman Sachs Investment Research global coverage universe
Rating Distribution Investment Banking Relationships
Buy Hold Sell Buy Hold Sell
Global 31% 54% 15% 48% 41% 36%
As of April 1, 2012, Goldman Sachs Global Investment Research had investment ratings on 3,507 equity securities. Goldman Sachs assigns stocks as
Buys and Sells on various regional Investment Lists; stocks not so assigned are deemed Neutral. Such assignments equate to Buy, Hold and Sell for
the purposes of the above disclosure required by NASD/NYSE rules. See 'Ratings, Coverage groups and views and related definitions' below.
Disclosures required by United States laws and regulations
See company-specific regulatory disclosures above for any of the following disclosures required as to companies referred to in this report: manager
or co-manager in a pending transaction; 1% or other ownership; compensation for certain services; types of client relationships; managed/co-
managed public offerings in prior periods; directorships; for equity securities, market making and/or specialist role. Goldman Sachs usually makes a
market in fixed income securities of issuers discussed in this report and usually deals as a principal in these securities.
The following are additional required disclosures: Ownership and material conflicts of interest: Goldman Sachs policy prohibits its analysts,
professionals reporting to analysts and members of their households from owning securities of any company in the analyst's area of coverage.
Analyst compensation: Analysts are paid in part based on the profitability of Goldman Sachs, which includes investment banking revenues. Analyst as officer or director: Goldman Sachs policy prohibits its analysts, persons reporting to analysts or members of their households from serving as an
officer, director, advisory board member or employee of any company in the analyst's area of coverage. Non-U.S. Analysts: Non-U.S. analysts may
not be associated persons of Goldman, Sachs & Co. and therefore may not be subject to NASD Rule 2711/NYSE Rules 472 restrictions on
communications with subject company, public appearances and trading securities held by the analysts.
Additional disclosures required under the laws and regulations of jurisdictions other than the United States
The following disclosures are those required by the jurisdiction indicated, except to the extent already made above pursuant to United States laws
and regulations. Australia: Goldman Sachs Australia Pty Ltd and its affiliates are not authorised deposit-taking institutions (as that term is defined in
the Banking Act 1959 (Cth)) in Australia and do not provide banking services, nor carry on a banking business, in Australia. This research, and any
access to it, is intended only for "wholesale clients" within the meaning of the Australian Corporations Act, unless otherwise agreed by Goldman
Sachs. Brazil: Disclosure information in relation to CVM Instruction 483 is available at http://www.gs.com/worldwide/brazil/area/gir/index.html. Where
applicable, the Brazil-registered analyst primarily responsible for the content of this research report, as defined in Article 16 of CVM Instruction 483, is
the first author named at the beginning of this report, unless indicated otherwise at the end of the text. Canada: Goldman, Sachs & Co. has approved
of, and agreed to take responsibility for, this research in Canada if and to the extent it relates to equity securities of Canadian issuers. Analysts may
conduct site visits but are prohibited from accepting payment or reimbursement by the company of travel expenses for such visits. Hong Kong:

June 11, 2012 Asia Pacific
Goldman Sachs Global Economics, Commodities and Strategy Research 42
Further information on the securities of covered companies referred to in this research may be obtained on request from Goldman Sachs (Asia) L.L.C.
India: Further information on the subject company or companies referred to in this research may be obtained from Goldman Sachs (India) Securities
Private Limited; Japan: See below. Korea: Further information on the subject company or companies referred to in this research may be obtained
from Goldman Sachs (Asia) L.L.C., Seoul Branch. New Zealand: Goldman Sachs New Zealand Limited and its affiliates are neither "registered banks"
nor "deposit takers" (as defined in the Reserve Bank of New Zealand Act 1989) in New Zealand. This research, and any access to it, is intended for
"wholesale clients" (as defined in the Financial Advisers Act 2008) unless otherwise agreed by Goldman Sachs. Russia: Research reports distributed
in the Russian Federation are not advertising as defined in the Russian legislation, but are information and analysis not having product promotion as
their main purpose and do not provide appraisal within the meaning of the Russian legislation on appraisal activity. Singapore: Further information
on the covered companies referred to in this research may be obtained from Goldman Sachs (Singapore) Pte. (Company Number: 198602165W).
Taiwan: This material is for reference only and must not be reprinted without permission. Investors should carefully consider their own investment
risk. Investment results are the responsibility of the individual investor. United Kingdom: Persons who would be categorized as retail clients in the
United Kingdom, as such term is defined in the rules of the Financial Services Authority, should read this research in conjunction with prior Goldman
Sachs research on the covered companies referred to herein and should refer to the risk warnings that have been sent to them by Goldman Sachs
International. A copy of these risks warnings, and a glossary of certain financial terms used in this report, are available from Goldman Sachs
International on request.
European Union: Disclosure information in relation to Article 4 (1) (d) and Article 6 (2) of the European Commission Directive 2003/126/EC is available
at http://www.gs.com/disclosures/europeanpolicy.html which states the European Policy for Managing Conflicts of Interest in Connection with
Investment Research.
Japan: Goldman Sachs Japan Co., Ltd. is a Financial Instrument Dealer under the Financial Instrument and Exchange Law, registered with the Kanto
Financial Bureau (Registration No. 69), and is a member of Japan Securities Dealers Association (JSDA) and Financial Futures Association of Japan
(FFAJ). Sales and purchase of equities are subject to commission pre-determined with clients plus consumption tax. See company-specific
disclosures as to any applicable disclosures required by Japanese stock exchanges, the Japanese Securities Dealers Association or the Japanese
Securities Finance Company.
Ratings, coverage groups and views and related definitions
Buy (B), Neutral (N), Sell (S) -Analysts recommend stocks as Buys or Sells for inclusion on various regional Investment Lists. Being assigned a Buy
or Sell on an Investment List is determined by a stock's return potential relative to its coverage group as described below. Any stock not assigned as
a Buy or a Sell on an Investment List is deemed Neutral. Each regional Investment Review Committee manages various regional Investment Lists to a
global guideline of 25%-35% of stocks as Buy and 10%-15% of stocks as Sell; however, the distribution of Buys and Sells in any particular coverage
group may vary as determined by the regional Investment Review Committee. Regional Conviction Buy and Sell lists represent investment
recommendations focused on either the size of the potential return or the likelihood of the realization of the return.
Return potential represents the price differential between the current share price and the price target expected during the time horizon associated
with the price target. Price targets are required for all covered stocks. The return potential, price target and associated time horizon are stated in each
report adding or reiterating an Investment List membership.
Coverage groups and views: A list of all stocks in each coverage group is available by primary analyst, stock and coverage group at
http://www.gs.com/research/hedge.html. The analyst assigns one of the following coverage views which represents the analyst's investment outlook
on the coverage group relative to the group's historical fundamentals and/or valuation. Attractive (A). The investment outlook over the following 12
months is favorable relative to the coverage group's historical fundamentals and/or valuation. Neutral (N). The investment outlook over the following
12 months is neutral relative to the coverage group's historical fundamentals and/or valuation. Cautious (C). The investment outlook over the
following 12 months is unfavorable relative to the coverage group's historical fundamentals and/or valuation.
Not Rated (NR). The investment rating and target price have been removed pursuant to Goldman Sachs policy when Goldman Sachs is acting in an
advisory capacity in a merger or strategic transaction involving this company and in certain other circumstances. Rating Suspended (RS). Goldman
Sachs Research has suspended the investment rating and price target for this stock, because there is not a sufficient fundamental basis for
determining, or there are legal, regulatory or policy constraints around publishing, an investment rating or target. The previous investment rating and
price target, if any, are no longer in effect for this stock and should not be relied upon. Coverage Suspended (CS). Goldman Sachs has suspended
coverage of this company. Not Covered (NC). Goldman Sachs does not cover this company. Not Available or Not Applicable (NA). The information
is not available for display or is not applicable. Not Meaningful (NM). The information is not meaningful and is therefore excluded.
Global product; distributing entities
The Global Investment Research Division of Goldman Sachs produces and distributes research products for clients of Goldman Sachs on a global
basis. Analysts based in Goldman Sachs offices around the world produce equity research on industries and companies, and research on
macroeconomics, currencies, commodities and portfolio strategy. This research is disseminated in Australia by Goldman Sachs Australia Pty Ltd
(ABN 21 006 797 897); in Brazil by Goldman Sachs do Brasil Corretora de Títulos e Valores Mobiliários S.A.; in Canada by Goldman, Sachs & Co.
regarding Canadian equities and by Goldman, Sachs & Co. (all other research); in Hong Kong by Goldman Sachs (Asia) L.L.C.; in India by Goldman
Sachs (India) Securities Private Ltd.; in Japan by Goldman Sachs Japan Co., Ltd.; in the Republic of Korea by Goldman Sachs (Asia) L.L.C., Seoul
Branch; in New Zealand by Goldman Sachs New Zealand Limited; in Russia by OOO Goldman Sachs; in Singapore by Goldman Sachs (Singapore)
Pte. (Company Number: 198602165W); and in the United States of America by Goldman, Sachs & Co. Goldman Sachs International has approved this
research in connection with its distribution in the United Kingdom and European Union.
European Union: Goldman Sachs International, authorized and regulated by the Financial Services Authority, has approved this research in
connection with its distribution in the European Union and United Kingdom; Goldman Sachs AG, regulated by the Bundesanstalt für
Finanzdienstleistungsaufsicht, may also distribute research in Germany.
General disclosures
This research is for our clients only. Other than disclosures relating to Goldman Sachs, this research is based on current public information that we
consider reliable, but we do not represent it is accurate or complete, and it should not be relied on as such. We seek to update our research as
appropriate, but various regulations may prevent us from doing so. Other than certain industry reports published on a periodic basis, the large
majority of reports are published at irregular intervals as appropriate in the analyst's judgment.
Goldman Sachs conducts a global full-service, integrated investment banking, investment management, and brokerage business. We have
investment banking and other business relationships with a substantial percentage of the companies covered by our Global Investment Research
Division. Goldman, Sachs & Co., the United States broker dealer, is a member of SIPC (http://www.sipc.org).

June 11, 2012 Asia Pacific
Goldman Sachs Global Economics, Commodities and Strategy Research 43
Our salespeople, traders, and other professionals may provide oral or written market commentary or trading strategies to our clients and our
proprietary trading desks that reflect opinions that are contrary to the opinions expressed in this research. Our asset management area, our
proprietary trading desks and investing businesses may make investment decisions that are inconsistent with the recommendations or views
expressed in this research.
The analysts named in this report may have from time to time discussed with our clients, including Goldman Sachs salespersons and traders, or may
discuss in this report, trading strategies that reference catalysts or events that may have a near-term impact on the market price of the equity
securities discussed in this report, which impact may be directionally counter to the analysts' published price target expectations for such stocks. Any
such trading strategies are distinct from and do not affect the analysts' fundamental equity rating for such stocks, which rating reflects a stock's
return potential relative to its coverage group as described herein.
We and our affiliates, officers, directors, and employees, excluding equity and credit analysts, will from time to time have long or short positions in,
act as principal in, and buy or sell, the securities or derivatives, if any, referred to in this research.
This research is not an offer to sell or the solicitation of an offer to buy any security in any jurisdiction where such an offer or solicitation would be
illegal. It does not constitute a personal recommendation or take into account the particular investment objectives, financial situations, or needs of
individual clients. Clients should consider whether any advice or recommendation in this research is suitable for their particular circumstances and, if
appropriate, seek professional advice, including tax advice. The price and value of investments referred to in this research and the income from them
may fluctuate. Past performance is not a guide to future performance, future returns are not guaranteed, and a loss of original capital may occur.
Fluctuations in exchange rates could have adverse effects on the value or price of, or income derived from, certain investments.
Certain transactions, including those involving futures, options, and other derivatives, give rise to substantial risk and are not suitable for all investors.
Investors should review current options disclosure documents which are available from Goldman Sachs sales representatives or at
http://www.theocc.com/about/publications/character-risks.jsp. Transaction costs may be significant in option strategies calling for multiple purchase
and sales of options such as spreads. Supporting documentation will be supplied upon request.
In producing research reports, members of the Global Investment Research Division of Goldman Sachs Australia may attend site visits and other
meetings hosted by the issuers the subject of its research reports. In some instances the costs of such site visits or meetings may be met in part or in
whole by the issuers concerned if Goldman Sachs Australia considers it is appropriate and reasonable in the specific circumstances relating to the
site visit or meeting.
All research reports are disseminated and available to all clients simultaneously through electronic publication to our internal client websites. Not all
research content is redistributed to our clients or available to third-party aggregators, nor is Goldman Sachs responsible for the redistribution of our
research by third party aggregators. For all research available on a particular stock, please contact your sales representative or go to
http://360.gs.com.
Disclosure information is also available at http://www.gs.com/research/hedge.html or from Research Compliance, 200 West Street, New York, NY
10282.
© 2012 Goldman Sachs.
No part of this material may be (i) copied, photocopied or duplicated in any form by any means or (ii) redistributed without the prior written consent of The Goldman Sachs Group, Inc.