bridging environmental data providers and seadatanet diva service within a collaborative and...
TRANSCRIPT
BlueBRIDGE receives funding from the European Union’s Horizon 2020 research and innovation programme under grant agreement No. 675680 www.bluebridge-vres.eu
Bridging environmental data providers and SeaDataNet DIVA service within a collaborative and distributed e-Infrastructure
Gianpaolo Coro, Pasquale Pagano, Umberto Napolitano
ISTI-CNR, Italy
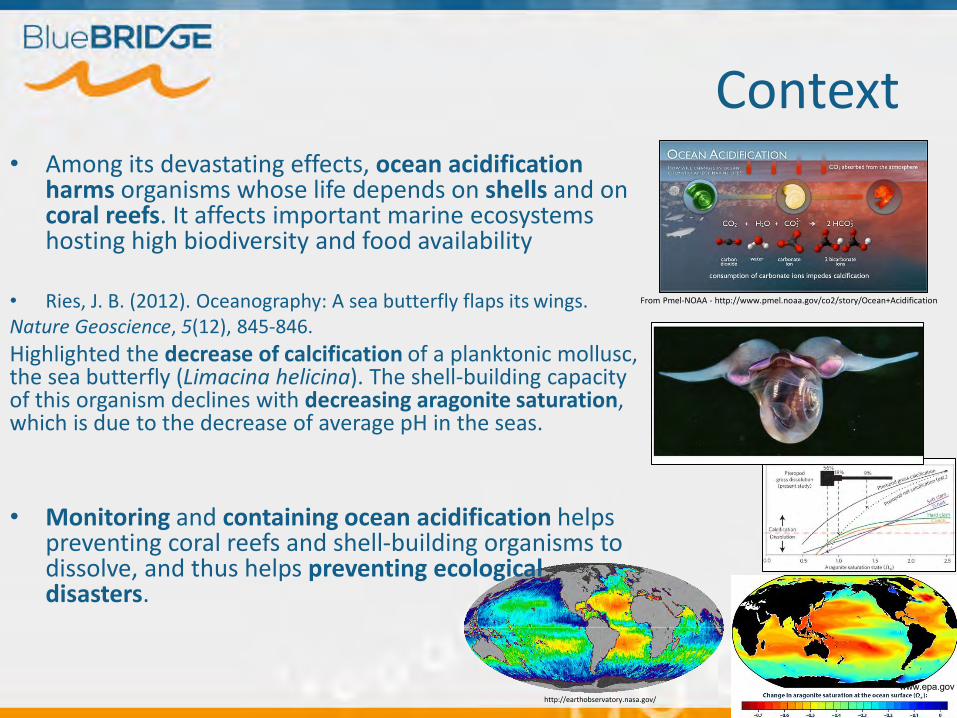
Context• Among its devastating effects, ocean acidification
harms organisms whose life depends on shells and on coral reefs. It affects important marine ecosystems hosting high biodiversity and food availability
• Ries, J. B. (2012). Oceanography: A sea butterfly flaps its wings.Nature Geoscience, 5(12), 845-846.
Highlighted the decrease of calcification of a planktonic mollusc, the sea butterfly (Limacina helicina). The shell-building capacity of this organism declines with decreasing aragonite saturation, which is due to the decrease of average pH in the seas.
• Monitoring and containing ocean acidification helps preventing coral reefs and shell-building organisms to dissolve, and thus helps preventing ecologicaldisasters.
From Pmel-NOAA - http://www.pmel.noaa.gov/co2/story/Ocean+Acidification
http://earthobservatory.nasa.gov/
www.epa.gov
Issues
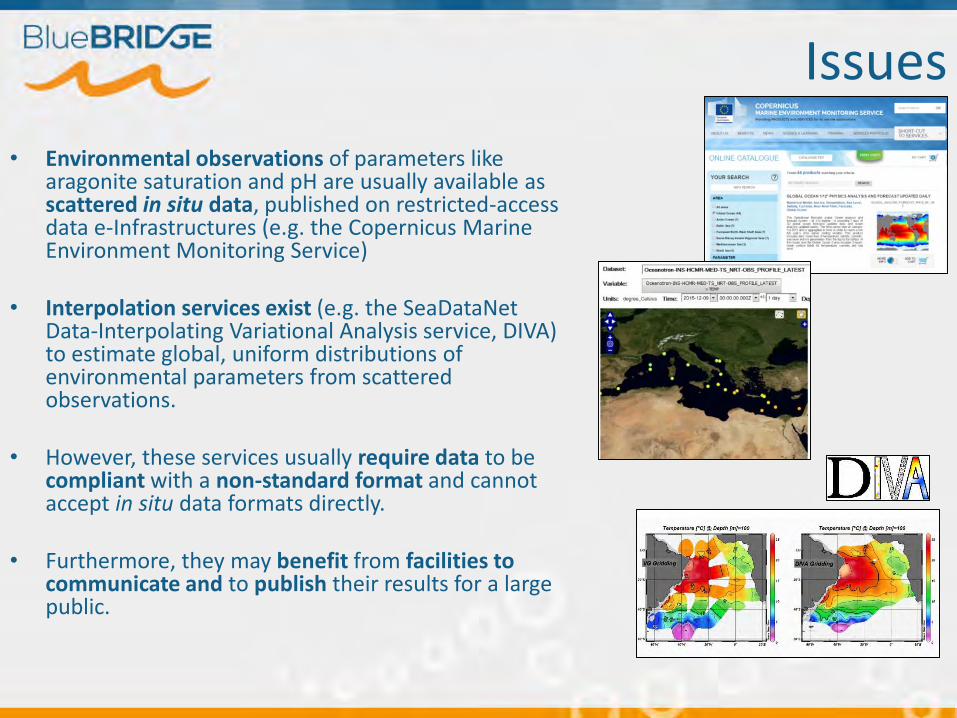
• Environmental observations of parameters like aragonite saturation and pH are usually available as scattered in situ data, published on restricted-access data e-Infrastructures (e.g. the Copernicus Marine Environment Monitoring Service)
• Interpolation services exist (e.g. the SeaDataNetData-Interpolating Variational Analysis service, DIVA) to estimate global, uniform distributions of environmental parameters from scattered observations.
• However, these services usually require data to be compliant with a non-standard format and cannot accept in situ data formats directly.
• Furthermore, they may benefit from facilities tocommunicate and to publish their results for a large public.

e-Infrastructurese-Infrastructures enable researchers at different locations across the worldto collaborate in the context of their home institutions or in national or multinationalscientific initiatives.• People can work together having shared access to unique or distributed scientific
facilities (including data, instruments, computing and communications).
Examples:
Belief, http://www.beliefproject.org/OpenAire, http://www.openaire.eu/i-Marine, http://www.i-marine.eu/EU-Brazil OpenBio, http://www.eubrazilopenbio.eu/

Virtual Research Environments
• Define sub-communities
• Allow temporary dedicated assignment of computational, storage, and data resources
• Manage policies
• Support data and information sharing
Inte
grat
es
e-Infrastructure
Unified Resource Space
Enab
les
VRE VRE VRE
WPS
External e-Infrastructures
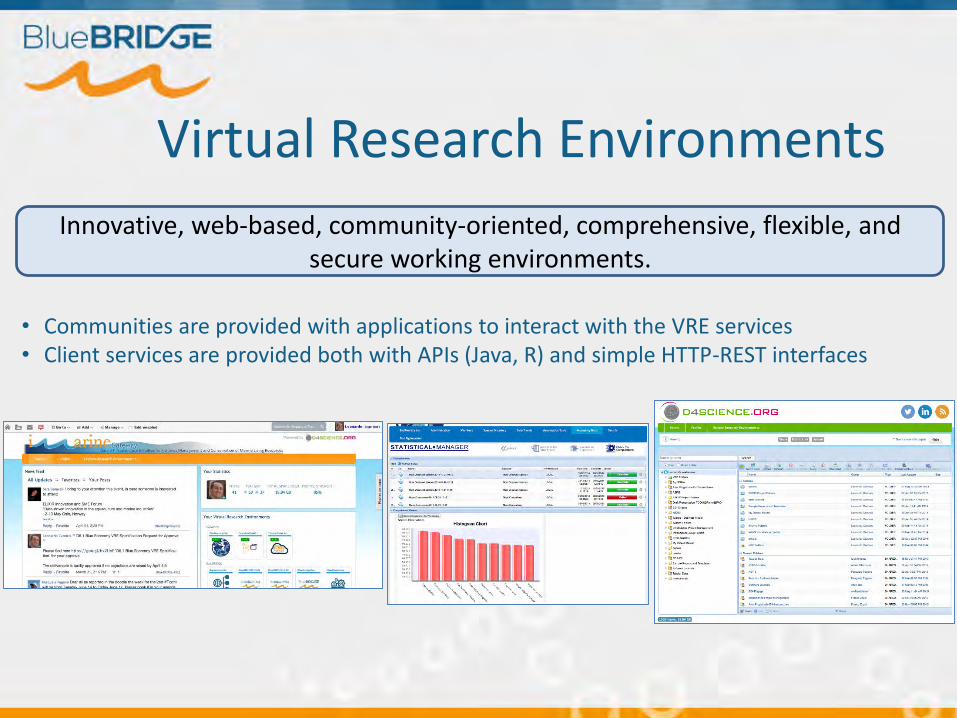
Virtual Research Environments
Innovative, web-based, community-oriented, comprehensive, flexible, and secure working environments.
• Communities are provided with applications to interact with the VRE services• Client services are provided both with APIs (Java, R) and simple HTTP-REST interfaces
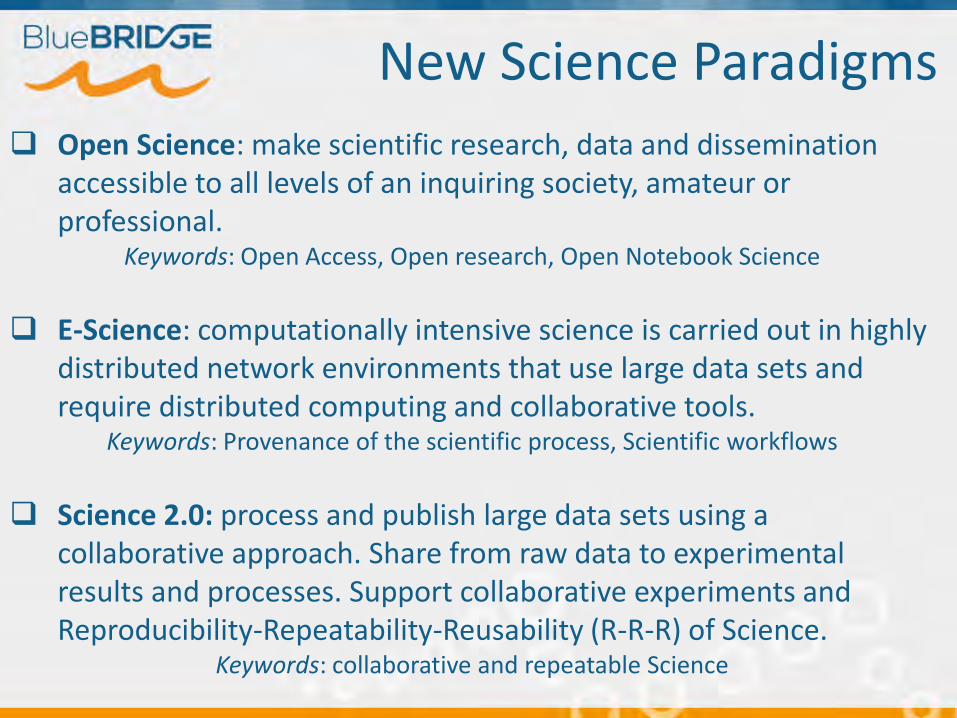
New Science Paradigms
Open Science: make scientific research, data and dissemination accessible to all levels of an inquiring society, amateur or professional.
Keywords: Open Access, Open research, Open Notebook Science
E-Science: computationally intensive science is carried out in highly distributed network environments that use large data sets and require distributed computing and collaborative tools.
Keywords: Provenance of the scientific process, Scientific workflows
Science 2.0: process and publish large data sets using a collaborative approach. Share from raw data to experimental results and processes. Support collaborative experiments and Reproducibility-Repeatability-Reusability (R-R-R) of Science.
Keywords: collaborative and repeatable Science
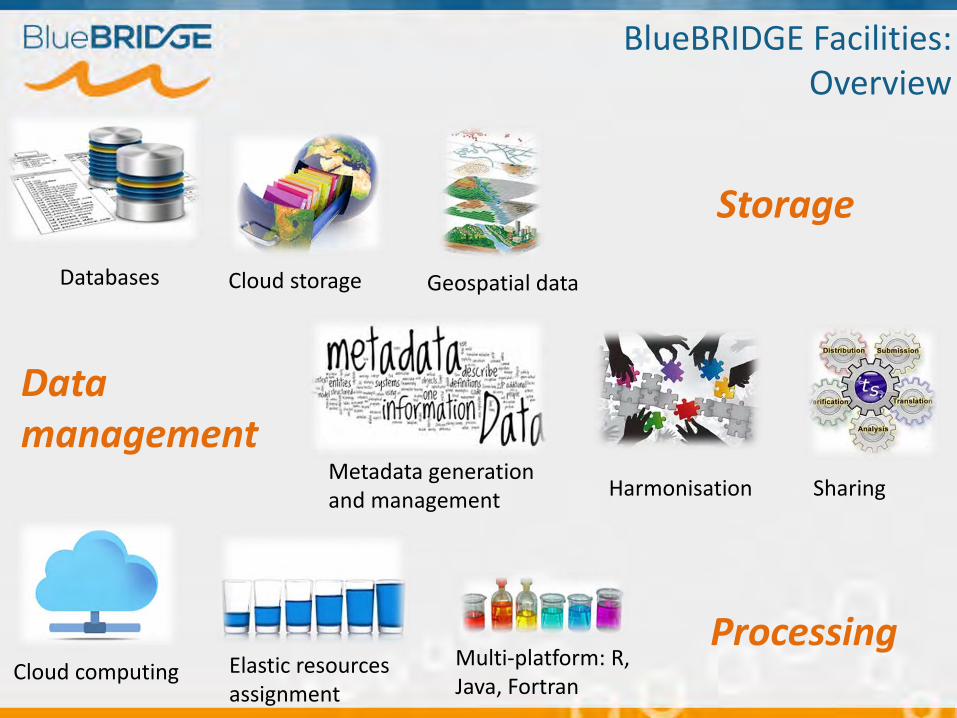
Storage
Databases Cloud storage Geospatial data
Metadata generation and management
Harmonisation Sharing
Data management
Cloud computing Elastic resources assignment
Multi-platform: R, Java, Fortran
Processing
BlueBRIDGE Facilities:Overview
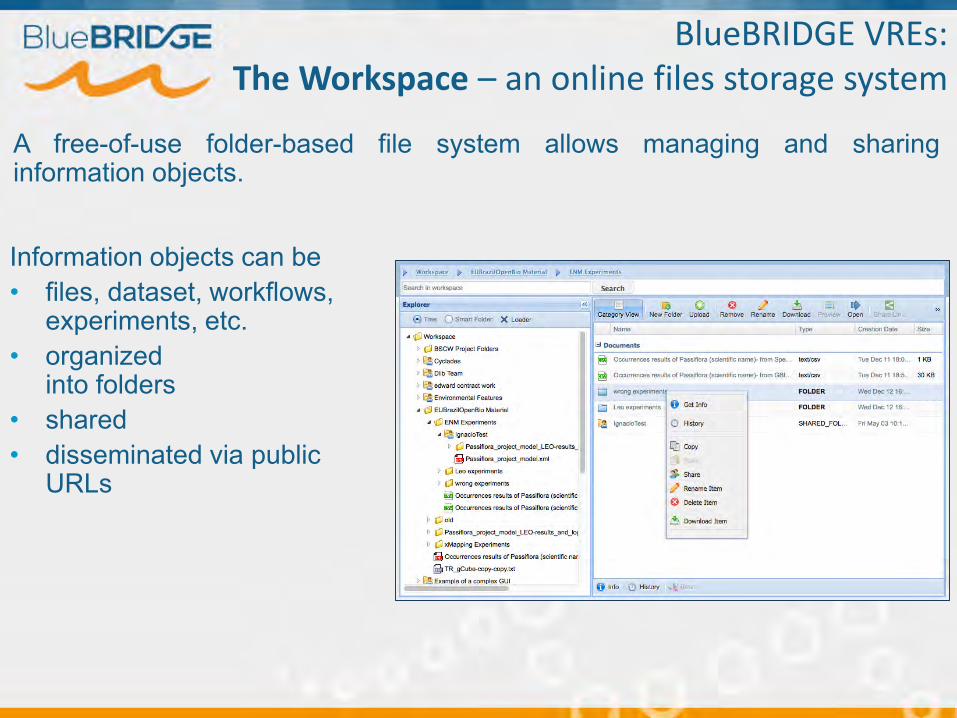
A free-of-use folder-based file system allows managing and sharinginformation objects.
Information objects can be • files, dataset, workflows,
experiments, etc. • organized
into folders • shared• disseminated via public
URLs
BlueBRIDGE VREs:The Workspace – an online files storage system

• Experiments on Big Data• Sharing inputs and results• Save the provenance of experiments• Supports R-R-R of experiments
WPS
REST
• Input/Out• Parameters• Provenance
Cloud Computing Platform

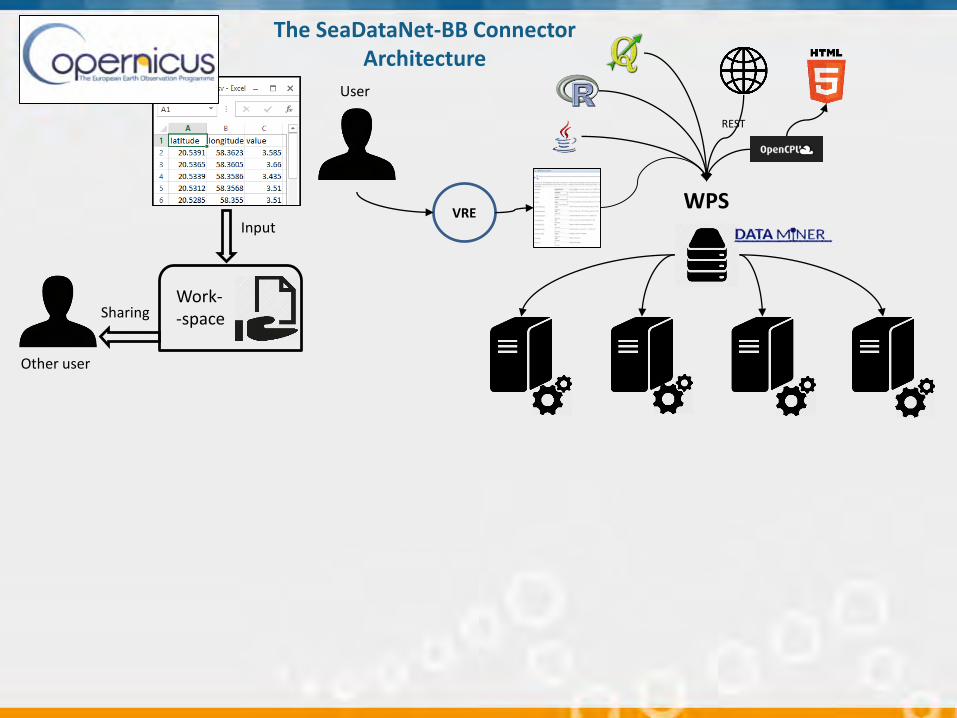
Proposed solution
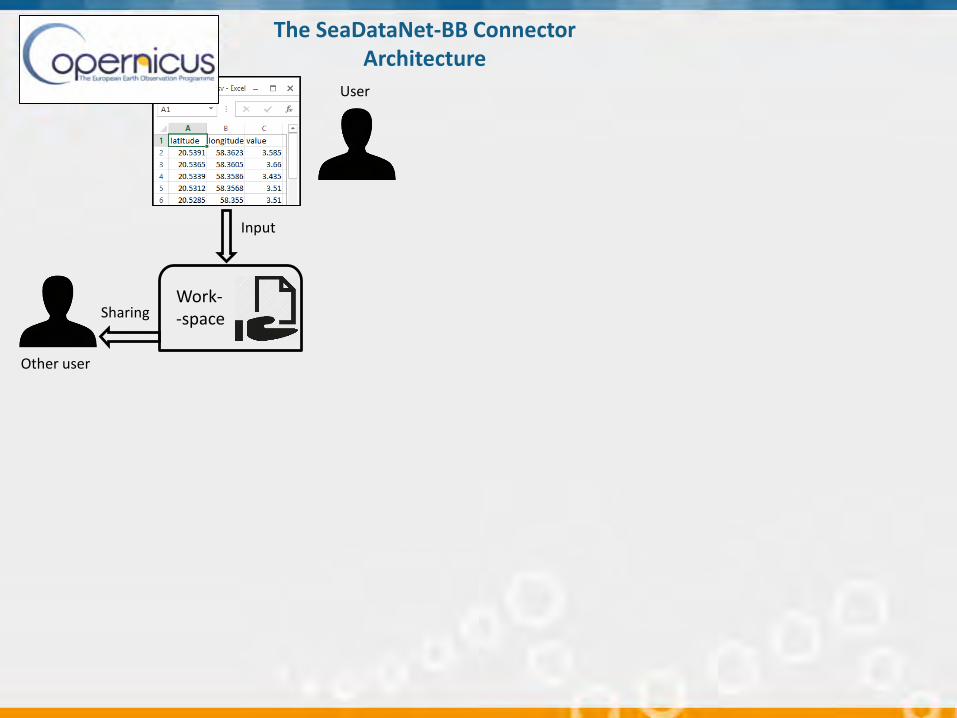
Work--spaceSharing
Input
User
Other user
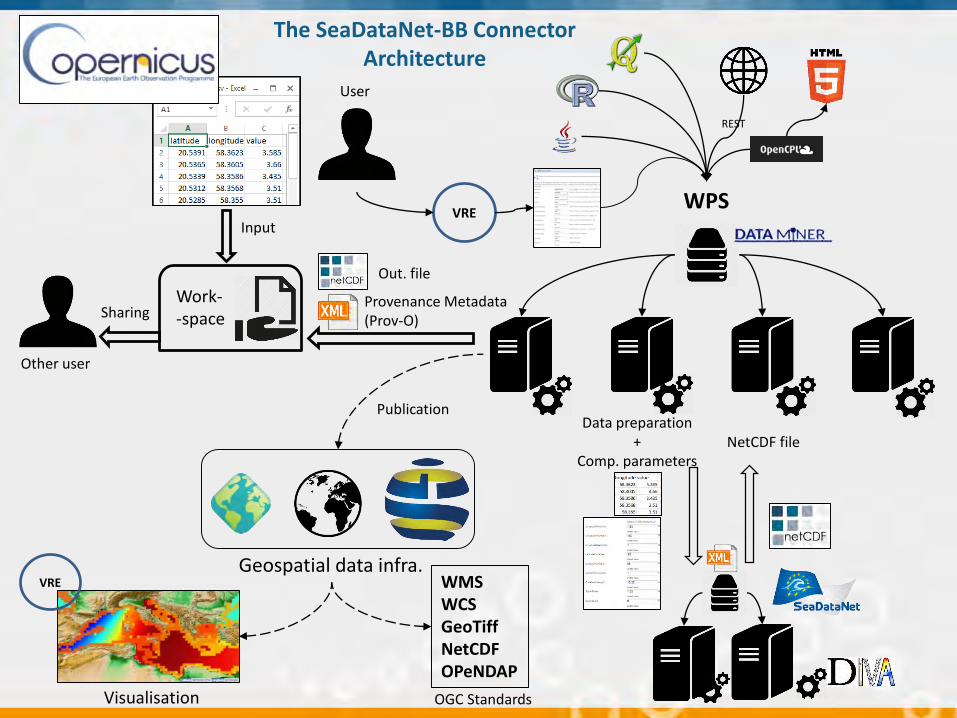
The SeaDataNet-BB ConnectorArchitecture

WPS
Work--space
VRE
Sharing
Input
User
Other user
The SeaDataNet-BB ConnectorArchitecture
WPS
REST
Work--space
VRE
Sharing
Input
User
Other user
The SeaDataNet-BB ConnectorArchitecture
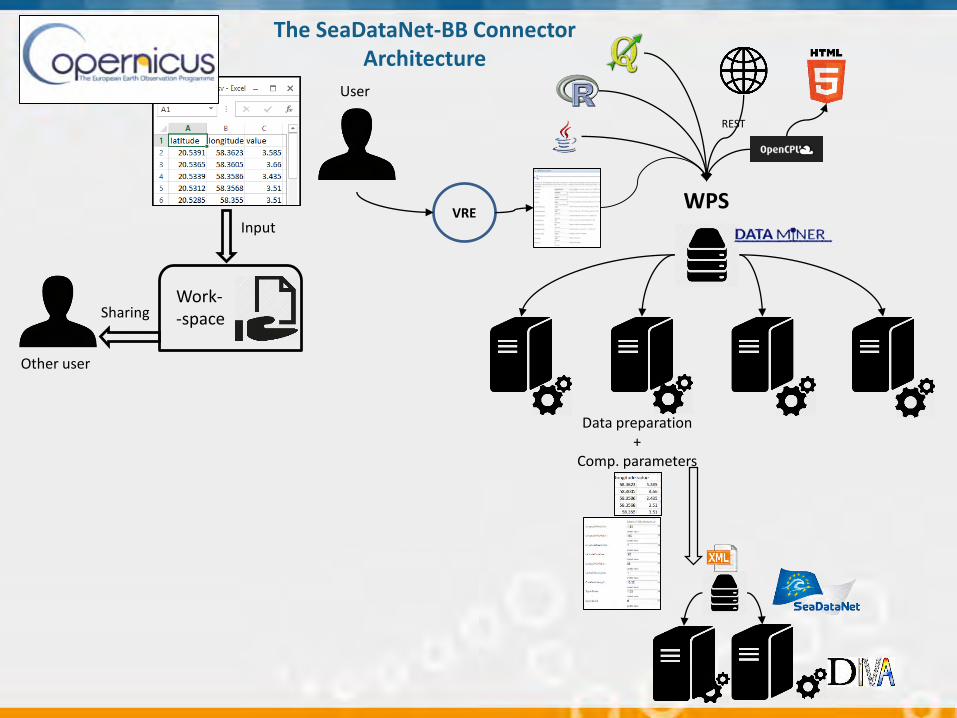
WPS
REST
Work--space
VRE
Data preparation+
Comp. parameters
Sharing
Input
User
Other user
The SeaDataNet-BB ConnectorArchitecture
WPS
REST
Work--space
VRE
Data preparation+
Comp. parameters
Sharing
Input
User
Other user
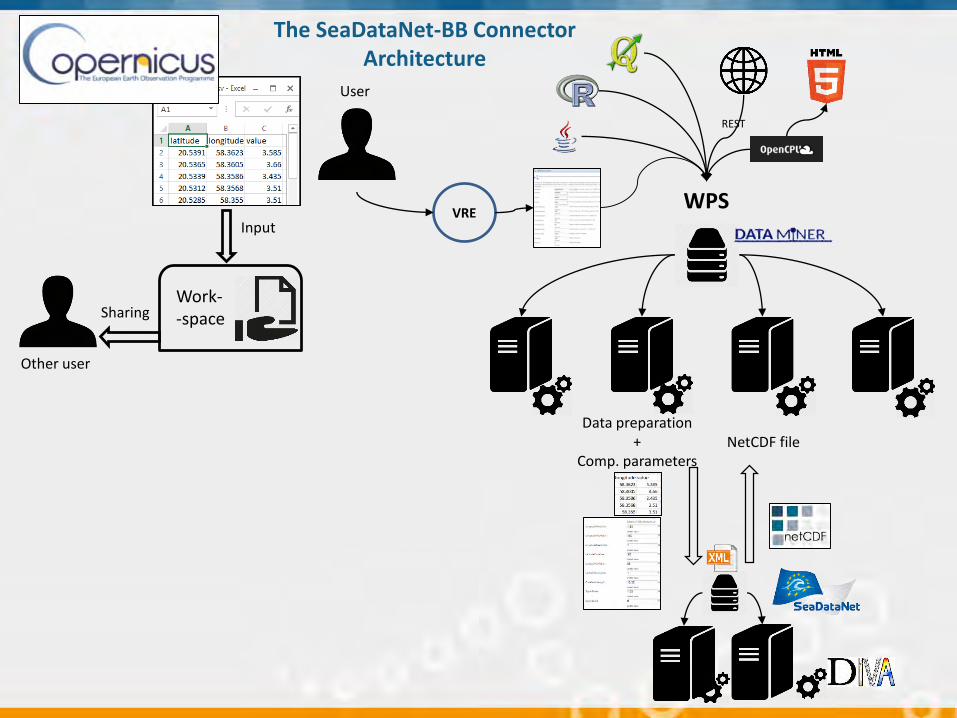
The SeaDataNet-BB ConnectorArchitecture
NetCDF file

WPS
REST
Work--space
VRE
Data preparation+
Comp. parametersNetCDF file
Provenance Metadata(Prov-O)
Out. file
Sharing
Input
User
Other user
The SeaDataNet-BB ConnectorArchitecture
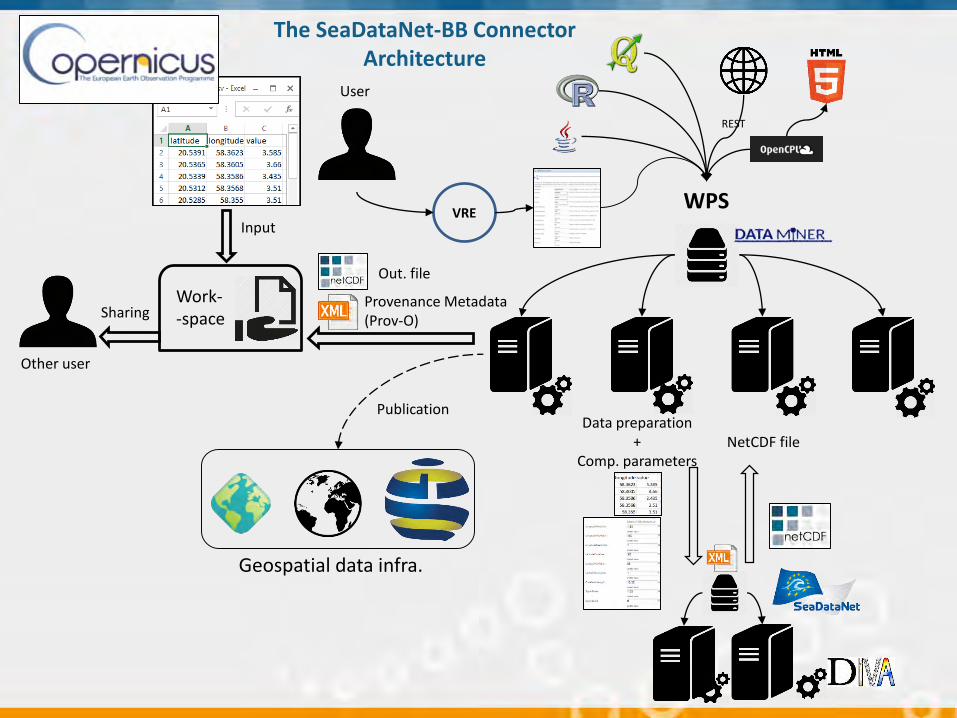
WPS
REST
Geospatial data infra.
Work--space
VRE
Data preparation+
Comp. parametersNetCDF file
Provenance Metadata(Prov-O)
Out. file
Sharing
Input
User
Other user
Publication
The SeaDataNet-BB ConnectorArchitecture
WPS
REST
Geospatial data infra.
Work--space
WMSWCSGeoTiffNetCDFOPeNDAP
VRE
Data preparation+
Comp. parametersNetCDF file
Provenance Metadata(Prov-O)
Out. file
Sharing
Input
User
Other user
OGC StandardsVisualisation
Publication
VRE
The SeaDataNet-BB ConnectorArchitecture

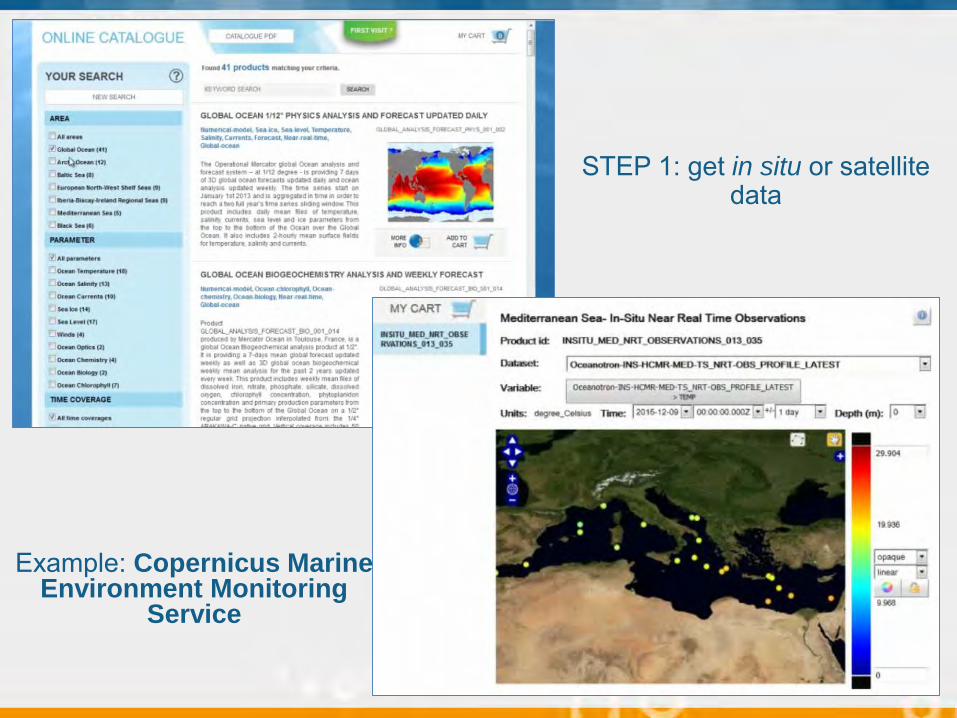
STEP 1: get in situ or satellite data
Example: Copernicus Marine Environment Monitoring
Service

STEP 2: extract data in tabular format and upload them on the Workspace
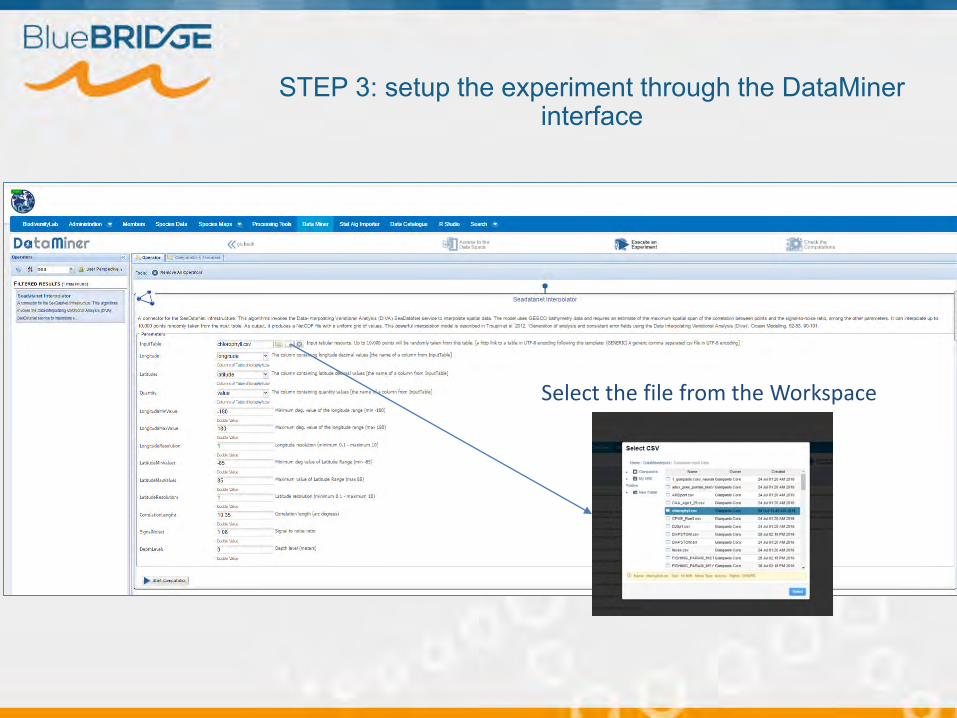
STEP 3: setup the experiment through the DataMinerinterface
Select the file from the Workspace

STEP 4: execute the experiment and get the results

STEP 5: get the results and inspect the metadata
The PROV-O ontology is used to represent the metadata of the computation
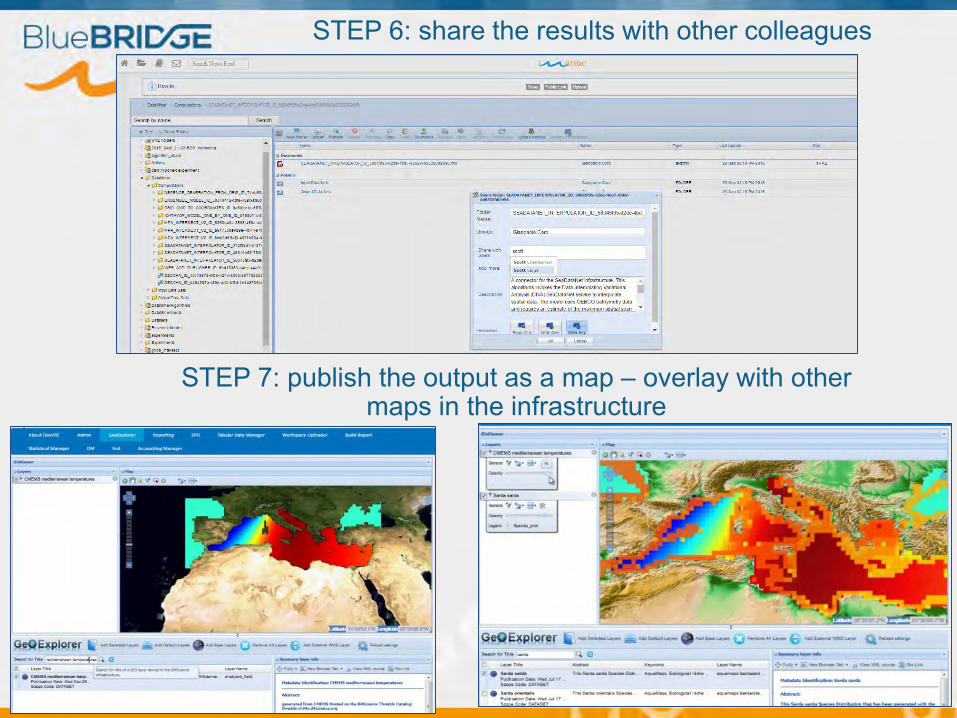
STEP 6: share the results with other colleagues
STEP 7: publish the output as a map – overlay with other maps in the infrastructure

Benefits of the integration
The process can accessed through VREs
Invoked via communication standards
Available for the BlueBRIDGE community (stock assessment, MPAs, aquaculture)
Automatic Web interface for the process
Provenance management
Storage of results on a high-availability system
Collaboration and sharing
R-R-R also from other software, e.g. QGIS

Collaborative experiments
WS
Shared online folders
Inputs
Outputs
Results
Computational system
In the e-Infrastructure
Through third party software

Usage from QGIS

Conclusions• We have presented the benefits brought by a bridge
between infrastructures;
• Our solution adds collaboration facilities and extends the usages of the connected service/data;
• This work goes in the direction of modern Science paradigms.
WS
Self-consistent comp. object
RepeatabilityProvenance Prov-O
ReusabilityUse of standards
Reproducibility

General links:D4Science e-Infrastructure website: https://www.d4science.org
Portal of the D4Science infrastructure: http://services.d4science.org
Portal of the BlueBRIDGE infrastructure: http://i-marine.d4science.org
About DataMiner:DataMiner user’s guide: https://wiki.gcube-system.org/gcube/DataMiner_Manager
DataMiner installation guide: https://wiki.gcube-system.org/gcube/DataMiner_Installation
Contributing with new algorithms:Tutorial on the integration of new algorithms with the DataMinerhttp://gcube.wiki.gcube-system.org/gcube/index.php/How-to_Implement_Algorithms_for_the_Statistical_Manager
Related work:• Candela, L., Castelli, D., Coro, G., Pagano, P., & Sinibaldi, F. (2013). Species distribution modeling in the cloud. Concurrency and Computation:
Practice and Experience.• Coro, G., Candela, L., Pagano, P., Italiano, A., & Liccardo, L. (2015). Parallelizing the execution of native data mining algorithms for
computational biology. Concurrency and Computation: Practice and Experience, 27(17), 4630-4644.• Candela, L., Castelli, D., Coro, G., Lelii, L., Mangiacrapa, F., Marioli, V., & Pagano, P. (2015). An infrastructure-oriented approach for
supporting biodiversity research. Ecological Informatics, 26, 162-172.• Coro, G., Magliozzi, C., Ellenbroek, A., Kaschner, K., & Pagano, P. (2016). Automatic classification of climate change effects on marine species
distributions in 2050 using the AquaMaps model. Environmental and Ecological Statistics, 23(1), 155-180.• Coro, G., Large, S., Magliozzi, C., & Pagano, P. (2016). Analysing and forecasting fisheries time series: purse seine in Indian Ocean as a case
study.ICES Journal of Marine Science: Journal du Conseil, fsw131.• Coro, G., Webb, T. J., Appeltans, W., Bailly, N., Cattrijsse, A., & Pagano, P. (2015). Classifying degrees of species commonness: North Sea fish
as a case study. Ecological Modelling, 312, 272-280.
Useful links
Thank you!